


Abstract
This study employed data-driven machine learning models to analyze the effects of filler material composition and other process parameters on mechanical properties during the crack repair of nickel-based superalloys such as K417G using wide-gap brazing technology. First, a linear regression model was used to analyze the influence of independent variables (filler material composition and other process parameters) on the dependent variables (tensile strength and elongation). The regression results indicated that temperature and filler composition significantly affected tensile strength and elongation. Subsequently, a TabNet machine learning model was applied to simulate the relationship between parameters such as composition and mechanical properties. The experimental results showed that when four parameters, namely, the filler composition, temperature, holding time, and pressure, were used as input features, the deviation between the actual and predicted values of elongation was minimal, with a value of only 1.5650.
1. Introduction
Nickel-based superalloys such as K417G [1,2] serve as critical materials for manufacturing the hot-end components of aero-engines. During long-term service under high temperature, high pressure, and corrosive gas environments, initial micro-cracks will form in these components. Therefore, it is essential to develop reliable joining and repair technologies for high-temperature alloy components used in aero-engines and related fields. Compared to other joining techniques [3,4], wide-gap brazing [5] exhibits significant advantages in efficiently and effectively repairing large-gap cracks. In this technique, the filler material consists of both low-melting-point alloys and high-melting-point alloys. During the joining process, the low-melting-point alloy diffuses into the high-melting-point alloy and base material [6,7,8]. Subsequently, isothermal solidification will occur during the holding stage, leading to the formation of a joint region with uniform microstructure and composition. As a result, the high-performance repair of wide-gap defects can be achieved, improving both structural reliability and economic efficiency.
More importantly, to obtain joints with superior mechanical properties, the optimization of process parameters in wide-gap brazing serves as a critical step. These parameters mainly include filler composition, joining temperature, holding time, and applied pressure. Conventionally, trial-and-error approaches are used to design and optimize parameters such as the content of low-melting-point powder in the filler material. However, this method [8] is time-consuming and costly, significantly extending the development cycle of joint microstructures. To address this issue, this study first employed regression analysis [9,10] to investigate the significance of the relationships between process parameters, including filler composition, joining temperature, holding time, and pressure, and the mechanical properties of the joints, namely tensile strength and elongation. Notably, linear regression methods often fail to accurately capture the intrinsic relationships between process parameters (i.e., holding time, pressure, and temperature), and joint mechanical properties. Therefore, to achieve a more accurate prediction of the influence of process parameters on joint performance, machine learning models [11,12,13,14] have been introduced to mine complex and hidden relationships in the data, rather than relying on traditional trial-and-error methods.
In recent years, data-driven machine learning techniques have been widely applied in material property prediction. Due to the close relationship between material composition and mechanical properties, Ozerdem et al. [15] used the compositions of Cu- and Ni-based alloys as inputs and employed artificial neural networks to predict tensile mechanical properties. Beyond alloy composition design, Varol et al. [16] predicted mechanical properties such as the hardness and tensile strength of composite materials using artificial neural networks based on other process parameters, including time and size. Daiki et al. [17] constructed convolutional neural networks using multimodal data, including numerical data and image data, to predict metallic phase structures.
However, most existing studies applying machine learning to process parameter design did not explicitly separate training datasets from validation datasets, despite the fact that validation serves as a crucial step in machine learning to improve prediction accuracy. In this study, a high-performance neural network architecture specifically designed for tabular data, namely TabNet [18,19,20], was employed. TabNet consisted of feature transformers, attentive transformers, and multiple decision steps, and it was used to investigate the effects of filler composition, joining temperature, holding time, and applied pressure on the mechanical properties of the joints after welding.
2. Experimental Parameters
2.1. Process Parameters of Wide-Gap Brazing
Over several years of systematic research, our group developed a wide-gap brazing (WGB) technology. Based on the theory of isothermal solidification, this technique employed a filler material composed of high-melting-point nickel-based alloy powders with compositions similar to that of the base metal, along with low-melting-point boron-containing nickel-based alloy powders. Extensive investigations [21,22,23] were conducted to elucidate the effects of filler composition and joining process parameters on the microstructural evolution of the WGB region (WGBR). Through these studies, the filler material composition and joining parameters were optimized, and the formation mechanisms of precipitated phases within the joint microstructure, as well as the corresponding strengthening mechanisms, were systematically revealed.
The base metal (BM) used in this study consisted of K417G alloy (Jiangsu Metalink Technologies Co., Ltd., Nanjing, China), with a theoretical melting point of 1340 °C. Its nominal chemical composition (in wt.%) was Co 10.2, Cr 8.8, Ti 4.7, Al 5.3, Mo 3.4, C 0.2, with Ni in balance. To achieve WGB of the K417G alloy, the filler material was prepared by mixing alloy powders with high and low melting points. One component was a high-melting-point powder (HMP) with a composition similar to that of the BM. This powder remained solid at high temperatures and served as a skeletal support during brazing. The other component was a low-melting-point powder (LMP) containing boron, which melted at elevated temperatures and underwent isothermal solidification during the holding stage. As a result, a homogenized solid-solution joint formed in the WGBR, enabling high-quality bonding. Both HMP and LMP powders were obtained from Zhongnuo New Material Technology Co., Ltd. (Beijing, China). The two types of alloy powders were mechanically mixed for 24 h in a three-dimensional powder mixer under high-purity argon protection, using different mixing ratios, as listed in the second column of Table 1, to prepare the brazing filler. The mechanically mixed filler powders were then placed into the brazing gaps.
Table 1.
Composition and process parameters of the joint microstructures, with the translated table structure and values retained (Low-melting-point powder, LMP).
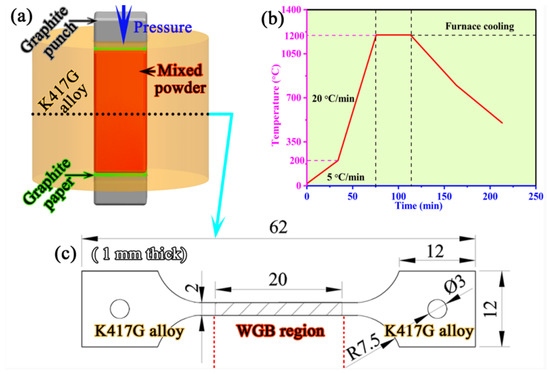
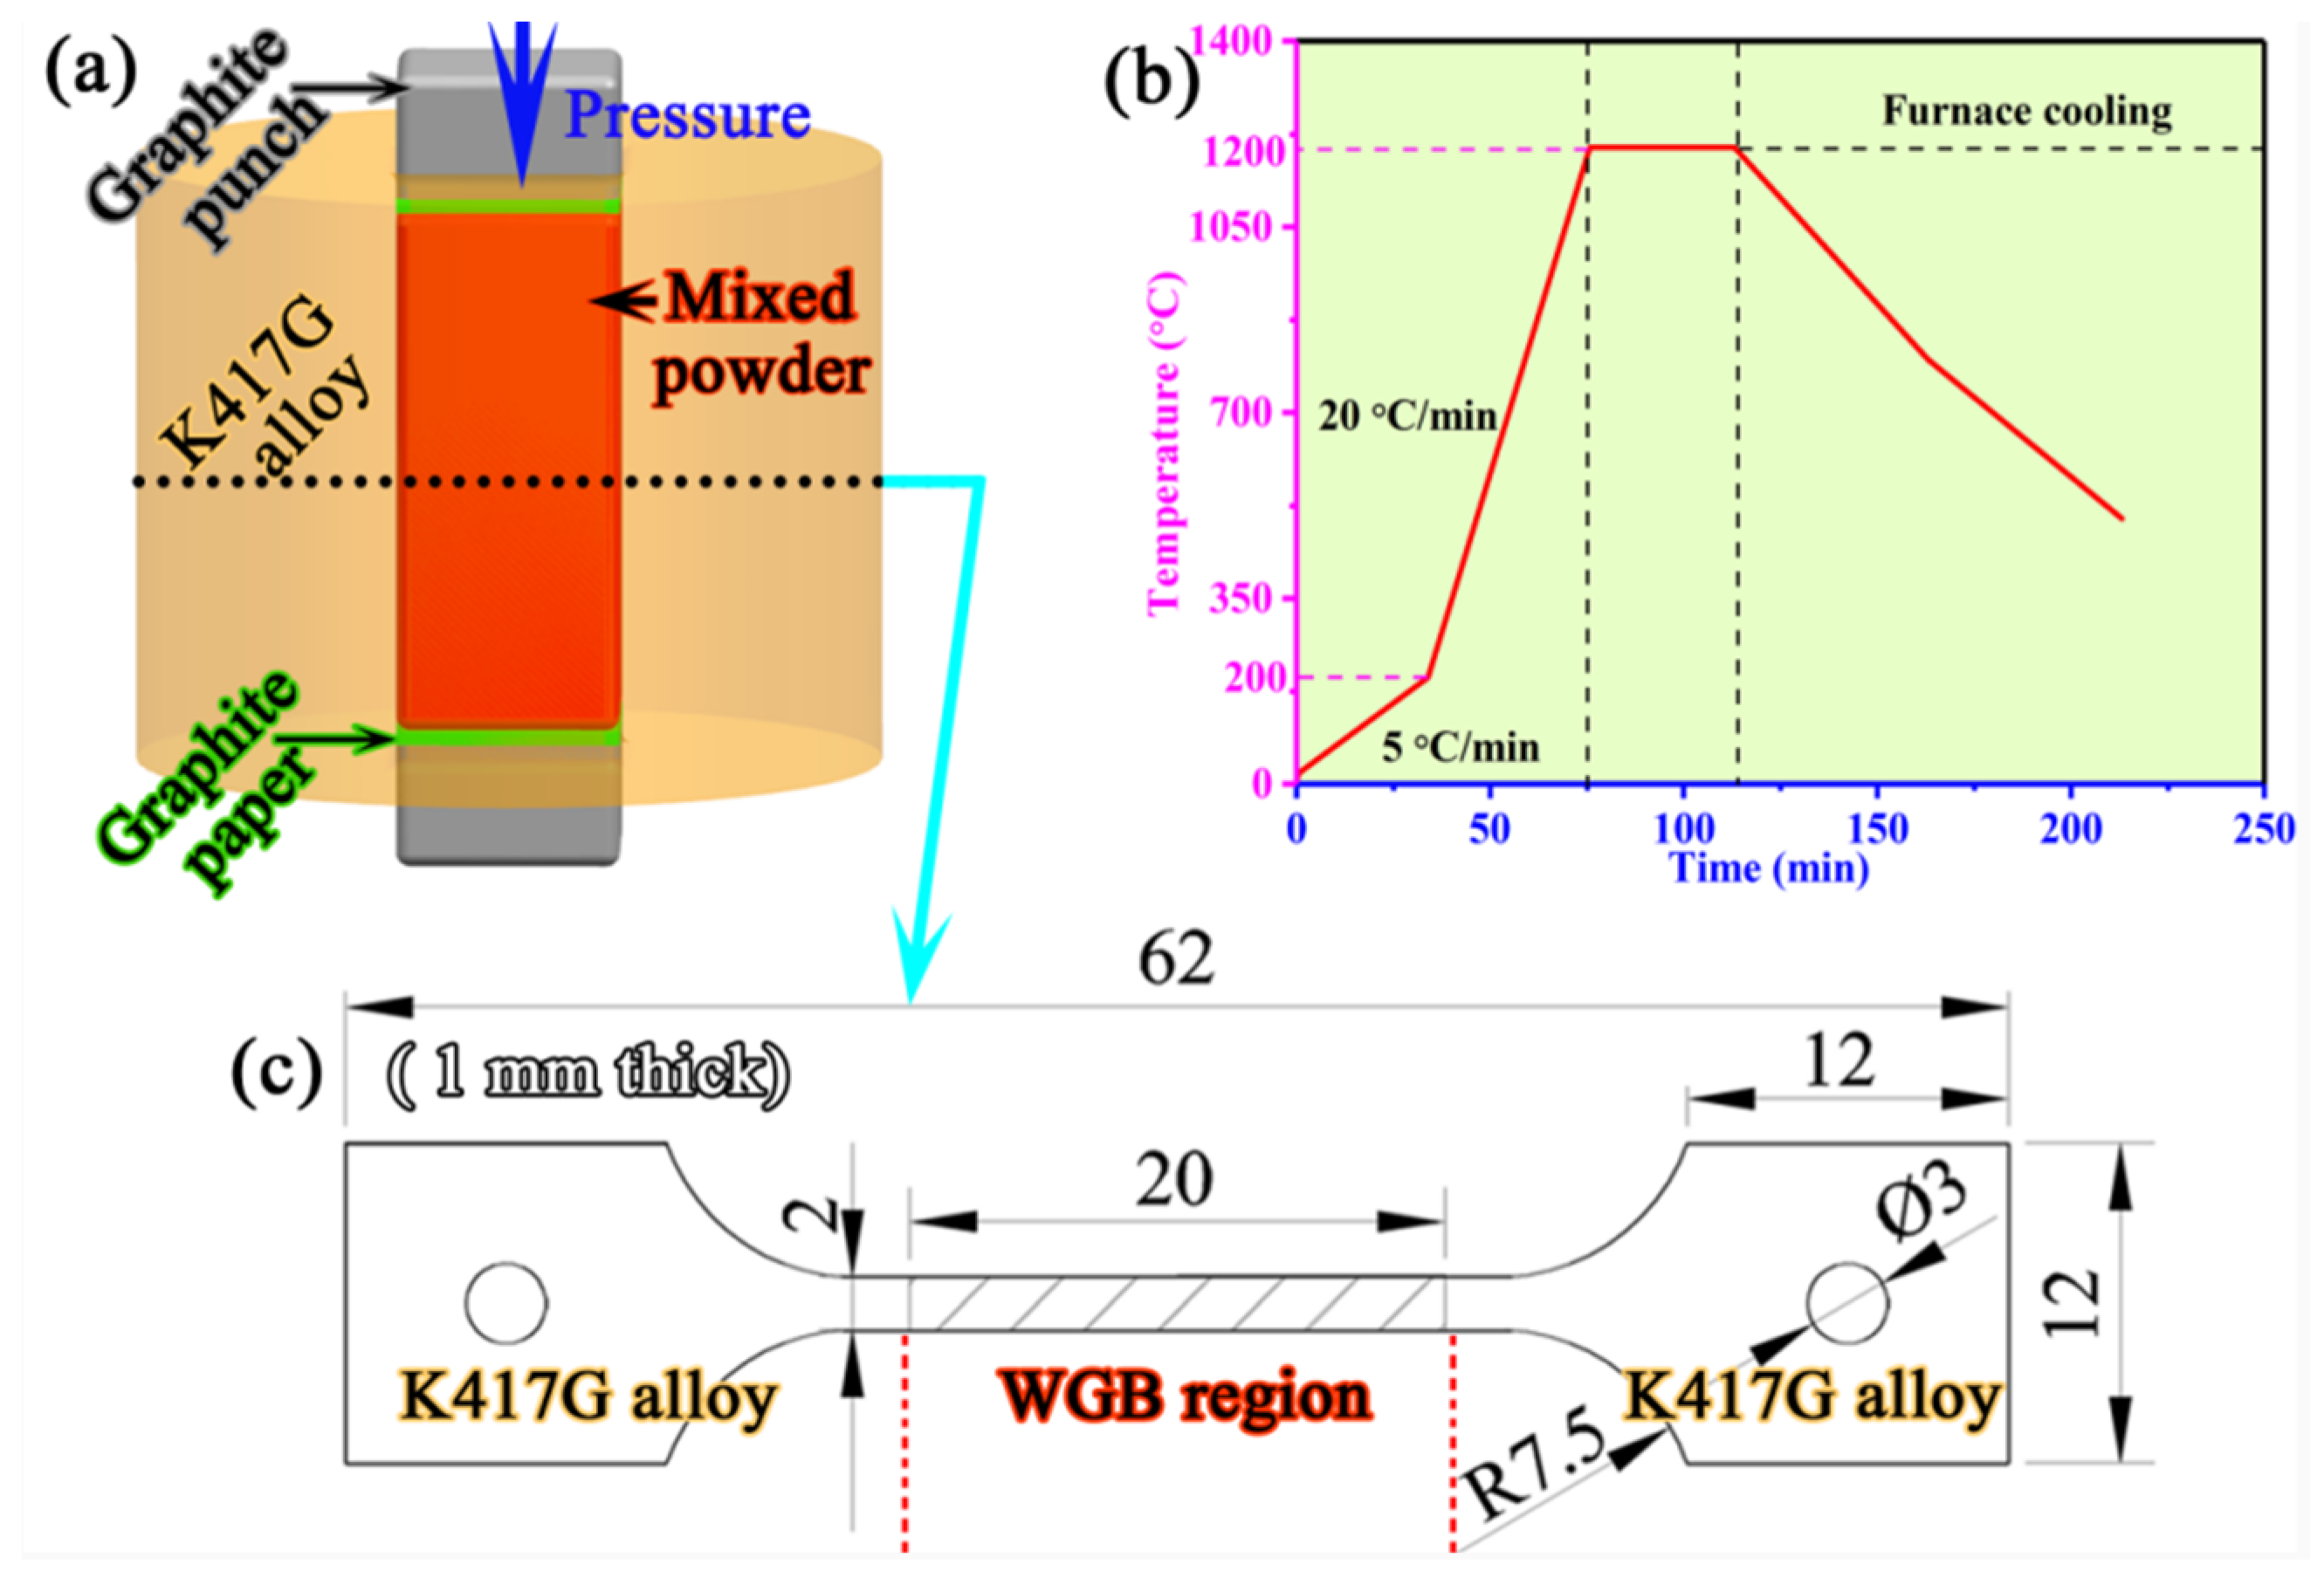
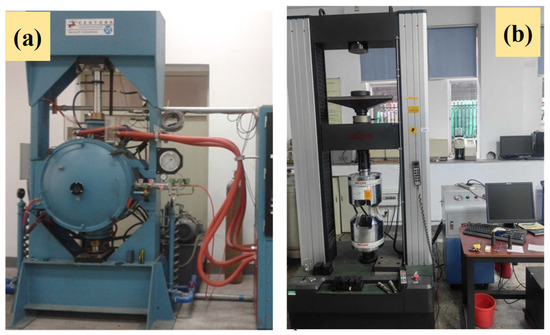
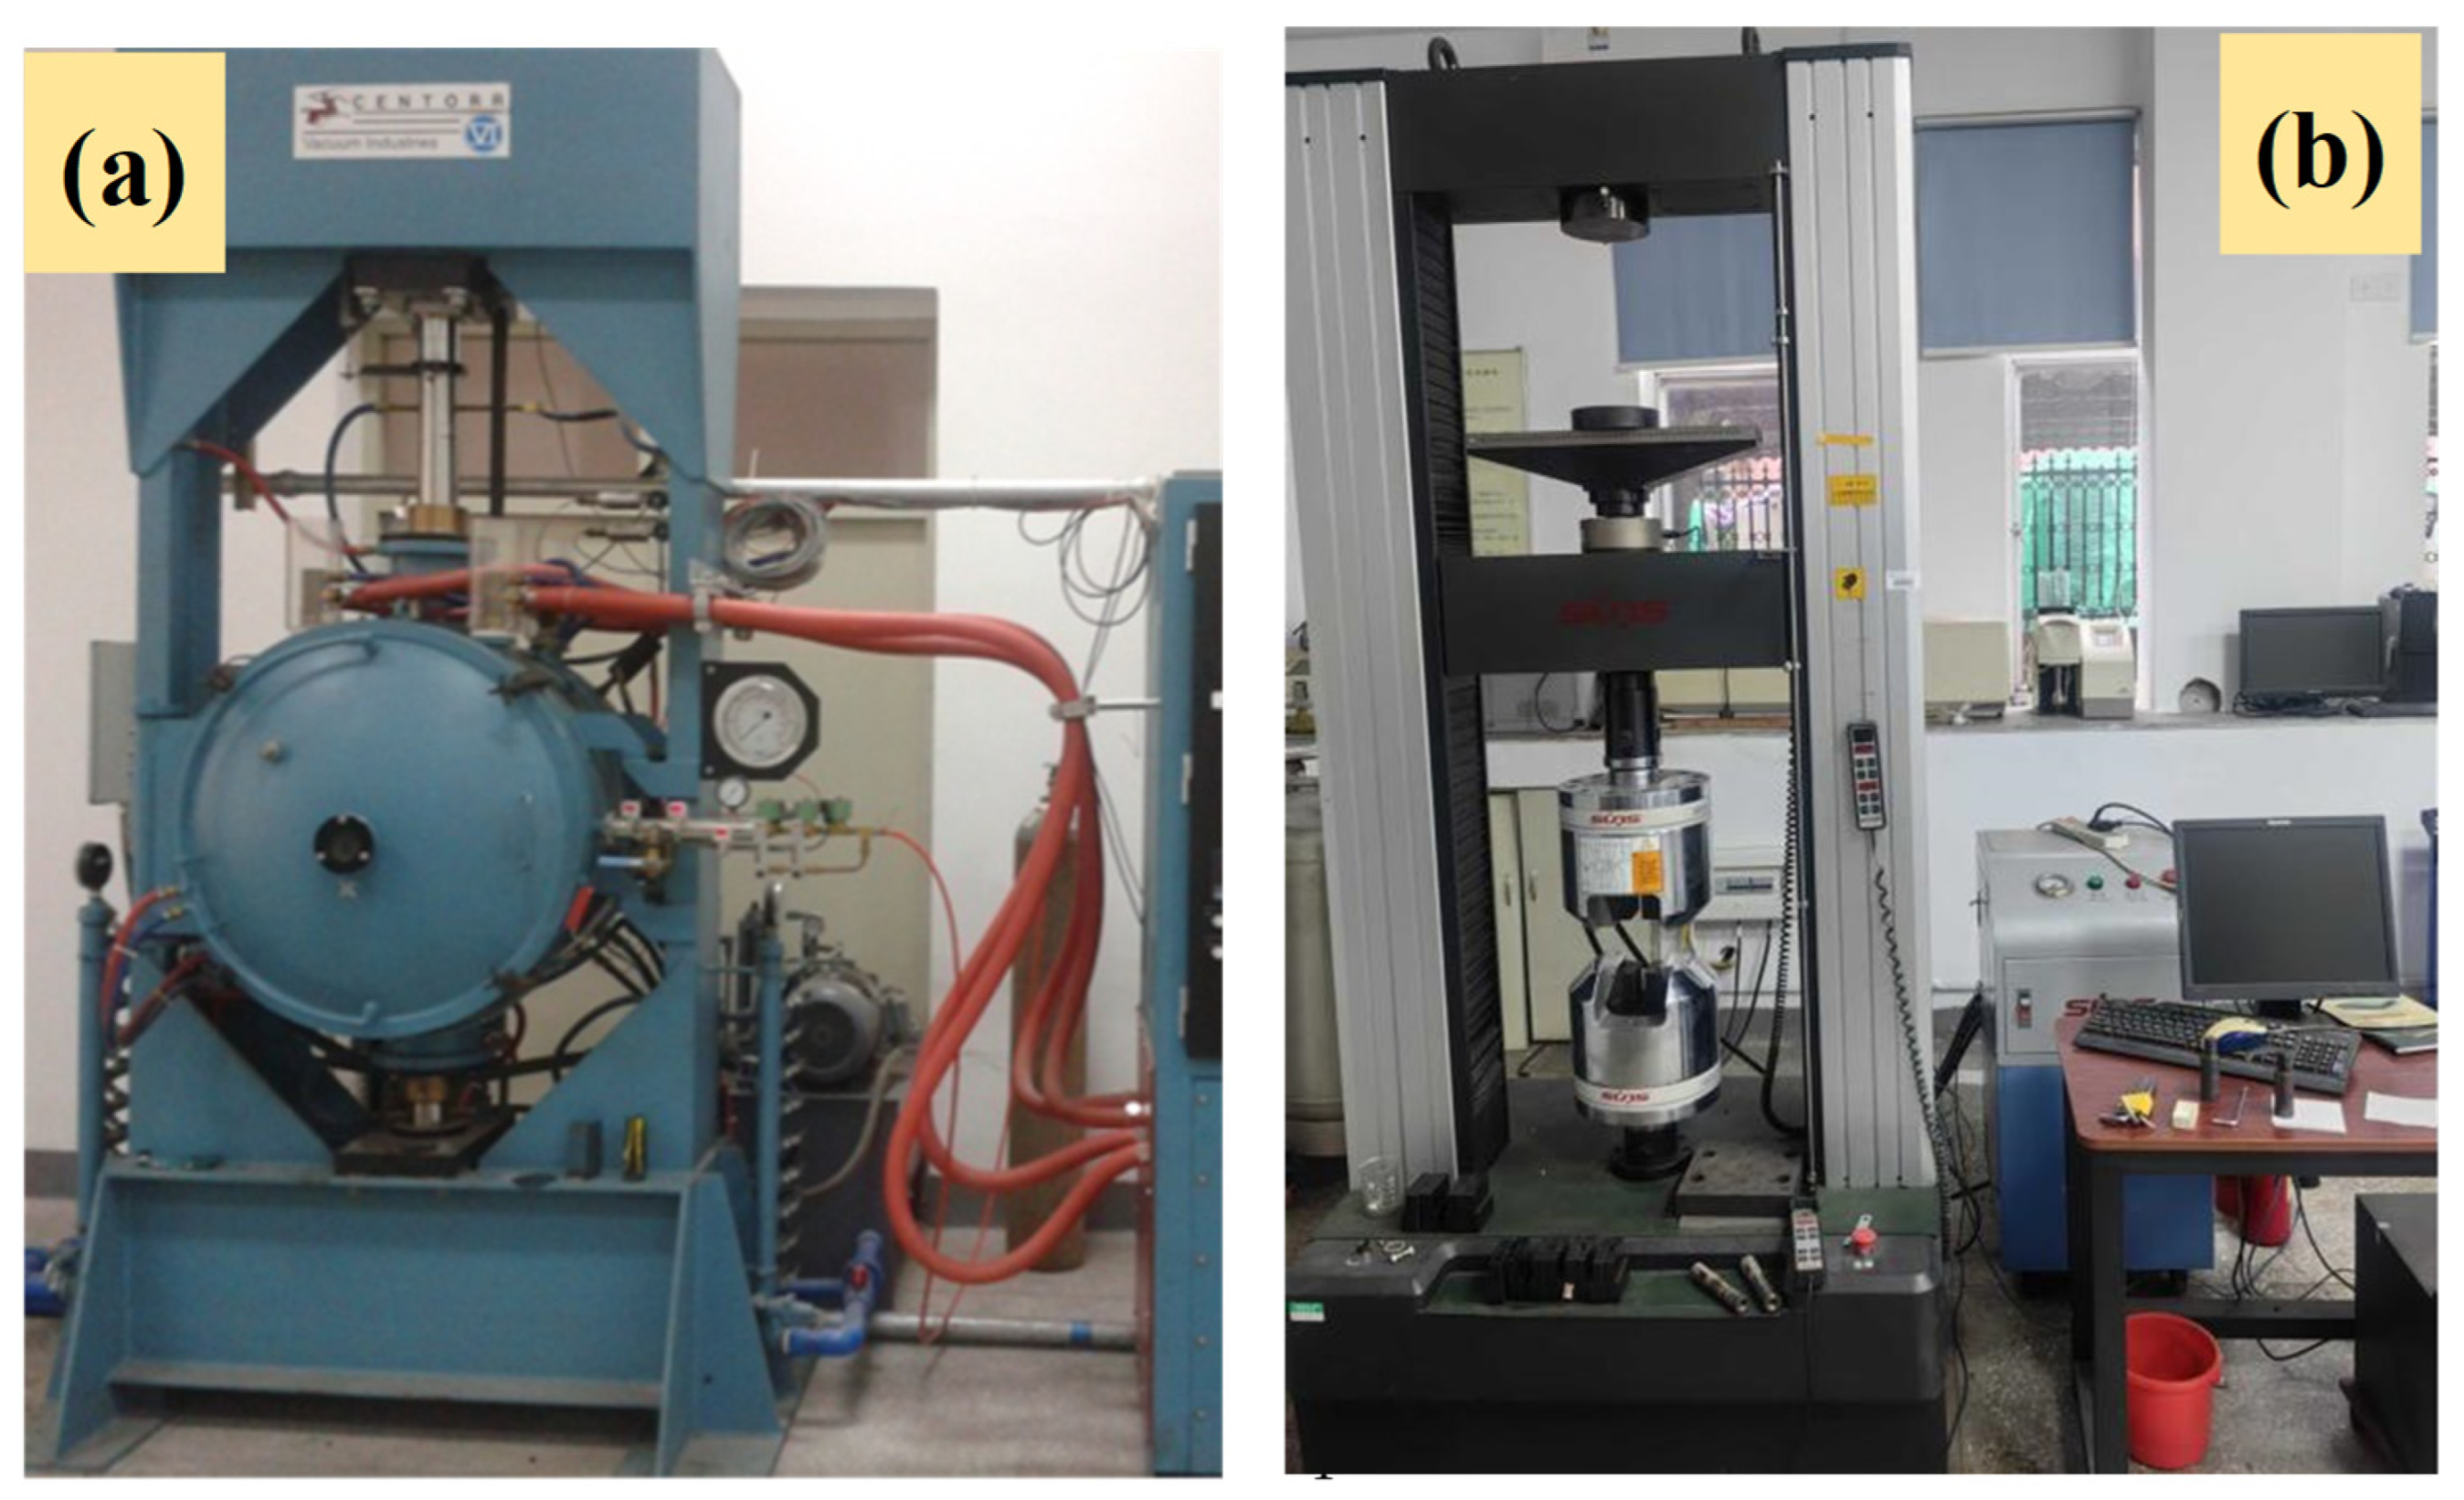
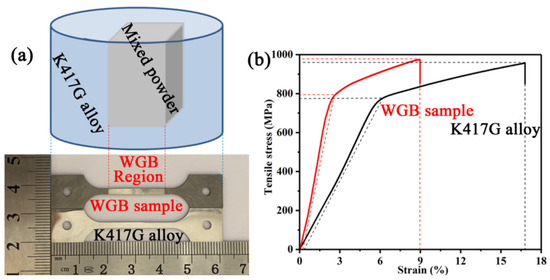
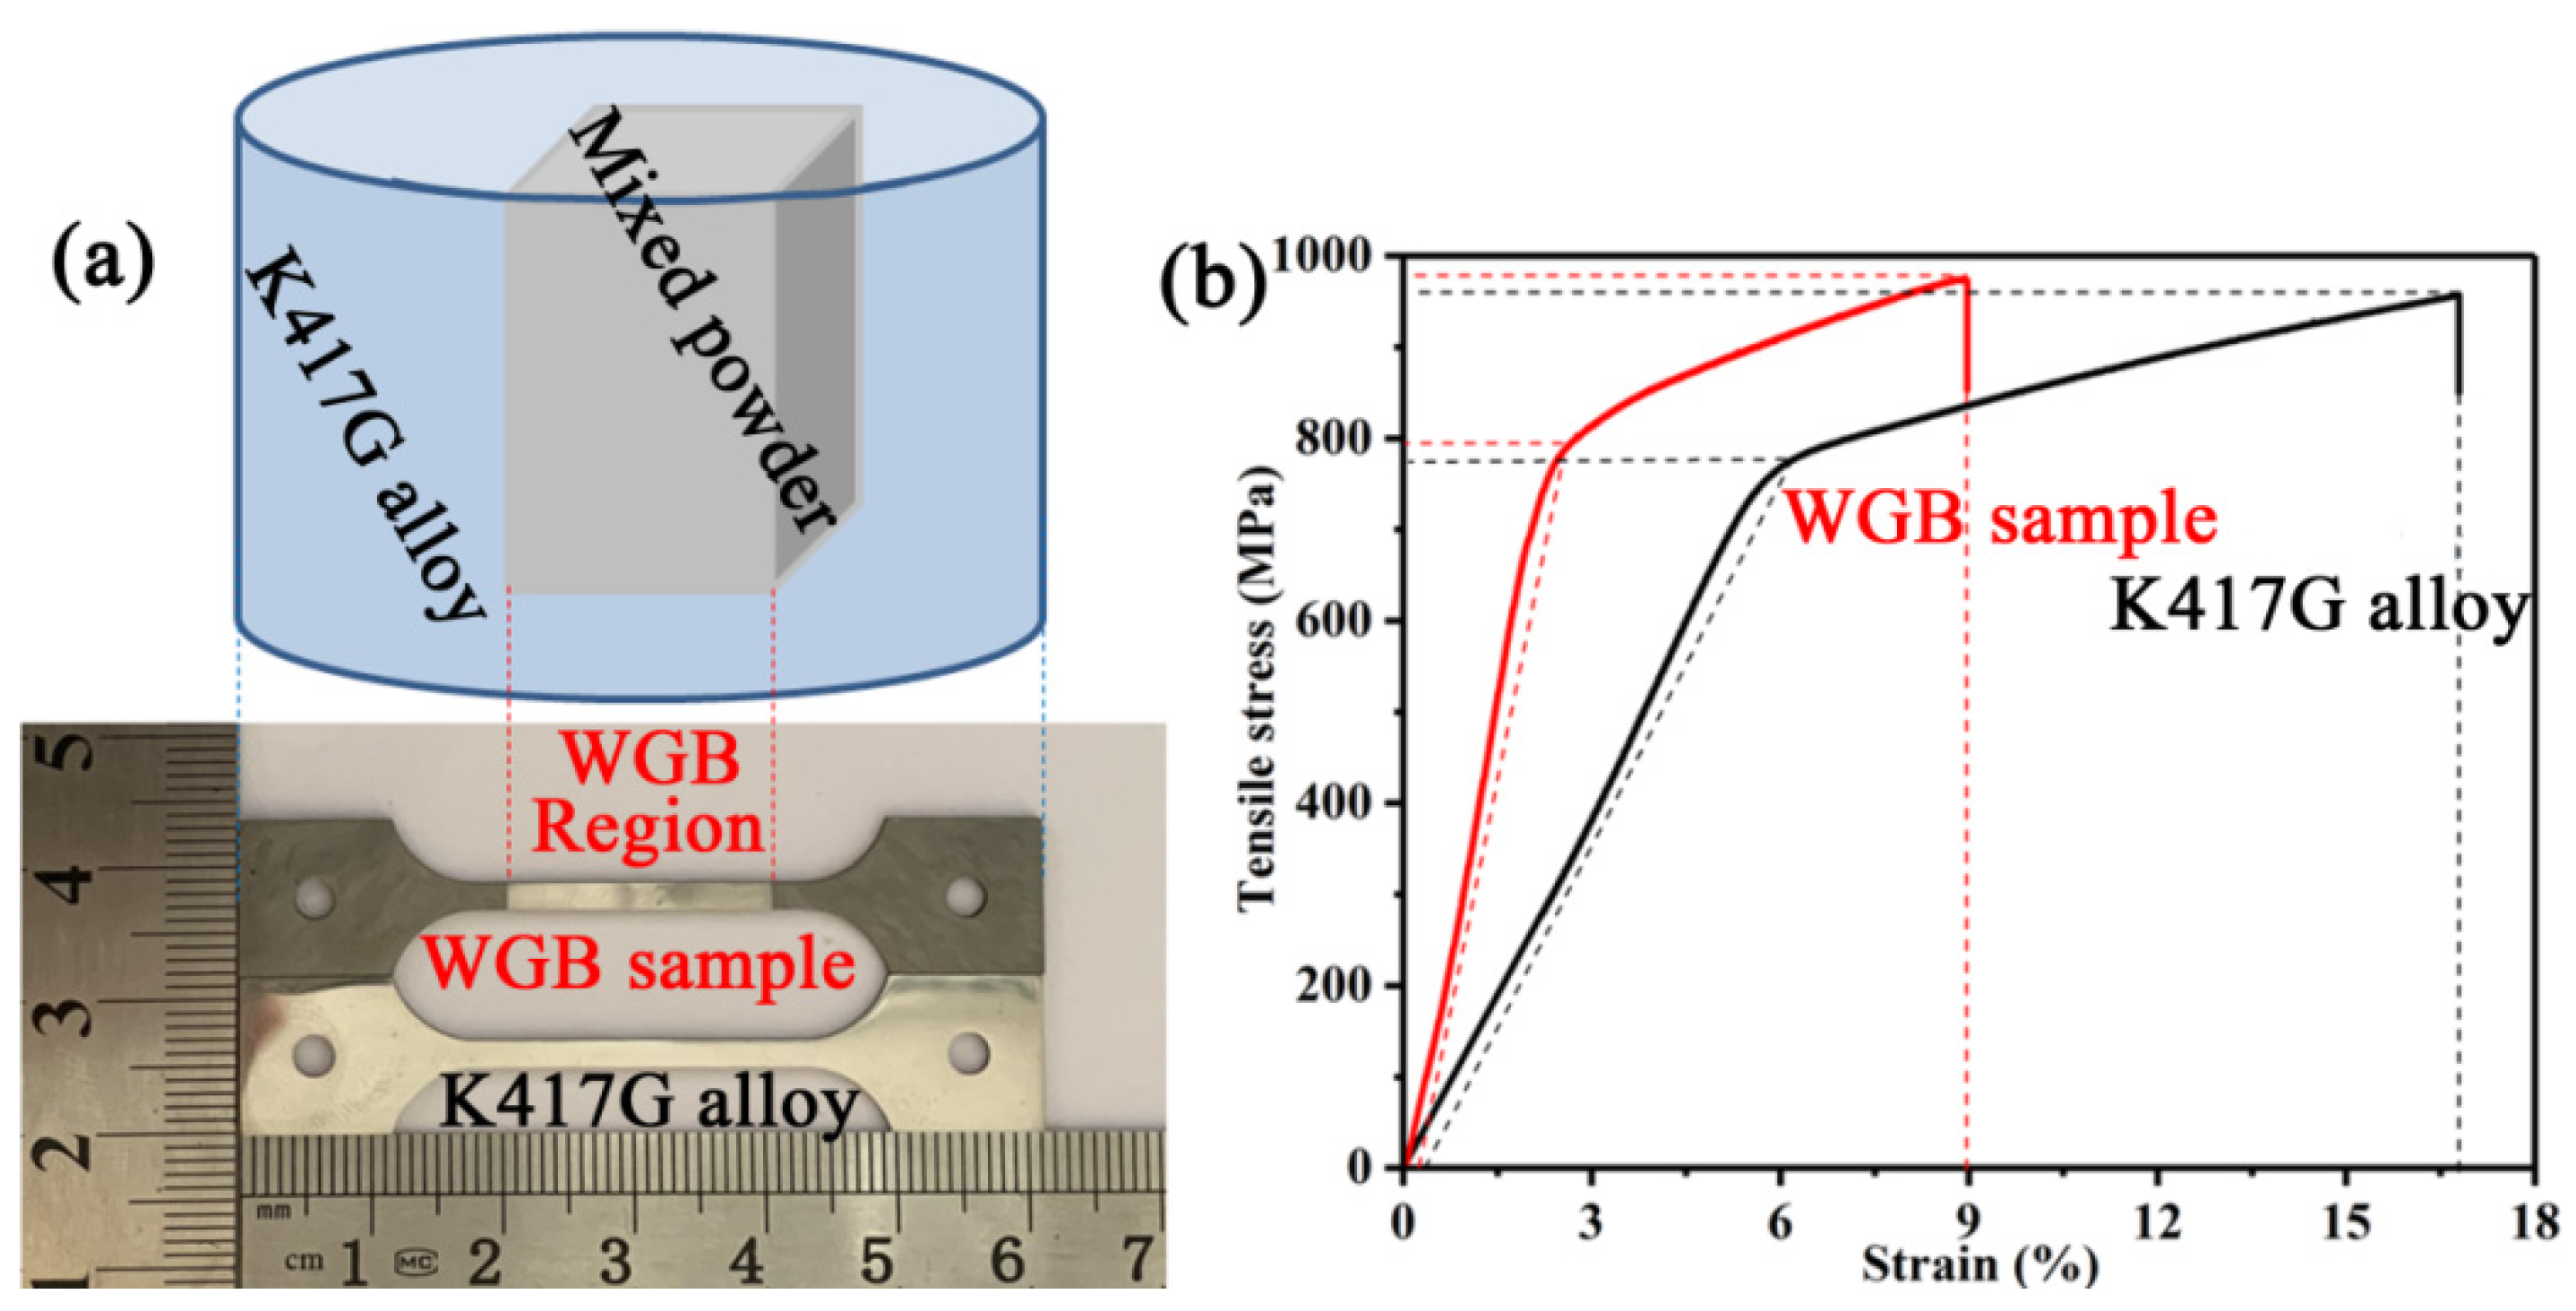
Filler materials with different compositions were assembled into the wide gaps of the base material (Figure 1a). After fixation using upper and lower graphite punches, the assemblies were placed into an HP-12 × 12 × 12 hot-pressing furnace (Figure 2a), where the vacuum level in the furnace chamber was maintained above 5.0 × 10⁻² Pa. Subsequently, the samples were heated at a rate of 20 °C/min to different temperatures, as listed in the third column of Table 1, subjected to different applied pressures (fifth column of Table 1), and held for different durations (fourth column of Table 1), followed by furnace cooling (Figure 1b). From the interfaces of the as-bonded wide-gap hot-pressed samples, tensile specimens with dimensions of L62 mm × W12 mm × H3 mm were sectioned (Figure 1c). The specimen surfaces were then mechanically ground and polished. Room-temperature tensile tests were conducted on the joint regions using a universal testing machine (CMT5105) equipped with a laser extensometer (Figure 2b), under quasi-static loading at a strain rate of 0.5 mm/min, as schematically illustrated in Figure 3. Figure 3a shows a physical tensile sample of the WGB sample and K417G alloy, and Figure 3b presents the corresponding stress-strain curve obtained from the tensile test.
Figure 1.
(a) Schematic illustration of the preparation of bonded specimens, (b) morphology of the HMP, and (c) morphology of the LMP.
Figure 2.
HP 12 × 12 × 12 Vacuum Hot Press Furnace (manufactured by CENTORR Vacuum Industries, Nashua, NH, USA) (a) and CMT5105 Electronic universal testing machine (Shenzhen SANS Testing Machine Co., Ltd., Shenzhen, China) (b).
Figure 3.
Tensile engineering stress–strain curves of the WGB sample and cast K417G alloy.
To analyze and predict the optimal joining process for the K417G nickel-based superalloy, four key process parameters were considered. The first parameter, composition (C), represents the content of LMP in the filler material, ranging from 1% to 20%. The second parameter, temperature (T), refers to the high-temperature oxidation temperature in the wide-gap brazing zone, with values ranging from 1100 °C to 1200 °C. Meanwhile, the third parameter, holding time (H), varied from 1 to 120 min. As the holding time increased, the oxide weight exhibited a parabolic trend, initially increasing and then stabilizing. The fourth parameter, pressure (P), represents the applied pressure during heat treatment, which promotes liquid phase formation in the interlayer and base material, facilitating uniform joint microstructure and improved joint performance. The pressure range was 1–30 MPa. In this study, 30 sets of process parameters were designed, as summarized in Table 1, listing the composition and process parameters corresponding to the joint microstructures obtained by WGB.
2.2. Statistical Regression Analysis of the Experimental Parameters
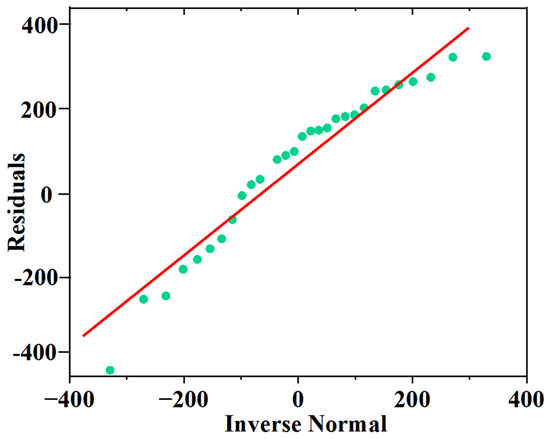
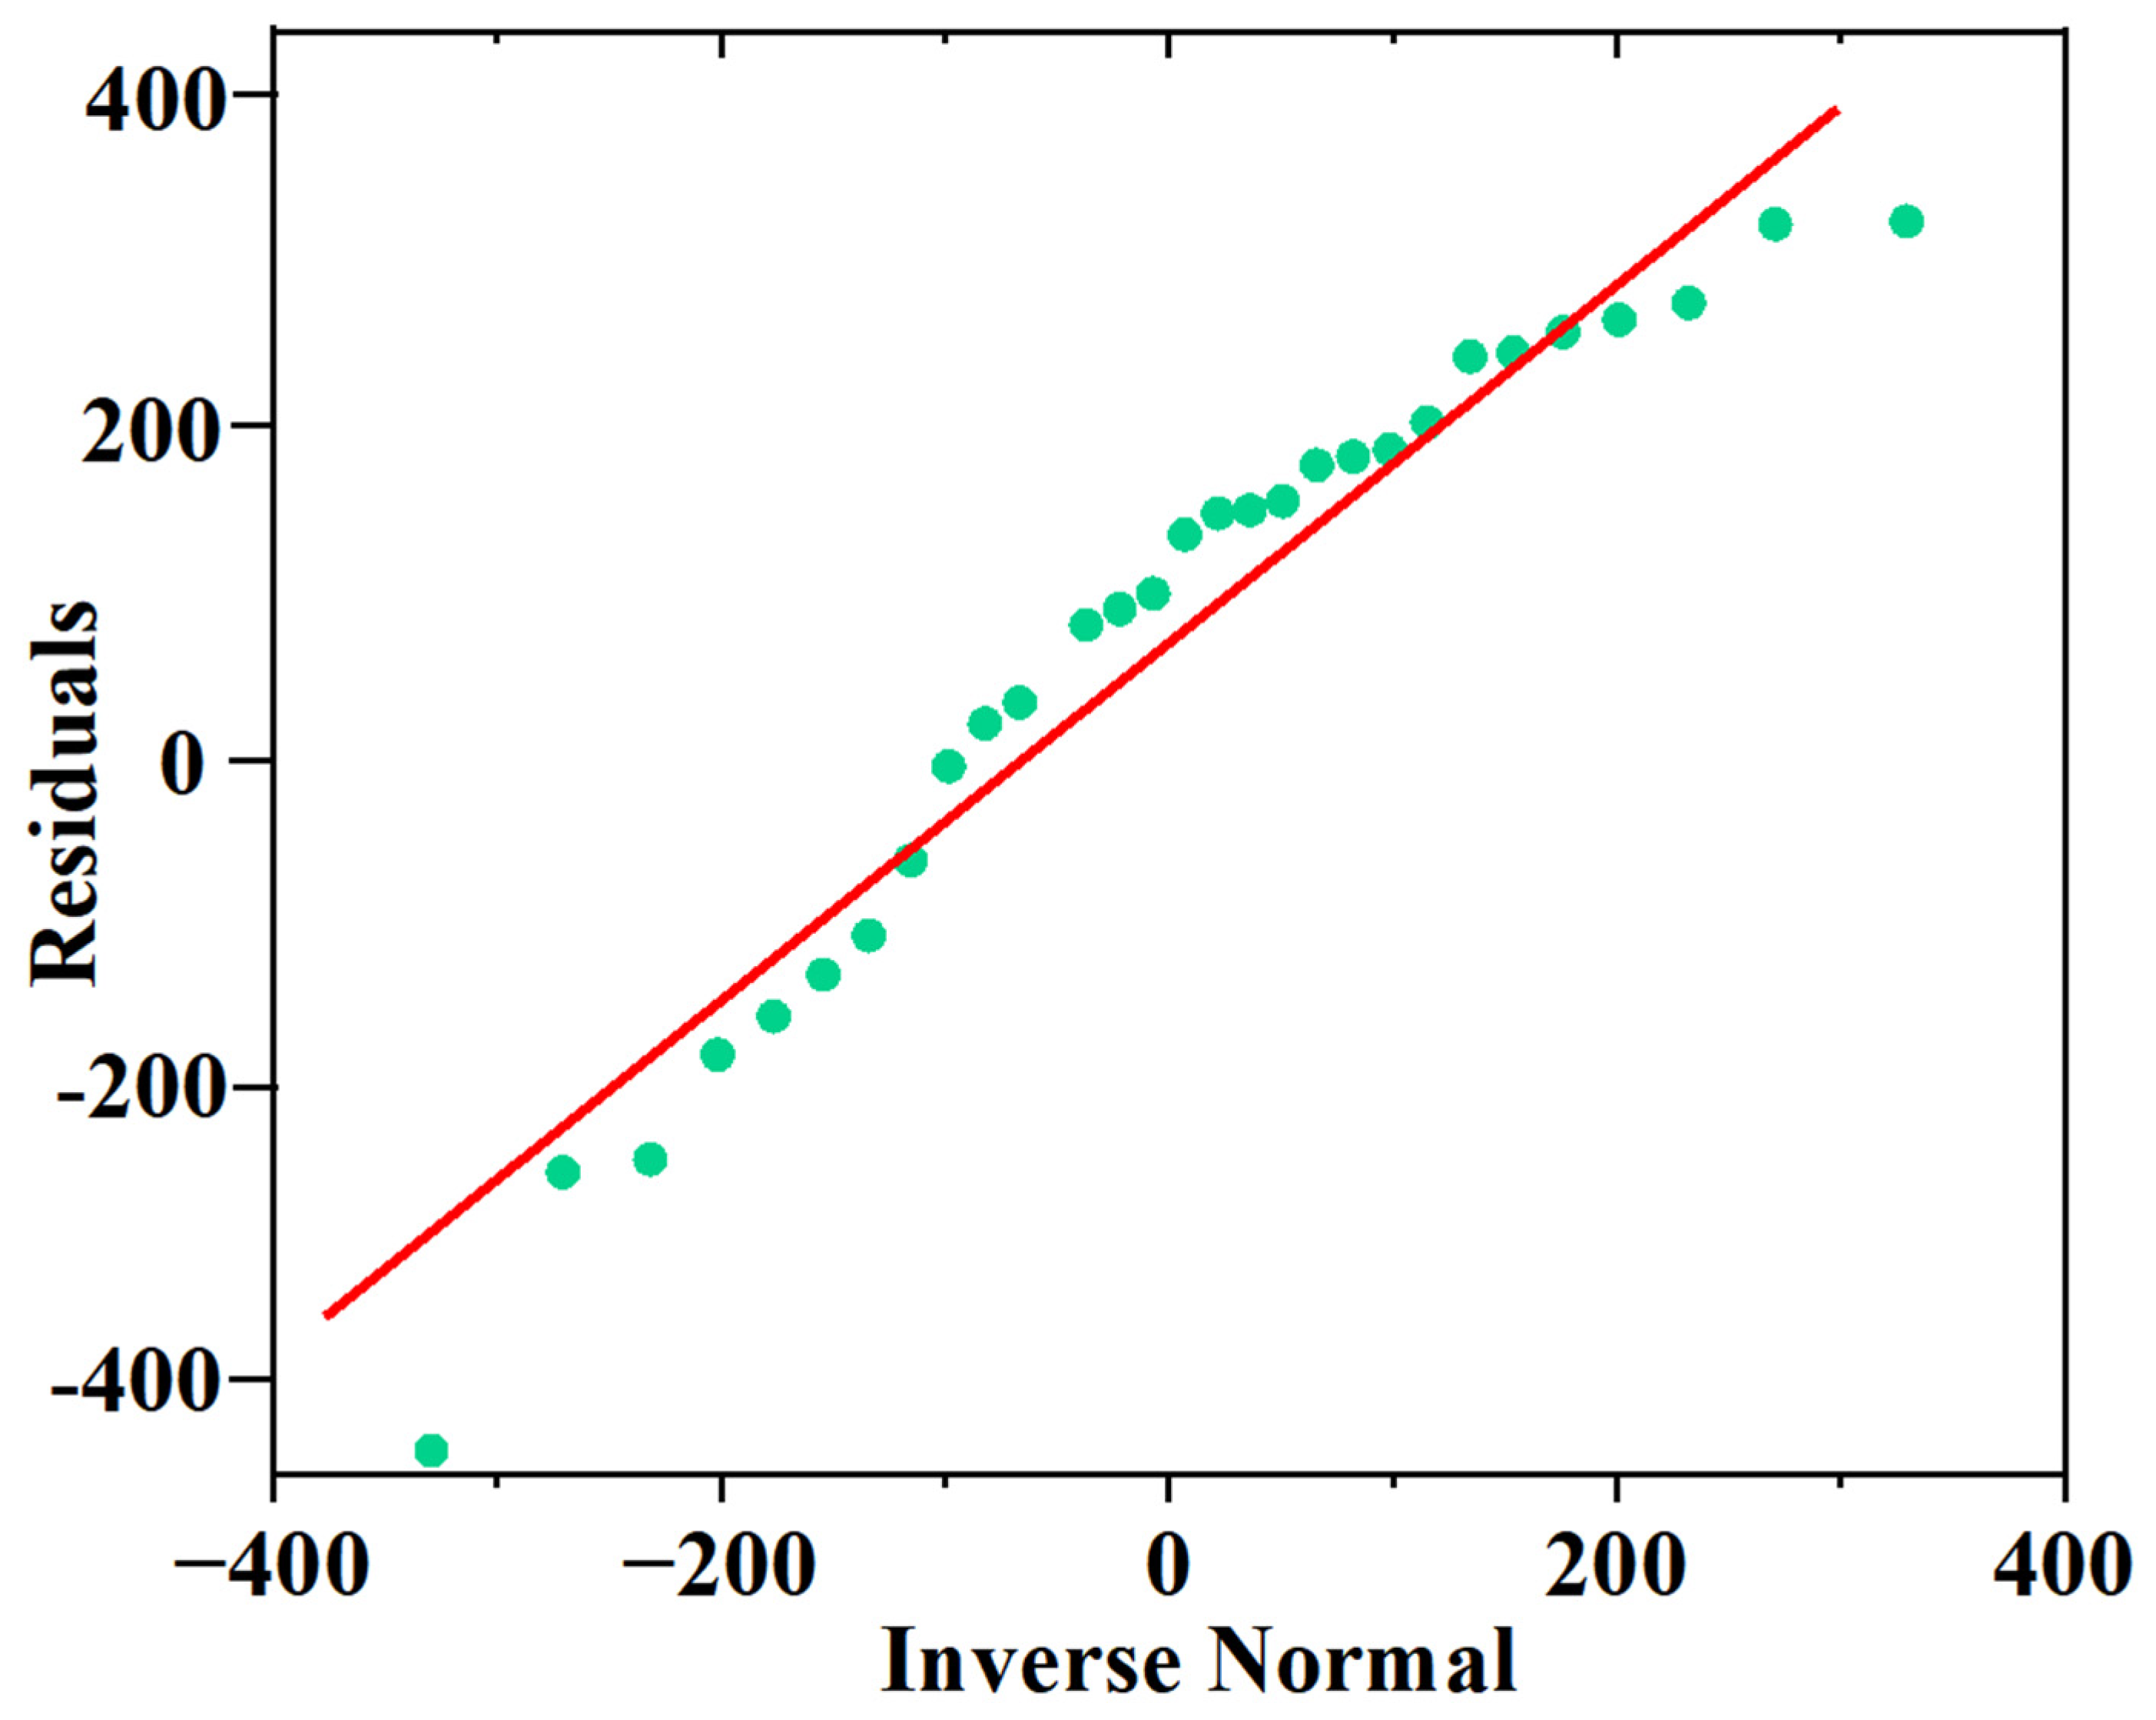
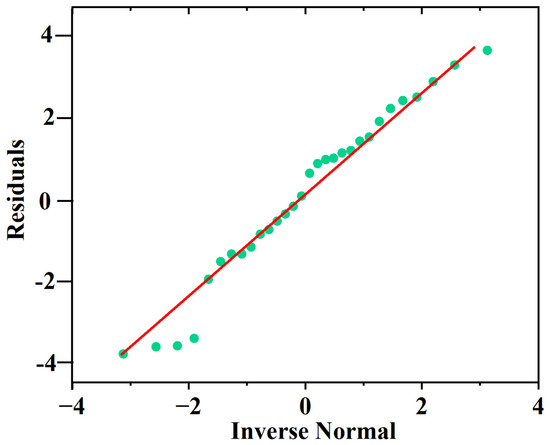
In this study, the experimental data contained no significant outliers. Both tensile strength and elongation were continuous variables, and the residuals approximately followed a normal distribution (Figure 4 and Figure 5). In addition, no severe multicollinearity was observed, as all variance inflation factors (VIFs) were below 5. The solid green dots in Figure 4 and Figure 5 represent the experimental data listed in Table 1; the red line in each figure corresponds to its linear regression fit, respectively.
Figure 4.
Residual distribution with tensile strength as the response variable.
Figure 5.
Residual distribution with elongation as the response variable.
Accordingly, two linear regression models were constructed to analyze the effects of composition, temperature, holding time, and pressure on the tensile strength and elongation. The regression model was expressed as follows:
where and denote the tensile strength and tensile elongation, respectively; and , , , and correspond to the composition, temperature, holding time, and pressure, respectively, and is the error term. The regression results are summarized in Table 2 and Table 3. As shown in Table 2, temperature had a statistically significant positive effect on tensile strength, while the composition, holding time, and pressure did not show significant effects. Table 3 shows that both the composition and temperature had significantly positive effects on elongation, whereas holding time and pressure were not statistically significant.
Table 2.
Effects of composition, temperature, holding time, and pressure on tensile strength.
Table 3.
Effects of composition, temperature, holding time, and pressure on elongation.
3. TabNet Model
3.1. Core Architecture of TabNet
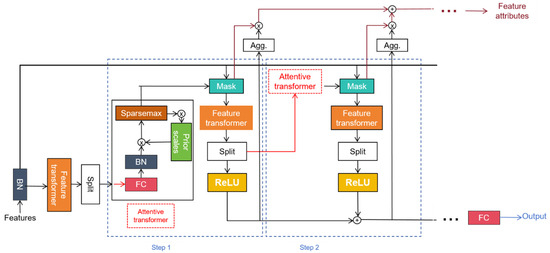
Inspired by the high-dimensional sparsity of tabular data and the need for efficient nonlinear fitting, TabNet serves as a high-performance neural network architecture specifically designed for tabular data. Its core components include feature transformers, attentive transformers, and multiple decision steps. Through a sequential attention mechanism, TabNet can perform instance-wise sparse feature selection, and by combining shared layers with decision-step-dependent layers, it can effectively model non-linear relationships. Along with gated linear units (GLUs) and sparse regularization [24,25,26], TabNet can retain strong nonlinear approximation capability while preventing redundant features from occupying model capacity. Moreover, feature selection masks provide inherent interpretability without requiring complex feature engineering, making TabNet particularly effective for small-sample tabular datasets.
The overall architecture of TabNet is illustrated in Figure 6. The TabNet encoder adopted a multi-decision-step structure. Each decision step contained a feature transformer, an attentive transformer, and a masking module. The feature transformer output was split into decision contributions and intermediate representations for subsequent steps. The aggregation module summed contributions from all decision steps to generate the final output while enabling feature attribution for interpretability.
Figure 6.
Core architecture of the TabNet model.
In this study, the TabNet input consisted of four features corresponding to key composition and process parameters. The formatted input matrix could be expressed as follows:
where denotes the number of samples, and represents the feature vector of the j-th sample, which corresponds to the four input parameters listed in the table. Specifically, the feature vector could be expressed as follows:
where , , , and denote the filler composition, processing temperature, holding time, and applied pressure of the j-th sample, respectively. The output of the TabNet model consisted of two mechanical performance indicators, corresponding to the room-temperature tensile strength M and elongation E shown in the table. Accordingly, the output vector could be written as follows:
where and represent the tensile strength and elongation of the j-th sample, respectively. In the TabNet model, the feature selection mask at each decision step i was generated through sparse normalization using the Sparsemax function. This mask was computed by incorporating the feature usage prior (P[i]) from previous decision steps, thereby ensuring efficient and non-redundant feature utilization. The corresponding operation could be formulated as follows:
where a[i − 1] denotes the intermediate representation from the previous decision step, is a trainable mapping function, and , with the parameter serving as a relaxation factor that ensures a reasonable allocation of features across different decision steps, preventing feature dominance at early stages. The selected features were then processed by the feature transformer to perform nonlinear transformation, yielding the decision contribution (d[i]) at the current step and the intermediate representation (a[i]) for the subsequent step:
where denotes the mapping function of the feature transformer, which incorporates GLUs to enhance the model’s capability to capture nonlinear relationships. The GLU could be defined as follows:
where z is the output of the fully connected layer, and denotes the Sigmoid activation function. The local decision outputs from all decision steps were aggregated after rectified linear unit (ReLU) activation [27,28] to obtain the final prediction, enabling balanced optimization for the dual-output regression task:
where and denote the weights and bias of the output layer, respectively, and represents the aggregated decision contributions from all decision steps. In this study, the learnable parameters of the TabNet model included the mapping matrix of the attentive transformer, the weights and biases of the feature transformer, as well as the output layer weight and bias . These parameters were optimized through hyperparameters such as the learning rate η and the number of training epochs γ. Equations (2)–(5) summarize the forward propagation process of TabNet, whose core mechanism followed a sequential logic of feature selection → feature transformation → multi-step aggregation. This structure enabled the efficient modeling of the nonlinear relationships between the composition and process parameters (C, T, H, and P) and the mechanical properties (M, E). Accordingly, the TabNet model adopted in this study employed four hidden layers in the feature transformer (two shared layers and two decision-step-dependent layers), each with a dimensionality of 8, and these layers were reused across three decision steps.
3.2. Loss Function
The loss function quantified the discrepancy between predicted values and ground truth labels, guiding model training through parameter optimization. To address the imbalance caused by different magnitudes of multiple output variables, a standard deviation–normalized weighted loss function was proposed. Based on the mean squared error (MSE), the loss function incorporated standard deviation weighting to balance contributions from tensile strength and elongation:
where denote the model predictions of tensile strength and elongation, respectively, represent the corresponding ground-truth values, and terms serve as the standard deviations of the true labels for tensile strength and elongation, respectively. This loss function was employed in the training of the TabNet regression model to replace the conventional mean loss calculation. It was particularly effective for multi-output regression tasks in which the output variables, such as the tensile strength and elongation in this study, differed significantly in numerical scale, enabling balanced optimization across multiple mechanical property targets.
3.3. Training Details
Before model training, data preprocessing was performed to meet the input requirements of the TabNet model and mitigate overfitting caused by the small sample size. Subsequently, a combined strategy of standardization and stratified splitting was adopted. Specifically, all four input parameters were standardized using the StandardScaler method to eliminate the influence of dimensional differences on the attention-based feature selection mechanism. The standardization process could be defined as follows:
where denotes the mean value, and represents standard deviation. The dataset was randomly split into training and validation sets at a ratio of 8:2, and a fixed random seed was used to ensure consistency in data distribution. For output processing, the two target variables, namely, tensile strength (MPa) and elongation, were retained in their original scales. The imbalance between these outputs was addressed through the proposed weighted loss function, which balanced the optimization priorities of the two mechanical properties. To alleviate overfitting in small-sample training, a triple safeguard strategy combining early stopping, learning rate scheduling, and sparse regularization was employed. In the early stopping mechanism, the validation MSE was monitored, and training was terminated when no improvement was observed for 15 consecutive epochs (patience = 15). The model parameters corresponding to the best validation performance were automatically saved, and the learning rate scheduling was implemented using the ReduceLROnPlateau scheduler. When the validation loss stagnated for five consecutive epochs, the learning rate was reduced by a factor of 0.5, with the minimum learning rate threshold set to 1 × 10⁻⁶, which helped the model escape local optima. In addition to sparse regularization, model weights were initialized using Xavier uniform initialization. The momentum parameter of batch normalization (BN) layers in the feature transformer was set to 0.02 to further suppress overfitting. The Adam optimizer was adopted for model training, with parameters configured as = 0.9, = 0.999, and weight decay of 1 × 10⁻⁵, achieving balance between the convergence speed and parameter regularization. The primary evaluation metrics for model training included the MSE, mean absolute error (MAE), and the coefficient of determination (). Among these, validation served as the criterion for selecting the optimal model.
3.4. Experimental Results
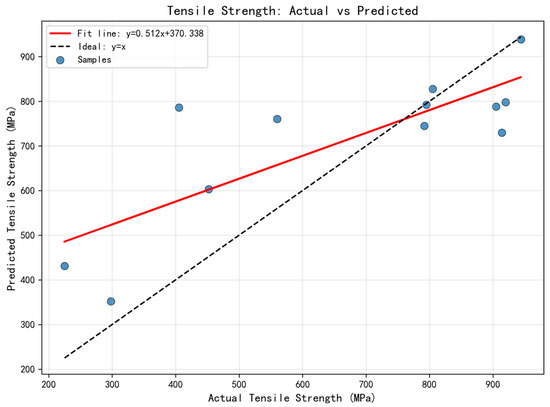
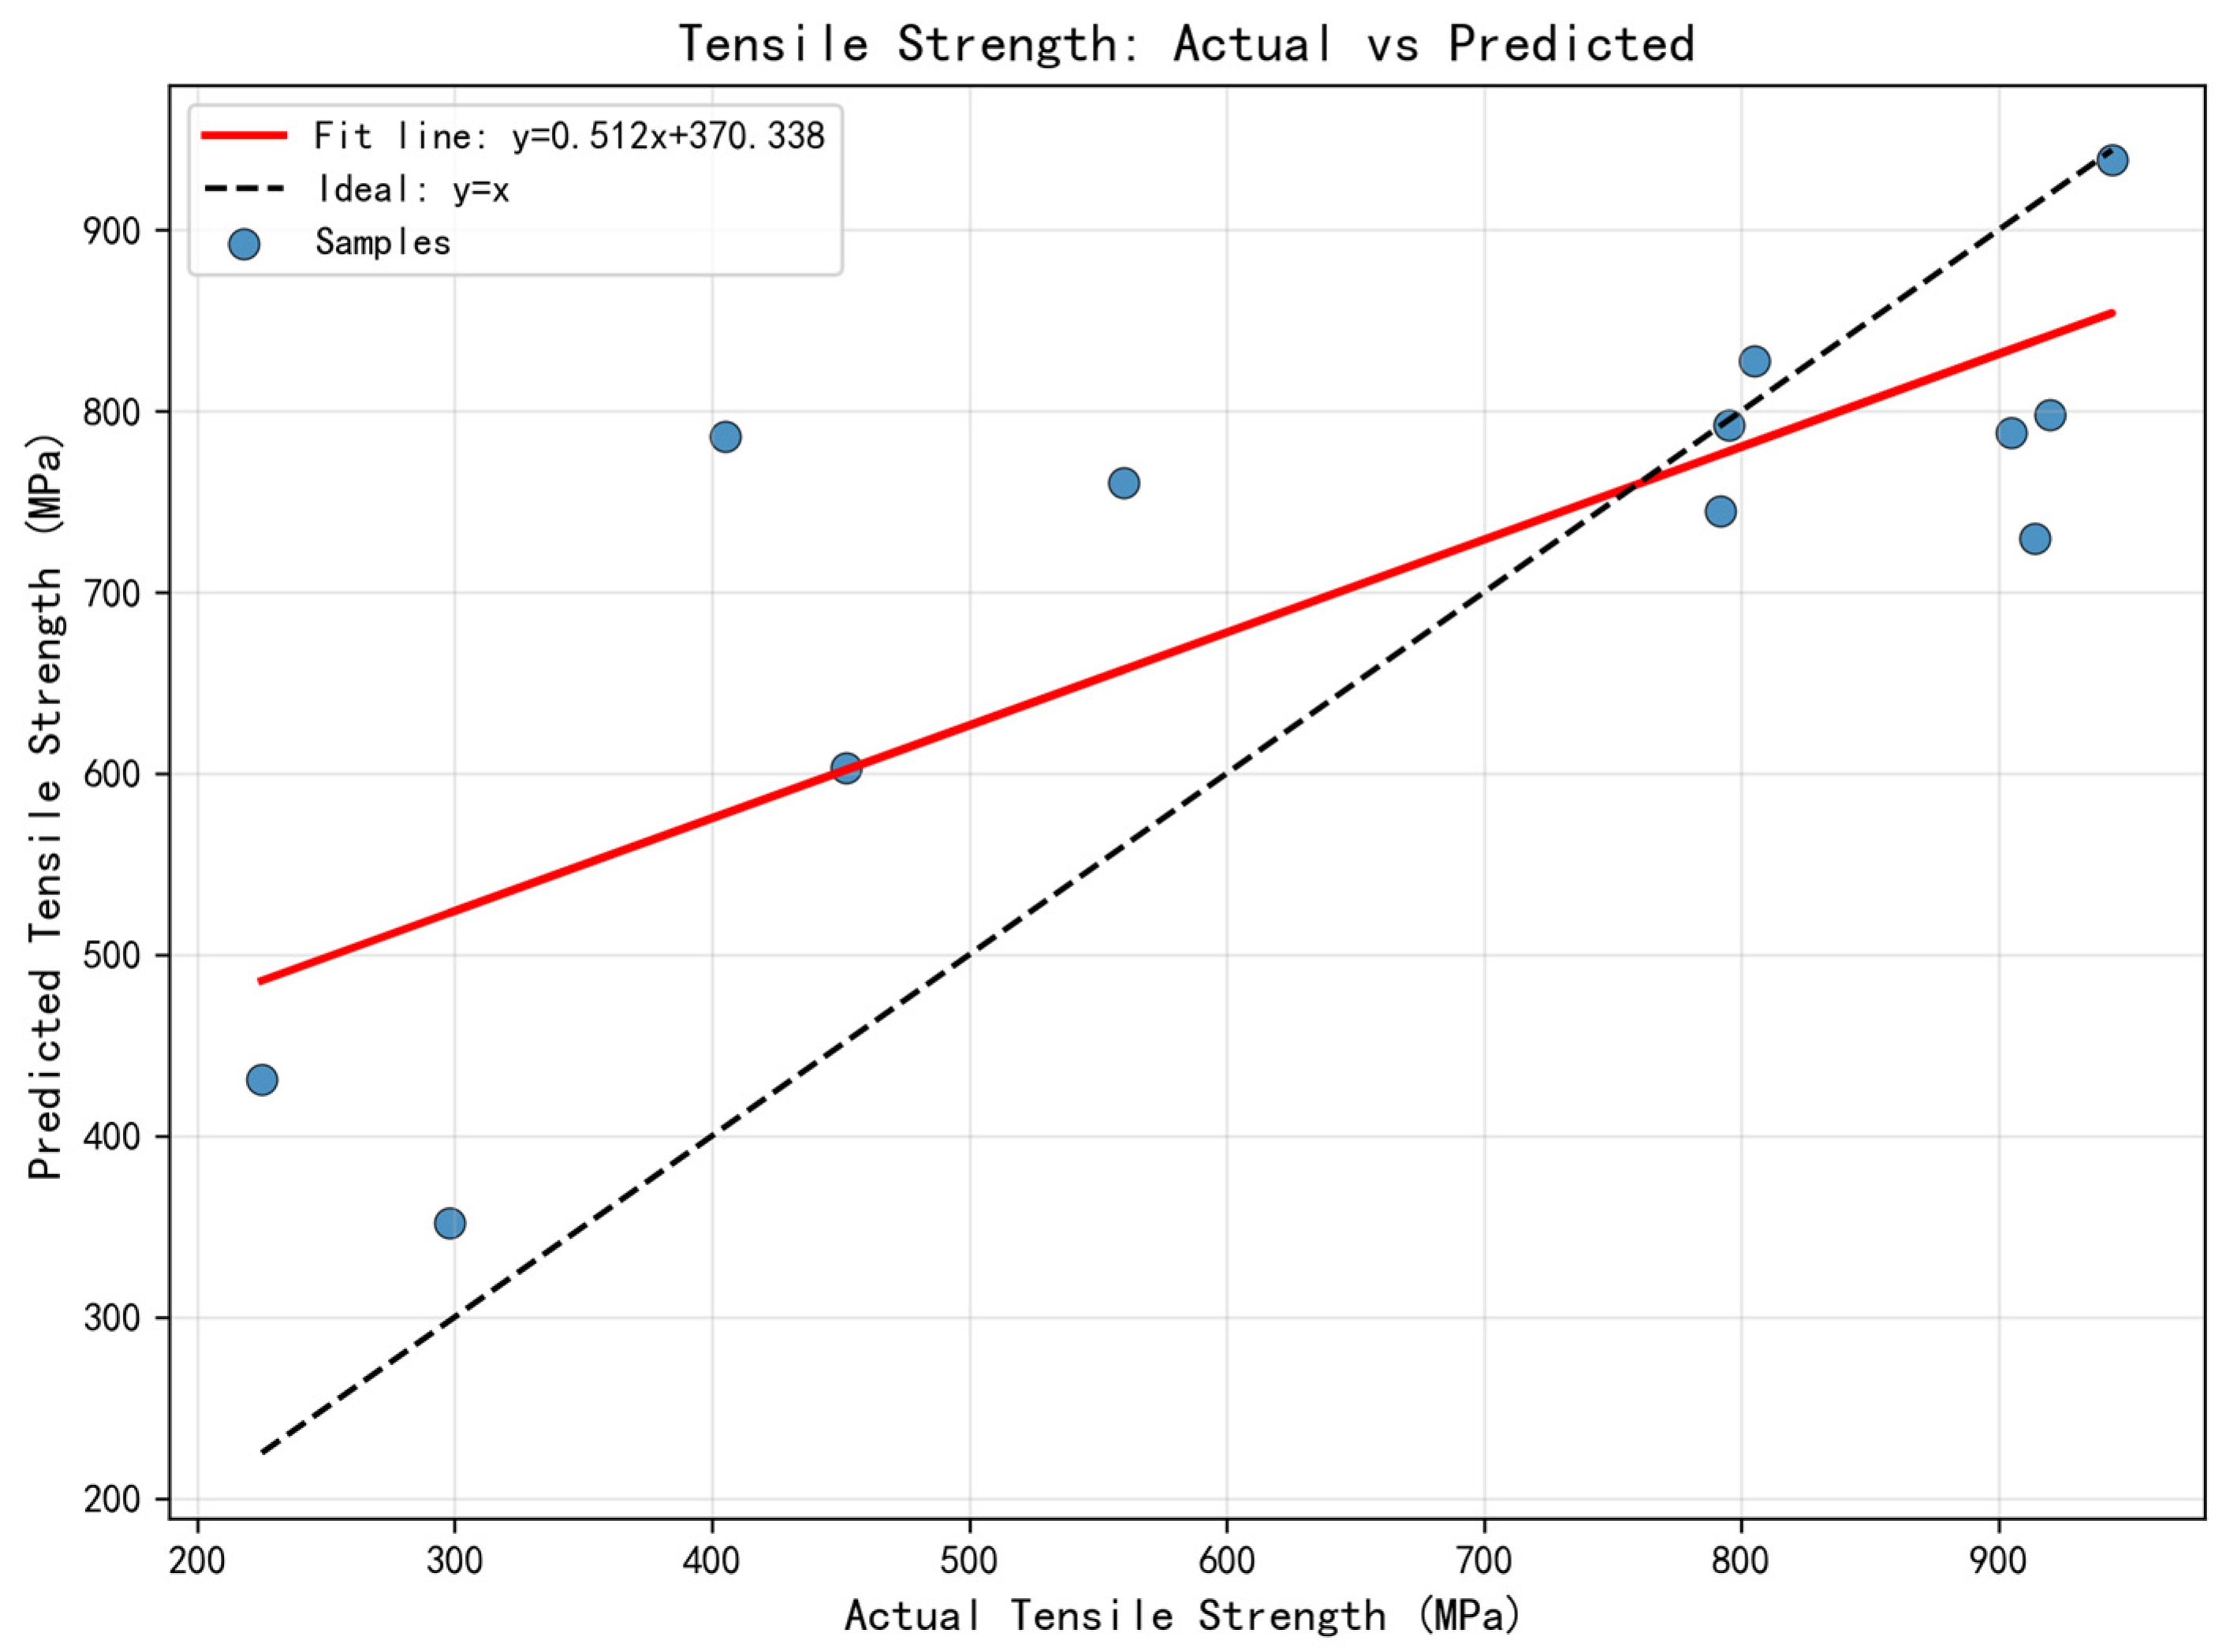
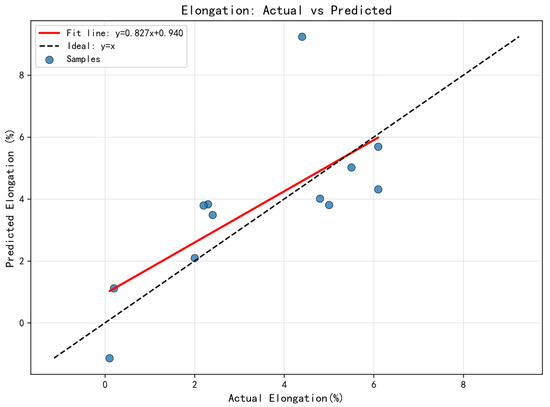
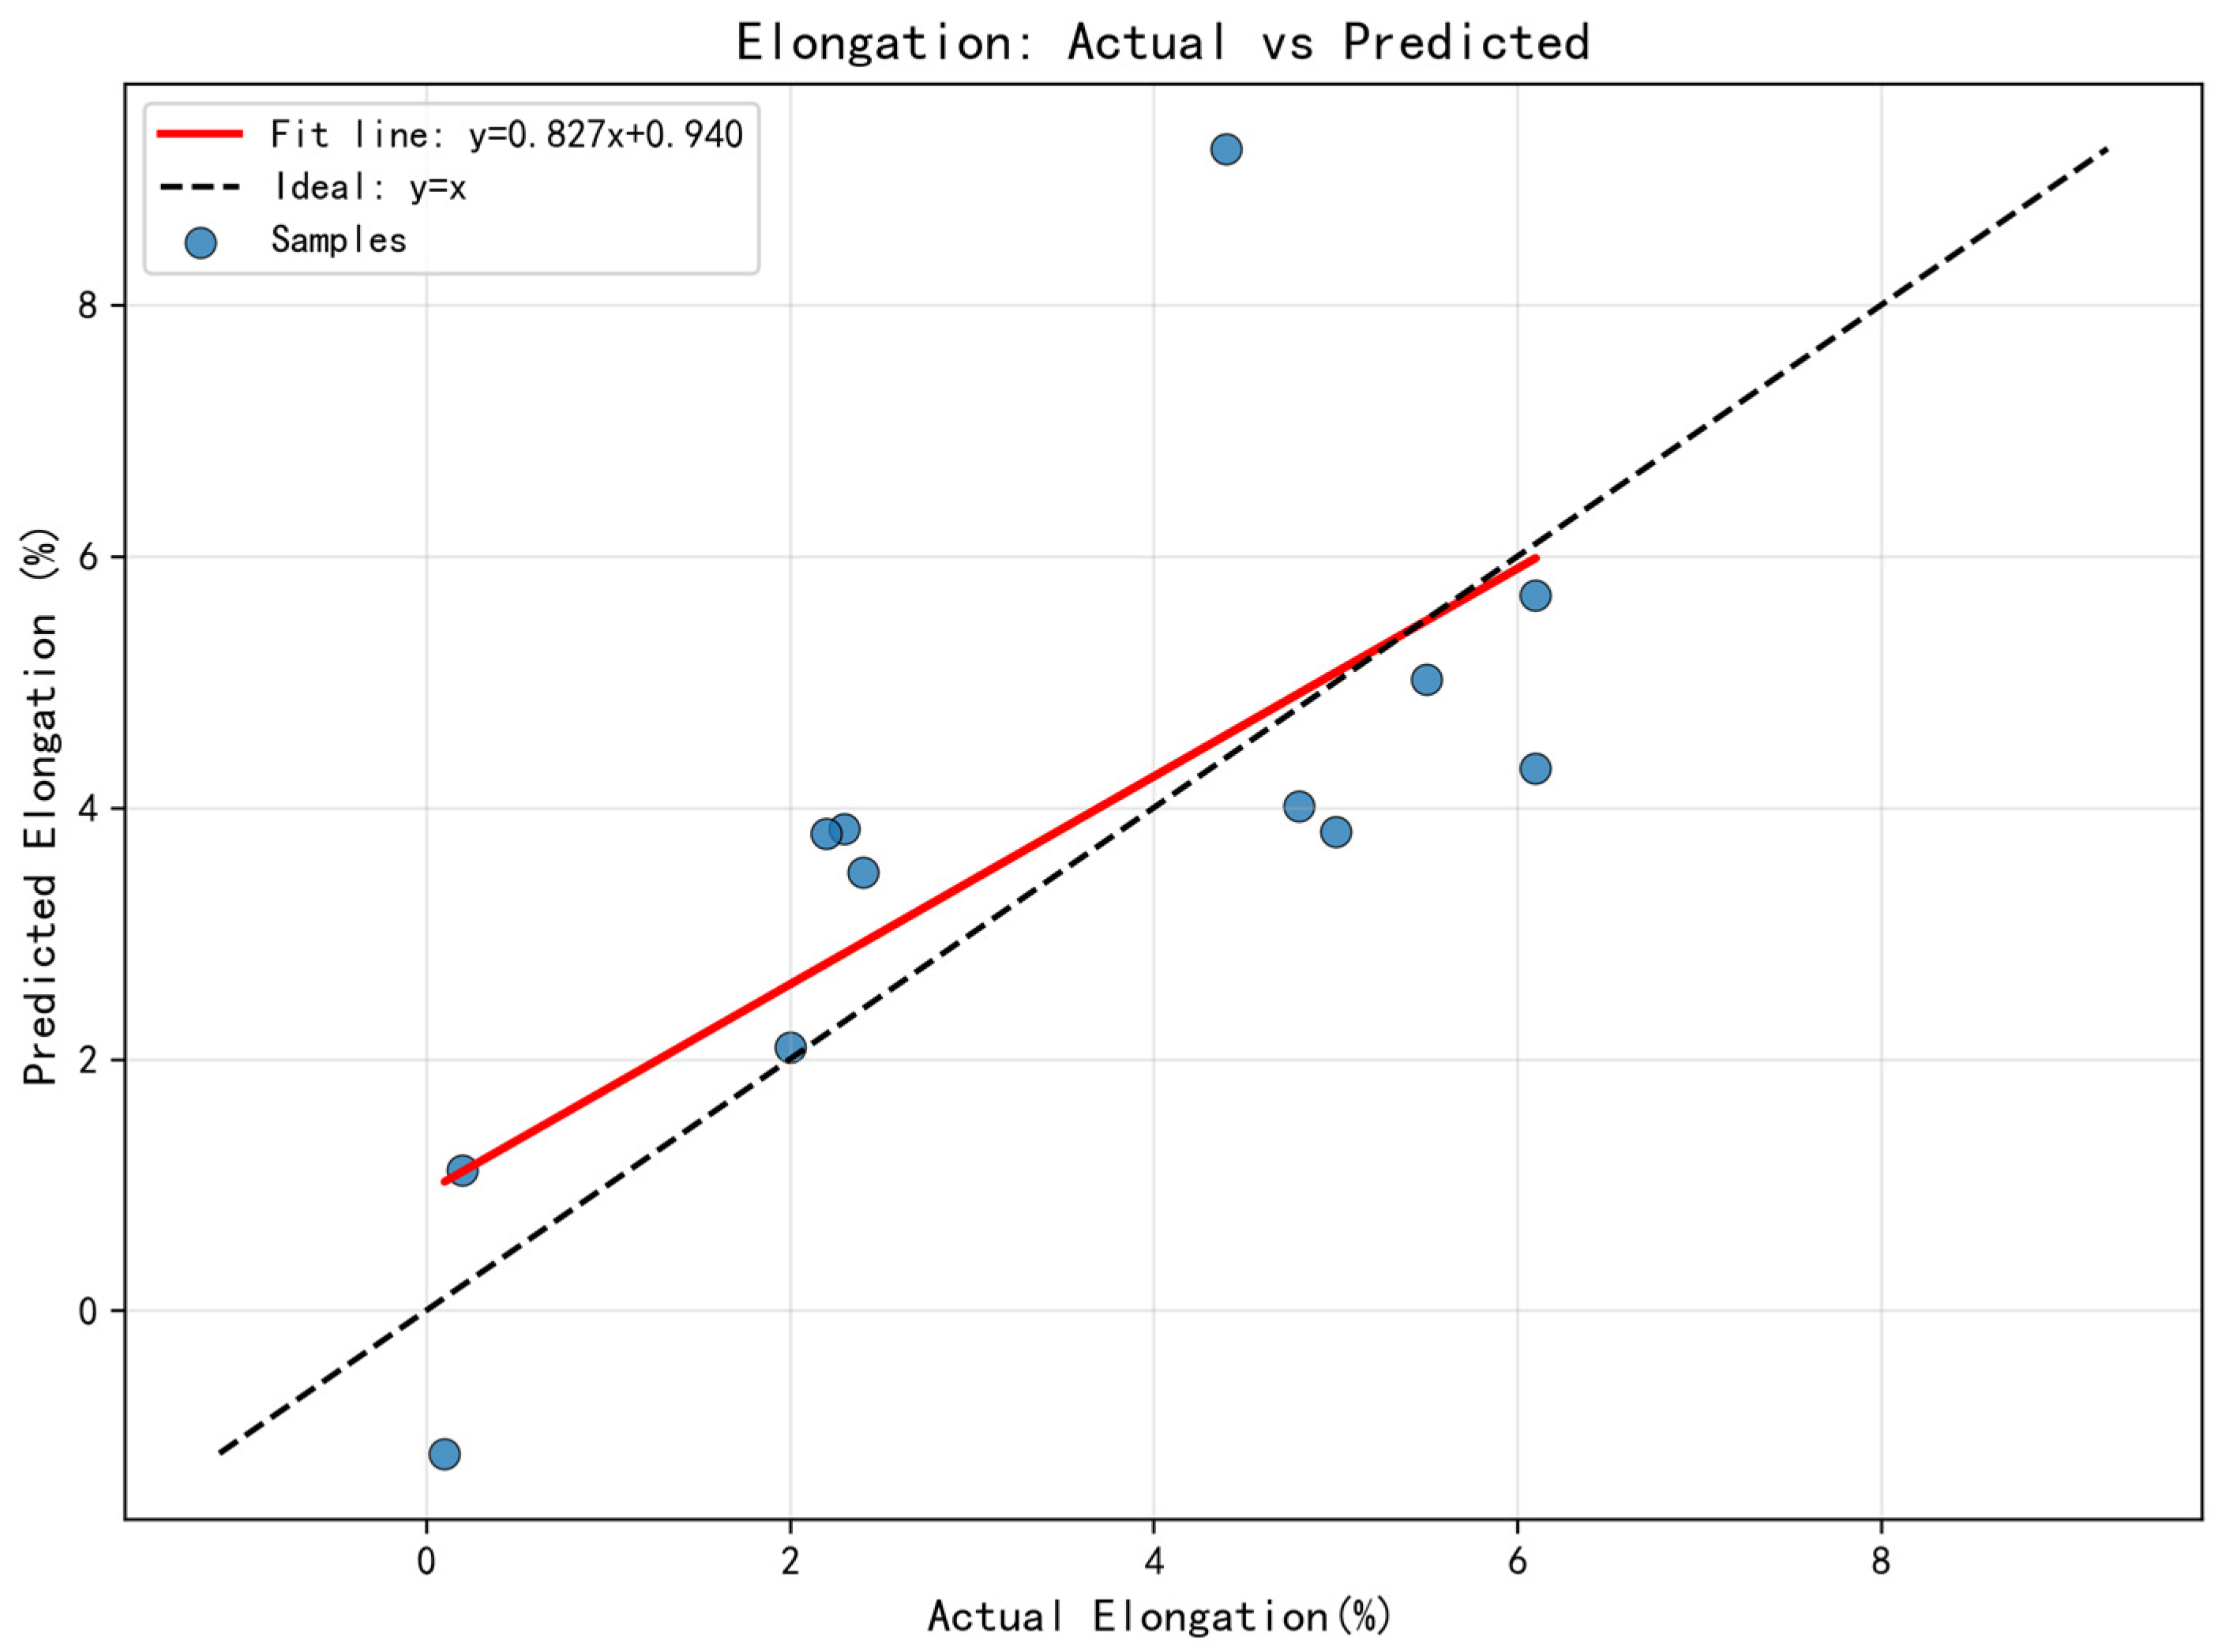
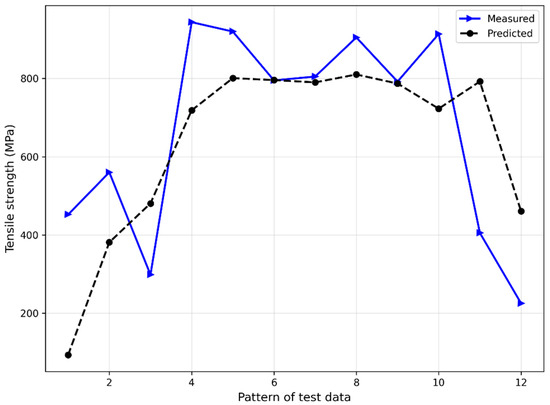
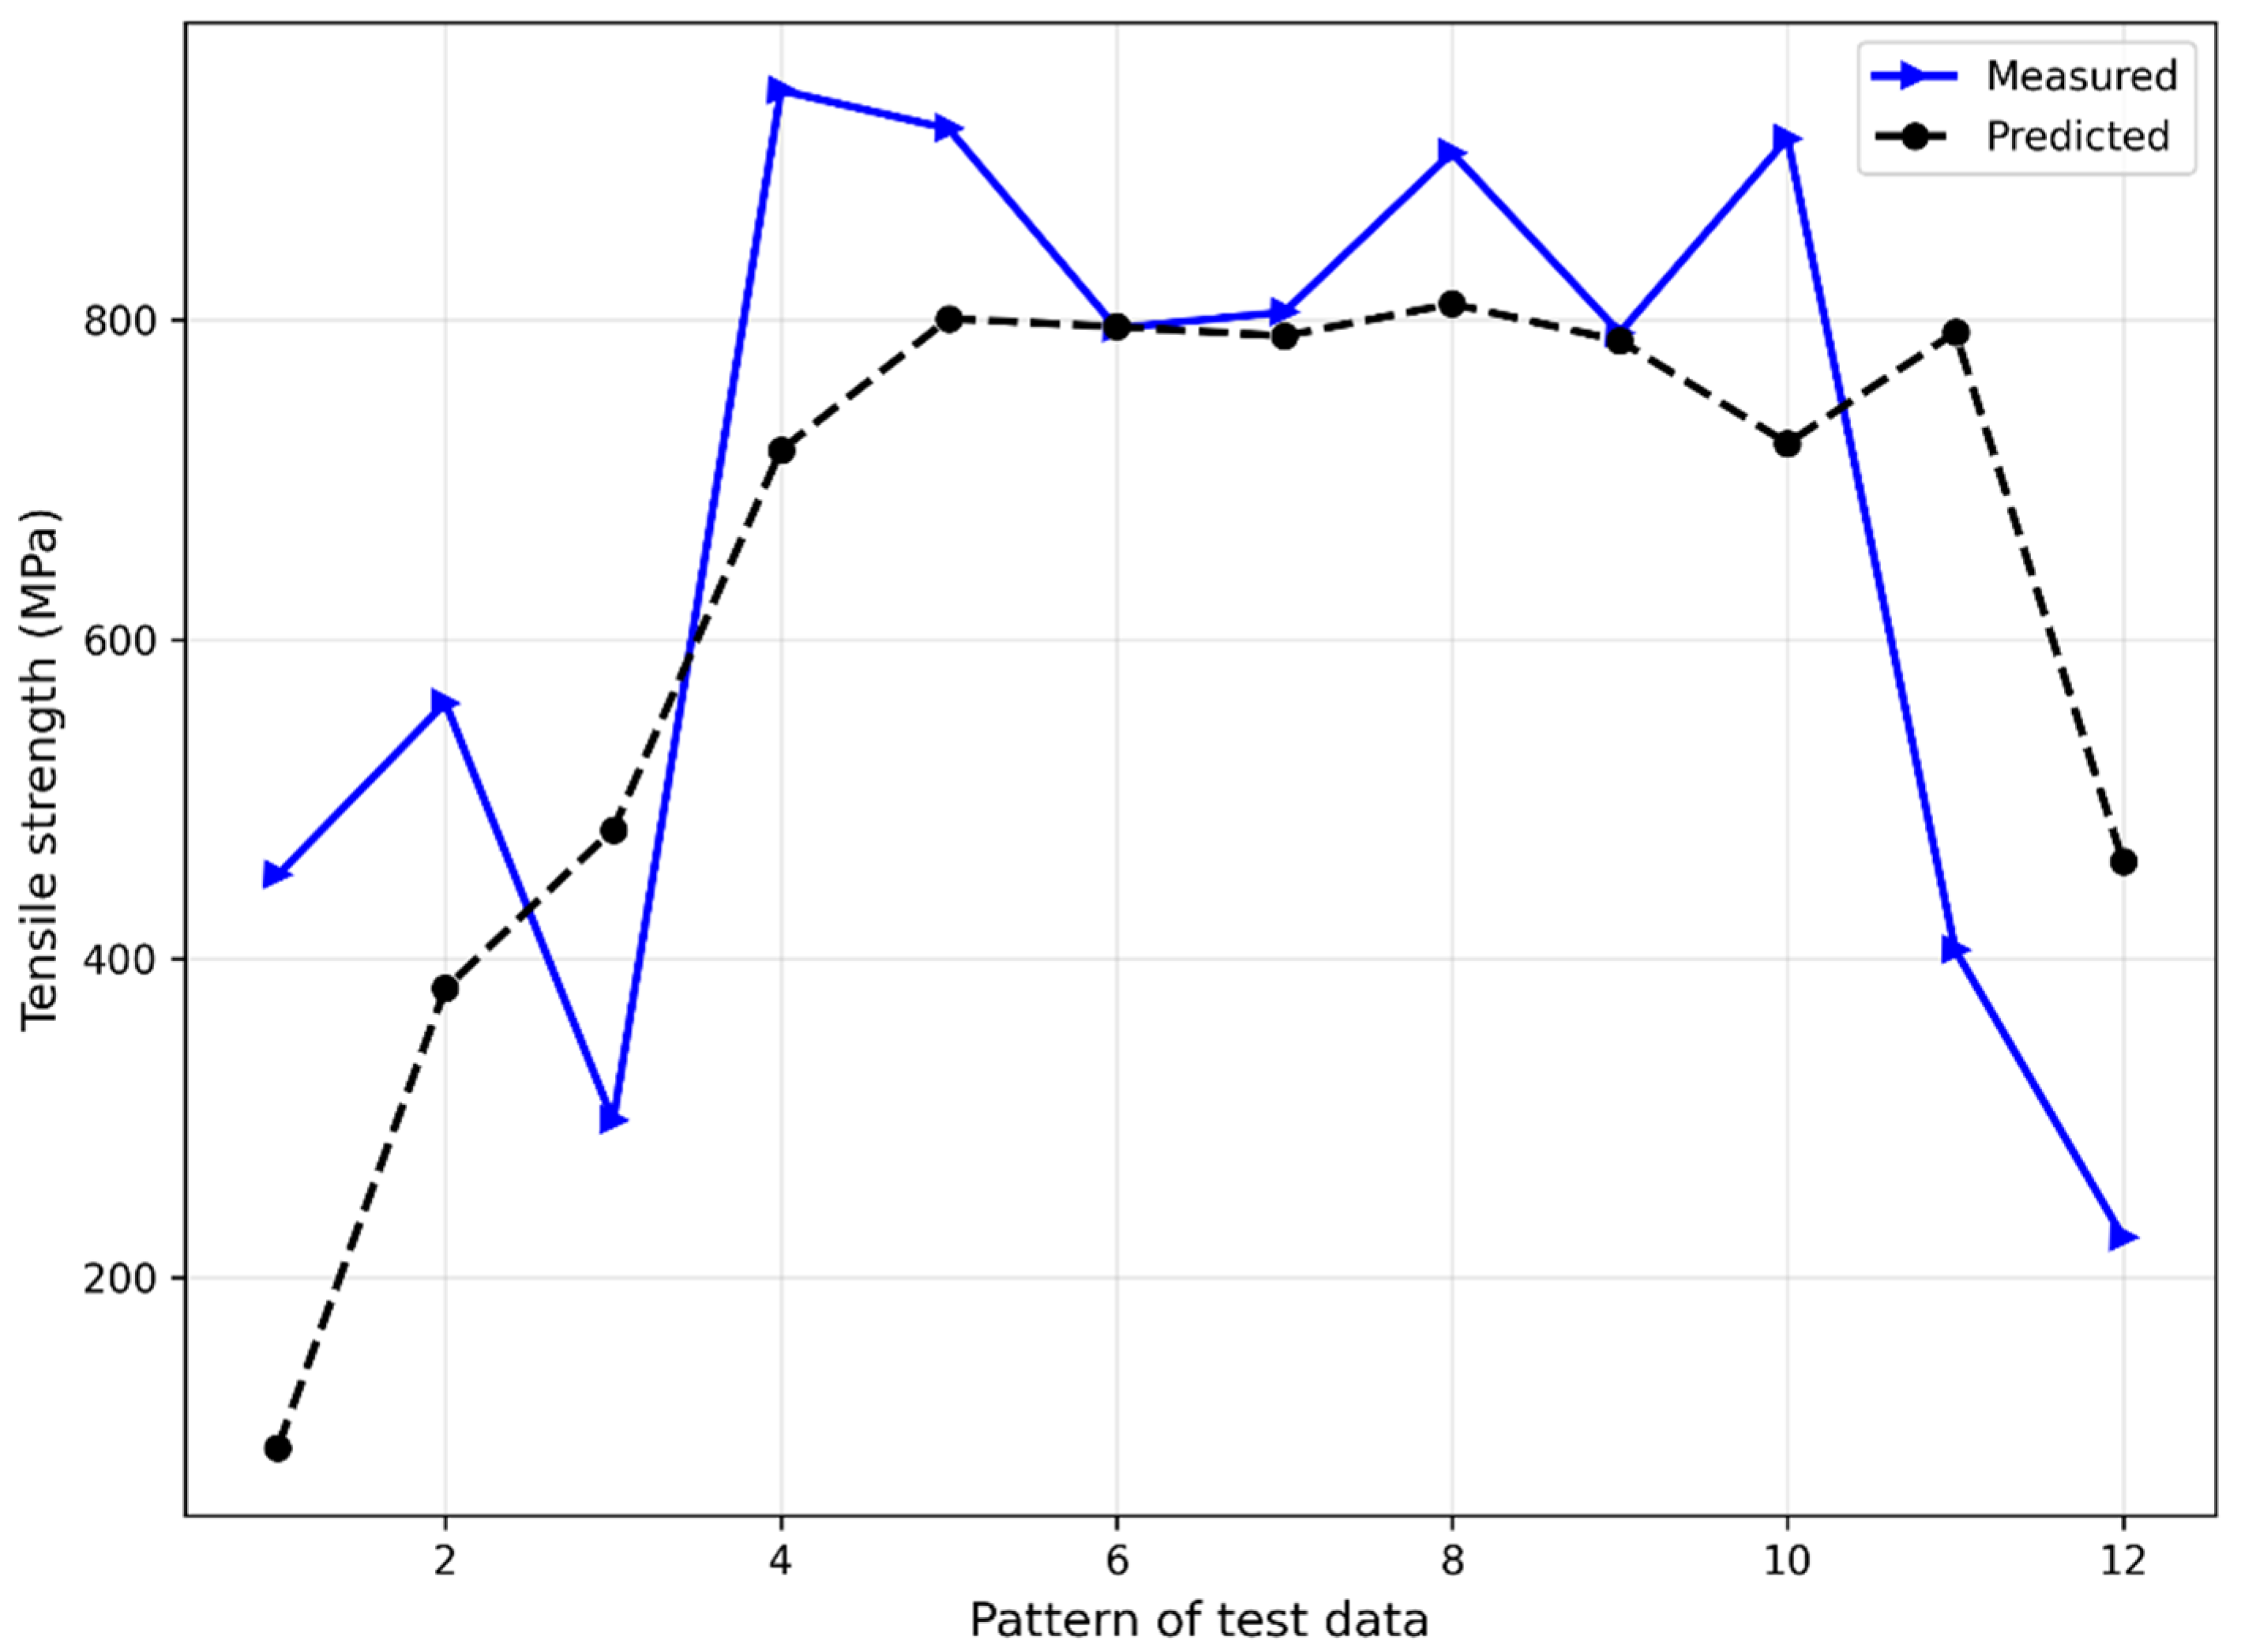
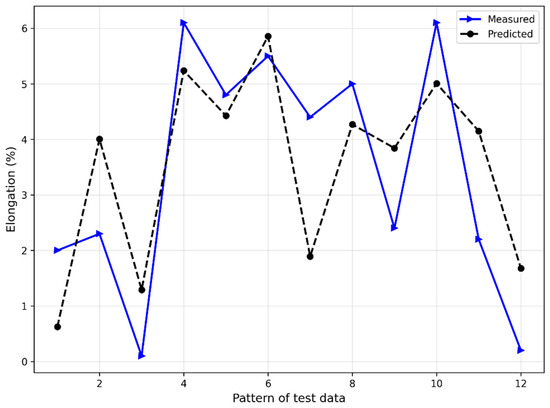
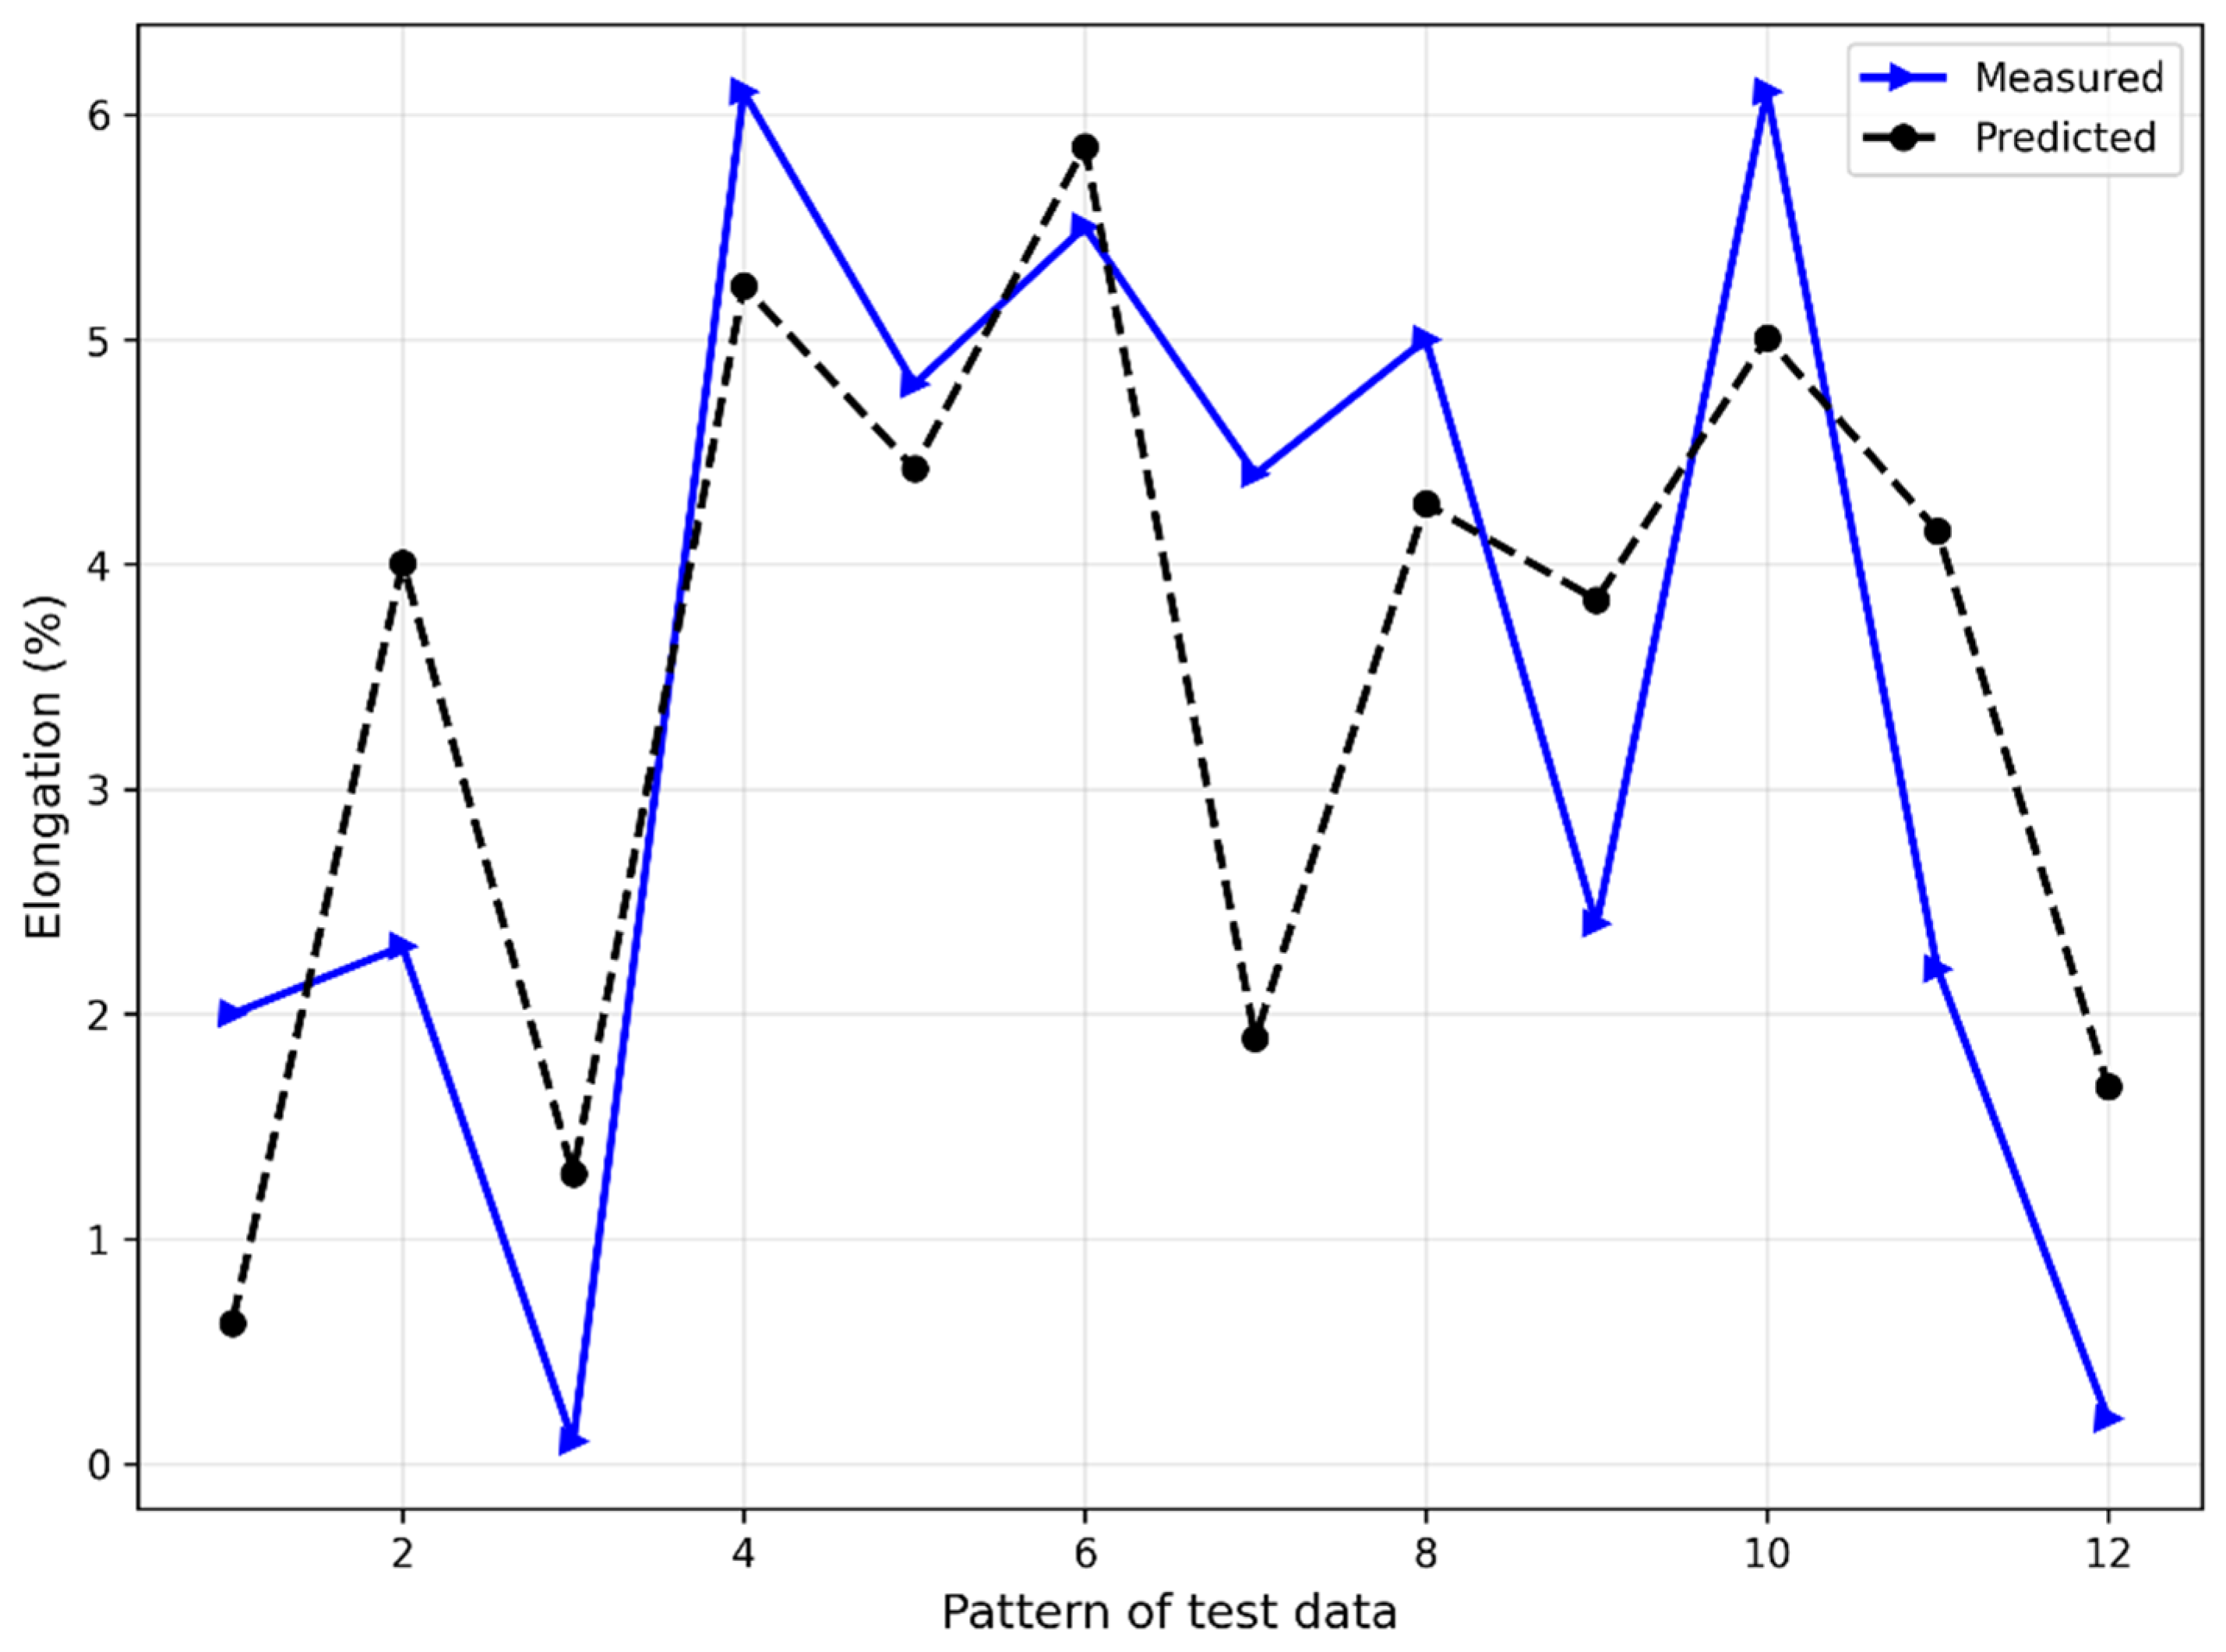
Figure 7 shows a comparison of the predicted and true tensile strength values of the test samples. The true values lie along the Y = X line, while the predicted values are distributed closely around it. Figure 8 shows a similar comparison for elongation, with predictions more tightly clustered around the ideal line. Figure 9 and Figure 10 present the corresponding line comparisons. As shown in Table 4 and Table 5, the TabNet model was compared with a deep learning model Transformer [29], a deep learning model architecture used for natural language processing (NLP) and other sequence-to-sequence tasks. The lower MAE values indicated that the TabNet model achieved higher prediction accuracy for elongation than for tensile strength. Compared to Transformer, TabNet used in this study obtained better prediction performance.
Figure 7.
Scatter plot comparing the predicted and experimental tensile strength values.
Figure 8.
Scatter plot comparing the predicted and experimental elongation values.
Figure 9.
Line plot comparing the predicted and experimental tensile strength values.
Figure 10.
Line plot comparing the predicted and experimental elongation values.
Table 4.
Statistical error of TabNet and Transformer in tensile strength prediction.
Table 5.
Statistical error of TabNet and Transformer for elongation rate.
4. Conclusions
This study investigated the effects of filler composition and joining process parameters, including temperature, holding time, and pressure, on the mechanical properties of joints repaired using WGB of the K417G alloy. The relationships between these parameters and mechanical properties are highly nonlinear, and they cannot be accurately described using conventional prediction methods. Statistical analysis revealed that temperature has a significant positive effect on tensile strength, while both composition and temperature significantly influence elongation. In addition, the TabNet machine learning model was applied to predict joint mechanical properties. To obtain a joint structure with excellent performance, multiple decision steps were used to optimize the process parameters of the joint structure after welding, using machine learning methods rather than a trial-and-error approach, suggesting that the model involved a four-layer TabNet network structure. The results indicated that due to the limited number of training samples, the TabNet model could not be fully trained, making it difficult to precisely approximate the functional relationship between the process parameters and mechanical properties. The limited dataset size did not allow the model to fully access all dimensions of the data distribution [30,31], which was prone to overfitting. As a result, this led to the model performing well on the training set but performing poorly on the test set or in practical applications (low generalization ability), as illustrated in this study.
Author Contributions
Conceptualization, Z.C.; methodology, Z.C., M.W. and J.F.; software, Z.C., validation, X.W. and X.L.; formal analysis, Z.C., and B.W.; investigation, Z.C., B.W.; resources, B.W., X.W., X.L. and J.F.; data curation, Z.C.; writing—original draft preparation, Z.C., M.W. and J.F.; writing—review and editing, M.W., X.W., X.L. and J.F.; visualization, X.W. and X.L.; supervision, B.W., X.W., X.L. and J.F.; funding acquisition, X.W. and X.L.; All authors have read and agreed to the published version of the manuscript.
Funding
Funding was provided by: National Natural Science Foundation of China (No. 62176071), Natural Science Foundation of Guangdong Province (No. 2025A1515010498), South China University of Technology Fundamental Research Funds for the Central Universities (No. 2023ZYGXZR005), Key Areas Research Program for Higher Education Institutions of Guangdong Provincial Department of Education (No. 2023ZDZX3058), Key-Area Research and Development Program of Guangdong Province (2024B1111080003), the Opening Project of the Guangdong Provincial Key Laboratory for Processing and Forming of Advanced Metallic Materials (South China University of Technology, GJ 202408), 2023 Guangdong Provincial Science and Technology Innovation Strategy Special Funds (University Students’ Science and Technology Innovation Cultivation) (No. pdjh2023b0823), Guangdong Basic and Applied Basic Research Foundation Project (No. 2023A1515010384), the School-Level Research Project of Guang Dong Polytechnic of Industry and Commerce (No. 2025-ZK-05), Guangzhou Science and Technology Bureau Projects (No. SL2022A04J00030), High-Level Talent Special Project/Initiative of Guangdong Polytechnic of Industry and Commerce (No. 2022-gc-07), 2024 Guangdong Higher Education Key Area Special Project: High-end Equipment Manufacturing (Intelligent Robotics & New Materials) (No. 2024ZDZX3113), and 2023 Guangdong Higher Education Key Area Special Project: High-end Equipment Manufacturing (2023ZDZX3058).
Data Availability Statement
The original contributions presented in the study are included in the article; further inquiries can be directed to the corresponding authors.
Acknowledgments
The authors gratefully acknowledge the financial support from the National Natural Science Foundation of China (Grant No. 62176071). The authors gratefully acknowledge Jiao Du for his expert technical support regarding the machine learning models, and Cunliang Pan for valuable discussions on data interpretation. We also appreciate the anonymous reviewers for their constructive comments Hansheng Yan and Gengxing Luo contributed to the analyses and discussion of the results and reviewed the entire manuscript.
Conflicts of Interest
The authors declare no conflict of interest.
References
- Rastegari, S.; Arabi, H.; Aboutalebi, M.R.; Eslami, A. A study on the microstructural changes of Cr-modified aluminide coatings on a nickel-based superalloy during hot corrosion. Can. Metall. Q. 2008, 47, 223–232. [Google Scholar]
- Zhang, J.; Zhu, H.; Zhou, N.; Su, X. Process optimization for synthesizing α-Al2O3 with tailored morphology and dispersibility by interpretable incremental machine learning. Mater. Des. 2025, 261, 115198. [Google Scholar] [CrossRef] [Scilit]
- Chen, N.; Wang, Z.; Wu, G.; Zhuo, X.; Ding, Y.; Wei, Y.; Ma, J.; Wang, M.; Shen, C.; Qian, B.; et al. Microstructure evolution and formation mechanism of interfaces in parallel gap resistance welding of stranded Ag-plated Cu conductor to Ag interconnector. Mater. Des. 2024, 238, 112697. [Google Scholar] [CrossRef] [Scilit]
- Bakhtiari, H.; Farvizi, M.; Rahimipour, M.R.; Malekan, A. Influence of bonding temperature on interfacial microstructure and high-temperature oxidation behavior of transient liquid phase (TLP) bonded Hastelloy X joints. Mater. Des. 2025, 258, 114740. [Google Scholar] [CrossRef] [Scilit]
- Zheng, L.; Lee, T.L.; Daisenberger, D.; Gorley, M.J.; Li, Z.; Zhang, G. Rapidly solidified highly alloyed Ni-based superalloy powders for multi-application: The faster the cooling, the softer? Mater. Des. 2025, 257, 114439. [Google Scholar]
- Cheng, Z.; Li, X.; Wang, B.; Qu, S.; Li, H. M3B2-type borides effect on the wide gap brazing of K417G alloy with mixed powder. J. Alloys Compd. 2020, 821, 153431. [Google Scholar] [CrossRef] [Scilit]
- Song, J.; Liang, M.; Lin, Y.; Wu, L.; Guo, J.; Liang, W.; Zhang, Y. Impact softening performance of low melting point alloy/copper foam composite phase change materials. Mater. Des. 2025, 256, 114360. [Google Scholar] [CrossRef] [Scilit]
- Lang, Z.; Zou, T.; Ye, Z.; Wu, T.; Wang, W.; Yang, J.; Huang, J. High-performance brazing of single crystal superalloys with Ni-Cr-Ta filler material. Mater. Des. 2024, 237, 112576. [Google Scholar]
- Cai, J.; Shi, J.; Wang, K.; Li, F.; Wang, W.; Wang, Q.; Liu, Y. A modified parallel constitutive model for elevated temperature flow behavior of Ti-6Al-4V alloy based on multiple regression. Int. J. Mater. Res. 2017, 108, 527–541. [Google Scholar] [CrossRef] [Scilit]
- Dong, W.; Paudel, B.J.; Deng, H.; Garner, S.; To, A.C. Data-driven distortion compensation for laser powder bed fusion process using Gaussian process regression and inherent strain method. Mater. Des. 2024, 243, 113063. [Google Scholar] [CrossRef] [Scilit]
- Kazi, M.K.; Eljack, F.; Mahdi, E. Predictive ANN models for varying filler content for cotton fiber/PVC composites based on experimental load displacement curves. Compos. Struct. 2020, 254, 112885. [Google Scholar] [CrossRef] [Scilit]
- Gao, M.; Meng, J.; Ma, N.; Li, M.; Liu, L. Artificial neural network–based constitutive relation modelling for the laminated fabric used in stratospheric airship. Compos. Adv. Mater. 2022, 31, 26349833211073146. [Google Scholar] [CrossRef] [Scilit]
- Zhao, X.; Huang, H.; Su, Y.; Qiao, L.; Yan, Y. Data-driven electrochemical behavior prediction for refractory high-entropy alloys by global and focused learning. Mater. Des. 2025, 255, 114202. [Google Scholar] [CrossRef] [Scilit]
- Peloquin, J.; Kirillova, A.; Rudin, C.; Brinson, L.; Gall, K. Prediction of tensile performance for 3D printed photopolymer gyroid lattices using structural porosity, base material properties, and machine learning. Mater. Des. 2023, 232, 112126. [Google Scholar] [CrossRef] [Scilit]
- Ozerdem, M.S.; Kolukisa, S. Artificial neural network approach to predict the mechanical properties of Cu–Sn–Pb–Zn–Ni cast alloys. Mater. Des. 2009, 30, 764–769. [Google Scholar] [CrossRef] [Scilit]
- Varol, T.; Canakci, A.; Ozsahin, S. Artificial neural network modeling to effect of reinforcement properties on the physical and mechanical properties of Al2024–B4C composites produced by powder metallurgy. Compos. Part B Eng. 2013, 54, 224–233. [Google Scholar] [CrossRef] [Scilit]
- Kuriki, D.; Briffod, F.; Shiraiwa, T.; Enoki, M. Multimodal deep learning framework to predict strain localization of Mg/LPSO two-phase alloys. Acta Mater. 2024, 281, 120398. [Google Scholar] [CrossRef] [Scilit]
- Arik, S.Ö.; Pfister, T. Tabnet: Attentive interpretable tabular learning. Proc. AAAI Conf. Artif. Intell. 2021, 35, 6679–6687. [Google Scholar] [CrossRef] [Scilit]
- He, K.; Zhang, X.; Ren, S.; Sun, J. Deep residual learning for image recognition. In Proceedings of the 2016 IEEE Conference on Computer Vision and Pattern Recognition (CVPR), Las Vegas, NV, USA, 27–30 June 2016; pp. 770–778. [Google Scholar]
- Triana-Martinez, J.; Álvarez-Meza, A.; Castellanos-Dominguez, G. Enhancing Agricultural Data Interpretability and Visualization with TabNet-Driven Feature Extraction and Local Biplots. Results Eng. 2025, 27, 106672. [Google Scholar] [CrossRef] [Scilit]
- Tajima, H.; Miyazawa, Y.; Furihata, K.; Masuda, H. In-situ observation of molten brazing filler metal permeating gap. Weld. Int. 2024, 38, 441–449. [Google Scholar] [CrossRef] [Scilit]
- Parks, C.M.; Kuipers, J.; Phillion, A.B. Uncovering the mechanism behind a two-step infiltration during layered wide-gap brazing of a Ni-base superalloy using a B-Containing filler metal. Materialia 2025, 40, 102404. [Google Scholar] [CrossRef] [Scilit]
- Cheng, Z.; Lai, X.; He, J.; Li, X.; Fan, J.; Lai, F. Microstructural Investigation and High-Temperature Oxidation Performance of K417G Alloy Prepared by Wide-Gap Brazing. Crystals 2025, 15, 434. [Google Scholar] [CrossRef] [Scilit]
- Yan, D.; Sun, J.; Huang, J. News Recommendation with Gated Linear Attention and Simplified Gated Linear Units. Informatica 2024, 48. [Google Scholar] [CrossRef] [Scilit]
- Chen, Y.; Wang, J.; Zhang, J.; Qin, Z.; Liu, X. Supervised Convolutional Encoder-Decoder with Gated Linear Units for Detecting Fetal R-Peaks. IEEE Access 2025, 13, 4290–4303. [Google Scholar] [CrossRef] [Scilit]
- Liu, C.; Zhen, J.; Shan, W. Time series classification based on convolutional network with a gated linear units kernel. Eng. Appl. Artif. Intell. 2023, 123, 106296. [Google Scholar] [CrossRef] [Scilit]
- Li, T.; Yoshikawa, K.; Endoh, T. Hardware-Efficient Activation Circuit for Edge Computing: Shifter-Polynomial Approximation of Leaky ReLU. IEEE Trans. Circuits Syst. Artif. Intell. 2025, 2, 3–13. [Google Scholar]
- Zhang, J.; Yu, J.; Zhang, Z.; Zheng, C.; Le, Y.; Li, Y. MASK_LOSS guided non-end-to-end image denoising network based on multi-attention module with bias rectified linear unit and absolute pooling unit. Comput. Vis. Image Underst. 2025, 252, 104302. [Google Scholar]
- Vaswani, A.; Shazeer, N.; Parmar, N.; Uszkoreit, J.; Jones, L.; Gomez, A.N. Attention Is All You Need. In Proceedings of the 31st Conference on Neural Information Processing Systems (NIPS 2017), Long Beach, CA, USA, 4–9 December 2017; pp. 5998–6008. [Google Scholar]
- Rather, I.H.; Kumar, S.; Gandomi, A.H. Breaking the data barrier: A review of deep learning techniques for democratizing AI with small datasets. Artif. Intell. Rev. 2024, 57, 226. [Google Scholar] [CrossRef] [Scilit]
- Hayot, V.; Amhaz, R.; Lecler, S.; Ferreira, A.A.; Chabrol, G. Machine learning for prediction of laser welds penetration on a multi-material dataset. Int. J. Adv. Manuf. Technol. 2025, 140, 2895–2907. [Google Scholar] [CrossRef] [Scilit]

Disclaimer/Publisher’s Note: The statements, opinions and data contained in all publications are solely those of the individual author(s) and contributor(s) and not of MDPI and/or the editor(s). MDPI and/or the editor(s) disclaim responsibility for any injury to people or property resulting from any ideas, methods, instructions or products referred to in the content. |
© 2026 by the authors. Licensee MDPI, Basel, Switzerland. This article is an open access article distributed under the terms and conditions of the Creative Commons Attribution (CC BY) license.