


Abstract
This study compares high-grade non-oriented electrical steels without rare-earth addition and with a La-Ce combined rare-earth treatment. Optical microscopy, X-ray diffraction (XRD), and electron backscatter diffraction (EBSD) were used to characterize the hot-rolled microstructure, through-thickness texture, and local orientation heterogeneity. The investigated La-Ce specimen exhibited a smaller average as-cast grain size (1.2 mm versus 2.0 mm) and a smaller hot-rolled surface grain size (39.08 μm versus 57.39 μm), together with a smoother microstructural transition from fine surface grains to elongated center-layer deformation grains. XRD revealed pronounced through-thickness texture gradients in both specimens. After a non-negativity-constrained post-reconstruction correction of the exported harmonic ODFs, the maximum α-fiber orientation density was 2.830 and 2.573 at the surface, 4.223 and 4.521 at 1/4 thickness, and 36.995 and 16.636 at the center for the rare-earth-free and La-Ce specimens, respectively. The center-layer difference corresponds to an approximately 55.0% lower α-fiber maximum in the investigated La-Ce specimen. For the γ-fiber, peak and mean f(g) values increased modestly at the surface and more strongly at 1/4 thickness, whereas the sampled ideal center-layer γ-fiber in the La-Ce specimen reached the lower bound of the constrained ODF representation. EBSD-IPF, GOS, and KAM maps further revealed reduced long-range orientation continuity and finer spatial segmentation of deformation-related orientation heterogeneity in the La-Ce specimen. Overall, the results show that trace La-Ce treatment is associated with microstructural refinement and a pronounced redistribution of the hot-band deformation texture, particularly in the sheet center.
1. Introduction
Non-oriented electrical steel (NOES) is a key soft-magnetic material for electrical equipment such as motors, generators, and traction motors for new-energy vehicles. Its service performance is closely related to grain size, microstructural homogeneity, and crystallographic texture [1,2,3,4,5,6,7,8]. Hot rolling is a critical link between the as-cast structure and subsequent normalizing, cold rolling, and annealing, and the grain morphology and orientation distribution of the hot-rolled sheet exert a pronounced microstructural inheritance effect on the recrystallization texture and magnetic properties of downstream products [3,9,10,11,12,13,14,15]. Because roll friction, temperature gradients, and deformation states vary from surface shear to near-plane-strain compression at the center, hot-rolled sheets commonly develop pronounced through-thickness microstructure-texture gradients [11,12,16]. Clarifying the evolution of microstructure and orientation at different thickness positions is therefore important for optimizing the magnetic performance of high-grade NOES.
Rare-earth elements such as La and Ce are highly chemically active and can alter the type, size, morphology, and interfacial state of inclusions, thereby affecting solidification nucleation, grain-boundary behavior, deformation stored energy, recovery, and recrystallization [17,18,19,20,21,22,23,24,25]. Previous studies have shown that combined La-Ce treatment can modify inclusions and refine the solidification structure of NOES. Our previous work further found that, within a Ce content range of 10–30 ppm, the type, number, and size distribution of rare-earth compound inclusions such as CeAlO3-Ce2O2S vary with Ce content [20], and that Ce can also influence the evolution of both macrotexture and microtexture in NOES [21,26]. However, existing studies have focused mainly on inclusion modification, solidification structure, magnetic properties, or subsequent recrystallization texture. The relationship among the surface-transition-center microstructural gradient, fiber-texture redistribution, and local deformation heterogeneity in hot-rolled sheets under combined La-Ce treatment remains to be clarified.
Accordingly, this study compares two high-grade NOES hot bands, one without rare-earth addition and one treated with La-Ce, with a total La+Ce content of approximately 32 ppm. The study focuses on the relationship between trace La-Ce treatment, microstructural refinement, and redistribution of the pronounced through-thickness texture gradient. Optical microscopy, XRD, and EBSD were used to characterize the hot-rolled microstructure. The macrotexture and α/γ-fiber orientation densities were systematically analyzed at the surface, 1/4 thickness (subsurface), and center layer. At the microscopic scale, IPF, grain orientation spread (GOS), and kernel average misorientation (KAM) maps were jointly used to distinguish long-range orientation continuity, grain-scale intragranular orientation spread, and short-range local misorientation heterogeneity. These complementary observations provide a basis for correlating the through-thickness deformation structure with the measured fiber-texture response.
2. Materials and Methods
The investigated materials were two hot-rolled high-grade NOES sheets, one rare-earth-free and one subjected to combined La-Ce treatment. Their chemical compositions are listed in Table 1. In the La-Ce sample, the mass fractions of La and Ce were 0.0013% and 0.0019%, respectively, corresponding to a total rare-earth content of approximately 0.0032% (32 ppm).
Table 1.
Chemical compositions of the experimental steels (wt%).
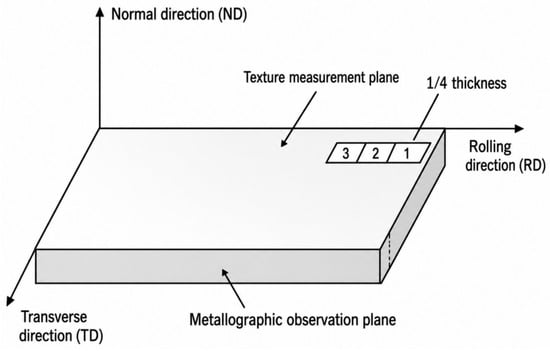
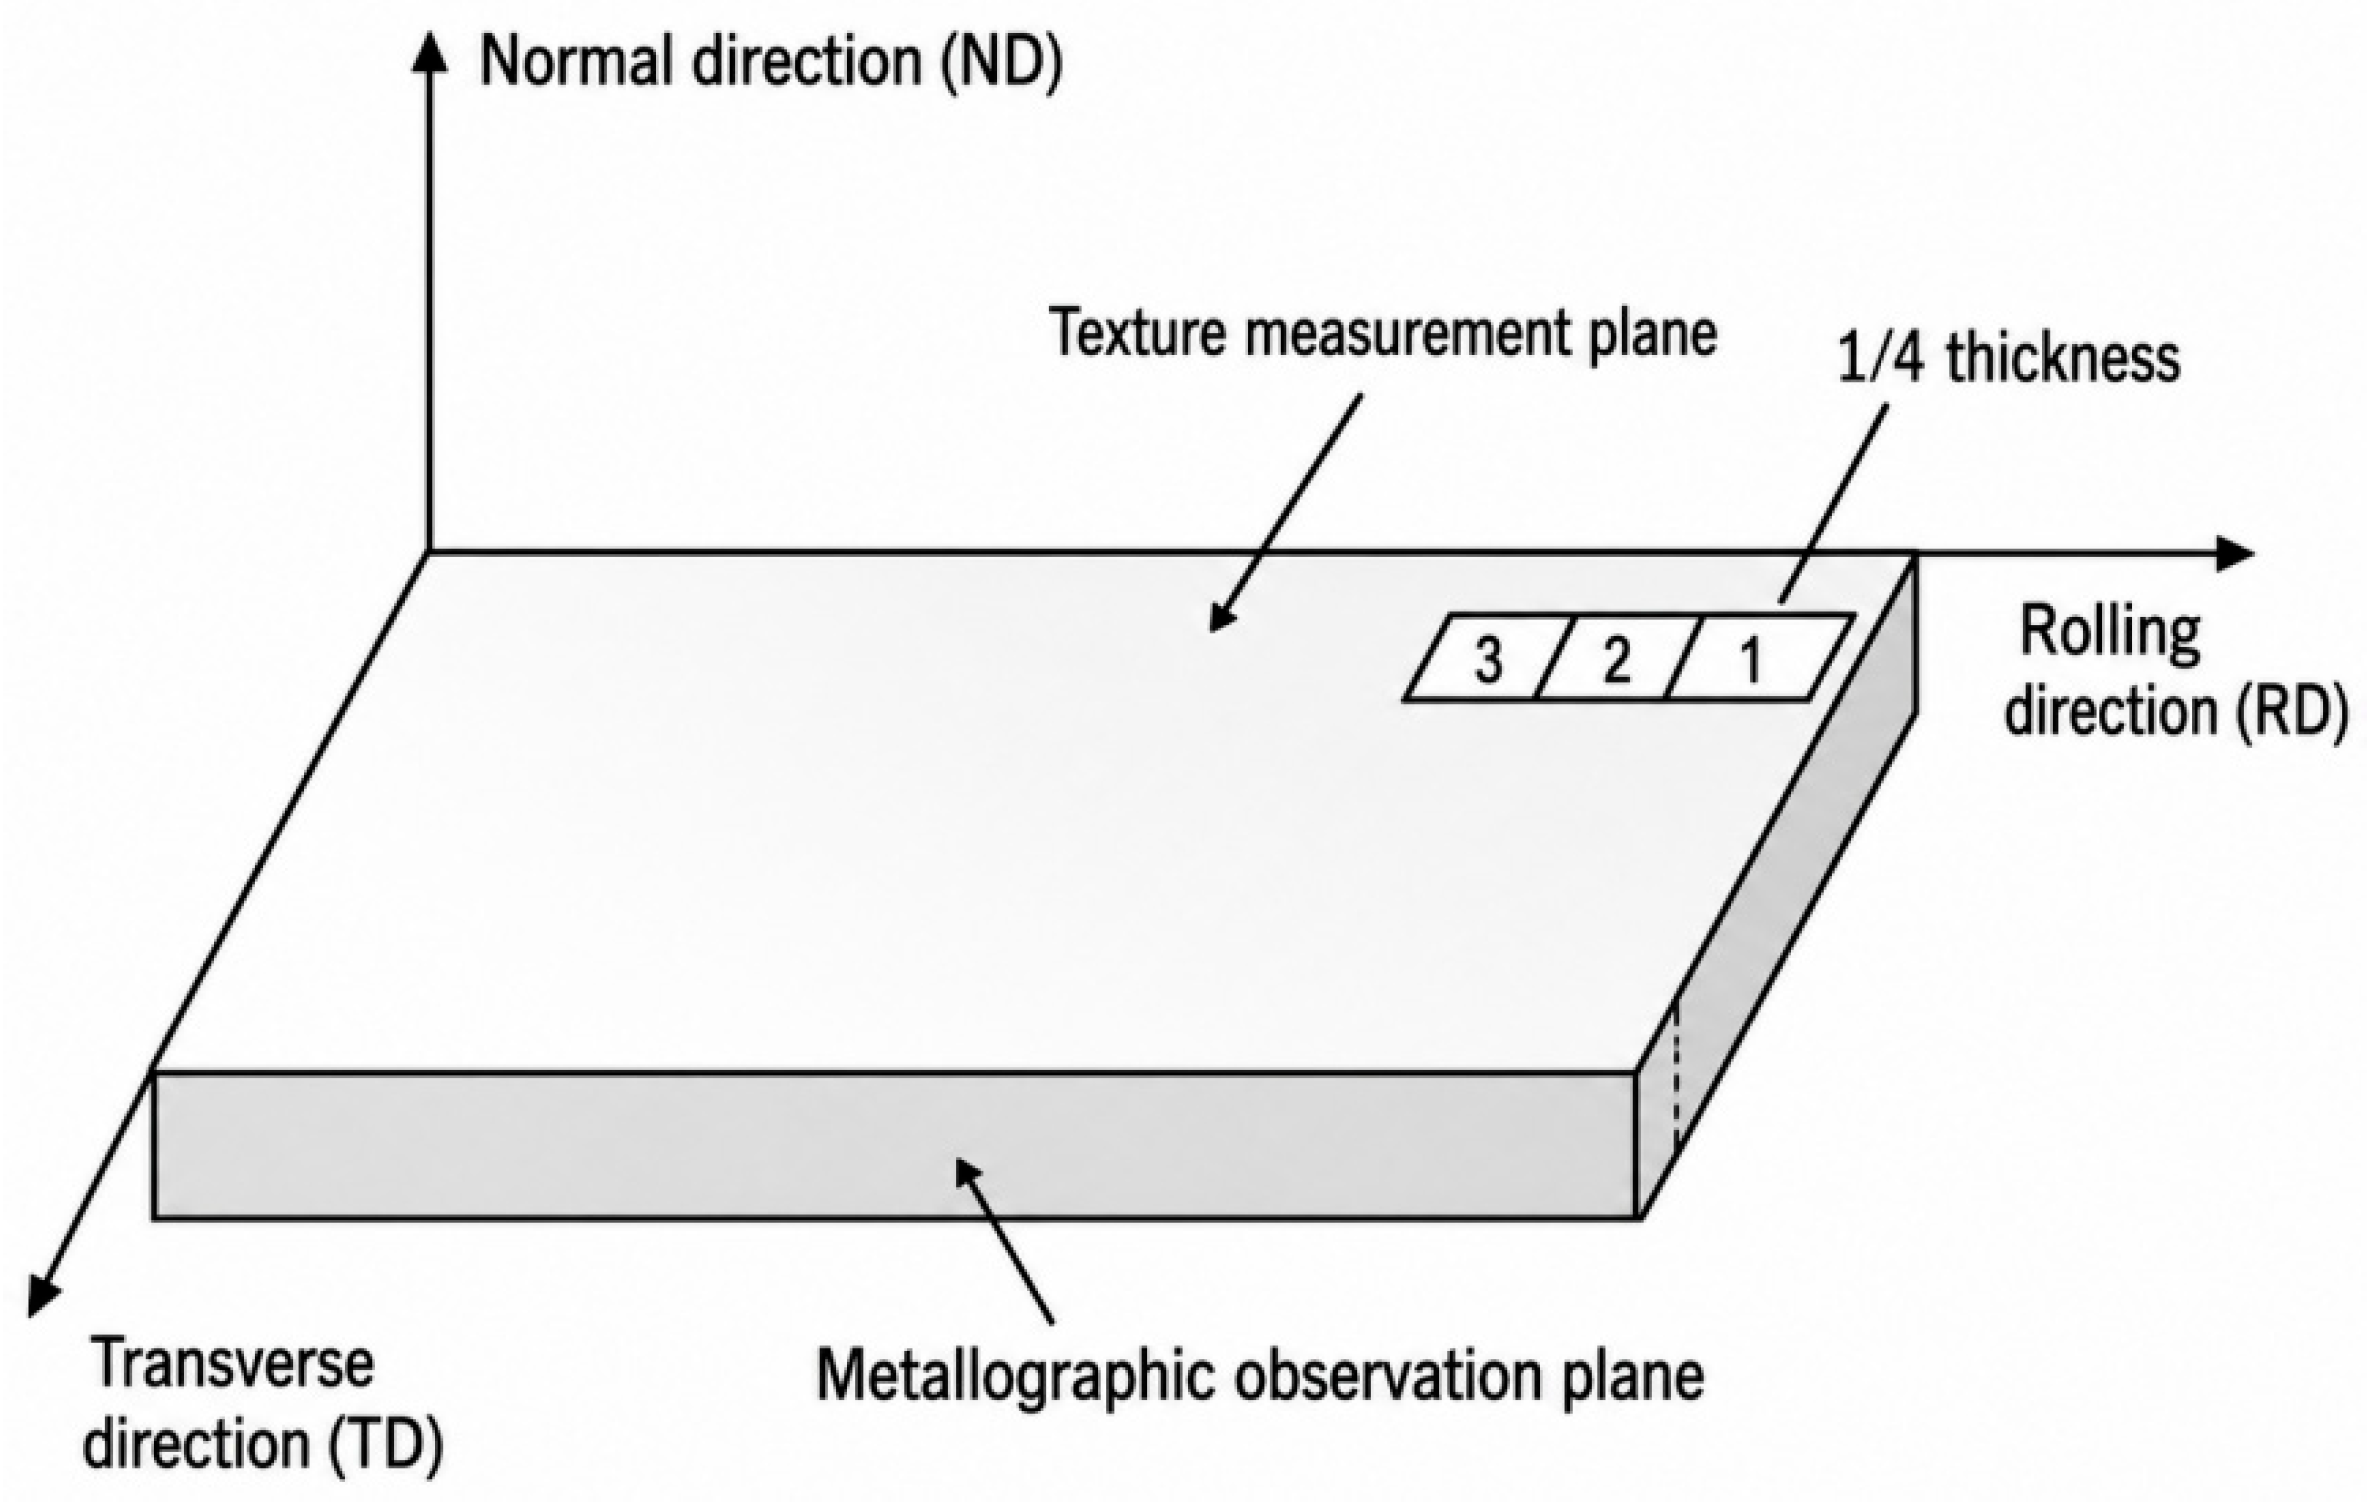
Both steels were subjected to the same thermal history and hot-rolling schedule, with an initial rolling temperature of 1150 °C and a finishing temperature of 780–850 °C. After cutting, the hot-rolled sheet dimensions were approximately 620 mm × 168 mm × 3 mm. The sampling and measurement locations are shown in Figure 1. Macrotexture was measured on RD–TD planes at the surface (after removing approximately 10% of the sheet thickness before measurement), at 1/4 thickness (subsurface), and at 1/2 thickness (center layer).
Figure 1.
Schematic of the sampling and characterization locations in the hot-rolled sheet.
Hot-rolled sheets with a thickness of 3 mm were used for microstructural and texture characterization. Metallographic specimens were ground sequentially using 240- to 2000-grit abrasive papers, mechanically polished, etched in 4% nital for approximately 50 s, immediately rinsed with water and ethanol, dried, and observed using a Zeiss optical microscope (Oberkochen, Germany). Macrotexture was measured using a D8 ADVANCE X-ray diffractometer (Bruker, Billerica, MA, USA) equipped with a Co target, operated at 35 kV and 40 mA, with a 0.18 mm aperture. The prepared RD–TD surface at each thickness position was used as the measurement region. Three incomplete pole figures, {110}, {200}, and {211}, were measured at 2θ = 52.4°, 77.2°, and 99.7°, respectively, with a maximum tilt angle χ = 75°. The ODF was calculated by the harmonic method with an expansion rank of 22 and orthorhombic sample symmetry. To eliminate non-physical negative orientation-density values associated with harmonic truncation, the exported ODFs were subjected to a minimum-change non-negativity-constrained post-reconstruction correction while preserving ODF normalization. On the φ2 = 45° section, f(g) along the α- and γ-fibers was evaluated at 5° intervals, and peak values, peak positions, and mean γ-fiber f(g) were determined.
Microtexture was characterized by EBSD in a scanning electron microscope operated at 20 kV with a step size of 2 μm. The mapped region extended from the transition region toward the sheet center, with an approximately 1.5 mm extent along the normal direction. The indexing rates were approximately 96% and 98% for the rare-earth-free and La-Ce specimens, respectively, and 193 and 224 reconstructed grains were analyzed after data cleaning. IPF maps were used to evaluate grain morphology and crystallographic-orientation continuity. GOS maps characterize grain-scale intragranular orientation spread, whereas KAM maps reveal neighborhood-scale local lattice-misorientation heterogeneity. The three map types were therefore evaluated together to compare the spatial organization of deformation-related orientation heterogeneity.
3. Results and Discussion
3.1. As-Cast Microstructure
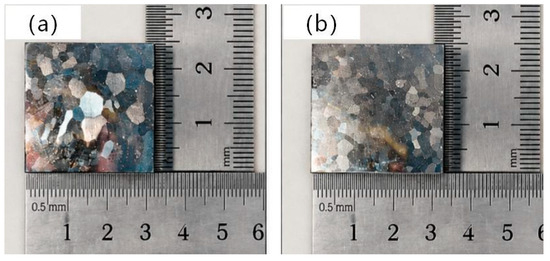
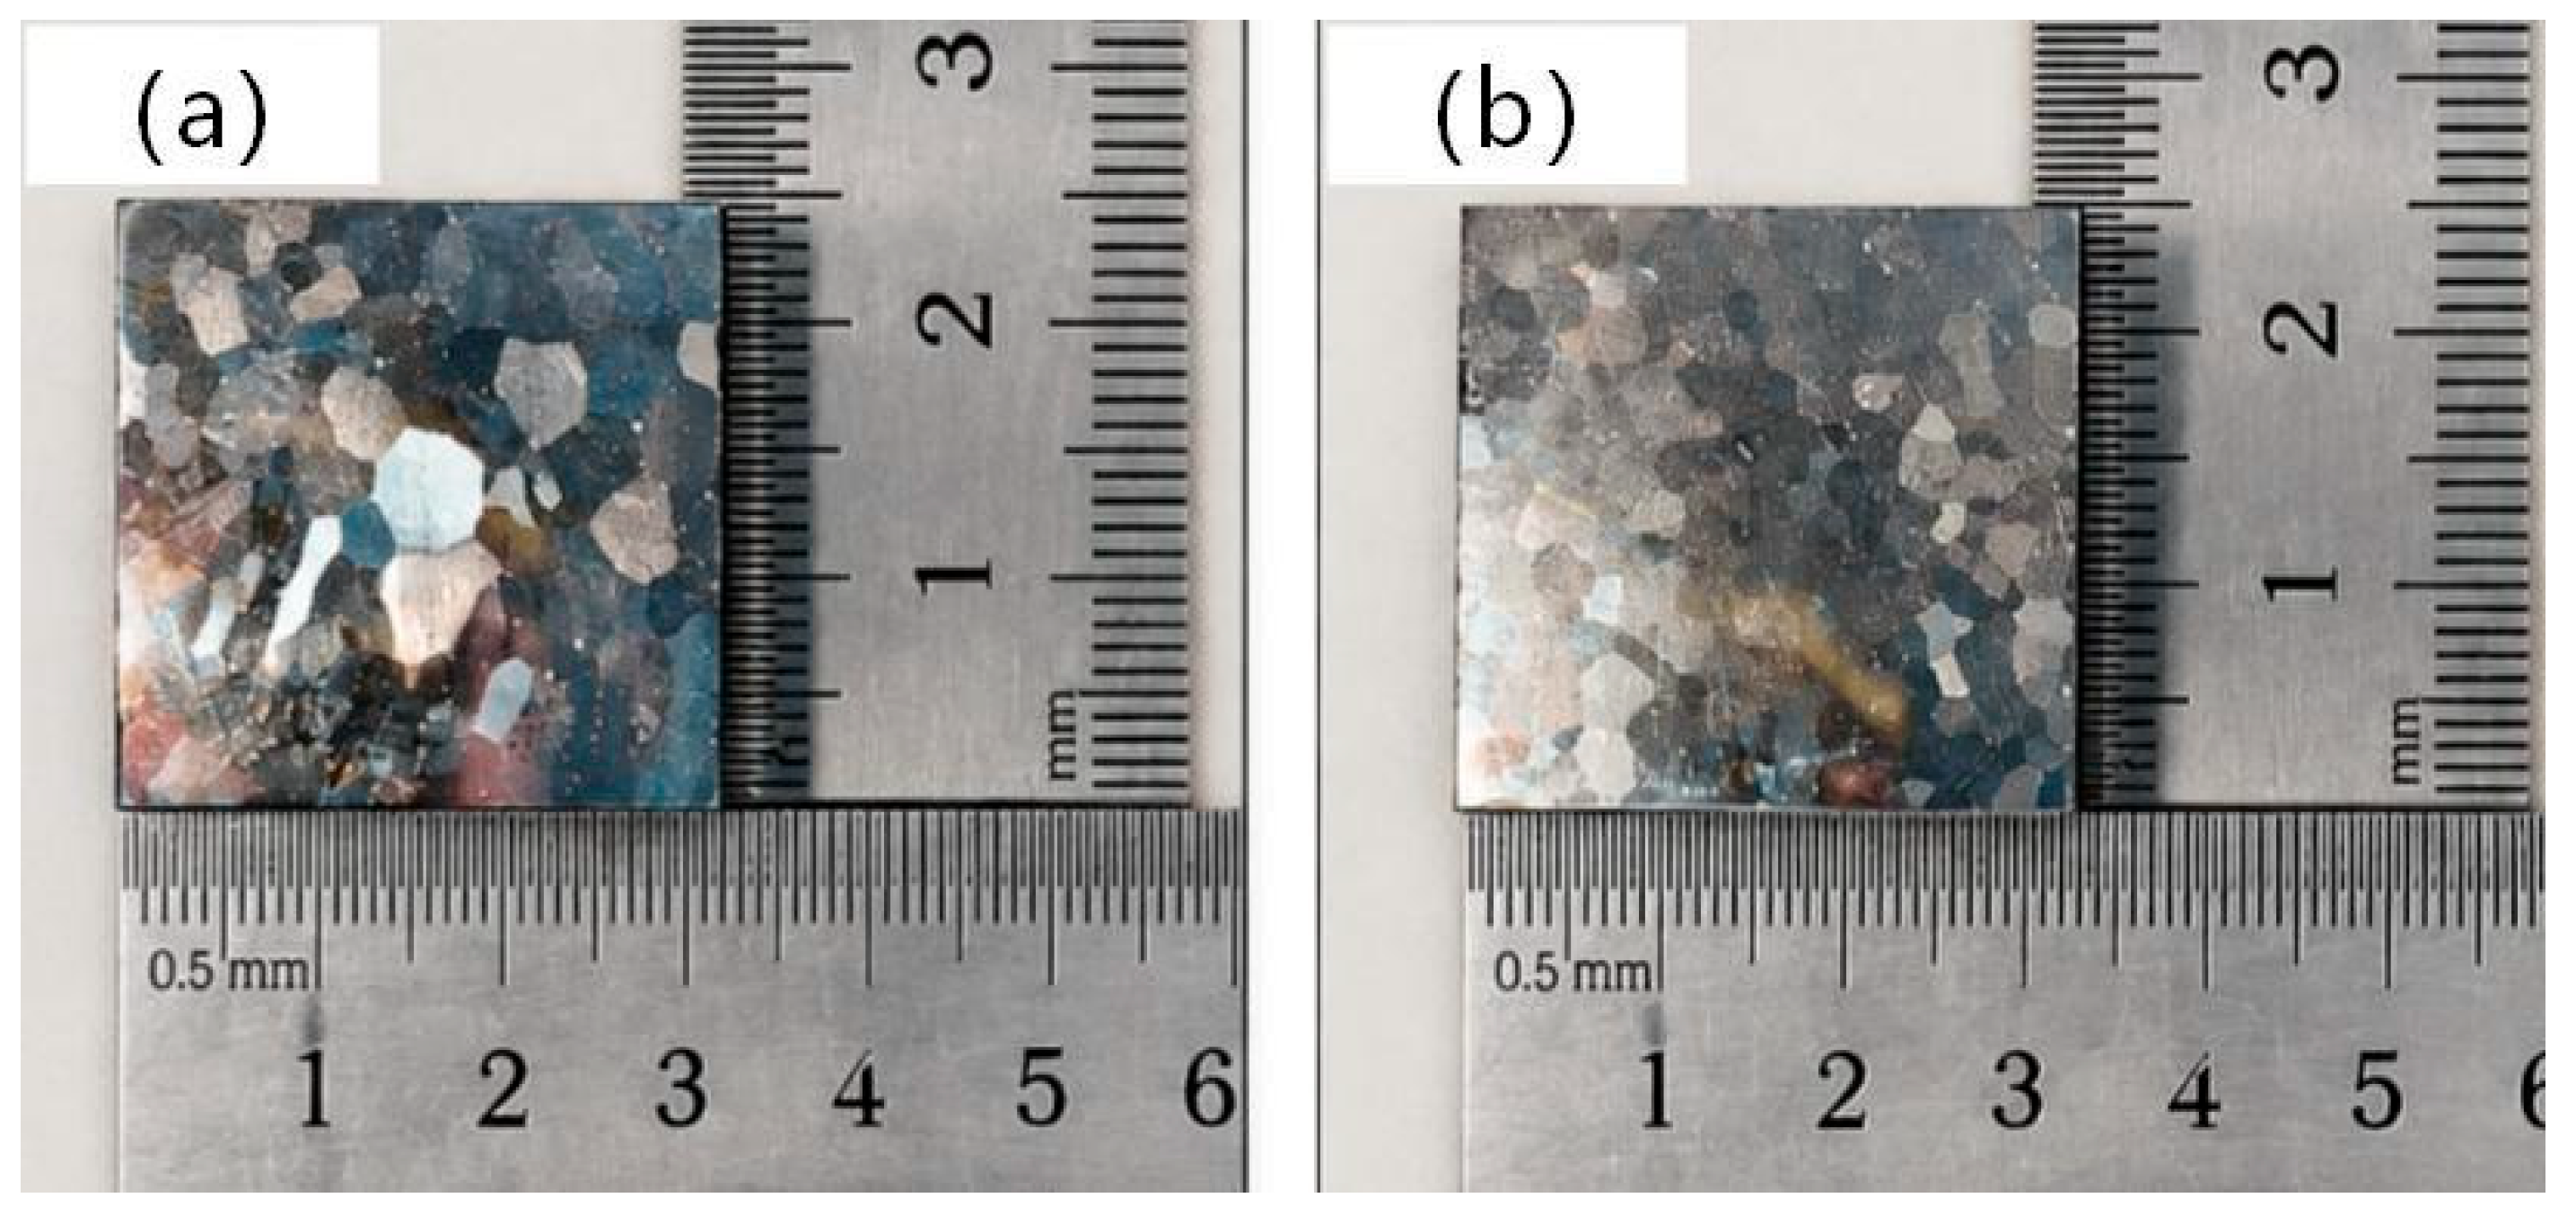
Figure 2 presents the as-cast macrostructures of the two samples. By the line-intercept method, the average grain size was approximately 2.0 mm for the rare-earth-free sample and 1.2 mm for the La-Ce sample, representing a reduction of approximately 40.0%.
Figure 2.
As-cast macrostructures of the rare-earth-free and La-Ce samples: (a) rare-earth-free; (b) La-Ce.
After combined La-Ce treatment, the as-cast grains were clearly refined, indicating that the rare-earth addition modified the conditions for effective nucleation and grain growth during solidification. Industrial tests on 3.2%Si-0.9%Al NOES showed that the equiaxed grain size of the slab decreased with increasing La-Ce content. Particle pinning by rare-earth inclusions was not considered the dominant refinement mechanism; instead, heterogeneous nucleation associated with favorable interfacial matching between (La,Ce)2O2S and δ-Fe was identified as the principal mechanism for equiaxed-grain refinement [19]. Because La and Ce have strong affinities for O and S, high-melting rare-earth oxysulfides can preferentially form and act as potential nucleation substrates before or during solidification, thereby increasing the number of effective nuclei and shortening the free-growth distance of individual grains [20].
3.2. Hot-Rolled Microstructure
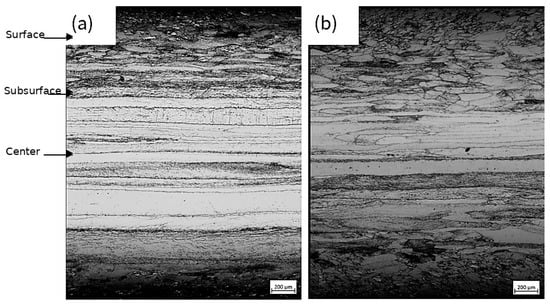
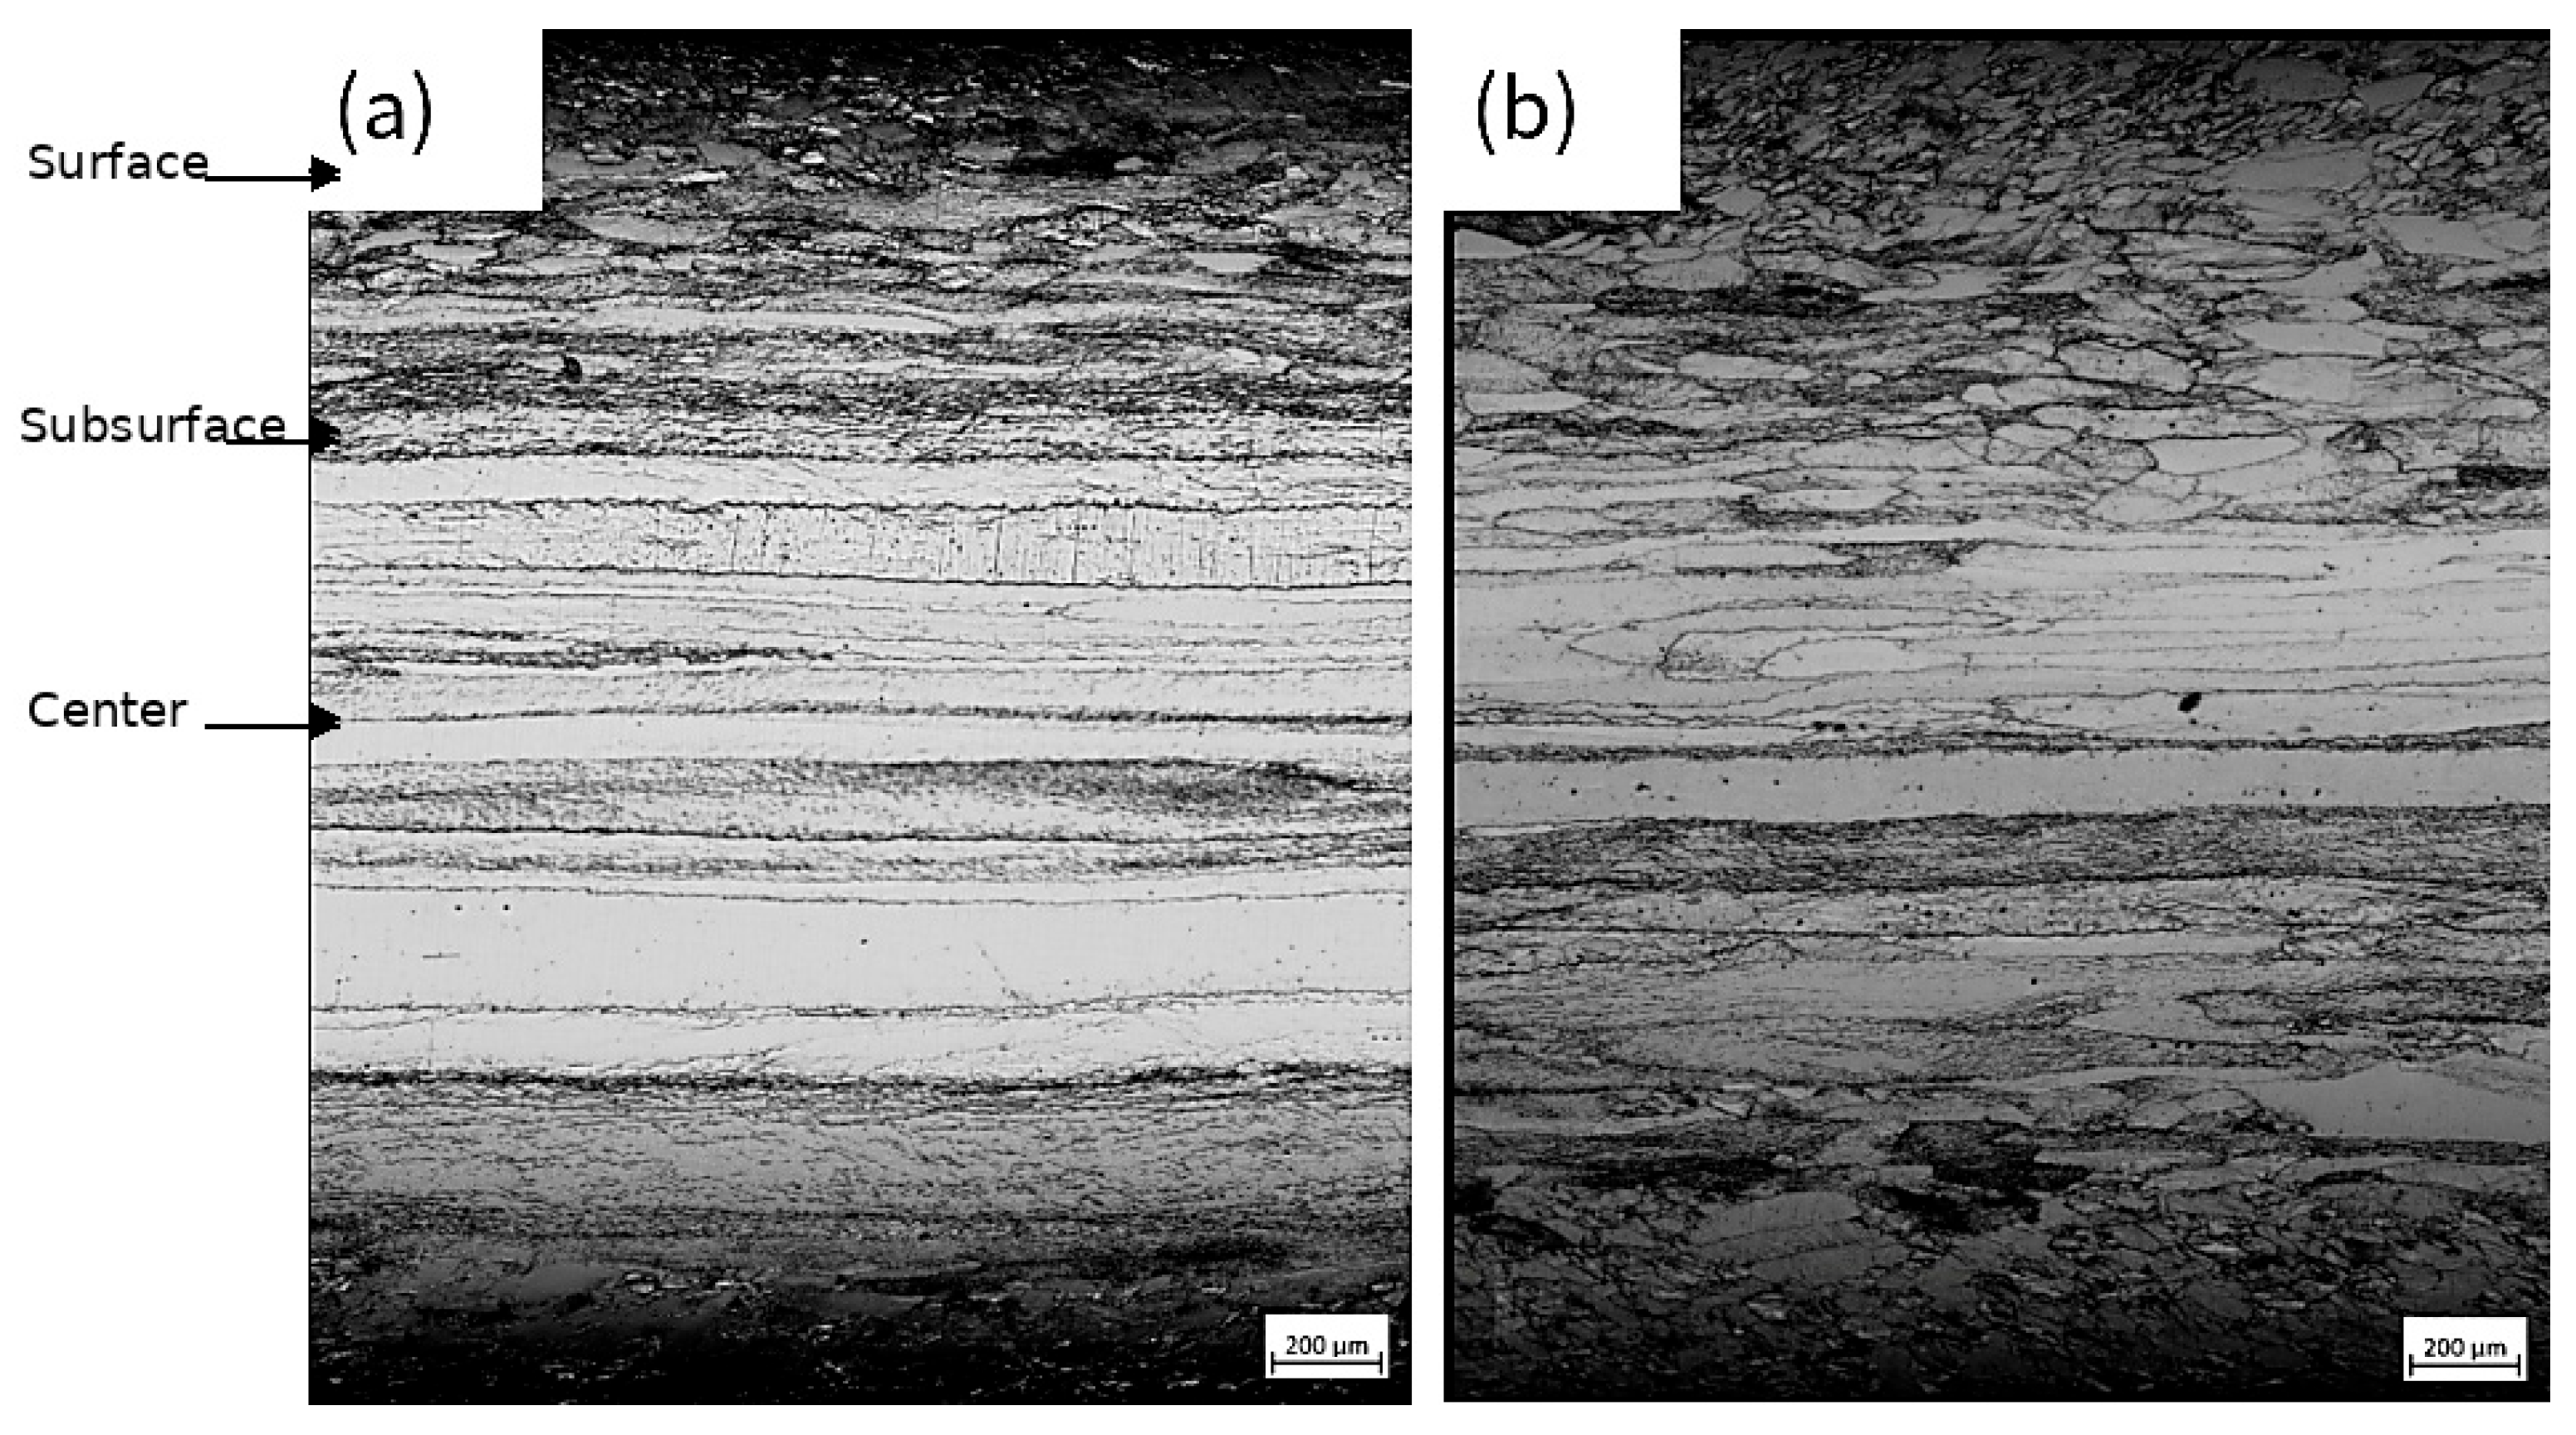
Figure 3 shows optical microstructures on the RD-ND cross-sections of the hot-rolled sheets. Both samples exhibited a pronounced through-thickness microstructural gradient: the surface consisted mainly of relatively fine equiaxed grains; toward the interior, a mixed structure of fine equiaxed grains and elongated deformation grains developed; and the center region was dominated by fibrous deformation grains elongated along the rolling direction. This through-thickness variation reflects differences in temperature, strain, and shear state experienced at different positions during hot rolling.
Figure 3.
Hot-rolled microstructures of the rare-earth-free and La-Ce samples; arrows indicate the surface, subsurface, and center layers: (a) rare-earth-free; (b) La-Ce.
Comparison of samples in Figure 3 shows that the rare-earth-free sample exhibited a relatively abrupt transition from the surface to the center: the surface zone of fine equiaxed grains was comparatively narrow, whereas coarse fibrous deformation grains elongated along RD formed a continuous distribution in the center region. In the La-Ce sample, the fine equiaxed-grain region near the surface was broader, the transition from surface to center was smoother, and the amount of continuously distributed coarse fibrous deformation grains in the center was reduced. These observations indicate that combined La-Ce treatment mitigates through-thickness microstructural heterogeneity in the hot-rolled sheet.
At the same magnification, approximately 107 surface grains were counted in the rare-earth-free sample, with an average grain size of 57.39 μm, compared with approximately 184 grains and an average size of 39.08 μm in the La-Ce sample. Thus, the surface grain size decreased by approximately 31.9% after La-Ce treatment. The total La-Ce content in the present study was approximately 32 ppm, comparable to the 30 ppm Ce level used in our previous work [20], in which Ce within this range clearly altered inclusion composition and grain size. The present results likewise demonstrate that combined La-Ce treatment significantly influences hot-rolled microstructural evolution.
3.3. Macroscopic Texture Analysis
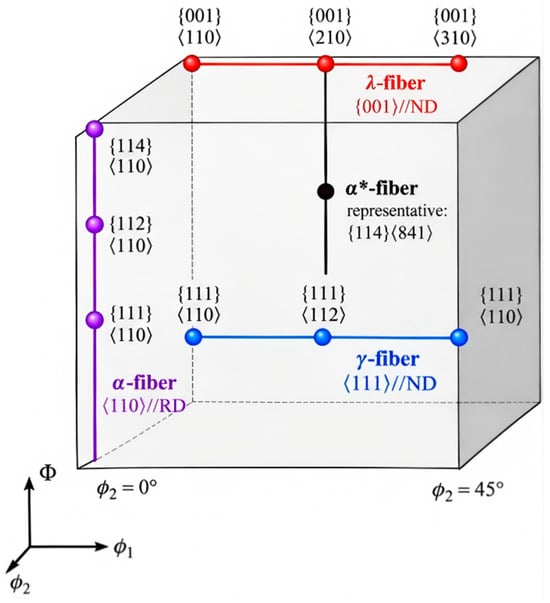
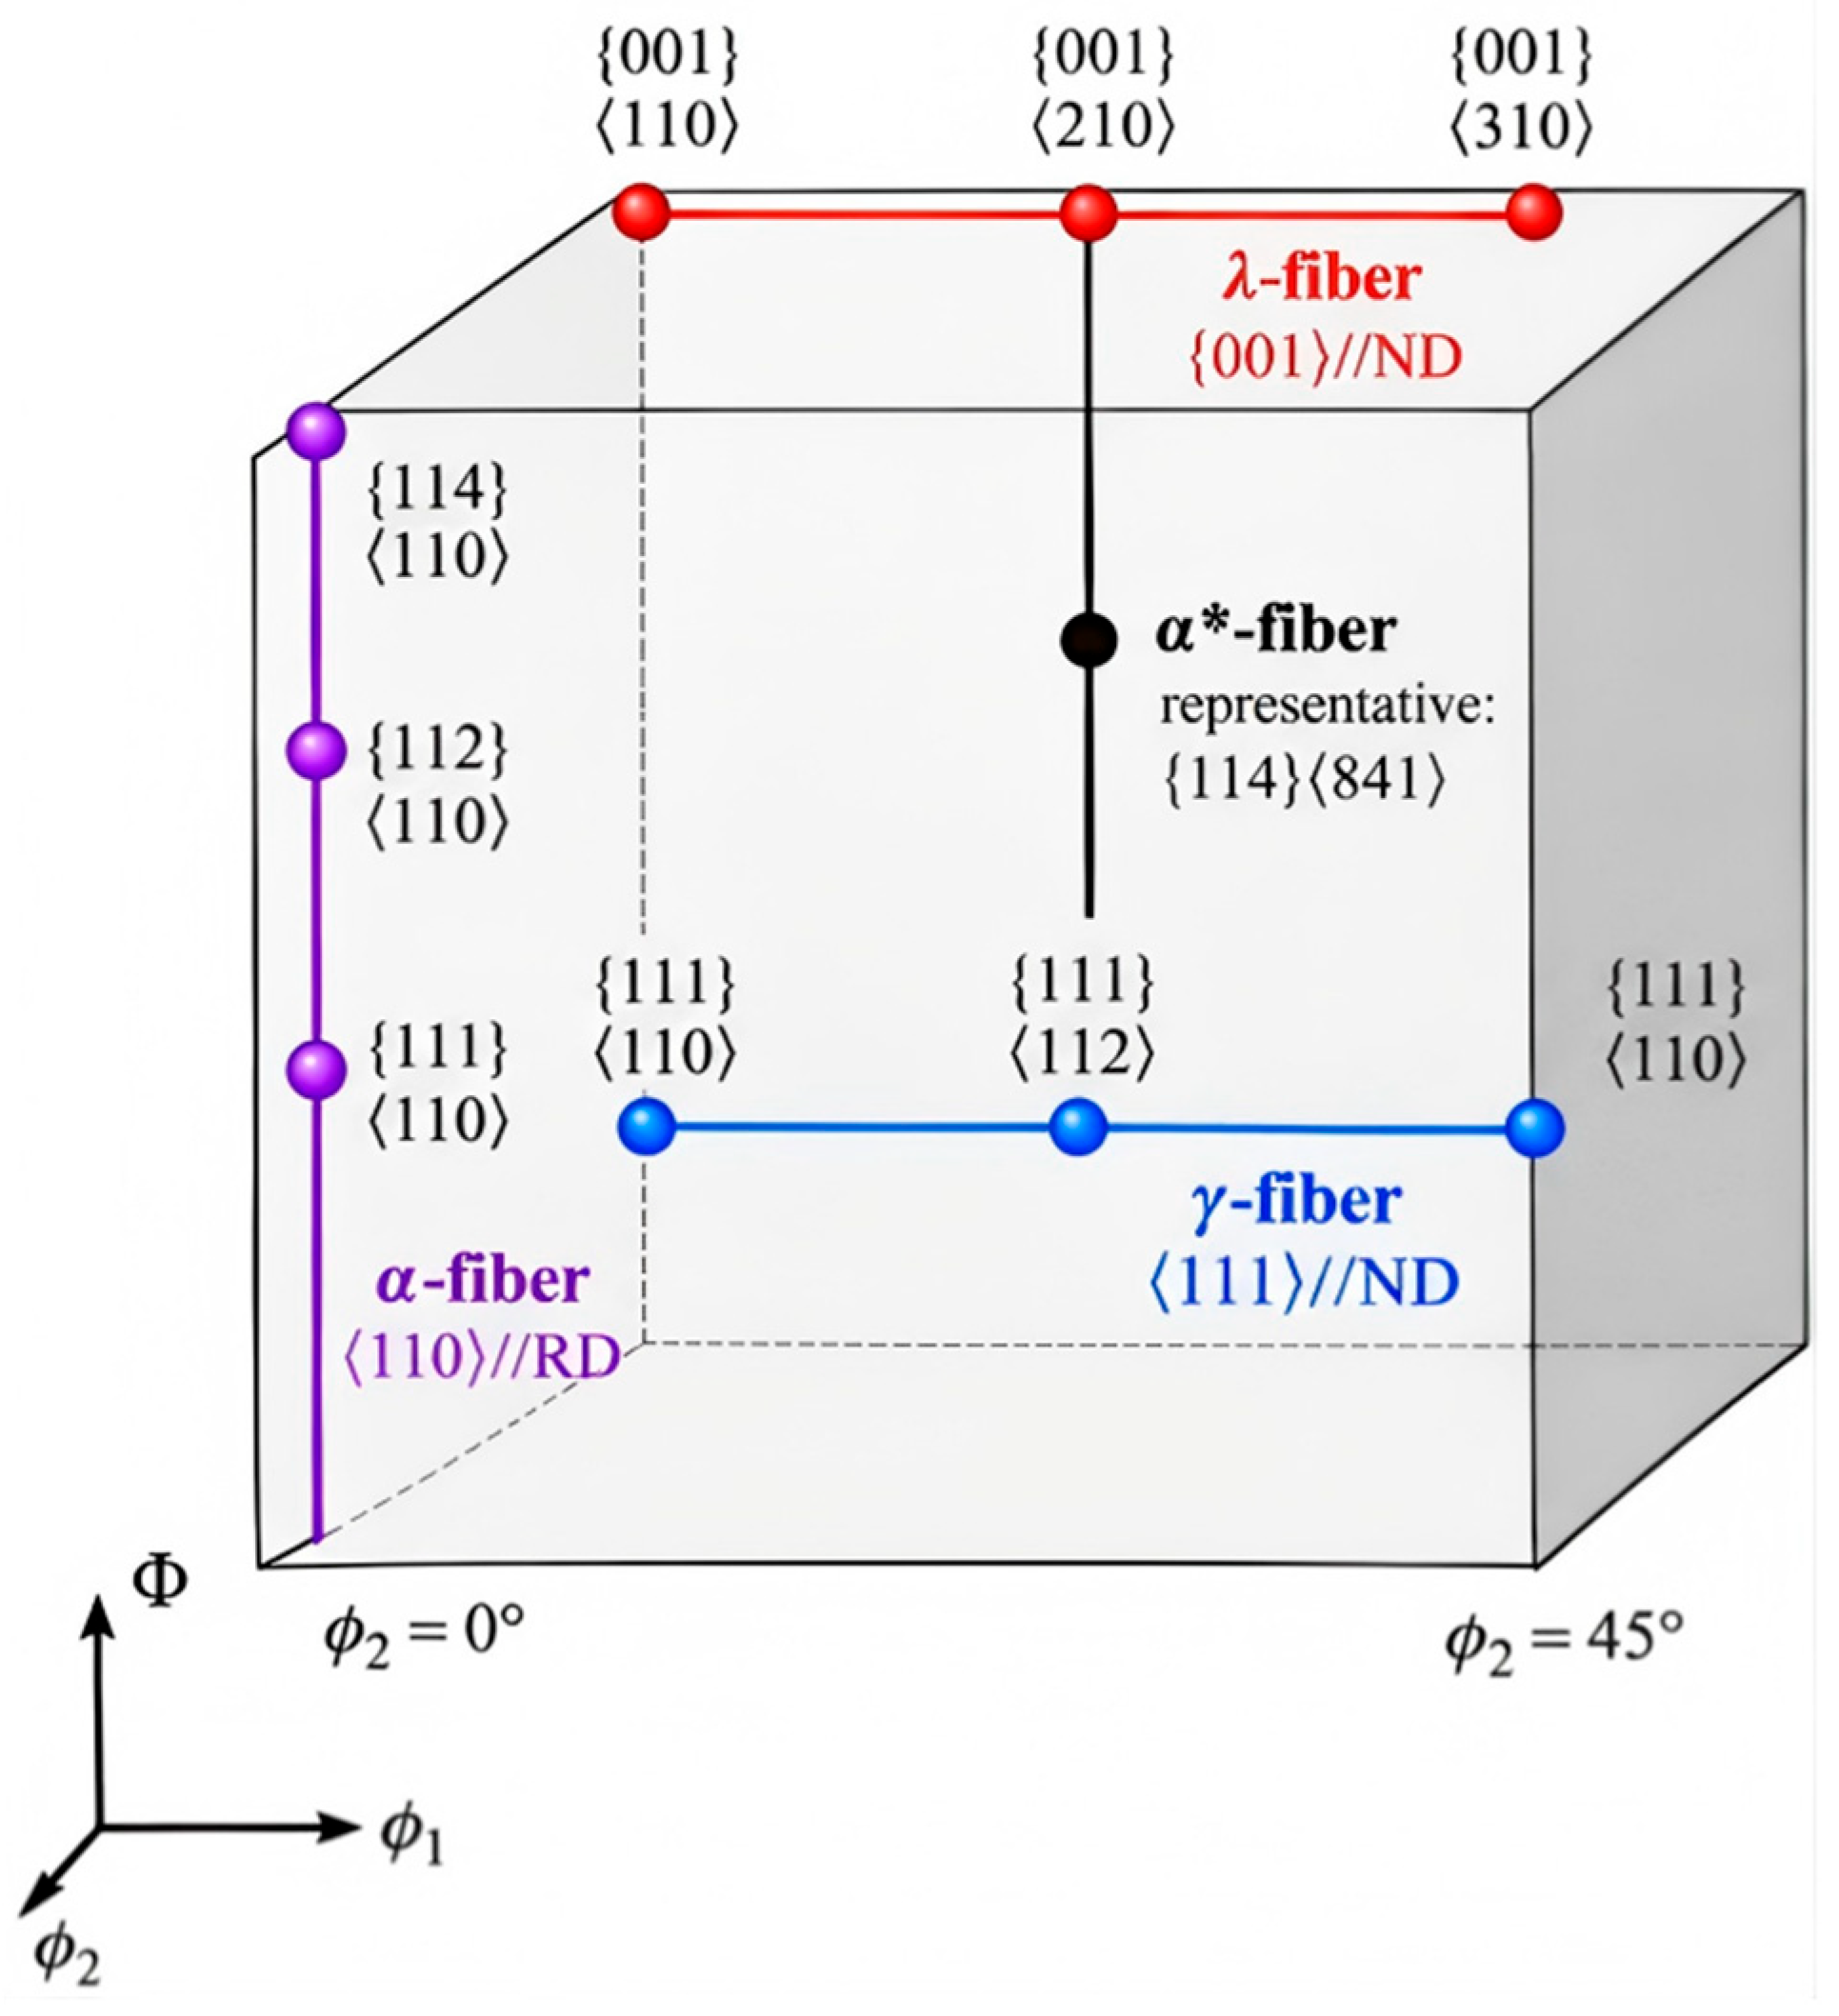
The orientation distribution function (ODF) describes crystallographic orientation density and major texture components. Figure 4 illustrates the typical orientations and fiber textures on the φ2 = 45° section for NOES. The γ-fiber is characterized by {111}//ND and mainly includes {111}<112> and {111}<110>, whereas the α-fiber is characterized by <110>//RD; on this section, typical orientations such as {001}<110>, {112}<110>, {111}<110>, and {110}<110> can be examined along Φ. The ODFs at the surface, subsurface, and center were compared, and the orientation densities along the α- and γ-fibers were quantified.
Figure 4.
Typical orientations and fiber textures on the φ2 = 45° ODF section of non-oriented electrical steel.
3.3.1. Surface Texture
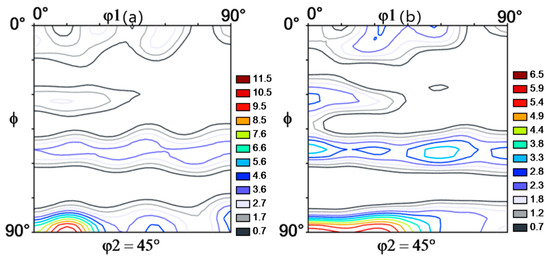
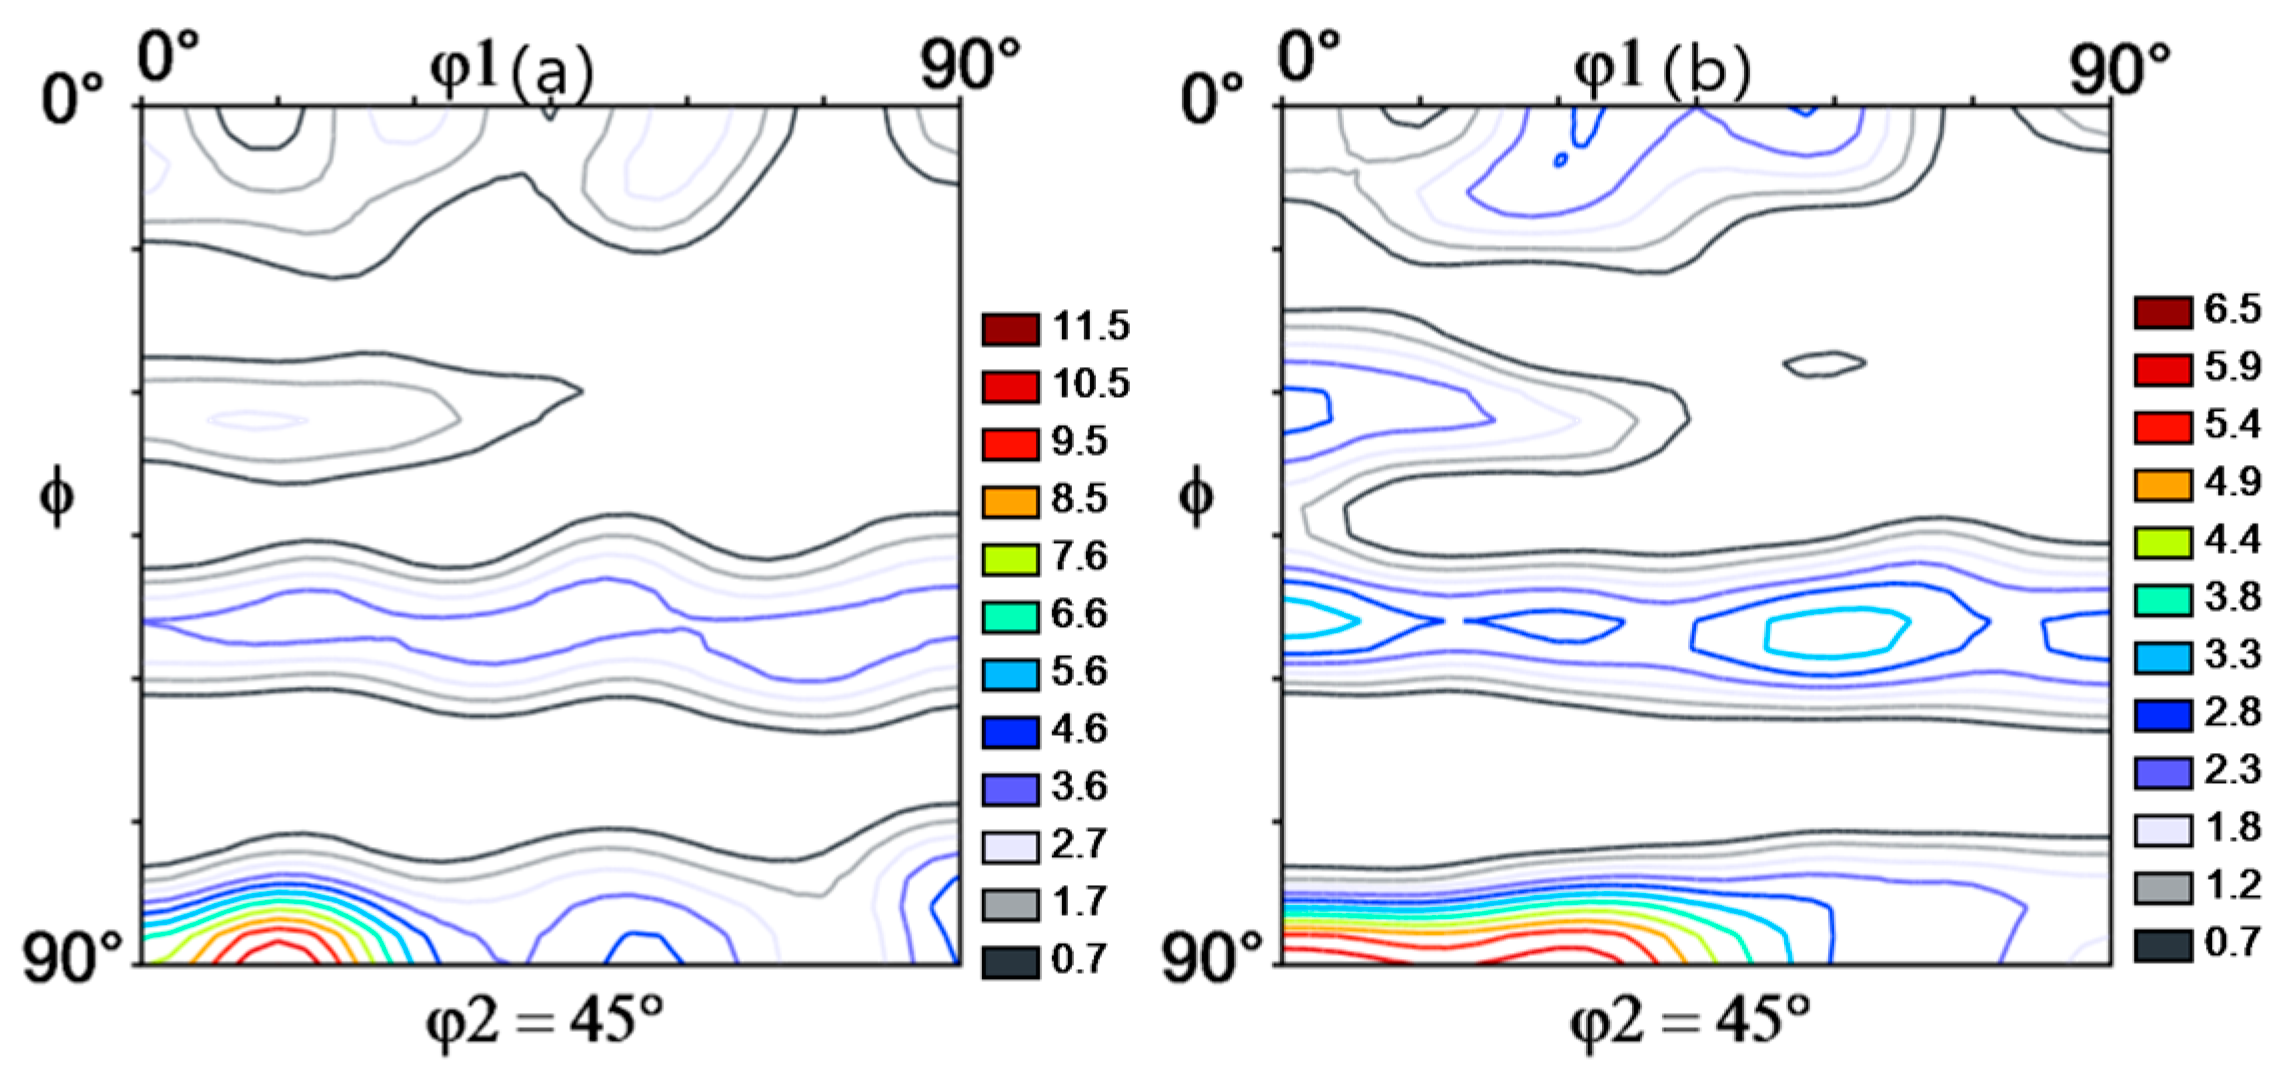
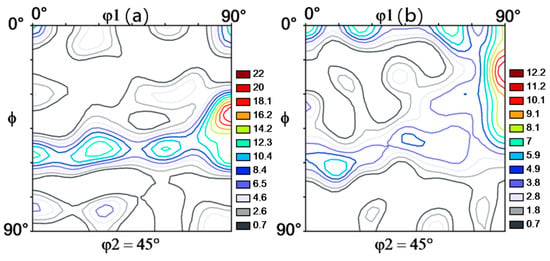
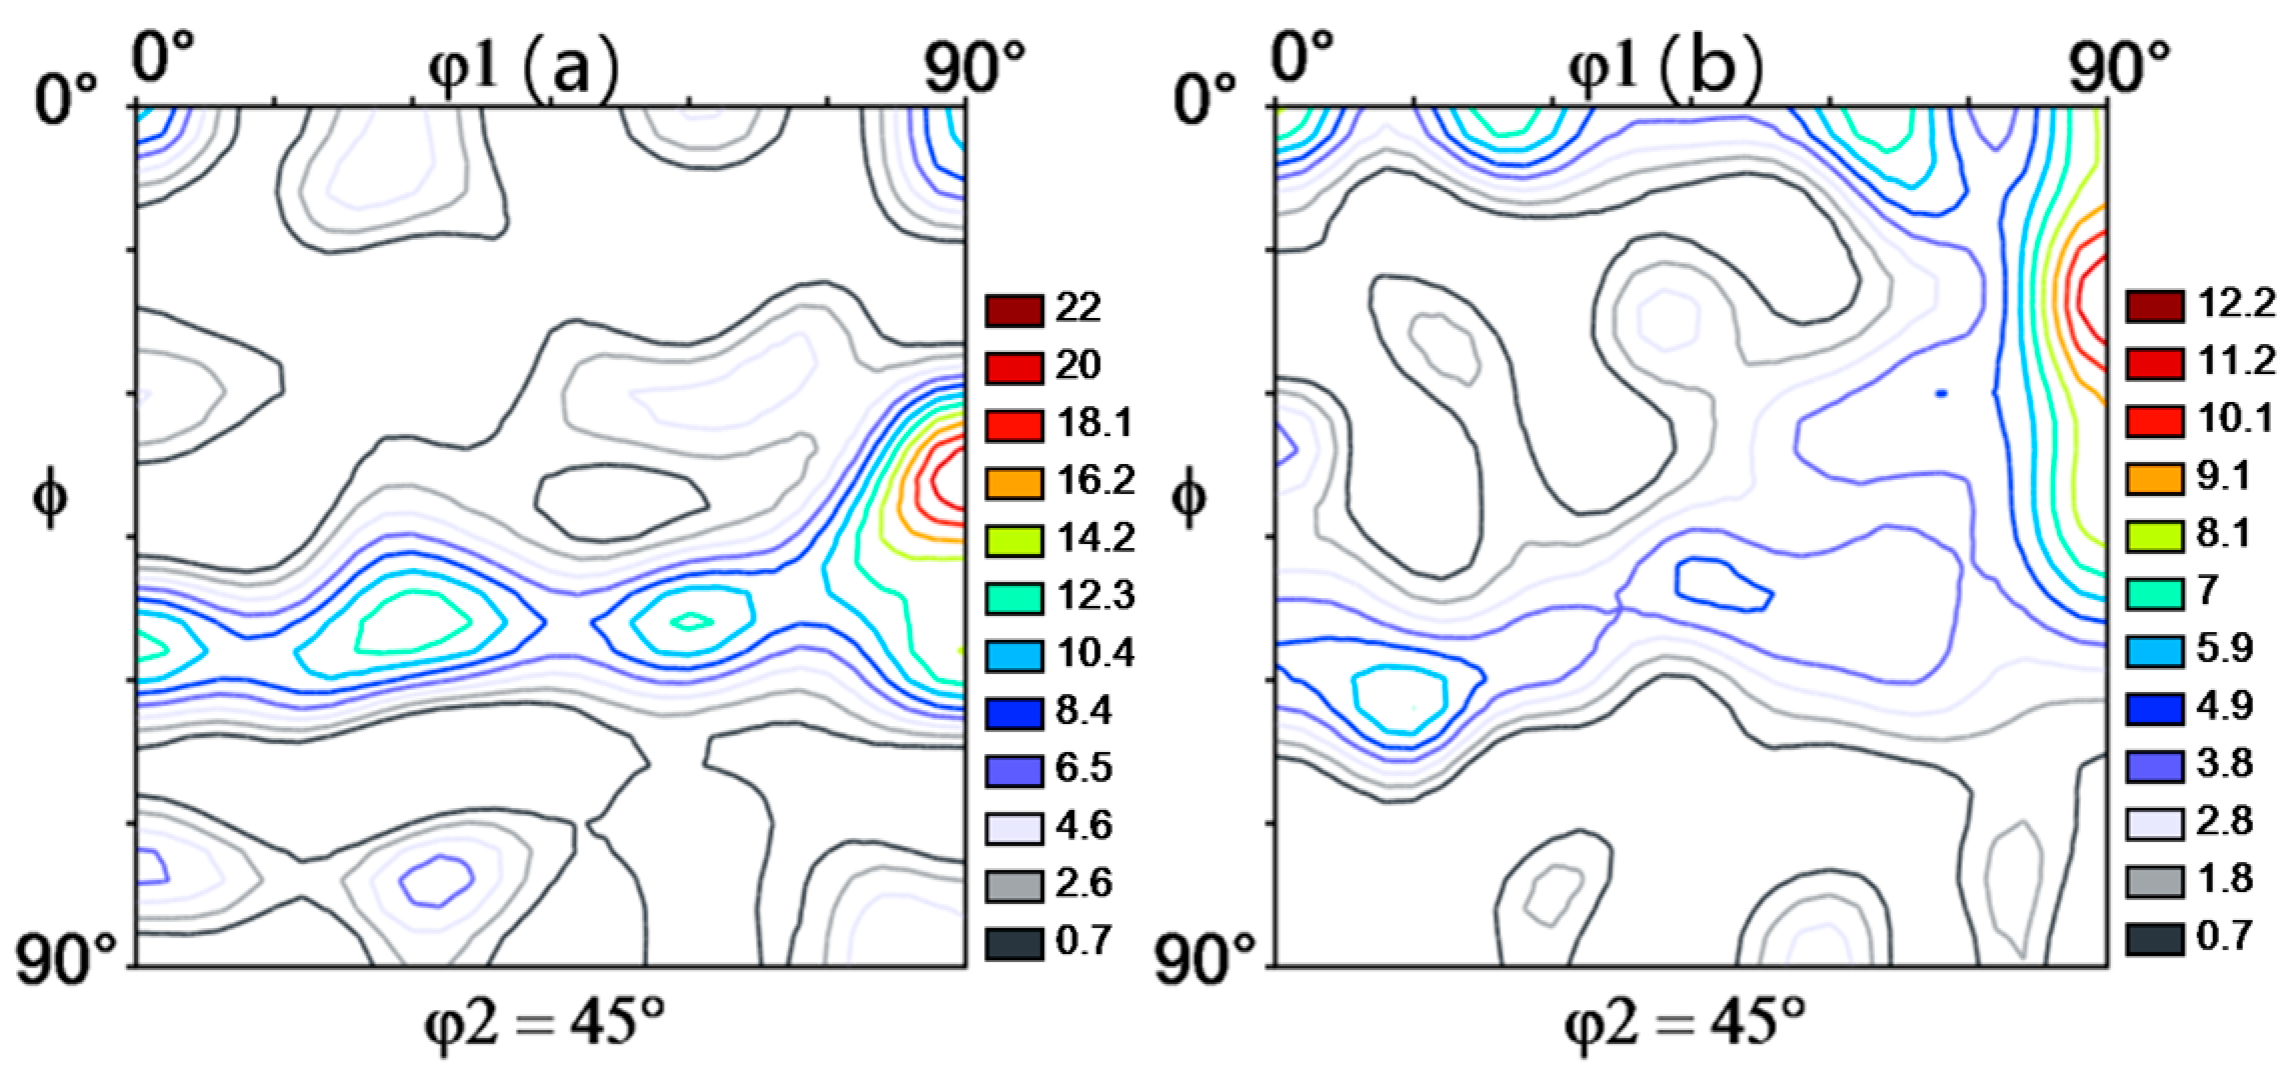
Figure 5 shows the φ2 = 45° ODF sections at the hot-rolled surface. Both samples retained γ-fiber features related to {111}//ND near Φ ≈ 55° and showed some orientation concentration in regions associated with the α-fiber. Thus, combined La-Ce treatment did not change the basic type of surface texture, but mainly affected the concentration and orientation density of individual components.
Figure 5.
φ2 = 45° ODF sections at the hot-rolled surface: (a) La-Ce; (b) rare-earth-free.
Quantitative analysis showed that the surface α-fiber maximum occurred at Φ = 55° in both specimens. After the non-negativity correction, the peak values were 2.830 for the rare-earth-free specimen and 2.573 for the La-Ce specimen, a difference of approximately 9.1%. For the γ-fiber, the peak shifted from φ1 = 30° to 40°, while the peak and mean orientation densities changed from 3.559 and 3.206 to 3.831 and 3.351, respectively. The surface texture therefore retained a similar dominant α-fiber orientation while showing a modest redistribution of orientation density within the γ-fiber.
From the deformation-mechanism perspective, the hot-rolled surface is directly subjected to additional shear imposed by roll friction, so its strain state deviates substantially from ideal plane-strain compression and its crystal-rotation paths are more complex than those at the sheet center. Previous studies have shown that through-thickness texture gradients during hot rolling are closely related to the shear-strain distribution and that, in NOES, hot-deformation amount and surface shear can markedly affect shear bands and subsequent orientation evolution [11,12,16]. Changes in initial grain size, inclusion state, grain-boundary conditions, slip accommodation, and recovery have also been proposed to influence orientation evolution in rare-earth-treated NOES [21,24,25]. The present surface texture response is consistent with a redistribution of deformation accommodation within this shear-dominated region.
3.3.2. Subsurface (1/4-Thickness) Texture
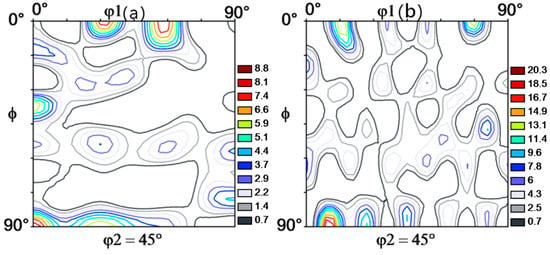
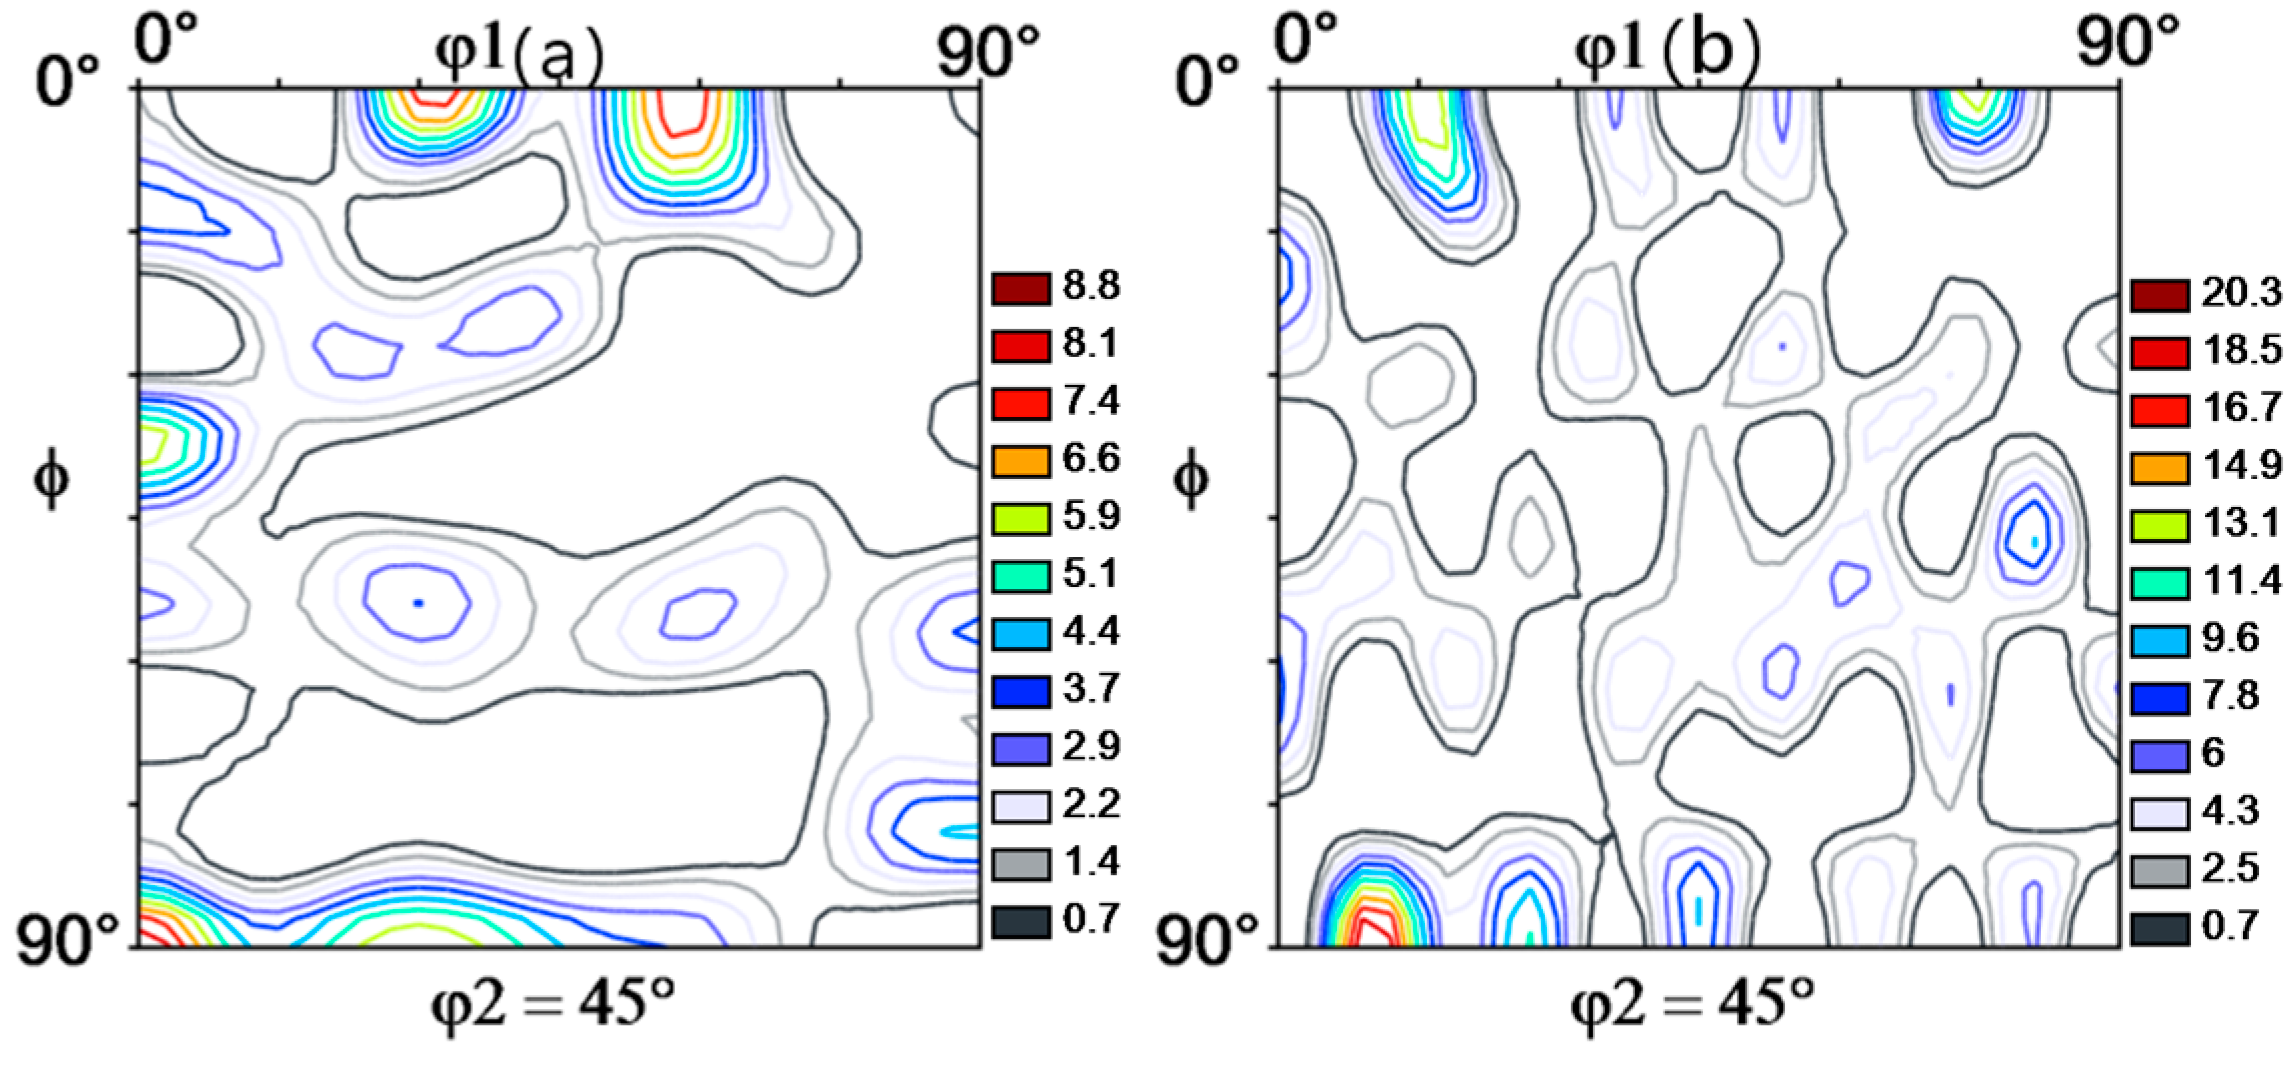
Figure 6 shows the φ2 = 45° ODF sections at 1/4 thickness. Compared with the surface, both samples displayed a more complex distribution of local peaks, indicating that texture at this position is more sensitive to changes in the through-thickness deformation state.
Figure 6.
φ2 = 45° ODF sections at 1/4 thickness (subsurface): (a) La-Ce; (b) rare-earth-free.
At 1/4 thickness, the corrected α-fiber maximum was 4.223 at Φ = 90° in the rare-earth-free specimen and 4.521 at Φ = 75° in the La-Ce specimen, accompanied by a clear peak-position shift. The γ-fiber changed more strongly: the maximum increased from 2.417 at φ1 = 80° to 3.500 at φ1 = 30°, while the mean f(g) increased from 1.464 to 2.818. The quantitative profiles therefore show a pronounced strengthening and redistribution of γ-fiber orientations in the La-Ce specimen at this thickness position.
The 1/4-thickness position lies in the transition from surface shear deformation to near-plane-strain compression at the center. The shear component has substantially decayed but has not completely disappeared, making crystal-rotation paths at this position sensitive to changes in strain partitioning. Changes in grain size, grain-boundary density, and inclusion/matrix interfacial state can modify deformation compatibility and stored-energy distribution among neighboring grains, thereby affecting subsequent orientation selection [21,24,25]. The observed α- and γ-fiber peak shifts are consistent with a redistribution of crystal-rotation paths within this transition region.
3.3.3. Center-Layer Texture
Figure 7 shows the φ2 = 45° ODF sections at the sheet center. Because the direct influence of roll-surface friction is weaker at the center, its orientation distribution differs markedly from that at the surface. Both samples exhibited strong preferred orientations, but the positions and degrees of local concentration differed.
Figure 7.
φ2 = 45° ODF sections at the center layer: (a) La-Ce; (b) rare-earth-free.
The most pronounced quantitative difference occurred in the center-layer α-fiber. After the non-negativity correction, the maximum orientation density was 36.995 at Φ = 50° in the rare-earth-free specimen and 16.636 at Φ = 20° in the La-Ce specimen, corresponding to an approximately 55.0% lower maximum in the investigated La-Ce specimen together with a marked peak-position shift. For the γ-fiber, the rare-earth-free center layer exhibited a maximum of 21.608 at φ1 = 60° and a mean intensity of 7.554. In the La-Ce specimen, the sampled ideal γ-fiber reached the lower bound of the constrained ODF representation. These results demonstrate a strong thickness dependence of the observed texture differences, with the largest α-fiber contrast occurring at the center.
The center layer is least affected by roll-surface friction and additional shear, so its macroscopic deformation state is closer to plane-strain compression. In BCC iron-based materials, rolling deformation readily produces an α-fiber characterized by <110>//RD and a γ-fiber related to {111}//ND. Coarse deformation grains or orientation bands extending along RD can promote spatially correlated deformation and crystal rotation over relatively large distances [16]. The finer and more segmented microstructural/orientation pattern observed in the La-Ce specimen reduces the spatial continuity of similarly oriented deformation regions, consistent with the substantially lower center-layer α-fiber maximum. This correspondence links the observed grain-scale segmentation with the pronounced redistribution of center-layer texture.
3.3.4. Quantitative Analysis of α- and γ-Fiber Textures
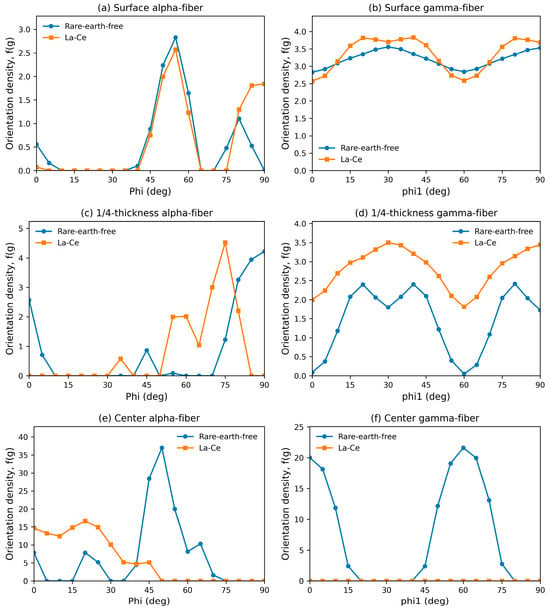
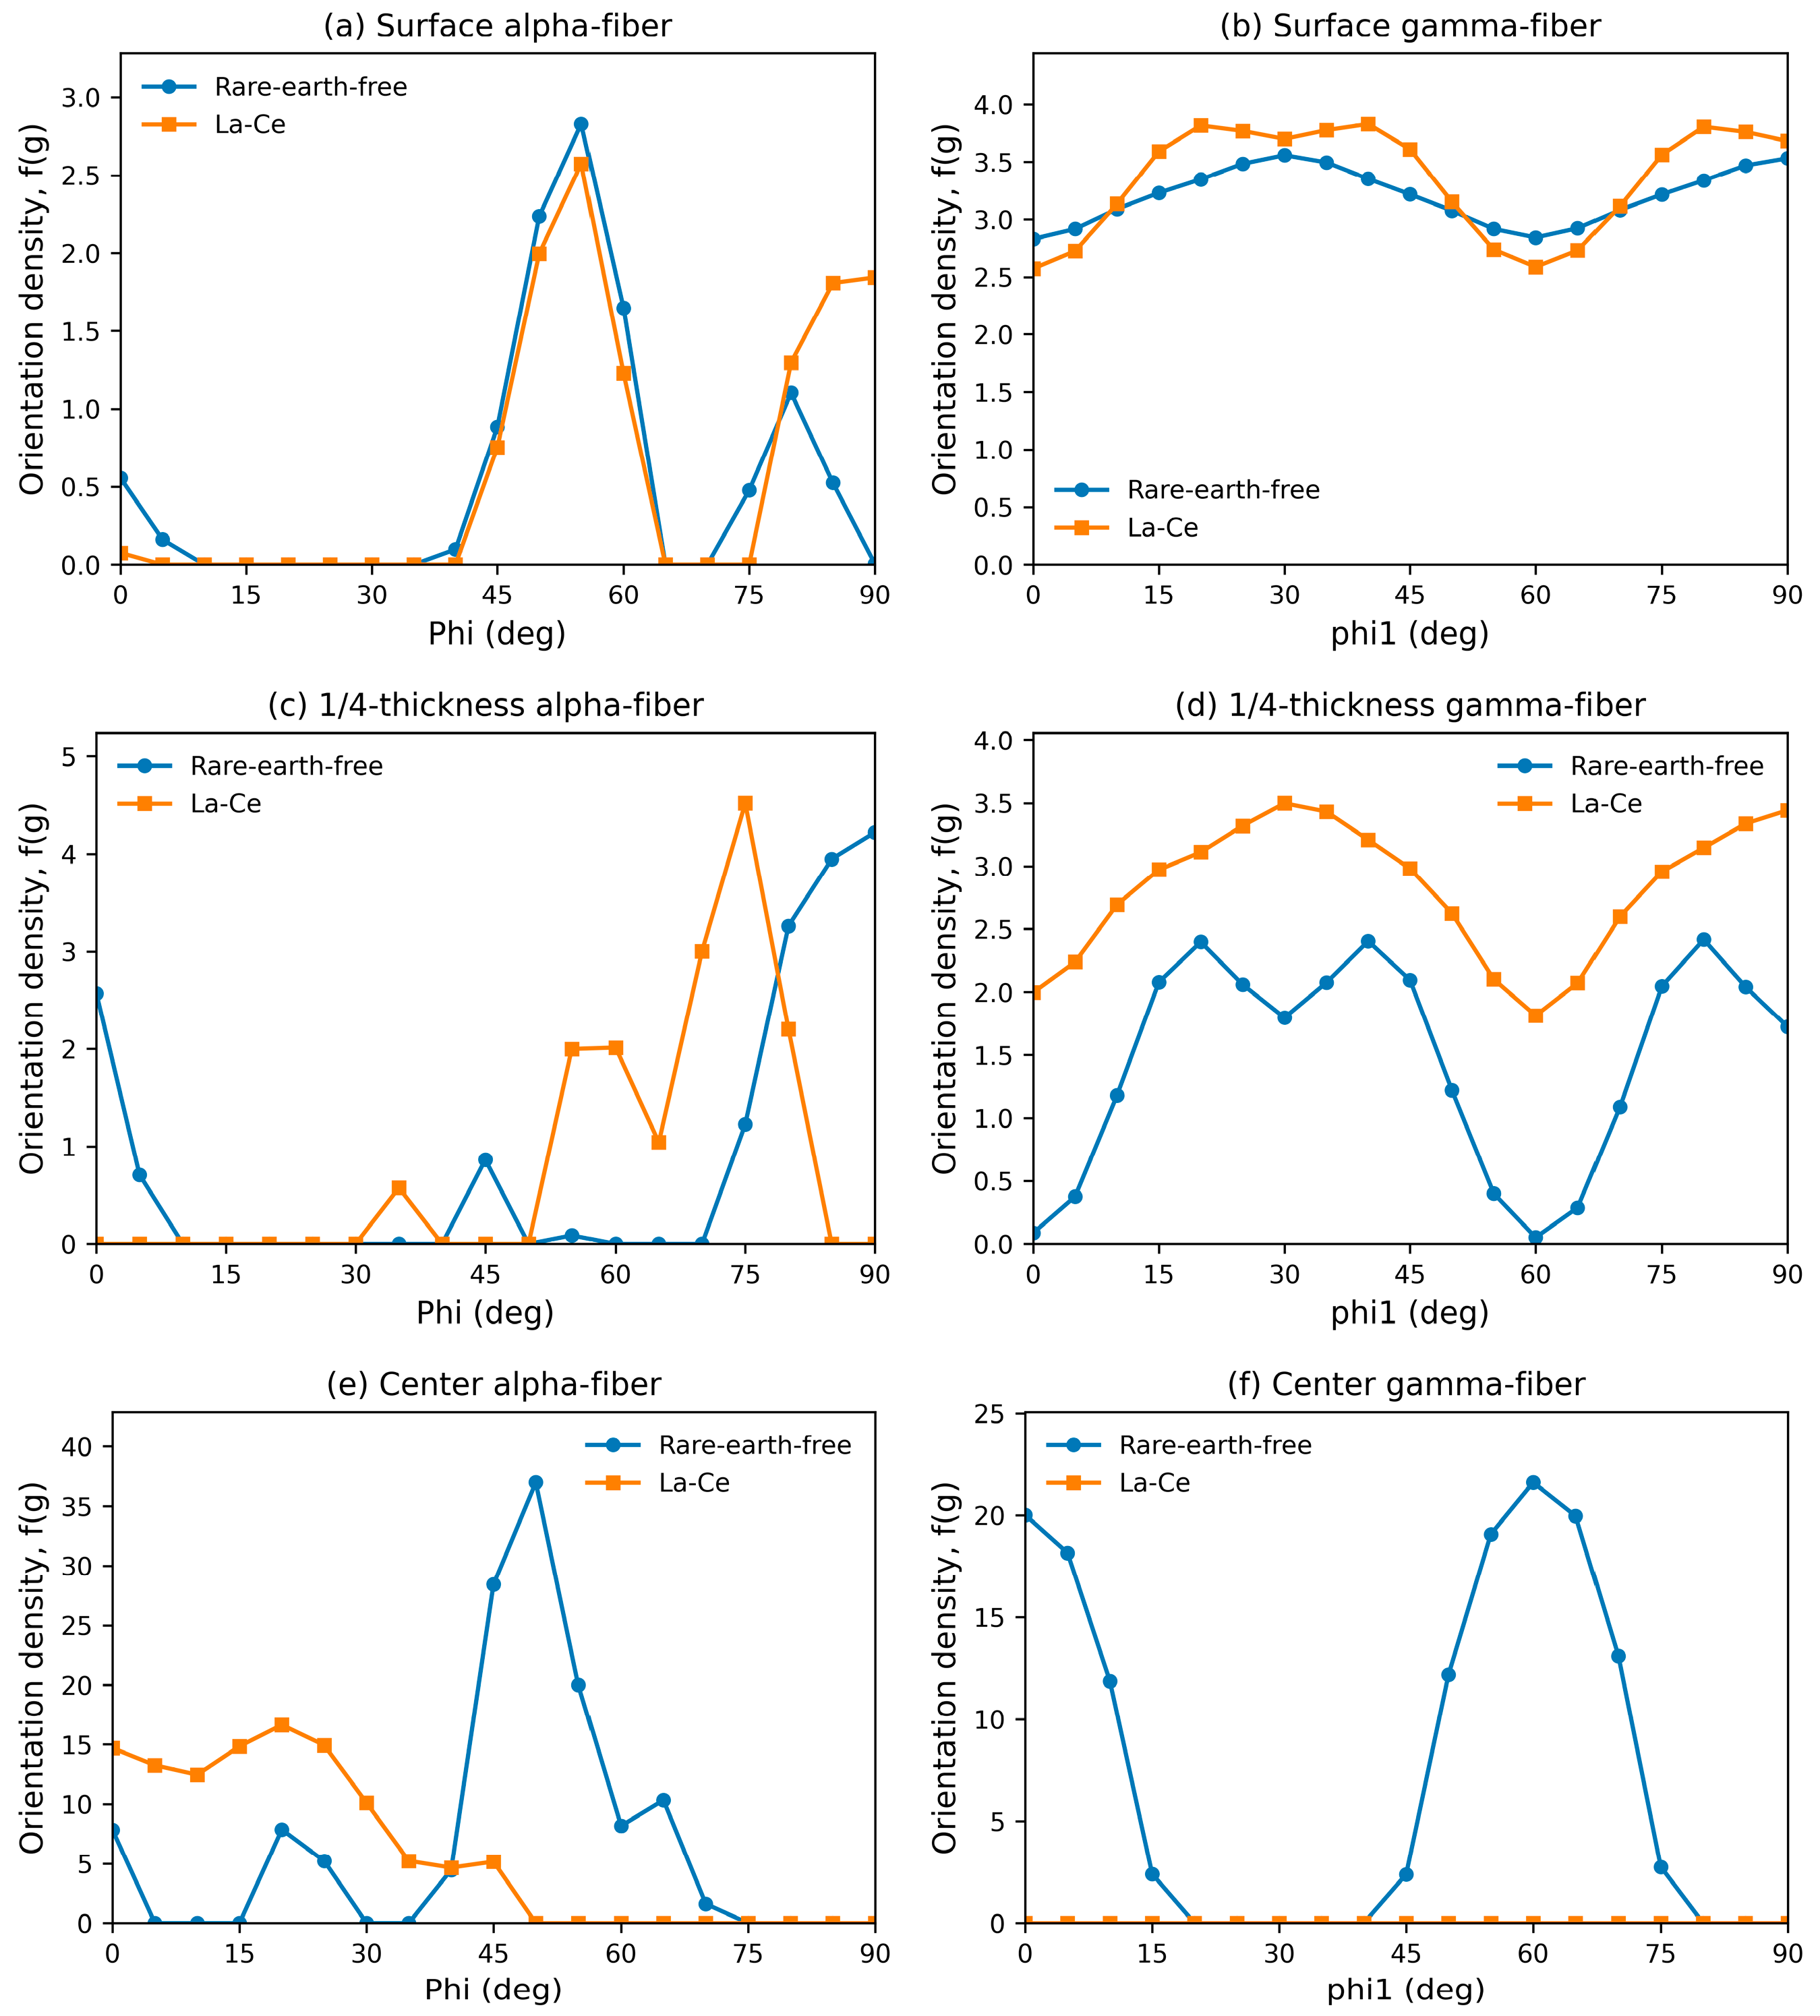
To quantify the texture changes at the three thickness positions, orientation-density variations along the α- and γ-fibers were extracted from the φ2 = 45° ODF section. For the α-fiber, φ1 = 0° and Φ varied from 0° to 90°; for the γ-fiber, Φ = 54.7° and φ1 varied from 0° to 90°. The orientation density f(g) was read at 5° intervals. Figure 8 shows the f(g) distributions for the α- and γ-fibers at the surface, 1/4 thickness, and center, and the quantitative parameters are summarized in Table 2.
Figure 8.
Orientation-density f(g) distributions along the α- and γ-fibers at different thickness positions for the rare-earth-free and La-Ce samples: (a) surface α-fiber; (b) surface γ-fiber; (c) 1/4-thickness α-fiber; (d) 1/4-thickness γ-fiber; (e) center α-fiber; (f) center γ-fiber.
Table 2.
Quantitative parameters of the α- and γ-fibers at different thickness positions.
For the surface α-fiber, the main peak in both specimens occurred at Φ = 55°. The corrected peak values were 2.830 for the rare-earth-free specimen and 2.573 for the La-Ce specimen, a difference of approximately 9.1%. For the γ-fiber, the rare-earth-free specimen had a peak of 3.559 at φ1 = 30° and a mean f(g) of 3.206; the La-Ce specimen had a peak of 3.831 at φ1 = 40° and a mean f(g) of 3.351. The peak and mean differences were approximately 7.6% and 4.5%, respectively.
At 1/4 thickness, the α-fiber peak changed from 4.223 at Φ = 90° to 4.521 at Φ = 75°, a difference of approximately 7.1% accompanied by a peak-position shift. The γ-fiber changed more strongly: the peak increased from 2.417 at φ1 = 80° to 3.500 at φ1 = 30°, while the mean f(g) increased from 1.464 to 2.818. Thus, the quantitative profiles indicate strengthening and redistribution of γ-fiber orientations in the investigated La-Ce specimen at 1/4 thickness.
At the center, the α-fiber maximum was 36.995 at Φ = 50° in the rare-earth-free specimen and 16.636 at Φ = 20° in the La-Ce specimen, corresponding to an approximately 55.0% lower maximum together with a marked peak-position shift. The rare-earth-free center layer exhibited a γ-fiber maximum of 21.608 at φ1 = 60° and a mean f(g) of 7.554. For the La-Ce specimen, the sampled ideal γ-fiber reached the lower bound of the non-negativity-constrained representation, giving sampled maximum and mean values of 0.000 * in Table 2. This result indicates a pronounced redistribution away from the sampled ideal γ-fiber positions in the center-layer ODF.
The f(g) profiles provide a quantitative comparison of texture intensity and orientation distribution at the three thickness positions. A descriptive through-thickness gradient index, GI = σ/mean[f(g)], was calculated from these positions. For the α-fiber peak intensity, GI decreased from 1.075 in the rare-earth-free specimen to 0.787 in the La-Ce specimen, indicating reduced through-thickness heterogeneity of the α-fiber. In contrast, the GI based on mean γ-fiber intensity changed from 0.628 to 0.715, demonstrating that the γ-fiber follows a different through-thickness redistribution trend. Together, these results show that the effect of La-Ce treatment is strongly fiber- and thickness-dependent rather than a uniform shift in the entire texture.
3.4. Microscopic Orientation Characteristics
EBSD was used to analyze local grain orientations and orientation heterogeneity in the mapped transition-to-center regions. The IPF maps characterize grain morphology and spatial orientation continuity, providing local microtexture information that complements the XRD macrotexture measurements.
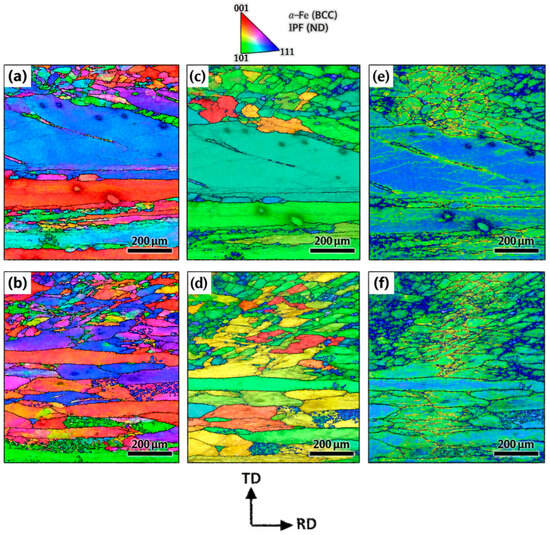
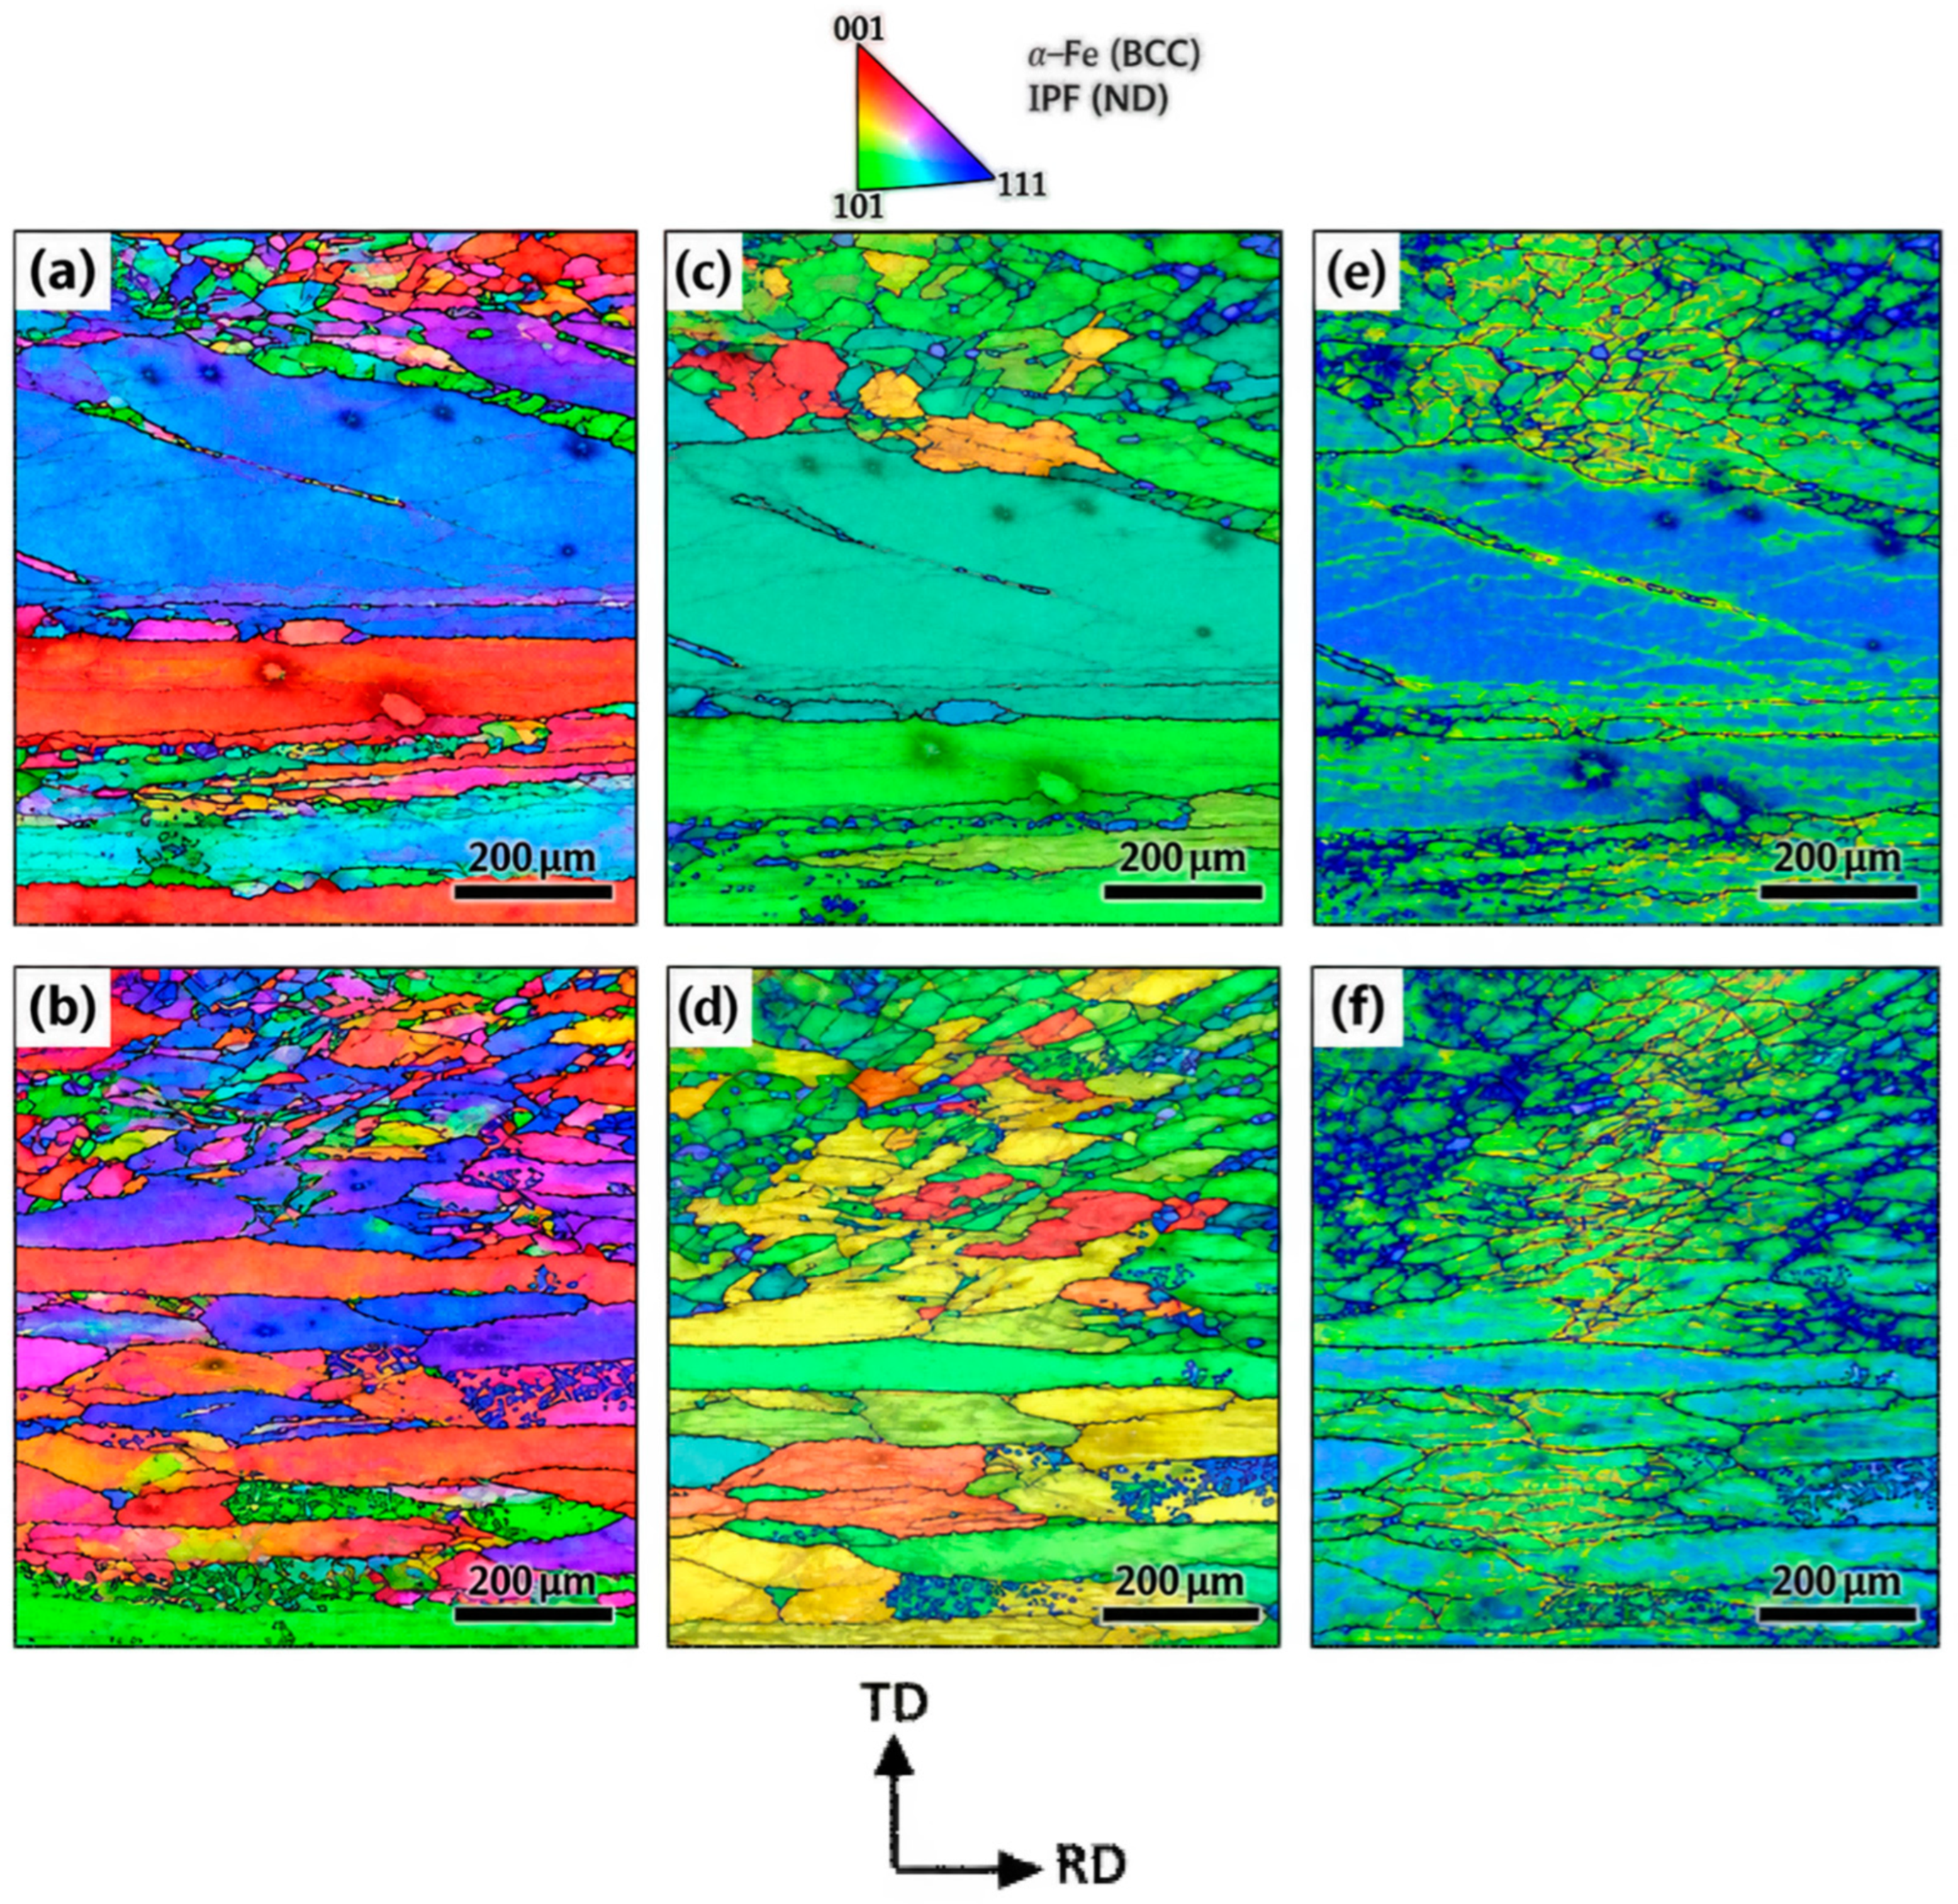
The IPF maps in Figure 9a,b show that, in the rare-earth-free sample, large regions with similar orientations extend continuously along RD from the transition zone toward the center layer. Some grains have large aspect ratios and exhibit pronounced rolling elongation. Thus, the center region displays not only strong morphological continuity but also strong spatial orientation correlation: adjacent regions have similar crystallographic orientations, and multiple deformation grains exhibit similar crystal-rotation characteristics over a relatively large spatial scale. By contrast, the La-Ce sample contains markedly fewer large continuous single-orientation regions, larger orientation differences between neighboring grains, and more grain boundaries and differently oriented grains interrupting the continuous elongated single-orientation bands.
Figure 9.
EBSD maps of the rare-earth-free and La-Ce samples at the same 200 μm scale: (a,b) IPF maps; (c,d) GOS maps; and (e,f) KAM maps. Panels (a,c,e) correspond to the rare-earth-free sample, and panels (b,d,f) correspond to the La-Ce sample. RD and TD are indicated in the schematic below the maps.
The corresponding GOS and KAM maps (Figure 9c–f) provide two complementary views of deformation-related orientation heterogeneity. In the rare-earth-free sample, the GOS map (Figure 9c) is dominated through much of the transition-to-center region by broad, laterally continuous areas with similar contrast. This morphology indicates that neighboring elongated deformation regions preserve a relatively coherent grain-scale orientation-spread state over long distances along RD. After La-Ce treatment (Figure 9d), the GOS contrast becomes distinctly more fragmented: grains with different contrast levels alternate more frequently, and the broad continuous regions are subdivided by a larger number of grain boundaries and orientation interfaces. Thus, the most robust conclusion from the GOS maps is not a simple overall increase or decrease in GOS, but a loss of long-range continuity and a redistribution of grain-scale intragranular orientation spread.
The KAM maps show a related change at the shorter-range neighborhood scale. In the rare-earth-free sample (Figure 9e), a comparatively broad low-contrast region occupies much of the central field, while stronger local contrast is concentrated mainly near boundaries, elongated interfaces, and several localized deformation features. In the La-Ce sample (Figure 9f), this broad uniform interior region is less evident; instead, local misorientation contrast is distributed in a finer and more spatially segmented manner through the elongated-grain structure. The KAM pattern therefore indicates that local lattice-rotation heterogeneity is partitioned into smaller spatial units after La-Ce treatment. Together, the GOS and KAM maps consistently demonstrate a redistribution of deformation-related orientation heterogeneity and a finer spatial partitioning of local orientation gradients in the La-Ce specimen, in agreement with the reduced long-range orientation continuity revealed by the IPF maps.
The combined IPF–GOS–KAM evidence provides a microstructural basis for understanding the weakening of the strong center-layer α-fiber. The center of the hot-rolled sheet is less affected by friction-induced surface shear and therefore deforms closer to plane-strain compression. Under these conditions, BCC ferrite readily follows stable crystal-rotation paths that form the α-fiber characterized by <110>//RD. In the rare-earth-free sample, long similarly oriented deformation regions, broad GOS domains, and an extended relatively uniform KAM interior indicate correlated deformation and crystal rotation over a comparatively large spatial scale. After La-Ce treatment, grain refinement and the increased number of interfaces subdivide these long deformation units; the GOS contrast becomes more grain-by-grain and discontinuous, while KAM contrast is redistributed into a finer network of local orientation gradients. This segmentation reduces the spatial range of correlated deformation and crystal rotation, providing a consistent microstructural explanation for the pronounced reduction in the center-layer α-fiber orientation concentration.
The hot-band texture redistribution may also influence subsequent microstructural and magnetic-property evolution. In BCC Fe-Si, <100> directions are easy magnetization directions whereas <111> directions are comparatively unfavorable. Hot-band grain morphology and orientation distribution affect deformation partitioning, shear-band formation, stored-energy distribution, recrystallization, and texture inheritance during subsequent cold rolling and annealing [3,7,8,9,10,11,12,13,14,15]. Accordingly, the observed refinement and center-layer texture redistribution provide a microstructural basis for further evaluation of downstream recrystallization texture and magnetic performance. Direct magnetic induction and core-loss measurements on the final annealed sheet will be particularly valuable for establishing this processing–microstructure–texture–property relationship.
The present comparison is based on one hot-rolled specimen for each condition and three XRD thickness positions. The results therefore establish clear differences between the investigated specimens, while broader statistical generalization will benefit from independent replicate heats and repeated spatial measurements. Such measurements, together with downstream texture and magnetic-property characterization, will further clarify the reproducibility and practical significance of the observed La-Ce-associated microstructural and texture changes.
4. Conclusions
- (1)
- The La-Ce specimen exhibited clear refinement of both the as-cast and hot-rolled microstructures and a smoother through-thickness microstructural transition. The average as-cast grain size decreased from 2.0 to 1.2 mm, while the average hot-rolled surface grain size decreased from 57.39 to 39.08 μm. The center region also contained fewer continuous coarse fibrous deformation grains, indicating a finer spatial subdivision of the hot-rolled deformation structure.
- (2)
- The hot-rolled texture response to La-Ce treatment was strongly thickness-dependent. Surface texture changes were relatively modest, whereas at 1/4 thickness the γ-fiber was strengthened and redistributed. The most pronounced difference occurred at the sheet center, where the α-fiber maximum decreased by approximately 55.0% in the La-Ce specimen, accompanied by a marked redistribution of the γ-fiber. The decrease in the α-fiber GI from 1.075 to 0.787 further indicates reduced through-thickness heterogeneity of the α-fiber, while the γ-fiber exhibited a different redistribution trend.
- (3)
- EBSD-IPF, GOS, and KAM maps consistently show that La-Ce treatment changes the spatial organization of deformation-related orientation heterogeneity. The La-Ce specimen exhibits reduced long-range continuity of similarly oriented deformation regions, a more segmented grain-scale GOS distribution, and a finer spatial network of local KAM contrast. These microscopic features are consistent with the pronounced redistribution and weakening of the center-layer α-fiber measured by XRD.
- (4)
- The combined microstructural, macrotexture, and microtexture results show that trace La-Ce treatment produces a strongly thickness-dependent redistribution of the hot-band deformation structure and texture. The most pronounced response occurs in the sheet center, where grain-scale segmentation is accompanied by a substantially lower α-fiber orientation concentration. These hot-band changes provide a basis for further evaluation of texture inheritance during cold rolling and annealing and of the resulting magnetic performance in the final sheet.
Author Contributions
Conceptualization, X.Z. and Q.H.; validation, T.L.; formal analysis, T.L.; investigation, X.Z.; writing—original draft preparation, X.Z.; writing—review and editing, X.Z., J.Q. and T.L.; supervision, J.Q. and Q.H.; project administration, J.Q.; funding acquisition, J.Q. All authors have read and agreed to the published version of the manuscript.
Funding
This research was funded by the Inner Mongolia Natural Science Foundation, grant number 2024MS05058.
Data Availability Statement
The original contributions presented in this study are included in the article. Further inquiries can be directed to the corresponding authors.
Conflicts of Interest
The authors declare no conflicts of interest.
References
- Zhu, C.Y.; Bao, Y.K.; Wang, Y.; Ma, J.H.; Li, G.Q. Research Progress on Application Status and Property Control of Non-Oriented Silicon Steel for Traction Motor of New Energy Vehicles. Mater. Rep. 2021, 35, 23089–23096. [Google Scholar] [CrossRef]
- Fan, L.F.; Qin, M.M.; Yue, E.B.; Xiao, L.J.; He, J.Z. Technological Challenges of New Energy Vehicle to Non-Oriented Silicon Steel. Mater. Rep. 2021, 35, 15183–15188. [Google Scholar] [CrossRef]
- Du, Y.; O’Malley, R.; Buchely, M.F. Review of Magnetic Properties and Texture Evolution in Non-Oriented Electrical Steels. Appl. Sci. 2023, 13, 6097. [Google Scholar] [CrossRef] [Scilit]
- Silveyra, J.M.; Ferrara, E.; Huber, D.L.; Monson, T.C. Soft Magnetic Materials for a Sustainable and Electrified World. Science 2018, 362, eaao0195. [Google Scholar] [CrossRef] [Scilit] [PubMed]
- Oda, Y.; Kohno, M.; Honda, A. Recent Development of Non-Oriented Electrical Steel Sheet for Automobile Electrical Devices. J. Magn. Magn. Mater. 2008, 320, 2430–2435. [Google Scholar] [CrossRef] [Scilit]
- Leuning, N.; Jaeger, M.; Schauerte, B.; Stöcker, A.; Kawalla, R.; Wei, X.; Hirt, G.; Heller, M.; Korte-Kerzel, S.; Böhm, L.; et al. Material Design for Low-Loss Non-Oriented Electrical Steel for Energy Efficient Drives. Materials 2021, 14, 6588. [Google Scholar] [CrossRef] [Scilit] [PubMed]
- Li, Z.H.; Xie, S.K.; Wang, G.D.; Liu, H.T. Dependence of Recrystallization Behavior and Magnetic Properties on Grain Size Prior to Cold Rolling in High Silicon Non-Oriented Electrical Steel. J. Alloys Compd. 2021, 888, 161576. [Google Scholar] [CrossRef] [Scilit]
- Park, J.T.; Szpunar, J.A. Evolution of Recrystallization Texture in Nonoriented Electrical Steels. Acta Mater. 2003, 51, 3037–3051. [Google Scholar] [CrossRef] [Scilit]
- Chen, D.M.; An, Z.Z.; Wang, G.D.; Liu, H.T. Effects of Hot Rolling and Coiling Temperatures on Microstructure, Texture and Magnetic Properties of 1.6 wt% Si Non-Oriented Silicon Steel. Mater. Today Commun. 2022, 31, 103807. [Google Scholar] [CrossRef] [Scilit]
- Cong, J.Q.; Guo, F.H.; Qiao, J.L.; Qiu, S.T.; Wang, H.J. Texture Evolution During Recrystallization and Grain Growth in Non-Oriented Electrical Steel Produced by Compact Strip Production Process. Materials 2022, 15, 197. [Google Scholar] [CrossRef] [Scilit] [PubMed]
- Chen, D.M.; Wang, G.D.; Liu, H.T. Effects of Slab Reheating Temperature and Hot Rolling Process on Microstructure, Texture and Magnetic Properties of 0.4% Si Non-Oriented Electrical Steel. Mater. Chem. Phys. 2023, 298, 127419. [Google Scholar] [CrossRef] [Scilit]
- Jiao, H.; Xie, X.; Hu, X.; Zhao, L.; Misra, R.D.K.; Liu, D.; Tang, Y.; Hu, Y. Role of Hot Rolling in Microstructure and Texture Development of Strip Cast Non-Oriented Electrical Steel. Metals 2022, 12, 354. [Google Scholar] [CrossRef] [Scilit]
- Jiao, H.T.; Xie, X.X.; Tang, Y.C.; Hu, Y.; Liu, D.J.; Zhao, L.Z. Improved Texture and Magnetic Properties in Thin-Gauge Strip-Cast Non-Oriented Electrical Steel Through Matching Design of Hot-Cold Rolling. J. Mater. Res. Technol. 2023, 24, 6411–6424. [Google Scholar] [CrossRef] [Scilit]
- Hawezy, D.; Birosca, S. Disparity in Recrystallization of α- & γ-Fibers and Its Impact on Cube Texture Formation in Non-Oriented Electrical Steel. Acta Mater. 2021, 216, 117141. [Google Scholar] [CrossRef] [Scilit]
- An, L.Z.; Wang, Y.P.; Wang, G.D.; Liu, H.T. Fabrication of High-Performance Low Silicon Non-Oriented Electrical Steels by a New Method: Low-Finishing-Temperature Hot Rolling Combined with Batch Annealing. J. Magn. Magn. Mater. 2022, 546, 168907. [Google Scholar] [CrossRef] [Scilit]
- Raabe, D.; Lücke, K. Texture and Microstructure of Hot Rolled Steel. Scr. Metall. Mater. 1992, 26, 1221–1226. [Google Scholar] [CrossRef] [Scilit]
- Ren, Q.; Hu, Z.; Cheng, L.; Zhang, L. Effect of Rare Earth Elements on Magnetic Properties of Non-Oriented Electrical Steels. J. Magn. Magn. Mater. 2022, 560, 169624. [Google Scholar] [CrossRef] [Scilit]
- Wang, H.J.; Niu, Y.H.; Ling, H.T.; Qiao, J.L.; Zhang, Y.L.; Zhong, W.; Qiu, S.T. Effects of Rare Earth La-Ce Alloying Treatment on Modification of Inclusions and Magnetic Properties of W350 Non-Oriented Silicon Steel. Metals 2023, 13, 626. [Google Scholar] [CrossRef] [Scilit]
- Song, C.; Xiang, L.; Shi, C.; Qiao, J.; Liu, J.; Qiu, S. Effect of Rare Earth La-Ce on Solidification Structure of 3.2%Si-0.9%Al Non-Oriented Silicon Steel. ISIJ Int. 2024, 64, 1000–1009. [Google Scholar] [CrossRef] [Scilit]
- Wang, H.J.; Niu, Y.H.; Ling, H.T.; Qiao, J.L.; Zhang, Y.L.; Zhong, W.; Qiu, S.T. Modification of Rare Earth Ce on Inclusions in W350 Non-Oriented Silicon Steel. Metals 2023, 13, 453. [Google Scholar] [CrossRef] [Scilit]
- Zhao, L.; Yang, J.; Hu, H.; Fu, X. Effect of Rare-Earth Ce on the Texture of Non-Oriented Silicon Steels. High Temp. Mater. Process. 2024, 43, 20220321. [Google Scholar] [CrossRef] [Scilit]
- Li, G.; Yang, Y.; He, Z.; Sha, Y. The Multiple Effects of RE Element Addition in Non-Oriented Silicon Steel. Materials 2025, 18, 401. [Google Scholar] [CrossRef] [Scilit] [PubMed]
- Li, H.Z.; Liu, H.T.; Wang, X.L.; Cao, G.M.; Li, C.G.; Liu, Z.Y.; Wang, G.D. Effect of Cerium on the As-Cast Microstructure and Tensile Ductility of the Twin-Roll Casting Fe–6.5 wt% Si Alloy. Mater. Lett. 2016, 165, 5–8. [Google Scholar] [CrossRef] [Scilit]
- Li, N.; Wang, Y.Q.; Qiu, S.T.; Xiang, L. Effect of Ce on the Evolution of Recrystallization Texture in a 1.2%Si-0.4%Al Non-Oriented Electrical Steel. ISIJ Int. 2016, 56, 1256–1261. [Google Scholar] [CrossRef] [Scilit]
- Fan, L.F.; Zhu, R.; He, J.Z.; Lu, B. Effect of Rare Earth Element La on Texture and Inclusion of Non-Oriented Electrical Steel Produced by Thin Slab Casting and Rolling Process. ISIJ Int. 2018, 58, 2348–2353. [Google Scholar] [CrossRef] [Scilit]
- Guo, F.; Niu, Y.; Fu, B.; Qiao, J.; Qiu, S. Influence Mechanisms of Trace Rare-Earth Ce on Texture Development of Non-Oriented Silicon Steel. Materials 2025, 18, 3493. [Google Scholar] [CrossRef] [Scilit] [PubMed]

Disclaimer/Publisher’s Note: The statements, opinions and data contained in all publications are solely those of the individual author(s) and contributor(s) and not of MDPI and/or the editor(s). MDPI and/or the editor(s) disclaim responsibility for any injury to people or property resulting from any ideas, methods, instructions or products referred to in the content. |
© 2026 by the authors. Licensee MDPI, Basel, Switzerland. This article is an open access article distributed under the terms and conditions of the Creative Commons Attribution (CC BY) license.