


Abstract
Pitting distress introduces discontinuous surface texture, thereby modifying the friction–adhesion coupling at the rubber–asphalt interface. This study systematically investigates the interfacial friction response of SBS-modified asphalt pavements with three pitting distribution patterns (sparse, medium, and dense) under varying sliding rates, temperatures, and cyclic loading using a custom-developed friction testing apparatus. The results reveal that adhesion-dominated friction is strongly dependent on both texture distribution and operating conditions. With increasing temperature, the dense pattern exhibits the most pronounced adhesion enhancement, with an average friction increase of 55.0%. The sparse pattern shows a continuous decreasing trend in the low-to-medium speed range, but exhibits a strengthening rebound at high speeds, demonstrating the most complex rate sensitivity. Under cyclic loading, among the three pitting patterns tested, the dense pattern exhibits the best friction retention, with an average friction reduction of only 6.2% after 30 cycles, compared to 9.5% for the sparse pattern and 10.8% for the medium pattern. Three-dimensional topography indicates that the medium pattern exhibits a continuous and relatively uniform wavy roughness, while the dense pattern transforms into a high-frequency serrated morphology. However, the wear in both patterns is dominated by homogenized micro-grooves, without the formation of local deep pits or sharp undulations, which favors the maintenance of stable skid resistance under the laboratory cyclic loading conditions tested in this study. Furthermore, a unified regression model with distribution dummy variables and interaction terms (R2 = 0.826; cross-validated Q2 = 0.646) quantifies the synergistic effect of pitting density and temperature, with the temperature sensitivity increasing six-fold from the sparse to the dense pattern (0.011 to 0.071 N/°C).
1. Introduction
Pavement skid resistance is a core factor in ensuring traffic safety, and its essence is governed by surface texture. Based on wavelength characteristics, texture is classified into micro-texture and macro-texture: micro-texture determines the absolute level of friction, while macro-texture dominates the rate at which friction decreases with increasing speed [1,2]. Among various pavement distresses, pitting distress directly weakens the tire–pavement frictional coupling by disrupting the uniformity and continuity of surface texture, making it a critical type of distress that leads to inadequate skid resistance [3]. Therefore, an in-depth understanding of the intrinsic relationship between texture evolution and friction deterioration under pitting distress is of great significance for improving skid-resistance design theories and maintenance decision-making.
Considerable progress has been made in understanding the influence of texture evolution on frictional performance. Ma et al. [4], through accelerated loading wear tests, revealed the evolution pattern of pavement macro-texture from rough to flat during the abrasion process. Guo et al. [5] further found that polishing under unidirectional traffic flow induces significant texture asymmetry, with micro-texture being more sensitive to polishing. At the material level, SBS-modified asphalt is prone to early plastic deformation under heavy-load and high-temperature conditions due to its thermoplastic behavior, thereby accelerating skid-resistance loss, whereas thermosetting epoxy asphalt and polyurethane-modified asphalt exhibit superior wear resistance [6]. Kong et al. [7,8] compared various preventive maintenance techniques and pointed out that high-elasticity ultra-thin overlays and SMA thin-layer overlays provide the most stable long-term skid resistance, and that aggregate type and texture characteristics jointly determine the evolution path of frictional performance. Environmental factors also exert a significant regulatory effect on skid resistance. Elevated temperatures promote phase transformation and enhanced adhesion in asphalt, thereby improving the frictional performance of rubber–asphalt mastics. Molecular dynamics simulations indicate that the glass transition temperature ranges between −20 °C and 0 °C, and that both bulk modulus and Young’s modulus increase with rubber powder content and temperature [9,10]. To address temperature interference, Luo et al. [11] proposed a temperature decoupling method based on a tire–pavement contact model, effectively eliminating the disturbance of seasonal temperature fluctuations on friction evaluation. Furthermore, water film thickness influences the roles of micro- and macro-texture through boundary lubrication and mixed lubrication mechanisms, respectively. Three-dimensional laser imaging studies have shown that temperature and mean profile depth are key factors affecting prediction accuracy, and under sand-accumulated conditions, interpretable machine learning models based on multi-scale fractals have been applied to skid-resistance assessment [12,13,14].
In terms of texture characterization and prediction methods, researchers have proposed new indices such as average texture surface area density based on high-precision three-dimensional images [15]. Shi et al. [16] constructed a convolutional neural network model based on effective contact-texture regions, decomposing texture into macro- and micro-scales for separate training and achieving a prediction relative error as low as 1.81%. Methods based on finite-element back-calculation combined with principal component analysis and Random Forest have enabled the accurate prediction of interfacial friction coefficients at different speeds [17]. The μ-FINO framework, through stacked Fourier neural operators, achieved cross-scale prediction of frictional behavior [18]. The concept of effective skid-resistance depth proposed by Luo et al. [19] further improved evaluation accuracy. In predictive modeling, a time-series Transformer model achieved a high R2 of 0.981 [20]; multilayer perceptron studies showed that the ReLU and Mish activation functions combined with the Adam optimizer can improve prediction accuracy by 13–18% [21]; and models such as support vector machines and Random Forests can accurately predict locked-wheel trailer friction values using data from the British Pendulum Tester, dynamic friction tester, and circular texture meter [22,23]. In addition, the IGWON-GBoost-based three-dimensional macro-texture evaluation method [24], aggregate micro-texture durability analysis [25], texture-parameter determination based on Persson’s friction theory incorporating wear evolution [26], texture-image fusion detection technology [27], prediction models based on tabular prior-data fitting networks [28], multi-factor friction performance models for network-level management [29], and studies on the relationship between transverse texture distribution and braking distance [30] have collectively driven a paradigm shift in this field from empirical evaluation to data-driven, multi-scale fusion approaches.
Although the above studies have substantially enriched the skid-resistance theory system from multiple dimensions—including texture evolution, material modification, environmental effects, and predictive modeling—the vast majority of work has focused on distress-free or ideally textured pavements. A systematic understanding of the friction evolution characteristics of distressed pavements, especially SBS-modified asphalt pavements with pitting distress under varying speeds, temperatures, and cyclic loading, remains lacking. The particularity of pitting distress lies in the fact that the distribution pattern of pits (sparse, medium, or dense) directly alters the effective contact area and stress concentration state between tire and pavement, resulting in friction mechanisms that are fundamentally different from those of uniform-texture pavements, and traditional prediction models are not directly applicable. This gap urgently calls for dedicated experimental investigation. To address this, the present study employs a self-developed tire–asphalt pavement friction testing platform to prepare SBS-modified asphalt pavement specimens with typical pitting distress. Systematic friction tests are conducted for three pitting distribution patterns under different sliding rates, temperatures, and cycle numbers. The aim is to reveal the influence mechanism of pitting distribution patterns on interfacial friction–adhesion coupling behavior, to clarify their skid-resistance stability and durability characteristics under complex environmental and loading conditions, and to provide experimental evidence and a quantitative model for the safety design and maintenance decision-making of asphalt pavements afflicted with pitting distress. It should be noted that the sliding rates employed in this study (1–10 mm/min) are laboratory-scale conditions, substantially lower than real tire–pavement sliding speeds (~10 m/s); direct extrapolation to field conditions is therefore not intended without further validation.
2. Experimental Setup and Condition Design
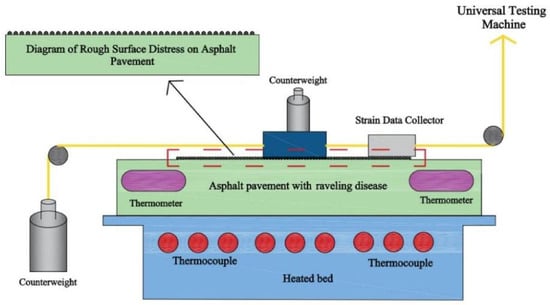
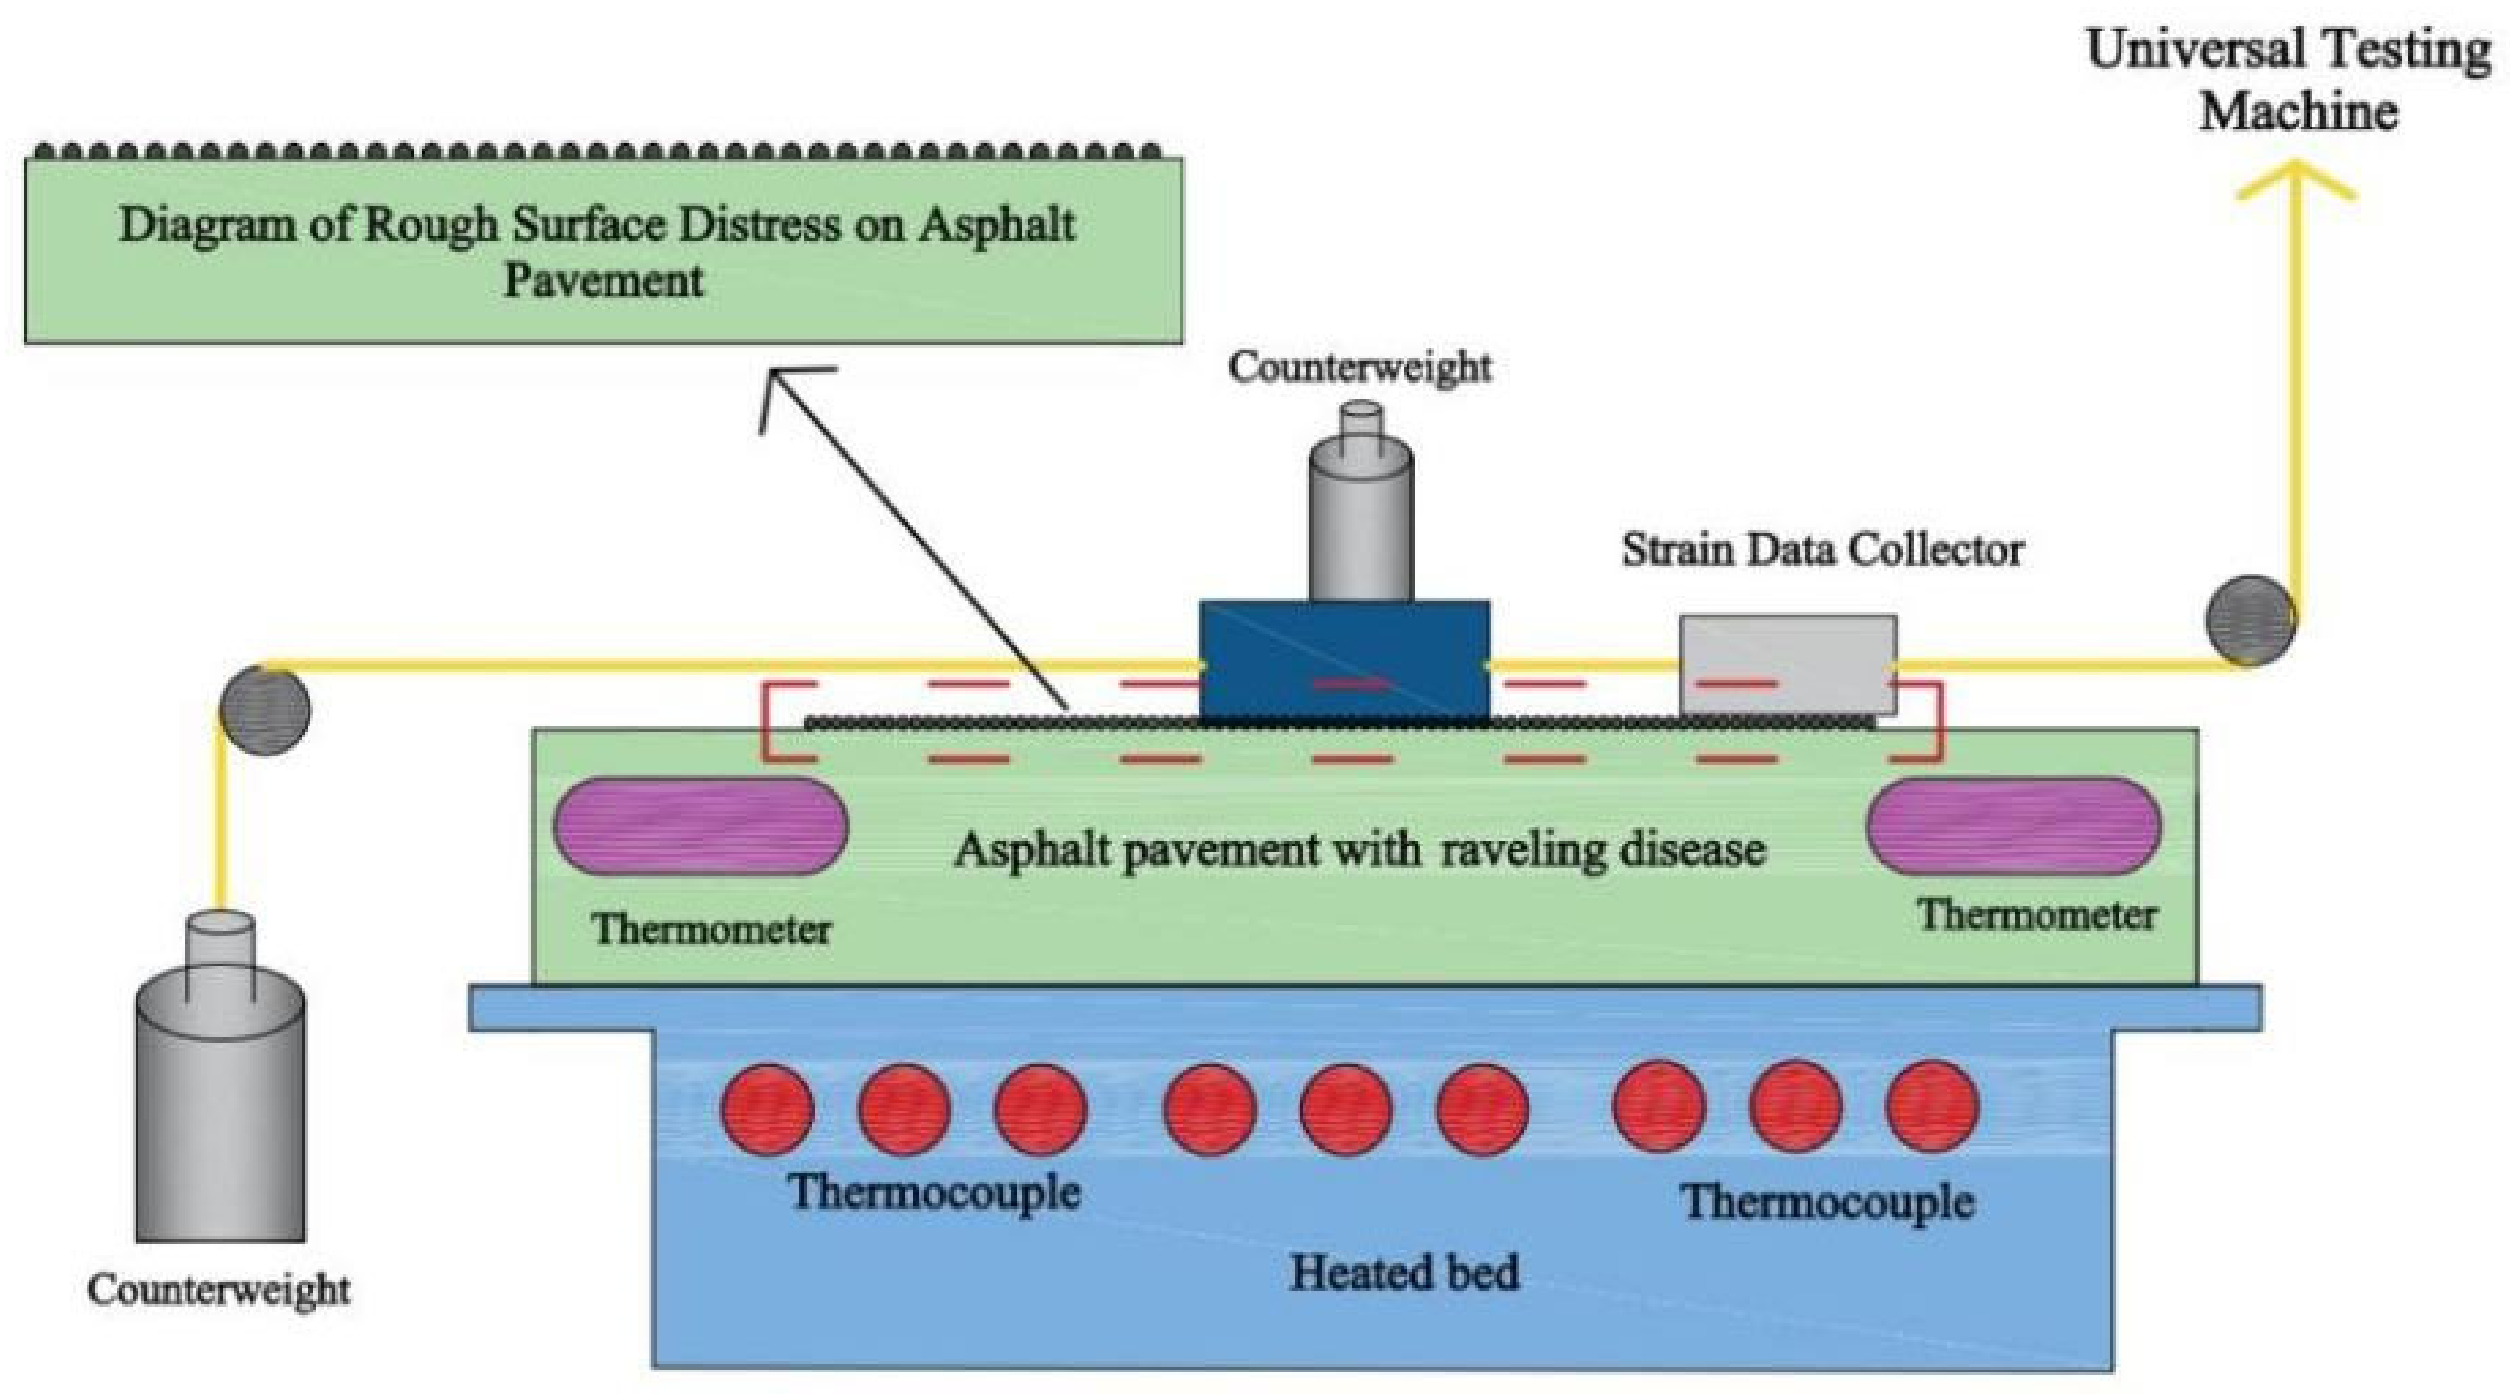
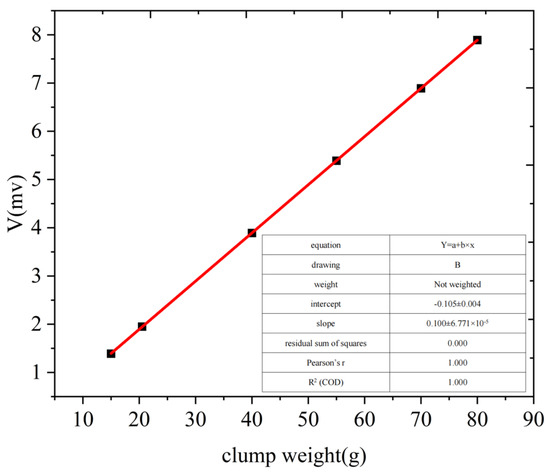
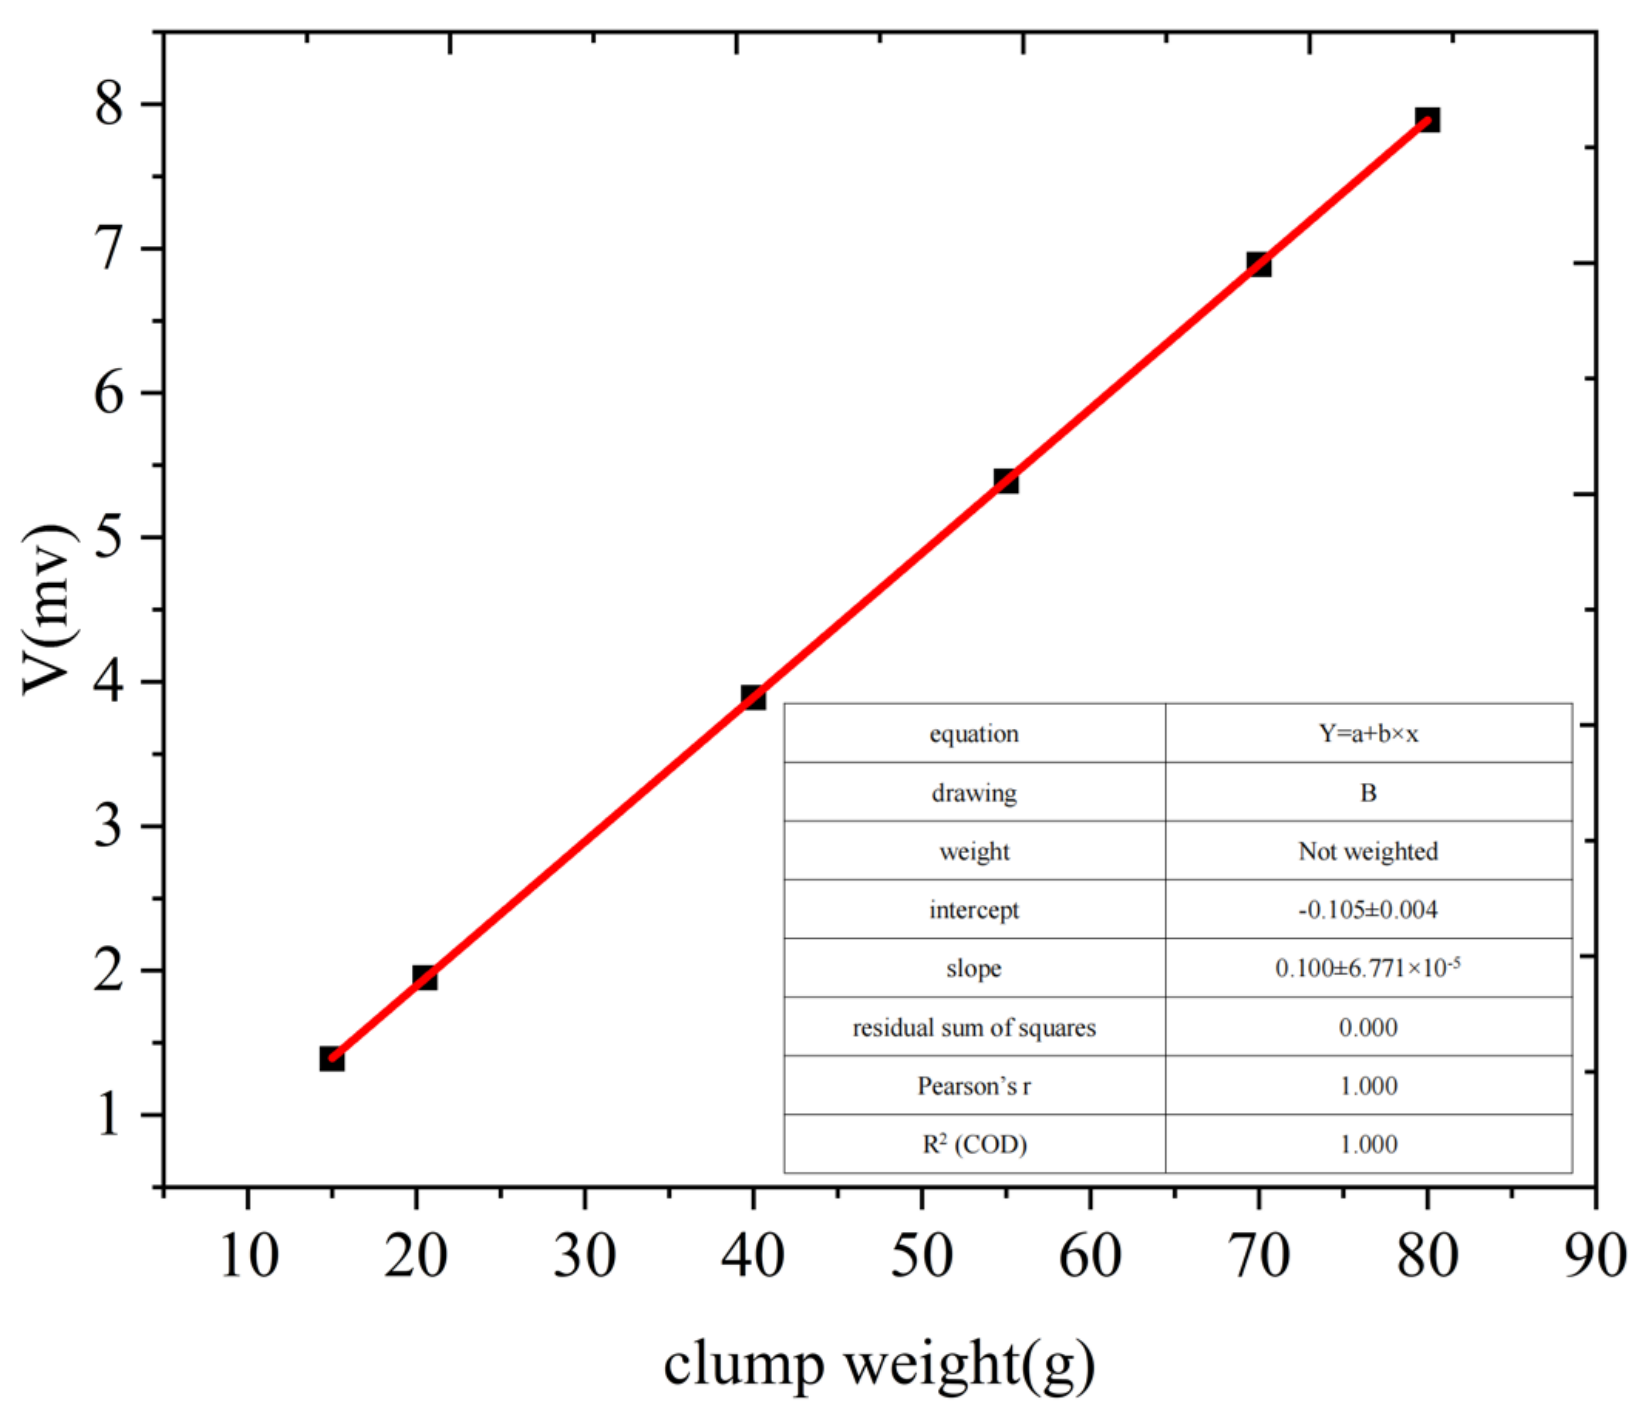
In order to meet the test requirements of friction characteristics between SBS-modified asphalt pavement with pitting distress and tire tread under different working conditions, a friction test system was designed and built independently, as shown in Figure 1. The platform is mainly composed of a material testing machine, a high-precision strain acquisition instrument, a fixed pulley group, a Kevlar traction line, a rubber tire specimen, and other core components. During the test, the device collects the voltage signal generated by the relative sliding of the tire and the asphalt pavement through a high-precision strain sensor, and converts the calibration curve into friction data. During the calibration process, standard weights of different masses are suspended step by step at the lower end of the sensor, and the corresponding voltage values are recorded to establish the force–voltage mapping relationship. As shown in Figure 2, there is a good linear relationship between the voltage response and the applied force value under the five weights, indicating that the test device has reliable sensing accuracy and stability, and can meet the test requirements of the friction characteristics of asphalt pavement.
Figure 1.
Schematic diagram of the friction performance test setup for asphalt specimens with pitting distress.
Figure 2.
Curve of voltage value versus counterweight.
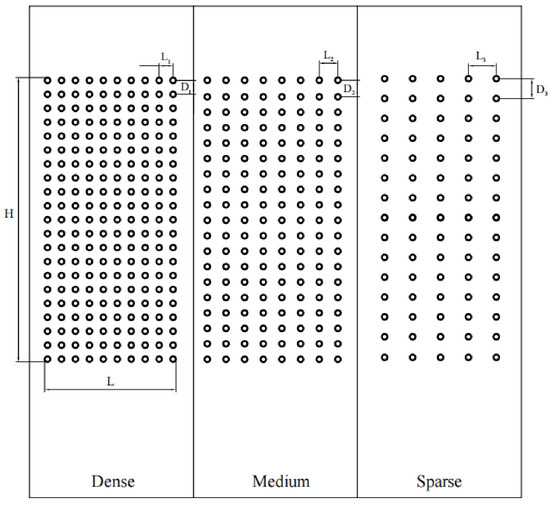
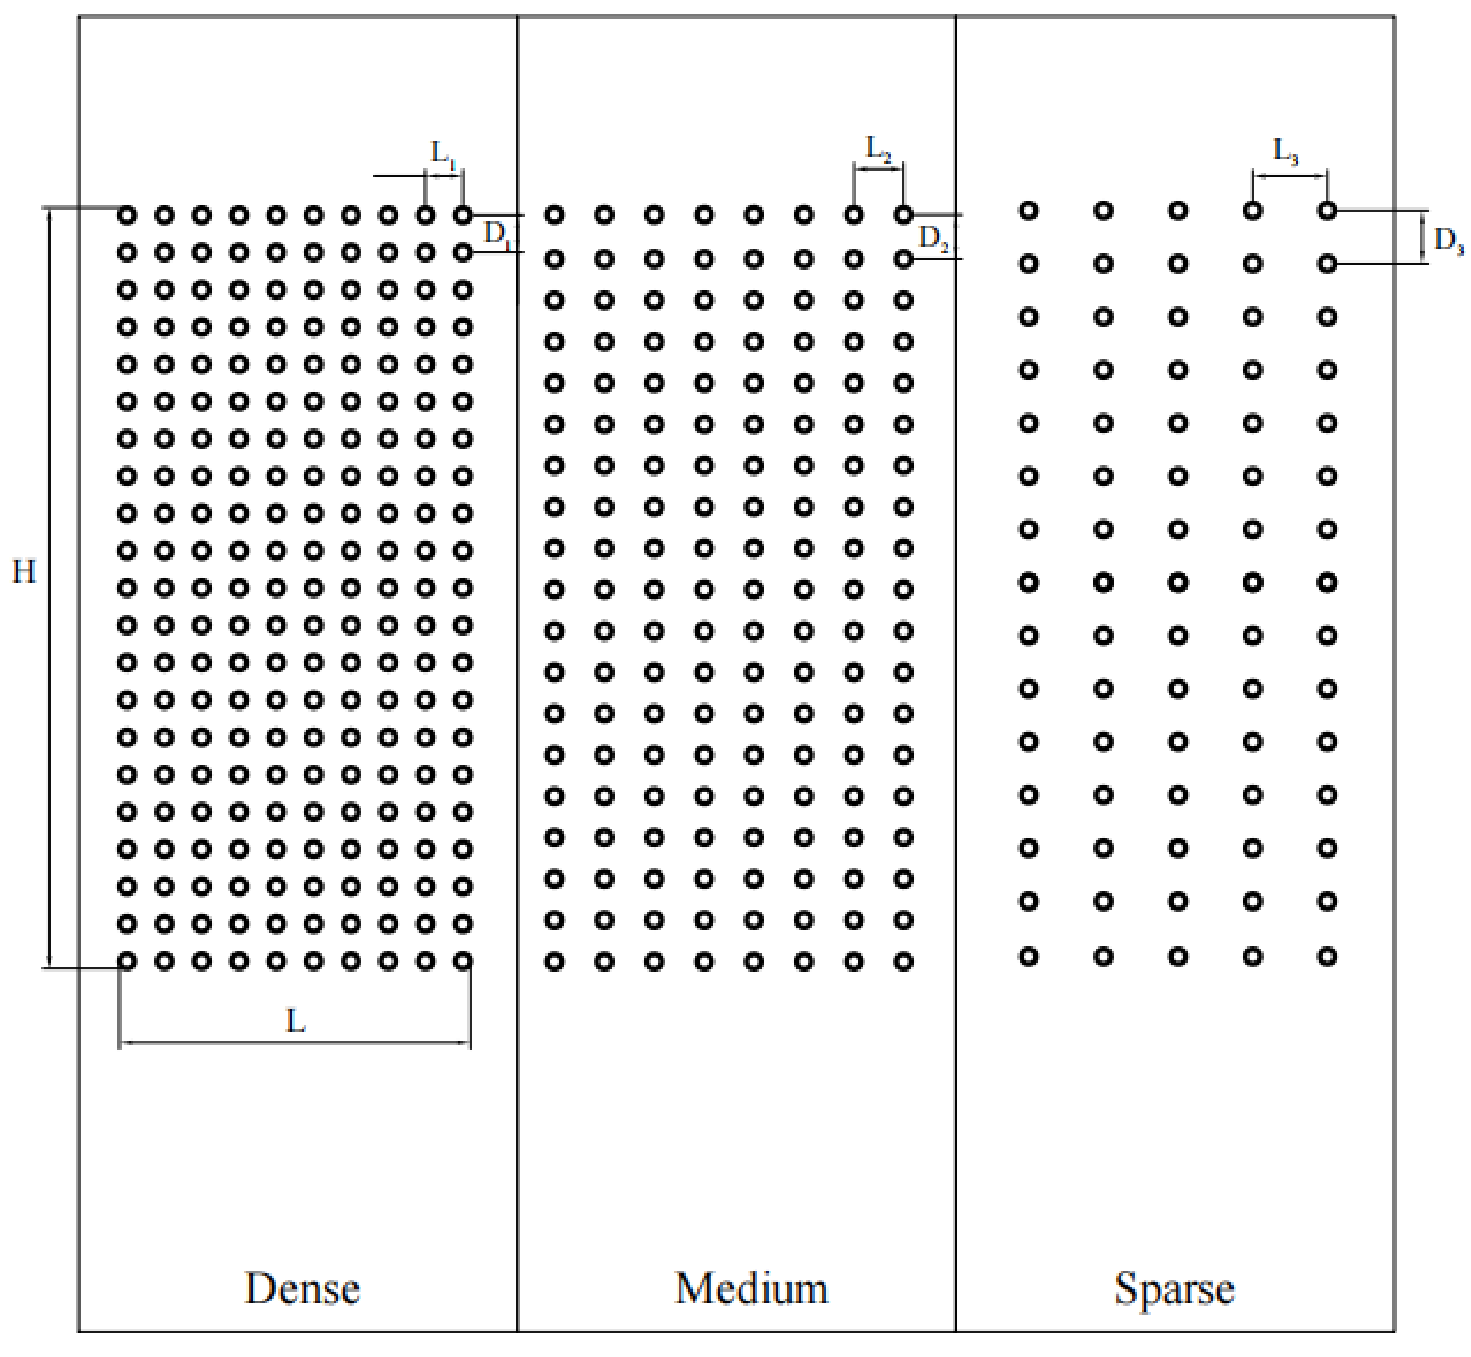
To simulate asphalt pavement with pitting distress, this study employed three pitting distribution patterns for specimen preparation. After forming the base asphalt specimens, fine asphalt aggregates of uniform particle size were selected as the pitting material, with specific dimensional parameters detailed in Table 1. While the asphalt specimens had not yet fully cooled, the fine aggregates were evenly spread on the specimen surfaces according to the following three distribution patterns: dense distribution (pitting coverage of approximately 50%, corresponding to about 210 pitting points), medium distribution (pitting coverage of approximately 30%, corresponding to about 150 pitting points), and sparse distribution (pitting coverage of approximately 10%, corresponding to about 74 pitting points). After the specimens were fully cooled, the spread aggregates firmly adhered to the surface, thereby forming distressed specimens with distinct pitting distribution characteristics. A schematic diagram of the pitting distress distribution patterns is shown in Figure 3. The rubber block with a Shore A hardness of 85 (specific parameters are shown in Table 2) was selected and cut into 40 mm × 40 mm squares as tire simulation specimens. Two holes are drilled in the diagonal position of the specimen, and the high-strength wire is inserted and bent into a closed loop, so as to provide a reliable anchorage point for the Kevlar traction line and ensure the stability of the connection during the sliding process.
Table 1.
Size parameters of pitting distress.
Figure 3.
Schematic diagram of pitting distress distribution patterns.
Table 2.
Rubber slider size parameters.
For each pitting distribution pattern, four nominally identical specimens were fabricated. Because the specimens were produced by manual molding, their surface smoothness and flatness varied appreciably between individual castings. Prior to testing, all specimens were screened visually and by surface flatness; the two specimens exhibiting the most uniform and defect-free surfaces were retained for friction testing, and the remaining two were excluded. For each test condition, three repeat runs were carried out on the assigned specimen, and the results of a single run are reported; within-condition standard deviations are therefore not reported. The between-specimen scatter that remained after screening is quantified and discussed in Section 5.6.
Unless otherwise stated, the sliding-rate tests (Table 3) were carried out at a laboratory ambient temperature of 23 ± 2 °C; the temperature series (Table 4) was conducted using the heating plate described in Section 3.2 at 30, 40, and 50 °C; and the cyclic-loading tests (Table 5) were likewise carried out at 23 ± 2 °C. A sensitivity check in which the assumed ambient temperature was varied between 20 and 28 °C confirmed that the retained model terms and all reported trends are unaffected (R2 = 0.811–0.826).
Table 3.
Comparison of friction force values at different speeds.
Table 4.
Comparison of friction force values at different temperatures.
Table 5.
Comparison of friction values at different numbers of cycles.
3. Experiment and Analysis
3.1. Effect of Sliding Rate on Friction Performance
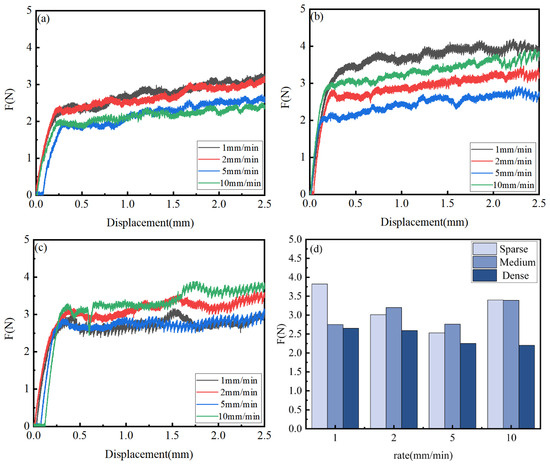
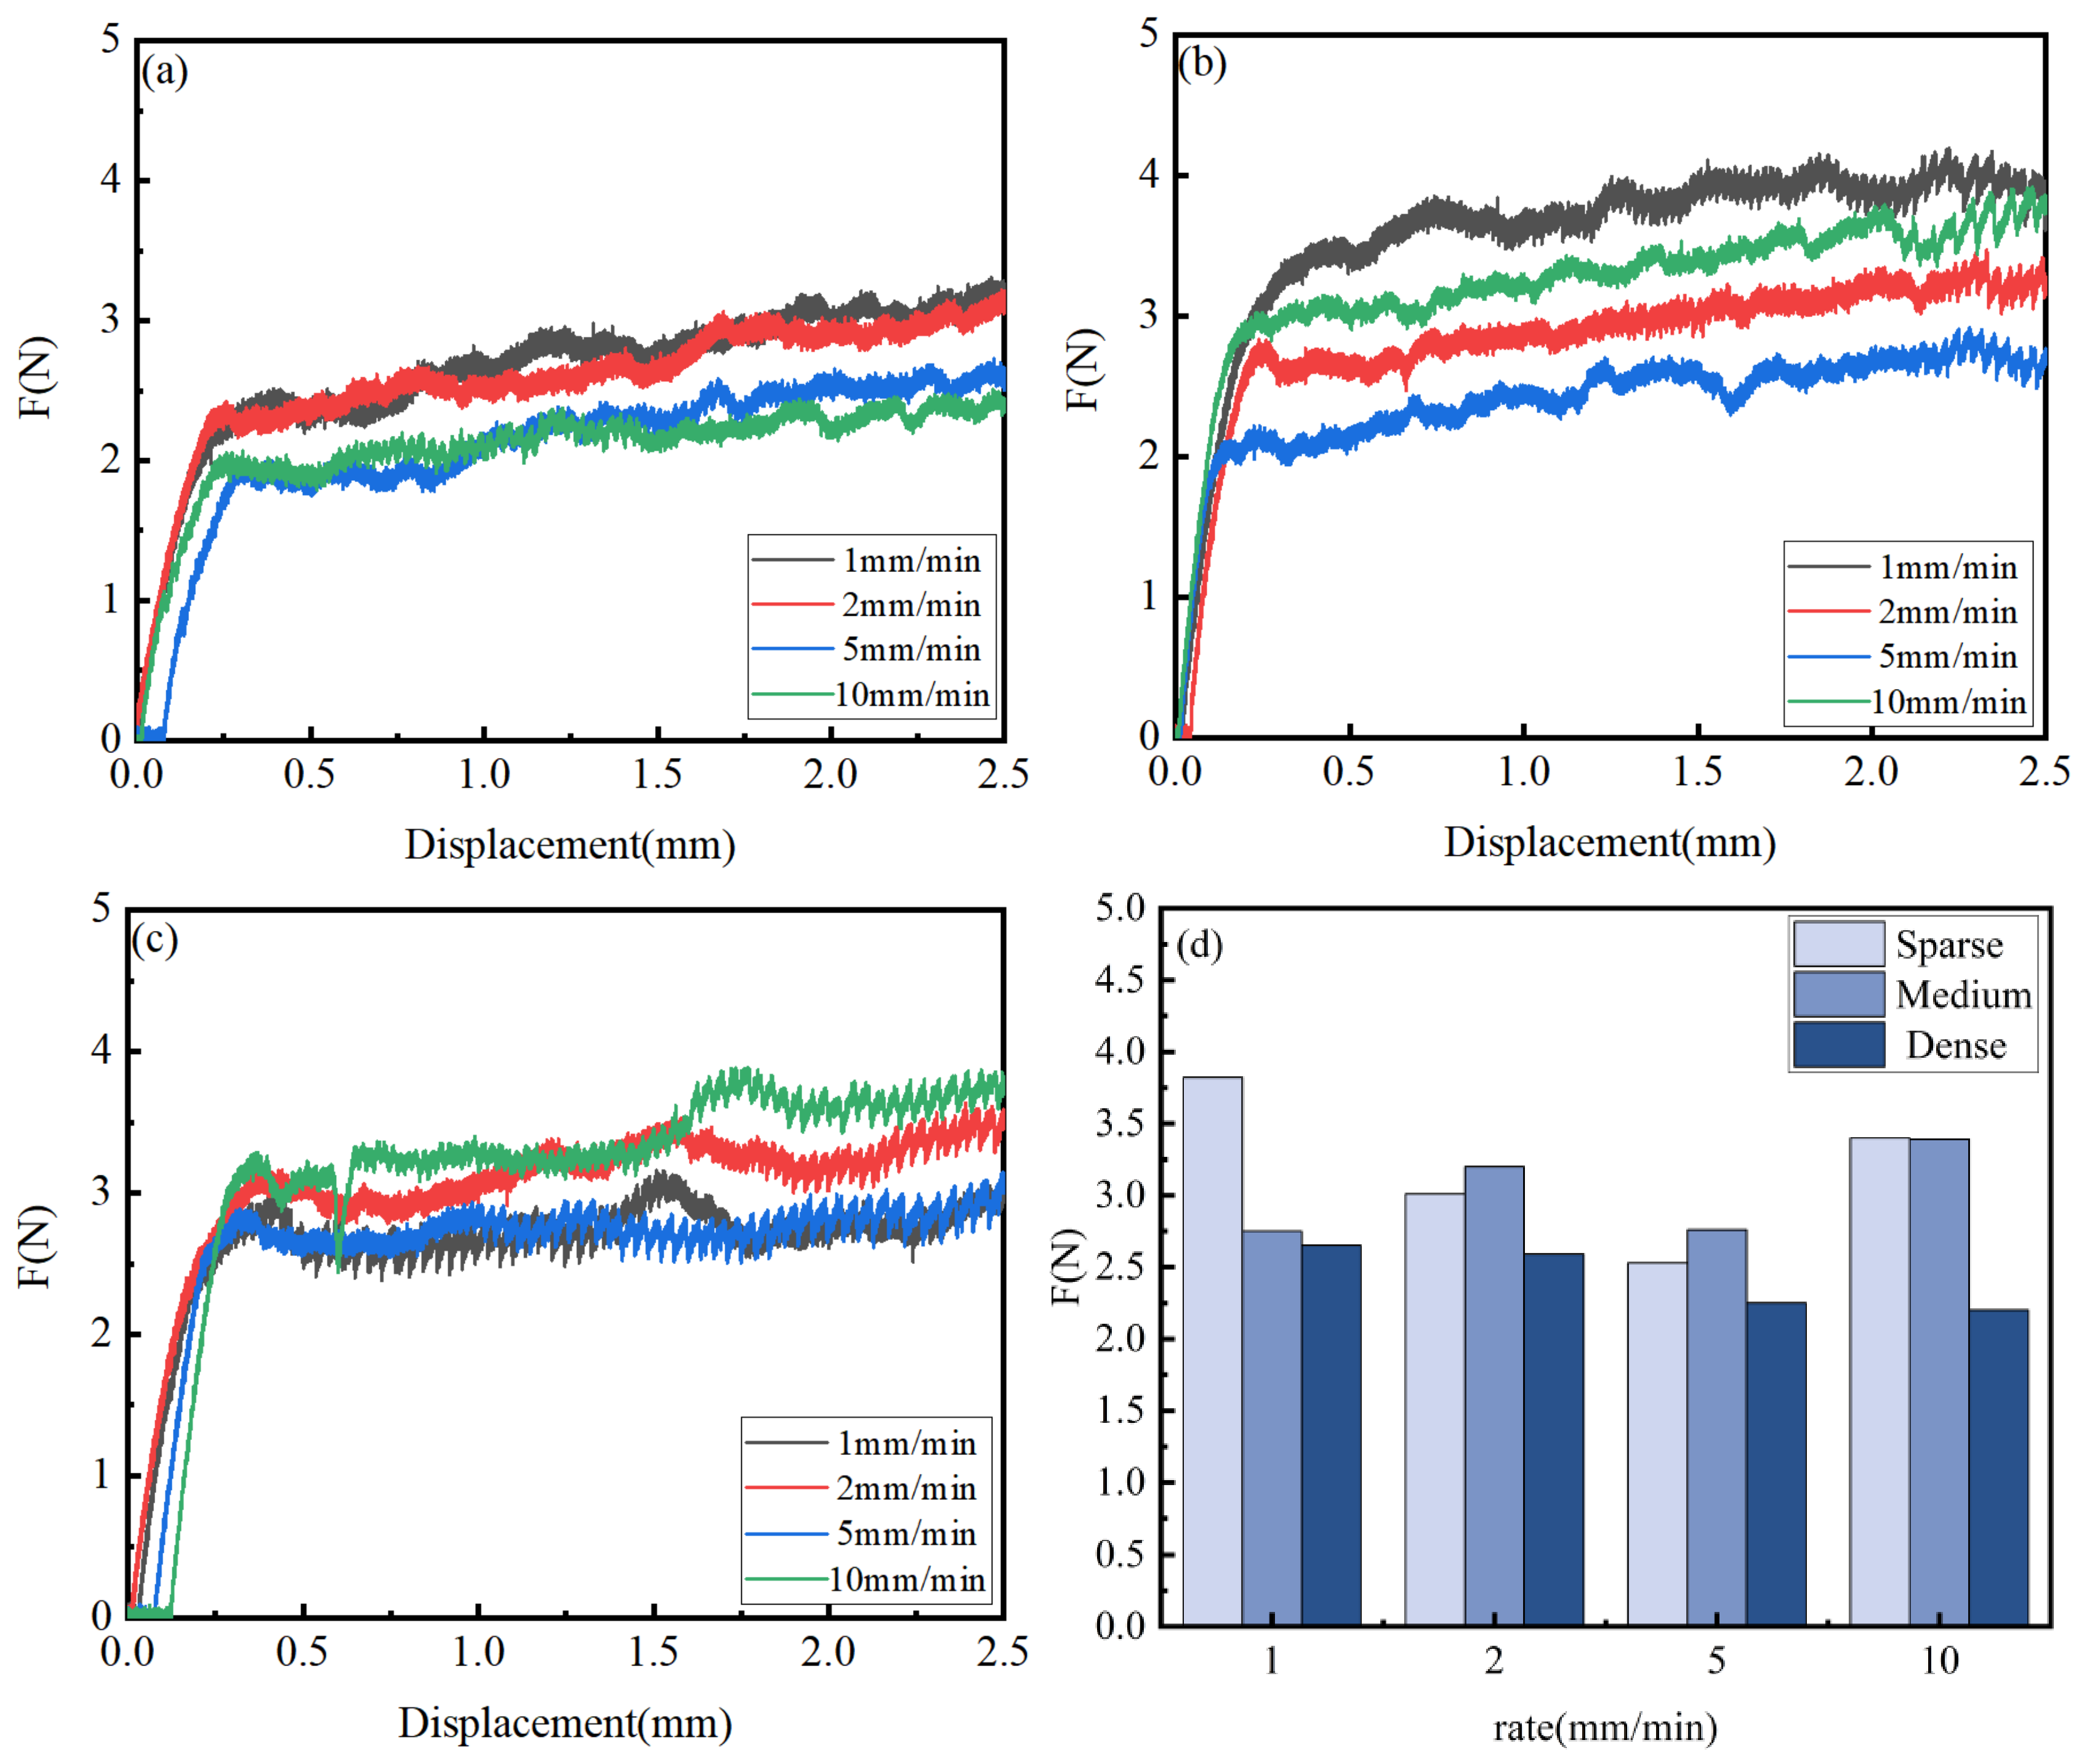
This study systematically analyzed the evolution of friction performance at the rubber–asphalt interface under different sliding rates. Figure 4a–c respectively illustrates the dynamic friction responses of dense, sparse, and medium pitting distribution patterns under varying rates. All tests in this section were conducted at a constant ambient temperature of 23 ± 2 °C. Under a constant displacement of 2.5 mm, time–friction curves were tested at four sliding rates: 1 mm/min, 2 mm/min, 5 mm/min, and 10 mm/min.
Figure 4.
Dynamic friction response under different sliding rates: (a) dense distribution; (b) sparse distribution; (c) medium distribution; (d) average comparison.
For the sparse pattern (Figure 4b), the friction force decreases monotonically from 3.82 N at 1 mm/min to 2.53 N at 5 mm/min, representing a reduction of 33.8%, which indicates a significant rate-softening effect in the low-to-medium speed range. However, when the speed further increases to 10 mm/min, the friction unexpectedly rebounds to 3.40 N, an increase of 34.4% relative to the value at 5 mm/min. This U-shaped trend suggests that at very low speeds, the sparse texture provides sufficient time for the growth of adhesive junctions, whereas at high speeds, the reduced contact time may shift the dominant dissipation mechanism toward enhanced hysteretic losses, thereby suppressing the softening effect. In contrast, the dense pattern (Figure 4a) exhibits a continuous downward trend across the entire speed range, with friction dropping from 2.65 N to 2.20 N (a decrease of 17.0%), without any rebound. This indicates that the closely spaced asperities of the dense surface maintain a relatively stable lubricating shear layer, which inhibits rate-induced strengthening. The medium pattern (Figure 4c) displays the most complex response: friction first rises from 2.75 N at 1 mm/min to 3.20 N at 2 mm/min, then decreases to 2.76 N at 5 mm/min, and finally climbs again to 3.39 N at 10 mm/min. This alternating increase–decrease–increase pattern reflects a competitive interplay between adhesive growth and viscoelastic relaxation under intermediate pit spacing. In terms of rate sensitivity, when sufficient time is allowed for interfacial bonding, the sparse pitting pattern can effectively promote adhesion-dominated friction. However, at 10 mm/min, the differences among the three patterns become substantially smaller (3.40, 3.39, and 2.20 N for sparse, medium, and dense, respectively), indicating that high sliding speeds tend to homogenize the friction output, with reduced influence from texture distribution.
In summary, the rate-dependent friction is not a simple monotonic function, but rather the result of competition among adhesive junction formation, viscoelastic hysteresis, and shear thinning of the asphalt binder. The sparse pattern, with its widely spaced and isolated pits, is more favorable to adhesive contributions at low speeds. The dense pattern, owing to its closely packed texture resembling a quasi-uniform surface, maintains stable but relatively low friction across all speeds. The medium pattern, serving as a transitional configuration, exhibits multi-crossover transitional behavior.
The sliding rate exerts a non-monotonic and crossover effect on the frictional behavior of the pitted surface: both sparse and dense distributions exhibit rate softening within 1–5 mm/min, but when the rate increases to 10 mm/min, the sparse distribution shows a strengthening rebound, while the dense distribution continues to decrease. This indicates that the sparse and medium distributions undergo a transition from softening to strengthening at high rates (with a threshold of approximately 5 mm/min). Specifically, the dense distribution reduces friction at low speeds but tends to become unstable at high speeds, whereas the sparse distribution exhibits strong vibration suppression at high speeds. These observations highlight the significant influence of different distribution patterns of pitting defects on the rate-dependent mechanical response, providing important experimental evidence for the optimal design of gradation schemes. It should be noted, however, that comparisons of absolute friction force between different pitting patterns are subject to specimen-to-specimen variability, as each pattern was realized on a different specimen; the absolute differences discussed above should therefore be interpreted with caution, whereas the relative trends remain robust. A detailed quantification is provided in Section 5.6.
3.2. Effect of Temperature on Friction Characteristics
In this experiment, temperature control of the asphalt specimens was achieved using a 200 W heating plate. The heating plate was positioned at the center of the lower surface of the specimen, enabling uniform temperature rise across the specimen surface through heat conduction. After setting the target temperature, heating was maintained for 20–30 min until the internal temperature of the specimen reached the preset value and remained uniformly distributed. Subsequently, the heating power was reduced for temperature preservation, allowing stable temperature maintenance within 10 min.
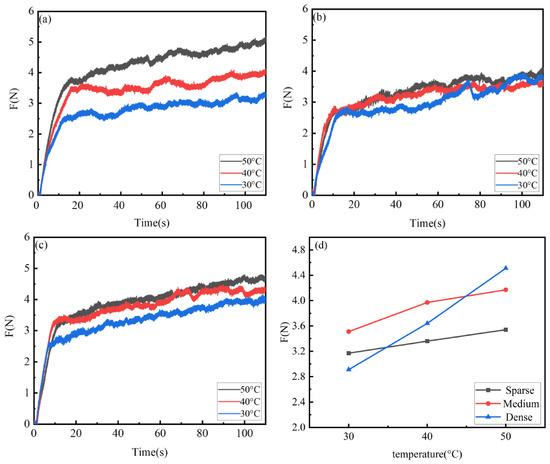
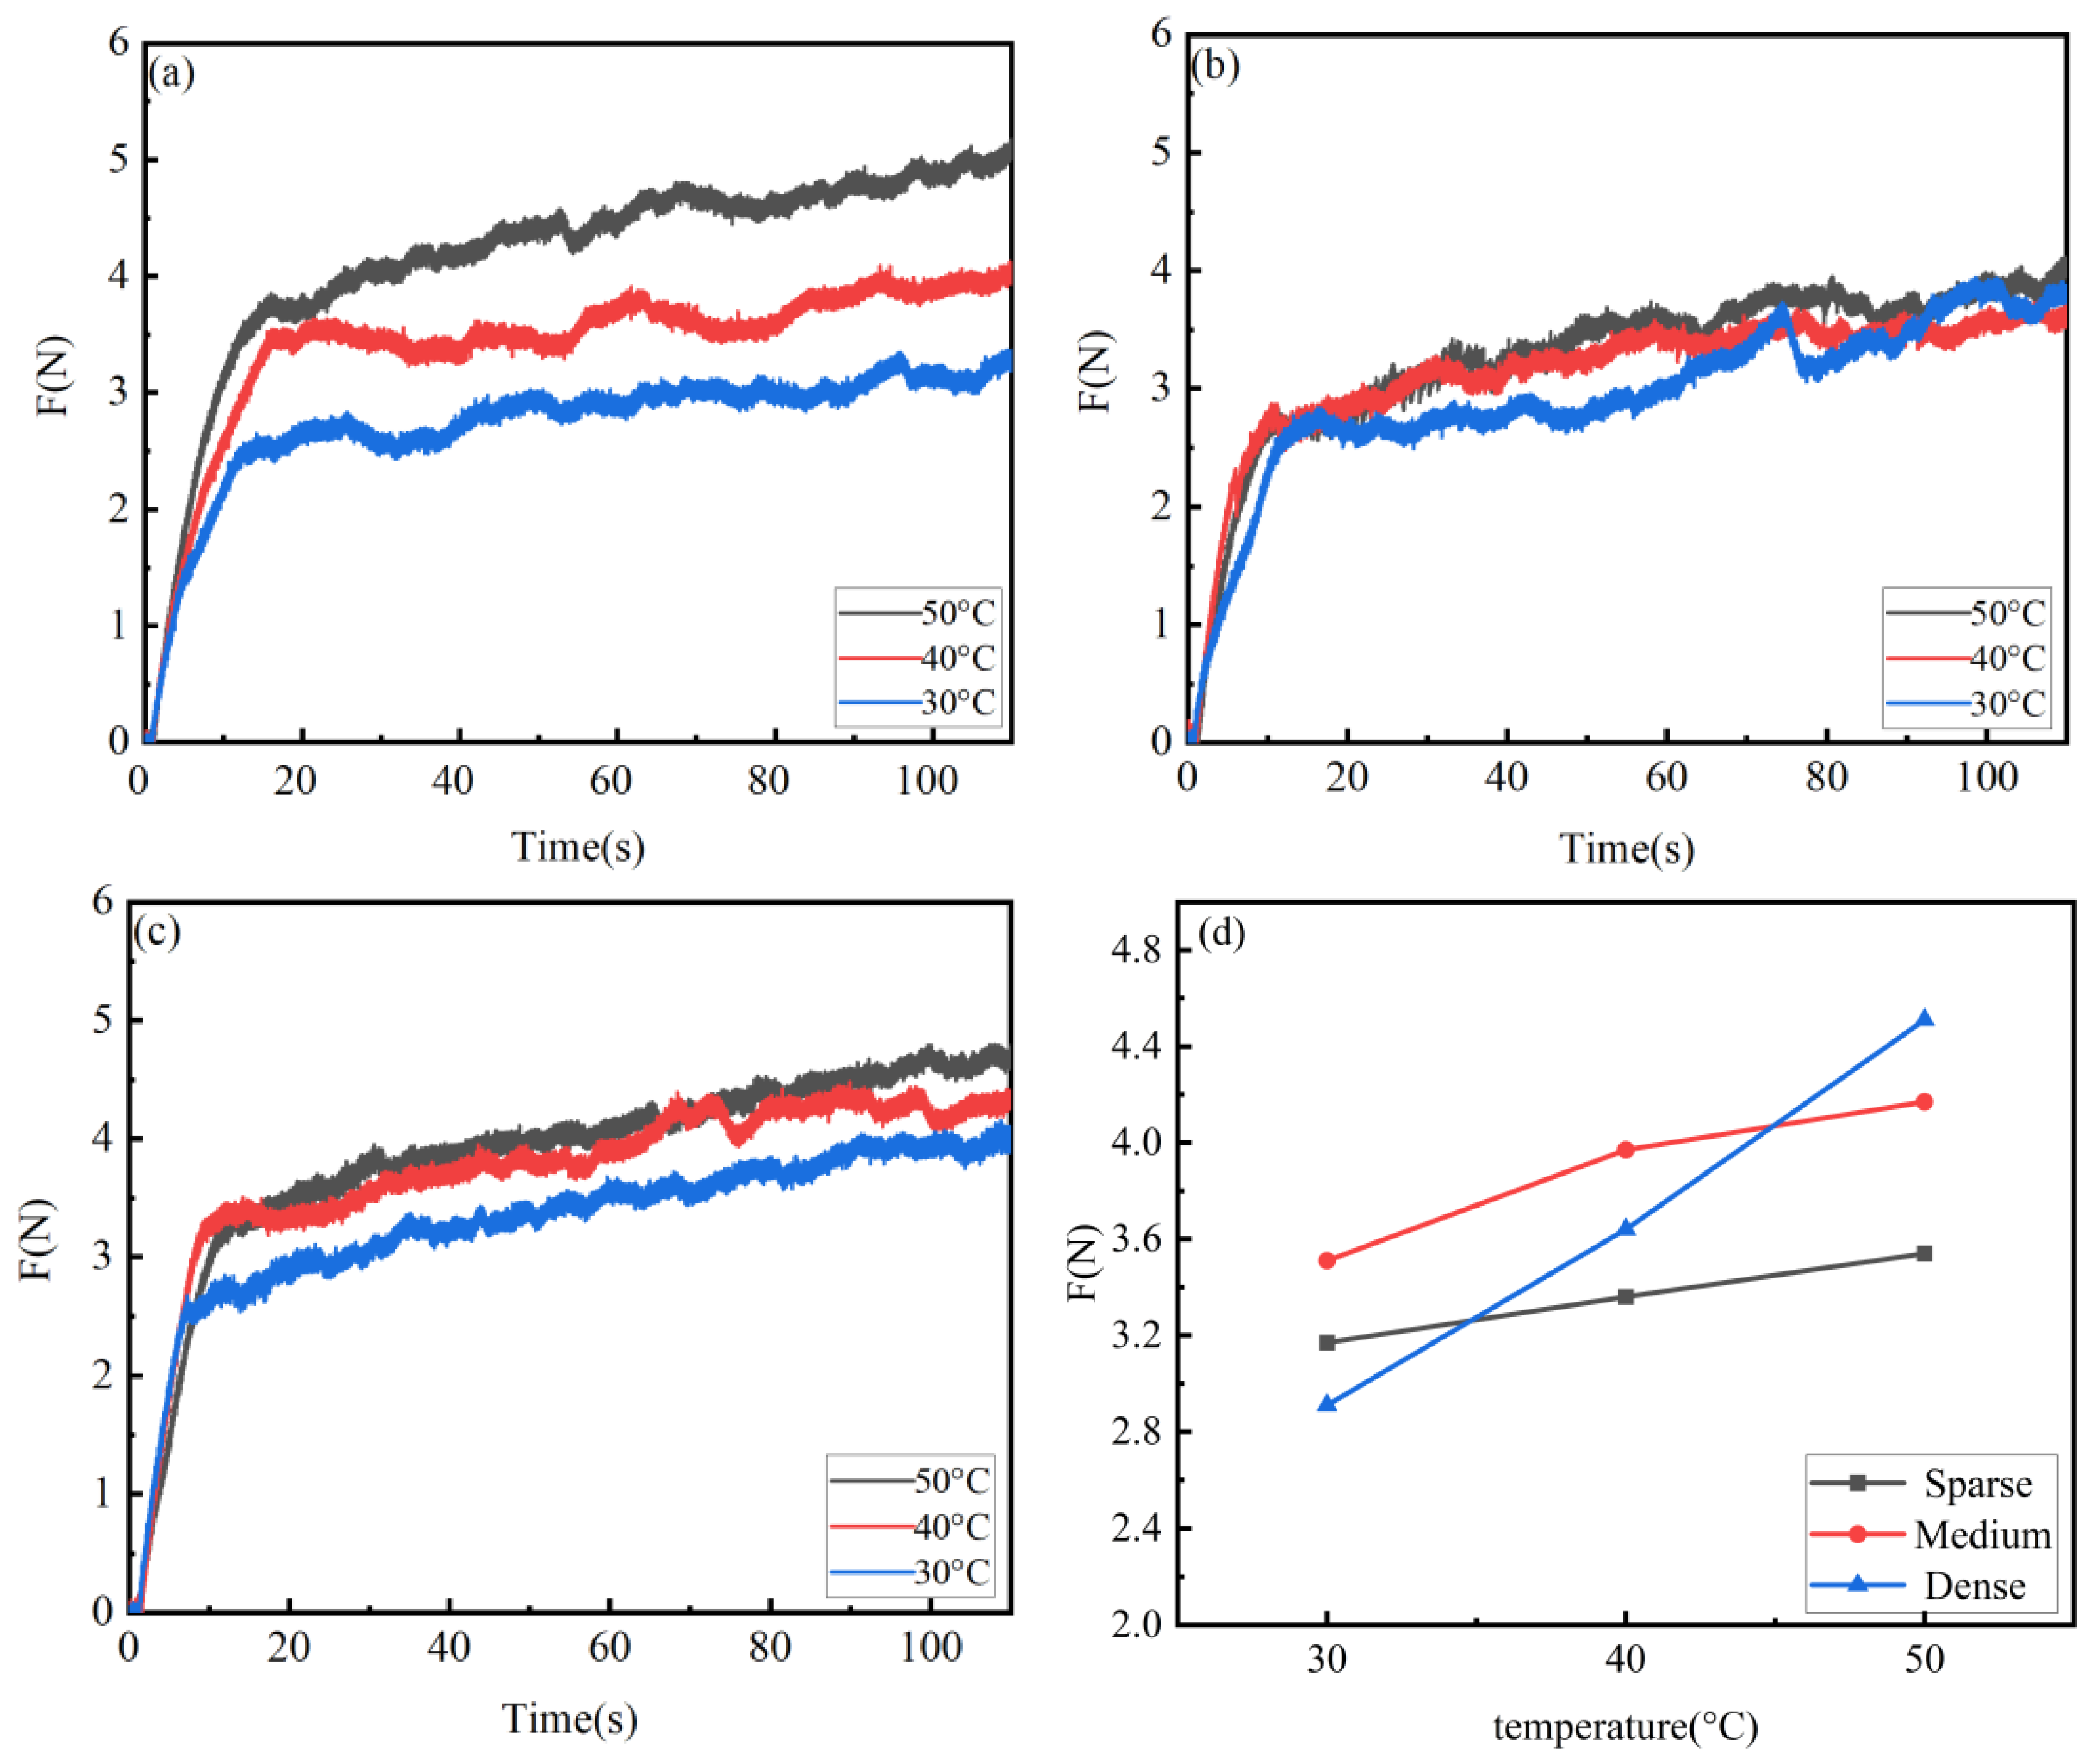
As a key environmental parameter affecting the rubber–pavement friction interface, the influence mechanism of temperature was systematically investigated through comparative tests. Under constant sliding speed (2 mm/min) and displacement (4 mm) conditions, the friction characteristics of the three pitting distribution patterns were tested, and the results are shown in Figure 5. As the temperature increased, the friction force generally exhibited an upward trend. The average friction forces of the sparse and medium distributions increased by 11.7% and 18.8%, respectively, while the dense distribution showed the most significant increase, reaching 55.0%. It can be observed that for the dense pitting distribution, the friction force increased markedly as the temperature rose from 30 °C to 50 °C, accompanied by a synchronous increase in vibration amplitude. Specific parameters are detailed in Table 4.
Figure 5.
Comparison of friction response curves under different temperatures: (a) dense distribution; (b) sparse distribution; (c) medium distribution; (d) average comparison.
Overall, elevated temperatures soften the asphalt, progressively enhancing the interfacial adhesion effect and shifting the friction mechanism from hysteresis-dominated to adhesion-dominated, with clear threshold behavior (around 30 °C). Once the asphalt surface temperature exceeds this threshold, the softened asphalt substantially increases the real contact area with the rubber, making adhesion the primary source of frictional resistance. The dense distribution, with its higher pit density, is likely to provide a larger real contact area than the sparse and moderate distributions, which would be consistent with a more pronounced adhesion contribution. Its average friction force increases by as much as 55%, whereas the sparse and medium distributions exhibit increases of only 11.7% and 18.8%, respectively. This result indicates that the superiority of the dense distribution at high temperatures is precisely due to the activation of the adhesion-dominated threshold effect, while at low temperatures, adhesion is weak and the differences among the distributions remain relatively insignificant. This mechanism provides a theoretical basis for the coupled design of temperature and surface texture. Nevertheless, the absolute friction values of the dense pattern at high temperatures should not be directly compared with those of the sparse or moderate patterns as quantitative design values, because the observed differences partly reflect specimen-to-specimen variability rather than purely texture effects. The relative ranking of temperature sensitivity is unaffected by such variability, and is further quantified in Section 5.4.
3.3. Effect of Cyclic Loading Frequency on Friction Performance
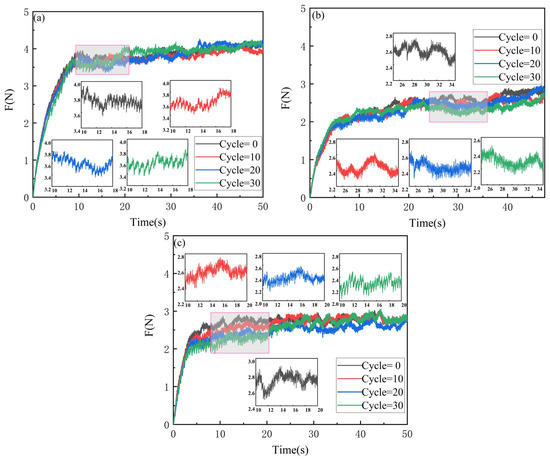
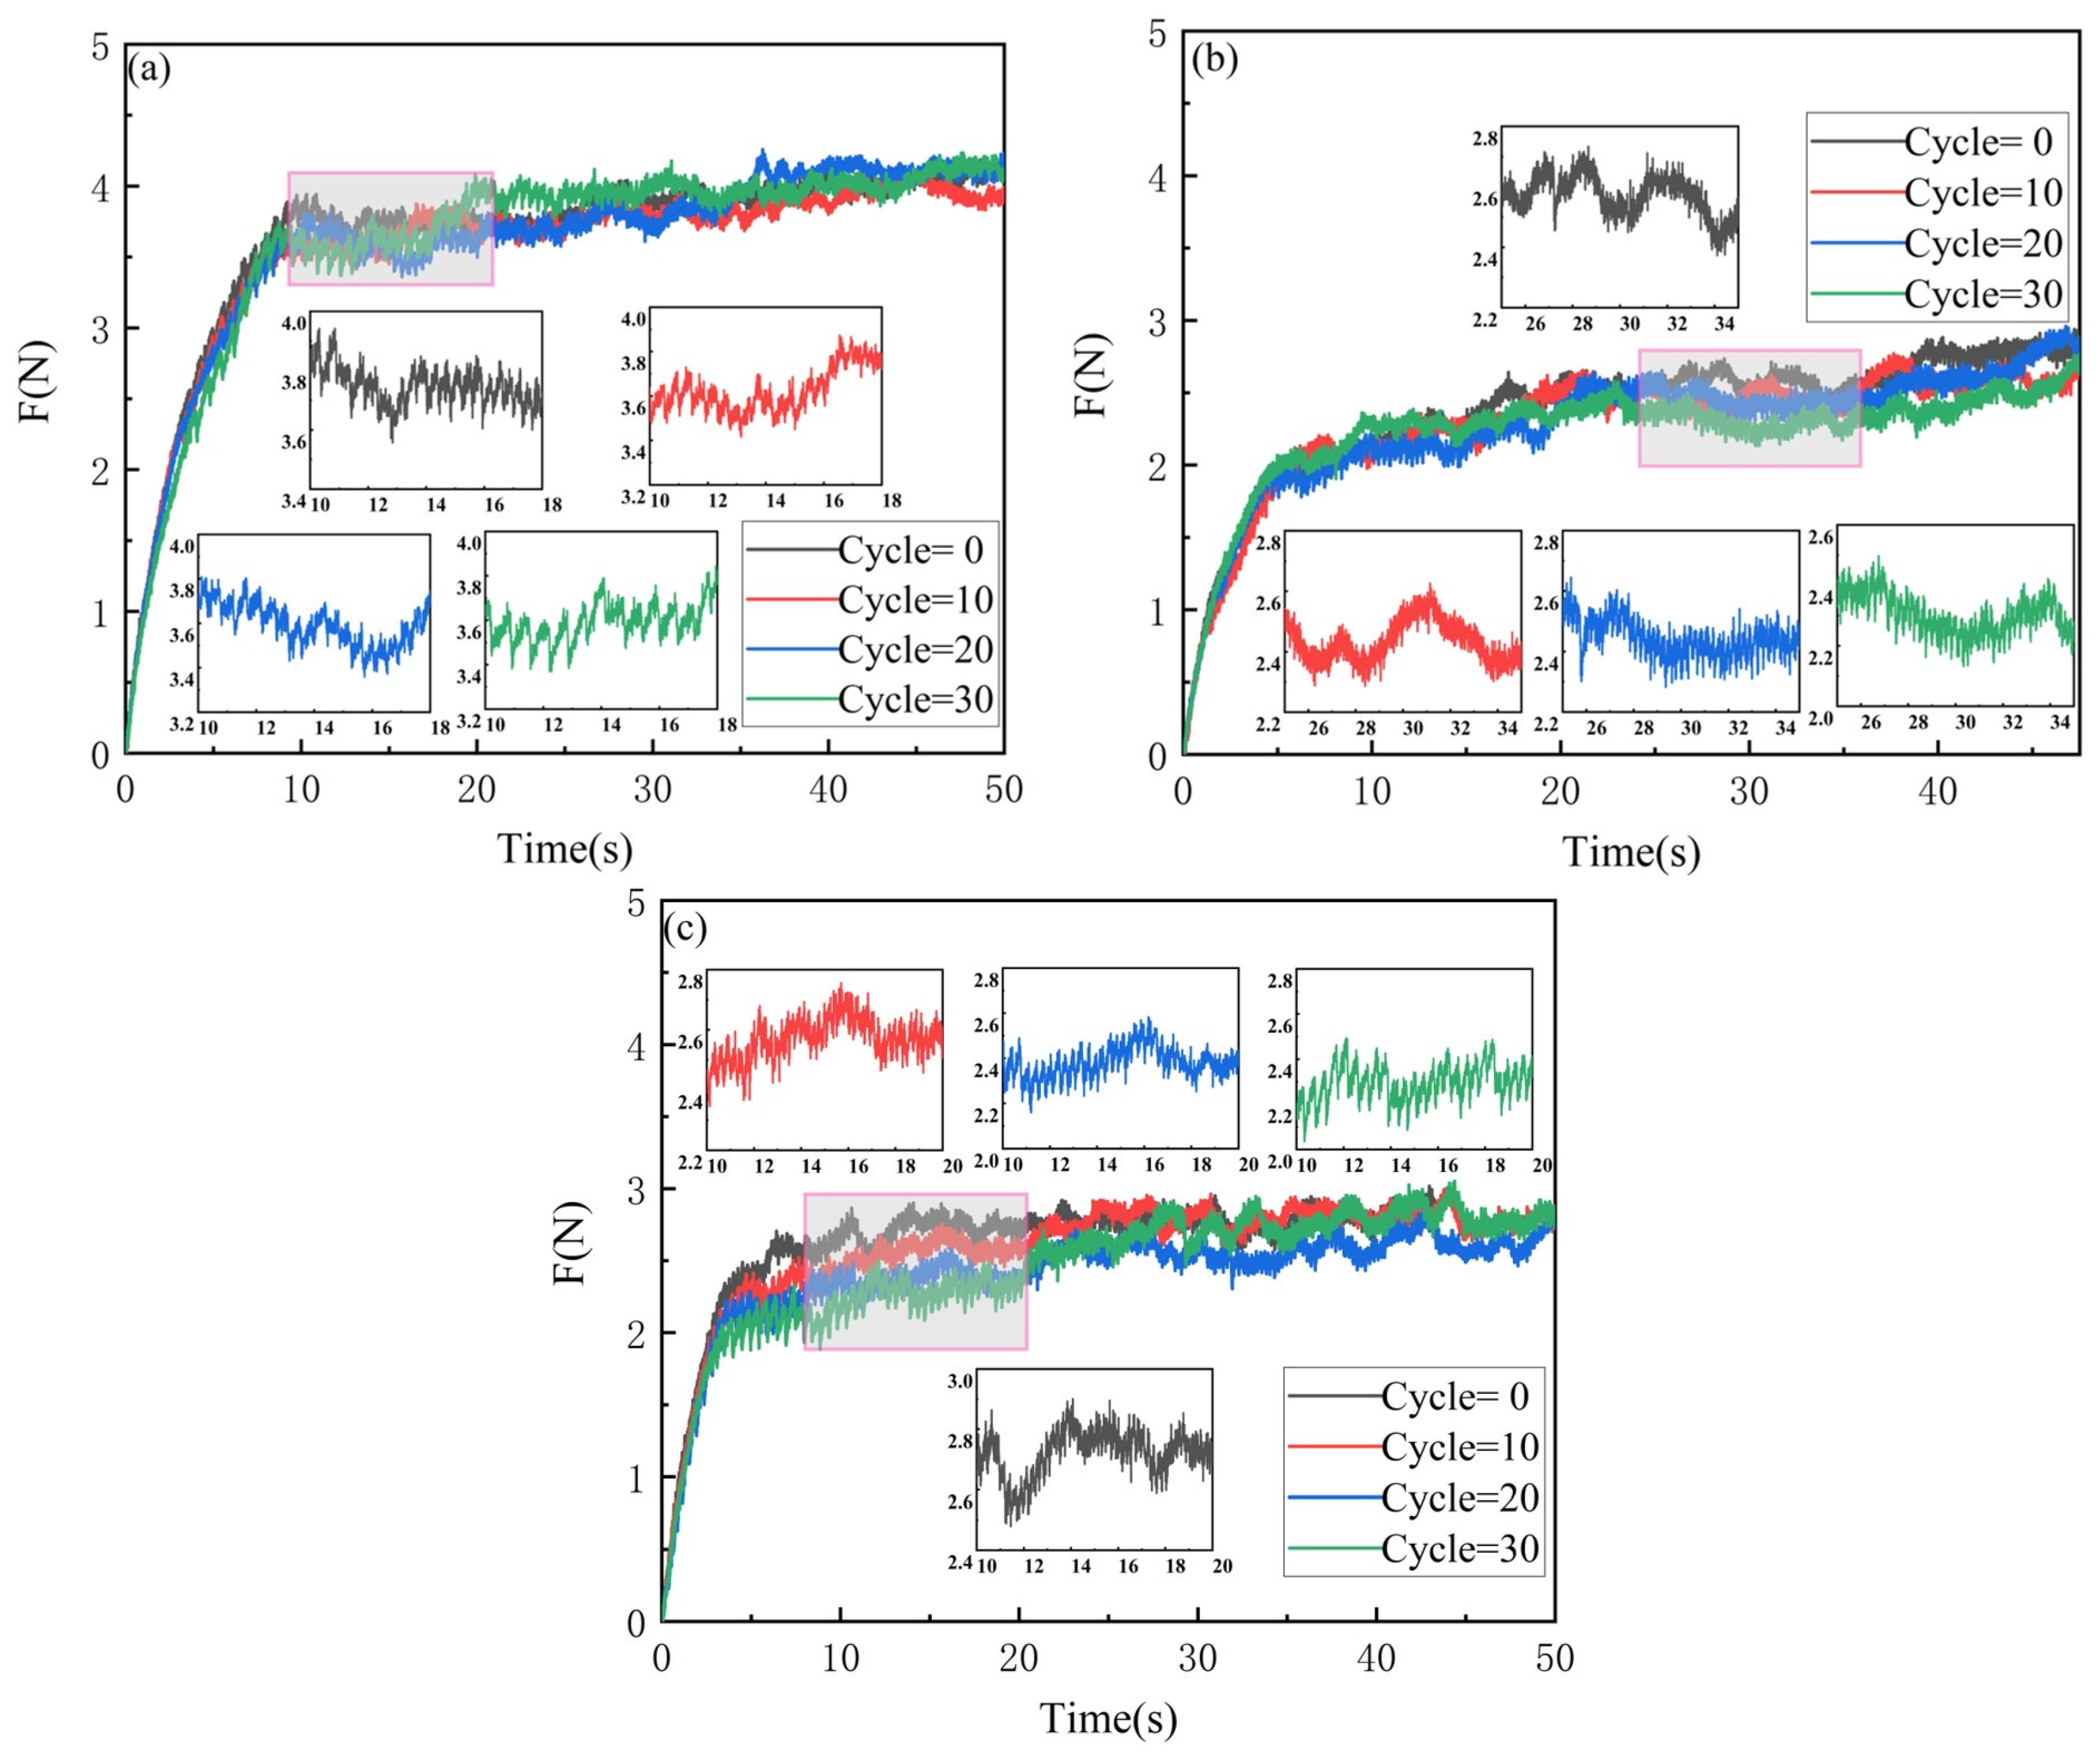
Under the experimental conditions of a constant sliding speed of 5 mm/min and a reciprocating stroke of 5 mm, and at an ambient temperature of 23 ± 2 °C, this study systematically analyzed the evolution of friction performance at the rubber–asphalt interface with increasing cycle numbers. Figure 6a–c respectively illustrates the dynamic responses and evolution characteristics of friction forces for sparse, medium, and dense pitting distribution patterns under cyclic loading.
Figure 6.
Comparison of friction fatigue characteristics under different pitting distribution patterns: (a) sparse distribution; (b) medium distribution; (c) dense distribution.
Based on the trend of friction force variation, the evolution process can be divided into three stages: the run-in stage (cycles 1–10), the stable stage (cycles 11–20), and the decline stage (cycles 21–30). During the run-in stage, the fluctuation amplitudes of the average friction forces for dense, medium, and sparse distributions were 2.2%, 3.6%, and 2.3%, respectively, with vibration amplitudes within the range of ±0.1–0.3 N. Upon entering the stable stage, the average friction forces of each distribution pattern showed no significant changes. In the decline stage, the average friction forces for the three distribution patterns decreased by 8.03%, 8.0%, and 4.1%, respectively, while the vibration amplitudes stabilized within a range of ±0.5 N. Overall, the friction force did not show a noticeable decrease in the first 10 cycles, after which it gradually declined. By the 30th cycle, all distribution patterns exhibited a significant downward trend in friction force. The characteristic parameters of friction force under different cycle numbers are detailed in Table 5, where the variation in vibration amplitude clearly characterizes the transition between friction stages and shows a significant correlation with friction force attenuation.
The degradation of friction performance primarily stems from the following three mechanisms: (1) changes in contact state due to wear on the rubber surface; (2) interface lubrication effects caused by debris accumulation; and (3) reduced elastic recovery capacity resulting from material fatigue. These findings apply to the specific cyclic loading protocol employed herein (30 cycles at 5 mm/min, ambient temperature) and characterize the short-term friction retention under those conditions; they do not by themselves establish long-term field durability, which would require substantially longer loading histories.
4. Microstructural Characterization
After the cyclic friction tests, a high-precision three-dimensional profilometer was used to accurately obtain the three-dimensional morphology and wear characteristics of the rubber slider surface. To prevent signal attenuation or distortion during measurement due to the non-conductive nature of the rubber material, the slider surface was coated with a thin layer of gold prior to testing. This treatment, by depositing a uniform metallic film, significantly enhanced the surface conductivity and reflectivity, thereby ensuring that the 3D profilometer could capture clear and stable morphological data. Ultimately, this enabled the quantitative analysis of surface profile, roughness, and damage patterns after friction.
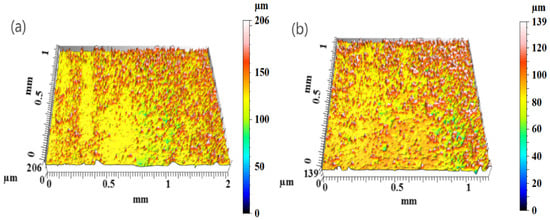
After 30 cycles of reciprocating friction tests, the surface morphology of the rubber slider was captured using a three-dimensional profilometer (Figure 7), and the roughness parameters were calculated. In general, when comparing the medium and dense pitting distributions, both the Sa and Ra are higher for the dense distribution (see Table 6). Under the medium pitting condition, the slider surface exhibits a continuous and relatively uniform wavy roughness; in contrast, the dense pitting transforms the surface into a high-frequency serrated morphology with finer and sharper alternating peaks and valleys. A direct comparison reveals that the dense distribution substantially increases the density of microscopic defects and intensifies local contour fluctuations, while the Ra is more sensitive to variations in peak-to-valley density. In terms of morphological evolution, the medium distribution produces a fairly regular undulating texture, whereas the dense distribution generates the most pronounced irregular roughness profile. Notably, under both distribution states, surface roughening is dominated by homogenized micro-grooves, without the formation of local deep pits or sharp undulations, which favors the maintenance of stable macro-texture under the present laboratory conditions.
Figure 7.
Microscopic morphology after 30 friction cycles under ambient temperature: (a) medium distribution; (b) dense distribution.
Table 6.
Parameter table of 3D profile of rubber slider.
5. Model Building and Analysis
5.1. Variable Definition and Model Specification
To quantify the coupled effects of pitting distribution pattern, sliding rate, and temperature on the average friction force, the average friction F (N) was taken as the dependent variable. As the distribution pattern is a categorical variable, it was encoded using dummy variables with the sparse pattern as the baseline: D1 = 1 for the medium pattern and D2 = 1 for the dense pattern (0 otherwise). The unified model is restricted to the initial state (N = 1), i.e., the rate series (Table 3) and the temperature series (Table 4), giving n = 21 observations. Cyclic degradation is analyzed separately in Section 5.4, because rate/temperature effects and wear evolution arise from different mechanisms and were measured in different test series. Tests in Table 3 were conducted at an ambient temperature of 23 °C.
The candidate model contained the main effects D1, D2, v, and T, the interactions D1·T, D2·T, and v·T, and the quadratic term v2, the last being included to accommodate the non-monotonic rate response observed for the sparse pattern in Section 3.1. Backward stepwise elimination (removal at p > 0.05) was applied.
5.2. Parameter Estimation and Simplified Model
Stepwise regression eliminated D1 and D1·T, indicating that at the present sample size, the medium pattern is not statistically separable from the sparse baseline within the unified model; its behavior is characterized by the segmented model in Section 5.4. All retained terms are significant at p < 0.05:
F = 0.477 − 1.789D2 + 0.941v + 0.137T + 0.047(D2·T) − 0.054(v·T) + 0.026v2.
Table 7 lists the estimates with standard errors and p-values.
Table 7.
Coefficient estimates of the unified model (n = 21).
Physical interpretation:
Density–temperature coupling. The positive interaction D2·T (+0.047 N/°C, p < 0.01) is the statistically robust element of this coupling: it shows that the friction of the dense pattern rises with temperature substantially faster than that of the sparse baseline, which is the quantitative expression of the temperature–adhesion positive-feedback mechanism identified in Section 3.2. Combined with the negative main effect of D2 (−1.789 N), the fitted model places the sparse–dense crossover at T* ≈ 38 °C, close to the temperature at which the dense pattern is experimentally observed to overtake the sparse one (40 °C, 3.64 N vs. 3.36 N, Table 4). As discussed in Section 5.6, however, T* depends on the difference in absolute friction level between specimens of different patterns and should therefore be regarded as indicative rather than as a calibrated design threshold.
Non-monotonic rate response. The combination of v, v2, and v·T gives ∂F/∂v = 0.941 − 0.054T + 0.052v. At ambient temperature, the model predicts friction to decrease with sliding rate up to roughly 6 mm/min and to rebound thereafter, reproducing the sparse-pattern rebound reported in Section 3.1, whereas at 50 °C, the predicted response monotonically decreases over the tested range. The negative v·T term (−0.054, p < 0.0001) thus expresses the increasing dominance of rate-induced softening as temperature rises.
5.3. Model Validation and Accuracy Evaluation
Goodness of fit and generalization were evaluated by leave-one-out cross-validation (LOOCV), in which each observation is predicted by a model fitted without it. The results are summarized in Table 8.
Table 8.
Goodness-of-fit and cross-validation metrics of the unified model.
The model accounts for 82.6% of the variance within the fitted sample and 64.6% under strict out-of-sample validation, with a cross-validated mean relative error of about 10%. Two representative conditions illustrate the out-of-sample behavior (LOOCV predictions, i.e., each point excluded from its own fit):
High-temperature dense condition (D2 = 1, T = 50 °C, v = 2 mm/min): predicted 4.34 N vs. measured 4.51 N, relative error 3.7%.
Low-speed sparse condition (v = 1 mm/min, ambient): predicted 3.18 N vs. measured 3.82 N, relative error 16.6%. This boundary point lies in the strongly adhesion-dominated stick regime at a very low sliding rate, which a polynomial rate term can only partly represent; predictions in this regime should be treated with caution. The considerable decrease from the fitted R2 (0.826) to the cross-validated Q2 (0.646) warrants particular comment. This drop is attributable primarily to two factors: first, the sample size (n = 21) is small relative to a model containing six terms, which makes the parameter estimates sensitive to individual observations; second, certain boundary conditions—particularly the low-speed sparse pattern at 1 mm/min and the high-temperature dense pattern at 50 °C—exert disproportionate leverage on the regression, so that excluding them in the LOOCV procedure markedly reduces the explanatory power. Despite this sensitivity, a cross-validated Q2 of 0.646 with a mean relative error of about 10% still indicates acceptable predictive capacity for an exploratory laboratory study. The model should nevertheless be read as a quantitative description of the observed mechanism-level trends within the tested parameter space, rather than as a robust predictive tool for absolute friction values under untested conditions.
It should be emphasized that the residual scatter quantified in Table 8 is within-specimen scatter: the regression is built on data measured on a single retained specimen per test series, and the metrics therefore describe how well the model reproduces the coupled rate–temperature–pattern response of those specimens. They do not incorporate specimen-to-specimen variability, which is addressed separately in Section 5.6. Accordingly, Equation (1) is intended as a quantitative description of mechanism-level trends rather than as a calibrated tool for absolute field prediction. Given the limited experimental data (n = 21) and the specimen-level variability discussed in Section 5.6, the model is not recommended for predicting absolute friction values under real-road conditions without further validation.
5.4. Segmented Regression Models and Comparative Analysis
Because the governing mechanisms differ among the three patterns, separate rate–temperature regressions F = β0 + βv·v + βT·T were fitted to the initial-state data of each pattern (Table 3 and Table 4, n = 7 each). The results are given in Table 9.
Table 9.
Comparison of segmented linear regression results for the three pitting patterns.
The temperature sensitivity increases monotonically from sparse (0.011 N/°C, p = 0.61) through medium (0.050 N/°C, p = 0.01) to dense (0.071 N/°C, p < 0.001), with a six-fold increase between the two extremes. Because each slope is obtained from measurements on one and the same specimen, it is unaffected by any constant offset between specimens; the ranking of temperature sensitivity is therefore the most robust quantitative result of this study and is fully consistent with the D2·T interaction of the unified model. The dense pattern is described almost exactly by the linear form (R2 = 0.987), indicating a clean adhesion-controlled response, whereas the poor linear fit for the sparse pattern (R2 = 0.113) reflects its non-monotonic rate behavior, which is better represented by the quadratic rate terms of Equation (1).
Cyclic degradation was quantified separately from the cyclic-loading series (Table 5) by fitting F = α0 + αNN for each pattern. To remove the influence of the differing absolute friction levels of the individual specimens, the decay rate is also expressed in normalized form, αN/F0 (Table 10).
Table 10.
Cyclic decay rates of average friction (Table 5 data).
On a normalized basis, the dense pattern degrades at approximately half the relative rate of the sparse and medium patterns (0.178% versus 0.349% and 0.343% per cycle) and shows the smallest total loss after 30 cycles. As this comparison is based on the relative change in each specimen with respect to its own initial value, it is insensitive to differences in absolute level between specimens, and the superior friction retention of the dense pattern can therefore be regarded as a reliable finding.
5.5. Model Application Recommendations
Within the scope defined above, the results support the following practical implications. It should be emphasized that these recommendations derive from laboratory-scale experiments and are intended for the relative comparison of texture strategies, not for absolute field friction prediction. First, the marked contrast in temperature sensitivity (0.071 N/°C for dense versus 0.011 N/°C for sparse) indicates that surfaces with densely distributed pitting-type texture retain, and indeed improve, their adhesion-dominated friction as pavement temperature rises, whereas sparse textures are comparatively temperature-insensitive; for pavements in hot regions or subject to prolonged high summer temperatures this contrast is the parameter of primary engineering interest. Second, the negative v·T interaction (−0.054) indicates that this temperature benefit is progressively offset at higher sliding speeds, so that high-speed sections should not rely on texture density alone. Third, the normalized cyclic decay rates of Table 10 provide a basis for the relative ranking of friction retention under the tested cyclic loading among the three patterns, and hence for prioritizing preventive maintenance. Given the specimen-level uncertainty quantified in Section 5.6, these recommendations should be applied as relative guidance for comparing texture strategies rather than as absolute predictions of field friction values.
5.6. Uncertainty from Specimen Variability and Limitations
Because the specimens were manually molded, residual differences in surface smoothness and flatness persisted even after the screening described in Section 2. Their magnitude can be quantified directly from the present dataset: for the dense pattern under nominally identical conditions (5 mm/min, ambient temperature, initial state), the two retained specimens gave average friction forces of 2.25 N (rate series, Table 3) and 3.88 N (cyclic series, Table 5), a difference of 1.63 N, corresponding to a coefficient of variation of about 38%. This between-specimen scatter is larger than any single effect quantified in this study, and it has three consequences that delimit the interpretation of the results.
Comparisons of absolute friction level between different patterns are confounded with specimen variability, since each pattern was realized on a different specimen. In particular, the difference in absolute friction between the sparse and dense patterns at low temperatures (1.17 N at 1 mm/min) is smaller than the observed between-specimen scatter (1.63 N), so it cannot be attributed unambiguously to the texture pattern. The crossover temperature T* ≈ 38 °C derived in Section 5.2, which depends on precisely this difference, is consequently indicative only and requires confirmation on a larger number of replicate specimens.
Comparisons based on relative measures are not affected, because a constant offset between specimens cancels when each specimen is referenced to its own baseline. This applies to the percentage increases in friction with temperature (55.0%, 18.8%, and 11.7% for dense, medium, and sparse respectively), to the temperature sensitivities of Table 9, and to the normalized cyclic decay rates of Table 10. The principal conclusions of this study rest on these relative quantities.
The residual scatter reported in Table 8 characterizes the model within the tested specimens only. Applied to a newly fabricated specimen or to a field surface, the prediction error would be dominated by specimen-level variability rather than by the model residual, and Equation (1) should not be used for absolute prediction without recalibration.
Accordingly, the analysis presented here establishes the mechanism and the relative ordering of the three pitting distribution patterns rather than absolute design values. Increasing the number of replicate specimens per pattern, improving the reproducibility of specimen fabrication, and reporting friction as a mean with confidence intervals over replicates are the principal directions for future work required to convert these relationships into quantitative design criteria.
6. Conclusions
Through systematic friction tests on SBS-modified asphalt specimens with three pitting distribution patterns under varying sliding rates, temperatures, and cyclic loading, the following main conclusions are drawn:
- (1)
- Pitting distribution density plays a dominant role in regulating interfacial friction response. As the temperature increased from 30 °C to 50 °C, the dense pattern exhibited the most significant increase in average friction force (55.0%), while the sparse and medium patterns showed increases of only 11.7% and 18.8%, respectively. This phenomenon is consistent with the larger effective contact area provided by dense pitting and enhanced adhesive effects after asphalt softening at elevated temperatures.
- (2)
- The influence of sliding rate on friction behavior varies notably among different pitting patterns. The sparse pattern exhibits a non-monotonic rate dependence, with friction decreasing in the low-to-medium speed range (1–5 mm/min) followed by a strengthening rebound at higher speeds, demonstrating the most complex rate sensitivity. In contrast, the dense pattern shows a continuous downward trend across the entire tested speed range with the smallest fluctuation, indicating the weakest rate sensitivity among the three patterns over the tested speed range.
- (3)
- Three-dimensional topography analysis reveals that wear morphology is pattern-dependent. The medium distribution produces a continuous and relatively uniform wavy roughness (Sa = 13.1 μm, Ra = 1.31 μm), whereas the dense distribution transforms the surface into a high-frequency serrated morphology with finer and sharper alternating peaks and valleys (Sa = 14.5 μm, Ra = 1.65 μm). The dense pattern significantly increases the density of microscopic defects and intensifies local contour fluctuations, with the linear roughness parameter Ra showing greater sensitivity to variations in peak-to-valley density. Despite these morphological differences, surface roughening under both patterns is dominated by homogenized micro-grooves rather than localized deep pits or sharp undulations, which favors the maintenance of stable macro-texture under the proposed laboratory conditions.
- (4)
- A unified regression model incorporating distribution dummy variables, sliding rate, temperature, and their interactions was established for the initial-state friction (R2 = 0.826, adjusted R2 = 0.767; leave-one-out cross-validated Q2 = 0.646; RMSE = 0.36 N; MRE ≈ 10%). The significant D2·T interaction (+0.047 N/°C, p < 0.01) quantifies the temperature–adhesion positive feedback of the dense pattern, and the segmented regressions show the temperature sensitivity increasing six-fold from sparse (0.011 N/°C) to dense (0.071 N/°C, R2 = 0.987). Normalized cyclic-decay analysis shows the dense pattern degrading at approximately half the relative rate of the other two patterns (0.178% versus 0.343–0.349% per cycle), confirming its superior friction retention under the tested cyclic loading. These relationships are established as relationships between texture, temperature, and friction rather than as absolute design values.
Author Contributions
Author Contributions: Conceptualization, X.H. and W.K.; methodology, G.L. and J.L.; software, W.K.; validation, Z.L., X.L. and Y.L. (Yingling Li); formal analysis, W.K. and X.H.; investigation, G.L., J.L., Z.L. and X.L.; resources, G.L. and X.H.; data curation, Y.L. (Yingling Li) and Y.L. (Yun Lin); writing-original draft preparation, G.L. and X.H.; writing—review and editing, X.H. and W.K.; visualization, Y.L. (Yun Lin); supervision, X.H. and W.K.; project administration, X.H.; funding acquisition, X.H. All authors have read and agreed to the published version of the manuscript.
Funding
This work was supported by the Key Research and Development Project of Qinghai Province (No. 2025-QY-229).
Data Availability Statement
The data presented in this study are available upon request from the corresponding author.
Conflicts of Interest
Authors Gang Li, Jiangang Li, Zhane Li, Xin Lu, Yingling Li and Yun Lin are employed by Qinghai Third Road and Bridge Construction Co., Ltd. The remaining authors declare no conflicts of interest.
References
- Cao, Y.X.; Sun, Y.Y. Evaluations approach to skid resistance performance of pavement based on tyre/road contact tress property. Intell. City 2021, 7, 9–12. [Google Scholar] [CrossRef]
- Gong, Z.L. Research on a Comprehensive Evaluation Method for Asphalt Pavement Skid Resistance Based on Tire–Pavement Contact Characteristics and Contaminant Influence; Tongfang Knowledge Network Technology Co., Ltd.: Beijing, China, 2025. [Google Scholar] [CrossRef]
- Liu, X.; Luo, H.; Chen, C.; Zhu, L.; Chen, S.; Ma, T.; Huang, X. A technical survey on mechanism and influence factors for asphalt pavement skid-resistance. Friction 2024, 12, 845–868. [Google Scholar] [CrossRef] [Scilit]
- Ma, Z.; Wang, H.; Zhang, Y.; Jelagin, D.; Hui, B. Study of the surface texture evolution and friction degradation in asphalt pavements during wear process. Wear 2025, 564–565, 205714. [Google Scholar] [CrossRef] [Scilit]
- Guo, W.; Xiao, X.; Ming, Y.; Tan, X.; Liu, Y. Directional evolution characteristics of asphalt pavement texture indicators and skid resistance performance under simulated accelerated polishing. Constr. Build. Mater. 2025, 505, 144658. [Google Scholar] [CrossRef] [Scilit]
- Yu, Y.; Wang, H.; Wang, H.; Chen, X.; Yang, J. Texture evolution and skid resistance in polymer-modified asphalt mixtures for runway pavements during wear process. Constr. Build. Mater. 2025, 498, 144037. [Google Scholar] [CrossRef] [Scilit]
- Kong, F.; Li, Y.; Wang, R.; Hu, X.; Yu, M.; Jin, D. Road Performance Evaluation of Preventive Maintenance Techniques for Asphalt Pavements. Lubricants 2025, 13, 410. [Google Scholar] [CrossRef] [Scilit]
- Zhang, X.; Wang, H.; Bennert, T. Tire polishing effects on rubber-texture contact and friction characteristics of different asphalt mixtures. Wear 2025, 582–583, 206328. [Google Scholar] [CrossRef] [Scilit]
- Du, Y.; Li, N.; Yang, M.; Shan, S.; Dou, H.; Chen, Y.; Liu, X. Temperature dependence of adhesive friction properties of rubber asphalt mortar and its mechanism of action. PLoS ONE 2025, 20, e0321059. [Google Scholar] [CrossRef] [Scilit] [PubMed]
- Yu, M.; You, Z.; Wu, G.; Kong, L.; Liu, C.; Gao, J. Measurement and modeling of skid resistance of asphalt pavement: A review. Constr. Build. Mater. 2020, 260, 119878. [Google Scholar] [CrossRef] [Scilit]
- Luo, Y.; Xu, Y.; Xu, Y.; Han, L.; Zhao, Y.; Yu, X. Temperature decoupling of asphalt pavement skid resistance degradation through tire-pavement contact model. Case Stud. Constr. Mater. 2026, 25, e06218. [Google Scholar] [CrossRef] [Scilit]
- He, Y.; Fan, Z.; Yang, X.; Wang, D.; Zhao, Z.; Lu, G.; Lv, S. Study on the influence of tire polishing on surface texture durability and skid resistance deterioration of asphalt pavement. Wear 2024, 556–557, 205518. [Google Scholar] [CrossRef] [Scilit]
- Tang, M.; He, X.; Liu, Z.; Lai, B.; Wang, B.; Zhan, Y. Non-contact detection technology of pavement skid resistance based on three-dimensional laser imaging. J. China Foreign Highw. 2023, 43, 44–50. [Google Scholar] [CrossRef]
- Weng, Y.; Sun, Z.; Liu, H.; Gu, Y. An Interpretable Method for Asphalt Pavement Skid Resistance Performance Evaluation Under Sand-Accumulated Conditions Based on Multi-Scale Fractals. Sensors 2025, 25, 2986. [Google Scholar] [CrossRef] [Scilit] [PubMed]
- Dai, G.; Luo, Z.; Chen, M.; Zhan, Y.; Ai, C. Reconstruction and Intelligent Evaluation of Three-Dimensional Texture of Stone Matrix Asphalt-13 Pavement for Skid Resistance. Lubricants 2023, 11, 535. [Google Scholar] [CrossRef] [Scilit]
- Shi, W.; Niu, D.; Li, Z.; Niu, Y. Effective contact texture region aware pavement skid resistance prediction via convolutional neural network. Comput.-Aided Civ. Infrastruct. Eng. 2023, 39, 2054–2070. [Google Scholar] [CrossRef] [Scilit]
- Peng, Y.; Wang, K.; Li, Q.J.; Yang, G.; Kong, L.; Zhu, H.; Li, Z.; Dai, X.; Li, Y.; Yang, B. Rubber-texture interface friction investigation based on FEM back-calculation and PCA-RF method. Constr. Build. Mater. 2025, 491, 142808. [Google Scholar] [CrossRef] [Scilit]
- Yang, L.; Tu, H.; Gong, H.; Wong, Y.D.; Li, H.; Zhou, B. μ-FINO: A friction-informed neural operator for cross-scale tire/road friction prediction using vehicle-mounted 3D lasers. Measurement 2026, 263, 120130. [Google Scholar] [CrossRef] [Scilit]
- Luo, Y.; Xu, Y.; Li, Y.; Wang, L.; Wang, H. The Effective Depth of Skid Resistance (EDSR): A Novel Approach to Detecting Skid Resistance in Asphalt Pavements. Materials 2025, 18, 1204. [Google Scholar] [CrossRef] [Scilit] [PubMed]
- Gao, L.; Din, Z.U.; Kim, K.; Senouci, A. Time Series Transformer-Based Modeling of Pavement Skid and Texture Deterioration. Constr. Mater. 2025, 5, 55. [Google Scholar] [CrossRef] [Scilit]
- Wan, X.; Yu, X.; Chen, M.; Ye, H.; Liu, Z.; Yu, Q. Prediction of Skid Resistance of Asphalt Pavements on Highways Based on Machine Learning: The Impact of Activation Functions and Optimizer Selection. Symmetry 2025, 17, 1708. [Google Scholar] [CrossRef] [Scilit]
- Khasawneh, M.A.; Mewada, H.; Rababah, S.; Nayeemuddin, M.; Khasawneh, A.A.; Alsheyab, M.A. Field Data–Driven Machine-Learning Approach for Estimating Pavement Skid Numbers from LWST Measurements for Improved Asphalt Pavement Safety. J. Transp. Eng. Part B Pavements 2026, 152, 04026020. [Google Scholar] [CrossRef] [Scilit]
- Chu, L.; Guo, W.; Fwa, T.F. Theoretical and practical engineering significance of British pendulum test. Int. J. Pavement Eng. 2020, 23, 1–8. [Google Scholar] [CrossRef] [Scilit]
- Hu, Y.; Sun, Z.; Pei, L.; Han, Y.; Li, W. Evaluate asphalt pavement frictional characteristics based on IGWO-NGBoost using 3D macro-texture data. Expert Syst. Appl. 2024, 242, 122786. [Google Scholar] [CrossRef] [Scilit]
- Zhong, J.; Jiang, X.; Cheng, Z.; Xie, S.; Huang, K.; Ma, Y.; Huang, B. Comprehensive evaluation framework for long-term pavement skid resistance and texture evolution. Case Stud. Constr. Mater. 2025, 23, e05474. [Google Scholar] [CrossRef] [Scilit]
- Guo, W.; Huang, K.; Xiong, J.; Jiang, R.; Ming, Y. Determination of pavement texture parameters for Persson’s friction theory based on wear evolution considerations. Tribol. Int. 2026, 214, 111215. [Google Scholar] [CrossRef] [Scilit]
- Zhong, J.; Zhang, J.; Cheng, Z.; Xie, S.; Huang, K.; Ma, Y.; Huang, B. Texture-image coupled fusion analysis for pavement skid resistance measurement. Measurement 2025, 256, 118272. [Google Scholar] [CrossRef] [Scilit]
- Weng, Z.; Leng, Z.; Du, Y.; Liu, C.; Zhang, X.; Li, D.; He, Y. Leveraging tabular prior-data fitted networks for accurate pavement friction coefficient prediction from 3D texture features. Tribol. Int. 2026, 218, 111794. [Google Scholar] [CrossRef] [Scilit]
- Xu, H.; Prozzi, J.A. Friction Performance Models for Network-Level Pavement Friction Management. Transp. Res. Rec. 2026, 2680, 602–612. [Google Scholar] [CrossRef] [Scilit]
- Yun, D.; Hu, L.; Sandberg, U.; Tang, C. Skid resistance performance and texture lateral distribution within the lanes of asphalt pavements. J. Traffic Transp. Eng. (Engl. Ed.) 2025, 12, 87–107. [Google Scholar] [CrossRef] [Scilit]

Disclaimer/Publisher’s Note: The statements, opinions and data contained in all publications are solely those of the individual author(s) and contributor(s) and not of MDPI and/or the editor(s). MDPI and/or the editor(s) disclaim responsibility for any injury to people or property resulting from any ideas, methods, instructions or products referred to in the content. |
© 2026 by the authors. Licensee MDPI, Basel, Switzerland. This article is an open access article distributed under the terms and conditions of the Creative Commons Attribution (CC BY) license.