


Abstract
Windage power losses (WPLs) can take a noticeable toll on the efficiency of high-speed gear transmissions, especially in helical gears, where complex 3D airflow patterns increase aerodynamic drag. In this work, we measured the WPL of a helical gear using a combination of analytical models, experiments, and CFD simulations. A custom test rig recorded windage losses at four speeds—2000, 3000, 4000, and 5000 rpm—producing values between 1.33 W and 21.67 W. We then compared these results with predictions from commonly used analytical methods (Dawson, Lord, ISO/TR 13593, ANSI/AGMA 6011-I03). These models showed discrepancies of about 25–35%, largely because they were not developed with helical gear geometries in mind. To complement this, CFD simulations carried out in SolidWorks Flow Simulation closely matched the experimental data, with an average deviation of just 4.99%. The combined results highlight the dominant mechanisms contributing to windage losses, assess the accuracy and limitations of each method, and identify the operating regimes where discrepancies are most pronounced. The findings offer a validated framework for predicting windage losses in industrial helical gears and support the development of more efficient gearbox designs.
1. Introduction
Improving the energy efficiency of industrial machinery has become a central objective across manufacturing, power generation, and processing sectors. Within this context, gear transmissions remain indispensable due to their reliability, load-carrying capacity, and adaptability to diverse operating conditions. As efficiency targets tighten and operating speeds increase, secondary loss mechanisms that were once considered negligible have gained new relevance. While load-dependent power losses—such as those arising from tooth meshing friction and bearing resistance—have been extensively studied and optimized, load-independent losses remain less well understood despite their growing significance in modern high-speed, lightweight transmission designs [1,2].
Among load-independent losses, windage power losses (WPLs) have emerged as a particularly important phenomenon in enclosed gear transmissions. Windage refers to the aerodynamic drag and momentum transfer experienced by rotating gear bodies as they interact with the surrounding fluid medium—typically air or an air–oil mixture in partially lubricated gearboxes [3,4]. Unlike churning losses that arise from oil immersion, windage occurs even in nominally “dry” or lightly lubricated environments and scales strongly with rotational speed, making it a dominant loss mechanism in high-speed applications such as aircraft auxiliary gearboxes, electric vehicle transmissions, and high-performance industrial drives [5,6].
For helical gears, which are widely preferred over spur gears due to their superior load capacity, smooth engagement, and reduced noise characteristics, windage losses present unique modeling challenges. The helical tooth geometry introduces complex three-dimensional flow patterns, axial flow components, and inter-tooth fluid exchange mechanisms that are not captured by classical windage correlations originally developed for simpler spur or cylindrical disk geometries [7,8]. Consequently, the design community lacks reliable, physics-based prediction tools that can accurately quantify WPL for helical gears across the full range of geometric parameters (helix angle, face width, module) and operating conditions (speed, enclosure configuration, fluid properties) encountered in modern transmission systems. Traditional analytical models often rely on simplifying assumptions that limit their applicability across the broad range of speeds, lubrication regimes, and enclosure configurations found in industrial gear units. Experimental studies, while essential for validation, are influenced by test-rig design, measurement uncertainty, and the difficulty of isolating windage from other loss mechanisms. Numerical simulations, especially those based on computational fluid dynamics [9,10,11], offer detailed insight into local flow structures but require careful calibration and substantial computational resources to ensure realistic representation of industrial operating conditions.
These limitations highlight the need for an integrated approach that combines the strengths of analytical, experimental, and numerical methods. Such an approach enables both a deeper understanding of the physical mechanisms governing windage losses and the development of predictive tools that can be applied confidently in engineering practice. This is particularly important for general industrial gear systems, where design decisions must balance performance, cost, durability, and maintainability.
In recent years, windage losses have drawn increasing attention as high-speed transmission systems continue to evolve in fields such as electric mobility, aerospace, robotics, and advanced industrial machinery. Today’s gearboxes run faster and are expected to meet stricter efficiency and thermal requirements, which makes aerodynamic losses a much more noticeable part of the overall no-load power consumption. This issue is especially relevant for helical gears, where the helix angle creates complex three-dimensional airflows that intensify axial pumping and inter-tooth recirculation, leading to higher windage than in spur gears. Altogether, these developments make clear that windage research remains highly relevant, driven by both industrial demands and the growing capability of modern computational and experimental methods to address unresolved aerodynamic challenges in gear transmissions.
This manuscript addresses this need by quantifying the windage power losses of a helical gear through a coordinated analytical, experimental, and numerical investigation. By combining these three approaches, a more robust and comprehensive understanding of gear windage behavior can be achieved. This integrated strategy is essential for developing accurate prediction tools and guiding the design of high-efficiency gear transmissions where aerodynamic losses play an increasingly important role. For this purpose, the study evaluates different analytical formulations tailored to helical gear geometry, conducts controlled experiments to measure windage losses under representative industrial conditions, and performs high-fidelity numerical simulations to resolve the complex flow patterns around the rotating gear. By synthesizing results across these complementary approaches, the work provides a validated and comprehensive understanding of windage loss mechanisms and offers practical guidance for improving prediction accuracy and reducing aerodynamic losses in industrial gear transmissions.
2. State of the Art in Prediction of Gear Windage Power Loss
2.1. Analytical and Empirical Models
Analytical prediction of WPL has historically relied on empirical correlations derived from dimensional analysis and curve-fitting to experimental data for idealized geometries. A classical formulation, such as that proposed by Dawson [12], treats the rotating gear as an equivalent smooth disk and applies boundary-layer drag theory to estimate torque and power dissipation [13,14]. Thus, the windage power losses by the teeth for a gear rotating in air with no enclosure can be estimated by:
where:
Pw = n2.9 · Da2.9 · b0.75 · mn1.15 · 10−17 · [W],
- n [rpm]—rotational speed of the gear;
- Da [mm]—root diameter;
- b [mm]—gear face width;
- mn [mm]—gear normal module.
A similar formula was proposed by Lord [15] for gears with a module ranging from 1 to 4 mm:
where:
Pw = 2.9 · ρ · ω3 · r3.51mn1.06 · b−0.42 · [W],
- ρ [kg/m3]—air density;
- ω [rad/s]—angular velocity;
- r [m]—gear pitch radius.
The analytical/empirical models proposed by Dawson and Lord rely on simplified boundary-layer drag assumptions. Both models capture the dominant speed-dependent aerodynamic drag but neglect the axial flow components and three-dimensional vortical structures characteristic of helical gears. As a result, they tend to less accurately predict windage losses when applied to helical geometries.
The standards ISO/TR 13593: 1999 [16] and ANSI/AGMA 6011-I03 [17] recommend the same equation for calculation of WPL:
where:
- d [mm]—gear pitch diameter;
- n [rpm]—gear speed;
- b [mm]—gear face width;
- mn [mm]—gear normal modulus
- β [°]—gear helix angle;
- A—empirical arrangement constant.
ANSI/AGMA 6011-I03 mentions A values between 1000 and 4000, without providing a selection method, therefore producing very different results. Despite this, ISO/TR 13593: 1999 provides an accurate equation to calculate the arrangement constant as follows:
where μ [Pa·s] is the air viscosity.
As observed, the ISO/TR 13593 and ANSI/AGMA 6011 standards introduce a more engineering-oriented formulation that includes the helix angle. This provides a first-order correction for helical gears, but the accuracy of the method depends strongly on the empirical arrangement constant A. The AGMA standard specifies a broad range for A, while ISO proposes a viscosity-based expression, leading to substantial variability in predicted losses. These models may overpredict or underpredict windage depending on the chosen constant and enclosure configuration.
More recent studies [7,18] have demonstrated that helical gears exhibit markedly different windage behavior compared to spur gears or discs due to the presence of axial flow components induced by the helix. Thus, Voeltzel et al. [7] showed through both experimental and numerical investigations that helix angle and face width significantly influence windage magnitude, with classical correlations underestimating losses for helical geometries by up to 30% in some configurations. Attempts to extend analytical models to helical gears have introduced correction factors for helix angle and tooth geometry [19], but these adaptations remain semi-empirical and require calibration against experimental or computational datasets, limiting their generalizability.
Recently, Yang and Lin [20] proposed a novel semi-analytical method for double-helical gears that decomposes the windage problem into inter-tooth flow estimation and single-tooth torque calculation. Their approach, validated against both experimental measurements and CFD simulations, demonstrated improved accuracy over classical correlations while maintaining computational efficiency suitable for design iteration. However, even this advanced analytical framework requires input data (such as inter-tooth flow rates) that must be obtained from experiments or CFD, underscoring the inherent limitations of purely analytical approaches for complex helical geometries.
2.2. Experimental Measurement Techniques
Experimental characterization of windage losses provides the essential ground truth for model validation and has been pursued through various test configurations. The most common approach involves mounting a gear specimen on a driven shaft instrumented with torque and speed sensors, then measuring the resistive torque under controlled environmental conditions (air temperature, pressure, enclosure geometry) [21,22]. To isolate windage effects from other loss mechanisms, researchers typically compare measurements for geared specimens against equivalent smooth discs with a matched outer diameter and face width, thereby separating the contribution of tooth geometry to aerodynamic drag [23,24].
Handschuh et al. [24] conducted systematic windage and churning tests on both gears and discs, varying rotational speed and oil immersion depth. Their results demonstrated that gear teeth produce substantially higher windage losses than equivalent discs due to enhanced flow separation, vortex shedding, and increased wetted surface area—effects that are particularly pronounced for helical gears where the helix angle further complicates the flow field. Similarly, parametric experimental studies have explored the influence of helix angle, module, face width, and enclosure clearance on windage magnitude [7,25], providing valuable datasets for model calibration and revealing trends that challenge the assumptions underlying classical correlations.
Despite their value, experimental campaigns face inherent limitations. Test facilities are costly to construct and operate, and the range of geometric and operating parameters that can be explored is practically constrained by specimen fabrication costs, instrumentation capabilities, and test rig flexibility. As a result, published experimental datasets typically cover only a small fraction of the design space, leaving significant regions unexplored and hindering the development of broadly applicable predictive models.
2.3. Computational Fluid Dynamics (CFD) Approaches
Computational fluid dynamics has emerged as a powerful complementary tool for windage prediction, offering the ability to resolve detailed three-dimensional flow fields around complex gear geometries and within realistic enclosure configurations [26,27,28]. CFD studies have provided fundamental insights into the physics of gear windage, revealing mechanisms such as inter-tooth recirculation zones, axial pumping flows in helical gears, expelled volumetric flow from gear peripheries, and the influence of shroud clearances and baffle placement on loss magnitude [7,29,30].
Voeltzel et al. [18] employed CFD to investigate windage in helical gears and confirmed that helix angle substantially alters the flow structure compared to spur gears, producing axial flow components that affect both the expelled air volume and the local pressure distribution on tooth flanks. Their simulations, validated against experimental torque measurements, demonstrated that CFD can capture geometric sensitivities missed by analytical models, making it a valuable tool for design optimization and for deriving empirical corrections to simpler formulations.
More recently, CFD has been applied to explore the influence of enclosure features on windage losses. Studies of baffle arrangements in helical geared transmissions [30] have shown that strategic placement of flow-directing elements can reduce windage by up to 20% by minimizing recirculation and expelled flow resistance. These findings underscore the importance of considering not only gear geometry but also the surrounding fluid domain and boundary conditions—factors that are difficult to incorporate systematically into analytical models.
However, CFD is not without limitations. High-fidelity simulations of rotating gears require fine spatial discretization, transient solution of the flow field, and appropriate turbulence modeling, resulting in significant computational expense. A single operating point may require hours to days of computation on modern workstations, rendering parametric exploration or design optimization via CFD alone impractical for most engineering applications. Furthermore, CFD results are sensitive to modeling choices (mesh resolution, turbulence closure, boundary conditions), and validation against experimental data remains essential to ensure prediction accuracy.
2.4. Research Gaps and Need for an Integrated Approach
The preceding review reveals a fundamental tension in the current state of windage loss prediction: analytical models are fast and design-friendly but lack the fidelity to capture helical gear physics accurately; experimental measurements provide reliable data but are expensive and limited in parametric scope; CFD offers detailed mechanistic insight but is computationally prohibitive for routine design use. Each method, when applied in isolation, leaves critical questions unanswered or trades accuracy for practicality.
Thus, several specific gaps persist in the literature:
- (a)
- Limited validation of analytical models for helical geometries: Most empirical correlations remain calibrated primarily for spur gears or discs, with helical-specific adaptations validated only for narrow ranges of helix angle and face width [7,19].
- (b)
- Insufficient experimental datasets: Published experimental studies, while valuable, typically explore only a few geometric configurations, leaving large portions of the design space (e.g., extreme helix angles, wide face gears, novel enclosure geometries) uncharted [24,25].
- (c)
- Lack of mechanistic understanding: The fundamental fluid mechanics governing inter-tooth flows, axial pumping, and their dependence on helix angle remain incompletely understood, hindering the development of physics-based (rather than purely empirical) analytical models [20,29].
- (d)
- Computational bottlenecks: While CFD can predict windage accurately, its computational cost restricts its use to validation or targeted parametric studies rather than broad design exploration or real-time optimization [26,28,31].
These shortcomings motivate an integrated analytical–experimental–numerical approach in which the strengths of each method are leveraged synergistically. Specifically, experiments can provide benchmark validation data and reveal parametric trends; CFD can resolve the detailed physics and fill gaps in experimental datasets by exploring configurations that are difficult or expensive to test physically; and analytical models—informed and calibrated by experimental and CFD data—can enable rapid, reliable predictions for routine design and optimization tasks. Recent literature explicitly calls for such integrated workflows [7,20,30], yet few studies have systematically implemented and demonstrated this methodology for helical gear windage.
3. Materials and Methods
3.1. Test Stand and Experimental Measurements
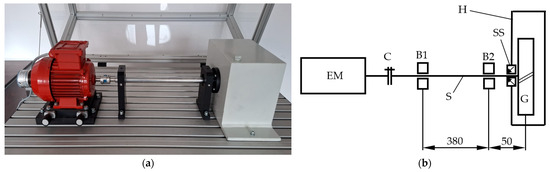
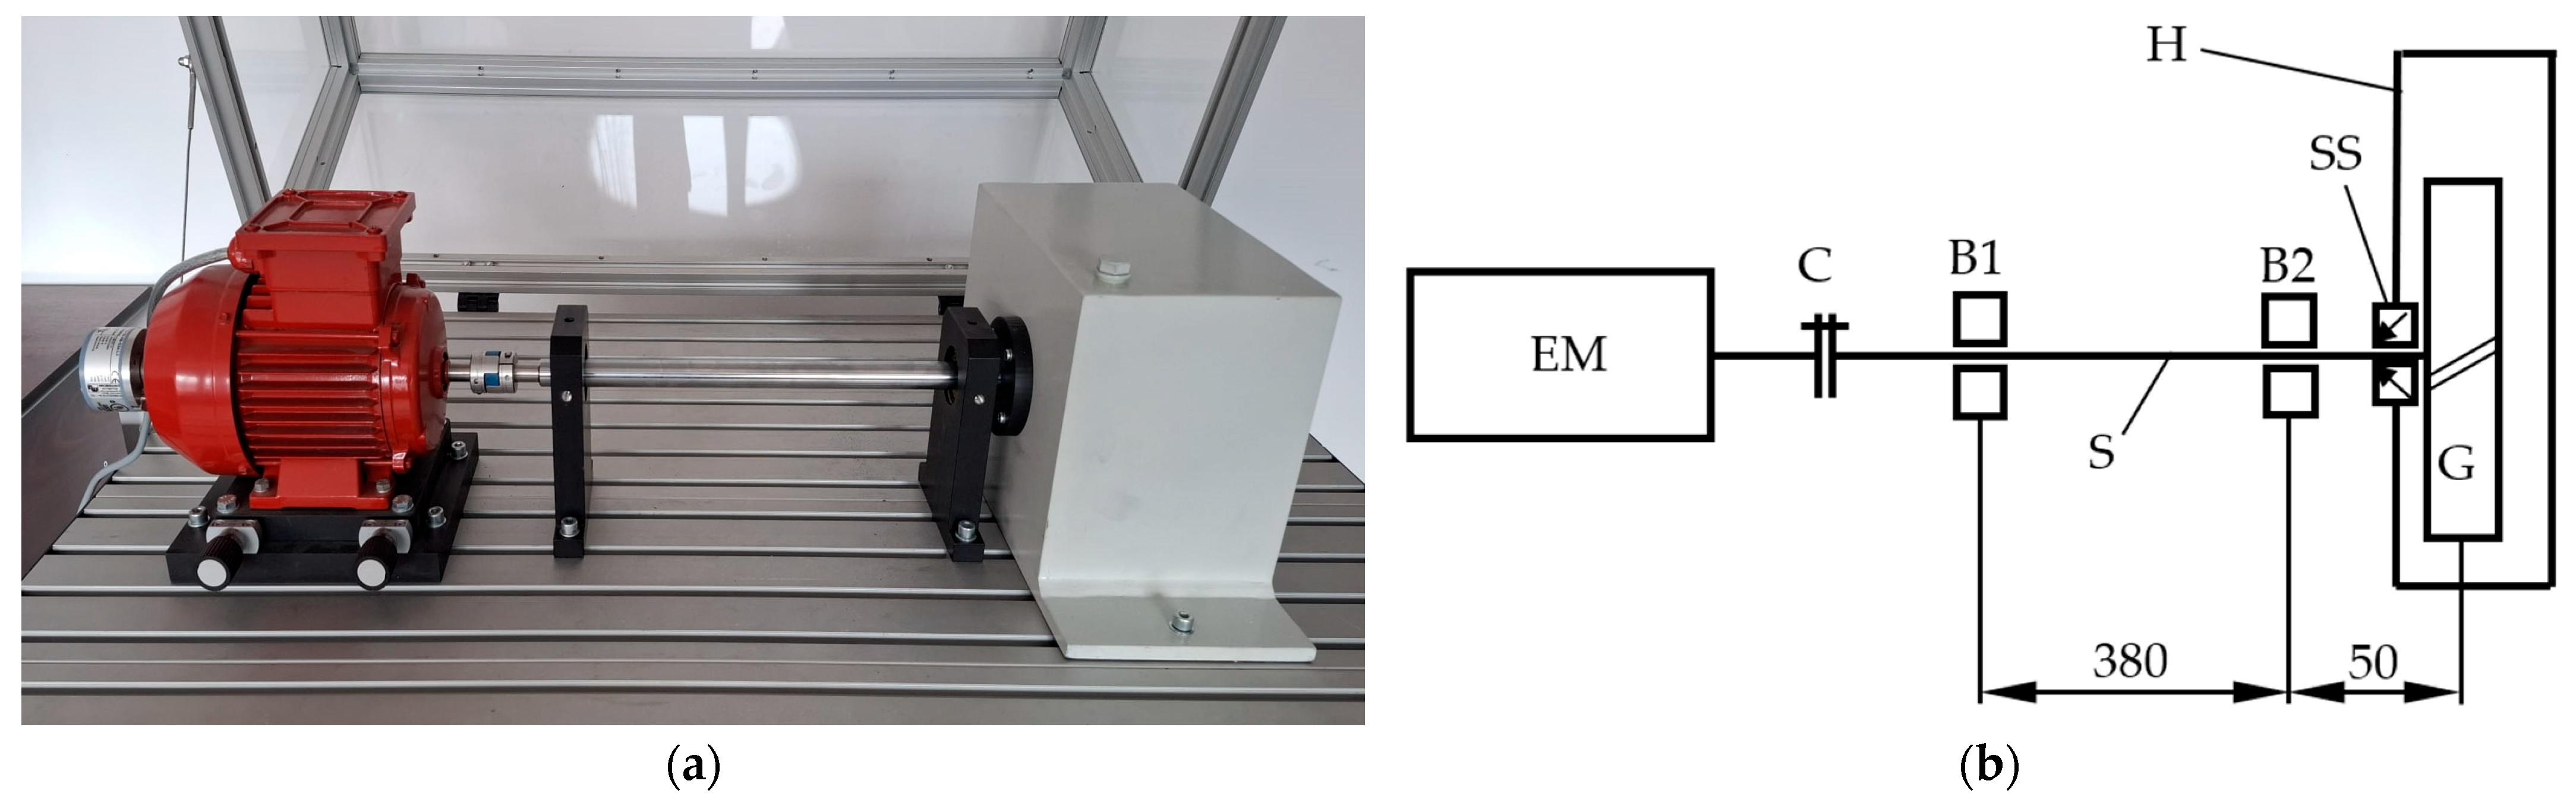
For the experimental measurement of the WPL of a helical gear, the test stand shown in Figure 1 was used. The experimental setup includes following main components:
Figure 1.
Test stand for WPL measurement of gears: (a) general view; (b) schematic view.
- -
- an electric motor (EM) with variable speed adjustment;
- -
- 2 bearing blocks;
- -
- a shaft (S) supported by ball bearings (B1 and B2) located inside the bearing blocks;
- -
- a claw coupling (C) to connect the electric motor with the shaft;
- -
- a helical gear (G) assembled on the other end of the shaft;
- -
- a parallelepiped housing (H) made of steel;
- -
- a shaft seal (SS) assembled in the (black) cover mounted on the housing.
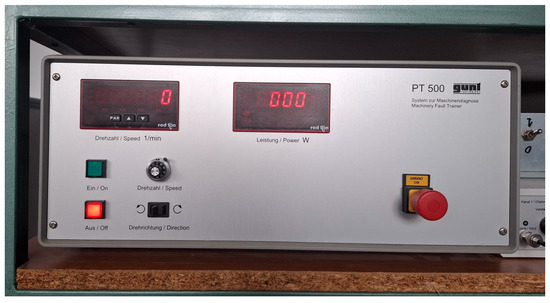
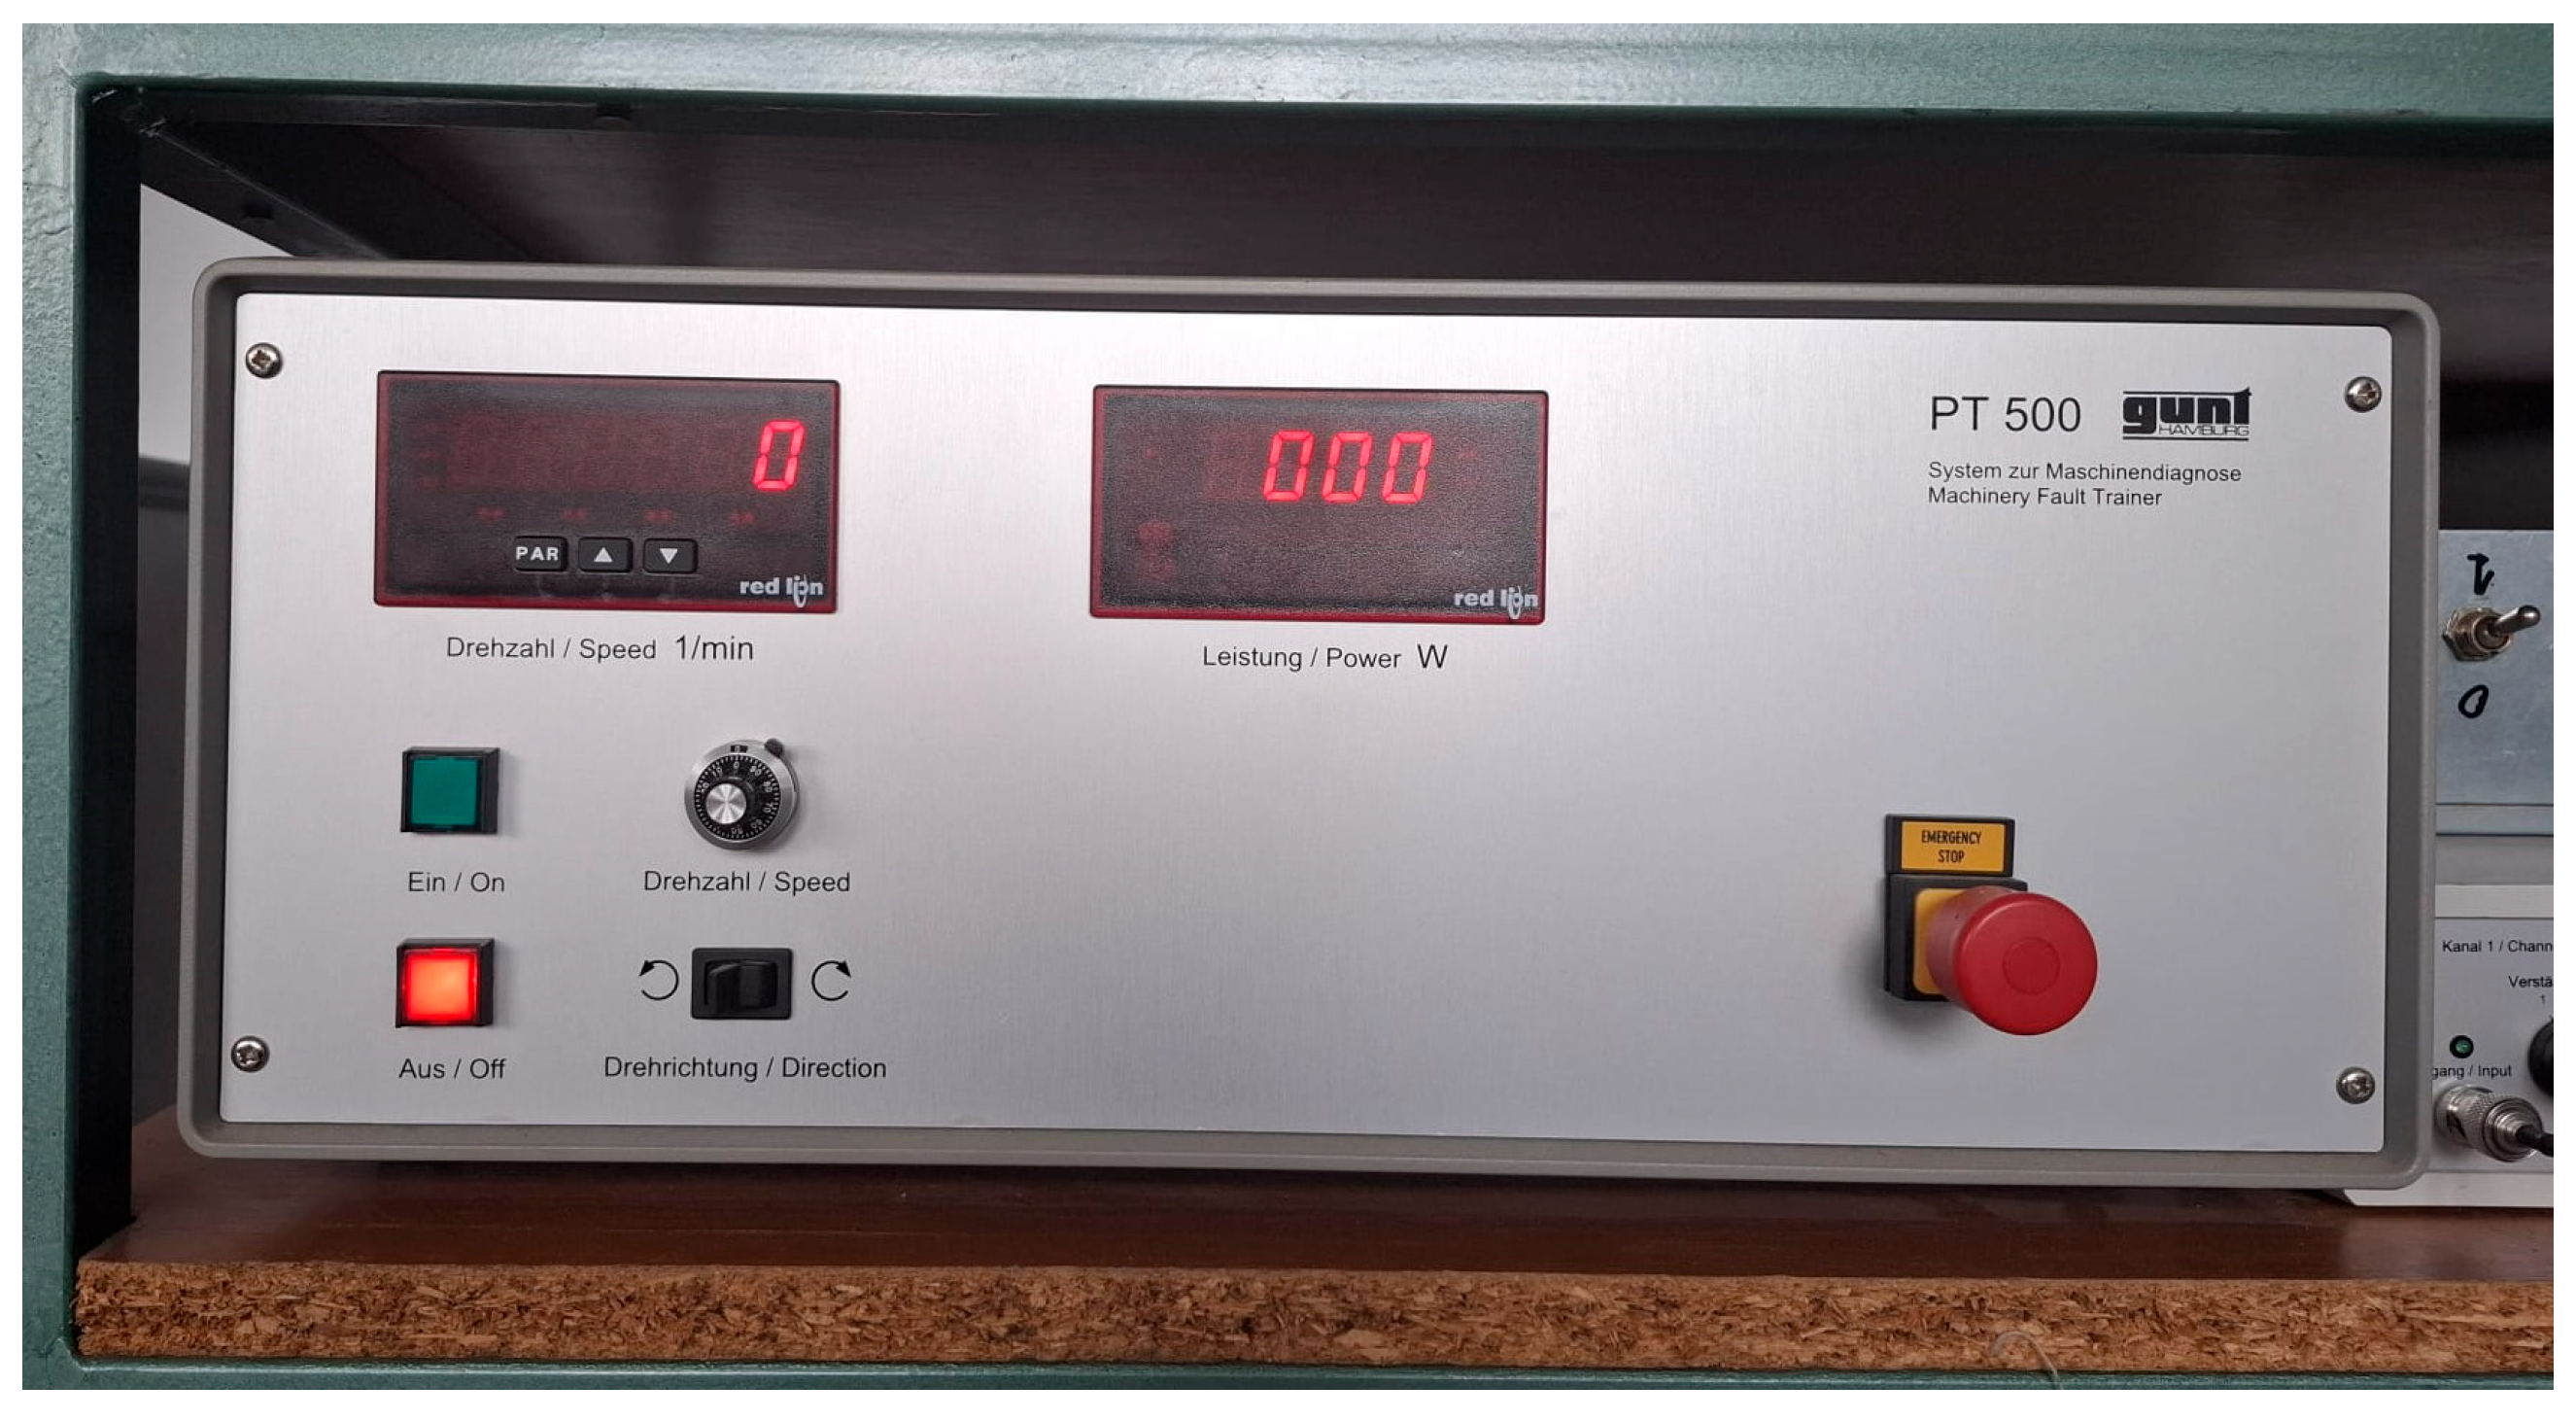
The electrical motor (EM) is actuated by a controller made by GUNT (Figure 2), which contains a frequency converter for continuous adjustment of the speed. For reading the power consumption and the speed recorded by the rotary encoder attached to the rear end of the motor, the controller has two displays.
Figure 2.
Controller of the electrical motor.
The main technical data of the test stand are presented in Table 1.
Table 1.
Technical data of the test stand components.
As for driving the system, there is not only a power loss because of the interaction between the gear and the air inside the housing (WPL), but also power losses caused by the friction inside the two bearings (B1 and B2) and the shaft seal (SS). The windage power loss of the helical gear Pw was measured as a difference between the total power consumption for driving the system Ptot and the power consumption for driving the assembly without the helical gear inside the housing (Pb,s):
Pw = Ptot − Pb,s
The windage power loss was determined experimentally by measuring the electrical power required to drive the test stand both with and without the helical gear installed inside the housing.
Adding the helical gear (G) to the shaft (S) indeed increases the static load on bearings B1 and B2. However, the mass of the gear is relatively small (≈100 g), and the cantilever length was minimized in the design to reduce additional bearing loading. For these reasons, we considered that the additional friction moments induced in the bearings (B1 and B2) by the weight of the gear (G) can be neglected without affecting the estimation of the gear windage results.
To ensure repeatability, the system was first operated for 30 min at 3000 rpm to stabilize the temperature-dependent friction in the bearings and shaft seal. After stabilization, the total power consumption and the baseline power consumption were recorded at four rotational speeds (2000, 3000, 4000, and 5000 rpm). At each speed level, three independent measurements were performed for both Ptot and Pb,s, and the average values were used to compute the windage power loss Pw according to Equation (5). The motor controller’s integrated power meter and rotary encoder provided real-time readings of electrical input power and rotational speed, ensuring consistent measurement conditions.
3.2. Analytical Approach
The windage power losses of the gear, whose technical data are given in Table 1, were predicted using the formulas proposed by Dawson [12] and Lord [15], as well as the ISO/TR 13593:1999 [16] and ANSI/AGMA 6011-I03 [17] standards equations, which are described in Section 2.1.
The calculations were done for the same 4 speed levels used for the experimental measurements, considering a viscosity of μ = 1.831 × 10⁻⁵ Pa·s and a density of ρ = 1.185 kg/m3 at 25 °C for the air.
3.3. 3D Modelling and Setting the Flow Simulation
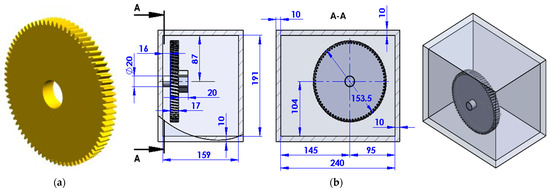
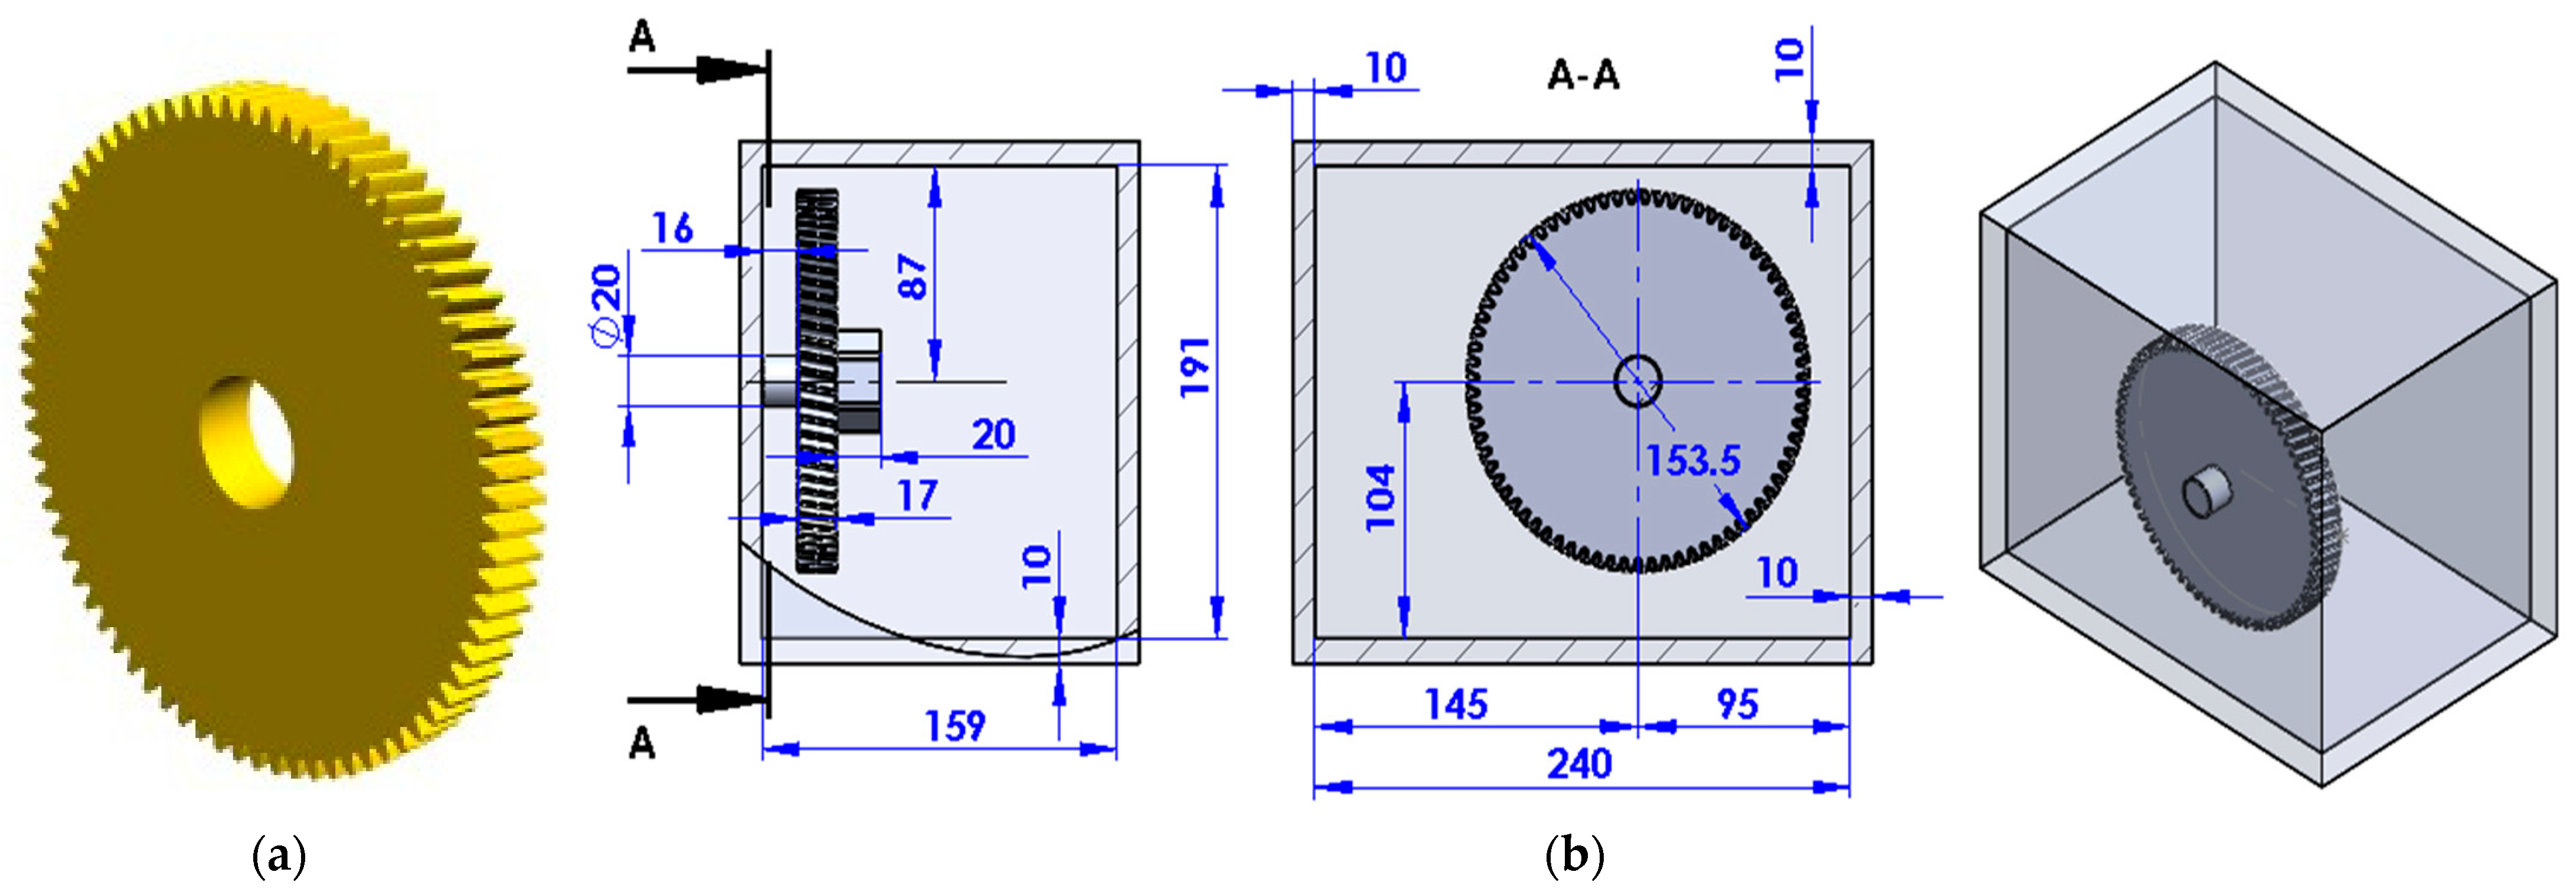
Starting from the above-mentioned information regarding the technical data of the test stand components, the generation of the gear 3D geometry was initiated by using KISSsoft 2025 software [32]. The model was exported as an stp-file and was integrated into the assembly generated in SolidWorks 2025 software. The gear geometry and the 3D model of the gearbox housing are shown in Figure 3.
Figure 3.
3D modelling of the test stand. (a) Helical gear geometry; (b) Assembly.
Based on the Favre-averaged Navier–Stokes equations and transport equations for turbulent kinetic energy known as the κ-ε model, Flow Simulation predicts laminar and turbulent internal or external flows [33].
The following actions were taken to run the simulation in SolidWorks’ Flow Simulation module: define a flow simulation project, specify a control volume and analysis type, specify the boundary and convergence conditions, perform calculations, and visualize the results. Table 2 presents the general settings of the simulation projects.
Table 2.
General settings of the simulation project.
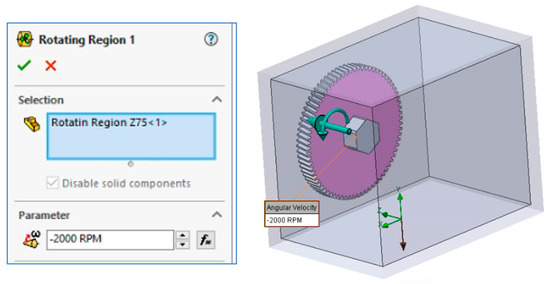
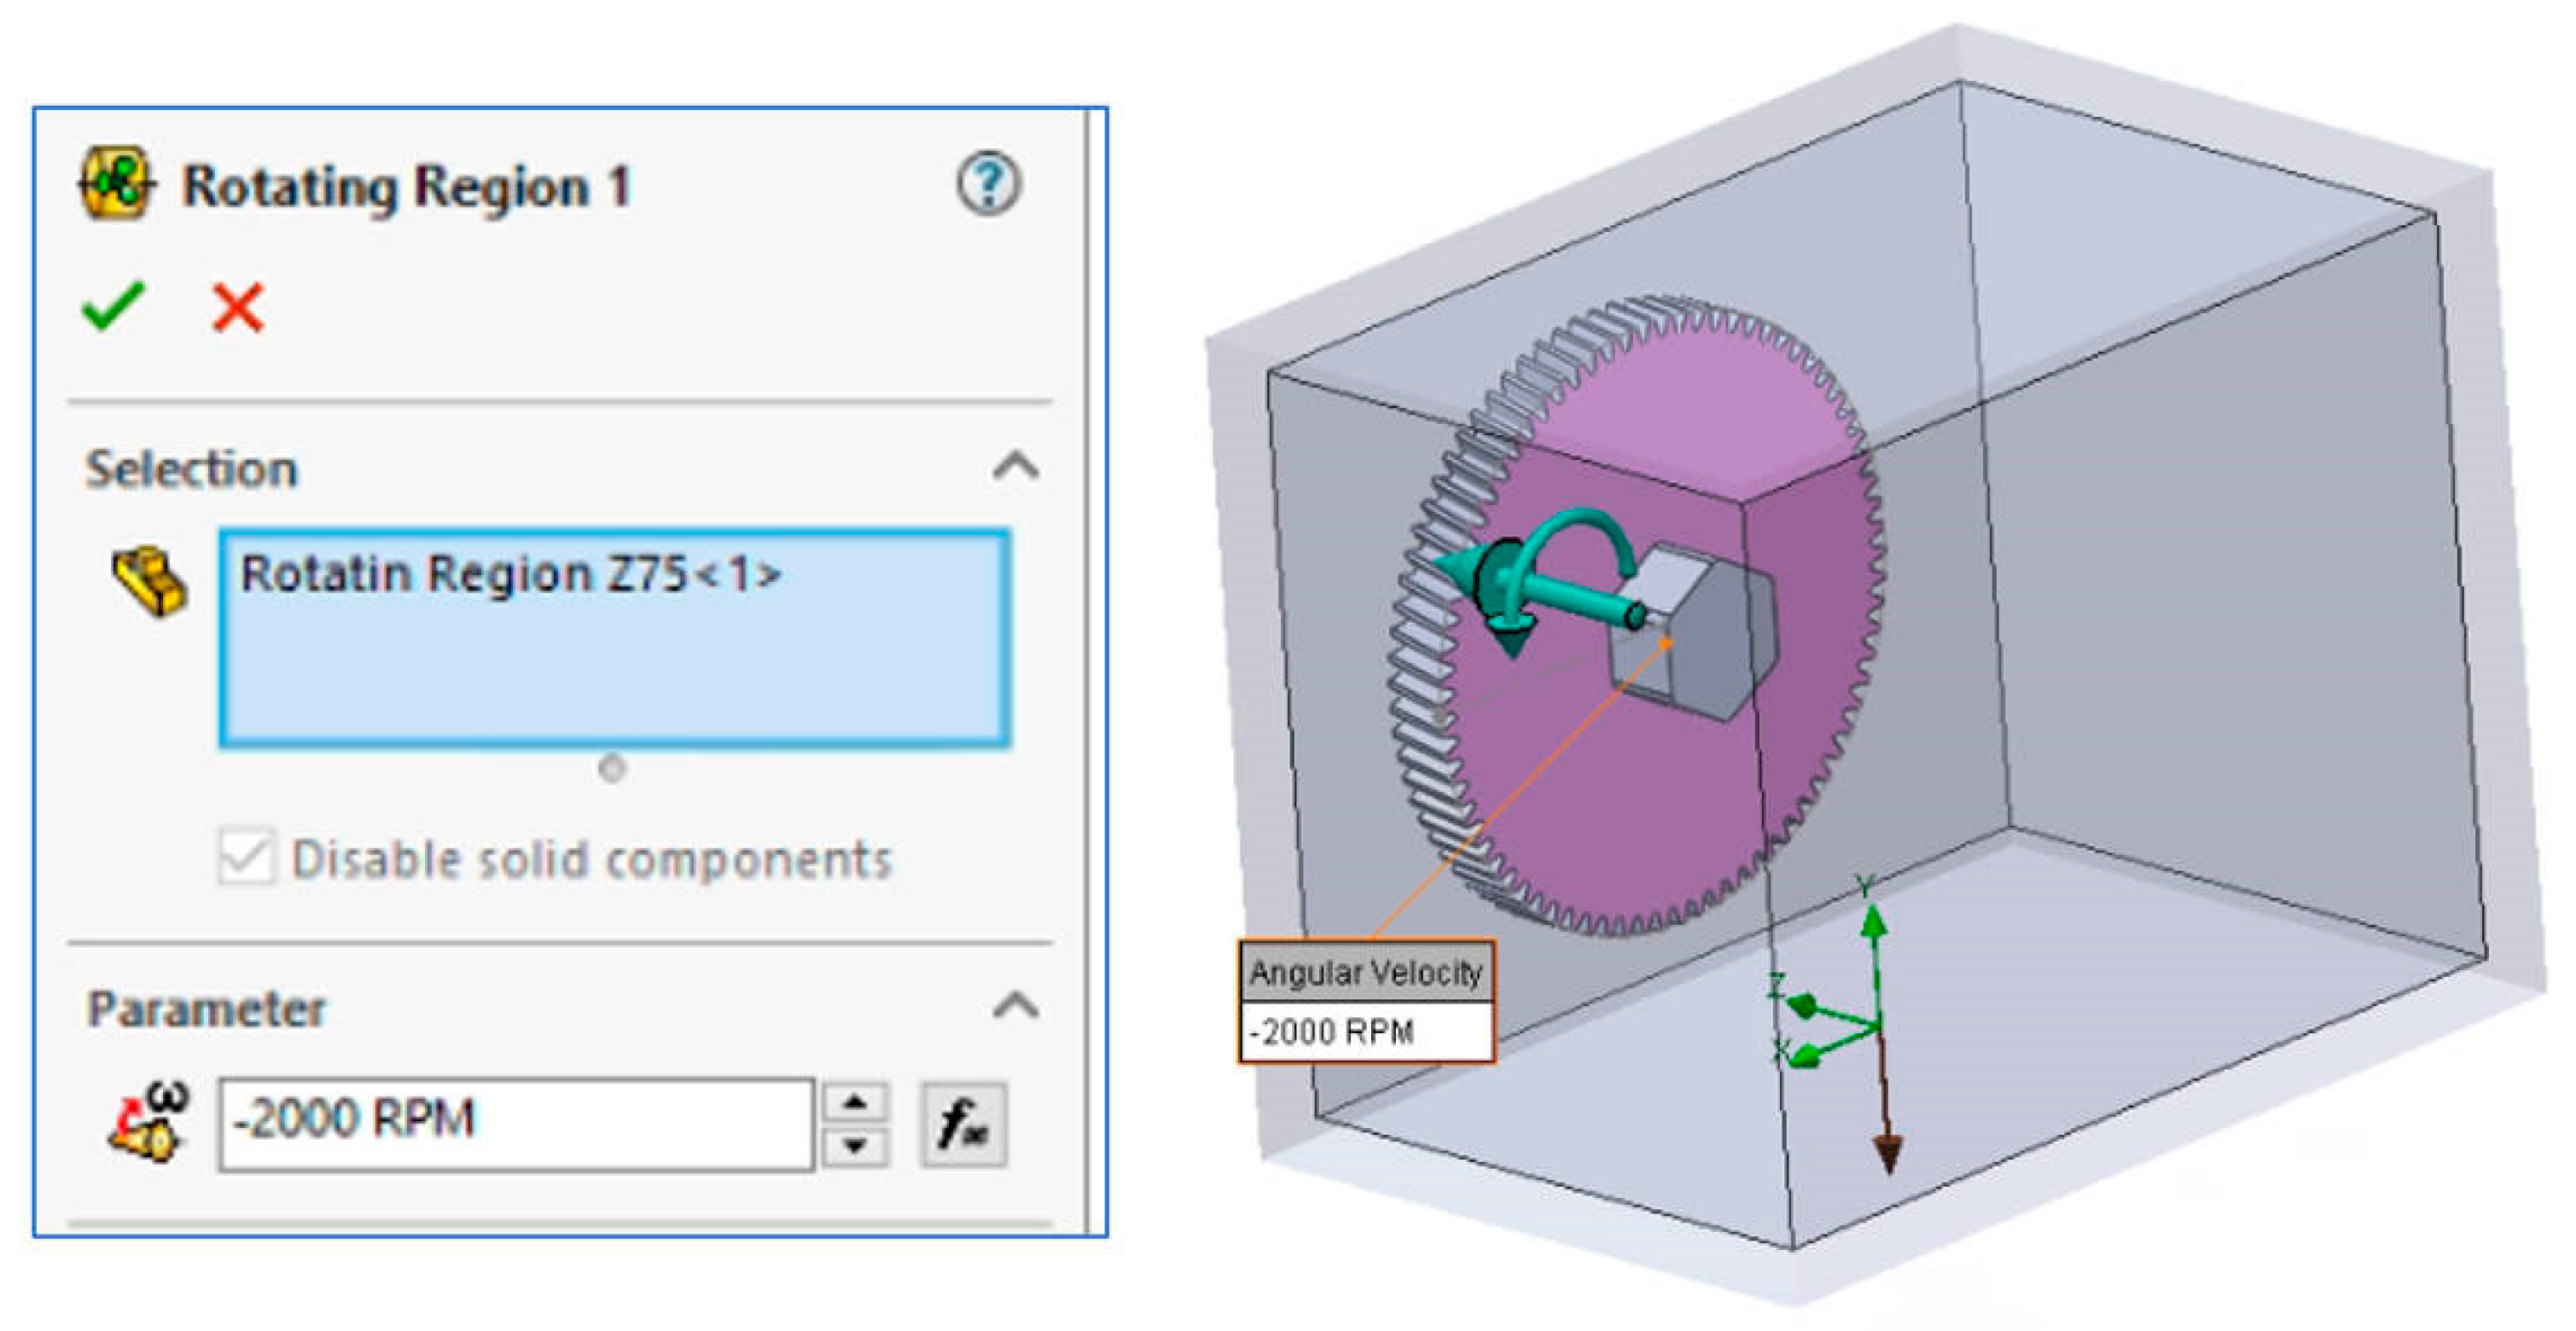
To define a local rotating frame of reference and examine fluid flow across rotating model components, the Rotating Region was set. To define the Rotating Region, a disc with a diameter of 165 mm and a width of 18 mm was created to include the gear geometry. Additionally, the angular velocity of this component had to be specified (Figure 4).
Figure 4.
Rotating Region settings.
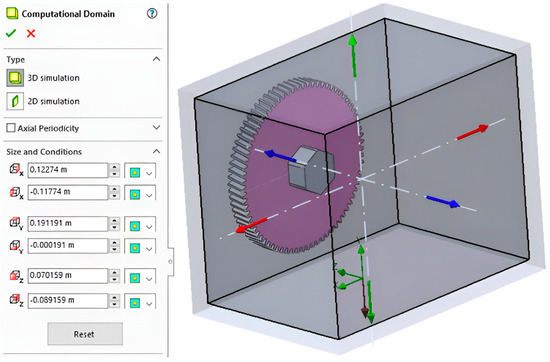
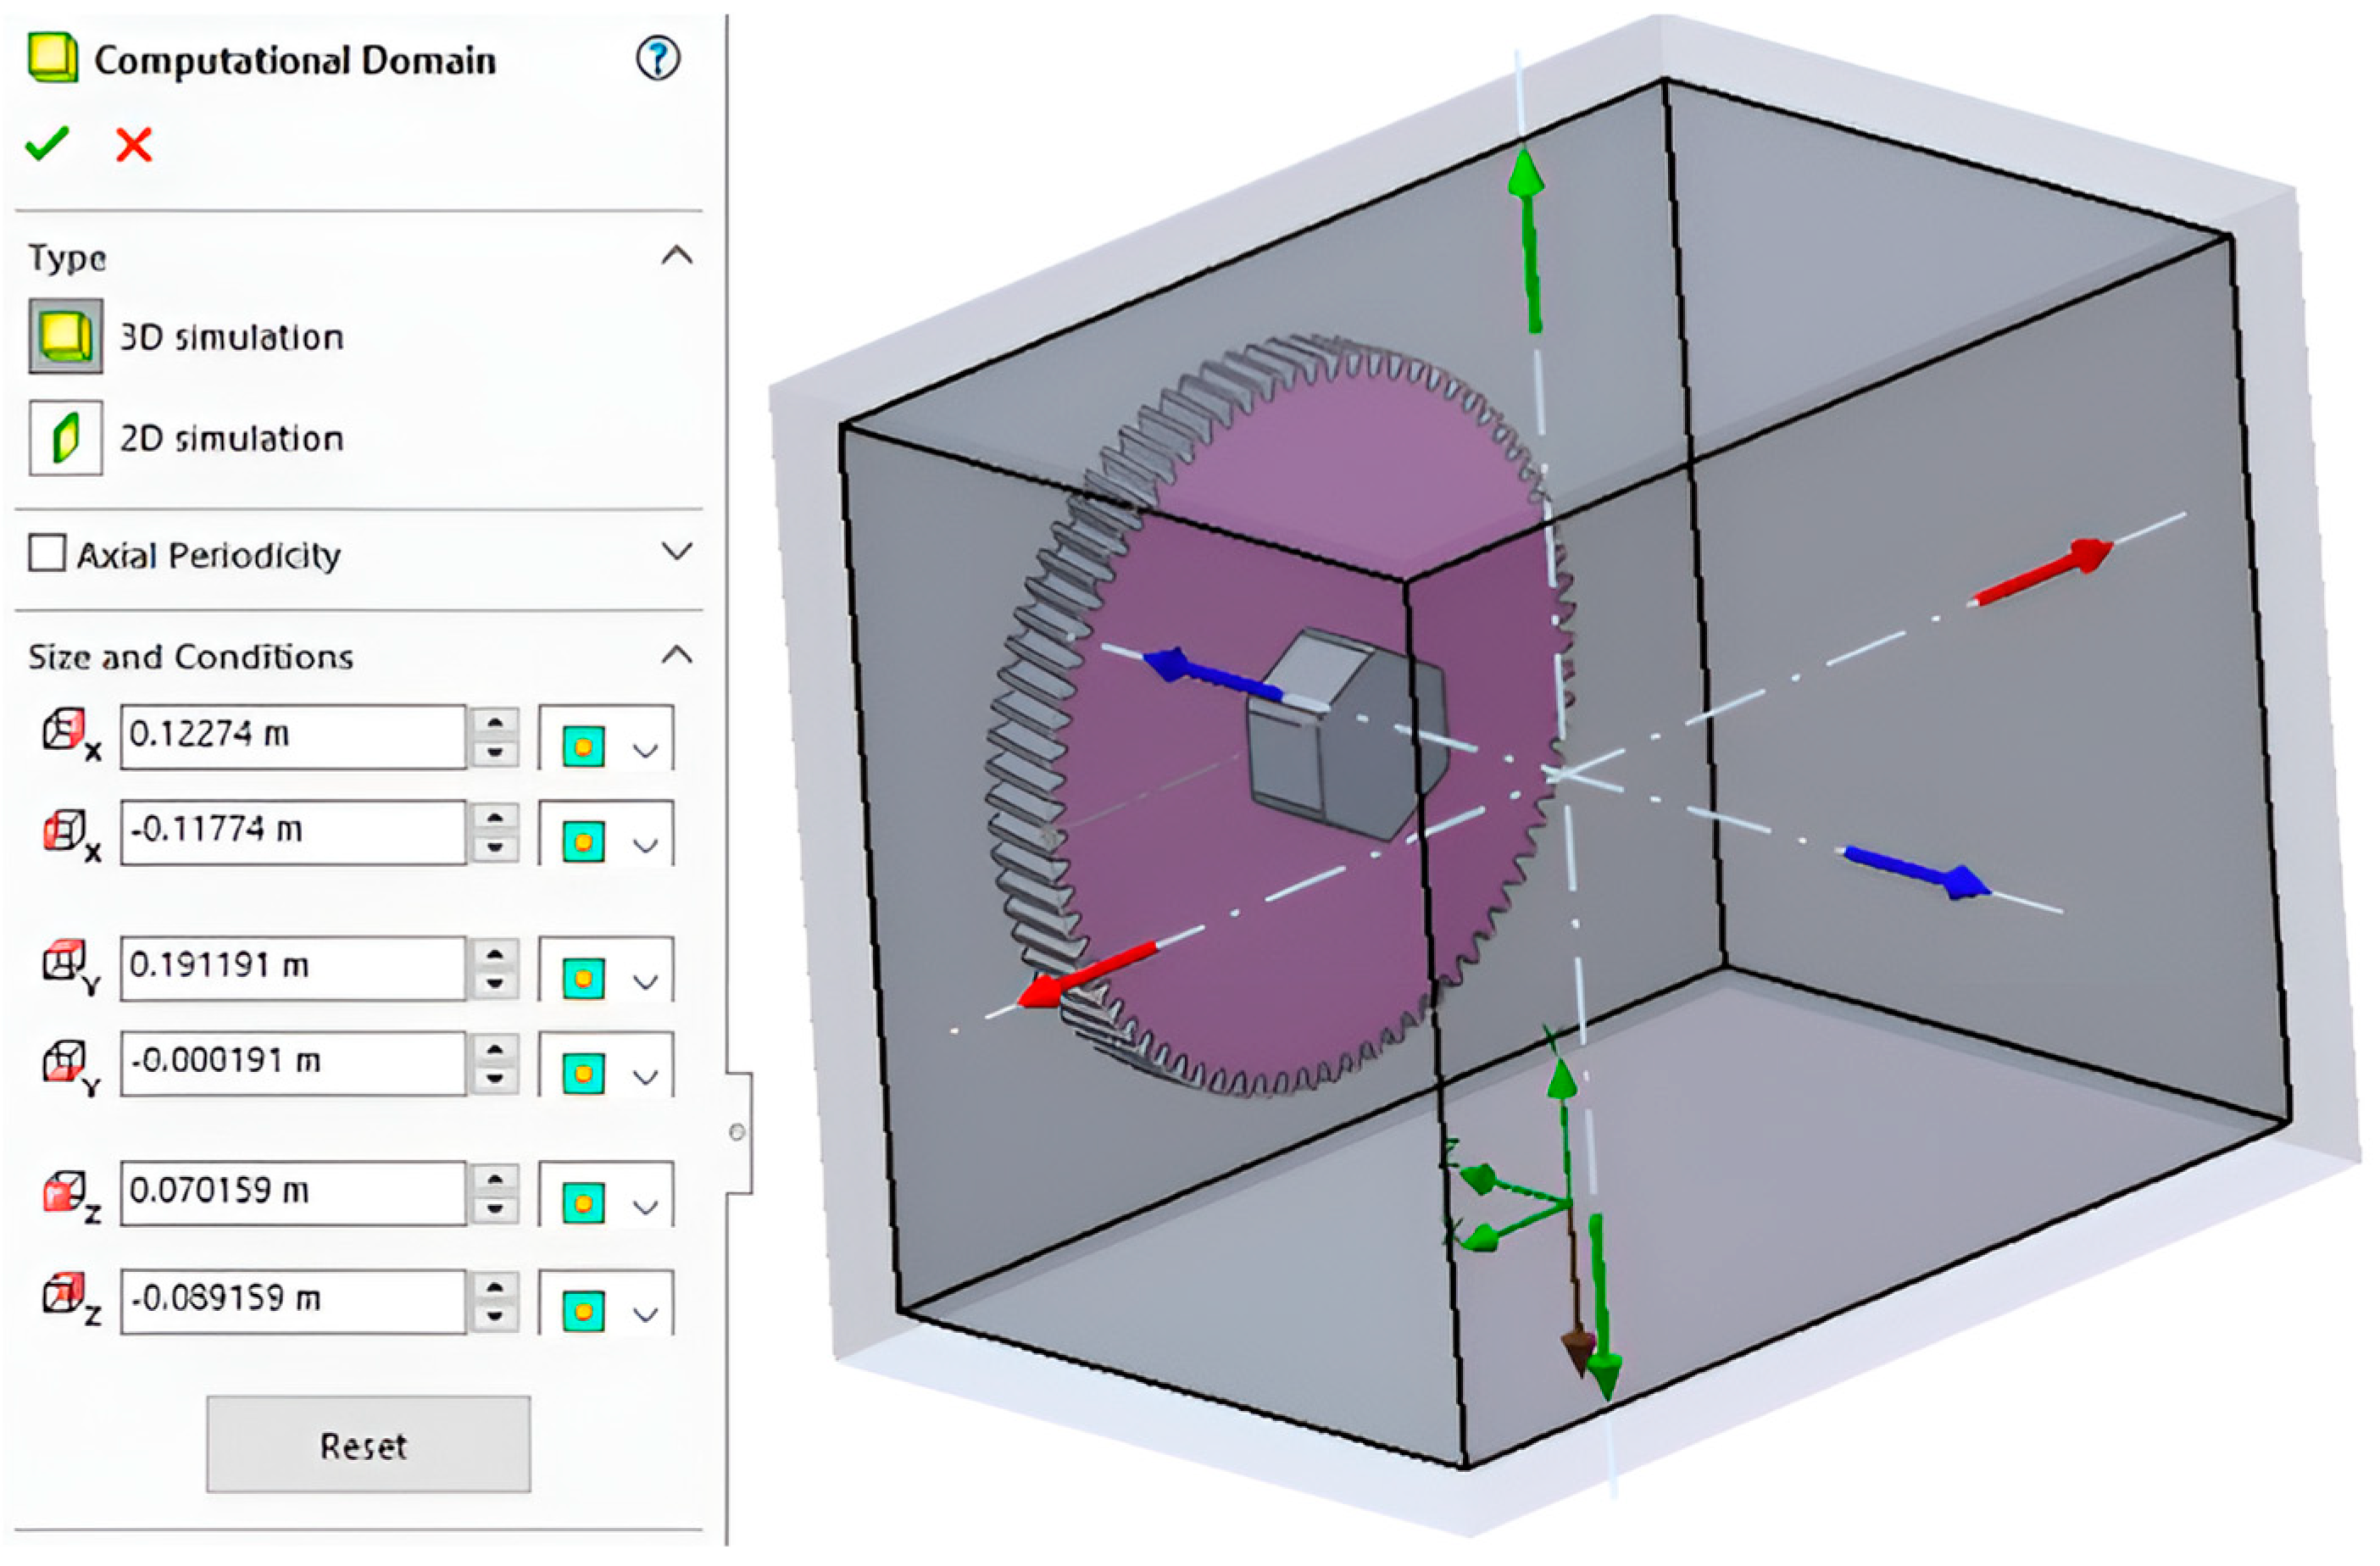
The assembly geometry is determined by the SolidWorks Flow Simulation module, which automatically creates the computational domain containing the examined geometry. The three-dimensional computational domain, which encompasses the assembly within a parallelepiped, is shown in Figure 5. The limits of the computational domain, which is the area used for flow computations, are parallel to the global coordinate system planes.
Figure 5.
Computational Domain settings.
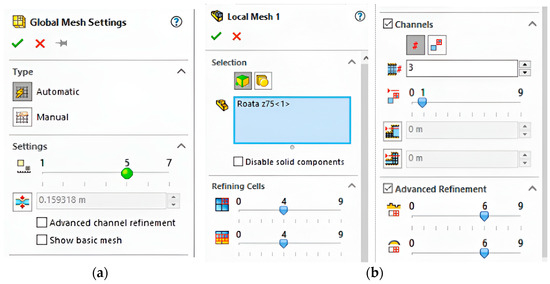
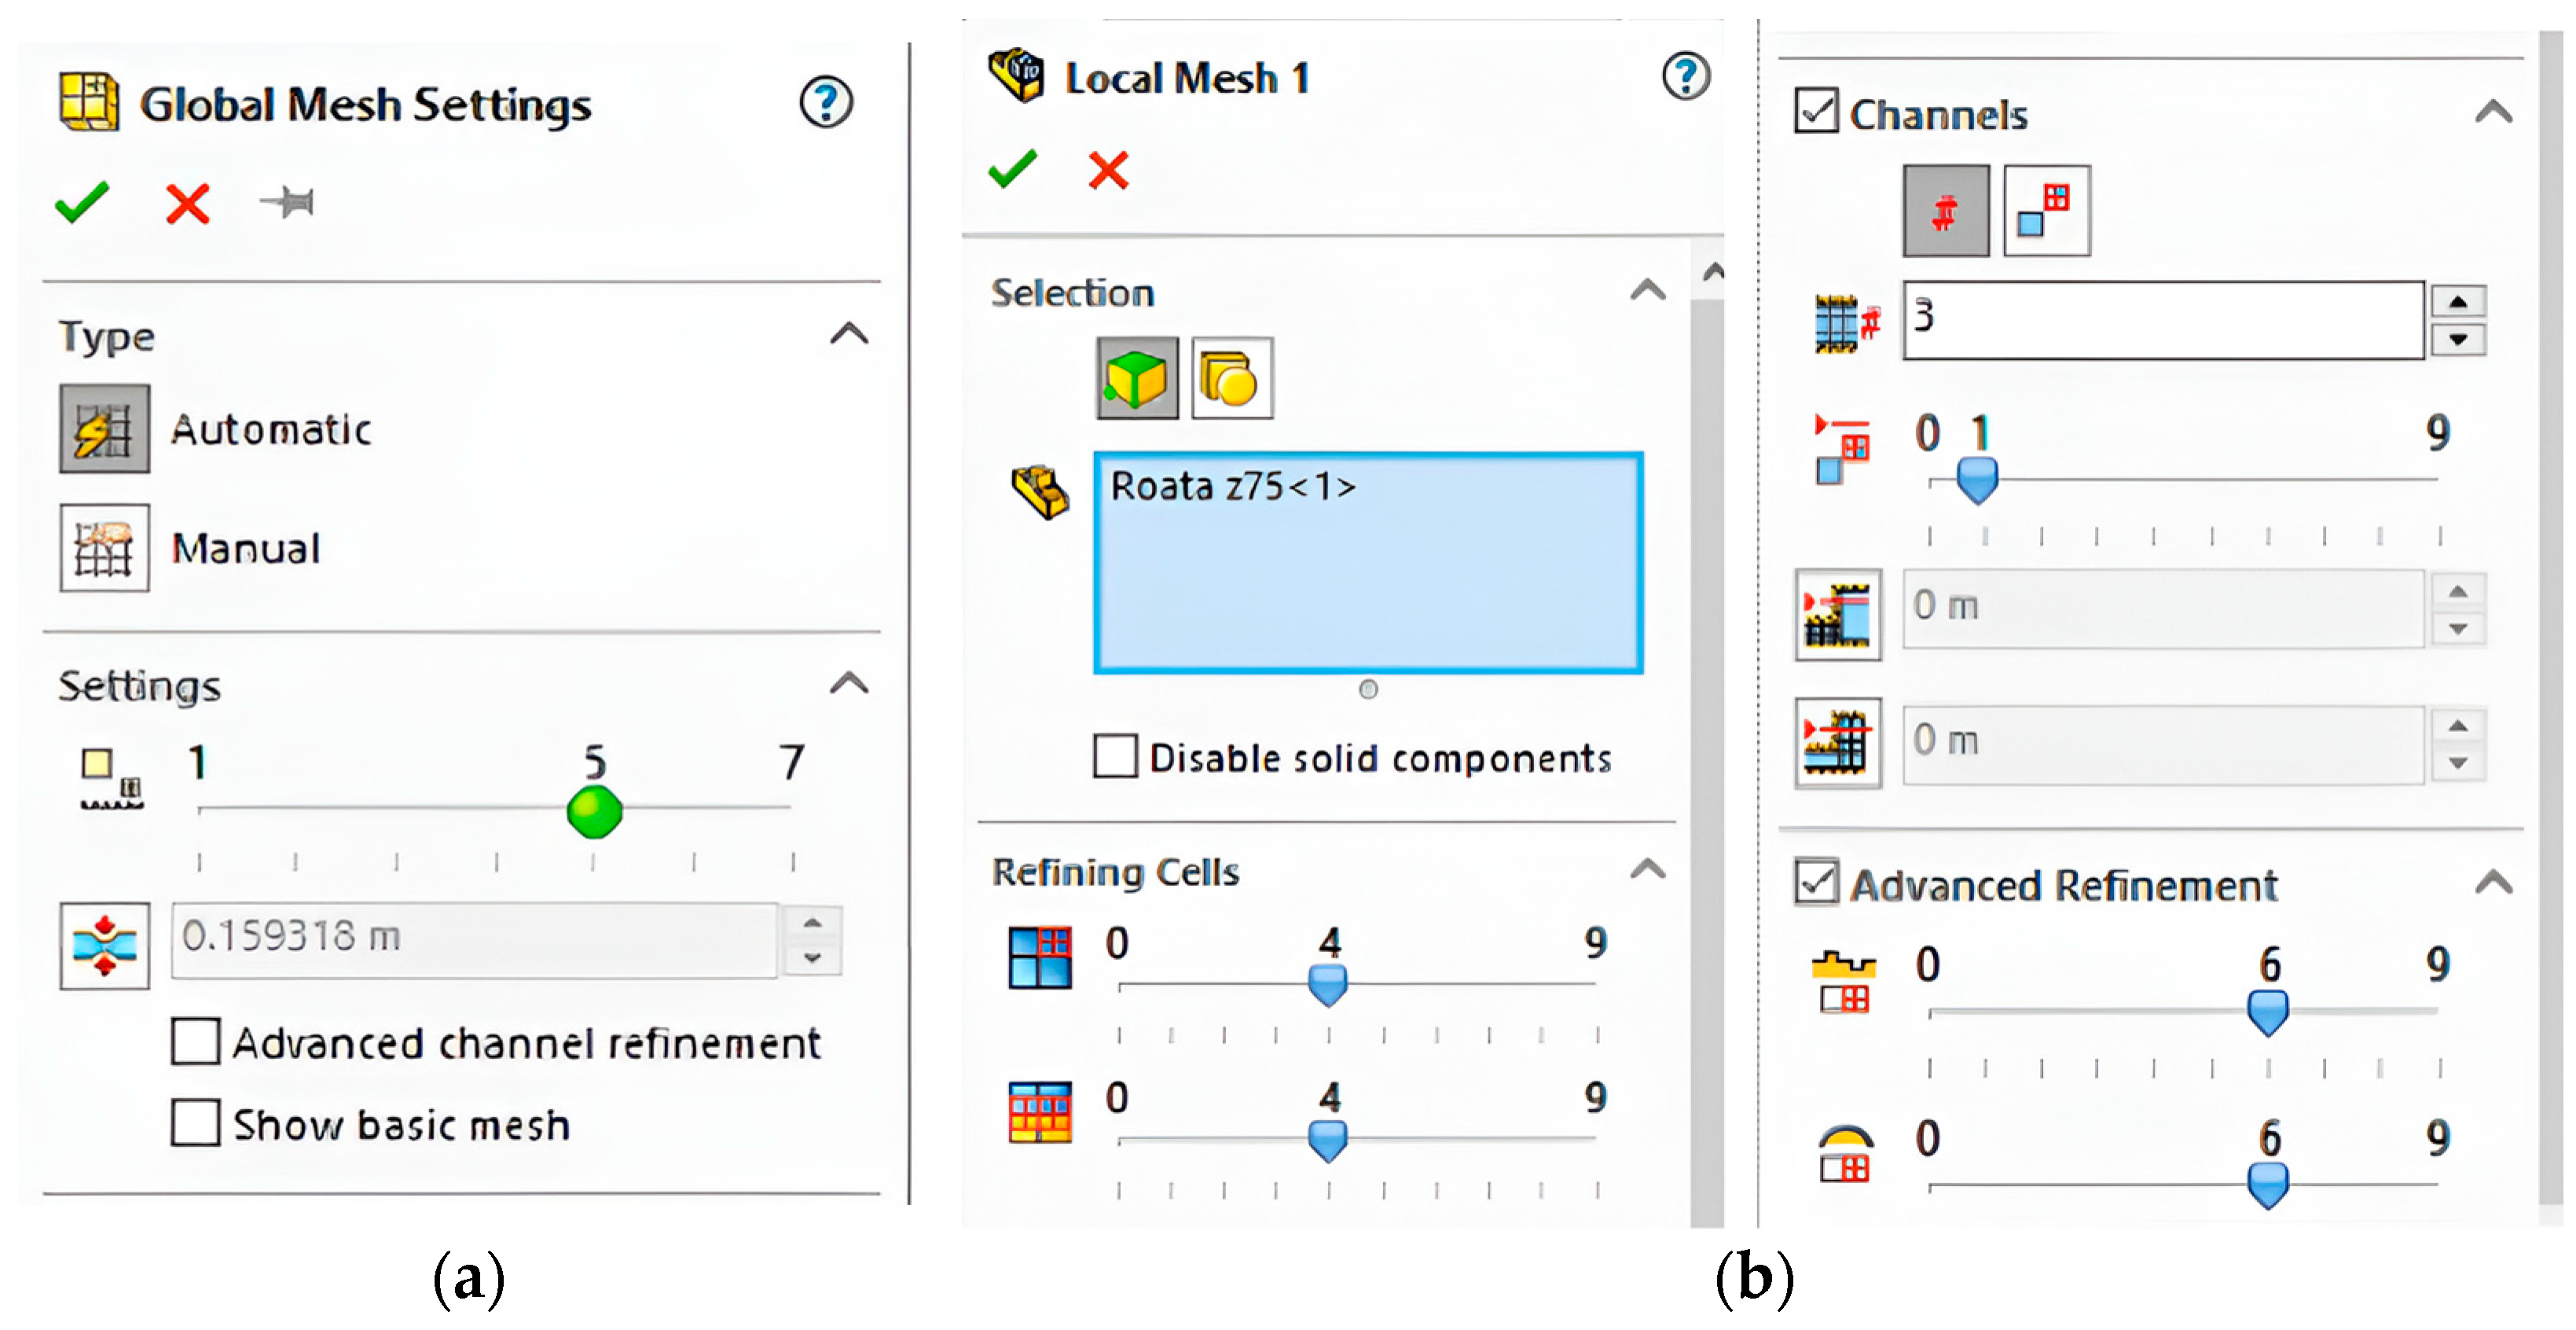
The precision of the results and the computation time are both impacted by meshing. Two types of meshes are imposed: a global mesh and a local mesh according to the settings shown in Figure 6, which generate 850,645 cells. The projects were calculated on a computer with the following configuration: processor 11th Gen Intel(R) Core (TM) i9-11900 K, 3.50 GHz, 16 cores, installed RAM 64,0 GB, 64-bit operating system, x64-based processor. The calculations for the four projects (2000, 3000, 4000, and 5000 rpm) occupied 57.7 GB on the HDD.
Figure 6.
Mesh settings. (a) Global; (b) Local.
4. Results and Discussion
Following the methodology outlined in the previous section, the study proceeded to quantify the windage power losses of the helical gear using experimental, analytical, and numerical techniques. The outcomes of the experimental investigations, along with the WPL calculated as the difference between the total power required to drive the system () and the power needed to operate the assembly without the helical gear installed in the housing (), are consolidated in Table 3.
Table 3.
Results of experimental measurements.
The outcomes of the analytical evaluations conducted using the empirical formulations proposed by Dawson [12] and Lord [15], as well as those specified in ISO/TR 13593:1999 [16] and ANSI/AGMA 6011-I03 [17] standards, are compiled in Table 4.
Table 4.
Results of analytical evaluations.
Finally, the CFD analyses conducted using the Flow Simulation module of the SolidWorks software yielded the windage torque loss (WTL) values for the helical gear at the four investigated rotational speeds (2000, 3000, 4000, and 5000 rpm). The corresponding windage power losses were subsequently determined using the established relationship between power and torque P = π·M·n/30. These results are reported in Table 5.
Table 5.
CFD results.
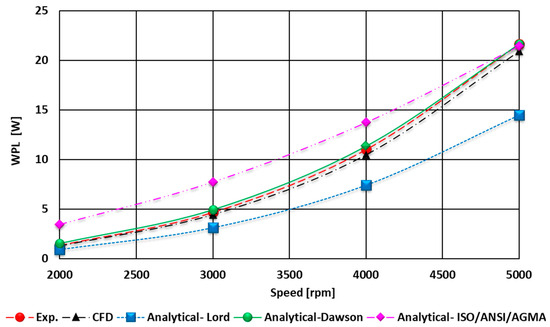
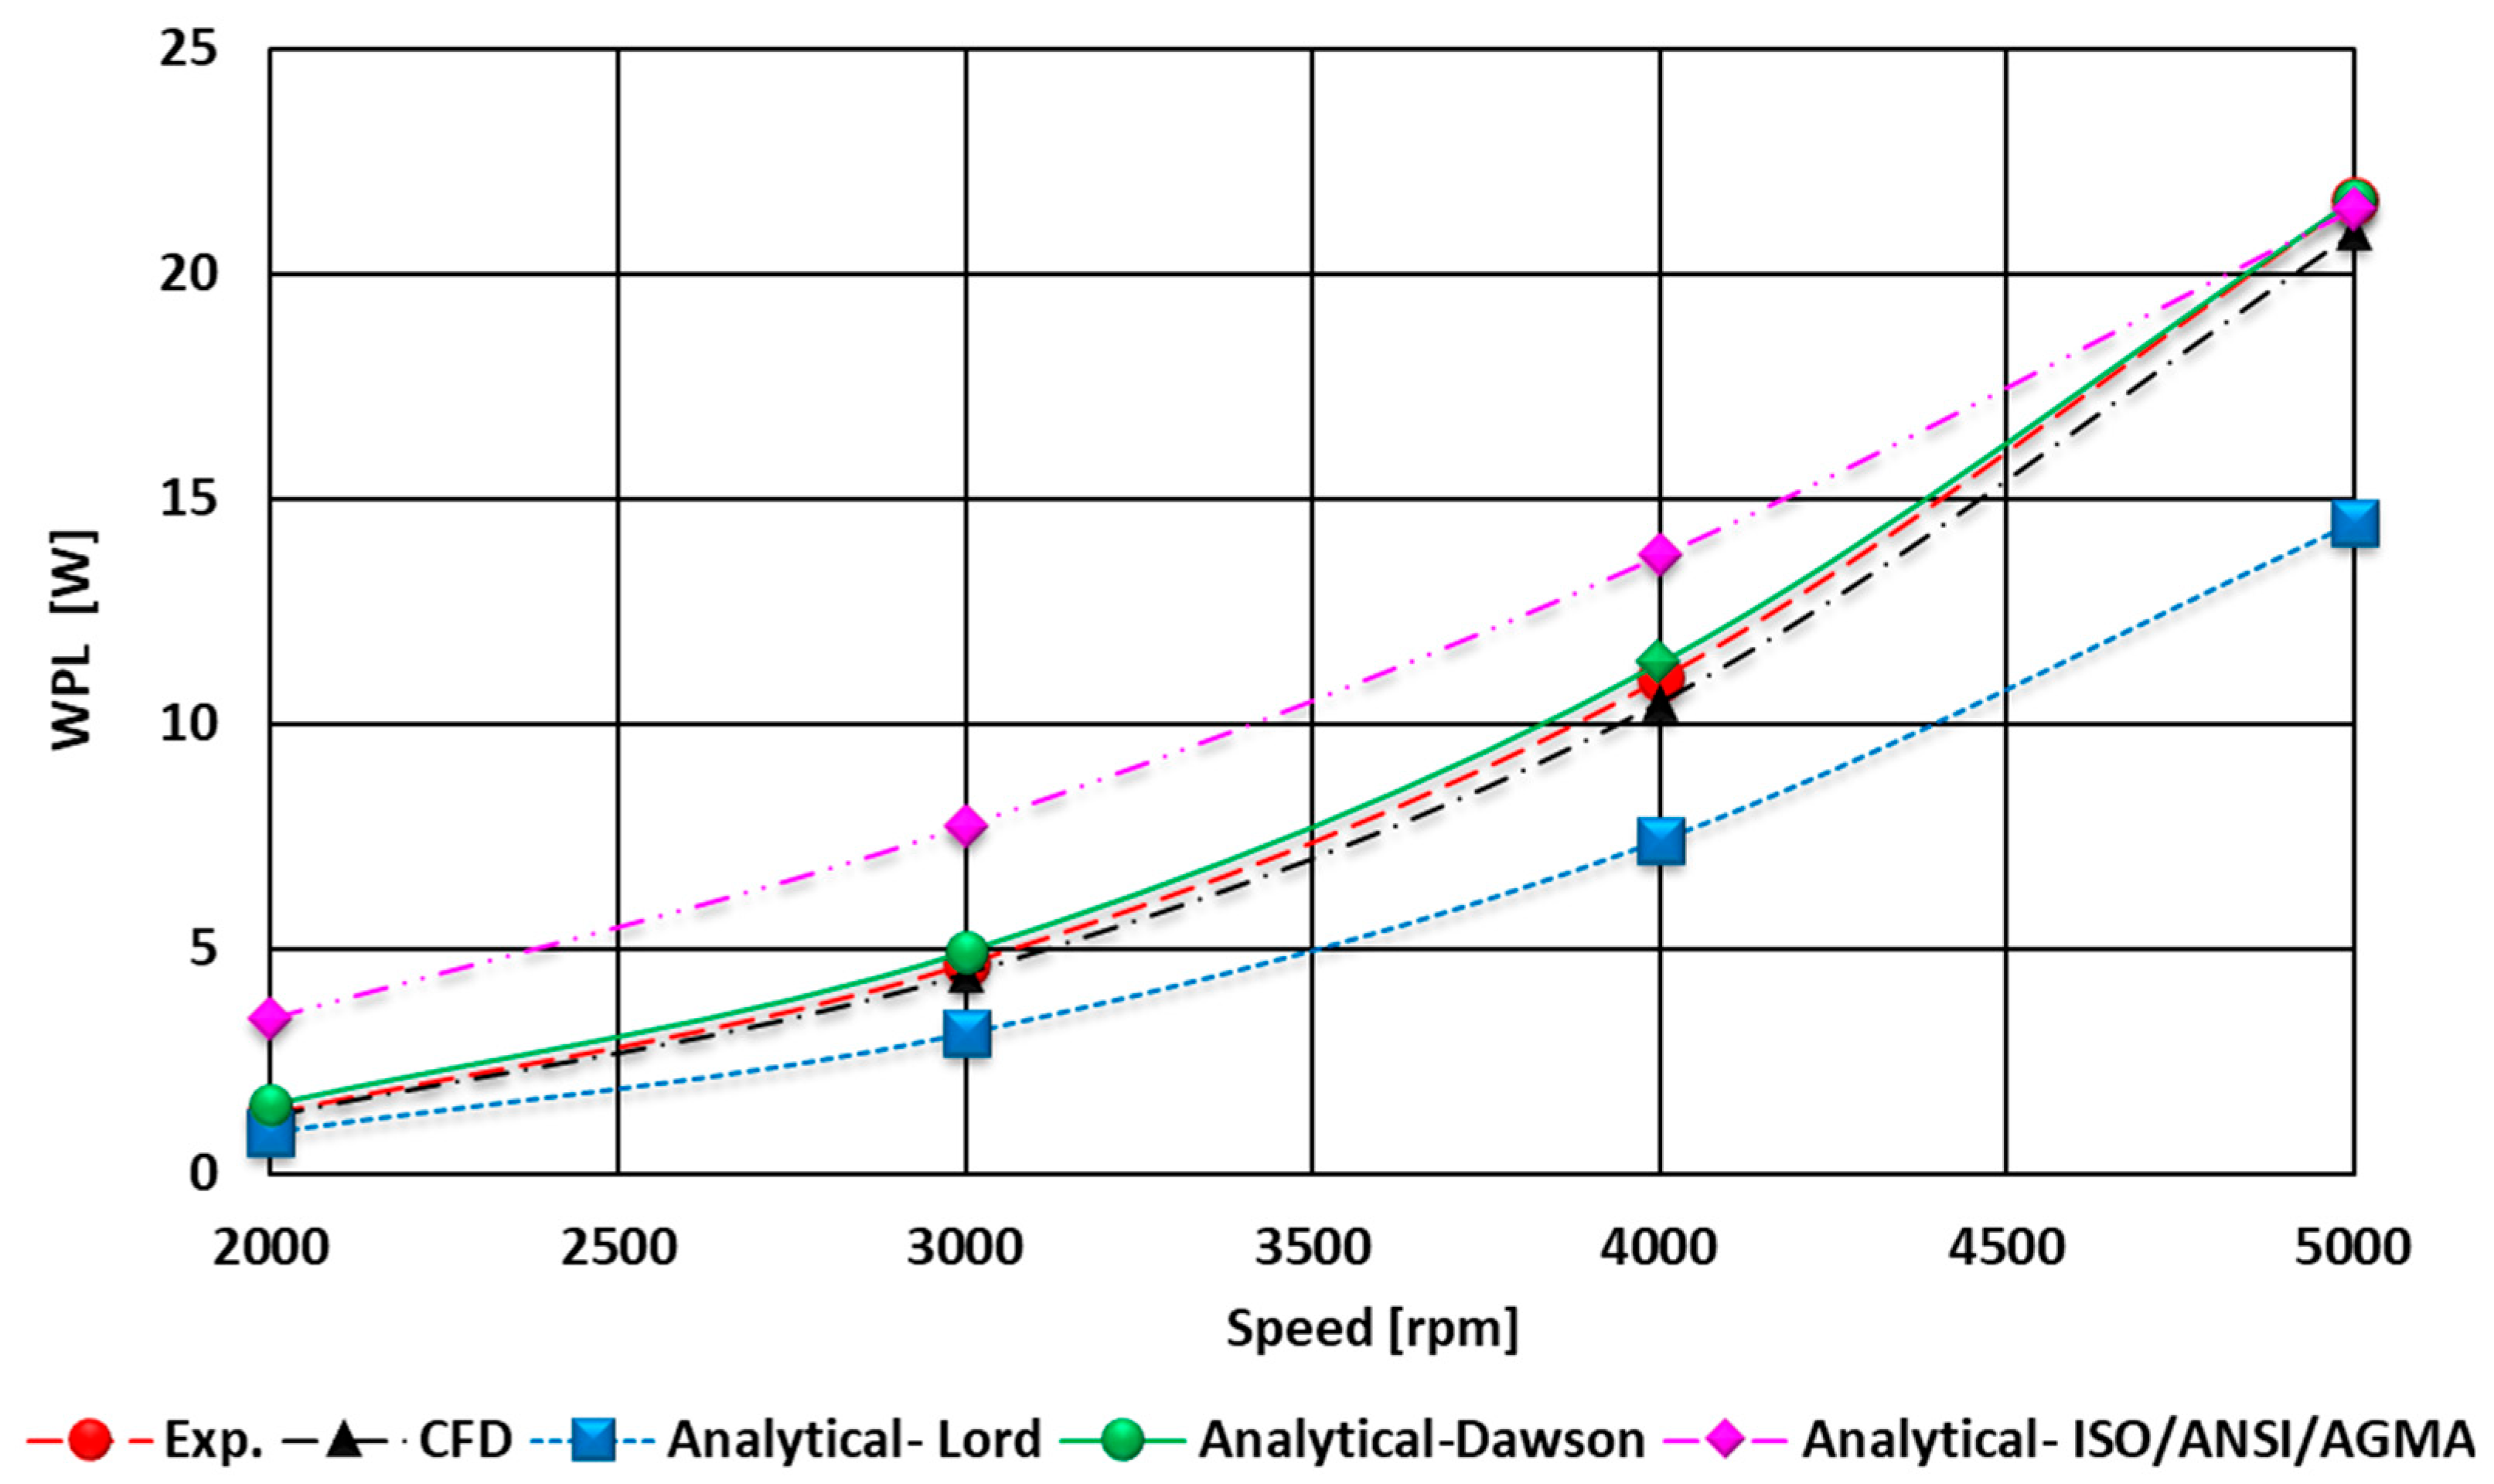
To evaluate the WPL of the helical gear using an integrated experimental, analytical, and numerical framework, Figure 7 provides a graphical synthesis of the results presented in Table 3, Table 4 and Table 5. In addition, Table 6 shows the percentage differences between the results of the estimates made by the 3 approaches.
Figure 7.
Variation in WPL as a function of speed.
Table 6.
Differences between the three approaches in WPL estimations.
As one can observe, the average deviation between the experimental measurements and the CFD results is 4.99%, decreasing progressively from 6.10% to 3.45% as the rotational speed increases from 2000 to 5000 rpm. The close agreement between the experimental measurements and the CFD predictions demonstrates the robustness of the numerical model in capturing the dominant aerodynamic phenomena around the rotating gear.
At lower rotational speeds, the flow surrounding the gear teeth is characterized by transitional boundary layers, localized separation, and sensitivity to small geometric and surface-finish variations. These effects introduce additional uncertainty in both the experimental measurements and the numerical predictions. The CFD model, although capable of resolving the dominant vortical structures, is more susceptible to turbulence-model limitations in transitional regimes, which explains the initial deviation of approximately 6.10% between the simulation and experiment at 2000 rpm.
As the rotational speed increases, the flow transitions into a fully turbulent regime dominated by strong centrifugal pumping, stable vortical patterns, and predictable shear-layer development. In this regime, the influence of small-scale disturbances diminishes, and the windage losses become governed primarily by global parameters such as rotational speed, gear diameter, and air density. Consequently, the CFD predictions align more closely with the experimental measurements, with the deviation decreasing to 3.45% at 5000 rpm
The progressive reduction in deviation with increasing the speed suggests that the flow becomes increasingly governed by fully turbulent, inertia-dominated mechanisms at higher speeds, conditions under which CFD turbulence models typically perform with greater accuracy. Additionally, the relative influence of experimental uncertainties diminishes as the magnitude of the measured WPL increases, further contributing to the improved correspondence. This can be explained by the fact that WPL scales approximately with the cube of the angular velocity (P α ω3). So, at increased speeds, the absolute WPL is much higher, but the absolute measurement uncertainty stays roughly constant, and therefore, the percentage error decreases.
The analytical estimates derived from Dawson’s empirical correlation also show good agreement with both the experimental and numerical results. The average discrepancies of 10.96% (experiment vs. Dawson) and 5.65% (CFD vs. Dawson) fall within acceptable engineering limits for empirical aerodynamic correlations.
Like the CFD–experiment comparison, the deviations decrease with increasing rotational speed, reaching 0.01% and 3.44% at 5000 rpm. This trend confirms that Dawson’s method, originally developed for high-speed rotating components, becomes increasingly valid as the flow transitions fully into the turbulent regime. The strong convergence of all three methods at 5000 rpm highlights the reliability of Dawson’s correlation for high-speed gear applications.
In contrast, the empirical formula proposed by Lord exhibits significantly larger deviations—approximately 30%—relative to both the experimental measurements and the CFD predictions. These discrepancies remain nearly constant across the entire speed range, indicating a systematic bias rather than a speed-dependent limitation. This behavior suggests that Lord’s correlation does not adequately capture the complex three-dimensional flow structures and tooth-induced pumping effects characteristic of helical gears. Its applicability appears limited to simpler geometries or flow conditions that differ substantially from those encountered in the present study.
The fact that the deviation remains nearly constant with increasing rotational speed further suggests that the discrepancy arises from a structural limitation of the formula rather than from a mismatch in the scaling of aerodynamic forces. In other words, the formula does not simply under- or over-predict the magnitude of WPL; it fundamentally omits key physical contributions that become significant in helical gear operation. This systematic bias explains why the error does not diminish even at high speeds, where other empirical methods (e.g., Dawson, ISO/AGMA) begin to converge with experimental and numerical results.
These observations reinforce the need for caution when applying Lord’s correlation to geometric and cinematic configurations that differ to those for which the formula has been deducted. Recent literature [34,35,36,37,38] has highlighted similar shortcomings and has proposed several pathways for revising Lord’s correlation to improve its applicability to modern gear geometries. These include the introduction of correction factors accounting for tooth geometry, helix angle, and gear aspect ratio, as well as the incorporation of turbulence-intensity-dependent terms to better capture the transition from laminar to fully turbulent flow regimes. Such modifications aim to bridge the gap between the simplified assumptions of the original correlation and the more complex aerodynamic behavior observed in real gear systems. Building on these insights, the authors of the present study propose an adapted version of Lord’s formula tailored specifically to the geometric and operating conditions investigated:
Pw = 4.1296 · ρ · ω3 · r3.51mn1.06 · b−0.42 · [W]
Equation (6) revises the constant from the original equation from 2.9 to 4.1296. This adjustment was selected to minimize the maximum discrepancy among the experimental, numerical, and analytical results, with the explicit objective of keeping the deviation below 5% across the tested speed range.
The percentage differences between the amended analytical results (obtained with the revised Lord’s formula) and the outcomes of experimental tests of the simulation are presented in Table 7. As can be observed, the modified correlations achieve mean deviations of 1.18% relative to the CFD predictions and 3.64% relative to the experimental measurements, representing a substantial improvement over the original formulation.
Table 7.
WPL estimated with Lord’s revised formula and new differences between approaches.
However, it is important to emphasize that this revised constant remains predominantly empirical and is calibrated solely for the specific gear geometry, operating conditions, and flow environment examined in this study. As such, its broader applicability cannot be assumed without further validation. Additional experimental campaigns and numerical simulations covering a wider range of gear sizes, helix angles, tooth profiles, and Reynolds numbers are necessary to determine whether the revised correlation can be generalized or whether further parameterization is required. Ultimately, while the proposed modification significantly enhances predictive accuracy within the present context, it should be regarded as a step toward a more comprehensive revision rather than a universally applicable solution.
A distinct behavior was observed for the WPL estimates obtained using the ISO/ANSI/AGMA standard method. At rotational speeds between 2000 and 4000 rpm, the deviations from the experimental and numerical results are substantial, reflecting the fact that the standard is not intended for use in this speed range. According to ANSI/AGMA 6011-I03, the method is applicable only for peripheral speeds exceeding 35 m/s or rotational speeds above approximately 4500 rpm for the tested gear. Once this threshold is exceeded, the agreement improves dramatically, with deviations of only 1.01% (experiment vs. standard) and 2.41% (CFD vs. standard) at 5000 rpm. This confirms that the standard provides reliable WPL estimates when applied within its prescribed domain of validity.
5. Conclusions
The combined experimental, numerical, and analytical investigation provides a coherent understanding of the windage power losses generated by the rotating helical gear. Across all three approaches, a consistent trend emerges: the discrepancies between the measured, simulated, and analytically predicted losses diminish progressively as the rotational speed increases. This convergence reflects the underlying aerodynamic behavior of the flow around the gear and the regimes in which the different evaluation methods operate most reliably.
The main conclusions are as follows:
Strong agreement between the experiment and CFD demonstrates the reliability of the numerical model, with deviations decreasing from 6.10% at 2000 rpm to 3.45% at 5000 rpm. This convergence reflects the increasing dominance of fully turbulent aerodynamic effects at higher speeds.
Dawson’s empirical correlation offers satisfactory accuracy, particularly at high rotational speeds. At 5000 rpm, the analytical predictions align almost perfectly with the experimental results (0.01% deviation), confirming the suitability of Dawson’s method for high-speed gear applications.
In contrast, Lord’s empirical formula exhibited persistent deviations of approximately 30% across all operating conditions, indicating that the original correlation does not adequately capture the complex three-dimensional aerodynamic behavior of helical gears. Motivated by recent literature proposing pathways for revising Lord’s formulation, the present study introduced an adapted version of the correlation tailored to the specific geometric and kinematic conditions investigated. By adjusting the empirical constant from 2.9 to 4.1296, the modified equation significantly improved predictive accuracy, reducing mean deviations to 1.18% relative to the CFD results and 3.64% relative to the experimental measurements. This adjustment was selected to limit the maximum discrepancy among the three evaluation methods to within 5%. Nevertheless, the revised correlation remains empirical in nature and requires further validation across a broader range of gear geometries and operating regimes before it can be considered generally applicable.
The ISO/ANSI/AGMA standard method performs poorly at low and medium speeds but becomes highly accurate once the gear reaches its intended applicability range (peripheral speed > 35 m/s or rotational speed > 4500 rpm). At 5000 rpm, deviations fall below 2.5%, validating the method for high-speed operation.
Overall, the findings highlight the importance of selecting windage loss prediction methods that are appropriate for the specific operating conditions and geometric characteristics of the gear. While CFD and experimental approaches provide high-fidelity results across all speeds, empirical correlations require careful consideration and, in some cases, targeted adaptation. The proposed revision of Lord’s formula represents a promising step toward improving analytical prediction capabilities, but further research is needed to generalize this approach and develop more universally applicable models for windage power loss estimation in geared systems.
Looking ahead, this work opens several promising directions for deeper exploration. A natural next step is to study a wider variety of helical gear geometries—changing the helix angle, module, and face width—to better understand how each feature shapes the windage behavior. It will also be important to look more closely at the gearbox environment itself. Elements such as enclosure design, shroud clearances, and ventilation paths are known to influence aerodynamic losses, yet their effects on helical gears are still not fully understood. On the numerical side, future studies will compare results across multiple CFD platforms to strengthen confidence in the predictions and identify any solver-dependent differences. Finally, combining the insights gained from experiments and simulations into more advanced semi-analytical models could lead to fast, reliable tools that support the design and optimization of high-efficiency industrial gearboxes.
Author Contributions
Conceptualization, Z.-I.K. and D.N.; methodology, C.N.; software, D.N. and. C.N.; validation, T.-D.P., Z.-I.K. and D.N.; formal analysis, T.-D.P.; investigation, C.N.; resources, A.G. and E.W.; data curation, D.N.; writing—original draft preparation, T.-D.P.; writing—review and editing, A.G. and E.W.; visualization, D.N.; supervision, Z.-I.K.; project administration, Z.-I.K. All authors have read and agreed to the published version of the manuscript.
Funding
This research received no external funding.
Data Availability Statement
The original contributions presented in the study are included in the article, further inquiries can be directed to the corresponding author.
Conflicts of Interest
The authors declare no conflicts of interest.
References
- Dai, Y.; Zhang, Y.Y.; Zhu, X. Generalized analytical model for evaluating the gear power losses transition changing from windage to churning behavior. Tribol. Int. 2023, 185, 108572. [Google Scholar] [CrossRef] [Scilit]
- Changenet, C.; Velex, P. A model for the prediction of churning losses in geared transmissions—Preliminary results. J. Mech. Des. 2007, 129, 128–133. [Google Scholar] [CrossRef] [Scilit]
- Diab, Y.; Ville, F.; Velex, P.; Changenet, C. Windage losses in high speed gears—Preliminary experimental and theoretical results. J. Mech. Des. 2004, 126, 903–908. [Google Scholar] [CrossRef] [Scilit]
- Petry-Johnson, T.T.; Kahraman, A.; Anderson, N.E.; Chase, D.R. An experimental investigation of spur gear efficiency. J. Mech. Des. 2008, 130, 062601. [Google Scholar] [CrossRef] [Scilit]
- Akin, L.S.; Mross, J.J. Theory for the effect of windage on the lubricant flow in the tooth spaces of spur gears. J. Eng. Ind. 1975, 97, 1266–1272. [Google Scholar] [CrossRef] [Scilit]
- Anderson, N.E.; Loewenthal, S.H. Spur-Gear-System Efficiency at Part and Full Load; NASA Technical Paper; National Aeronautics and Space Administration, Scientific and technical Information Office: Hampton, VA, USA, 1980; p. 1622.
- Voeltzel, N.; Marchesse, Y.; Changenet, C.; Ville, F.; Velex, P. On the influence of helix angle and face width on gear windage losses. Proc. Inst. Mech. Eng. C J. Mech. Eng. Sci. 2016, 230, 1101–1112. [Google Scholar] [CrossRef] [Scilit]
- Concli, F.; Gorla, C.; Stahl, K.; Höhn, B.-R.; Michaelis, K.; Schultheiß, H.; Stemplinger, J.-P. Load independent power losses of ordinary gears: Numerical and experimental analysis. In Proceedings of the 5th World Tribology Congress (WTC 2013), Torino, Italy, 8–13 September 2013. [Google Scholar]
- Li, L.; Zhang, Y.; Xue, X. Optimized design and CFD analysis of drag-reduction windshields for aviation spiral bevel gears. Results Eng. 2026, 30, 110133. [Google Scholar] [CrossRef] [Scilit]
- Su, J.; Ouyang, Y.; Yin, L.; Shi, Z.; Zhou, C.; Wang, H. Advancing wind turbine gearbox durability with eco-friendly GO nanolubricants: CFD simulation–experiment synergy for understanding flow dynamics, wear suppression and surface restoration mechanisms. Tribol. Int. 2026, 213, 111034. [Google Scholar] [CrossRef] [Scilit]
- Zhu, X.; Dai, Y.; Ma, F. On the estimation of the windage power losses of spiral bevel gears: An analytical model and CFD investigation. Simul. Modell. Pract. Theory 2021, 110, 102334. [Google Scholar] [CrossRef] [Scilit]
- Dawson, P.H. Windage loss in larger high-speed gears. Proc. Inst. Mech. Eng. A Power Process Eng. 1984, 198, 51–59. [Google Scholar] [CrossRef] [Scilit]
- Daily, J.W.; Nece, R.E. Chamber dimension effects on induced flow and frictional resistance of enclosed rotating disks. J. Basic Eng. 1960, 82, 217–230. [Google Scholar] [CrossRef] [Scilit]
- Mann, R.W.; Marston, C.H. Friction drag on bladed disks in housings as a function of Reynolds number, axial and radial clearance, and blade aspect ratio and solidity. J. Basic Eng. 1961, 83, 719–723. [Google Scholar] [CrossRef] [Scilit]
- Lord, A.A. An Experimental Investigation of Geometric and Oil Flow Effects on Gear Windage and Meshing Losses. Ph.D. Thesis, University of Wales, Swansea, UK, 1998. [Google Scholar]
- ISO/TR 13593:1999; Enclosed Gear Drives for Industrial Applications. ISO: Geneva, Switzerland, 1999.
- ANSI/AGMA 6011-I03; Specification for High Speed Helical Gear Units. American Gear Manufacturers Association: Alexandria, VA, USA, 2004.
- Voeltzel, N.; Marchesse, Y.; Changenet, C.; Ville, F.; Velex, P. Preliminary numerical investigations on windage power losses generated by helical gears. In Proceedings of the International Gear Conference 2014, Lyon, France, 26–28 August 2014. [Google Scholar]
- Marchesse, Y.; Changenet, C.; Ville, F.; Velex, P. Investigations on CFD simulation for predicting windage power losses in spur gears. J. Mech. Des. 2011, 133, 024501. [Google Scholar] [CrossRef] [Scilit]
- Yang, J.; Lin, T. Novel calculation method for windage power loss of double-helical gear transmission. J. Fluids Eng. 2023, 145, 081202. [Google Scholar] [CrossRef] [Scilit]
- Ruzek, M.; Ville, F.; Velex, P.; Boni, J.B.; Marchesse, Y. On windage losses in high-speed pinion-gear pairs. Mech. Mach. Theory 2019, 132, 123–132. [Google Scholar] [CrossRef] [Scilit]
- Seetharaman, S.; Kahraman, A.; Moorhead, M.D.; Petry-Johnson, T.T. Oil churning power losses of a gear pair: Experiments and model validation. J. Tribol. 2009, 131, 022202. [Google Scholar] [CrossRef] [Scilit]
- Hill, M.J.; Kunz, R.F.; Medvitz, R.B.; Handschuh, R.F.; Long, L.N.; Noack, R.W.; Morris, P.J. CFD analysis of gear windage losses: Validation and parametric aerodynamic studies. J. Fluids Eng. 2011, 133, 031103. [Google Scholar] [CrossRef] [Scilit]
- Handschuh, M.J.; Guner, A.; Kahraman, A. An experimental investigation of windage and oil churning power losses of gears and discs. Proc. Inst. Mech. Eng. Part J J. Eng. Tribol. 2023, 237, 163–177. [Google Scholar] [CrossRef] [Scilit]
- Pallas, S.; Marchesse, Y.; Changenet, C.; Ville, F.; Velex, P. A windage power loss model based on CFD studies about several spur gears. Mech. Ind. 2012, 13, 317–326. [Google Scholar] [CrossRef] [Scilit]
- Neurouth, A.; Changenet, C.; Ville, F.; Octrue, M. Experimental investigations to use splash lubrication for high-speed gears. J. Tribol. 2014, 136, 021104. [Google Scholar] [CrossRef] [Scilit]
- Concli, F.; Gorla, C. CFD simulation of power losses and lubricant flows in gearboxes. In American Gear Manufacturers Association Fall Technical Meeting 2016; 11FTM21; AGMA: Alexandria, VA, USA, 2017; pp. 122–131. [Google Scholar]
- Laruelle, S.; Fossier, C.; Changenet, C.; Ville, F.; Koechlin, S. Experimental investigations and analysis on churning losses of splash lubricated spiral bevel gears. Mech. Ind. 2017, 18, 412. [Google Scholar] [CrossRef] [Scilit]
- Mastrone, M.N.; Concli, F. CFD simulation of grease lubrication: Analysis of the power losses and lubricant flows inside a back-to-back test rig gearbox. J. Non-Newton. Fluid Mech. 2021, 297, 104652. [Google Scholar] [CrossRef] [Scilit]
- Massini, D.; Fondelli, T.; Andreini, A.; Facchini, B.; Tarchi, L.; Leonardi, F. Computational investigation of baffle influence on windage loss in helical geared transmissions. Tribol. Int. 2018, 132, 106852. [Google Scholar]
- Pau, T.D.; Korka, Z.I.; Nedelcu, D.; Hrimiuc, C. Assessing the meshing for windage power losses simulation of an orthogonal face gear. Machines 2025, 13, 341. [Google Scholar] [CrossRef] [Scilit]
- KISSsoft Gear Design Software. Available online: https://www.kisssoft.com/en/products/product-overview/kisssoft-elements/brochures/brochure (accessed on 22 March 2026).
- Dassault Systèmes. SOLIDWORKS Flow Simulation Technical Reference. 2025. Available online: https://help.solidworks.com/2025/english/SolidWorks/cworks/r_SOLIDWORKS_Simulation_Reference.htm (accessed on 22 March 2026).
- Quiban, R.; Changenet, C.; Marchesse, Y.; Ville, F. Experimental investigations about the power loss transition between churning and windage for spur gears. J. Tribol. 2021, 143, 1–6. [Google Scholar] [CrossRef] [Scilit]
- Li, L.; Wang, S. Research on the calculation method of windage power loss of aviation spiral bevel gear and experiment verification. Proc. Inst. Mech. Eng. Part E J. Proc. Mech. Eng. 2023, 239, 706–716. [Google Scholar] [CrossRef] [Scilit]
- Li, L.; Wang, S. Experimental Study and Numerical Analysis on Windage Power Loss Characteristics of Aviation Spiral Bevel Gear with Oil Injection Lubrication. Stroj. Vestn. J. Mech. Eng. 2023, 69, 235–247. [Google Scholar] [CrossRef]
- Dai, Y.; Yang, C.; Liu, H.; Zhu, X. Analytical and Experimental Investigation of Windage–Churning Behavior in Spur, Bevel, and Face Gears. Appl. Sci. 2024, 14, 7603. [Google Scholar] [CrossRef] [Scilit]
- Dai, Y.; Yang, C.; Zhu, X. Investigations of the Windage Losses of a High-Speed Shrouded Gear via the Lattice Boltzmann Method. Appl. Sci. 2024, 14, 9174. [Google Scholar] [CrossRef] [Scilit]

Disclaimer/Publisher’s Note: The statements, opinions and data contained in all publications are solely those of the individual author(s) and contributor(s) and not of MDPI and/or the editor(s). MDPI and/or the editor(s) disclaim responsibility for any injury to people or property resulting from any ideas, methods, instructions or products referred to in the content. |
© 2026 by the authors. Licensee MDPI, Basel, Switzerland. This article is an open access article distributed under the terms and conditions of the Creative Commons Attribution (CC BY) license.