


Abstract
Observations of photoelectric conversion in Fe- and Mn-rich semiconductor mineral coatings highlight their potential role in the origin of life and the evolution of environmental conditions. However, natural silicate minerals, which make up most of the Earth’s crust, are generally considered wide-bandgap insulators and are not expected to exhibit a photoelectric effect. In this study, we experimentally confirm measurable impurity-like photoelectron activity in natural silicate minerals and explore possible regulatory mechanisms. We show that electron-active elements (e.g., structural Fe and Ti) and lattice defects in minerals such as pyroxene and mica can reduce the optical gap (Eopt) to below ~4.13 eV, producing small photocurrents ranging from 0.010 to 0.114 μA/cm2 on ITO substrates (background signal excluded). The structural types of these minerals—chain, island, layer, and framework—may influence their photoelectric responses by affecting electron transport pathways. Notably, light wavelength strongly controls both the photoelectric relative activity (PRA = 3–10 for silicates) and the decay kinetics (0.002–0.021 s−1) of minerals. Visible light (400–800 nm) markedly enhances photocurrent densities in low-bandgap minerals such as limonite (Eopt = 2.11 eV). In contrast, ultraviolet light (UVB, 300 nm) enhances photoelectric responses in high-bandgap minerals, including feldspar and quartz (Eopt = 4.31 and 6.08 eV, respectively). Multivariate statistical analysis further indicates that elemental composition governs spectroscopic features that influence photoelectric behavior. Among these, Fe, Al, Si, and Ti are identified as key regulatory elements. These results provide new insights into the role of natural silicates in photoelectron-driven environmental and geological processes and highlight the potential of silicate-based materials for solar energy conversion applications.
1. Introduction
The terrestrial surface is widely covered by natural semiconductor coatings, which are mainly composed of iron and manganese oxides [1]. Under visible (Vis) light (400–800 nm), these coatings can generate stable photocurrents. This process drives elemental cycling in the Earth’s critical zone and supports microbial metabolism and pollutant transformation [2,3,4]. In addition, before and during the intervals between the two Great Oxidation Events, the Earth’s surface was exposed to intense ultraviolet (UV) radiation (150–280 nm) [5]. Under such conditions, mineral-driven photochemical reactions provided a key energetic basis for the emergence of life and represented an important class of surface processes [6,7]. Together, these findings have reshaped current views of energy cycling at the Earth’s surface.
Classical natural semiconductor minerals are mainly metal oxides and metal sulfides. Most of these minerals show maximum photoelectric absorption at wavelengths between 249 and 777 nm [8]. With the exception of baddeleyite (ZrO2, Eg = 5.0 eV) and romarchite (SnO, Eg = 4.2 eV), the bandgaps (Eg) of most semiconductor minerals are below 4.0 eV, corresponding to excitation wavelengths longer than 310 nm [9]. Common surface semiconductor minerals include iron oxides (e.g., goethite, hematite, ferrihydrite, and magnetite) [10,11], titanium oxides (e.g., rutile and anatase) [12], and manganese oxides (e.g., birnessite) [13]. These Fe-, Mn-, and Ti-bearing oxides typically occur as colloids ranging from nanometer to centimeter scales [14,15,16]. They respond strongly to visible light and exhibit efficient photoelectric conversion, as demonstrated by numerous previous studies [17,18,19,20].
Beyond these secondary metal minerals, primary silicate minerals are ubiquitous on the Earth’s surface. They account for more than 90% of the Earth’s crust [21]. Despite their abundance, their photoelectrochemical properties have long been neglected because of their intrinsically wide bandgaps (Eg > 5 eV) [21,22], which classify them as electrical insulators. Recent advances in materials science and physical chemistry, however, have revealed the potential of silicate minerals as photoelectric materials. For example, studies on Fe3+-doped forsterite (Mg1−xFexSiO4) show that increasing Fe3+ content markedly reduces the bandgap [23], from 4.5 eV at x = 0.01 to 4.22 eV at x = 0.11. In contrast, pure forsterite (Mg2SiO4) has a bandgap of 8.4 eV [24]. First-principles density functional theory (DFT) calculations for pyroxene with a NaAlSi2O6 structure indicate that substitution of Tl3+ for Al3+ can reduce the bandgap from 5.3 eV to below 3.0 eV [25]. In addition, Ca and Cl doping has been reported to decrease the bandgap of natural biotite to 3.1–3.4 eV [26].
In natural systems, transition metal elements, most commonly Fe and Ti, are frequently incorporated into silicate minerals through isomorphous substitution [27]. They may occur as major constituents, such as structural Fe in pyroxene, or as trace impurities, such as Fe in kaolinite, and are typically electron-active [28,29,30,31]. Together with lattice defects, these elements can introduce localized energy levels within the bandgap [32,33,34]. This process effectively narrows the bandgap and increases the likelihood of photoelectric conversion [35,36,37].
To date, studies on the photoelectric properties of silicate minerals have been largely limited to theoretical calculations [25,33,36], artificial doping experiments [23,26], photocatalytic degradation of pollutants in suspension systems [38,39,40], and the construction of mineral-supported photoelectrodes [41,42]. The intrinsic photoresponse of natural silicate minerals in direct active electrode systems has not yet been experimentally demonstrated. Moreover, the relationships between photoelectric response, crystal structure, and light wavelength remain poorly understood. The statistical links among elemental composition, spectral characteristics, and photoelectric performance are also insufficiently quantified.
To address these questions, we examined 20 natural samples, including silicate minerals, associated iron and titanium oxides, and representative samples of basalt, paleosol (deep-time soil), and modern soil. We combined comprehensive spectroscopic characterization X-ray diffraction (XRD), X-ray fluorescence (XRF), UV–Vis diffuse reflectance spectroscopy (UV–Vis DRS), X-ray photoelectron spectroscopy (XPS), electron paramagnetic resonance (EPR), and photoluminescence (PL) spectroscopy with photoelectrochemical measurements (i–t) and multivariate statistical analysis. This study aims to: (1) experimentally verify the photoelectric activity of natural silicate minerals in direct electrode systems; (2) clarify how phase composition and crystal structure modulate photoelectric responses; (3) resolve wavelength-dependent regulation under UVB and visible light; and (4) establish quantitative correlations among elemental composition, spectral characteristics, and photoelectric performance. Together, these results provide a mechanistic basis for understanding photoelectric effects in natural silicates during surface environmental and geological processes and demonstrate the application potential of silicate-based materials.
2. Experimental Sections
2.1. Acquisition and Preprocessing of Mineral Materials
The mineral samples (Table S1) were crushed and manually selected under a 100× optical microscope. They were cleaned sequentially with anhydrous ethanol and distilled water, then ground to 200 mesh using a planetary ball mill with agate jars and a vibrating mill. The resulting powders were ultrasonically cleaned four times with anhydrous ethanol and distilled water, freeze-dried by centrifugation, and stored in a drying cabinet at 25 °C until further analysis. Details of the mineral selection criteria are provided in Text S1, and representative sample photographs are shown in Figure S1.
2.2. Mineral Characterization Methods
X-ray diffraction (XRD) analysis of the 200-mesh mineral powders was performed using an Empyrean diffractometer (Malvern Panalytical, Almelo, The Netherlands) with Cu Kα radiation (λ = 1.5406 Å), operated at 40 kV and 40 mA. Diffraction data were collected over a 2θ range of 4–70° at a scan rate of 1° min−1 with a step size of 0.026°. Phase identification was carried out using Jade 9.0 with the PDF-4+ (2009) database. For multiphase samples, such as rocks and soils, semi-quantitative phase analysis was conducted using the Rietveld refinement method implemented in HighScore software (version 3.0.5). Some XRD patterns were obtained from commercial analytical services (see notes in Table S1). In addition, two basalt samples were examined by polarizing optical microscopy (Leitz SM-LUX-POL, Ernst Leitz GmbH, Wetzlar, Germany).
For elemental analysis by XRF (PANalytical Axios-WDX), samples were fused with a Li2B4O7-LiBO2 flux (1:1) at 1000 °C for 4 min and cooled to form homogeneous glass discs. Loss on ignition (LOI) was determined from the mass loss after heating at 1000 °C for 20 min in air. Milligram-scale Fa and Ttn samples were analyzed by inductively coupled plasma optical emission spectrometry (ICP-OES; Thermo Fisher Scientific iCAP™ PRO XP, Thermo Fisher Scientific Inc., Waltham, MA, USA).
UV–Vis diffuse reflectance spectra (200–800 nm) were acquired at 1 nm intervals using a Shimadzu UV-3600 Plus spectrophotometer (Shimadzu Corporation, Kyoto, Japan) equipped with an integrating sphere. BaSO4 was used as the white reference. Reflectance data were converted to absorption using the Kubelka–Munk (K–M) function. Absorption peak identification and spectral integration were performed using Origin 2021. After normalization, direct and indirect bandgaps were estimated from Tauc plots according to the following relations:
The function F(R∞) is defined as the K–M function, where R∞ represents the relative diffuse reflectance.
α, h, v, and C represent the light absorption coefficient, Planck’s constant, frequency, and a constant, respectively. Eg indicates the bandgap width, where n is taken as 1/2 for direct bandgap materials and as 2 for indirect bandgap materials.
XPS of four selected minerals (Aug, Ol, Bt, and Chl) was performed using a Thermo Scientific Nexsa spectrometer (Thermo Fisher Scientific Inc., Waltham, MA, USA) with a monochromatic Al Kα source (hν = 1486.6 eV) under ultra-high vacuum (≤5 × 10⁻⁸ mbar). Survey scans were recorded with a 400 μm spot over the 0–1350 eV range (1.0 eV step, 100 eV pass energy). High-resolution scans of Fe 2p, Ti 2p, O 1s, and C 1s were collected with 0.05 eV step, 50 eV pass energy, ≥2 min per region, and signal-to-noise ratio > 20. Charge correction was applied using the C 1s peak at 284.8 eV, and spectra were deconvoluted with Avantage software (version 5.9931). Valence band spectra were acquired under similar conditions (200 μm spot, 50 eV pass energy, 20 to −5 eV range, 0.020 eV step, 4 scans).
EPR measurements were performed on a Bruker ESR5000 spectrometer (X-band) (Bruker GmbH, Karlsruhe, Germany) at room temperature. Oxygen vacancy signals were measured from 20 mg of dry mineral powder packed in 4 mm quartz tubes. For radical trapping, 4 mg/mL samples were dispersed in deionized water (for ·OH) or methanol (for ·O2−). A 100 μL aliquot of the suspension was mixed with 2 μL of DMPO (100 mM), loaded into quartz capillaries, and irradiated with a 300 W xenon lamp (200–800 nm) for 10 min. The samples were then sealed in quartz capillaries for analysis. Dark controls were prepared using the same procedure without irradiation.
Five minerals (Aug, NM_Hd, GD_Hd, Tr, and Bt) were selected for photoluminescence (PL) spectroscopy tests, which were conducted using a FluoroMax-4 fluorescence spectrophotometer (HORIBA, Kyoto, Japan). Further experimental details are provided in the Text S2.
2.3. Preparation of Mineral Electrodes and Photoelectrochemical Testing Methods
Electrode preparation and electrochemical methods were adapted from Lu et al. [1]. Mineral powder (200 mesh) was further ground in an agate mortar and passed through a 400-mesh sieve (<38 μm) to prepare the mineral electrodes (Figure 1A; detailed procedures are provided in Text S3).
Figure 1.
Preparation of mineral electrode and photoelectrochemical testing. (A) Illustrates the processes of mineral grinding and electrode sheet encapsulation; (B) Depicts the schematic of the three-electrode system testing; (C) Shows the working electrode sheets used in some tests (after coating).
Photoelectrochemical measurements were conducted in a standard three-electrode system (Figure 1B,C). The mineral film served as the working electrode (effective area 2 cm2), a graphite rod (6 mm diameter, purity > 99.99%) as the counter electrode, and an Ag/AgCl electrode (+0.197 V vs. SHE, 25 °C) as the reference. The electrolyte was 0.1 M KH2PO4 (pH 6.5 ± 0.1) maintained at 25 ± 0.5 °C in a 150 mL quartz cell. Time-resolved photocurrents were recorded at a bias of 1 V (vs. SCE) using an LK2010 workstation (Tianjin Lanlike Co., Ltd., Tianjin, China). Illumination was applied from the back side through a 300 W Xe lamp (200–800 nm, 80 mW/cm2) or LED sources (UVB 300 nm or Vis 400–800 nm, each 15 mW/cm2). Each test included six light/dark cycles (50 s on/50 s off) over 600 s. Light intensity was measured with an optical power meter (OHSP-350; Haopu Optoelectronic Technology Co., Ltd., Hangzhou, China). Detailed spectral data and additional experimental procedures are provided in Figure S2 and Text S4.
2.4. Photocurrent Decay Index Model
To account for the instrument’s filtering response, the photocurrent decay was fitted with a first-order RC circuit. The apparent photocurrent (illuminated current minus dark current) was obtained from the photocurrent–time curve.
Data were fitted using the Asymptotic model in Origin 2021 with the Levenberg–Marquardt algorithm. The model equation is as follows:
The above equation corresponds to the RC circuit model equation:
a—The steady-state current value after a prolonged period is achieved, thereby fully conforming to Equation (4) when this parameter is equal to zero.
b—The absolute value of the difference between the initial moment y and the steady-state value a corresponds to V0 in Equation (4).
c—The exponential decay factor, which determines the rate of decay, corresponds to exp(−1/(RC)) in Equation (4), where RC represents the time constant of the circuit, thereby influencing the speed of decay.
The decay rate constant k, which reflects the decay performance of mineral electrodes, can be readily obtained through the following transformation:
2.5. Statistical Analysis
Statistical analyses were performed using SPSSPRO (https://www.spsspro.com) for significance testing and Origin 2021 (Correlation Plot plugin) for correlation analysis and visualization. Data normality and variance homogeneity were verified prior to analysis. Mantel tests and associated plots were conducted in R Studio 2025 (code provided in Text S5 and Table S6). Crystal structures were rendered using VESTA (version 3.5.8). Other figures were prepared in Origin 2021 and PowerPoint 2016, with final editing in Photoshop 2017 and Illustrator 2020.
3. Results
3.1. Mineralogical Features
Mineral samples were classified into nine groups based on their distinctive properties (Table 1). Corresponding XRD patterns and elemental compositions are provided in Figure S3 and Table 2.
Table 1.
The mineral compositions and identification results of all samples.
Table 2.
Elemental composition information of mineral samples.
All major diffraction peaks matched the expected characteristics. For example, the pyroxene group (Aug and Hd) showed a peak at 29.88° corresponding to the crystal plane, and the olivine group displayed the 112 crystal plane peak. Some samples, however, exhibited impurity peaks (Figure S3A) or specific elemental features (Table 2). No accessory mineral peaks were detected in the pyroxene group (Aug, NM_Hd, and GD_Hd). In contrast, the olivine sample Cas_Fa, primarily iron-doped forsterite, showed amphibole and clay impurity peaks, while the Ol sample exhibited an enstatite peak at 28.32° (221 crystal plane). Gem-quality titanite (Ttn) showed no secondary phases, indicating high purity. In the amphibole/mica group, Tr contained a chlorite peak, and Bt showed a minor quartz peak. Within the feldspar/quartz group, Ab included a quartz peak, whereas Clear_Qtz showed no impurity peaks. For the clay minerals, Mk (kaolinite calcined at 900 °C) displayed broadened aluminum silicate peaks and an anatase peak at 25.3°, while Kln contained weak quartz (101 plane) and illite (002 plane) peaks. Chl showed no impurity peaks.
Elemental analysis showed elevated Ti in Aug, Bt, Chl, and Mk (0.8%–1.1%), in contrast to <0.1% Ti in olivine and other primary minerals. Aug contained higher Al and Mg (10.5%–14.6%) than Hd samples (NM_Hd and GD_Hd, 1.62%–2.71%), reflecting enrichment from impurities. Mafic minerals, including pyroxene, olivine, and amphibole, had Fe contents of 5.6%–19.2% (Table 2).
Iron and titanium oxide peaks matched standard reference patterns, although natural samples showed additional features. Lm contained hematite as the dominant phase and goethite, with quartz and amorphous components, likely SiO2 and ferrihydrite. Ilm’s main peak corresponded to its reference pattern, consistent with the white particles observed in the mineral photograph (Figure S1B(h1)).
The basalt samples (EM_Basalt and HN_Basalt) were mainly composed of monoclinic pyroxene and plagioclase, with minor ilmenite and siderite (Figure S3B). Thin-section microscopy showed well-preserved primary mineral crystals (Figure S4). EM_Paleosol contained ~16% quartz, dominated by hematite and montmorillonite, with ~7% rutile. The Yellow-Red Soil standard sample (GBW07405 [GSS-5]) comprised 48% quartz, 37% kaolinite, and 14% hematite.
3.2. Electronic Structure and Defect Characterization
UV–Vis analysis showed minimal visible-light absorption (400–800 nm) in most silicate minerals, except for Fe- and Ti-oxide-enriched samples. Absorbance followed the order: iron oxides (8–16 a.u.) > titanium oxides (6–9 a.u.) > mafic silicates and rocks/soils (2–8 a.u.) > clays and the feldspar/quartz group (0–1 a.u.) (Figure 2J). Absorption edges and characteristic peaks are annotated in Figure 2A–I and Figure S7. Raw, non-normalized spectra are shown in Figure 2J and Figure S9.
Figure 2.
The UV-DRS spectra of the samples. The normalized K–M spectral values (A–I) and the absolute values (non-normalized K–M [F(R)]) of the spectra ((J) or Figure S9). The tangent lines in the figure indicate the position of the absorption edge. Abs denotes the absorbance.
Primary silicate minerals exhibited strong UV absorption (200–400 nm), with the order Aug > Hd > Bt > Tr > Cas_Fa > Ol > Fa (Figure 2J). The peak at 240–270 nm corresponds to Fe3+/Fe2+–O charge transfer [43]. A weak feature at ~205 nm may be related to Ti orbital transitions [44,45,46]. Rock and soil samples followed the order EM_Basalt > HN_Basalt > EM_Paleosol (Figure 2J). EM_Paleosol showed lower overall absorbance due to clay enrichment and compaction. However, it displayed enhanced visible absorption from hematite compared with fresh basalts.
Iron oxides showed strong UV–Vis absorption across 200–800 nm, with Lm exhibiting the highest absorbance. The Lm spectrum showed characteristic peaks at 250, 333, and 500 nm (Figure 2G). These peaks correspond to O 2p → Fe3+ t2g transitions [47] and form a broad band consistent with its mixed-phase composition of goethite, hematite, and amorphous phases. Syn_Hem and Syn_Gt exhibited lower absorbance than Lm, suggesting multiphase enhancement effects [48]. The hematite-dominated Yellow-Red Soil maintained high absorption across the full 200–800 nm range.
Ilm showed broad absorption across 200–800 nm, which is characteristic of an indirect bandgap semiconductor requiring phonon-assisted transitions [49]. Rutile impurities may form heterojunctions and further extend the absorption range. Syn_Ant and Syn_Rt exhibited predominantly UV absorption, with cutoff wavelengths at 380 nm and 400 nm, respectively. Ttn showed stronger UV absorption than the titanium oxides (Figure 2J) and featured a peak at 205 nm attributed to O → Ti4+ charge transfer [50].
Clear_Qtz showed negligible visible-light absorption due to its wide bandgap, with significant absorption confined to wavelengths below 200 nm (vacuum UV region). Ab exhibited weak UV absorption below 300 nm. Kln and Mk absorbed weakly below 350 nm, with Kln showing peak broadening related to amorphous aluminosilicates. In contrast, Fe-rich Cln (13.84% Fe) showed much stronger UV absorption between 200 and 350 nm than the other clay minerals (Figure 2J).
Because of the extremely low absorbance of Clear_Qtz and Ab, these samples were used as baseline references (negative controls) in subsequent photocurrent measurements of natural minerals. A detailed discussion of photocurrent measurement errors is provided in Section 4.1.
Photoluminescence (PL) spectroscopy showed similar impurity-related emission peaks in the five minerals Aug, NM_Hd, GD_Hd, Tr, and Bt (Figure S8), likely reflecting their common mafic composition. A detailed discussion is presented in Section 4.1.
Tauc plot analysis (Figure 3) and absorption edge calculations (Figure 2A–I) indicated direct bandgap transitions in all samples. Indirect bandgap data are shown in Figure S5.
Figure 3.
Tauc plot of samples with tangent indicating optically direct bandgap position (A–I). The intersection point of the tangent line with the x-axis gives the estimated Tauc gap or optical gap (Eopt).
The analysis focused on silicate minerals with optical gaps lower than 4.13 eV. This value corresponds to a wavelength of 300 nm, which represents the shortest wavelength of contemporary solar radiation at the Earth’s surface [51]. This range covers part of the UVB (280–320 nm) and the entire UVA (320–420 nm) spectral region [52]. Minerals with Eopt ≤ 4.13 eV included the pyroxene group (Aug and Hd), the olivine group (Cas_Fa), titanite (Ttn), the amphibole/mica group (Tr and Bt), clay minerals (Chl, Mk, and Kln), and basalt samples (EM_Basalt and HN_Basalt). In contrast, olivine samples Ol and Fa required excitation in the UVC range (180–280 nm) [52] because of their higher optical gaps (Eopt > 4.5 eV).
Direct calculation of bandgaps (Eg) for natural minerals using the Tauc method may introduce uncertainties. These mainly arise from the compositional heterogeneity of mineral powders, such as lattice defects, secondary alteration, and impurity interference, as well as from scattering-induced shifts in the absorption edge [53]. Nevertheless, UV–Vis spectra (Figure 2A–I) show that most silicate minerals have absorption edges above 320 nm. Combined with their full-spectrum absorption intensity (Figure 2J), this suggests that silicate minerals have potential photoelectric responses over the 200–800 nm range.
In this study, Eopt values are used only as approximate references. The estimated Eopt of mafic silicates is particularly informative. For natural silicates, photoelectric behavior is controlled by multiple spectroscopic parameters. Overall light absorption capacity is critical, whereas Eopt serves as an auxiliary reference in the weak-photocurrent measurement system used here (Section 3.5 and Section 4.4).
In contrast, iron and titanium oxides exhibited typical semiconductor bandgaps (Eopt = 2.1–3.8 eV). The measured bandgaps of Syn_Hem (Eopt = 2.15 eV) and Syn_Gt (Eopt = 2.75 eV) were slightly different from benchmark values reported by Sherman for hematite (2.2 eV) and goethite (2.5 eV) [54]. This difference may be related to variations in lattice defects or surface hydroxylation. The bandgaps of Syn_Ant (Eopt = 3.49 eV) and Syn_Rt (Eopt = 3.25 eV) agreed well with values reported by Zanatta [55].
XPS analysis of four silicates (Aug, Ol, Bt, and Chl) detected all major elements (Figure 4A), except trace Ti. The Chl sample showed extremely high purity (treated as 100%, Table 1). Therefore, the Fe 2p signal near 710 eV can be attributed entirely to the silicate bulk phase. The Fe/Si atomic ratio obtained by XPS (<0.1) was significantly lower than that measured by XRF (0.1–0.3) (Figure 4A). This low XPS Fe/Si ratio confirms the absence of surface iron oxide phases, which would otherwise increase this ratio [56]. Accordingly, the Fe 2p signals at ~710 eV in all four silicates originate from structural Fe in the bulk phase.
Figure 4.
XPS and EPR characterization of four mineral samples (Aug, Ol, Bt, and Chl). (A) The survey spectrum of XPS; (B–E) Fe 2p high-resolution spectra; (F–I) O 1s high-resolution spectra; (J,K) Ti 2p high-resolution spectra (with Ti signals detected only in Aug and Bt); (L) EPR defect signals; (M) EPR OH signals; (N) EPR ·O2– signals; (O) The positive correlation between EPR signal intensity and photocurrent response intensity (Section 4.1).
High-resolution Fe 2p spectra indicate mixed Fe2+/Fe3+ states in all samples (Figure 4B–E) [57]. Trace Ti4+ was detected only in Aug and Bt (<1%; Figure 4J,K). The O 1s spectra suggest the presence of defect oxygen in these silicates (Figure 4F–I). The peak near 531 eV (metal–O) is attributed to Fe–O, Ti–O, Ca–O, and Al–O bonds [58]. The peak near 532 eV (vacancy–O) is associated with oxygen vacancies as well as Mg–O and Si–O bonds [57,59]. The existence of oxygen vacancies is further supported by EPR signals (g = 2.004; Figure 4L). EPR measurements detected irradiation-induced reactive oxygen species (·OH and ·O2−) under 200–800 nm illumination (Figure 4M,N), confirming the photoelectric activity of silicates. Based on the relative intensities of defect and radical signals, the photoelectric performance followed the order: Aug > Ol > Bt > Chl (Figure 4L–N).
The band edge positions are provided in Figure S12. Their valence band potentials are sufficiently positive to oxidize common substrates (e.g., H2O), suggesting that photoexcited electron–hole pairs in silicate minerals maybe participate in driving redox electron transfer processes at the Earth’s surface.
3.3. Photocurrent Curve Characteristics of Mineral Electrodes Under Different Light Sources
UV-DRS analysis of optical gaps indicates that silicate minerals possess photoelectrochemical potential. This was further verified by i–t measurements using mineral electrodes, which produced measurable photocurrents.
All mineral electrodes generated distinct photocurrent responses under different light sources. Average photocurrent densities ranged from 0.021 to 0.322 μA cm−2 (Figure 5A and Figure 7A1), 0.045 to 1.508 μA cm−2 (Figure 5B and Figure 7A2), and 0.010 to 0.067 μA cm−2 (Figure 5C and Figure 7A2). Under Xe_200–800 nm and LED_400–800 nm illumination, most mineral electrodes exhibited higher photocurrents than the blank electrode (curve labeled 0), indicating photoelectron generation by the mineral coatings. In contrast, under UVB irradiation (LED_300 nm), the photocurrents of all minerals were lower than that of the blank electrode, except for titanium oxide. This behavior is attributed to the dominant photocurrent contribution from the ITO substrate, whose absorption edge is near 320 nm (Figure S6), thereby masking mineral signals. The influence of ITO under UVB illumination is discussed in Section 4.1. At identical light intensity (15 mW cm−2), UVB-induced photocurrents (Figure 5B) were higher than those under visible light (Figure 5C), reflecting the higher photon energy in the UVB range.
Figure 5.
Time-dependent photocurrent curves of mineral electrodes during light-dark cycles over 600 s under three different light sources. (A) Photocurrent curve under Xe_200–800 nm illumination (yellow gradient curve); (B) Photocurrent curve under LED_300 nm illumination (red gradient curve); (C) Photocurrent curve under LED_400–800 nm illumination (blue gradient curve). The numbered labels and the dashed lines connecting the figures represent the corresponding minerals for each curve, with the axis colors corresponding to the scale bar colors.
Photocurrent response curves exhibited three distinct patterns under all illumination conditions. (1) Gradual type (Figure 5, Nos. 1–14, 18, 21, and 24), observed in primary silicates and secondary aluminum silicate minerals, showed stable and uniform photocurrents with slow decay rates (<5% min−1). This behavior indicates inefficient charge separation and migration. (2) Sharp type (Figure 5, Nos. 15–17, 19, and 22–23), represented by iron oxides (Syn_Hem and Syn_Gt), rutile (Syn_Rt), and iron-oxide-rich soils (EM_Paleosol and Yellow-Red Soil), displayed rapid excitation (response time < 0.1 s) followed by fast decay (>20% s−1), resulting in narrow current peaks. (3) Slow-response type (Figure 5, No. 20) was observed only for anatase (Syn_Ant). It showed a delayed rise (>5 s) with a pronounced lag, consistent with previous reports [60].
Photocurrent responses of the same mineral varied markedly with light source. Gradual-type minerals maintained similar curve shapes under all illumination conditions. In contrast, sharp-type minerals lost their characteristic peak under UVB irradiation (Figure 5B, Nos. 15–17). This likely results from photon energies near 300 nm exceeding the optimal excitation range of iron oxides (500–600 nm), which reduces charge separation efficiency. Anatase exhibited its slow-response behavior only under full-spectrum Xe illumination (200–800 nm; Figure 5A, No. 20) and behaved as a gradual-type material under isolated UVB or visible light (Figure 5B,C, No. 20).
3.4. Photocurrent Density and Decay Characteristics of Mineral Electrodes Under Different Light Sources
Figure 6 shows the decay curves of all mineral electrodes. All curves fit the exponential model well (Section 2.4, Equations (3)–(5)), with R2 > 0.99. Fitting parameters are listed in Tables S2–S4. The decay rate constants ranged from 0.006–0.018 s−1 under Xe irradiation, 0.003–0.007 s−1 under UVB, and 0.002–0.021 s−1 under visible light.
Figure 6.
Decay fitting curves of different mineral electrodes under illumination using three different types of lamps. Fitting curves for the photocurrent decay of each mineral electrode under light source of Xe (A1–A9), LED_UVB (B1–B9) and LED_Vis (C1–C9), where the scatter points represent the photocurrent densities for each cycle, and the dashed lines indicate the fitted curves along with their 95% confidence error limits; Photographs of three different light sources (A10, B10, and C10).
Under Xe illumination (200–800 nm, 80 mW cm−2), average photocurrent densities followed the order: titanium oxides (0.053–0.322 μA cm−2) > iron oxides (0.062–0.167 μA cm−2) > primary silicate minerals (0.033–0.108 μA cm−2) ≈ rock and soil mixtures (0.046–0.105 μA cm−2) > clay minerals (0.021–0.071 μA cm−2) (Figure 7A1). Ilm and Syn_Gt showed lower responses than other samples in their groups. Ab and Clear_Qtz exhibited the weakest signals among primary silicates. Kln showed the lowest response among clay minerals.
Figure 7.
Average photocurrent and decay rate of mineral electrodes under different illumination types and mineral structures. (A1,A2) Comparison of average photocurrent densities of each mineral electrode, with the same dashed box indicating the same mineral types; (B,C) Differences in average photocurrent density and decay rates of mineral electrodes under three types of light sources (using the Friedman test); (D) Decay rates of all mineral electrodes; (E) Ranking of photoelectric relative activity among different mineral electrodes; (F) Differences in photocurrent density between mafic and felsic minerals (using the Kruskal–Wallis test); (G) Differences in photocurrent density among four structural types of silicate minerals; (H) Ternary diagram of WPD-Wk-PRA for different mineral electrodes, where the abbreviations WPD, Wk, and PRA represent weighted photocurrent density, weighted k, and photoelectric relative activity, respectively.
Under 300 nm LED irradiation (15 mW cm−2), photocurrent densities ranked as follows: titanium oxides (0.058–1.508 μA cm−2) > primary silicate minerals (0.070–0.114 μA cm−2) ≈ rock and soil mixtures (0.045–0.111 μA cm−2) > clay minerals (0.045–0.091 μA cm−2) > iron oxides (0.040–0.065 μA cm−2) (Figure 7A2, blue circles). This trend differs from that under full-spectrum Xe illumination, where iron oxides produced lower photocurrents than silicates at 300 nm. Clear_Qtz and Ab showed enhanced UVB responses compared with their Xe (200–800 nm) results.
Under 400–800 nm LED illumination (15 mW cm−2), photocurrent densities followed the order: iron oxides (0.018–0.068 μA cm−2) > titanium oxides (0.022–0.026 μA cm−2) ≈ rock/soil mixtures (0.012–0.033 μA cm−2) > primary silicates (0.009–0.025 μA cm−2) > clay minerals (0.010–0.019 μA cm−2) (Figure 7A2, red circles). This trend differs from that under UVB irradiation, where iron oxides produced higher photocurrents than silicates. Under visible light (400–800 nm), titanium oxides approached the performance of silicate minerals, while Clear_Qtz and Ab remained weakly responsive.
Mineral electrodes exhibited significantly different photocurrent densities (p ≤ 0.01) under three wavelength ranges. UVB irradiation produced a higher median photocurrent (0.075 μA cm−2) than visible light (0.021 μA cm−2) (Figure 7B). In contrast, the decay rate constants (k) showed no significant differences (Figure 7C). Comparisons between UVB and visible conditions are valid because the light intensity (15 mW cm−2) and experimental setup were identical.
Iron oxides exhibited significantly higher photocurrent decay rates than other minerals under Xe and visible light (Figure 7D), indicating poorer electrode stability during cycling. Under UVB irradiation, Syn_Hem, Syn_Rt, and EM_Paleosol showed accelerated decay behavior (Figure 7D). The photoelectric relative activity (PRA), defined as the ratio of photocurrent density under UVB to that under visible light, varied widely (1–64). The highest PRA values were observed for titanium oxides, while iron oxides showed the lowest values (Figure 7E).
Across all light sources, mafic silicates consistently produced higher photocurrents (0.02–0.08 μA cm−2) than felsic silicates (0.01–0.08 μA cm−2) (Figure 7F). With expanded sampling, Kln was reclassified as felsic based on its light color. Photocurrent intensity varied systematically with silicate structure. It decreased from chain to island to layer to framework types, except for an enhanced UVB response in framework silicates (Figure 7G).
The photoelectrochemical performance of different mineral electrodes was compared using a simplified evaluation method based on the WPD, Wk, and PRA metrics. The definitions of WPD and Wk are as follows:
Here, Photocurrent refers to average photocurrent density and k represents the decay rate. UVB light was assigned a lower weight given its minor energy contribution to solar UV. All equation parameters were log-transformed and normalized prior to analysis.
As shown in the ternary diagram WPD–Wk–PRA, three colored parallelogram regions represent distinct mineral performance zones (Figure 7H). The felsic zone (red) is defined by low WPD and Wk values and high PRA, including samples such as Ab, Qtz, and Kln. The mafic zone (gray) shows moderate WPD and PRA with low Wk, mainly comprising primary mafic silicates and EM_Basalt. The Fe-rich oxides zone (green) is characterized by high WPD and Wk values and low PRA, representing iron oxides, EM_Paleosol, and Yellow-Red Soil.
3.5. The Interrelationship Among Elemental, Spectral, and Photoelectrochemical Indicators of Minerals
To further clarify the influence of spectroscopic and elemental indicators on photocurrent parameters, the data were classified into three levels: major categories, subdivided indicators, and single indicators (Table S5 for details). We found illumination conditions strongly affected these correlations
Spectroscopic and electrochemical parameters were closely linked, serving as core photoelectric performance indicators (Figure 8A). Under Xe and visible light, absorption characteristics (Edge, Peak, Area) positively correlated with photocurrent intensity and decay rate constant (p ≤ 0.05). In contrast, the optical gap showed negative correlations due to lower light absorption at wider gaps. Under UVB irradiation (300 nm), only a negative correlation between Photocurrent and Area_400–800 nm was observed (p ≤ 0.01). Wavelength-dependent patterns were evident from elliptical distributions in the heatmap (Figure 8A), indicating inverse regulatory mechanisms of mineral light absorption under different wavelengths.
Figure 8.
Correlation network of spectral, electrochemical, and elemental indicators among 24 minerals. (A) Heatmap of correlations between spectral and electrochemical indicators; (B1–B3) Mantel regression plots among three matrices (electrochemical matrix, spectral matrix, and elemental matrix). Blue circles represent the transformed distance data, while the red lines indicate the regression curves between the two matrices; the shaded areas represent the 95% confidence intervals. (C) Heatmap of correlations between elemental indicators and spectral as well as electrochemical indicators, with elements represented in the form of their corresponding oxides; (D) Mantel test of the subdivisions of spectral and electrochemical indicators against the elemental matrix.
Elemental composition also influenced photoelectric performance (Figure 8C). Al negatively correlated with Peak, Photocurrent (Xe/Vis), and k_Vis (p ≤ 0.05), whereas Fe positively correlated with Edge, Area (all ranges), and k_Vis, but negatively with Band and Photocurrent_UVB. Si showed negative correlations with Area (200–800/300 nm), Photocurrent_Vis, and k_Vis. Notably, Al and Si exhibited coordinated effects, whereas Fe showed inverse behavior (Figure 8C). These trends matched elemental analysis results, showing a strong positive Al–Si correlation (p ≤ 0.01) and a negative Al–Fe relationship (Figure 8D).
Mantel analysis showed significant correlations between spectroscopic and electrochemical matrices (p = 0.002; Figure 8B1) and between elemental and electrochemical matrices (p = 0.029; Figure 8B2), but not between elemental and spectroscopic matrices (p = 0.063; Figure 8B3). Subcategory analysis indicated that Fe, Si, and Ti were strongly correlated (p ≤ 0.01) with absorption characteristics (Peak and Edge; Figure 8D). Fe was also specifically associated with photocurrent densities (p ≤ 0.01), consistent with the single-indicator analysis (Figure 8C).
In summary, mineral spectroscopic and electrochemical indicators exhibited significant but wavelength-dependent correlations, with opposite trends under UVB versus visible light. Elemental analysis showed that Fe positively influenced photoelectric performance, whereas Al and Si had negative effects. Matrix-level analysis confirmed intercorrelations among spectroscopic, electrochemical, and elemental parameters, highlighting Fe, Si, and Ti as key contributors, consistent with single-indicator results.
4. Discussion
4.1. Photocurrent Effects Induced by Impurities and Defects Level
This study is the first to use a direct electrolytic cell system with natural silicate minerals, revealing measurable photoelectrochemical activity (Figure 5 and Figure 6). Electron-active elements (e.g., Fe and Ti) and lattice defects (Figure 4) enable this activity by lowering apparent bandgaps from intrinsic values (>5 eV) to photoresponsive ranges [33,61,62,63,64,65]. Selection of “relatively pure” rather than “absolutely pure” minerals is necessary, as fully pure samples are geologically unattainable. Unlike previous micro-nano coating approaches with Fe/Mn/Ti-rich minerals [16], our bulk silicates retain high phase purity without continuous coating structures (Figure 4A).
UV–Vis spectroscopy confirms the dominant role of electron-active elements in reducing bandgaps (Eopt < 4.13 eV; Section 3.2), while characteristic peaks of trace impurities are also observed (Figure S7). XPS analysis shows Fe3+/Fe2+ and Ti4+ as the main chemical states in the silicates. Defects, primarily oxygen vacancies, further enhance photocurrent, as indicated by correlations between EPR signals (vacancies and radicals) and photocurrent density (Figure 4O).
PL spectra of mafic silicates (Aug, Hd, Tr, and Bt) display consistent impurity- and defect-related emission peaks (Figure S8B), attributed to electron–hole recombination via defect levels. An inverse correlation between luminescence intensity and photocurrent (r = −0.7, Figure S8D) reflects reduced carrier separation efficiency at higher recombination rates [66]. Although assigning specific PL peaks (397–550 nm) to particular recombination processes is challenging [67,68], the 300 nm emission edge, unrelated to impurities (Figure S8D), likely approximates the intrinsic band-to-band transition, slightly below the UV–Vis absorption edge at 320 nm.
Based on the analysis, the detected photocurrents (0.010–0.114 μA cm−2) likely arise from excitation via impurity- or defect-related energy levels associated with electron-active elements, rather than a fundamental transformation of the wide-bandgap silicate matrix into a semiconductor. This distinction is important. The signals reflect trace-level photoresponses from defects, not band-to-band semiconductor behavior. These phenomena are analogous to impurity photoconductivity in semiconductor physics. In this study, we term this phenomenon impurity-like photoelectron activity.
Measuring such weak photocurrents requires rigorous controls to avoid artifacts. High-purity silicate minerals were used as negative controls. Although synthetic olivine could, in theory, represent undoped silicates [69], its nanoparticulate form produces non-representative photoelectric properties compared with natural micron-scale samples. To address this, Clear_Qtz (crystal-grade) and Ab were chosen as high-purity, wide-bandgap controls due to their minimal light absorption (Figure S9). Clear_Qtz showed even lower absorptivity than 99.5% pure synthetic quartz (Figure S10). Its Eopt of 6.08 eV (Figure 3E) matched the reported 6.04 eV [70]. Electrodes modified with these minerals produced much weaker photocurrents than other silicates (Figure 7A1), confirming that the observed signals originate from mineral-specific absorption rather than experimental artifacts.
The influence of the ITO conductive substrate must be considered. ITO glass strongly absorbs around 320 nm (Figure S6), affecting measurements in the UVB region. Back-side illumination was used for photocurrent tests, consistent with previous studies [7]. Front-side illumination was found to produce measurement errors in natural silicate systems. Under front-side conditions, photocurrent intensities were 60%–70% lower than with back-side illumination. This is due to heterogeneous UVB exposure at the ITO–mineral interface, caused by differential light attenuation through the mineral coatings (UV penetration in minerals reaches ~0.1 mm [24], far exceeding the 2 μm film thickness). Back-side illumination, in contrast, ensures more uniform interface irradiation through ITO, optimizing photocurrent generation.
Residual ITO interference remained under both illumination modes. Most silicate minerals showed negative net photocurrents (mineral electrode minus ITO background) under UVB (Figure S11), a phenomenon rarely seen under Xe or visible light. This suggests UVB-specific inhibition of charge carriers in ITO by mineral particles, particularly at 300 nm. Positive net photocurrents under visible light (400–800 nm) confirm that photoelectron generation is driven by impurity- or defect-level excitation rather than intrinsic band-to-band transitions (Figure S11). At these wavelengths, photon energy is below ITO’s bandgap, and interference from the substrate is negligible.
While Li et al. reported strong UV-induced photocurrents in natural sulfur [7], our findings differ for fundamental reasons. First, sulfur exhibits strong band-to-band photoresponse, whereas the silicate minerals in this study show weak, defect-mediated transitions. Second, their experiments used spin-coated commercial sulfur with methanol hole scavengers, which enhanced UV photoelectric performance.
Discriminating UVB-range mineral signals from ITO interference remains challenging. We recommend using Clear_Qtz and Ab photocurrents as reference baselines in ITO-containing systems. Xe lamp and visible-light measurements, however, proved reliable (Figure S11). Future studies may benefit from in situ photoelectrochemical characterization to further resolve these effects.
Although systematic experimental errors are not the focus here, standardized coating and electrochemical procedures are critical to reduce artifacts and signal drift (Section 2.3), given the inherent decay of natural minerals (Figure 6). To minimize measurement variability, we used high-throughput electrode testing combined with statistical analysis, emphasizing mineralogical and statistical significance. The observed photoelectric responses in mafic silicates potentially persistent since the early Earth may represent a previously overlooked electron-transfer process in long-term geological evolution [71,72].
4.2. Effect of Structural Composition on Photoelectrochemical Activity in Silicate Minerals
The photoelectrochemical performance of silicate minerals appears to be related to their structural types, classified by [SiO4] unit connectivity [73]. Chain silicates (pyroxene: 0.078–0.096 μA cm−2) and island silicates (olivine: 0.081–0.102 μA cm−2) exhibit higher photocurrents than layered silicates (clays: 0.021–0.057 μA cm−2) and framework silicates (feldspar/quartz: 0.032–0.033 μA cm−2) (Figure 7G). The reactivity of Fe(II)-bearing silicate minerals under pressure with water has been calculated using DFT methods by Li et al. [74]. Their results indicate that chain and island structures (pyroxene and olivine) are more reactive than layered structures (phyllosilicates), which aligns with our findings. This difference may be linked to the electronic transmission characteristics of their crystal structures [75,76,77,78].
The photoelectrochemical response of rocks and soils generally reflects their mineral composition. Two basalt samples (>90% feldspar + pyroxene) show similar photocurrents, with EM_Basalt slightly outperforming HN_Basalt under Vis light due to a higher pyroxene/feldspar content ratio (43%/50% vs. 18%/73%). Although the Yellow-Red Soil contains a significant amount of hematite (14%), its other components are mainly kaolinite and quartz (Section 3.1), resulting in a low overall photocurrent (<0.05 μA cm−2) (Figure 6A1,A2). Surprisingly, EM_Paleosol (48.8% hematite + 7.9% rutile) shows lower currents (0.020–0.045 μA cm−2) than Ilm (0.023–0.058 μA cm−2) and Yellow-Red Soil (0.032–0.105 μA cm−2) (Figure 7A1,A2). This non-linearity indicates that mineral content alone is a poor predictor of photoelectrochemical performance.
4.3. The Modulation Mechanism of Mineral Photoelectrochemical Behavior by Light Source Wavelength
This study evaluates mineral photoelectrochemical behavior using four wavelength-dependent parameters: (1) photocurrent density, (2) UVB/Vis photoresponse ratio (PRA), (3) response curve profile (gradual, sharp, or slow type), and (4) decay characteristics, represented by the multicycle exponential constant k.
Light wavelength strongly influences mineral photoresponse. UVB (300 nm) produces the highest photocurrent in titanium oxides (Syn_Ant, Eopt = 3.49 eV; 1.5 μA cm−2), whereas visible light favors iron oxides (Lm, Eopt = 2.11 eV; 0.068 μA cm−2) (Figure 7A2). This pattern reflects the fundamental photon–bandgap matching principle: when E ≥ Eg, intrinsic band-to-band transitions dominate carrier generation; otherwise, indirect transitions through impurity or defect energy levels prevail [79,80]. Notably, primary silicates and clays exhibit 1.5–2.5 times higher photocurrent under UVB than iron oxides (Figure 7A2), likely due to their wider bandgaps (Eopt > 4 eV) and defect-enhanced UV absorption [81].
Mineral PRA values show clear wavelength-dependent stratification: iron oxides (0.96–2) < mafic silicates (3–4) < felsic silicates (7–10) < titanium oxides (8–68) (Figure 7E), reflecting the bandgap dependence of light absorption. Titanium and iron oxides have markedly different PRA values because their bandgaps respond most sensitively to different wavelengths. This pattern illustrates how light wavelength controls mineral photoelectric responses. Intermediate PRA values in mafic silicates indicate balanced UV–Vis absorption. Felsic silicates approach titanium oxide behavior due to their wide bandgaps (4.31–6.08 eV) (Figure 3). Ilm’s PRA (2.63) is close to that of iron oxides, likely due to their similar, relatively low bandgaps (2–2.8 eV) (Figure 3). Importantly, PRA scales with bandgap width but does not correlate monotonically with absolute photocurrent intensity (e.g., quartz and feldspar).
Photocurrent curve shape—gradual, sharp, or slow—dynamically reflects carrier recombination [82] and depends on both mineral type and light wavelength. Sharp-type minerals, such as iron oxides, show peak Vis responses due to bandgap matching (e.g., Syn_Hem: Eopt = 2.15 eV, Figure 3) [83]. Under UVB, excess photon energy causes peak disappearance through thermal relaxation or defect trapping [84,85]. Slow-response anatase exhibits spectral hysteresis under Xe and UVB light. This arises from indirect bandgap-induced phonon coupling, which delays charge separation [86]. Gradual-type silicates maintain stable responses, likely due to their wide bandgaps (>4 eV) and rigid crystal structures [87]. This wavelength selectivity may reflect planetary environmental adaptation: early Earth’s UV regime (~2.5 Ga, pre-ozone) favored silicate photoelectric processes, whereas post-Phanerozoic ozone conditions enhanced Vis responses of iron oxides [88,89]. Martian hematite may show UV-dominated photoresponse behavior distinct from Earth [90].
Light wavelength modulates mineral degradation kinetics, as evidenced by first-order exponential decay profiles (Figure 6) [91]. Syn_Hem displays rapid decay (k = 0.015 s−1, Figure 6 and Figure 7D) across all spectra likely due to FeOOH passivation (Fe2O3 + 6H+ + 2e− → 2Fe2+ + 3H2O) [92]. Syn_Ant shows UVB-specific degradation (k = 0.008 s−1, Figure 6 and Figure 7D) potentially from lattice oxygen loss (TiO2 + 2h+ → TiO2−x + 1/2O2) [93,94]. EM_Paleosol replicates this UVB instability (Figure 7D). Silicates and aluminosites may maintain stability through robust Si-O bonds and wide bandgaps.
The observed mineral photoelectrochemical behavior offers guidance for tuning silicate-based photoelectrodes. Loading iron oxides onto mafic silicates increases WPD but also raises Wk. In contrast, incorporating felsic minerals improves stability by reducing Wk, though it slightly lowers WPD (Figure 7H). Therefore, optimal performance requires a careful balance between photocurrent density and stability (Figure 7H).
4.4. Element–Spectrum–Photoelectrochemical Multilevel Regulation Pathways
Electron-active elements and defects introduce intra-bandgap states (impurity/defect energy levels) in natural silicates, substantially reducing their optical gaps. This effect drives spectroscopic evolution and produces detectable impurity-like photocurrents. The mineral photoresponse is further influenced by structural composition and light wavelength, revealing a multiscale regulatory pathway: elemental composition → spectroscopic parameters → photocurrent characteristics. Importantly, elements modulate photoelectric responses through spectroscopic control, showing both scale dependence (from single indicators to matrices) and wavelength selectivity (Figure 9).
Figure 9.
Impurity-like photoelectric activity of natural silicate minerals—regulating factors (structural composition and wavelength)—multilevel regulation pathways.
Mineral photocurrent intensity correlates closely with spectroscopic features [95]. Beyond the bandgap, parameters such as absorption edge, maximum absorption peak, and absorption area serve as secondary predictors (Figure 8A) [96]. Under visible light, strong electro-optical correlations are observed (r = 0.6–0.8, Figure 8A), allowing photocurrent to be predicted from spectral data. Under UVB, the correlation reverses (r = −0.4–−0.7, Figure 8A). This wavelength-dependent behavior aligns with the previously discussed photocurrent modulation mechanism. Minerals with strong visible-light absorption show reduced UV conversion efficiency due to excess photon energy.
Elemental composition plays a critical role in determining both spectroscopic and photoelectric properties (Figure 8C). In felsic and aluminosilicate minerals, the Al–O–Si bonding network can hinder visible-light photoresponse by limiting charge migration [75,76]. In contrast, Fe enhances photoelectric activity through two possible pathways: (1) intrinsic semiconductor transitions of iron oxides and (2) Fe–O charge transfer, which creates intermediate energy levels that facilitate carrier separation [43,81].
Matrix-level analysis shows a significant correlation between the elemental and electrochemical matrices, while no strong association exists with the spectroscopic matrix (Section 3.5). This indicates that elemental composition indirectly regulates photoelectric response through its effect on spectroscopic characteristics, forming a cascade pathway: “element → spectroscopy → electrochemistry” (Figure 9). This coupling effect can override the wavelength dependence of the light source. Overall, Fe, Si, and Ti collectively dominate photon capture by modulating absorption peak positions and edges, which directly affects the behavior of photo-generated carriers (Figure 9). In contrast, the direct influence of bandgap value is less pronounced. Fe emerges as the most critical regulatory element (Figure 8D).
5. Conclusions
Combined spectroscopic and electrochemical analyses confirm that natural silicate minerals exhibit detectable impurity-like photoelectric activity. This activity arises from electron-active elements (e.g., Fe/Ti) and defect-induced local band structure modifications, which reduce the optical gap to ≤4.13 eV and facilitate the separation of photo-generated charge carriers. Mineral photoresponse is governed by intrinsic structural composition (layered, chain, island, or framework) and extrinsic light excitation (UVB or visible). Multiscale analysis reveals a hierarchical regulation pathway of element → spectroscopy → electrochemistry showing both scale-dependence and wavelength-selectivity, with Fe, Al, Si, and Ti playing key roles.
These findings provide a theoretical framework for understanding photoelectron-driven environmental and geological processes in natural silicates, including geological evolution, energy conversion, and elemental cycling. This mechanistic insight also offers fundamental guidance for the design of silicate-based materials. Beyond the strong photon-to-electron conversion seen in Fe/Mn-rich mineral coatings (intrinsic band-to-band effect), the subtle impurity-like photoelectron activity (arising from defect or impurity levels) in mafic silicates may also contribute meaningfully at Earth’s surface. Future studies could investigate charge carrier transport and specific regulatory mechanisms in natural silicates under light excitation using in situ photoelectrochemical systems.
Supplementary Materials
The following supporting information can be downloaded at: https://www.mdpi.com/article/10.3390/min16020199/s1, Text S1: Selection of mineral materials; Text S2: Photoluminescence spectroscopy testing; Text S3: Preparation of mineral electrodes; Text S4: Photoelectrochemical testing parameters; Text S5: Mantel_test code; Table S1: The types, abbreviations, sources, and forms of all samples; Table S2: Fitting parameters of the photocurrent decay model under Xe_200–800 nm experimentation; Table S3: Fitting parameters of the photocurrent decay model under LED_300 nm experimentation; Table S4: Fitting parameters of the photocurrent decay model under LED_400–800 nm experimentation; Table S5: Classification and description of indicators in analysis of spectroscopy, elemental, and electrochemistry; Table S6: Complete dataset (elemental composition, spectral characteristics, and photocurrent measurements) employed in Mantel test analysis; Figure S1: Mineral pretreatment methods and photographs of mineral samples are presented; Figure S2: Spectral data ranges of three light sources; Figure S3: Mineral XRD identification spectra; Figure S4: Microscopic thin section identification images of basalt; Figure S5: Tauc plots of mineral samples (indirect band gap); Figure S6: Tauc plots of ITO glass (direct band gap–A, indirect band gap–B) and UV–Vis absorption spectra (normalized–C, absolute values–D); Figure S7: Schematic diagram of the main peak positions in the UV–Vis spectra of various mineral samples; Figure S8: PL and PLE spectral plots of five mineral samples; Figure S9: Non-normalized K–M [F(R)] spectra for mineral samples; Figure S10: Absolute spectral values (non-normalized) of negative control minerals; Figure S11: The net photocurrent densities (mineral electrode signal minus ITO background signal) of different mineral electrodes under three light sources; Figure S12: Valence band positions and energy level diagrams of four mineral samples.
Author Contributions
T.H.: Writing—original draft, Visualization, Validation, Software, Methodology, Formal analysis, Data curation, Conceptualization. C.H.: Writing—review & editing, Supervision, Resources, Project administration, Methodology, Investigation, Funding acquisition, Conceptualization. All authors have read and agreed to the published version of the manuscript.
Funding
This work was supported by the National Science and Technology Major Project on Deep Earth (2025ZD1007901) and the National Natural Science Foundation of China (Grant No. 41771248).
Data Availability Statement
The data that support the findings of this study are available within the article and its Supplementary Materials.
Acknowledgments
We are grateful to Yanzhang Li (Postdoctoral Researcher, Peking University) for his scholarly assistance and supportive discussions during the writing of this article. The authors are also grateful to the anonymous reviewers for their invaluable comments and constructive suggestions, which improved the manuscript greatly. In addition, acknowledgments are made to the Analysis and Testing Center of Sichuan University for providing the XRD and UV–Vis spectroscopic analyses. In the graphical abstract, lighting effects in the photoelectric behavior schematic and three electron-ball symbols in the band structure diagram were designed by Macrovector and Pikisuperstar (www.freepik.com).
Conflicts of Interest
The authors declare no conflicts of interest.
References
- Lu, A.; Li, Y.; Ding, H.; Xu, X.; Li, Y.; Ren, G.; Liang, J.; Liu, Y.; Hong, H.; Chen, N. Photoelectric conversion on Earth’s surface via widespread Fe-and Mn-mineral coatings. Proc. Natl. Acad. Sci. USA 2019, 116, 9741–9746. [Google Scholar] [CrossRef] [Scilit]
- Chen, Z.; Dong, G.; Chen, Y.; Wang, H.; Liu, S.; Chen, Z.; Yang, C.; Shang, X.; Dahlgren, R. Impacts of enhanced microbial-photoreductive and suppressed dark microbial reductive dissolution on the mobility of As and Fe in flooded tailing soils with zinc sulfide. Chem. Eng. J. 2019, 372, 118–128. [Google Scholar] [CrossRef] [Scilit]
- Lu, A.; Li, Y.; Jin, S.; Wang, X.; Wu, X.-L.; Zeng, C.; Li, Y.; Ding, H.; Hao, R.; Lv, M. Growth of non-phototrophic microorganisms using solar energy through mineral photocatalysis. Nat. Commun. 2012, 3, 768. [Google Scholar] [CrossRef] [Scilit]
- Zhong, C.; Ren, Y.; Guo, Y.-Y.; Lu, A.; Liu, J. Photoelectron-promoted sulfate reduction for heavy metal removal without organic carbon addition. Environ. Sci. Technol. 2024, 58, 21680–21691. [Google Scholar] [CrossRef] [Scilit]
- Liang, X.; Stüeken, E.E.; Alessi, D.S.; Konhauser, K.O.; Li, L. A seawater oxygen oscillation recorded by iron formations prior to the Great Oxidation Event. Nat. Geosci. 2025, 18, 417–422. [Google Scholar] [CrossRef] [Scilit]
- Schoonen, M.; Smirnov, A.; Cohn, C. A perspective on the role of minerals in prebiotic synthesis. Ambio 2004, 33, 539–551. [Google Scholar] [CrossRef]
- Li, Y.; Li, Y.; Liu, Y.; Wu, Y.; Wu, J.; Wang, B.; Ye, H.; Jia, H.; Wang, X.; Li, L. Photoreduction of inorganic carbon (+IV) by elemental sulfur: Implications for prebiotic synthesis in terrestrial hot springs. Sci. Adv. 2020, 6, eabc3687. [Google Scholar] [CrossRef] [Scilit] [PubMed]
- Lu, A. Mineralogical photocatalysis in natural self-purification of inorganic minerals. Acta Petrol. Mineral. 2003, 22, 323–331. [Google Scholar]
- Xu, Y.; Schoonen, M.A. The absolute energy positions of conduction and valence bands of selected semiconducting minerals. Am. Mineral. 2000, 85, 543–556. [Google Scholar] [CrossRef] [Scilit]
- Yapp, C. Rusty relics of Earth history: Iron(III) oxides, isotopes, and surficial environments. Annu. Rev. Earth Planet. Sci. 2001, 29, 165–199. [Google Scholar] [CrossRef] [Scilit]
- Bai, Y.; Dai, Q.; Guo, J.; Dong, F.; Chen, H.; Hai, J.; Fan, L.; Yun, J.; Huang, J.; Zhang, R. Iron oxides semiconductor minerals photocatalysis reduce methane fluxes in paddy soils. J. Environ. Manag. 2025, 380, 125062. [Google Scholar] [CrossRef] [Scilit] [PubMed]
- Abou-Ghanem, M.; Oliynyk, A.O.; Chen, Z.; Matchett, L.C.; McGrath, D.T.; Katz, M.J.; Locock, A.J.; Styler, S.A. Significant variability in the photocatalytic activity of natural titanium-containing minerals: Implications for understanding and predicting atmospheric mineral dust photochemistry. Environ. Sci. Technol. 2020, 54, 13509–13516. [Google Scholar] [CrossRef] [Scilit]
- Khosravi, M.; Allakhverdiev, S.I.; Eaton-Rye, J.J.; Hołyńska, M.; Aro, E.-M.; Shen, J.-R.; Najafpour, M.M. Fundamental properties, characterization techniques, and applications for photo(electro) catalysis: From Nanosized manganese oxides to manganese coordination compounds. Coord. Chem. Rev. 2025, 527, 216396. [Google Scholar] [CrossRef] [Scilit]
- Xiao, Y.; Li, Y.; Ding, H.; Li, Y.; Lu, A. The fine characterization and potential photocatalytic effect of semiconducting metal minerals in danxia landforms. Minerals 2018, 8, 554. [Google Scholar] [CrossRef] [Scilit]
- Xu, X.; Li, Y.; Li, Y.; Lu, A.; Qiao, R.; Liu, K.; Ding, H.; Wang, C. Characteristics of desert varnish from nanometer to micrometer scale: A photo-oxidation model on its formation. Chem. Geol. 2019, 522, 55–70. [Google Scholar] [CrossRef] [Scilit]
- Xu, X.; Ding, H.; Li, Y.; Wang, H.; Lu, A. The Micro-scaled characterization of natural terrestrial ferromanganese coatings and their semiconducting properties. Coatings 2020, 10, 666. [Google Scholar] [CrossRef] [Scilit]
- Ahmed, K.A.M.; Peng, H.; Wu, K.; Huang, K. Hydrothermal preparation of nanostructured manganese oxides (MnOx) and their electrochemical and photocatalytic properties. Chem. Eng. J. 2011, 172, 531–539. [Google Scholar] [CrossRef] [Scilit]
- Faber, M.S.; Jin, S. Earth-abundant inorganic electrocatalysts and their nanostructures for energy conversion applications. Energy Environ. Sci. 2014, 7, 3519–3542. [Google Scholar] [CrossRef] [Scilit]
- AlSalka, Y.; Granone, L.I.; Ramadan, W.; Hakki, A.; Dillert, R.; Bahnemann, D.W. Iron-based photocatalytic and photoelectrocatalytic nano-structures: Facts, perspectives, and expectations. Appl. Catal. B 2019, 244, 1065–1095. [Google Scholar] [CrossRef] [Scilit]
- Yamakata, A.; Vequizo, J.J.M. Curious behaviors of photogenerated electrons and holes at the defects on anatase, rutile, and brookite TiO2 powders: A review. J. Photochem. Photobiol. C 2019, 40, 234–243. [Google Scholar] [CrossRef] [Scilit]
- Yonghua, D.; Lishi, M.; Ping, L.; Yong, C. First-principles calculations of electronic structures and optical, phononic, and thermodynamic properties of monoclinic α-spodumene. Ceram. Int. 2017, 43, 6312–6321. [Google Scholar] [CrossRef] [Scilit]
- Kalita, J.; Wary, G. Estimation of band gap of muscovite mineral using thermoluminescence (TL) analysis. Phys. B 2016, 485, 53–59. [Google Scholar] [CrossRef] [Scilit]
- Naik, R.; Prashantha, S.; Nagabhushana, H.; Girish, K. Electrochemical, photoluminescence and EPR studies of Fe3+ doped nano Forsterite: Effect of doping on tetra and octahedral sites. J. Lumin. 2018, 197, 233–241. [Google Scholar] [CrossRef] [Scilit]
- Shankland, T. Band gap of forsterite. Science 1968, 161, 51–53. [Google Scholar] [CrossRef] [Scilit] [PubMed]
- Legesse, M.; Park, H.; El Mellouhi, F.; Rashkeev, S.N.; Kais, S.; Alharbi, F.H. Improved photoactivity of pyroxene silicates by cation substitutions. ChemPhysChem 2018, 19, 943–953. [Google Scholar] [CrossRef] [Scilit] [PubMed]
- Sugita, T.; Mori, M.; Shimoyama, I. Conversion of clay minerals to photocatalysts for CrVI reduction and salicylic acid decomposition. Appl. Clay Sci. 2023, 243, 107074. [Google Scholar] [CrossRef] [Scilit]
- Pekov, I.V. Microporous framework silicate minerals with rare and transition elements: Minerogenetic aspects. Rev. Mineral. Geochem. 2005, 57, 145–171. [Google Scholar] [CrossRef] [Scilit]
- Rustad, J.R.; Yin, Q.-Z. Iron isotope fractionation in the Earth’s lower mantle. Nat. Geosci. 2009, 2, 514–518. [Google Scholar] [CrossRef] [Scilit]
- Mihailova, B.; Della Ventura, G.; Waeselmann, N.; Xu, W.; Schlüter, J.; Galdenzi, F.; Marcelli, A.; Redhammer, G.J.; Boiocchi, M.; Oberti, R. Atomistic insight into lithospheric conductivity revealed by phonon–electron excitations in hydrous iron-bearing silicates. Commun. Mater. 2021, 2, 57. [Google Scholar] [CrossRef] [Scilit]
- Berry, A.J.; Doyle, P.M.; Schofield, P.F.; Miller, L.A.; Losq, C.L.; Burnham, A.D.; Mosselmans, J.F.W. The oxidation state of titanium in silicate melts. Geochim. Cosmochim. Acta 2024, 366, 210–220. [Google Scholar] [CrossRef]
- Pérez-Arévalo, S.; Millán-Franco, M.A.; Aguilar-Reyes, B.O.; Reyes-Gasga, J. Structural and chemical characterization of kaolinite from the Capula clay in Michoacán region, Mexico, by X-ray diffraction and electron microscopy. Ceram. Int. 2025, 51, 55020–55029. [Google Scholar] [CrossRef] [Scilit]
- He, H.; Cao, J.; Duan, N. Defects and their behaviors in mineral dissolution under water environment: A review. Sci. Total Environ. 2019, 651, 2208–2217. [Google Scholar] [CrossRef] [Scilit]
- Richard, D.; Rendtorff, N.M. Local Environments in Iron-Bearing Clay Minerals by DFT Approaches: The Case of Structural Fe in Kaolinite. Appl. Clay Sci. 2021, 213, 106251. [Google Scholar] [CrossRef] [Scilit]
- Dai, L.; Karato, S.i. Electrical Conductivity of Ti-Bearing Hydrous Olivine Aggregates at High Temperature and High Pressure. J. Geophys. Res. Solid Earth 2020, 125, e2020JB020309. [Google Scholar] [CrossRef] [Scilit]
- Shichi, T.; Takagi, K. Clay minerals as photochemical reaction fields. J. Photochem. Photobiol. C 2000, 1, 113–130. [Google Scholar] [CrossRef] [Scilit]
- Chen, J.; Min, F.; Liu, L.; Cai, C. Systematic exploration of the interactions between Fe-doped kaolinite and coal based on DFT calculations. Fuel 2020, 266, 117082. [Google Scholar] [CrossRef] [Scilit]
- Saito, K.; Morita, M.; Okada, T.; Wijitwongwan, R.; Ogawa, M. Designed functions of oxide/hydroxide nanosheets via elemental replacement/doping. Chem. Soc. Rev. 2024, 53, 10523–10574. [Google Scholar] [CrossRef] [Scilit]
- Cheng, M.; Song, W.; Ma, W.; Chen, C.; Zhao, J.; Lin, J.; Zhu, H. Catalytic activity of iron species in layered clays for photodegradation of organic dyes under visible irradiation. Appl. Catal. B 2008, 77, 355–363. [Google Scholar] [CrossRef] [Scilit]
- Martínez-Costa, J.; Rivera-Utrilla, J.; Leyva-Ramos, R.; Sánchez-Polo, M.; Velo-Gala, I. Individual and simultaneous degradation of antibiotics sulfamethoxazole and trimethoprim by UV and solar radiation in aqueous solution using bentonite and vermiculite as photocatalysts. Appl. Clay Sci. 2018, 160, 217–225. [Google Scholar] [CrossRef] [Scilit]
- Redouane-Salah, Z.; Malouki, M.A.; Khennaoui, B.; Santaballa, J.A.; Canle, M. Simulated sunlight photodegradation of 2-mercaptobenzothiazole by heterogeneous photo-Fenton using a natural clay powder. J. Environ. Chem. Eng. 2018, 6, 1783–1793. [Google Scholar] [CrossRef] [Scilit]
- Zhang, B.; Hou, Y.; Yu, Z.; Liu, Y.; Huang, J.; Qian, L.; Xiong, J. Three-dimensional electro-Fenton degradation of Rhodamine B with efficient Fe-Cu/kaolin particle electrodes: Electrodes optimization, kinetics, influencing factors and mechanism. Sep. Purif. Technol. 2019, 210, 60–68. [Google Scholar] [CrossRef] [Scilit]
- Li, X.; Simon, U.; Bekheet, M.F.; Gurlo, A. Mineral-Supported Photocatalysts: A Review of Materials, Mechanisms and Environmental Applications. Energies 2022, 15, 5607. [Google Scholar] [CrossRef] [Scilit]
- Cloutis, E.A.; McCormack, K.A.; Bell, J.F., III; Hendrix, A.R.; Bailey, D.T.; Craig, M.A.; Mertzman, S.A.; Robinson, M.S.; Riner, M.A. Ultraviolet spectral reflectance properties of common planetary minerals. Icarus 2008, 197, 321–347. [Google Scholar] [CrossRef] [Scilit]
- Loeffler, B.M.; Burns, R.G.; Tossell, J.A.; Vaughan, D.J.; Johnson, K.H. Charge transfer in lunar materials: Interpretation of ultraviolet-visible spectral properties of the moon. In Proceedings of the Lunar and Planetary Science Conference; Pergamon Press, Inc.: New York, NY, USA, 1974; pp. 3007–3016. [Google Scholar]
- Izawa, M.R.M.; Applin, D.M.; Morison, M.Q.; Cloutis, E.A.; Mann, P.; Mertzman, S.A. Reflectance spectroscopy of ilmenites and related Ti and TiFe oxides (200 to 2500 nm): Spectral–compositional–structural relationships. Icarus 2021, 362, 114423. [Google Scholar] [CrossRef] [Scilit]
- Delgado, L.; Delgado, A. Photoluminescence and thermoluminescence of Ti centers in LiF (TLD-100). J. Appl. Phys. 1984, 55, 515–518. [Google Scholar] [CrossRef] [Scilit]
- Strens, R.G.J.; Wood, B.J. Diffuse reflectance spectra and optical properties of some iron and titanium oxides and oxyhydroxides. Mineral. Mag. 1979, 43, 347–354. [Google Scholar] [CrossRef] [Scilit]
- Lan, Q.; Li, F.-B.; Sun, C.-X.; Liu, C.-S.; Li, X.-Z. Heterogeneous photodegradation of pentachlorophenol and iron cycling with goethite, hematite and oxalate under UVA illumination. J. Hazard. Mater. 2010, 174, 64–70. [Google Scholar] [CrossRef] [Scilit]
- Zhang, X.; Lu, B.; Li, R.; Fan, C.; Liang, Z.; Han, P. Structural, electronic and optical properties of ilmenite ATiO3 (A = Fe, Co, Ni). Mater. Sci. Semicond. Process. 2015, 39, 6–16. [Google Scholar] [CrossRef] [Scilit]
- Tossell, J.A.; Vaughan, D.; Johnson, K. The electronic structure of rutile, wustite, and hematite from molecular orbital calculations. Am. Mineral. 1974, 59, 319–334. [Google Scholar]
- Wang, Y.; Braghiere, R.K.; Yin, Y.; Yao, Y.; Hao, D.; Frankenberg, C. Beyond the visible: Accounting for ultraviolet and far-red radiation in vegetation productivity and surface energy budgets. Glob. Change Biol. 2024, 30, e17346. [Google Scholar] [CrossRef] [Scilit]
- Cao, X.; Zhao, J.; Wang, Z.; Xing, B. New insight into the photo-transformation mechanisms of graphene oxide under UV-A, UV-B and UV-C lights. J. Hazard. Mater. 2021, 403, 123683. [Google Scholar] [CrossRef] [Scilit]
- Klein, J.; Kampermann, L.; Mockenhaupt, B.; Behrens, M.; Strunk, J.; Bacher, G. Limitations of the Tauc plot method. Adv. Funct. Mater. 2023, 33, 2304523. [Google Scholar] [CrossRef] [Scilit]
- Sherman, D.M. Electronic structures of iron (III) and manganese (IV)(hydr) oxide minerals: Thermodynamics of photochemical reductive dissolution in aquatic environments. Geochim. Cosmochim. Acta 2005, 69, 3249–3255. [Google Scholar] [CrossRef] [Scilit]
- Zanatta, A.R. Temperature-dependent optical bandgap of TiO2 under the Anatase and Rutile phases. Results Phys. 2024, 60, 107653. [Google Scholar] [CrossRef] [Scilit]
- Alagia, V.E.; Mohanakumar, S.; Duits, M.H.G.; Mugele, F. Influence of anions on the formation of a passivating Fe-rich interfacial layer during olivine dissolution. Geochim. Cosmochim. Acta 2025, 403, 152–165. [Google Scholar] [CrossRef] [Scilit]
- Yuan, J.; Zhang, Y.; Yu, A.; Wen, S.; Bai, S. Flotation separation of ilmenite and titanaugite modified by Fe2+-assisted peroxymonosulfate oxidation: Performance and activation mechanism. Appl. Surf. Sci. 2025, 682, 161617. [Google Scholar] [CrossRef] [Scilit]
- Li, Y.; Huang, F.; Gao, W.; Zhu, Q.; Shen, C.; Li, M.; Sun, X.; Wang, X. Raman spectroscopy and XPS study of the thermal decomposition of Mg-hornblende into augite. J. Raman Spectrosc. 2022, 53, 820–831. [Google Scholar] [CrossRef] [Scilit]
- Huang, S.-C.; Zhou, Y.-L.; Duan, L.; Luo, D.-Z.; Yang, B.-P.; Chen, G.; Liu, X.-H.; Tang, J.-G.; Zhang, N. Mn2+-doped Co3Si2O5(OH)4 serpentine nanosheets with tuned d-band centers for efficient oxygen evolution in alkaline and neutral electrolytes. Rare Met. 2025, 44, 1042–1052. [Google Scholar] [CrossRef] [Scilit]
- Liu, J.; Liu, X.; Ding, H.; Ren, G.; Sun, Y.; Liu, Y.; Ji, X.; Ma, L.Z.; Li, Y.; Lu, A. Enhanced mechanism of extracellular electron transfer between semiconducting minerals anatase and Pseudomonas aeruginosa PAO1 in euphotic zone. Bioelectrochemistry 2021, 141, 107849. [Google Scholar] [CrossRef] [Scilit] [PubMed]
- Bystrov, V.S.; Piccirillo, C.; Tobaldi, D.M.; Castro, P.M.L.; Coutinho, J.; Kopyl, S.; Pullar, R.C. Oxygen vacancies, the optical band gap (Eg) and photocatalysis of hydroxyapatite: Comparing modelling with measured data. Appl. Catal. B 2016, 196, 100–107. [Google Scholar] [CrossRef] [Scilit]
- Morita, M.; Horiuchi, Y.; Matsuoka, M.; Ogawa, M. Preparation of Titanium-Containing Layered Alkali Silicates. Cryst. Growth Des. 2022, 22, 1638–1644. [Google Scholar] [CrossRef] [Scilit]
- Faul, U.H.; Cline, C.J.; David, E.C.; Berry, A.J.; Jackson, I. Titanium-hydroxyl defect-controlled rheology of the Earth’s upper mantle. Earth Planet. Sci. Lett. 2016, 452, 227–237. [Google Scholar] [CrossRef] [Scilit]
- Bai, S.; Zhang, N.; Gao, C.; Xiong, Y. Defect engineering in photocatalytic materials. Nano Energy 2018, 53, 296–336. [Google Scholar] [CrossRef] [Scilit]
- Gao, S.; Zhao, S.; Tang, X.; Sun, L.; Li, Q.; Yi, H. Research on the application of defect engineering in the field of environmental catalysis. Green Energy Environ. 2024, 10, 1187–1209. [Google Scholar] [CrossRef] [Scilit]
- Tebyetekerwa, M.; Zhang, J.; Xu, Z.; Truong, T.N.; Yin, Z.; Lu, Y.; Ramakrishna, S.; Macdonald, D.; Nguyen, H.T. Mechanisms and applications of steady-state photoluminescence spectroscopy in two-dimensional transition-metal dichalcogenides. ACS Nano 2020, 14, 14579–14604. [Google Scholar] [CrossRef] [Scilit] [PubMed]
- Garcia-Guinea, J.; Correcher, V.; Sanchez-Muñoz, L.; Finch, A.A.; Hole, D.E.; Townsend, P.D. On the luminescence emission band at 340nm of stressed tectosilicate lattices. Nucl. Instrum. Methods Phys. Res. Sect. A 2007, 580, 648–651. [Google Scholar] [CrossRef] [Scilit]
- Kalita, J.M.; Wary, G. Trap and recombination sites of biotite mineral estimated by thermoluminescence analysis. J. Lumin. 2016, 170, 64–71. [Google Scholar] [CrossRef] [Scilit]
- Qafoku, O.; Ilton, E.S.; Bowden, M.E.; Kovarik, L.; Zhang, X.; Kukkadapu, R.K.; Engelhard, M.H.; Thompson, C.J.; Schaef, H.T.; McGrail, B.P.; et al. Synthesis of nanometer-sized fayalite and magnesium-iron(II) mixture olivines. J. Colloid Interface Sci. 2018, 515, 129–138. [Google Scholar] [CrossRef] [Scilit]
- Ngoc, T.; Ca, N.X.; Thanh, N.T.; Hung, N.M.; Du, P.T.; Chung Thuy, T.T.; Huong, N.T.; Van Do, P. Thermoluminescence properties and new insights on the UV-vis absorption features of colorless quartz after γ-ray irradiation. RSC Adv. 2024, 14, 19154–19166. [Google Scholar] [CrossRef] [Scilit]
- Zhang, Y.; Tong, M.; Lu, Y.; Zhao, F.; Zhang, P.; Wan, Z.; Li, P.; Yuan, S.; Wang, Y.; Kappler, A. Directional long-distance electron transfer from reduced to oxidized zones in the subsurface. Nat. Commun. 2024, 15, 6576. [Google Scholar] [CrossRef] [Scilit]
- Zhang, Y.; Tong, M.; Zhang, P.; Kappler, A.; Yuan, S. Different scales of electron transfer processes in the subsurface. Environ. Biogeochem. Process. 2025, 1, e002. [Google Scholar] [CrossRef] [Scilit]
- Zhao, Q.; Gao, C.; Zhang, Y.; Zhang, Y. Advances and application potential in the research of silicate mineral-based 3D printing materials. Prog. Mater. Sci. 2025, 152, 101450. [Google Scholar] [CrossRef] [Scilit]
- Li, Y.; Wang, H.; Li, Y.; Ye, H.; Zhang, Y.; Yin, R.; Jia, H.; Hou, B.; Wang, C.; Ding, H.; et al. Electron transfer rules of minerals under pressure informed by machine learning. Nat. Commun. 2023, 14, 1815. [Google Scholar] [CrossRef] [Scilit] [PubMed]
- Hawthorne, F.C.; Uvarova, Y.A.; Sokolova, E. A structure hierarchy for silicate minerals: Sheet silicates. Mineral. Mag. 2019, 83, 3–55. [Google Scholar] [CrossRef] [Scilit]
- Day, M.C.; Hawthorne, F.C. A structure hierarchy for silicate minerals: Chain, ribbon, and tube silicates. Mineral. Mag. 2020, 84, 165–244. [Google Scholar] [CrossRef] [Scilit]
- Bleam, W.F. Atomic theories of phyllosilicates: Quantum chemistry, statistical mechanics, electrostatic theory, and crystal chemistry. Rev. Geophys. 1993, 31, 51–73. [Google Scholar] [CrossRef] [Scilit]
- Dash, P.; Yuan, M.; Gao, J.; Furman, E.; Lanagan, M.T. High electric field conduction in low-alkali boroaluminosilicate glass. J. Appl. Phys. 2018, 123, 054102. [Google Scholar] [CrossRef] [Scilit]
- Wang, X.; Shi, T.; Wang, X.; Song, A.; Li, G.; Wang, L.; Huang, J.; Meng, A.; Li, Z. Insight into the synergistic effect of defect and strong interface coupling on ZnIn2S4/CoIn2S4 heterostructure for boosting photocatalytic H2 evolution. J. Energy Chem. 2024, 92, 151–161. [Google Scholar] [CrossRef] [Scilit]
- Wang, S.; Zhang, Z.; Chen, C.; Zhang, H.; Shi, S.; Xie, J.; Cai, Y.; Gao, S.; Chen, W.; Dong, C.; et al. Achieve near-infrared absorption in Cs3Sb2Br9 through 3d orbital energy level splitting to construct high-performance intermediate band solar cells. Chem. Eng. J. 2025, 504, 158638. [Google Scholar] [CrossRef] [Scilit]
- Zhang, P.; Wu, L.-j.; Pan, W.-g.; Bai, S.-c.; Guo, R.-t. Efficient photocatalytic H2 evolution over NiS-PCN Z-scheme composites via dual charge transfer pathways. Appl. Catal. B 2021, 289, 120040. [Google Scholar] [CrossRef] [Scilit]
- Liu, B.; Zhao, X.; Yu, J.; Parkin, I.P.; Fujishima, A.; Nakata, K. Intrinsic intermediate gap states of TiO2 materials and their roles in charge carrier kinetics. J. Photochem. Photobiol. C 2019, 39, 1–57. [Google Scholar] [CrossRef] [Scilit]
- Li, J.; Chen, H.; Triana, C.A.; Patzke, G.R. Hematite photoanodes for water oxidation: Electronic transitions, carrier dynamics, and surface energetics. Angew. Chem. 2021, 60, 18380–18396. [Google Scholar] [CrossRef] [Scilit] [PubMed]
- Heo, S.; Seo, G.; Lee, Y.; Lee, D.; Seol, M.; Lee, J.; Park, J.-B.; Kim, K.; Yun, D.-J.; Kim, Y.S.; et al. Deep level trapped defect analysis in CH3NH3PbI3 perovskite solar cells by deep level transient spectroscopy. Energy Environ. Sci. 2017, 10, 1128–1133. [Google Scholar] [CrossRef] [Scilit]
- Fast, J.; Aeberhard, U.; Bremner, S.P.; Linke, H. Hot-carrier optoelectronic devices based on semiconductor nanowires. Appl. Phys. Rev. 2021, 8, 021309. [Google Scholar] [CrossRef] [Scilit]
- Wang, X.; Shen, S.; Feng, Z.; Li, C. Time-resolved photoluminescence of anatase/rutile TiO2 phase junction revealing charge separation dynamics. Chin. J. Catal. 2016, 37, 2059–2068. [Google Scholar] [CrossRef] [Scilit]
- Park, H.; Yu, S.; Siegel, D.J. Predicting charge transfer stability between sulfide solid electrolytes and Li metal anodes. ACS Energy Lett. 2021, 6, 150–157. [Google Scholar] [CrossRef] [Scilit]
- Lyons, T.W.; Reinhard, C.T.; Planavsky, N.J. The rise of oxygen in Earth’s early ocean and atmosphere. Nature 2014, 506, 307–315. [Google Scholar] [CrossRef] [Scilit]
- Salles, T.; Husson, L.; Lorcery, M.; Hadler Boggiani, B. Landscape dynamics and the Phanerozoic diversification of the biosphere. Nature 2023, 624, 115–121. [Google Scholar] [CrossRef] [Scilit]
- Chan, M.A.; Beitler, B.; Parry, W.T.; Ormö, J.; Komatsu, G. A possible terrestrial analogue for haematite concretions on Mars. Nature 2004, 429, 731–734. [Google Scholar] [CrossRef] [Scilit]
- Kniepert, J.; Neher, D. Effect of the RC time on photocurrent transients and determination of charge carrier mobilities. J. Appl. Phys. 2017, 122, 195501. [Google Scholar] [CrossRef] [Scilit]
- Kim, K.; Choi, W.; Hoffmann, M.R.; Yoon, H.-I.; Park, B.-K. Photoreductive dissolution of iron oxides trapped in ice and its environmental implications. Environ. Sci. Technol. 2010, 44, 4142–4148. [Google Scholar] [CrossRef] [Scilit] [PubMed]
- Deml, A.M.; Stevanović, V.; Muhich, C.L.; Musgrave, C.B.; O’Hayre, R. Oxide enthalpy of formation and band gap energy as accurate descriptors of oxygen vacancy formation energetics. Energy Environ. Sci. 2014, 7, 1996–2004. [Google Scholar] [CrossRef] [Scilit]
- Yi, D.; Lu, F.; Zhang, F.; Liu, S.; Zhou, B.; Gao, D.; Wang, X.; Yao, J. Regulating charge transfer of lattice oxygen in single-atom-doped titania for hydrogen evolution. Angew. Chem. 2020, 59, 15855–15859. [Google Scholar] [CrossRef] [Scilit]
- He, X.; Li, Y.; Yu, H.; Zhou, G.; Ke, L.; Yip, H.-L.; Zhao, N. A microsized optical spectrometer based on an organic photodetector with an electrically tunable spectral response. Nat. Electron. 2024, 7, 694–704. [Google Scholar] [CrossRef] [Scilit]
- Nishimura, T.; Kumabe, Y.; Harashima, Y.; Fujii, M.; Tachikawa, T. Machine-learning-driven photocurrent prediction in multielement-doped hematite photoelectrodes. ACS Catal. 2025, 15, 11993–12004. [Google Scholar] [CrossRef] [Scilit]
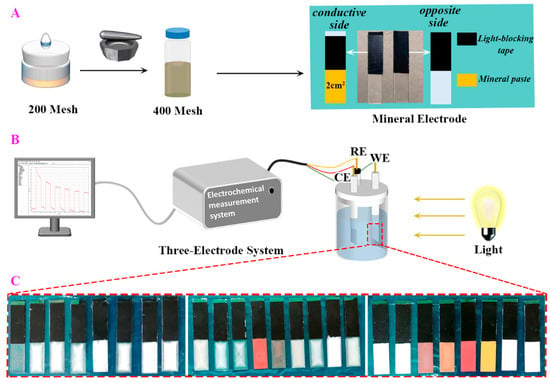
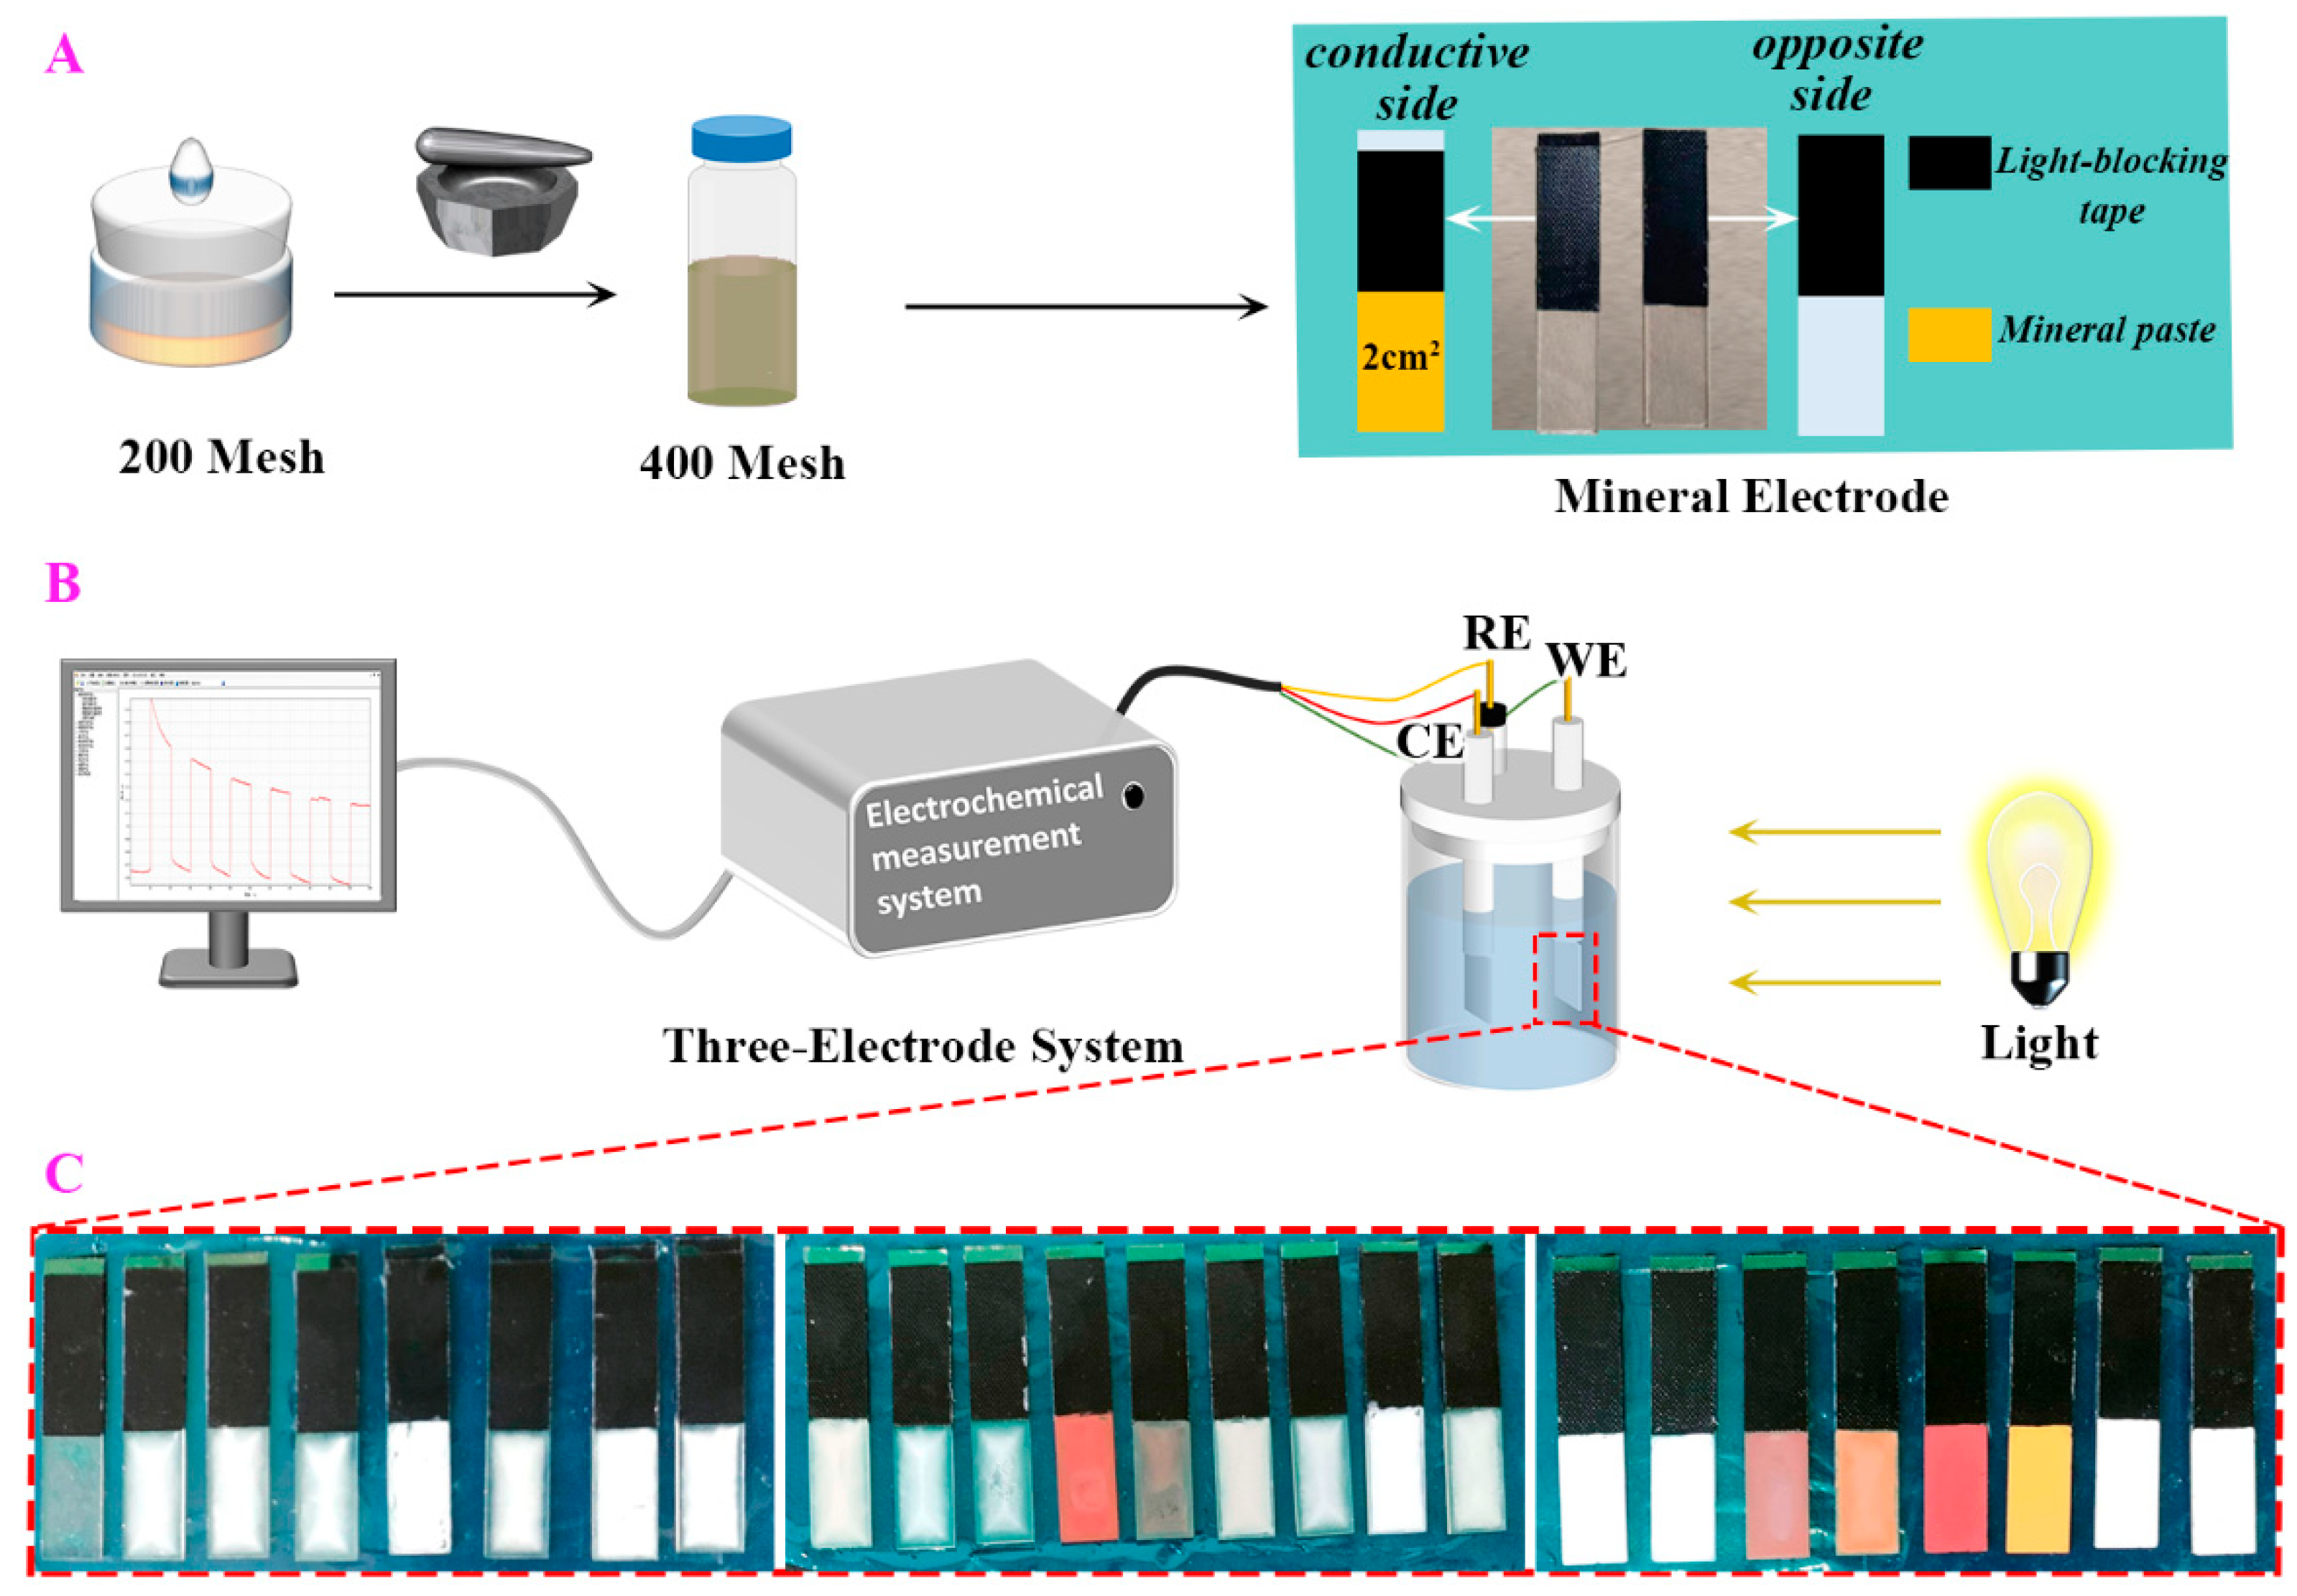
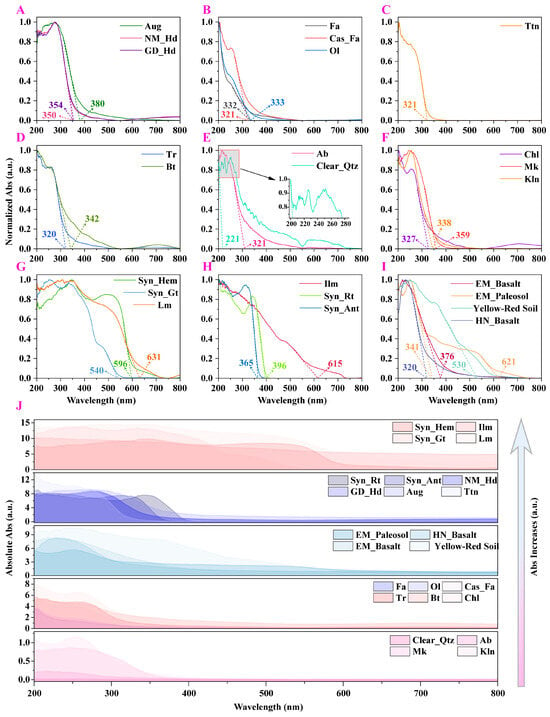
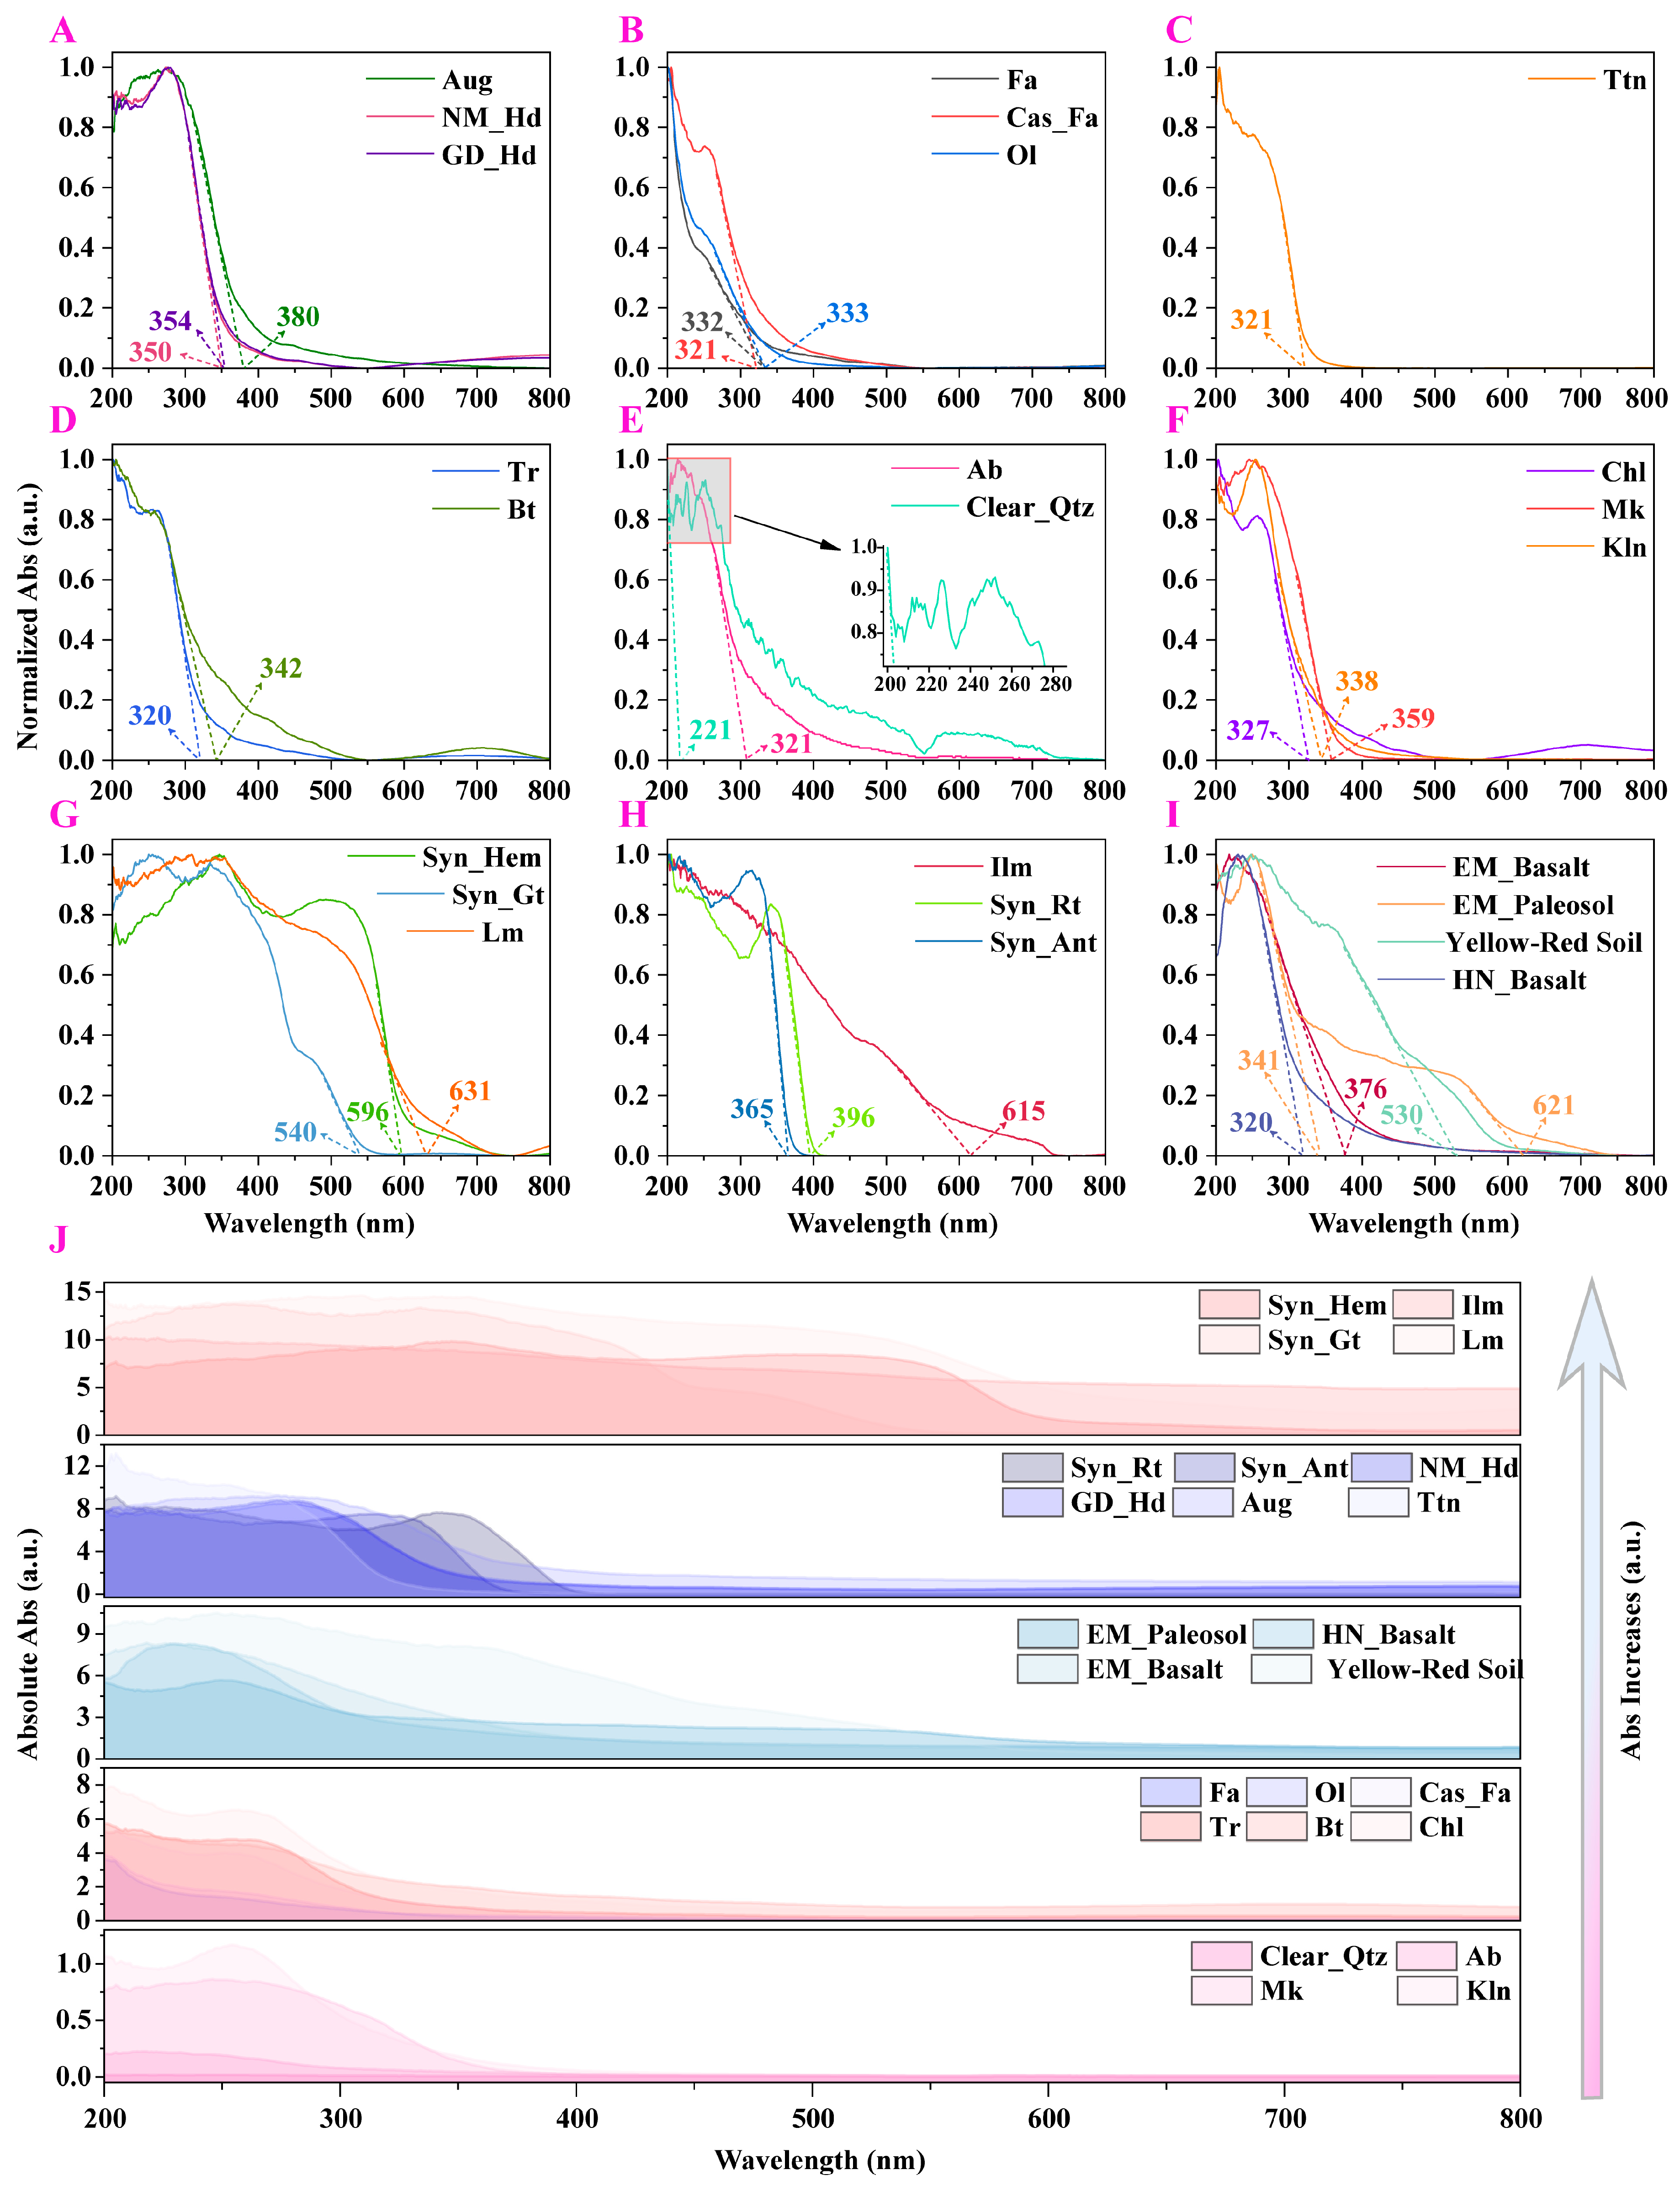
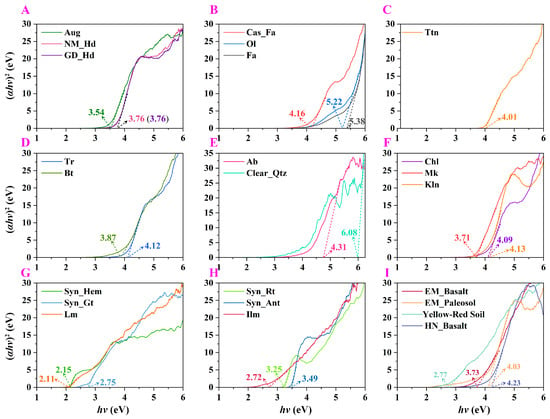
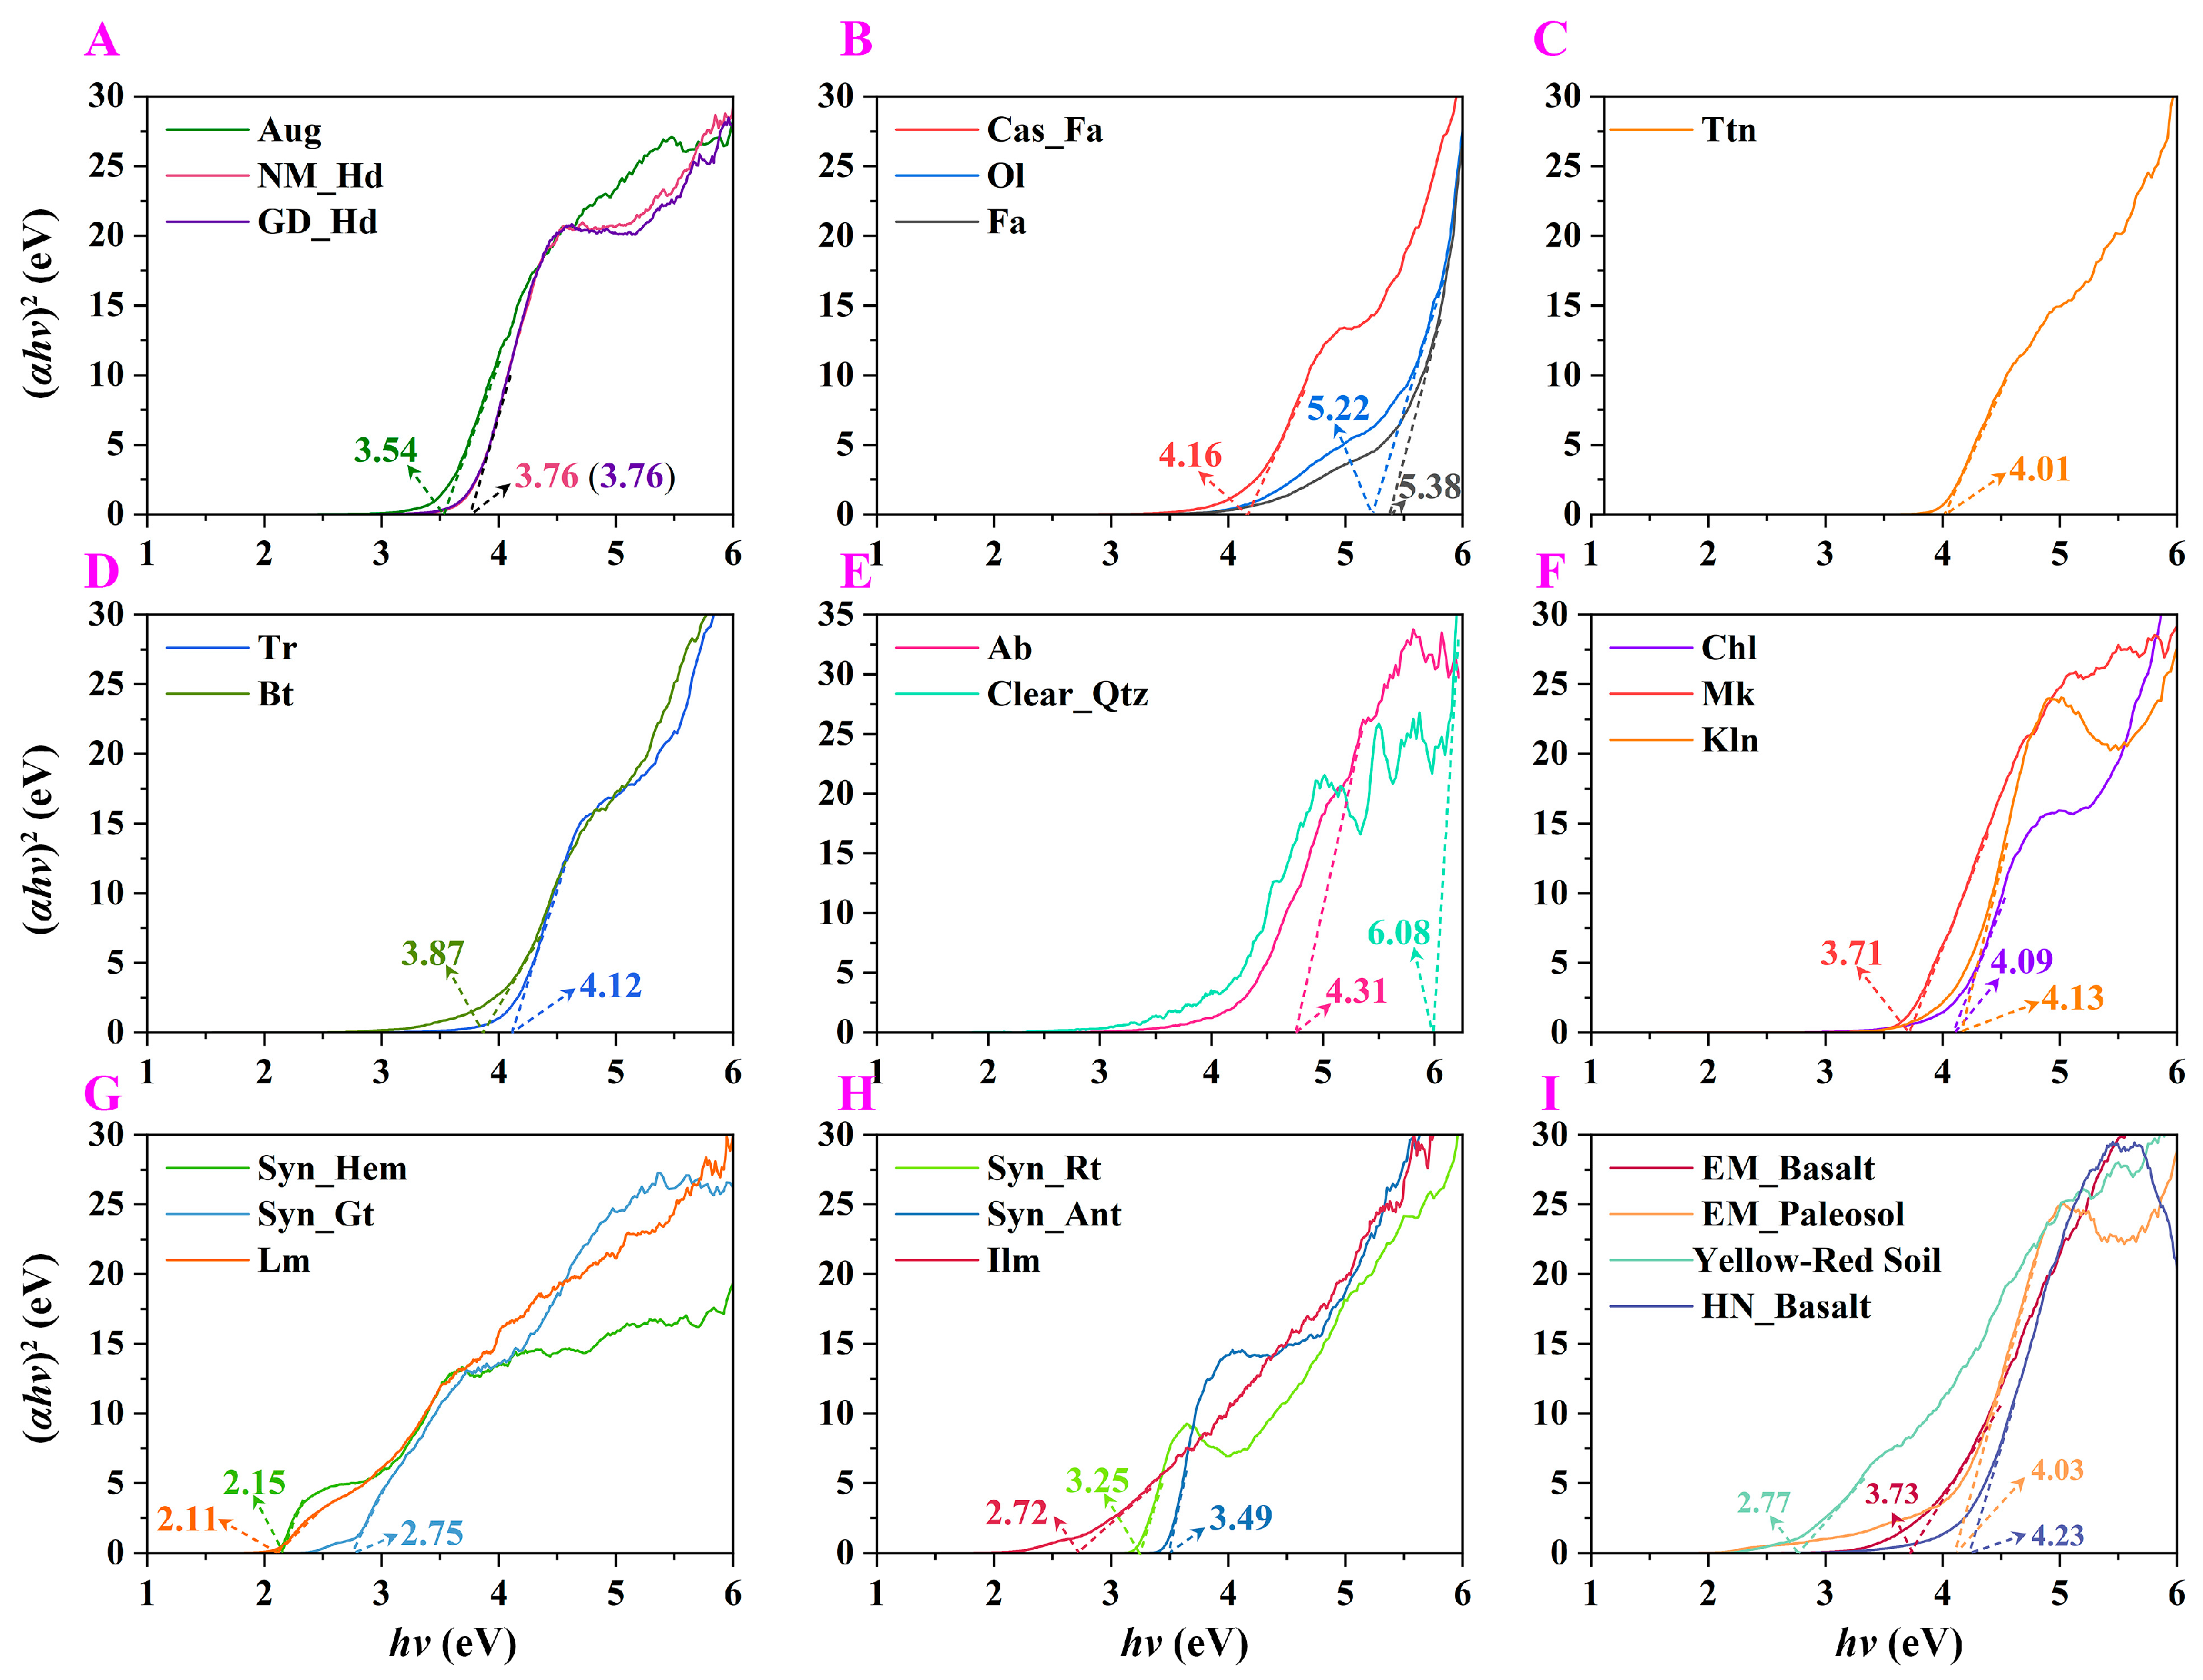
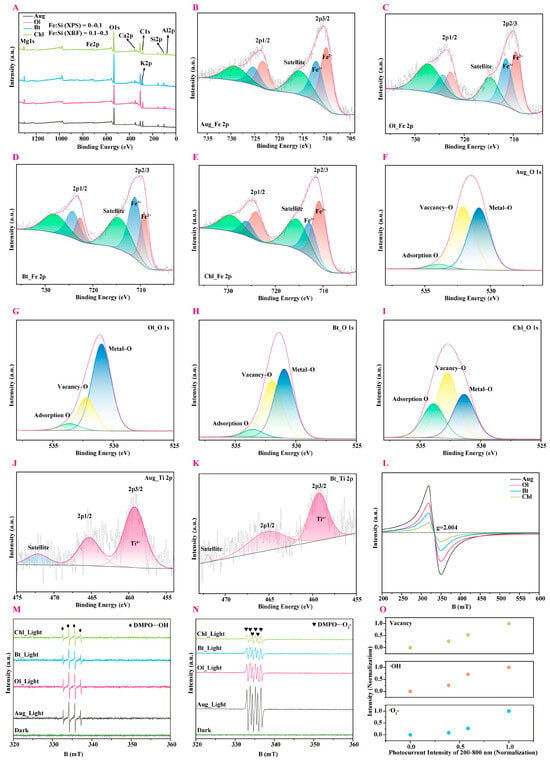
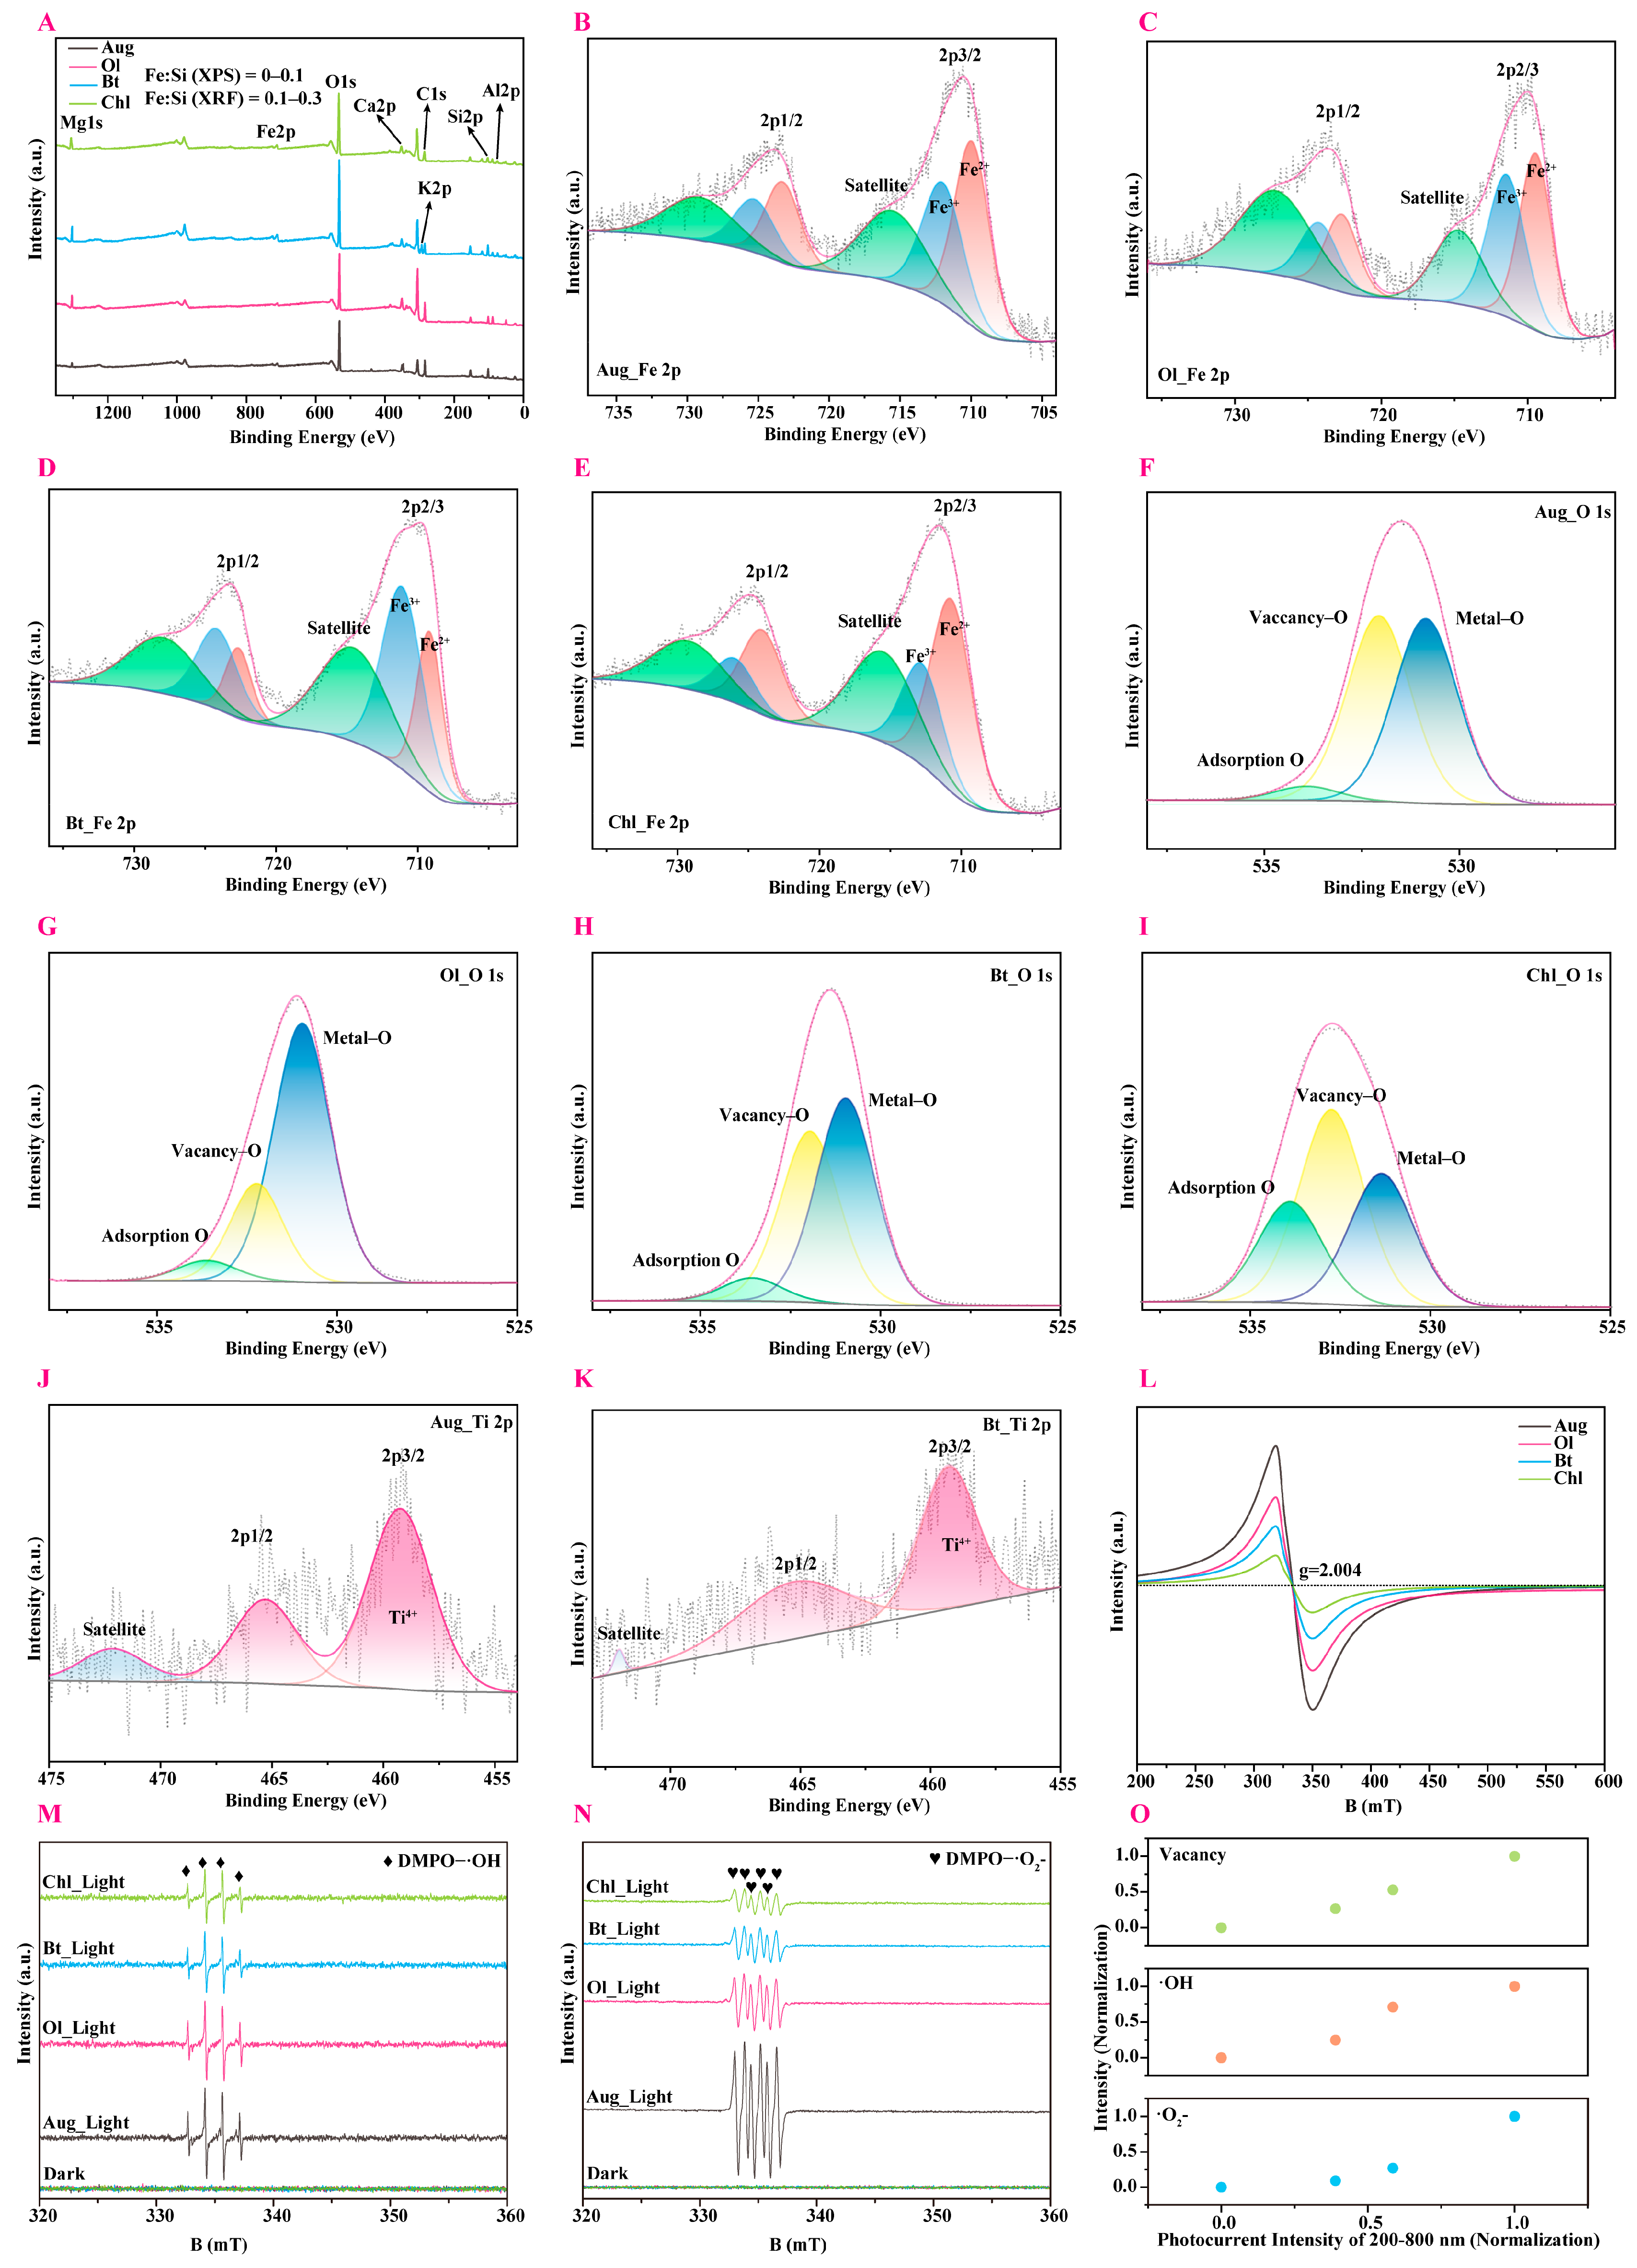
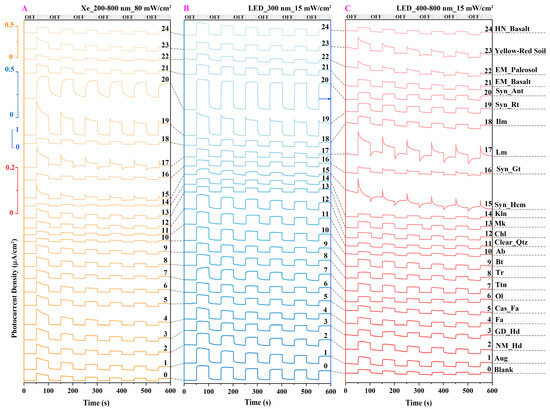
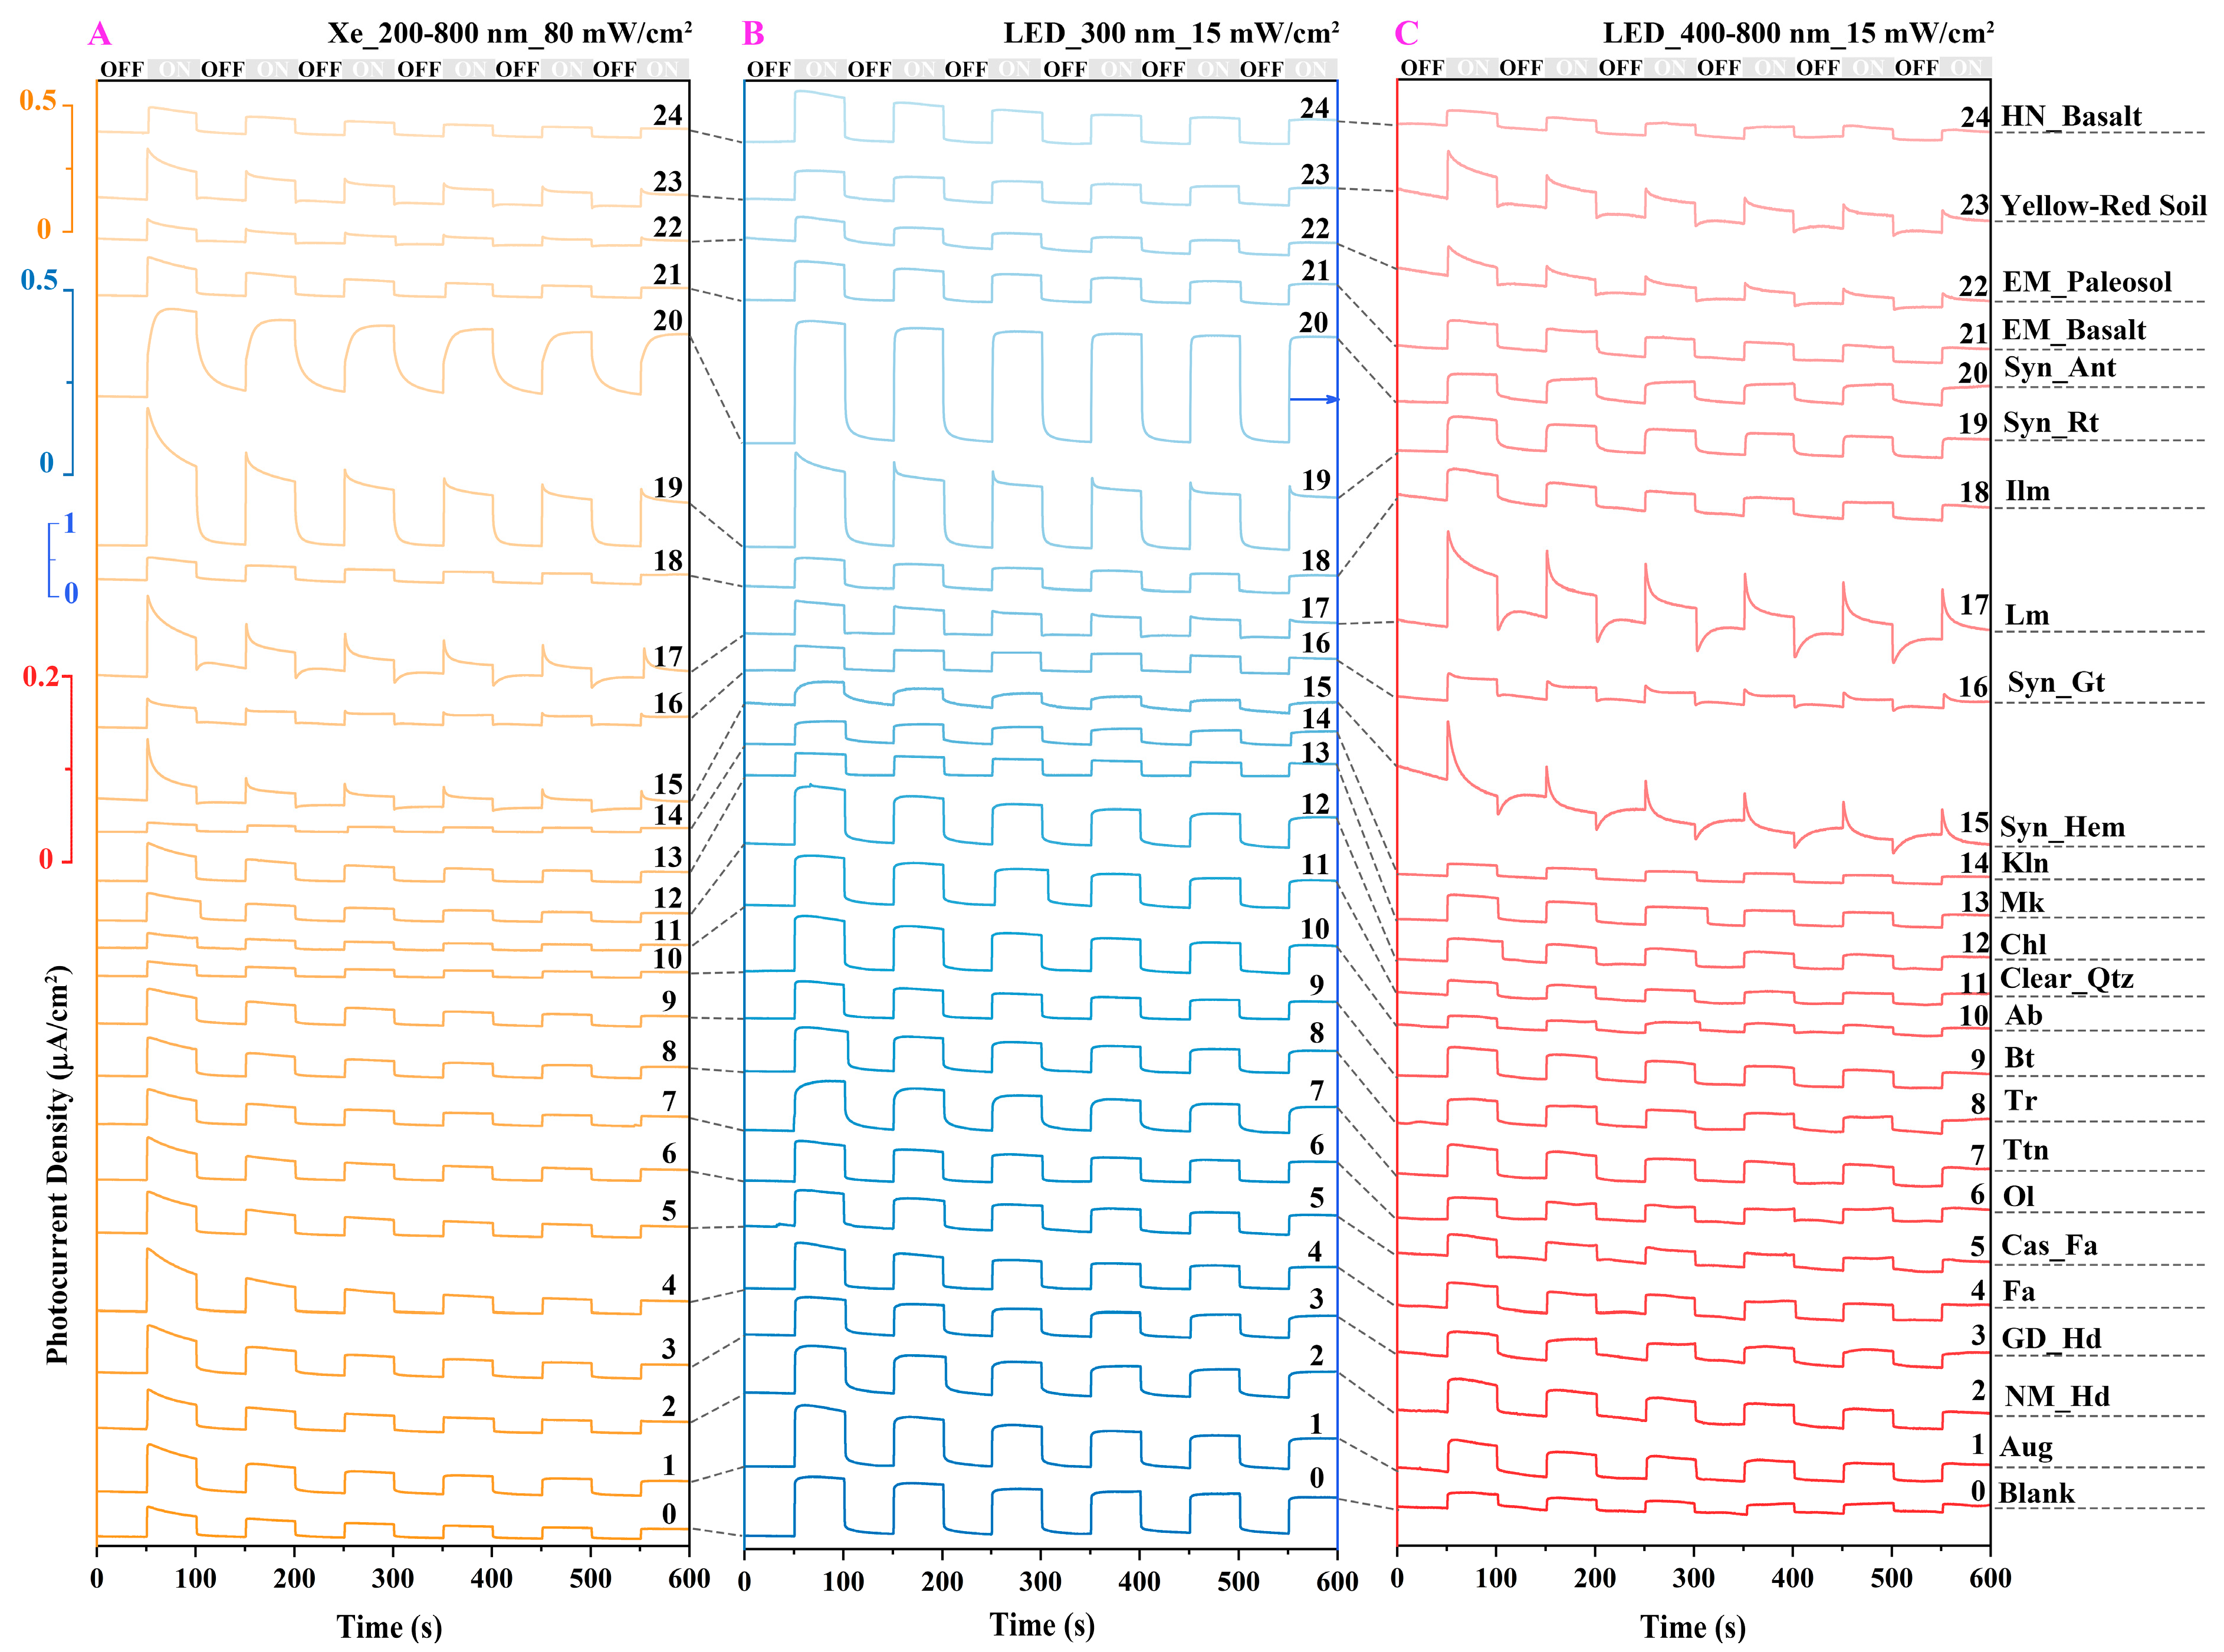
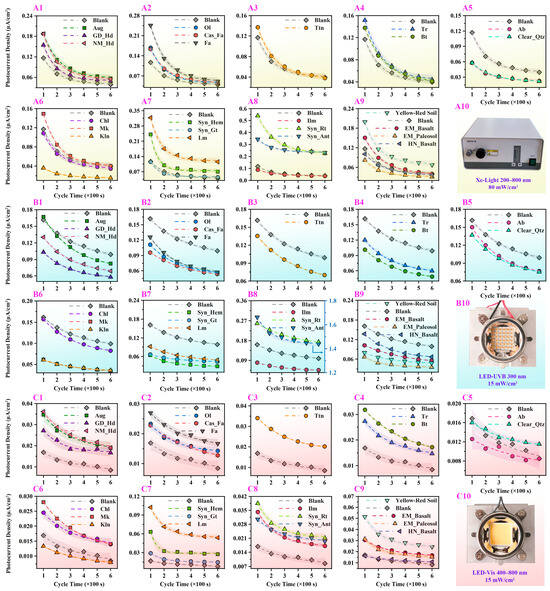
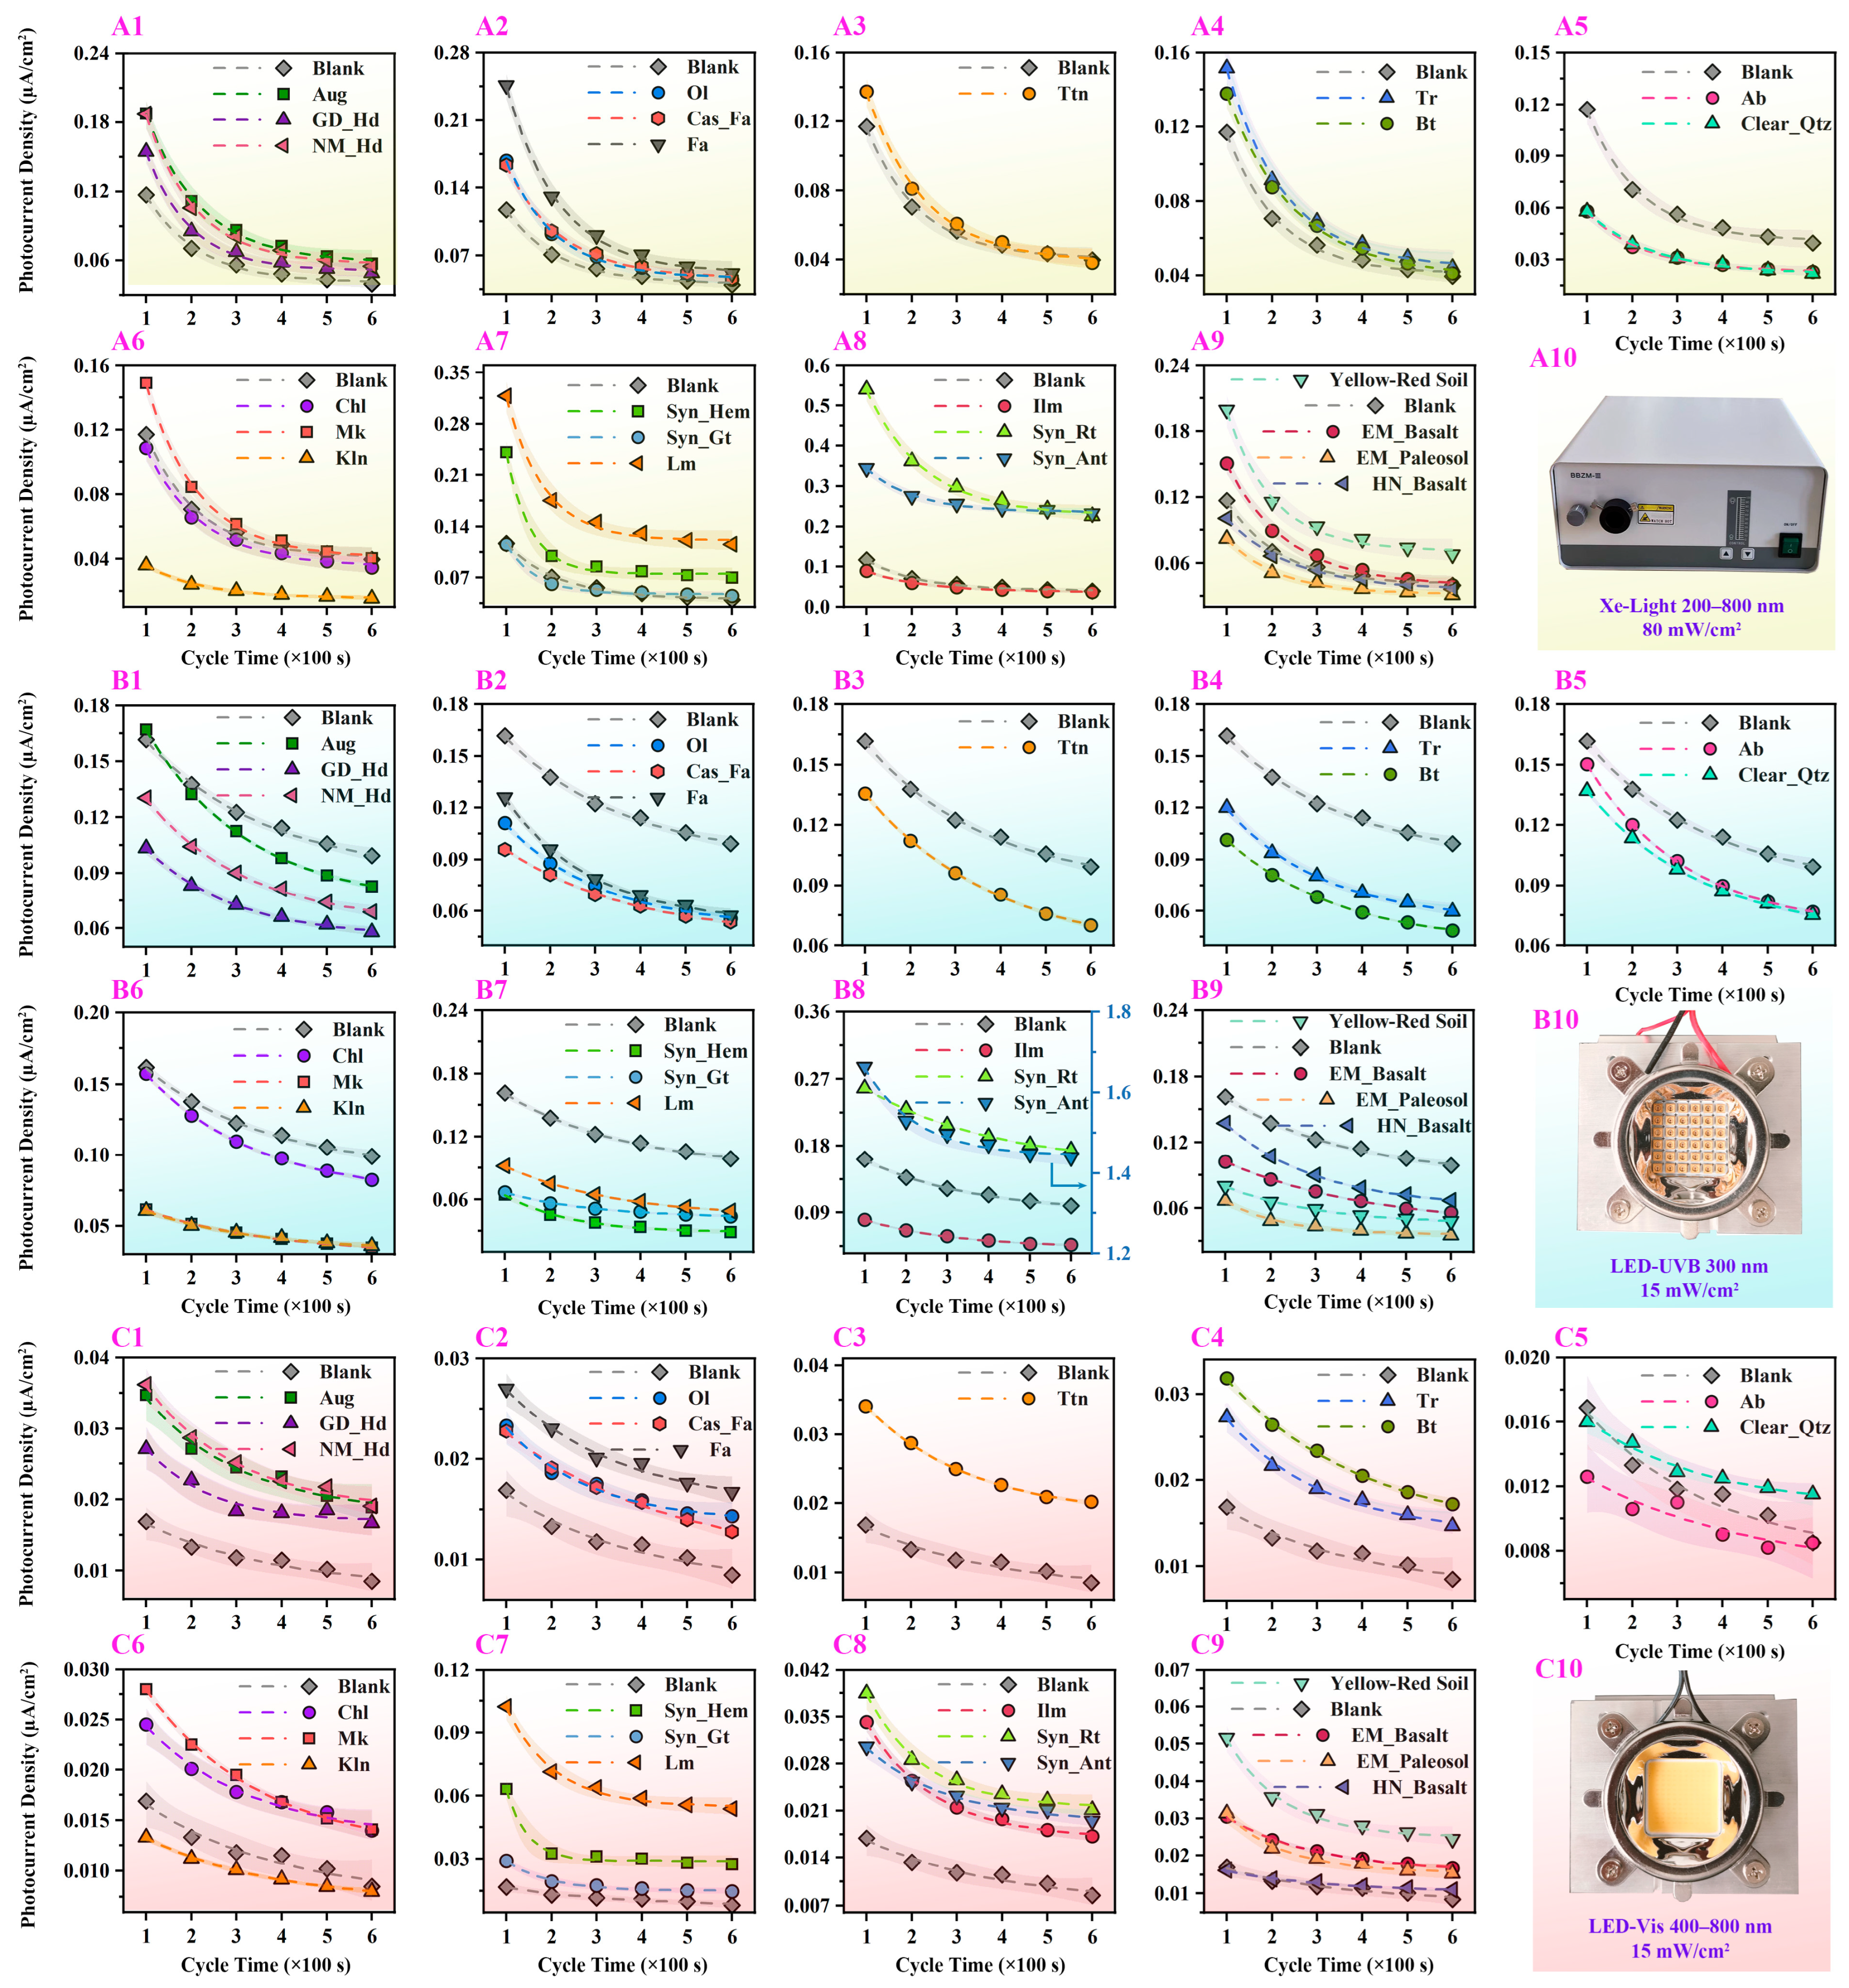
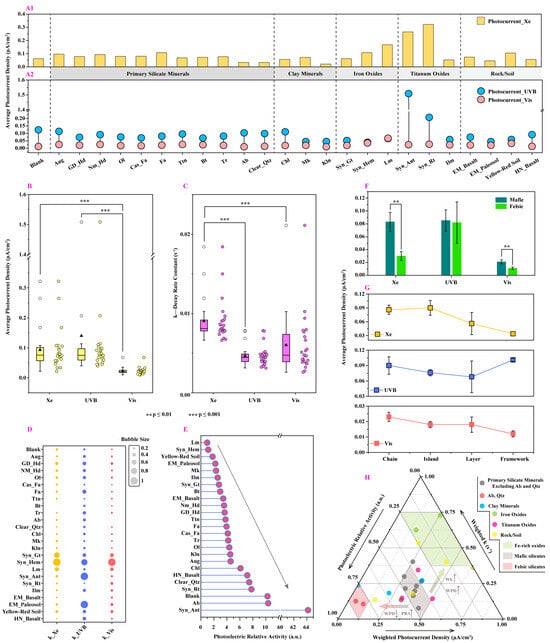
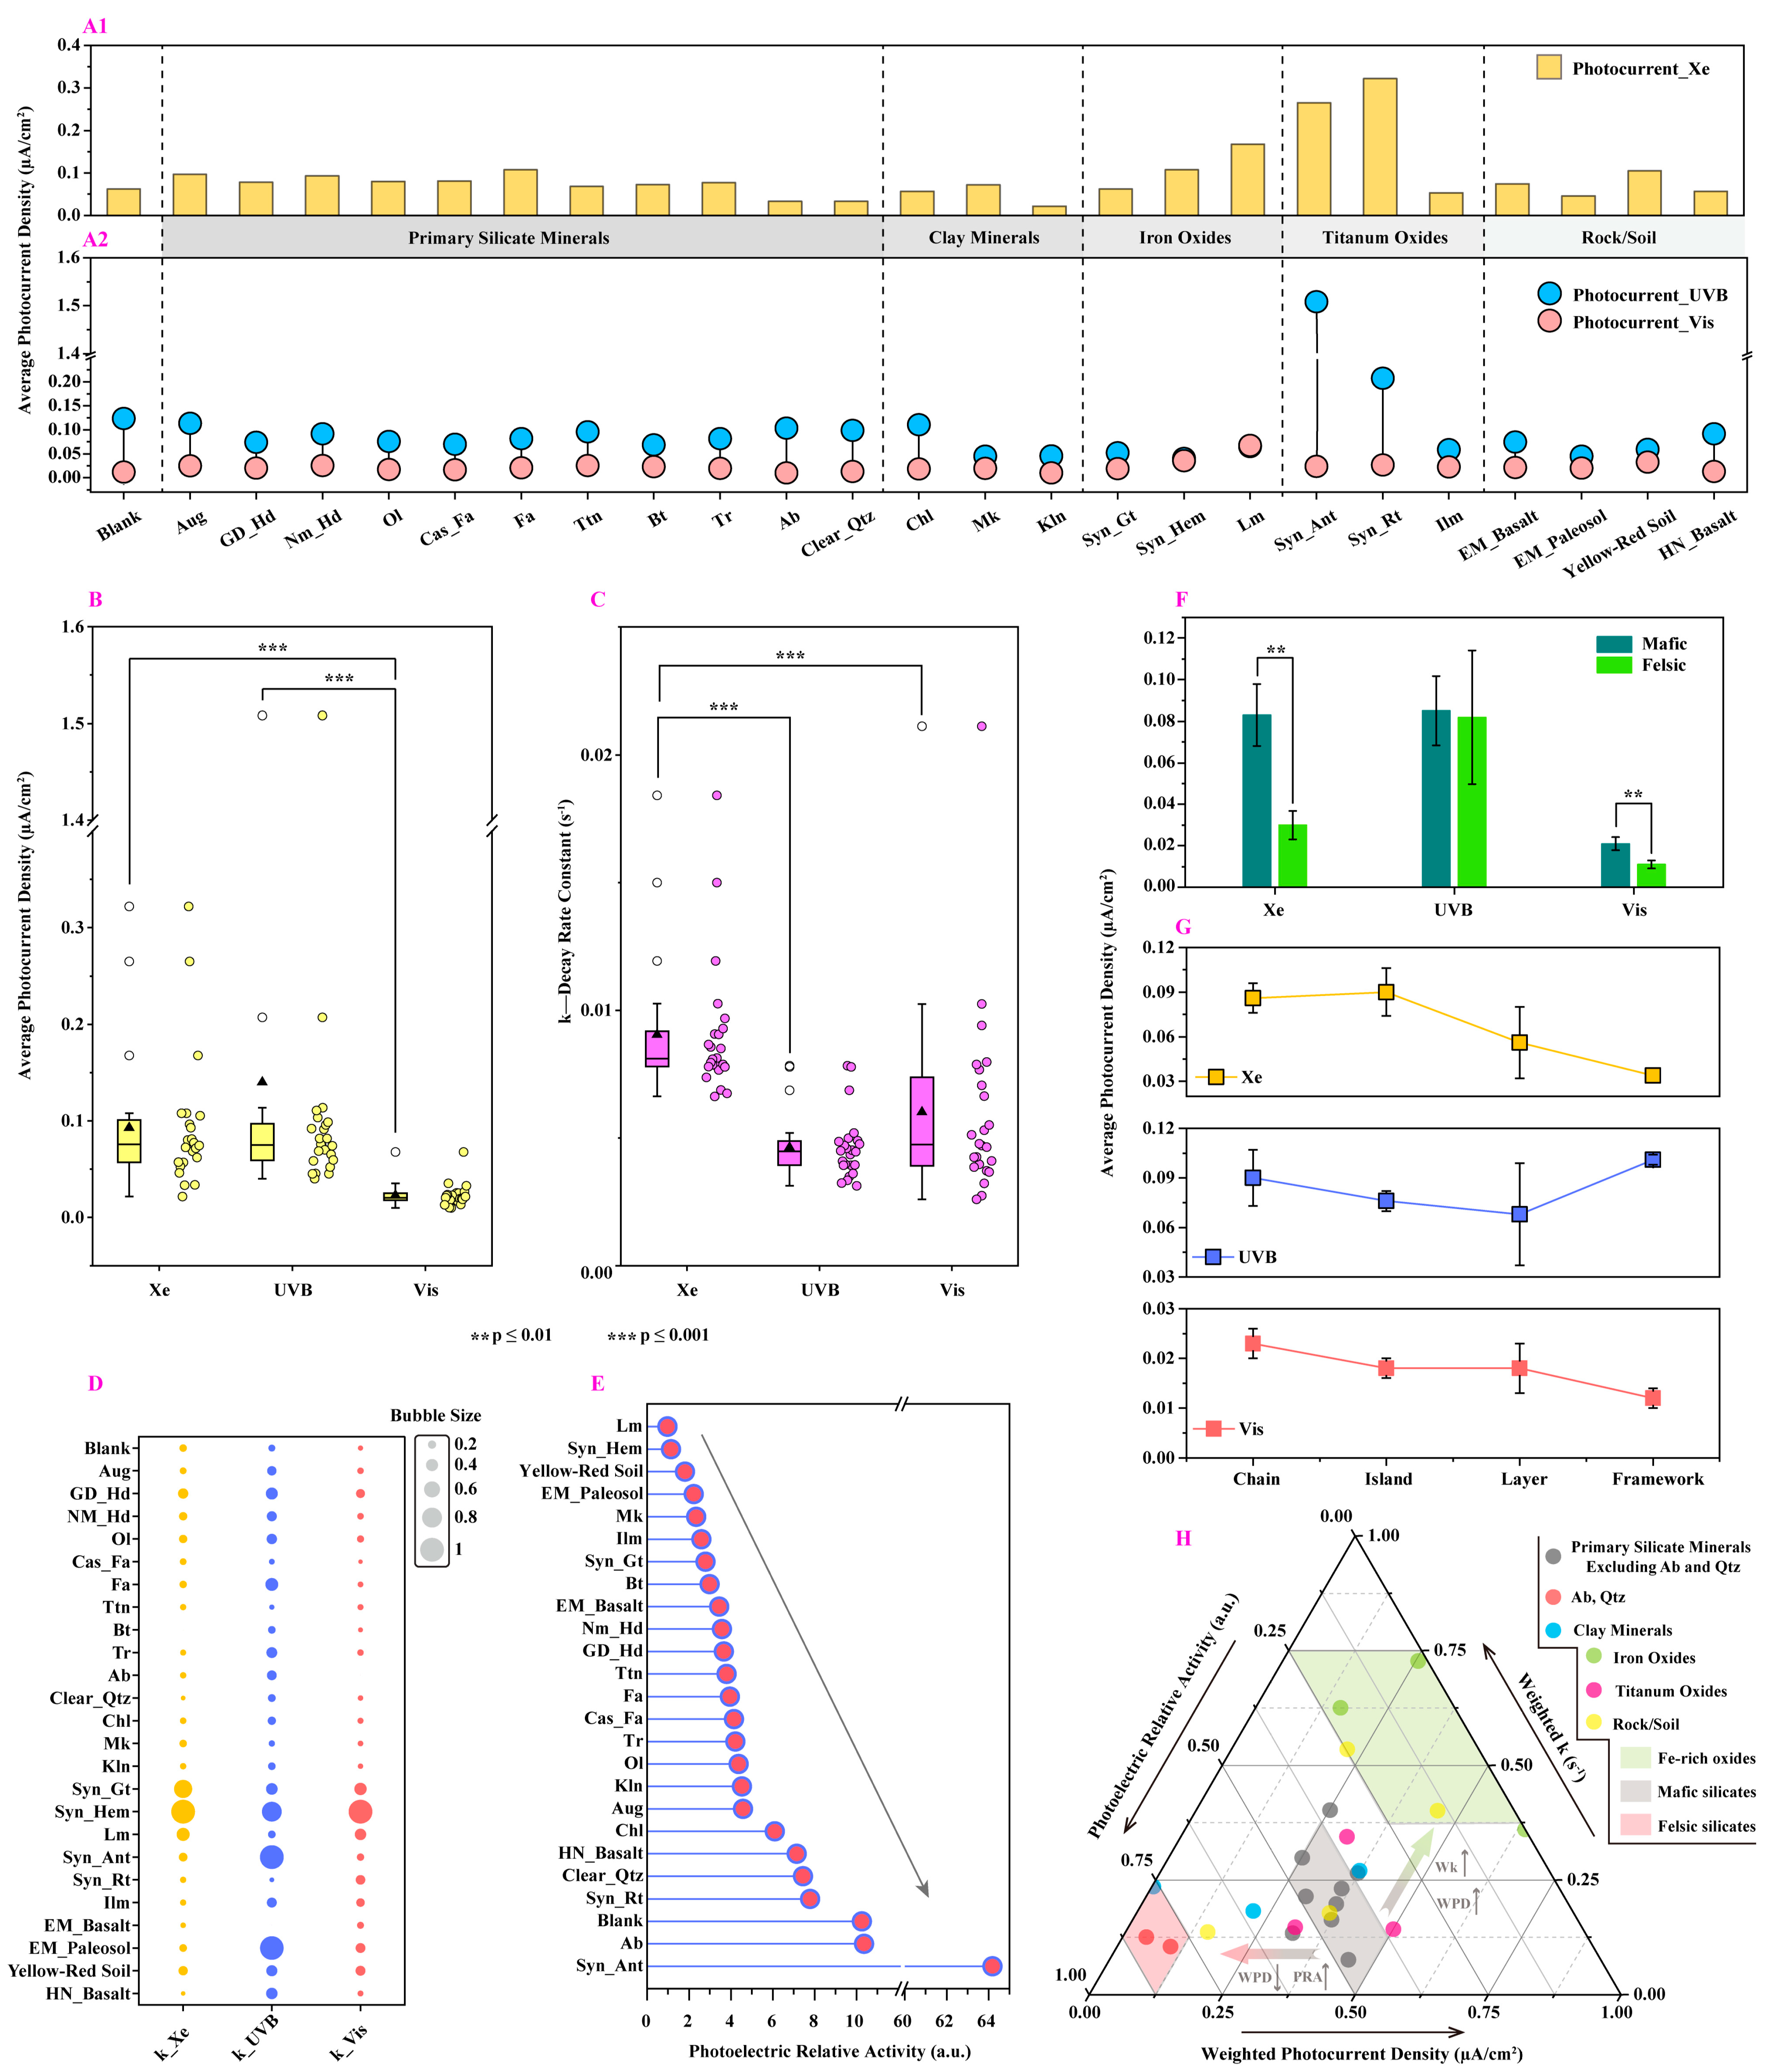
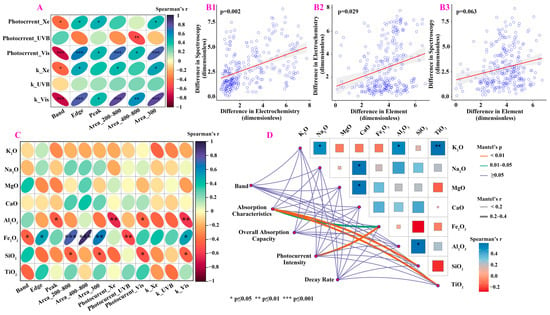
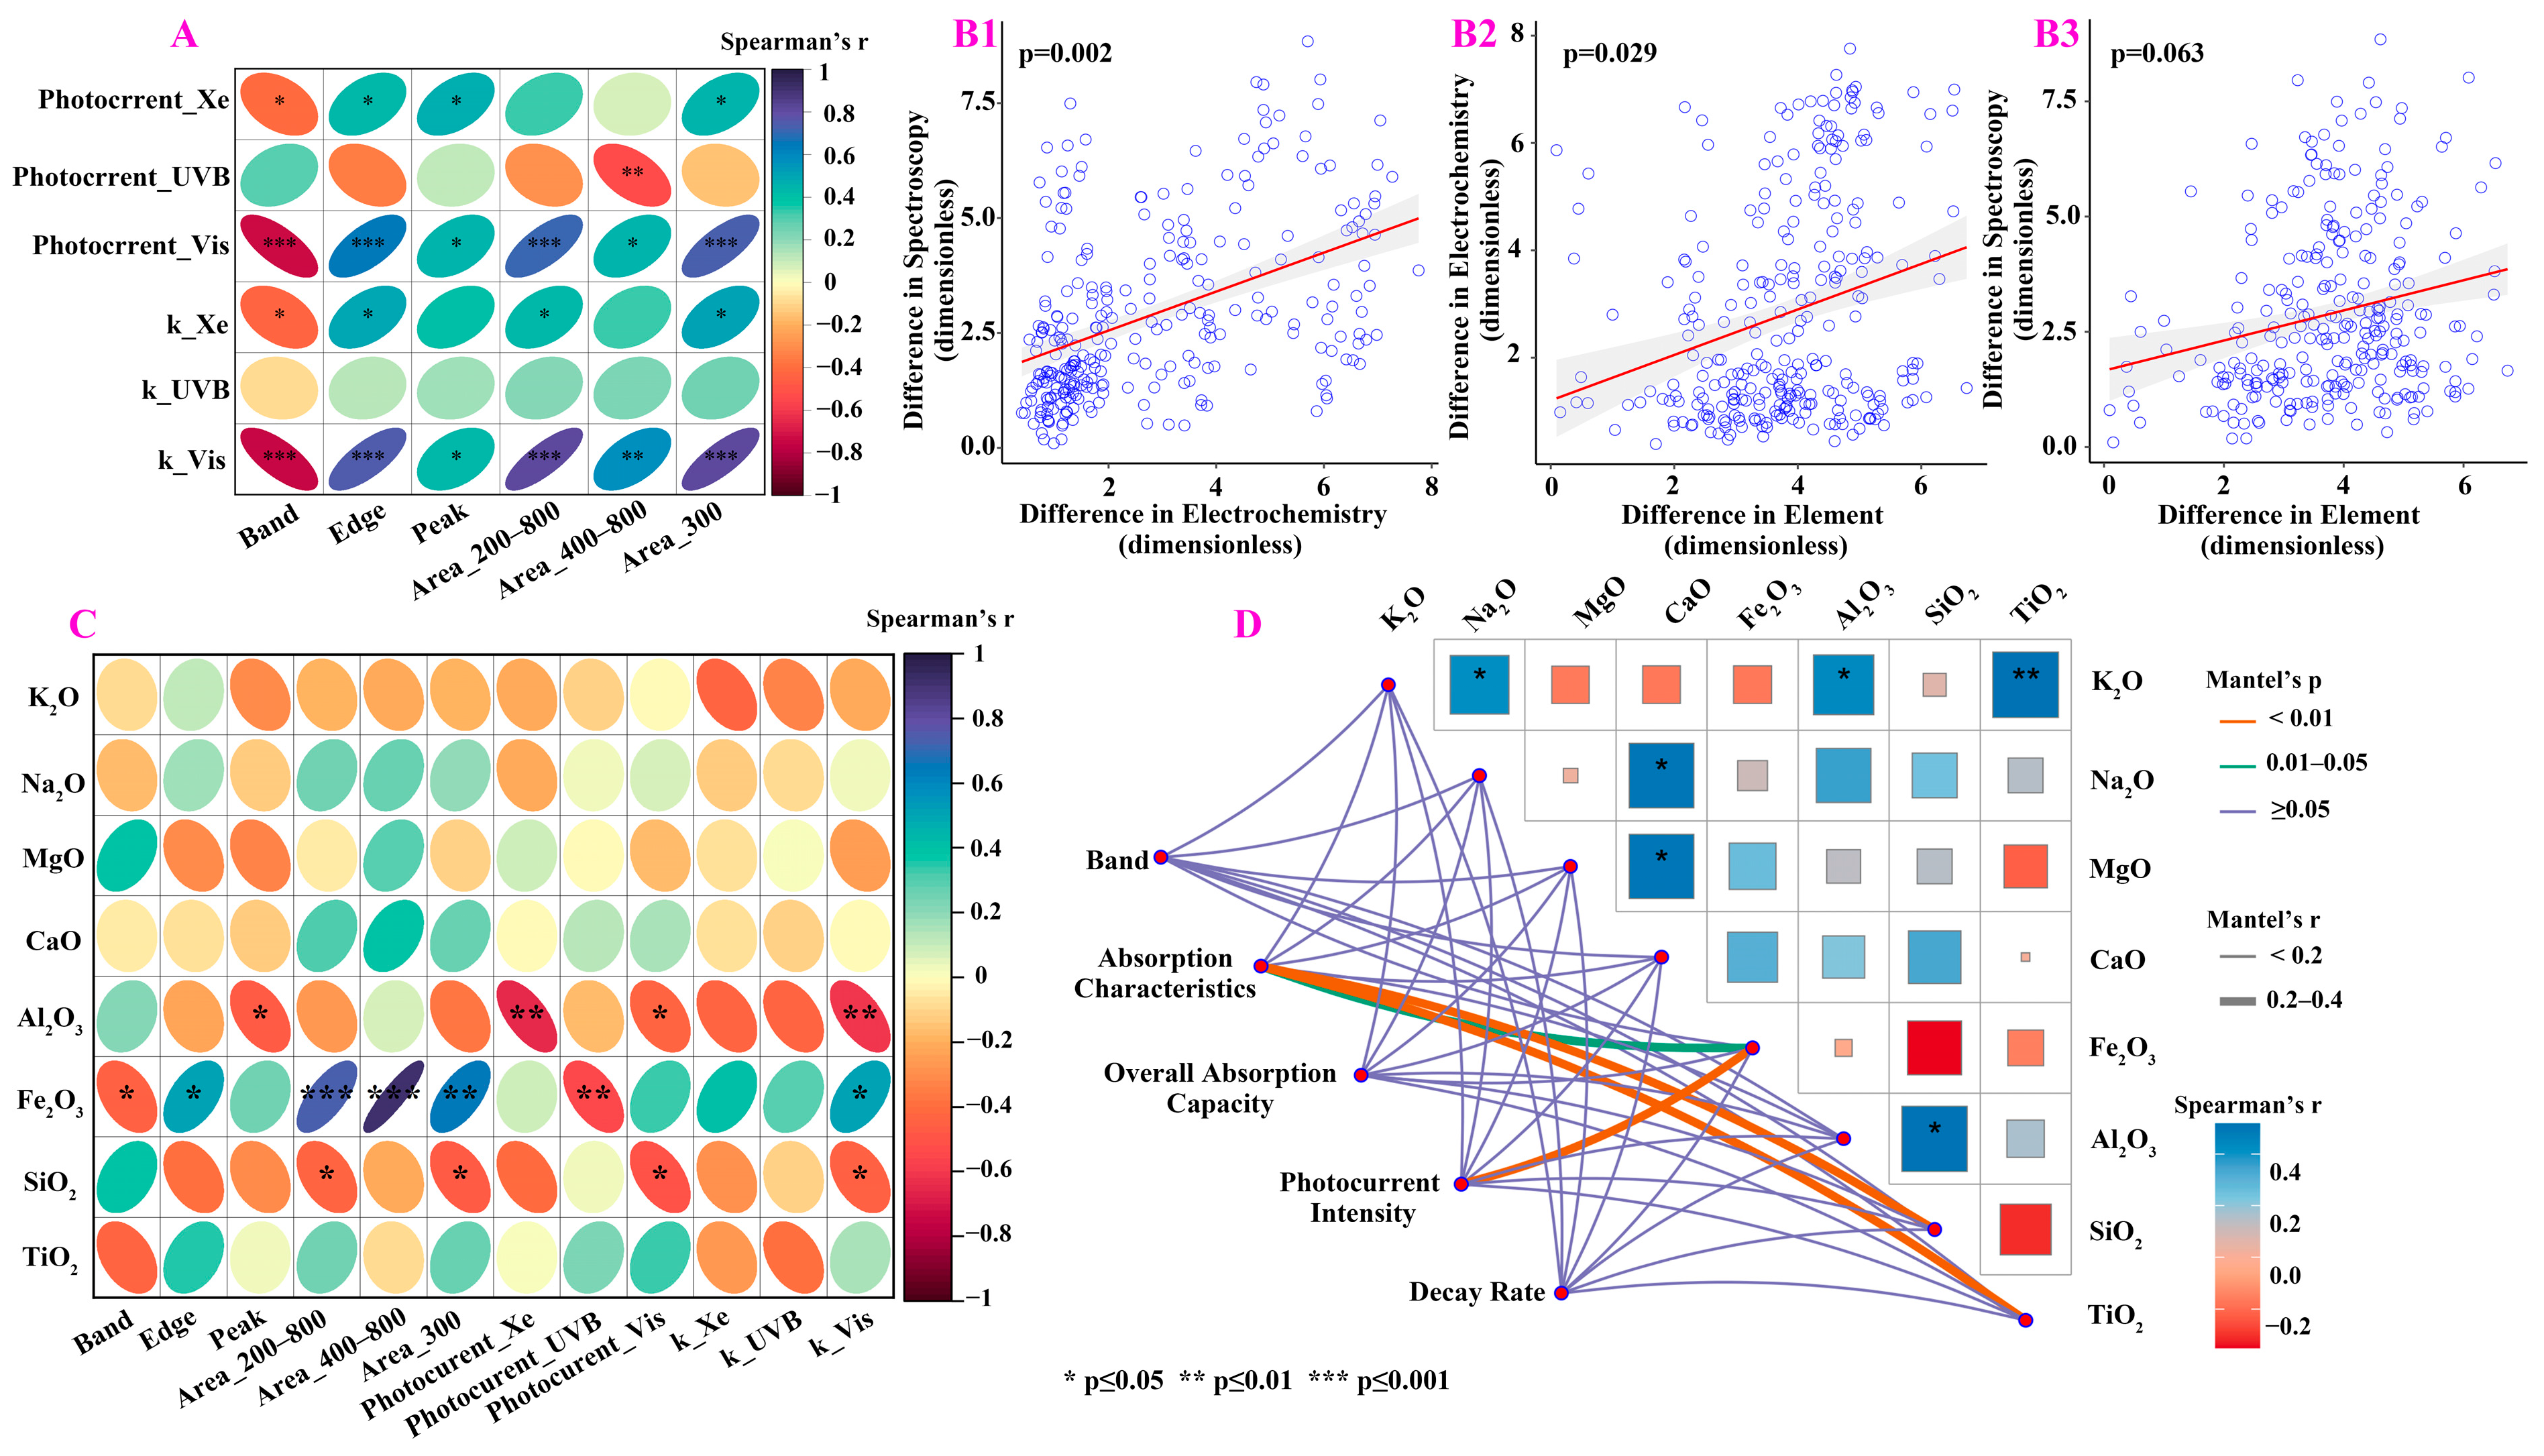
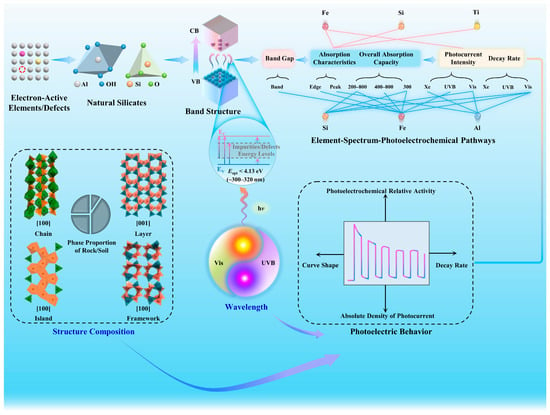
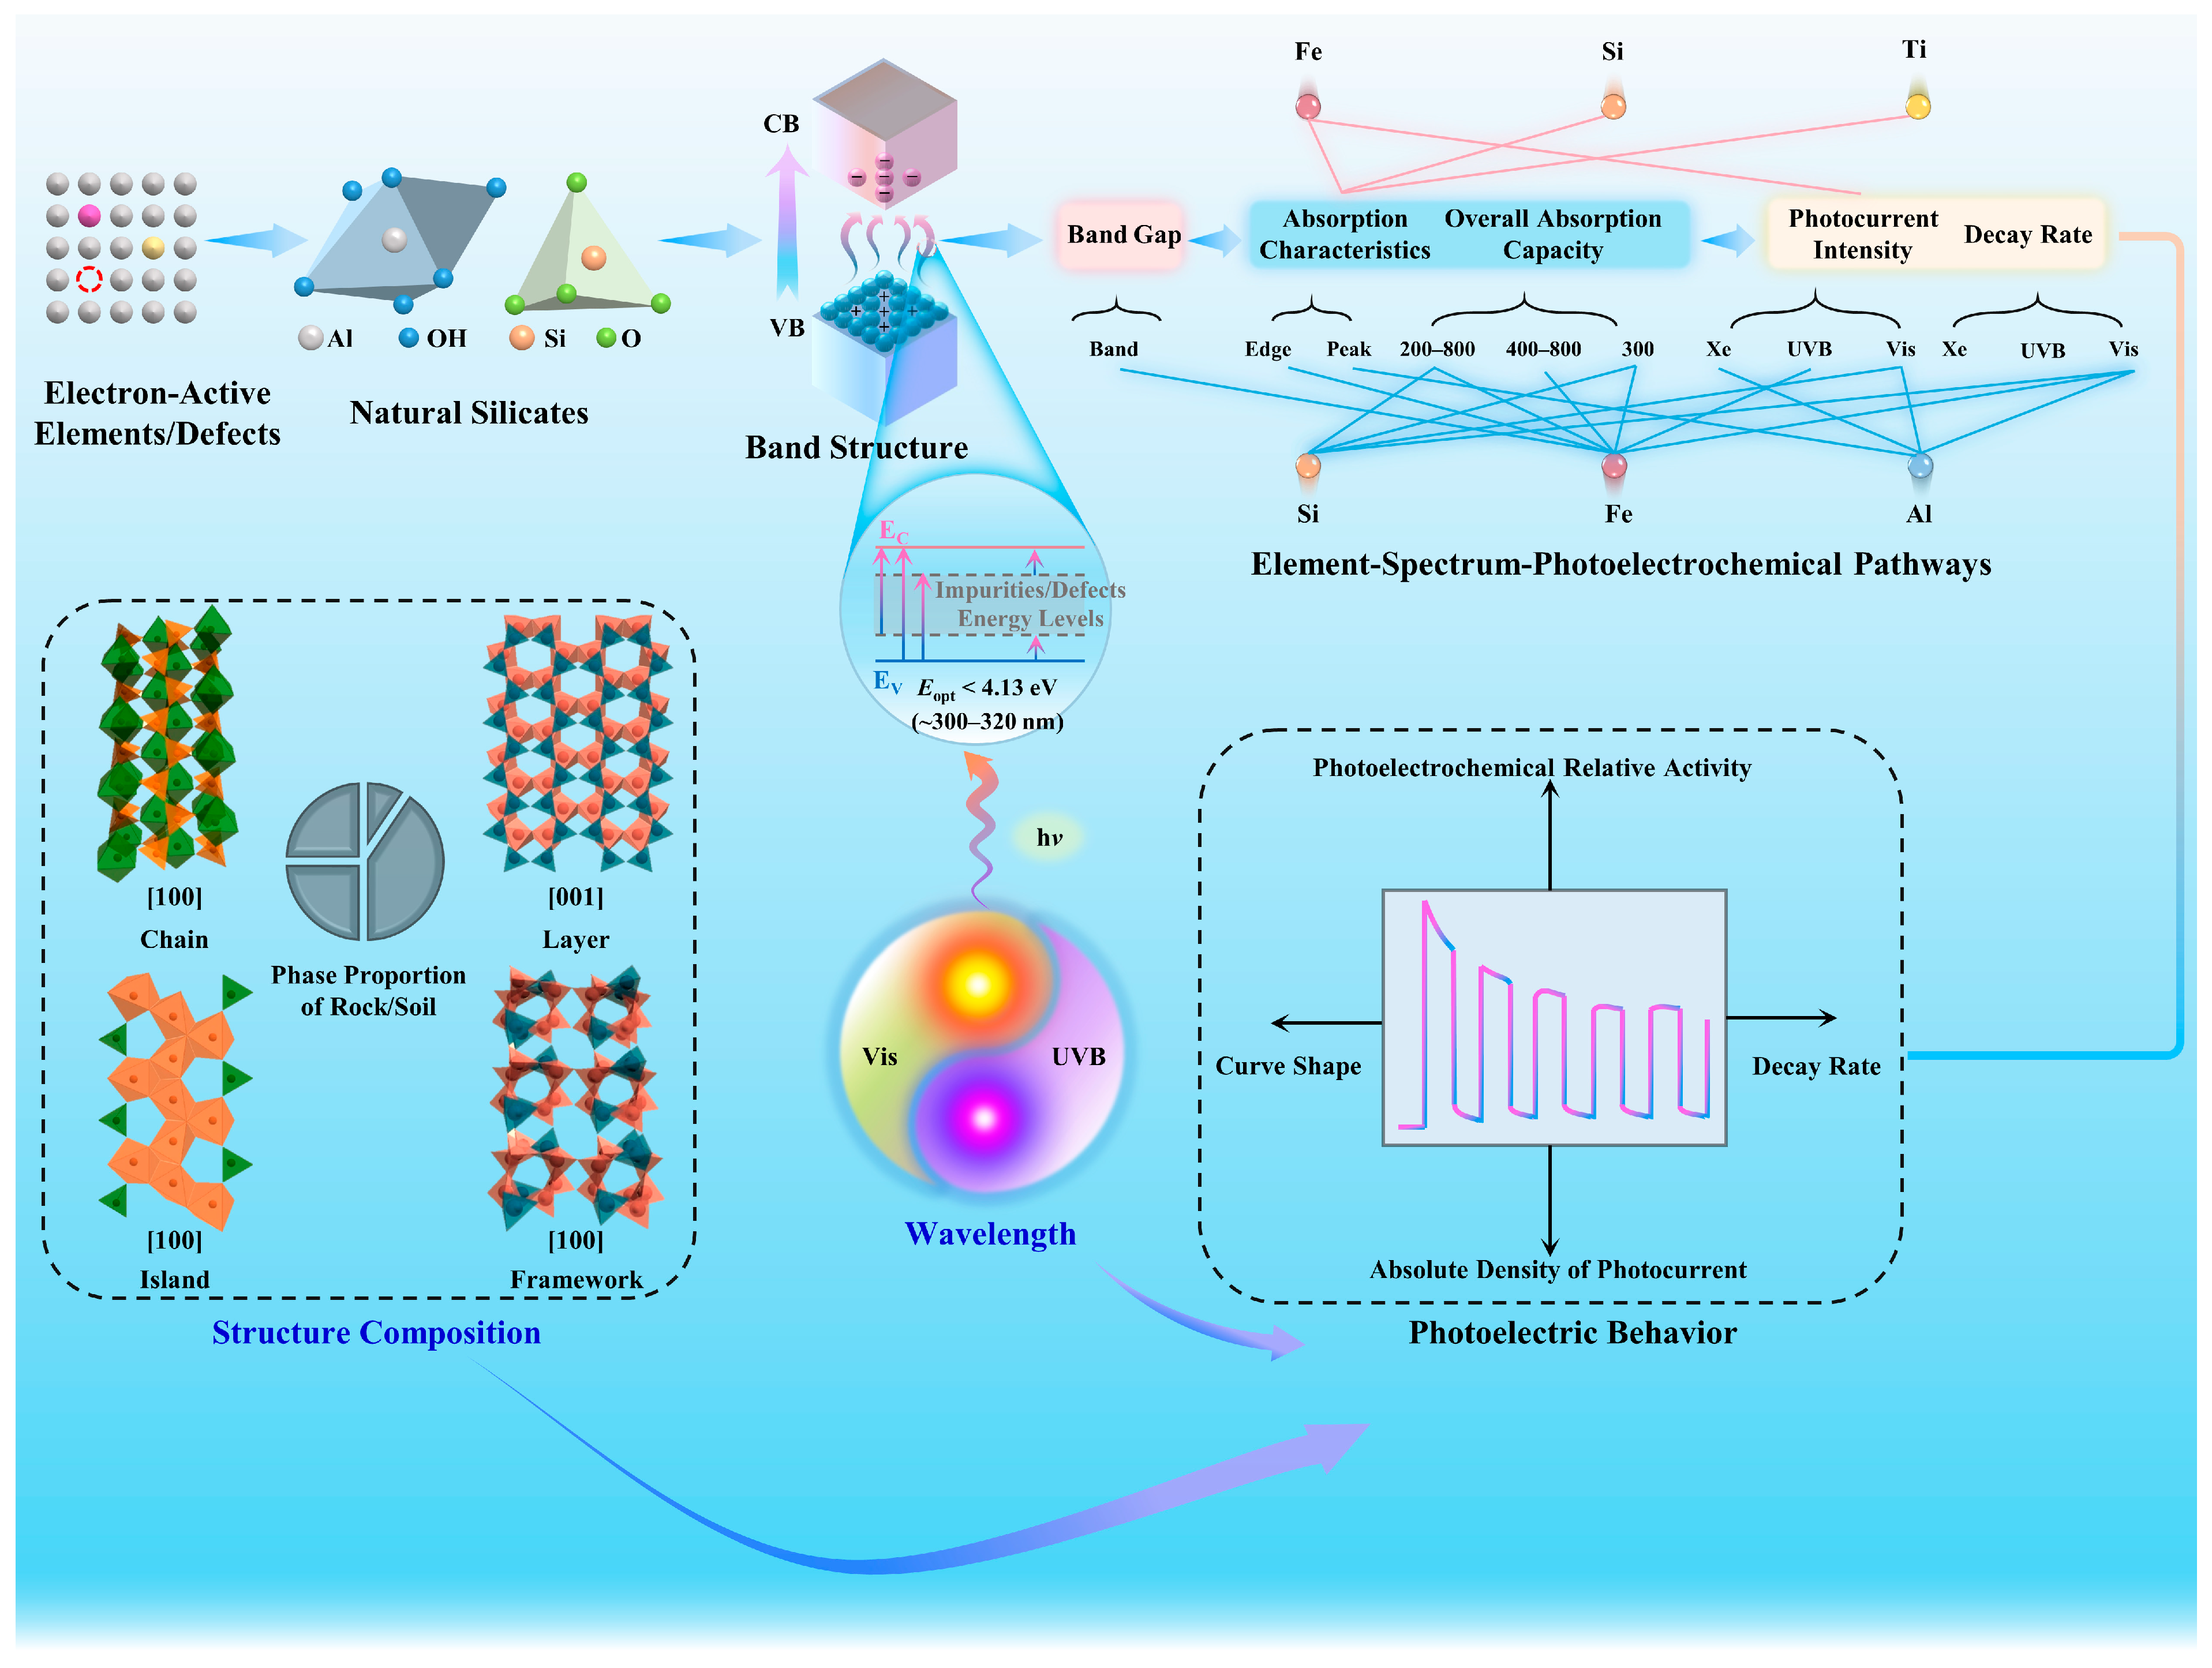

Disclaimer/Publisher’s Note: The statements, opinions and data contained in all publications are solely those of the individual author(s) and contributor(s) and not of MDPI and/or the editor(s). MDPI and/or the editor(s) disclaim responsibility for any injury to people or property resulting from any ideas, methods, instructions or products referred to in the content. |
© 2026 by the authors. Licensee MDPI, Basel, Switzerland. This article is an open access article distributed under the terms and conditions of the Creative Commons Attribution (CC BY) license.