


Abstract
The spatiotemporal evolution of ecosystem services and the elucidation of their driving mechanisms constitute a central scientific issue in territorial spatial optimization and regional sustainable development. Taking Gansu Province, a core area of the ecological security barrier in northwestern China, as the study area, this study integrates land-use, natural geographic, and socioeconomic data from 2000 to 2020. Using a land-use transfer matrix, the InVEST model, the Geographical Detector, and the PLUS model, we constructed a comprehensive analytical framework that combines historical evolution analysis, spatial differentiation identification, and multi-scenario simulation and prediction. The framework was used to systematically reveal the spatiotemporal dynamics of four core ecosystem services, namely carbon storage (CS), water yield (WY), habitat quality (HQ), and soil retention service (SDR), and to analyze their natural and socioeconomic driving mechanisms, while also simulating land-use change and ecosystem-service responses under the natural development, ecological protection, and urban expansion scenarios in 2030. The results show that, from 2000 to 2020, land use in Gansu Province was dominated by grassland (average proportion: 33.34%) and unused land (average proportion: 41.35%). Urban land expanded from 660.52 km2 to 2227.36 km2, with its share increasing from 0.15% to 0.50%, mainly through the conversion of cropland and grassland. Ecosystem services exhibited marked spatial differentiation: CS increased from east to west; WY showed an increasing pattern from northwest to southeast; HQ was lower in the central and southeastern regions and higher in the western and southern regions; and SDR was dominated by low-value areas in the northwest (average proportion: 84.81%). Driving-mechanism analysis indicated that slope was the core natural factor affecting CS, HQ, and SDR (q = 0.18–0.45), while mean annual precipitation dominated the variation in WY (q = 0.31–0.35). The influence of socioeconomic factors such as GDP increased gradually over time, showing an evolutionary trend from natural dominance to coordinated natural–socioeconomic regulation. Multi-scenario simulation further showed that, under the ecological protection scenario, grassland area increased significantly (+0.60%), the proportions of medium-value CS zones and high-value WY zones increased, and ecosystem services were optimized overall; under the urban expansion scenario, cropland and urban land expanded (+0.87% and +0.23%, respectively), imposing potential pressure on part of the ecosystem-service functions. These findings provide a scientific basis for optimizing territorial spatial planning, strengthening the ecological security barrier, and promoting regional sustainable development in Gansu Province. The methodological framework also offers a broadly applicable reference for ecologically sensitive arid and semi-arid regions in northwestern China.
1. Introduction
Ecosystem services form the foundation of human production and daily life, as well as regional ecological security. Their supply capacity and spatial distribution directly affect the efficiency of resource allocation and the sustainability of socioeconomic development [1]. Since the Study of Critical Environmental Problems (SCEP) first introduced the concept of “environmental services” in the 1970s [2], the roles of ecosystems in climate regulation [3], material cycling [4], soil and water conservation [5], and biodiversity maintenance [6] have been systematically recognized. The United Nations 2030 Agenda for Sustainable Development established an overarching framework for global sustainability [7], and ecosystem services are closely linked to multiple Sustainable Development Goals (SDGs). For example, water conservation capacity provides essential support for achieving the goal of sustainable water resource management under SDG 6 (Clean Water and Sanitation); CS assessment supports climate change mitigation and carbon neutrality under SDG 13 (Climate Action); and the maintenance of SDR and HQ is an important pathway for implementing SDG 15 (Life on Land), curbing land degradation, and restoring ecosystem functions [8,9,10]. Given the central role of ecosystem services in national ecological security and sustainable development, China has incorporated them into the key indicator system for the delineation and regulation of ecological protection redlines. Land Use/Cover Change (LUCC), by reshaping surface-cover types, landscape patterns, and ecological processes [11], regulates regional material and energy cycles [12] and is widely regarded as one of the key drivers of the spatiotemporal evolution of ecosystem services [13].
A substantial body of research has confirmed that LUCC exerts significant effects on ecosystem-service provision. In the Beijing–Tianjin–Hebei region, land-use change under different economic development scenarios has led to a decline in ecosystem carbon storage, and rapid urbanization has markedly compressed high-HQ areas [14]. At the watershed scale, land-use intensity is generally negatively correlated with biodiversity and multiple ecosystem services, whereas biodiversity can, to some extent, enhance the synergistic supply of ecosystem services [15]. Cross-regional studies have further shown that, in areas such as France, the potential positive effects of climate change on ecosystem services are often offset by the indirect effects of land-use change, reflecting the complex interactions between natural processes and human activities [16]. In Zhangjiakou and Chengde, Hebei Province, shrubland has shown relatively high ecological benefits in terms of WY and SDR, further highlighting the important regulatory role of land-use types in ecosystem-service provision [17].
Although related research has accumulated steadily, clear limitations remain. On the one hand, most existing studies focus on a single ecosystem service or static assessments at a single time point, making it difficult to systematically reveal the synergies and trade-offs among multiple ecosystem services during long-term evolution [18]. On the other hand, the response of ecosystem services to land-use change often shows pronounced nonlinear characteristics, yet analyses of driving mechanisms still rely largely on traditional linear methods, which makes it difficult to fully capture the interactions between natural geographic conditions and socioeconomic factors, particularly in ecologically fragile arid and semi-arid regions [19,20].
From the methodological perspective, ecosystem-service assessment models have continued to evolve. The InVEST model has been widely applied because of its spatially explicit quantification of multiple services, including carbon storage [21], water yield [22], soil retention service [23], and habitat quality [24]. The ARIES model has advantages in analyzing service flows and trade-offs, but it depends strongly on case-specific data and has limited generalizability [25]. The SolVES model is mainly used to characterize ecosystem services related to cultural and social values, and its results are often presented in the form of nonmonetary indices [26]. Meanwhile, land-use simulation models, such as CA [27], CLUE-S [28], FLUS [29], and PLUS [30], each have their own strengths in simulating land-use evolution, among which the PLUS model shows strong adaptability in simulating patch-scale evolution under the constraints of multiple driving factors. Accordingly, coupling land-use scenario simulation models with ecosystem-service assessment models to reveal the impacts of land-use change on ecosystem-service provision and their response mechanisms has gradually become a mainstream methodological paradigm in this field.
In addition, research on the driving mechanisms of ecosystem services has gradually shifted from analyses centered on single natural factors toward an integrated natural–socioeconomic perspective. The Geographical Detector method has clear advantages in dealing with nonlinear relationships and interactions among multiple factors, and has been used to analyze the spatial differentiation of ecosystem services and their driving mechanisms in regions such as Beijing–Tianjin–Hebei [14]. However, systematic studies that combine this approach with multi-scenario land-use simulation in arid and semi-arid regions remain relatively limited.
Gansu Province is located in the arid and semi-arid region of northwestern China and lies at the junction of the Loess Plateau, the Qinghai–Tibet Plateau, and the Inner Mongolia Plateau. It is characterized by ecological fragility and prominent human–land conflicts [31]. In recent years, under the combined background of accelerated urbanization and the continued implementation of ecological projects, the regional land-use pattern has undergone substantial adjustments, and ecosystem-service provision has shown marked spatiotemporal heterogeneity; nevertheless, its evolutionary mechanisms and future trends remain highly uncertain [32]. Therefore, it is necessary to construct an integrated analytical framework in this region that combines historical evolution analysis, driving-mechanism identification, and scenario simulation.
Accordingly, this study takes Gansu Province as the study area and comprehensively applies the InVEST model, the PLUS land-use simulation model, and the Geographical Detector method to systematically analyze the spatiotemporal evolution of land use and ecosystem services, identify their driving mechanisms, and evaluate future ecosystem-service responses under different land-use scenarios. The study focuses on three key questions: (1) What are the spatiotemporal evolution characteristics of land-use patterns and ecosystem services in Gansu Province from 2000 to 2020? (2) What are the driving mechanisms through which natural geographic and socioeconomic factors affect the spatial differentiation of ecosystem services? (3) What possible response patterns may ecosystem services show in Gansu Province in 2030 under different development scenarios? The study aims to provide scientific support for the construction of the ecological security barrier, the optimization of territorial spatial planning, and sustainable land use in Gansu Province, while also offering a methodological reference for integrated ecosystem-service research in ecologically sensitive arid and semi-arid regions.
2. Materials and Methods
2.1. Overview of the Study Area
Gansu Province is located in northwestern China (32°11′–42°57′ N, 92°13′–108°46′ E), with a total area of about 4.258 × 10⁵ km2. Situated at the junction of the Loess Plateau, the Qinghai–Tibet Plateau, and the Inner Mongolia Plateau, the province is long and narrow in shape, with terrain that generally slopes from southeast to northwest (Figure 1). Jointly influenced by the topographic pattern and large-scale atmospheric circulation, Gansu lies in the transitional zone from the monsoon region to the non-monsoon region and exhibits pronounced climatic spatial differentiation. Annual precipitation decreases from about 760 mm in the southeast to less than 50 mm in the northwest, whereas evaporation shows the opposite trend, forming a marked humidity gradient. The complex topography and climate have shaped diverse landforms and ecosystem patterns. The Hexi Corridor in central and western Gansu presents a typical mountain–oasis–desert composite landscape, and its ecosystems are highly sensitive to changes in water resources. The southeastern part lies in the transitional zone between the Qinghai–Tibet Plateau and the Loess Plateau, where mountains and hills are widely distributed and forest and grassland ecosystems are concentrated, forming an important regional ecological conservation space [33,34]. Marked differences among geomorphic types in water conservation, SDR, and habitat support result in strong spatial heterogeneity in ecosystem services.
Figure 1.
Location of Gansu Province. Notes: (a) shows the administrative boundaries of Gansu Province and the prefecture-level administrative divisions; (b) shows the 2020 land-use/land-cover classification map of Gansu Province based on the CNLUCC dataset; and (c) shows the Digital Elevation Model (DEM), indicating terrain elevation in meters across the province.
2.2. Data Sources
This study integrates natural environmental data, meteorological data, and socioeconomic data (Table 1). The natural environmental data include land-use data (China National Land Use/Cover Change dataset, CNLUCC), the Digital Elevation Model (DEM), the normalized difference vegetation index (NDVI), and water-distribution data. The meteorological data mainly include annual precipitation and potential evapotranspiration, both obtained from the National Tibetan Plateau Data Center. These variables are important inputs for estimating WY and soil erosion, and are also key driving variables regulating ecosystem water supply capacity and habitat stability. Soil data were derived from the dataset of soil conservation capacity for preventing water erosion in China and were mainly used for the quantitative estimation of SDR. Socioeconomic data include GDP (gross domestic product) and transportation infrastructure data such as railways and highways.
Table 1.
Data sources, temporal coverage, spatial resolution, and applications of datasets used in this study for analyzing land-use change and ecosystem services in Gansu Province.
2.3. Research Methods
To systematically examine the spatiotemporal evolution, driving mechanisms, and future responses of ecosystem services under land-use change in Gansu Province, this study constructed an integrated methodological framework covering historical evolution analysis, spatial differentiation identification, and multi-scenario simulation and prediction (Figure 2). Centered on land-use change, this framework organically links ecosystem-service assessment, driving-mechanism analysis, and scenario simulation, thereby forming a complete analytical path from current-state understanding to future projection. Specifically, a land-use transfer matrix and the InVEST model were first used to quantitatively analyze land-use pattern change and the spatiotemporal evolution of ecosystem services, including CS, WY, HQ, and SDR, in Gansu Province from 2000 to 2020. Second, the optimal-parameter Geographical Detector model was employed to identify the spatial differentiation of ecosystem services and the driving mechanisms of natural environmental and socioeconomic factors, thereby revealing the explanatory power of different factors and their interactions for ecosystem services. Finally, combined with the PLUS model, land-use patterns and ecosystem services in 2030 were simulated and predicted under multiple scenarios, including natural development, ecological protection, and urban expansion, in order to analyze ecosystem-service responses and spatial restructuring processes under different development pathways. Through the systematic coupling of ecosystem-service assessment, driving-mechanism analysis, and scenario simulation, the study establishes an integrated analytical pathway to reveal the mechanisms through which land-use change affects ecosystem services in Gansu Province, thereby providing scientific support for regional territorial spatial optimization and ecological security barrier construction.
Figure 2.
Conceptual framework and technical workflow for analyzing the spatiotemporal dynamics and driving mechanisms of ecosystem services in Gansu Province. Notes: CS denotes carbon storage, WY denotes water yield, HQ denotes habitat quality, SDR denotes soil retention service, Elev denotes elevation (X1), Slp denotes slope (X2), Asp denotes aspect (X3), AAP denotes annual average precipitation (X4), AAT denotes annual average temperature (X5), ET denotes evapotranspiration (X6), NDVI denotes normalized difference vegetation index (X7), and GDP denotes gross domestic product (X8).
2.3.1. Land-Use Transition Matrix
The land-use transfer matrix can be used to analyze the mutual conversion relationships among different land-use types during the study period and to reflect the direction and intensity of land-use structural adjustment [41]. By analyzing the inflow and outflow of each land-use type in different periods, it can reveal the internal conversion characteristics of land-use change and its dominant transformation pathways. The land-use transfer matrix is expressed as follows:
where denotes area, denotes the total number of land-use types, and denote land-use types, and denotes the area converted from land-use type to land-use type .
2.3.2. Quantifying Ecosystem Services
Quantifying ecosystem services is an important means of systematically evaluating the contribution of natural ecosystems to human well-being and also provides a scientific basis for ecological conservation and regional sustainable development decision-making. As a spatially explicit assessment tool based on ecological processes, the InVEST model can quantitatively characterize multiple ecosystem-service functions and their spatial distributions, thereby providing quantitative support for regional ecosystem management and territorial spatial planning.
Considering the diverse geomorphic types, arid and water-scarce climate, fragile ecological conditions, and localized urban agglomeration characteristics of Gansu Province, this study selected CS, WY, HQ, and SDR for quantitative assessment. These services can comprehensively reflect regional ecosystem functions in climate regulation, water resource regulation, biodiversity maintenance, and soil and water conservation, and are of great significance for maintaining ecological security in Gansu Province and the broader northwestern region.
- (1)
- Carbon Storage (CS)
CS refers to the capacity of an ecosystem to absorb and fix atmospheric carbon dioxide through photosynthesis and store it in biomass and soil. This study employed the carbon storage module of the InVEST model. Its main principle is to calculate carbon storage on the basis of land-use data and four major carbon pools, namely aboveground biomass carbon, belowground biomass carbon, soil carbon, and dead organic matter. The average carbon density of each carbon pool is multiplied by the area of the corresponding land-use type, and the sum of the four carbon pools constitutes the final CS result [14,42]. The calculation formula is provided in Appendix A.1.
- (2)
- Water Yield (WY)
The operation of the water yield module in the InVEST model is primarily based on the principle of water balance. The algorithm assumes that the WY of each raster cell is collected at the watershed outlet through surface or subsurface runoff, and the difference between precipitation and actual evapotranspiration for each raster cell is taken as the WY of that cell. The WY of raster cells is then summed and averaged to obtain the WY contribution of watersheds at different levels [43]. The calculation formula is provided in Appendix A.2.
- (3)
- Habitat Quality (HQ)
This study investigated HQ in Gansu Province using the habitat quality module of the InVEST model. The basic principle is to use land-use data as the foundation, calculate habitat degradation according to the intensity of threat factors and the sensitivity of each land-use type to those threats, and then derive HQ by combining habitat degradation with habitat suitability. HQ is an indirect indicator of biodiversity abundance, and the output values range from 0 to 1. Values closer to 1 indicate higher biodiversity in the region [43,44]. The calculation formula is provided in Appendix A.3.
- (4)
- Soil Retention Service (SDR)
SDR is defined as the difference between potential soil erosion and actual soil erosion in the study area, reflecting the strength of soil erosion resistance. The SDR module of the InVEST model is based on the Revised Universal Soil Loss Equation (RUSLE) and the sediment delivery ratio module, and calculates the difference between potential soil erosion and actual soil erosion under natural vegetation protection. In this study, the SDR module of the InVEST model was used to conduct a spatial quantitative analysis of SDR in Gansu Province, thereby revealing the spatial distribution characteristics of regional soil conservation functions [45]. The calculation formula is provided in Appendix A.4.
2.3.3. Quantitative Detection of Factors Influencing Spatiotemporal Patterns of Ecosystem Services
Based on the Geographical Detector method implemented in R, the factor detector and interaction detector were used to systematically quantify the mechanisms by which natural environmental and socioeconomic factors influence the spatiotemporal evolution of ecosystem services. Specifically, the factor detector evaluates the degree of spatial stratified heterogeneity in the dependent variable and measures the explanatory power of each independent variable for such heterogeneity using the q statistic. A higher q value indicates a stronger explanatory effect of the corresponding factor on the spatial heterogeneity of ecosystem services. The interaction detector is used to identify the joint effects of multiple factors and to reveal how different driving factors interact to shape the spatiotemporal distribution patterns of ecosystem services [46].
Compared with traditional regression models, this method can effectively avoid interference from multicollinearity among variables during the analytical process. Through stratified comparison, it can clearly distinguish the independent effects of different influencing factors on ecosystem service change and can still ensure robust and reliable results even when the explanatory variables are highly correlated. This provides an effective means of further revealing the composite driving mechanisms of natural and human factors underlying ecosystem service patterns and offers a scientific basis for regional land-use optimization and ecological conservation decision-making. In addition, the interaction detector evaluates the synergistic effects among multiple factors (Appendix A.4 Table A1), thereby identifying the influence of interactions among different factors on ecosystem services and revealing how they jointly affect the spatiotemporal changes in ecosystem services [14]. The specific formula is as follows:
where ranges from 0 to 1, and a larger value indicates stronger explanatory power of the corresponding factor for the spatial distribution of ecosystem services; denotes the number of classes of the influencing factor; and denote the numbers of units of the influencing factor and the ecosystem-service density values, respectively; and and σ2 denote the variances of the influencing factor and the ecosystem-service density values, respectively.
The spatial pattern of ecosystem services is driven by multiple factors. This study selected 10 factors from the natural environmental and socioeconomic dimensions. Natural environmental factors include topographic factors, namely elevation (X1), slope (X2), and aspect (X3), which were used to quantify the influence of terrain on the spatial distribution of ecosystem services [47]. Climatic factors include mean annual precipitation (X4), mean annual temperature (X5), and evapotranspiration (X6), which play important roles in shaping regional ecosystem-service patterns [47]. NDVI (X7) was used as an ecological factor to reflect changes in ecosystem conditions and thus serves as an important indicator of ecosystem evolution [48]. Socioeconomic factors include population density (X8) and GDP (X9), which were used to characterize the effects of human activities on ecosystem-service evolution [48].
Before running the Geographical Detector, continuous explanatory variables need to be discretized in R to meet the model requirement for categorical stratified variables. In this study, the optimal-parameter Geographical Detector was adopted, and candidate discretization schemes were tested by combining multiple classification methods with different numbers of intervals. Specifically, four discretization methods, namely equal interval, natural breaks, quantile, and geometric interval, were applied in combination with a range of class numbers, and the scheme with the highest explanatory power (q value) was selected as the optimal stratification result for each variable.
2.3.4. Multi-Scenario Land-Use Simulation
PLUS Model and Accuracy Validation
- (1)
- PLUS Model
The PLUS model is an advanced development of the FLUS model. Compared with the traditional cellular automata (CA) model, it can not only identify the driving mechanisms of land-use change in greater depth, but also achieve higher-precision simulation at the patch scale. The PLUS model integrates multi-objective optimization algorithms and mainly includes two core modules: the Land Expansion Analysis Strategy module, which is responsible for identifying and extracting historical land-expansion patterns, and the CA module based on random patch seeds, which uses a random-seed generation mechanism and a threshold-decreasing mechanism to achieve refined simulation of the spatiotemporal dynamics of land-use patterns [49].
In this study, a Markov chain was first constructed using 2000–2010 land-use data to quantify historical land type conversion patterns. Subsequently, with 2010 as the base year for simulation, the 2020 land-use pattern was modeled. The formula is as follows:
where and represent the probabilities of land-use states at the initial time and the target time, respectively. T is the transition matrix.By applying the Markov model to the land-use data of Gansu Province from 2000 to 2010, the transition-probability matrix among land-use types during this period can be obtained (Table 2).
Table 2.
Land-use transition-probability matrix for Gansu Province during 2000–2010 derived from the Markov model.
- (2)
- Selection of Driving Factors
Considering the natural geographic characteristics and socioeconomic development conditions of Gansu Province, this study constructed a driving-factor system encompassing both natural environmental conditions and human activities, including nine indicators: elevation [49], slope [49], mean annual temperature [50], water bodies [51], distance to railways [52], distance to expressways [52], distance to national roads [52], population density, and GDP [53] (Figure 3).
Figure 3.
Spatial distribution of physical environmental and socioeconomic driving factors of land-use change in Gansu Province. Notes: The selected driving factors include (a) elevation, (b) slope, (c) average temperature, (d) distance to water bodies, (e) distance to railways, (f) distance to expressways, (g) distance to national roads, (h) population density, and (i) GDP.
These variables all have clear ecological relevance and spatial response logic. Among them, elevation reflects land suitability and ecological potential, slope determines land usability and soil and water conservation conditions, mean annual temperature characterizes regional thermal conditions, and water bodies influence land accessibility and agricultural production potential. Transportation–location factors, including distance to railways, expressways, and national roads, jointly reflect regional accessibility and development radiation capacity. Population density reflects the intensity of human activities, while GDP, as a core indicator of regional economic development, captures the demand for construction land expansion and the driving role of human activities in land-use change. Previous studies have shown that integrating natural and human factors into a unified driving-factor system can significantly improve the accuracy and stability of land-use simulation. Therefore, the driving-factor selection in this study is supported by both theoretical and empirical evidence and provides a sound basis for simulating land use in Gansu Province in 2030.
This study simulates land-use change scenarios rather than climate change scenarios. Therefore, in the 2030 scenario simulations, climatic variables were treated as static background conditions, and no separate future climate scenarios, such as changes in precipitation, were specified. Differences among scenarios mainly arose from land-use transition rules and ecological constraint settings. When ecosystem services were assessed based on the scenario-specific land-use results, consistent inputs for precipitation, temperature, and evapotranspiration were used across all scenarios to highlight the effects of land-use change on ecosystem services.
Setting Domain Weight Parameters
Neighborhood weight directly affects the mutual conversion process among different land-use types. It is a constant ranging from 0 to 1. The larger the neighborhood weight, the stronger the conversion capacity of that land-use type and the easier it is for the land to be converted into or out of other categories; the smaller the value, the less likely the land-use type is to change and the more likely it is to remain unchanged. In this study, neighborhood weights were mainly determined by calculating the proportion of the expansion area of each land-use type relative to the total expansion area, according to the following formula [50]:
where is the neighborhood weight of the ith land-use type, and is the area change in the ith land-use type.
The calculated neighborhood weights for cropland, forest land, grassland, water area, construction land, unused land, and other construction land are 0.09, 0.22, 0.06, 0.05, 0.10, 0.06, and 0.40, respectively.
Scenario Design
(1) Natural development scenario: This scenario is intended to reveal the natural evolution trend of future land use in Gansu Province. Using the land-use data of Gansu Province from 2000 to 2010, this study constructed a Markov model and calculated the transition-probability matrix among land-use types (Table 3) to infer the future evolution of the land-use structure. The model output can be used to predict the changes in land-use area and spatial distribution in 2030, thereby reflecting the natural evolution characteristics of land use without policy intervention [51].
Table 3.
Land-use conversion rule matrix under the natural development scenario (ND) for land-use simulation in Gansu Province.
(2) Ecological protection scenario: On the basis of the natural development scenario, this scenario strengthens ecological constraints by restricting the conversion of natural ecological land to cropland and construction land and by prioritizing the protection of key ecological spaces such as forest land, grassland, and water area, so as to maintain the ecological security pattern and determine the reasonable demand distribution of each land-use type in 2030 [51] (Table 4).
Table 4.
Land-use conversion rule matrix under the ecological protection scenario (EP) used in the PLUS model simulation.
(3) Urban expansion scenario: This scenario is designed to simulate the possible evolution pathway of land use in Gansu Province under accelerated urbanization and a development-first orientation. The scenario setting is mainly based on the guidance on urbanization and the growth of construction land in the Gansu Provincial Territorial Spatial Plan (2020–2035) [53] and related regional development plans, emphasizing the orderly expansion of urban land and rural settlements to meet the needs of population agglomeration and economic growth (Table 5).
Table 5.
Land-use conversion rule matrix under the urban expansion scenario (UE) for simulating future land-use dynamics in Gansu Province.
Simulation Accuracy Assessment
The Kappa coefficient is an important indicator for measuring classification accuracy and consistency and is widely used for the accuracy validation of land-use simulation results [52]. Before applying the PLUS model to simulate land-use change under different scenarios, this study used the Kappa coefficient to validate simulation accuracy. Taking 2000 as the base year and 2010 as the ending year, land-use change in 2020 was simulated, and the simulated results were compared with the actual land-use data to evaluate the reliability of the model simulation.
In the formula, denotes the proportion of correct simulations; denotes the expected proportion of correct simulations under random conditions; denotes the proportion of correct simulations under ideal classification conditions. A Kappa value between 0.61 and 0.80 indicates that the model’s simulation results are favorable, with a good degree of consistency in the simulations.
OA (Overall Accuracy) is an indicator used to evaluate the overall correctness of classification results and represents the proportion of correctly classified pixels among all pixels. A higher OA value indicates better classification accuracy and simulation performance [53].
In the formula, is the number of classes; is the number of validation samples; and _a denotes the actual prediction accuracy.
FoM (Factor of Merit) is an indicator used to measure the consistency between the actual land-use pattern and the simulated land-use pattern. Compared with the Kappa coefficient, the FoM metric can avoid overestimating accuracy. Its values range from 0 to 1, and a larger value indicates better model performance [53]. The formula is as follows:
In the formula, is the number of errors in which change occurred in the actual data but not in the simulated data; is the number of correctly simulated changes in which change occurred in both the actual and simulated data; is the number of errors in which change occurred in both the actual and simulated data but was spatially inconsistent; and is the number of errors in which no change occurred in the actual data but change was simulated.
3. Results
3.1. Land-Use Changes from 2000 to 2020
From 2000 to 2020, the land-use structure of Gansu Province remained relatively stable overall, but the direction and intensity of change varied significantly among land-use types. (Figure 4) Grassland and unused land consistently dominated, accounting for 33.34% and 41.35% of the total land area, respectively, and together forming the basic framework of the regional land-use pattern. Cropland and forest land ranked next, with average proportions of 14.93% and 8.84%, respectively. Water area, urban land, and rural settlements occupied relatively small proportions, together accounting for less than 2% (Appendix A.4 Table A2 and Table A3).
Figure 4.
Spatiotemporal evolution of land-use patterns in Gansu Province from 2000 to 2020. Notes: (a–c) show the land-use distributions of Gansu Province in 2000, 2010, and 2020, respectively; and (d) shows the changes in land-use area during 2000–2010 and 2010–2020.
In terms of land-use conversion, cropland was the most active land-use type during the study period, and its conversion direction differed markedly between stages. From 2000 to 2010, cropland was mainly converted into grassland and unused land, with conversion areas of 3241.64 km2 and 1486.26 km2, respectively, indicating that the decrease in cropland in this stage was mainly affected by ecological restoration and marginal-land adjustment. From 2010 to 2020, the structure of cropland conversion changed. Although conversion to grassland and unused land continued, the area converted to urban land increased significantly to 432.97 km2, reflecting markedly intensified pressure from urban development on cropland.
Urban land expanded continuously during the study period, and the expansion rate accelerated over time. The area of urban land increased from 660.52 km2 in 2000 to 1131.13 km2 in 2010 and further to 2227.36 km2 in 2020, while its share of the total land area rose from 0.15% to 0.50%. In terms of conversion sources, urban expansion mainly came from cropland and grassland, indicating that urban growth was primarily concentrated in areas with favorable development conditions and that regional production and ecological spaces were simultaneously compressed.
In addition, water area increased overall during the study period, with more pronounced growth after 2010. Unused land, by contrast, decreased slowly but remained one of the largest land-use types in the study area in 2020, indicating that the overall level of land development and utilization in the region was still relatively low.
3.2. Spatiotemporal Patterns of Ecosystem Services from 2000 to 2020
From 2000 to 2020, ecosystem services in Gansu Province exhibited marked spatial differentiation, and different service types showed clear differences in spatial pattern and temporal change (Figure 5). To characterize spatial heterogeneity, the Jenks natural breaks method was used to classify the continuous values of each ecosystem service into five classes: low, medium–low, medium, medium–high, and high (Appendix A.4 Table A4).
Figure 5.
Spatial distribution patterns of major ecosystem services in Gansu Province from 2000 to 2020. Notes: CS denotes carbon storage, WY denotes water yield, HQ denotes habitat quality, and SDR denotes soil retention service. The figure shows the spatial distributions of ecosystem services in 2000, 2010, and 2020, and Mean denotes the average ecosystem-service value during the study period.
CS showed an overall spatial gradient of gradual increase from east to west. Low-value areas were mainly concentrated in the eastern urban agglomerations and surrounding areas, with an average proportion of 0.30%. Medium–low-value areas (average proportion: 41.74%) were mainly distributed around the eastern urban fringes and in parts of the Loess Plateau, radiating outward around urban centers. Medium-value areas (average proportion: 34.32%) and medium–high-value areas (average proportion: 14.81%) were mainly distributed in the central and southern parts of the province, whereas high-value areas (average proportion: 8.82%) were concentrated in the southwestern mountains. From 2000 to 2020, the proportions of low-value (+0.35%), medium-value (+0.36%), and high-value (+0.20%) areas increased, whereas those of medium–low-value (−0.52%) and medium–high-value (−0.37%) areas decreased, indicating an overall stable CS pattern accompanied by some structural adjustment among classes.
WY showed a spatial pattern of gradual enhancement from west to east and from north to south. Low-value areas were dominant (average proportion: 53.86%) and widely distributed in the northwestern and northern parts of the province. Medium–low-value areas (average proportion: 13.67%) were mainly located in the central transitional zone; medium-value areas (average proportion: 14.75%) were distributed in the southern and southeastern parts; medium–high-value areas (average proportion: 13.40%) were concentrated in the southeastern, southern, and some northwestern areas; and high-value areas (average proportion: 4.33%) were scattered in the northwestern and southern parts. From 2000 to 2020, the proportion of low-value areas decreased by 2.21%, while the proportions of medium–high-value and high-value areas increased by 0.20% and 1.64%, respectively; by contrast, the proportions of medium–low-value and medium-value areas decreased by 3.50% and 0.55%, respectively.
HQ generally showed a spatial pattern of lower values in the central and southeastern regions and higher values in the western and southern regions. Low-value areas were dominant (average proportion: 42.85%) and mainly distributed in the central and southeastern parts of the province. Medium–low-value areas (average proportion: 14.87%) were concentrated in the central region; medium-value areas (average proportion: 2.21%) were scattered in the south; medium–high-value areas (average proportion: 14.29%) formed belt-like distributions in the northwestern mountains and the southeastern region; and high-value areas (average proportion: 25.78%) were mainly concentrated in the western and southern mountainous areas. From 2000 to 2020, the proportion of high-value areas increased by 0.44% and that of medium-value areas increased by 0.04%, whereas the proportions of low-value (−0.05%), medium–low-value (−0.37%), and medium–high-value (−0.06%) areas all decreased, indicating an overall gradual improvement in HQ.
SDR showed a spatial pattern of gradual enhancement from northwest to southeast. Low-value areas were overwhelmingly dominant (average proportion: 84.81%) and mainly distributed in the northwestern and northern regions; medium–low-value areas (average proportion: 10.40%) were concentrated in the central region; medium-value areas (average proportion: 3.42%) were mainly distributed in the southern and southeastern regions; medium–high-value areas (average proportion: 1.15%) were concentrated in the northwestern high mountains and southeastern mountains; and high-value areas (average proportion: 0.22%) were scattered in the northwestern and southern parts. During 2000–2020, the proportions of low-value (+0.81%) and high-value (+0.01%) areas increased, whereas those of medium–low-value (−0.60%), medium-value (−0.19%), and medium–high-value (−0.03%) areas decreased, indicating that the overall improvement in SDR was limited and that the spatial structure remained dominated by low service levels.
3.3. Impact of Driving Factors on Spatiotemporal Variations in Ecosystem Services
From 2000 to 2020, the driving factors of ecosystem services in Gansu Province showed pronounced spatiotemporal heterogeneity (Figure 6). Among these, slope (X2) demonstrated strong explanatory power for carbon storage (q = 0.18–0.22), habitat quality (q = 0.32–0.40), and soil conservation (q = 0.38–0.45), indicating that topographical conditions exert a stable and significant regulatory influence on the spatial differentiation of ecosystem services over the long term. Annual precipitation (X4) emerged as the core driver of water production services, with q values of 0.31, 0.35, and 0.33 in 2000, 2010, and 2020, respectively, underscoring the direct and persistent influence of climatic conditions on regional water supply capacity. Furthermore, NDVI (X7) exhibited q values ranging from 0.12 to 0.18 in water production services, indicating that vegetation cover plays a supplementary role in water regulation, with this effect being more pronounced in areas with higher vegetation recovery levels.
Figure 6.
Explanatory power (q values) of natural and socioeconomic factors influencing ecosystem service spatial patterns in Gansu Province. Notes: The q values were derived using the geographic detector method to quantify the explanatory power of different driving factors on the spatial heterogeneity of ecosystem services. Natural environmental factors include elevation, slope, aspect, precipitation, temperature, evaporation, and NDVI, while socioeconomic factors include population density, nighttime light intensity, and GDP. Higher q values indicate stronger explanatory power of the corresponding factor for ecosystem service spatial variation.
The influence of socioeconomic factors on ecosystem services generally showed a gradually increasing trend. GDP (X8) exhibited relatively significant explanatory power for carbon storage in 2000 (q = 0.15) and 2020 (q = 0.19), while demonstrating strong disruptive effects on habitat quality in 2010 (q = 0.34) and 2020 (q = 0.32), reflecting the intensifying pressure exerted by economic growth and associated human activities on ecosystem structure and function. In contrast, altitude (X1) exhibited weaker explanatory power for soil retention (q ≤ 0.08), indicating that in high-altitude regions, soil retention processes are more influenced by other natural factors or their combined effects rather than being directly constrained by topographic height alone.
Ecosystem services in Gansu Province changed significantly from 2000 to 2020, and the driving factors showed clear dynamic evolutionary characteristics (Figure 7). The results indicate that slope (X2) was the key controlling factor, and its interactions with annual precipitation (X4), annual mean temperature (X5), NDVI (X7), and GDP (X8) generated significant nonlinear or bivariate enhancement effects on CS, HQ, and SDR. This highlights the pivotal role of topographic factors in the coupled interactions among multiple natural and socioeconomic elements. Annual precipitation (X4) and NDVI (X7) played dominant roles in SDR and WY, and their interaction showed the strongest explanatory power for WY, with q values ranging from 0.48 to 0.53.
Figure 7.
Interactions among driving factors of spatial differentiation in ecosystem services in Gansu Province. Notes: CS denotes carbon storage, WY denotes water yield, HQ denotes habitat quality, and SDR denotes soil retention service. Elev denotes elevation (X1), Slp denotes slope (X2), Asp denotes aspect (X3), AAP denotes annual average precipitation (X4), AAT denotes annual average temperature (X5), ET denotes evapotranspiration (X6), NDVI denotes normalized difference vegetation index (X7), and GDP denotes gross domestic product (X8).
From a temporal perspective, the interaction between slope (X2) and NDVI (X7) in 2000 exerted the most pronounced influence on carbon storage (q = 0.39), manifesting as a distinct nonlinear enhancement effect. Concurrently, the interaction between slope (X2) and GDP (X8) exhibited the highest explanatory power for habitat quality (q = 0.41), demonstrating a bidirectional enhancement characteristic. By 2010, the interaction between slope (X2) and NDVI (X7) (q = 0.38) remained a key determinant of carbon storage, while the combined explanatory power of slope (X2) and GDP (X8) for habitat quality further increased (q = 0.46). By 2020, the interaction between NDVI (X7) and GDP (X8) became the dominant influence on carbon stocks (q = 0.34), indicating a sustained strengthening of the synergistic regulatory effect of vegetation cover changes and economic development on regional carbon stocks. Moreover, the interaction between annual precipitation (X4) and NDVI (X7) exerted the greatest influence on water production services (q = 0.52), reflecting the decisive role of climatic conditions and vegetation cover in regional water resource regulation processes.
3.4. Land-Use Change Simulation and Evolution
3.4.1. Validation of Simulation Accuracy and Assessment of Model Applicability
The model validation results showed that the Kappa coefficient was 0.95, which was significantly higher than the consistency threshold of 0.7. The OA value was 0.9668, indicating a high level of agreement between the simulated results and the actual land-use pattern. This suggests that the model can accurately reflect the spatial distribution characteristics of land use in the study area. The FoM value was 0.4093, with A = 28,718, B = 41,148, C = 2656, and D = 28,000, further indicating that the model has a strong ability to identify pixels associated with land-use change and can effectively characterize the spatial evolution of land use in the study area. Therefore, the model provides reliable support for subsequent multi-scenario simulations (Figure 8).
Figure 8.
Current land use in 2020 (a) and simulated land use (b).
3.4.2. Characteristics of Land-Use Change Under Different Scenarios
Under the natural development scenario, unutilised land remains predominant, accounting for 40.50%, followed by grassland (33.60%) and cultivated land (14.46%). Forest land, water bodies, urban land, and rural settlements accounted for relatively low proportions of 8.91%, 0.98%, 0.71%, and 0.84% respectively (Appendix A.4 Table A5 and Figure 9). Compared with 2020, the overall land-use changes under the natural development scenario show a slight decrease in the proportion of unutilised land (−0.22%), while the proportions of cultivated land and urban land increased significantly, rising by 0.26% and 0.21%, respectively. Spatially, this change is primarily manifested in the outward expansion of construction land around existing urban agglomerations, with this expansion process mainly occupying portions of grassland and unutilised land.
Figure 9.
Projected land-use patterns in Gansu Province under different development scenarios in 2030. Notes: ND denotes the natural development scenario, EP denotes the ecological protection scenario, and UE denotes the urban expansion scenario. Panels (a–c) show the simulated spatial distributions of land-use patterns in Gansu Province in 2030 under the three scenarios. The red boxes indicate two representative areas selected for detailed local analysis, and the corresponding enlarged views (Region 1 and Region 2) show local land-use pattern variations under different scenarios. Panel (d) presents a statistical comparison of land-use areas (km2) for each land-use category across the three scenarios.
Under the ecological protection scenario, unutilised land remains the dominant land-use type at 40.23%, followed by grassland (34.06%) and cultivated land (14.25%). Forest land, water bodies, urban land, and rural settlements account for 8.95%, 1.02%, 0.66%, and 0.83%, respectively (Appendix A.4 Table A6 and Figure 9). Compared with 2020, both the proportions of unutilised land and cultivated land decreased in this scenario, by −0.49% and −0.47%, respectively, while grassland increased significantly by 0.60%. The proportion of forested land remained largely stable. These changes primarily manifest as the expansion of grassland and water bodies around existing water areas and onto portions of unutilised land, reflecting the optimization and adjustment of land-use structure under ecological conservation guidance.
Under the urban expansion scenario, unutilised land remains dominant at 40.48%, followed by grassland (33.58%) and cultivated land (14.59%). Forest land, water bodies, urban land, and rural settlements accounted for 8.91%, 0.88%, 0.73%, and 0.84%, respectively (Appendix A.4 Table A7 and Figure 9). Compared with 2020, the proportion of unutilised land decreased (−0.24%), while the proportions of cultivated land and urban land increased significantly, rising by 0.87% and 0.23%, respectively. The proportion of forested land showed no significant change. Spatial evolution characteristics indicate that urban land and rural settlement construction land exhibit a pronounced outward expansion trend, primarily encroaching upon cultivated land and some grassland in the peripheral areas of towns.
3.5. Characteristics of Ecosystem Service Variations Across Multiple Scenarios
Compared with ecosystem services in 2020, the overall ecosystem-service pattern in 2030 under different development scenarios showed only slight fluctuations (Figure 8 and Figure 10). Across the three future development scenarios, the spatial distribution pattern of CS remained generally consistent, showing a gradual increase from east to west. Low-value zones were mainly distributed in the eastern and northern regions; medium–low-value zones were widely distributed in the eastern and central regions; medium-value zones were concentrated in the western and southern regions; medium–high-value zones were mainly distributed in the northwestern and southwestern regions; and high-value zones were scattered in the southwestern region. In terms of class structure, the medium–low-value zone accounted for the highest proportion in all three scenarios, at 41.38%, 41.09%, and 41.32%, respectively. Compared with 2020, the proportions of low-value and high-value zones increased under all scenarios, while the medium–low-value zone showed a slight downward trend. The medium-value zone increased under the natural development and ecological protection scenarios but decreased under the urban expansion scenario. The medium–high-value zone decreased under the natural development and ecological protection scenarios but increased under the urban expansion scenario. Among these changes, the ecological protection scenario showed the most significant increase in the medium-value zone (+0.54%), while the medium–low-value zone showed the largest decrease (−0.42%).
Figure 10.
Spatial distribution of ecosystem services in Gansu Province under different development scenarios in 2030. Notes: ND denotes the natural development scenario, EP denotes the ecological protection scenario, UE denotes the urban expansion scenario, CS denotes carbon storage, WY denotes water yield, HQ denotes habitat quality, and SDR denotes soil retention service. The figure shows the spatial distribution patterns of ecosystem services in Gansu Province under the three 2030 land-use scenarios simulated by coupling the PLUS model with the InVEST ecosystem-service assessment framework.
The spatial distribution of WY under the three future development scenarios remained highly consistent with that in 2020, showing an overall pattern of increase from northwest to southeast. Low-value zones dominated under all scenarios, among which the urban expansion scenario had the highest proportion of low-value zones (56.85%), whereas the ecological protection scenario had the largest proportion of high-value zones (4.25%). Compared with 2020, the change trends among WY classes varied across scenarios. Overall, however, low-value and medium–low-value zones changed relatively little, while medium-value, medium–high-value, and high-value zones showed only slight fluctuations.
The spatial pattern of HQ under the three future development scenarios was generally consistent with that in 2020 and showed a dual-dominant distribution characterized by the coexistence of low-value and high-value zones. Under the different scenarios, low-value zones (42.79–43.08%) and high-value zones (25.95–26.36%) consistently accounted for relatively large proportions. Among them, the ecological protection scenario showed the highest proportion of high-value areas (26.36%); the natural development scenario showed the largest proportion of low-value areas (43.08%); and the urban expansion scenario showed a relatively higher proportion of medium–low-value areas (14.61%). Compared with 2020, medium-value and medium–high-value areas showed an overall slight downward trend under all scenarios, whereas medium–low-value areas decreased slightly under both the natural development and ecological protection scenarios, and high-value areas generally increased.
The spatial distribution of SDR under the three future development scenarios remained highly consistent with that in 2020 and was still characterized by the absolute dominance of low-value zones. Among the different scenarios, the natural development scenario had the highest proportion of low-value zones (84.92%), the ecological protection scenario had the highest proportion of medium–high-value zones (1.19%), and the urban expansion scenario had the lowest proportion of high-value zones (0.22%). Compared with 2020, all scenarios showed slight decreases in medium-value, medium–high-value, and high-value zones, whereas low-value and medium–low-value zones showed slight increases.
4. Discussion
4.1. Land-Use Change and the Spatial Pattern of Ecosystem Services
From 2000 to 2020, land-use change in Gansu Province was characterized by localized restructuring on the basis of overall stability, reflecting the spatial adjustment process jointly driven by natural constraints in arid and semi-arid regions, urban development demand, and ecological protection policies. Grassland and unused land remained dominant over the long term, indicating that regional land use is still mainly composed of ecological space and low-intensity development space. Cropland was converted more frequently into grassland and unused land in the early period, whereas in the later period conversion to urban land became more pronounced, suggesting that land-use transition has gradually shifted from ecological-restoration-driven change to urban-expansion-driven change, especially in areas with relatively favorable development conditions, such as Lanzhou and the Hexi Corridor. Similar patterns of land-use restructuring and associated ecological effects have also been reported in the arid regions of northwestern China and in the Hexi Corridor [53].
These changes further shaped the spatial differentiation of ecosystem services. CS and HQ were relatively high in the western, southern, and mountainous regions and relatively low in the central and eastern regions, where development activities are more intensive, indicating that ecosystem-service levels are controlled not only by natural background conditions but also by land-use intensity and the integrity of ecological space. WY gradually increased from northwest to southeast, reflecting the effect of hydrothermal gradients on regional ecosystem-service patterns. By contrast, SDR remained generally low across the province, suggesting that the improvement in ecosystem stability is still strongly constrained by the inherent environmental background [54].
Overall, the evolution of ecosystem-service patterns in Gansu Province reflects the combined effects of natural conditions, socioeconomic development, and ecological governance. Future territorial spatial optimization should pay greater attention to coordinating production, living, and ecological spaces under resource and environmental constraints, so as to maintain regional ecological security and the stability of ecosystem-service provision.
4.2. Driving Mechanisms of Spatial Differentiation in Ecosystem Services
From 2000 to 2020, ecosystem services in Gansu Province exhibited pronounced spatial differentiation, and this pattern was mainly shaped by the combined effects of regional natural geographic conditions, land-use configuration, and the intensity of human activities. Gansu spans the Loess Plateau, the northeastern margin of the Qinghai–Tibet Plateau, and the Hexi Corridor, and is characterized by large topographic variation and clear hydrothermal gradients from southeast to northwest, which determine the strong regional differentiation of ecosystem services. Related studies in Gansu Province and neighboring arid inland basins have similarly shown that topography, precipitation, and land-use patterns jointly determine ecosystem-service distribution, with more pronounced effects in ecologically fragile regions [55].
The overall east-to-west increase in CS indicates that it is affected not only by vegetation distribution but also by land-use intensity. The eastern and central regions are characterized by concentrated urban development and earlier cropland exploitation, resulting in a high degree of ecological space fragmentation and therefore relatively low CS. By contrast, the western and southwestern mountainous regions have more concentrated ecological land, such as grassland and forest land, and are subject to relatively weak human disturbance, making it easier to maintain higher CS. Existing studies have likewise shown that, in arid regions and at the scale of Gansu Province, land-use change has a sustained influence on the spatial distribution of CS, and that the reduction in ecological land, grassland degradation, and the expansion of built-up land generally result in the decline or spatial restructuring of carbon storage [56].
The southeastward increase in WY reflects the fundamental control exerted by the precipitation pattern. The Hexi Corridor and the northern arid region are characterized by scarce precipitation and strong evaporation, so WY has remained low over the long term there, whereas the southern and southeastern mountainous areas have more favorable precipitation conditions and therefore form high-value zones. HQ is lower in the central and southeastern regions and higher in the western and southern regions, mainly owing to differences in development intensity and ecological patch integrity. The central region, where transportation corridors and urban nodes are densely distributed, undergoes more frequent land-use transitions and has lower habitat continuity, whereas the western and southern mountainous areas retain relatively intact ecological structures and thus support higher HQ [57]. SDR remains generally low across the province and gradually increases from northwest to southeast, indicating that ecosystem stability is still constrained by the arid climatic background and the inherently fragile ecological foundation.
Overall, the spatial pattern of ecosystem services in Gansu Province reflects an integrated process in which natural conditions establish the baseline, land-use patterns intensify spatial differentiation, and human activities drive local adjustments [56].
4.3. Policy Implications
The results of this study show that land-use change has a significant impact on ecosystem-service provision, especially in ecologically fragile arid and semi-arid regions. Existing studies have pointed out that adjustments in land-use structure can substantially affect regional ecosystem services by changing vegetation cover and ecological processes [58]. Therefore, regional development planning should emphasize the protection of ecological space and the optimization of land-use structure in order to maintain the stability and sustainability of ecosystem-service provision.
First, the protection of key ecological areas such as grassland, forest land, and water bodies should be strengthened. Related studies have shown that natural ecosystems such as forests and grasslands play important roles in CS, HQ, and soil and water conservation [14,47]. Therefore, in territorial spatial planning, ecological protection redlines and ecological restoration projects should be used to effectively protect and restore important ecological spaces, so as to enhance regional ecosystem resilience and service capacity [59,60].
Second, the expansion of urban construction land should be appropriately controlled. With regional economic development and population growth, urban expansion may squeeze cropland and ecological land, thereby affecting the supply capacity of ecosystem services. Future land-use planning should optimize urban spatial structure and improve land-use efficiency so as to reduce the occupation of ecological space and achieve coordination between economic development and ecological protection [59,61].
In addition, dynamic monitoring of the spatial patterns of ecosystem services should be strengthened, and ecosystem-service assessment results should be incorporated into territorial spatial planning and ecological-management decision-making. By integrating ecosystem-service evaluation with land-use planning, a more scientific basis can be provided for the construction of regional ecological security patterns and the formulation of ecological protection policies [59,62].
Overall, achieving sustainable development in arid and semi-arid regions requires a balance between economic growth and ecological protection. Optimizing land-use structure, strengthening ecological protection, and advancing ecological restoration are key strategies for enhancing the sustained provision of ecosystem services.
4.4. Uncertainties and Methodological Limitations
Although this study provides a systematic analysis of the spatiotemporal dynamics of ecosystem services through the integration of multiple models and approaches, certain uncertainties remain. First, the InVEST model, PLUS model, and Geographical Detector method employed in this study are widely recognized and extensively applied in ecosystem service and land-use change research. However, the integration of multiple models may introduce compounded uncertainties due to differences in input data, parameterization, and underlying algorithmic structures.
Second, ecosystem service assessments are inherently sensitive to the quality of input data and the specification of model parameters. For example, key parameters in the InVEST model, including carbon density, evapotranspiration coefficients, and soil erosion factors, may significantly influence simulation outcomes. Likewise, the performance of the PLUS model in land-use scenario simulations may be affected by the selection of driving factors and the assumptions underlying different scenarios.
Despite these limitations, the models and datasets adopted in this study have been extensively validated in regional-scale applications and have demonstrated strong capability in representing the spatial patterns of land-use change and ecosystem services. Consequently, the results are considered robust in capturing the overall trends and principal driving mechanisms of ecosystem service dynamics in Gansu Province at the regional scale. Future studies should incorporate higher-resolution datasets and long-term ecological monitoring data to further refine model parameterization and validation, thereby enhancing the reliability and precision of the findings.
5. Conclusions
Drawing on land-use changes in Gansu Province from 2000 to 2020 and multi-scenario projections for 2030, this study systematically elucidates the spatiotemporal effects of land-use dynamics on key ecosystem services, including CS, WY, HQ, and SDR. The findings demonstrate that land-use structure serves as the principal driver of spatial differentiation in ecosystem services, with natural geographic factors providing dominant baseline control, while socioeconomic development and policy interventions exert substantial modulatory effects. This reflects a dynamic progression from natural-dominated regulation toward an integrated natural–socioeconomic governance framework.
Under alternative development scenarios, the ecological protection scenario—by strictly limiting the conversion of ecological land and safeguarding forests, grasslands, and water bodies—significantly enhanced overall ecosystem service provision, particularly increasing the share of median carbon storage and high-value water yield areas. The natural development scenario maintained ecosystem service functions at relatively stable levels, whereas the urban expansion scenario imposed considerable pressure on critical services, underscoring the decisive role of land-use trajectories in shaping ecosystem service patterns.
Based on these insights, it is recommended that the integrity and connectivity of key ecological functional zones be prioritized, that ecological protection and spatial governance be reinforced, and that the provision of ecosystem services be coordinated with regional development demands. The “historical evolution–driving mechanism–scenario simulation” framework established in this study offers a quantifiable and operational approach, not only applicable to Gansu Province but also providing a transferable reference for ecosystem service management and territorial spatial planning in other arid and semi-arid regions, as well as ecologically sensitive areas.
Author Contributions
Z.D. contributed to methodology, software development, validation, formal analysis, investigation, data curation, and original draft writing. C.L. was responsible for conceptualization and reviewing and editing the manuscript. X.W. provided resources and visualization support. X.T. oversaw conceptualization, funding acquisition, supervision, and project administration. S.S. Writing—review & editing, Supervision. All authors have read and agreed to the published version of the manuscript.
Funding
This research received no external funding.
Data Availability Statement
The datasets used and analyzed during this study are primarily from public repositories or have been cited in the main text. Specifically: CNLUCC data, DEM data, Slope data, aspect data, annual mean temperature data, annual mean precipitation data, evaporation data, NDVI data, GDP data, and population density data were obtained from the Resource and Environment Science and Data Center (https://www.resdc.cn/). Mean annual precipitation data and evaporation data were accessed from the National Tibetan Plateau Data Center (TPDC) (https://data.tpdc.ac.cn/). Soil Data Source were accessed dataset of Soil Conservation Capacity Preventing Water Erosion in China (1992–2019) (https://www.scidb.cn). Water area data, railway data, highway data and high-speed railway data were accessed via OpenStreetMap (OSM) (www.navmaps.eu/).
Conflicts of Interest
The authors declare no conflicts of interest.
Appendix A
Appendix A.1. The Calculation Formula of Carbon Storage
In the formula: , , , , and , respectively, represent total carbon(t), aboveground biomass(), root biomass(), carbon in dead organic matter(), and soil organic carbon storage().
The accuracy of CS results mainly depends on the reasonableness of carbon-density parameter selection. Existing studies have demonstrated that climate and temperature are the principal factors affecting carbon-density values. Therefore, based on the previous literature, this study collected mean annual temperature and mean annual precipitation data and used a modified carbon-density formula to adjust the carbon density of each land-use type.
where denotes soil carbon density (t·hm−2) obtained by adjusting for annual mean precipitation; and denote biomass carbon density (t·hm−2) adjusted for annual mean precipitation and annual mean temperature respectively; represents annual mean precipitation in millimeters; denotes the mean annual temperature in degrees Celsius; and represent the biomass carbon density correction coefficients for mean annual precipitation and mean annual temperature respectively and denote the results for GanSu Province and the national average respectively; and denote the correction coefficients for biomass carbon density and soil carbon density respectively.
Appendix A.2. The Calculation Formula of Water Yield
Appendix A.3. The Calculation Formula of Habitat Quality
Appendix A.4. The Calculation Formula of Soil Retention Service
RUSLE = R × K × S × L × P × C
RKLS = R × K × L × S
SD = RKLS − USLE
Table A1.
Types of interaction detection.
Table A2.
Land-use transfer matrix of Gansu Province during 2000–2010 derived from land-use change analysis (km2).
Table A3.
Land-use transfer matrix of Gansu Province during 2010–2020 derived from land-use change analysis (km2).
Table A4.
Classification of continuous values of ecosystem services.
Table A5.
Land-use transfer matrix of Gansu Province under the natural development scenario during 2020–2035 (km2).
Table A6.
Land-use transfer matrix of Gansu Province under the ecological protection scenario during 2020–2035 (km2).
Table A7.
Land-use transfer matrix of Gansu Province under the urban expansion scenario during 2020–2035 (km2).
References
- Mo, H.; Xiao, Z. A systematic review and synthesis of trade offs and synergies among watershed ecosystem services. Discov. Environ. 2026, 4, 27. [Google Scholar] [CrossRef] [Scilit]
- Study of Critical Environmental Problems. Man’s Impact on the Global Environment: Assessment and Recommendations for Action; MIT Press: Cambridge, MA, USA, 1970.
- Jorge, J.S.; Caliman, A. Brazil’s environmental rollback threatens global ecosystem services. Ecosyst. Serv. 2026, 77. [Google Scholar] [CrossRef] [Scilit]
- Wang, S.; Wang, S.; Smith, P. Quantifying impacts of onshore wind farms on ecosystem services at local and global scales. Renew. Sustain. Energy Rev. 2015, 52, 1424–1428. [Google Scholar] [CrossRef] [Scilit]
- Xiao, Q.; Hu, D.; Xiao, Y. Assessing changes in soil conservation ecosystem services and causal factors in the Three Gorges Reservoir region of China. J. Clean. Prod. 2017, 163, S172–S180. [Google Scholar] [CrossRef] [Scilit]
- Sun, G.; Li, W.; Zhang, B. Valuing the Main Forest Ecosystem Services for China’s Beibu Gulf Economic Zone: How to Make a Good Measurement of Biodiversity Maintenance? In Proceedings of the 2011 Asia-Pacific Power and Energy Engineering Conference, Wuhan, China, 25–28 March 2011; pp. 1–4. [Google Scholar] [CrossRef] [Scilit]
- Kanter, R.; Fort, M.P. Shared burdens, shared responsibilities: Advancing the 2030 Agenda for Sustainable Development. Lancet 2025, 406, 1703–1705. [Google Scholar] [CrossRef] [Scilit] [PubMed]
- Tharik, M.; Arumugam, K.; Vijayaraghavalu, S.S. Assessing natural and human-induced drivers of groundwater quality and health risks in coastal deltas: Advancing SDG 3, SDG 6, SDG 13, and SDG 15. Appl. Water Sci. 2025, 15, 313. [Google Scholar] [CrossRef] [Scilit]
- Chen, P.; Chu, Z.; Han, H. Responding to SDG13: Exploring the role of renewable energy in physical climate risk governance. Energy 2025, 338, 138983. [Google Scholar] [CrossRef] [Scilit]
- Fu, S.; Lei, J.; You, Y.; Zhou, N. Assessment of land degradation in the conventional lake Chad basin between 2001 and 2020 based on SDG 15.3. 1. Environ. Sustain. Indic. 2025, 28, 101002. [Google Scholar] [CrossRef] [Scilit]
- Cheng, Y.; Zhang, X.; Song, W. Ecological risk assessment of land use change in the Tarim River Basin, Xinjiang, China. Land 2024, 13, 561. [Google Scholar] [CrossRef] [Scilit]
- Zhao, Y.; Zhang, X.; Bai, Y.; Mi, F. Does land use change affect green space water use? An analysis of the Haihe River Basin. Forests 2019, 10, 545. [Google Scholar] [CrossRef] [Scilit]
- Liu, Y.; Huang, X.; Liu, Y. Detection of long-term land use and ecosystem services dynamics in the Loess Hilly-Gully region based on artificial intelligence and multiple models. J. Clean. Prod. 2024, 447, 141560. [Google Scholar] [CrossRef] [Scilit]
- Sheng, S.; Huang, J. Spatiotemporal dynamics and driving mechanisms of ecosystem services in the Beijing–Tianjin–Hebei urban agglomeration: Implications for sustainable land use planning. Land 2025, 14, 969. [Google Scholar] [CrossRef] [Scilit]
- Sokół, M.; Łaska, G. Biodiversity and ecosystem services: Complementary approach for catchment protection and land use in northeastern Poland. Ecol. Indic. 2024, 159, 111649. [Google Scholar] [CrossRef] [Scilit]
- Lungarska, A.; Chakir, R. Projections of climate change impacts on ecosystem services and the role of land use adaptation in France. Environ. Sustain. Indic. 2024, 22, 100369. [Google Scholar] [CrossRef] [Scilit]
- Xu, D.; Wu, F.; He, L.; Liu, H.; Jiang, Y. Impact of land use change on ecosystem services: Case study of the Zhangjiakou-Chengde area. Acta Ecol. Sin. 2019, 39, 7493–7501. [Google Scholar] [CrossRef] [Scilit]
- Winkler, K.J.; Viers, J.H.; Nicholas, K.A. Assessing ecosystem services and multifunctionality for vineyard systems. Front. Environ. Sci. 2017, 5, 15. [Google Scholar] [CrossRef] [Scilit]
- Menconi, M.; Palazzoni, L.; Grohmann, D. Core themes for an urban green systems thinker: A review of complexity management in provisioning cultural ecosystem services. Urban For. Urban Green. 2021, 65, 127355. [Google Scholar] [CrossRef] [Scilit]
- Pan, N.; Guan, Q.; Wang, Q.; Sun, Y.; Li, H.; Ma, Y. Spatial differentiation and driving mechanisms in ecosystem service value of arid region: A case study in the middle and lower reaches of Shule River Basin, NW China. J. Clean. Prod. 2021, 319, 128718. [Google Scholar] [CrossRef] [Scilit]
- Du, Z.; Ou, C.; An, Y.; Chen, J.; Meng, Y.; Chen, F. Analysis of Annual Spatiotemporal Variations in Carbon Stock in the Urban Agglomeration of the Middle Yangtze River Basin, China. Land 2024, 13, 2089. [Google Scholar] [CrossRef] [Scilit]
- Ma, J.; Jin, X.; Yin, X.; Liu, P.; Nie, Z. A new InVEST–genetic algorithm coupled water yield model: Application to water conservation function assessment in the Zhangjiakou-Chengde area. Ecol. Indic. 2025, 179, 114237. [Google Scholar] [CrossRef] [Scilit]
- Li, T.; Wang, X.; Jia, H. Evaluate water yield and soil conservation and their environmental gradient effects in fujian province in south China based on InVEST and geodetector models. Water 2025, 17, 230. [Google Scholar] [CrossRef] [Scilit]
- Li, X.; Liu, Z.; Li, S.; Li, Y. Multi-scenario simulation analysis of land use impacts on habitat quality in Tianjin based on the PLUS model coupled with the InVEST model. Sustainability 2022, 14, 6923. [Google Scholar] [CrossRef] [Scilit]
- Bagstad, K.J.; Semmens, D.J.; Winthrop, R.; Jaworksi, D.; Larson, J. Ecosystem Services Valuation to Support Decisionmaking on Public Lands—A Case Study of the San Pedro River Watershed, Arizona; US Geological Survey: Reston, VA, USA, 2012. [Google Scholar] [CrossRef] [Scilit]
- Sherrouse, B.C.; Clement, J.M.; Semmens, D.J. A GIS application for assessing, mapping, and quantifying the social values of ecosystem services. Appl. Geogr. 2011, 31, 748–760. [Google Scholar] [CrossRef] [Scilit]
- Sheng, S.; Lian, H. The spatial pattern evolution of rural settlements and multi-scenario simulations since the initiation of the reform and opening up policy in China. Land 2023, 12, 1763. [Google Scholar] [CrossRef] [Scilit]
- Shaoying, L.; Xiaoping, L.; Xia, L.; Yimin, C. Simulation model of land use dynamics and application: Progress and prospects. Natl. Remote Sens. Bull. 2021, 21, 329–340. [Google Scholar] [CrossRef] [Scilit]
- Hu, S.; Chen, L.; Li, L.; Zhang, T.; Yuan, L.; Cheng, L.; Wang, J.; Wen, M. Simulation of land use change and ecosystem service value dynamics under ecological constraints in Anhui Province, China. Int. J. Environ. Res. Public Health 2020, 17, 4228. [Google Scholar] [CrossRef] [Scilit] [PubMed]
- Zhu, K.; Li, S.; Huang, W.; Hou, P.; Liu, Y.; Liu, J.; Li, Z. Integrating the PLUS-InVEST Model to Project Water Conservation Dynamics and Decipher Climatic Drivers in the Chengdu–Chongqing Economic Zone Under Multiple Future Scenarios. Hydrology 2025, 12, 184. [Google Scholar] [CrossRef] [Scilit]
- Lei, J.; Liu, X.; Wang, L.; Li, X.; Ma, J.; Zhang, L.; Yang, H. Study on the relationship between intensive land use and ecosystem service value in Gansu Province. Ecol. Model. 2026, 511, 111379. [Google Scholar] [CrossRef] [Scilit]
- Bai, Y.; Han, C.; Tang, F.; Li, Z.; Tian, H.; Huang, Z.; Ma, L.; Hu, X.; Wang, J.; Chen, B. Potential Impacts of Land Use Change on Ecosystem Service Supply and Demand Under Different Scenarios in the Gansu Section of the Yellow River Basin, China. Remote Sens. 2025, 17, 489. [Google Scholar] [CrossRef] [Scilit]
- Li, X.; Yang, K.; Zhou, Y. Progress in the study of oasis-desert interactions. Agric. For. Meteorol. 2016, 230, 1–7. [Google Scholar] [CrossRef] [Scilit]
- Zhang, M.; Zhou, Y.; Li, X.; Sun, Z.; Yang, G.; Xie, Z. Quantifying the Contributions of Regional Human Activities and Global Climate Change to the Regional Climate in a Typical Mountain-Oasis-Desert System of Arid Central Asia from 1979 to 2018. J. Geophys. Res. Atmos. 2023, 128, e2022JD037110. [Google Scholar] [CrossRef] [Scilit]
- Xu, X.L.; Liu, J.Y.; Zhang, S.W.; Li, R.D.; Yan, C.Z.; Wu, S.X. China Multi-Temporal Land Use Remote Sensing Monitoring Data Set (CNLUCC); Resource and Environment Science Data Registration and Publication System: Beijing, China, 2018; Available online: https://www.resdc.cn/ (accessed on 10 June 2025).
- Dataset of Soil Conservation Capacity Preventing Water Erosion in China (1992–2019). Available online: https://www.scidb.cn/ (accessed on 10 June 2025).
- Resource and Environment Science Data Center. Provincial Digital Elevation Model (DEM) 30 m Data (SRTM 30 m); Resource and Environment Science Data Center: Beijing, China, 2005; Available online: https://www.resdc.cn/ (accessed on 10 June 2025).
- Peng, S.; Ding, Y.; Liu, W.; Li, Z. 1 km monthly temperature and precipitation dataset for China from 1901 to 2017. Earth Syst. Sci. Data 2019, 11, 1931–1946. [Google Scholar] [CrossRef] [Scilit]
- Peng, S. 1 km Monthly Potential Evapotranspiration Dataset for China (1901–2023); National Tibetan Plateau/Third Pole Environment Data Center: Beijing, China, 2022; Available online: https://data.tpdc.ac.cn/ (accessed on 10 June 2025).
- OpenStreetMap Contributors. Available online: https://www.openstreetmap.org/ (accessed on 10 June 2025).
- Yang, Y.; Fang, M.; Li, J.; Jiao, Y.; Zhang, L.; Shi, L. Study on the Spatial Evolution and Evolutionary Models of Rural Settlements in 25 Counties (Cities, Districts) along the Yellow River in Shandong Province. J. Life Sci. Agric 2024, 1, 11–16. [Google Scholar] [CrossRef] [Scilit]
- Cheng, M.-Y.; Ji, G.-X.; Huang, J.-C.; Geng, J.-X.; Li, L.; Lu, J. Multi-scenario land cover simulation and carbon stock assessment in Shaanxi province based on the PLUS-InVEST model. Huanjing Kexue 2025, 46, 5729–5740. [Google Scholar] [CrossRef] [Scilit]
- Guan, R.-J.; Chen, Y.-L.; Huang, X.-B.; Lian, W.-H.; Liu, X.-G. Multi-scenario Simulation of Land Use and Response of Ecosystem Services in Southern Jiangxi Province Based on PLUS-InVEST Model. Huanjing Kexue 2025, 46, 7270–7285. [Google Scholar] [CrossRef] [Scilit]
- Gao, Y.; Ma, L.; Liu, J.; Zhuang, Z.; Huang, Q.; Li, M. Constructing ecological networks based on habitat quality assessment: A case study of Changzhou, China. Sci. Rep. 2017, 7, 46073. [Google Scholar] [CrossRef] [Scilit] [PubMed]
- Abdelwahab, O.M.; Ricci, G.F.; Netti, A.M.; De Girolamo, A.M.; Gentile, F. Modeling the Effect of Nature-Based Solutions in Reducing Soil Erosion with InVEST® SDR: The Carapelle Case Study. Water 2025, 17, 3451. [Google Scholar] [CrossRef] [Scilit]
- Yang, L.; Liu, Y.; Liu, Y.; Liu, R. Spatial-temporal dynamics and drivers of ecosystem service interactions along the Yellow River area in Shaanxi Province. J. Clean. Prod. 2025, 496, 145095. [Google Scholar] [CrossRef] [Scilit]
- Liu, R.; Li, L.; Guo, L.; Jiao, L.; Wang, Y.; Cao, L.; Wang, Y. Multi-scenario simulation of ecological risk assessment based on ecosystem service values in the Beijing-Tianjin-Hebei region. Environ. Monit. Assess. 2022, 194, 434. [Google Scholar] [CrossRef] [Scilit]
- Shen, J.; Li, S.; Liu, L.; Liang, Z.; Wang, Y.; Wang, H.; Wu, S. Uncovering the relationships between ecosystem services and social-ecological drivers at different spatial scales in the Beijing-Tianjin-Hebei region. J. Clean. Prod. 2021, 290, 125193. [Google Scholar] [CrossRef] [Scilit]
- Li, H.; Song, W. Evolution of rural settlements in the Tongzhou District of Beijing under the new-type urbanization policies. Habitat Int. 2020, 101, 102198. [Google Scholar] [CrossRef] [Scilit]
- Zhang, S.; Yang, P.; Xia, J.; Wang, W.; Cai, W.; Chen, N.; Hu, S.; Luo, X.; Li, J.; Zhan, C. Land use/land cover prediction and analysis of the middle reaches of the Yangtze River under different scenarios. Sci. Total Environ. 2022, 833, 155238. [Google Scholar] [CrossRef] [Scilit]
- Chen, J.; Fu, H.; Chen, S. Multi-scenario simulation and assessment of ecosystem service value at the city level from the perspective of “production–living–ecological” spaces: A Case Study of Haikou, China. Land 2023, 12, 1021. [Google Scholar] [CrossRef] [Scilit]
- Duan, Z.; Lu, C.; Wang, X.; Tang, X.; Sheng, S. Spatiotemporal Evolution and Multi-Scenario Simulation of Rural Settlements in Liangzhou District: Evidence from an Oasis Region in the Arid Northwest. Land 2025, 14, 2397. [Google Scholar] [CrossRef] [Scilit]
- Zheng, Z.; Wang, J.; Ni, J.; Cui, Y.; Zhu, Q. Lacustrine Wetlands Landscape Simulation and Multi-Scenario Prediction Based on the Patch-Generating Land-Use Simulation Model: A Case Study on Shengjin Lake Reserve, China. Remote Sens. 2024, 16, 4169. [Google Scholar] [CrossRef] [Scilit]
- Gansu Province Territorial Space Planning (2021–2035). Available online: https://www.gsei.com.cn/ (accessed on 20 June 2025).
- Zhao, J.; Shao, Z.; Xia, C.; Fang, K.; Chen, R.; Zhou, J. Ecosystem services assessment based on land use simulation: A case study in the Heihe River Basin, China. Ecol. Indic. 2022, 143, 109402. [Google Scholar] [CrossRef] [Scilit]
- Zhu, G.; Qiu, D.; Zhang, Z.; Sang, L.; Liu, Y.; Wang, L.; Zhao, K.; Ma, H.; Xu, Y.; Wan, Q. Land-use changes lead to a decrease in carbon storage in arid region, China. Ecol. Indic. 2021, 127, 107770. [Google Scholar] [CrossRef] [Scilit]
- Li, Y.; Liu, W.; Feng, Q.; Zhu, M.; Yang, L.; Zhang, J.; Yin, X. The role of land use change in affecting ecosystem services and the ecological security pattern of the Hexi Regions, Northwest China. Sci. Total Environ. 2023, 855, 158940. [Google Scholar] [CrossRef] [Scilit] [PubMed]
- Yu, H.-X.; Tang, J.-L.; Chen, R.-Q. Spatiotemporal evolution characteristics and multi-scale spatial balance and matching analysis of ecosystem service supply and demand in Hubei Province. Huanjing Kexue 2024, 45, 6477–6488. [Google Scholar] [CrossRef] [Scilit] [PubMed]
- Gansu Province Territorial Space Ecological Restoration Plan (2021–2035). Available online: https://zrzy.gansu.gov.cn/ (accessed on 20 June 2025).
- Action Plan for Gansu Province to Fortify the National Ecological Security Barrier in the West. Available online: https://lslhzhb.lanzhou.gov.cn/ (accessed on 20 June 2025).
- Yellow River Basin Territorial Space Planning (2021–2035). Available online: https://www.gov.cn/ (accessed on 20 June 2025).
- Song, W.; Li, H. Spatial pattern evolution of rural settlements from 1961 to 2030 in Tongzhou District, China. Land Use Policy 2020, 99, 105044. [Google Scholar] [CrossRef] [Scilit]
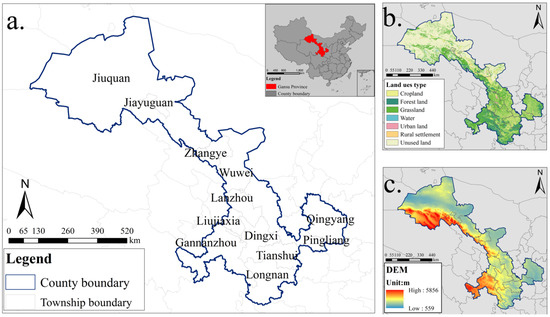
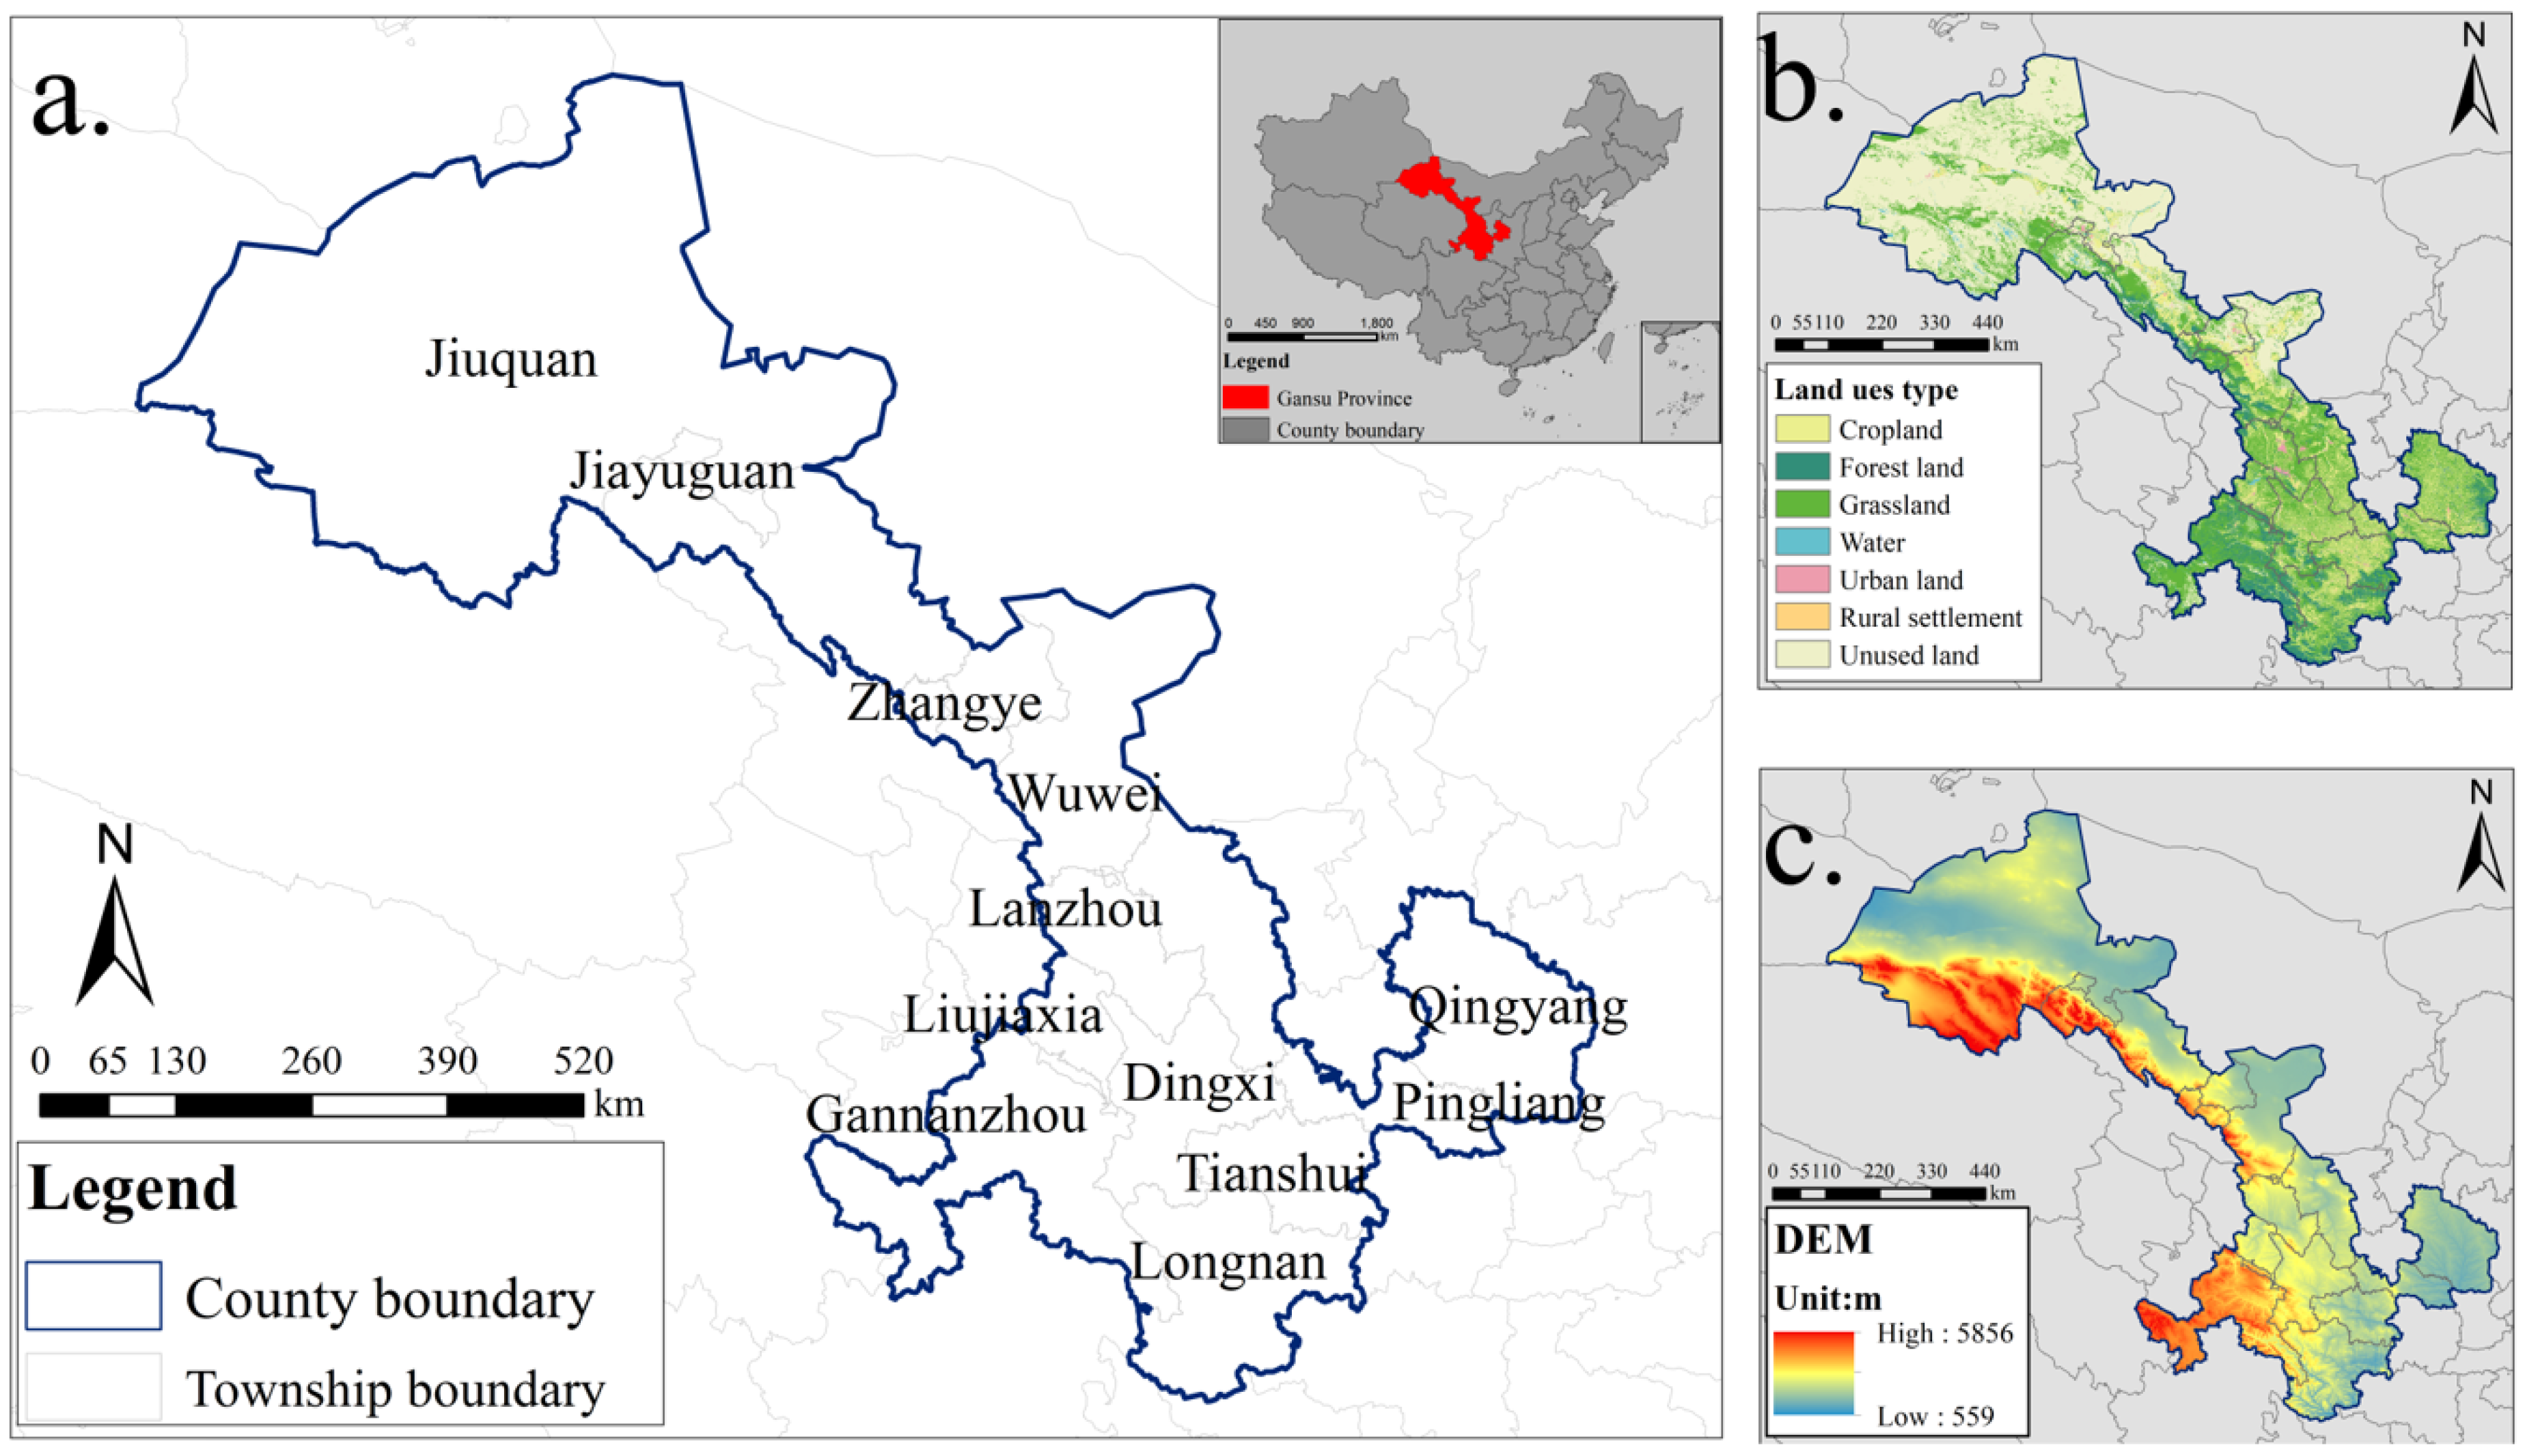
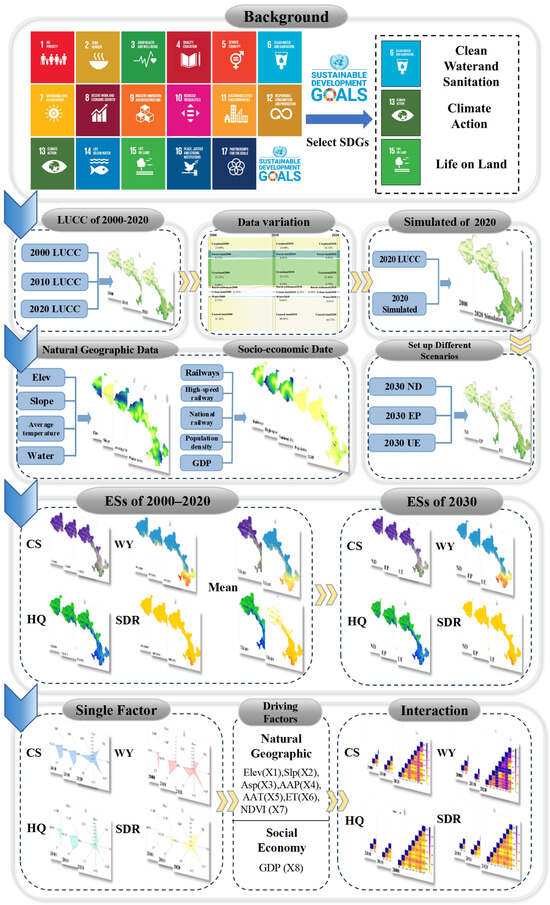
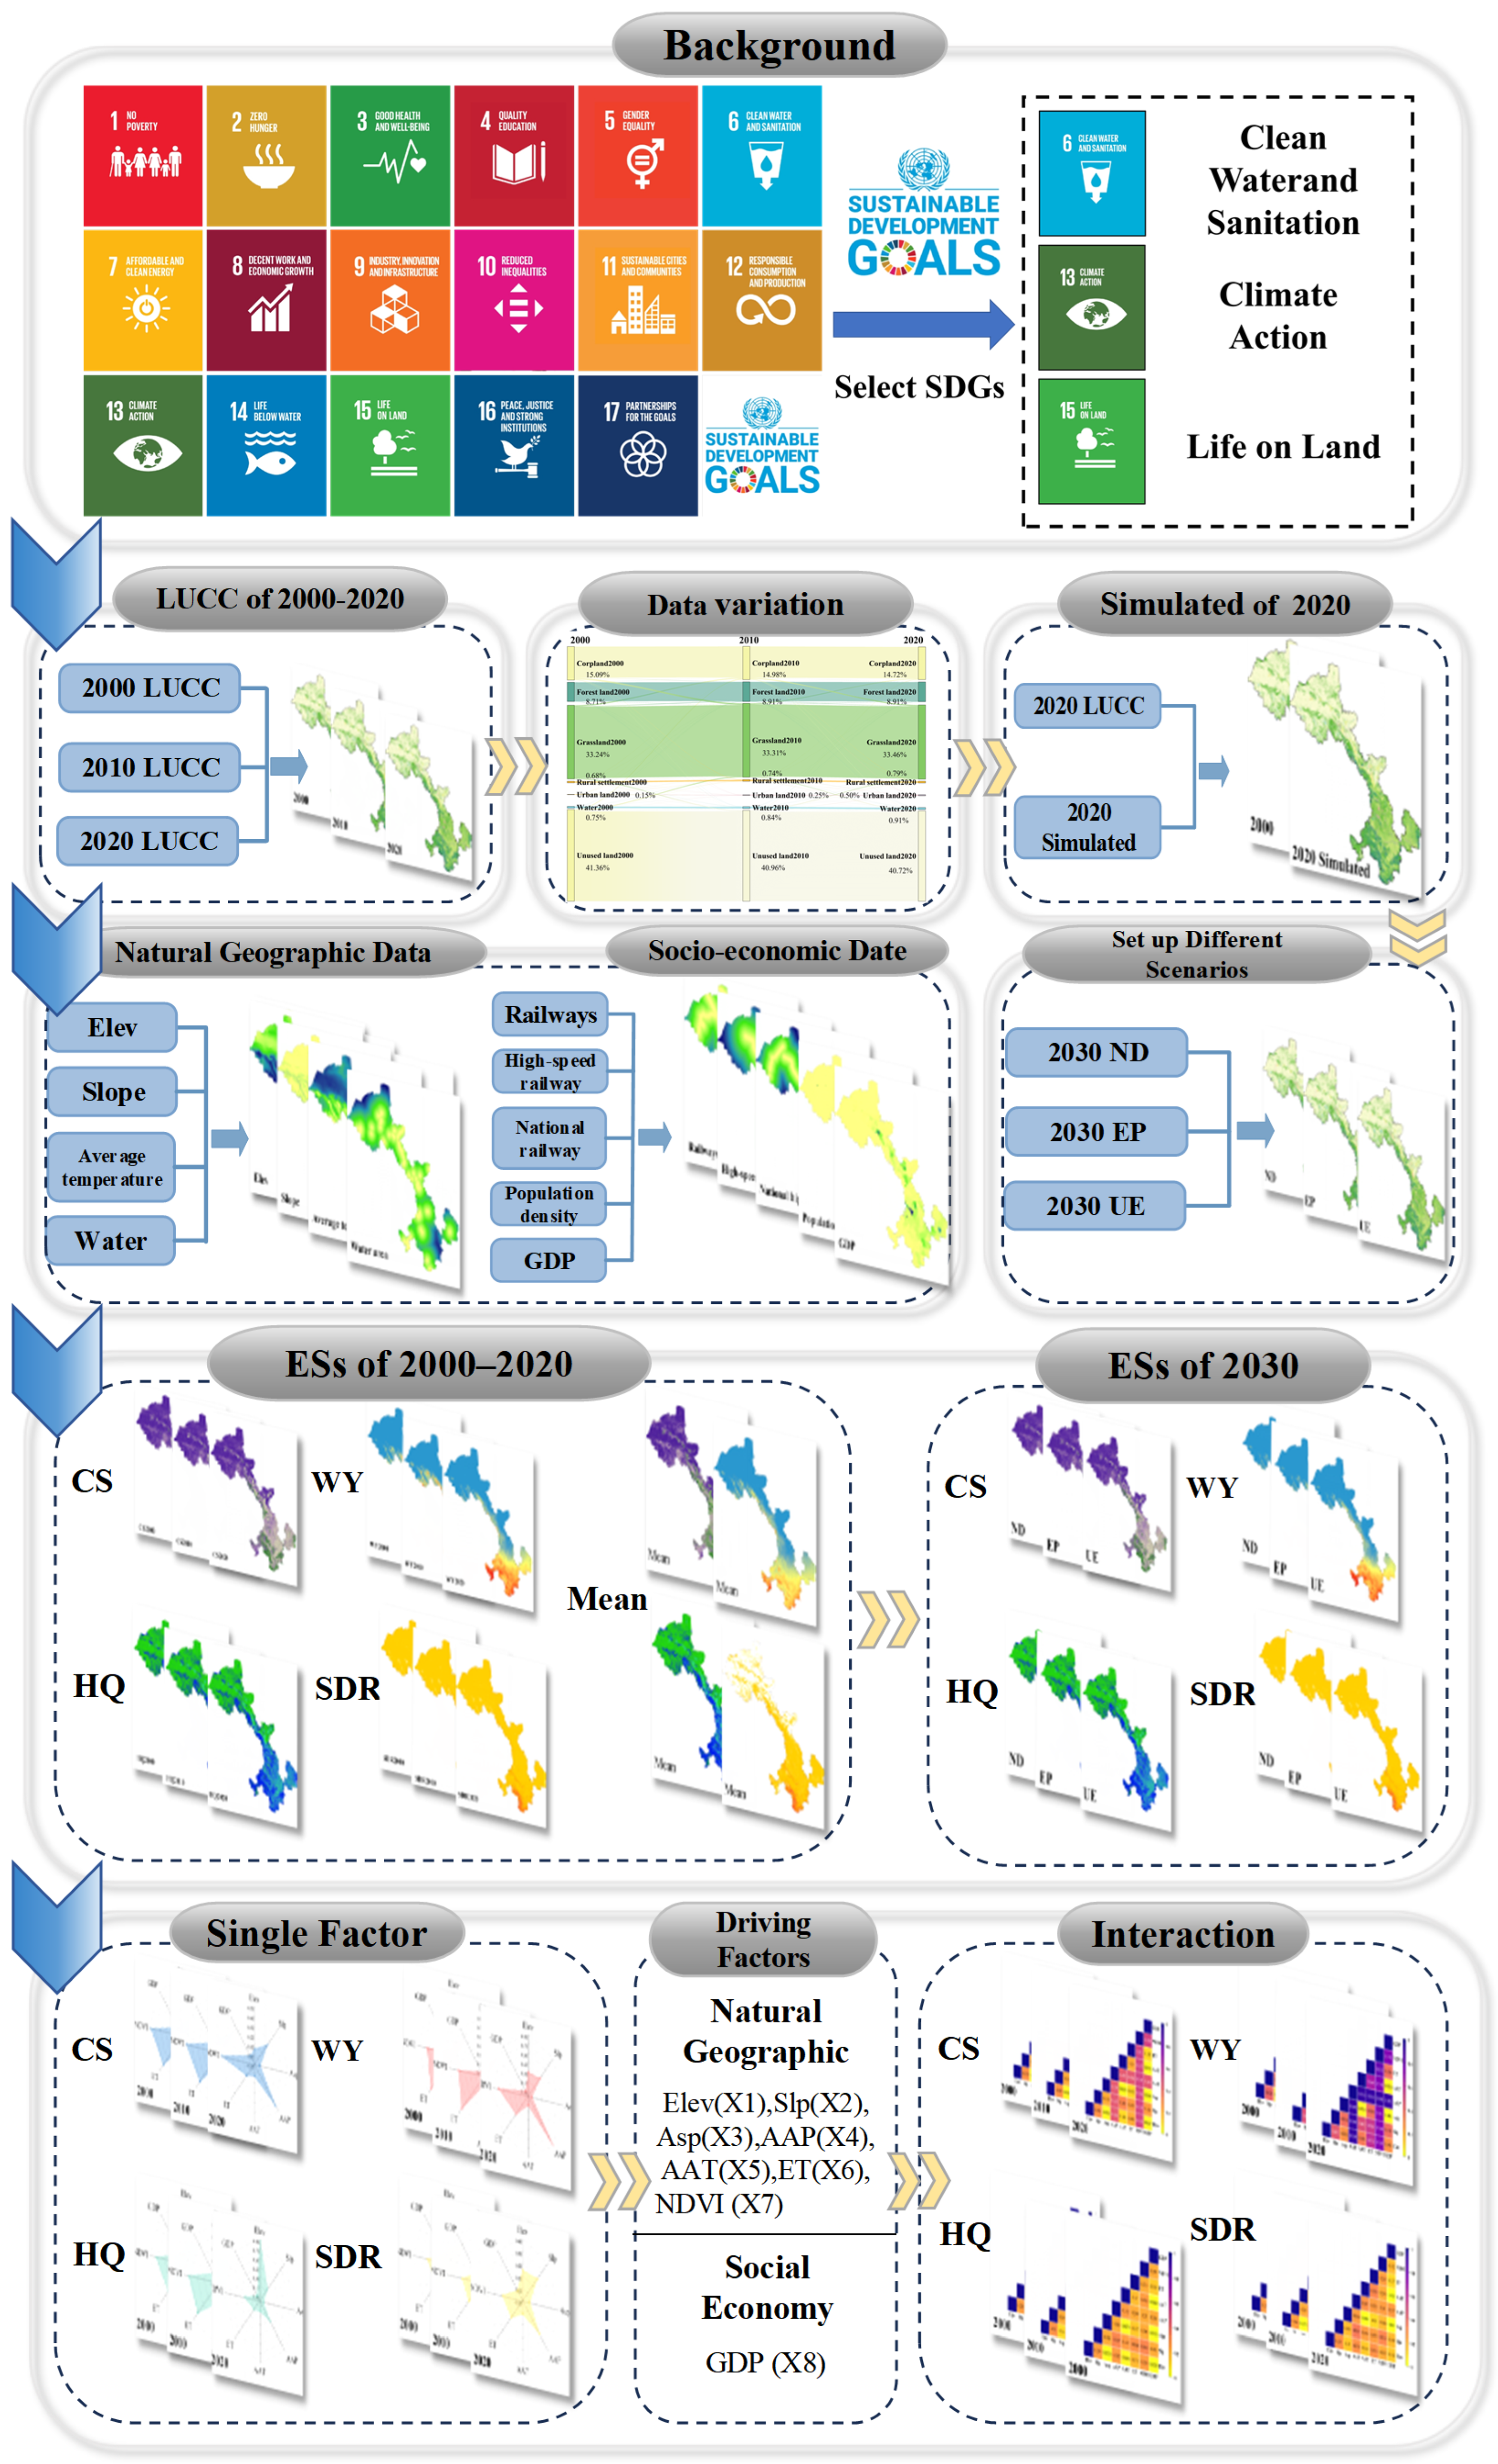
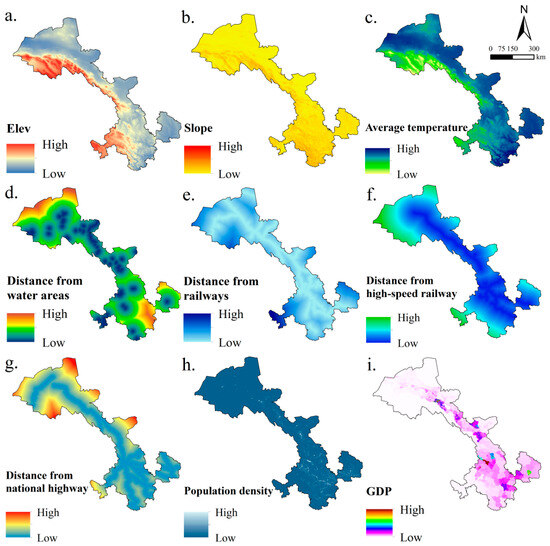
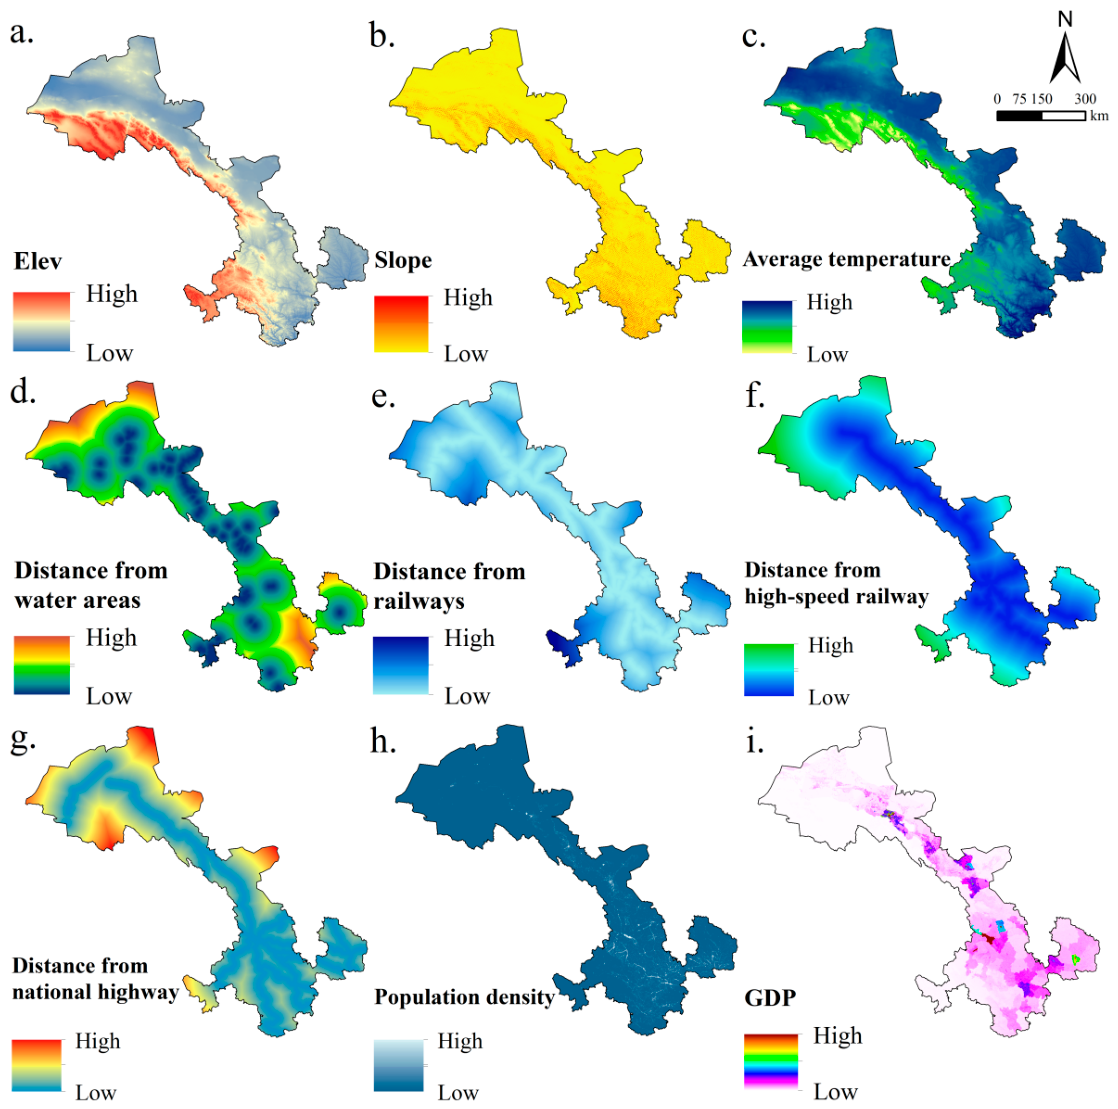
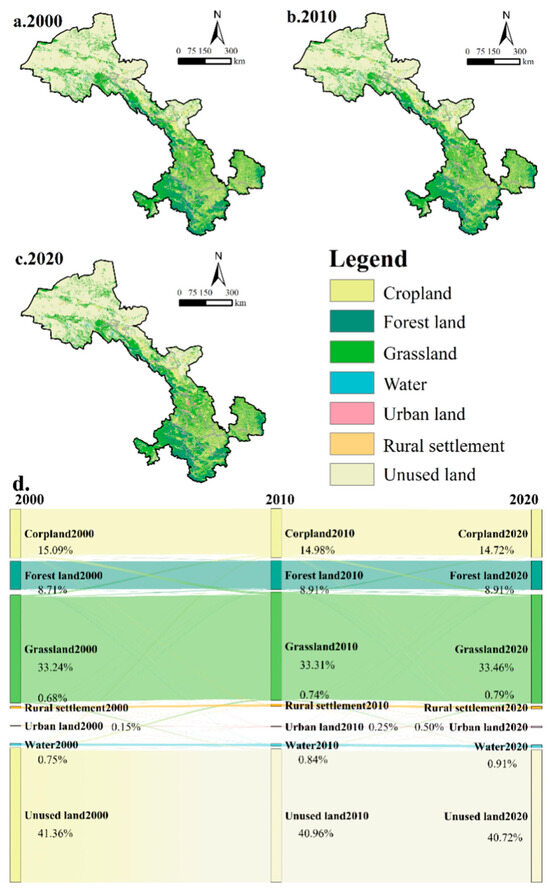
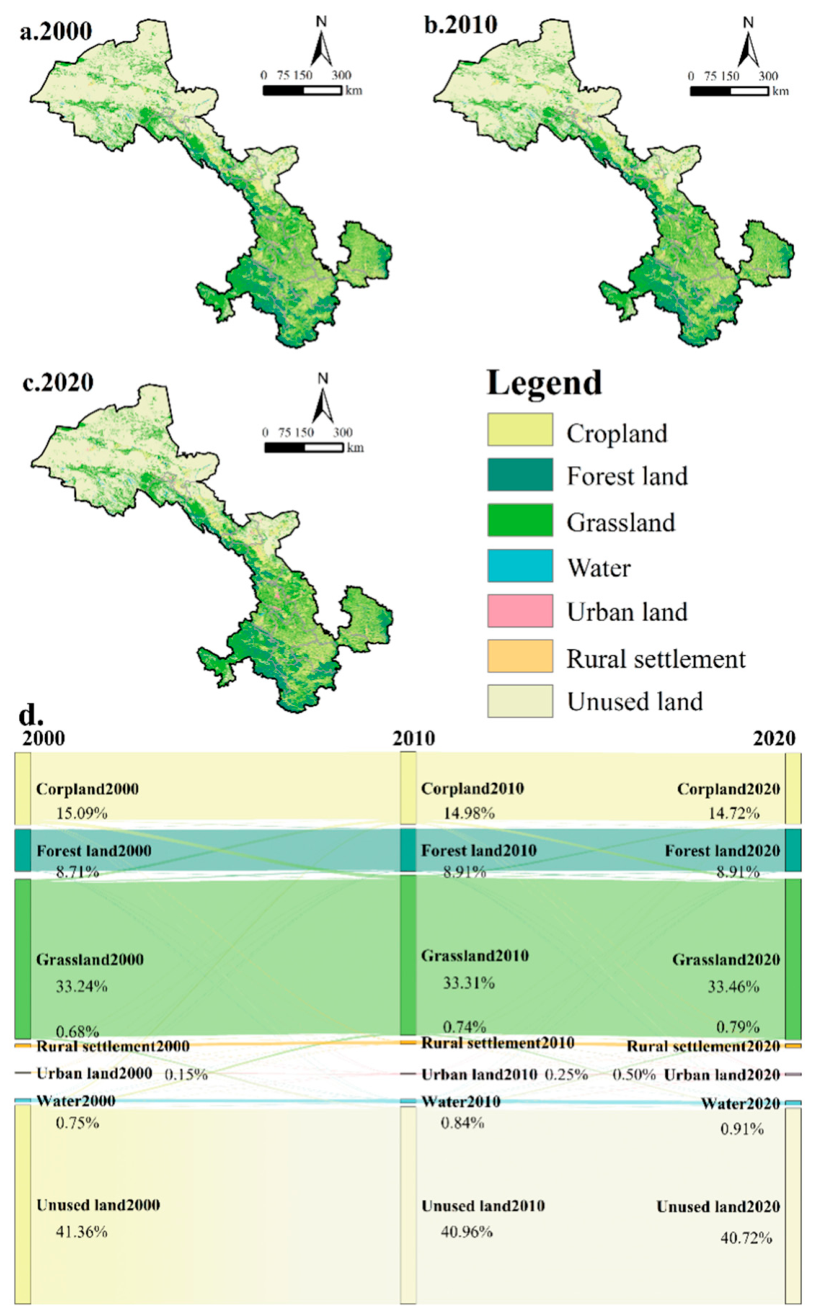
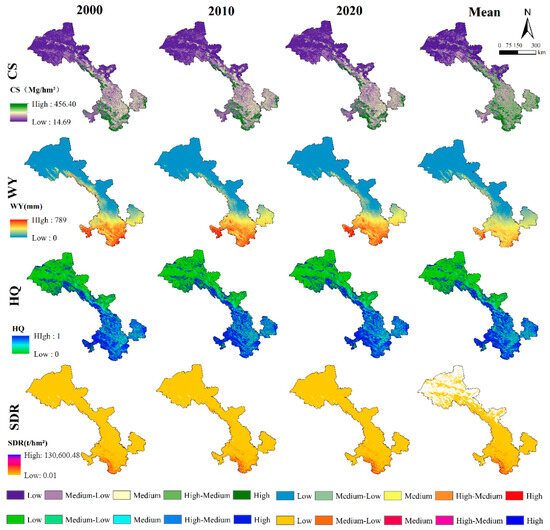
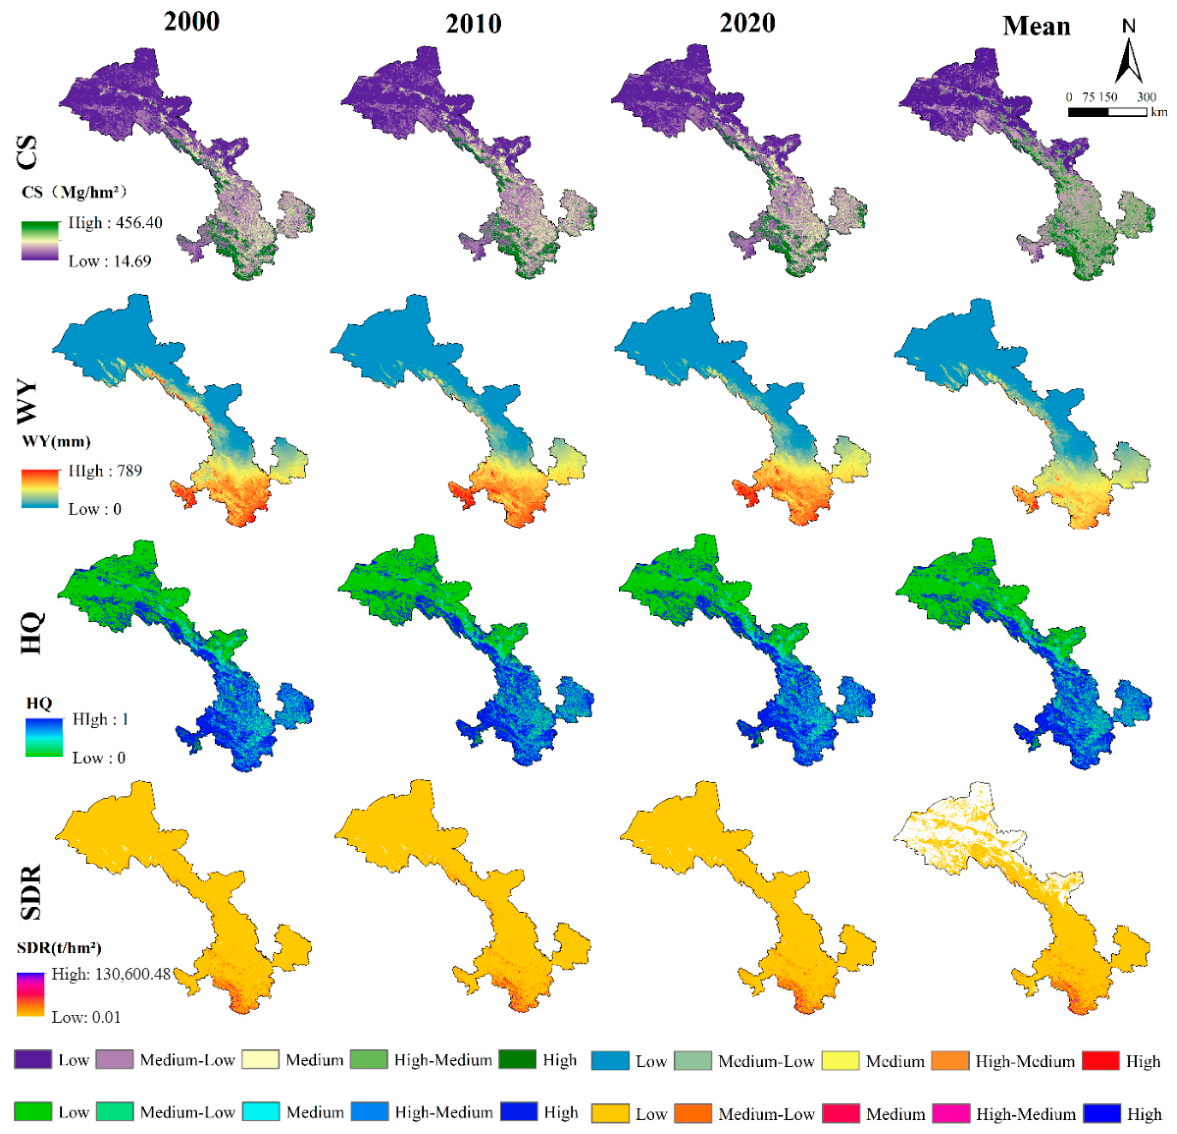
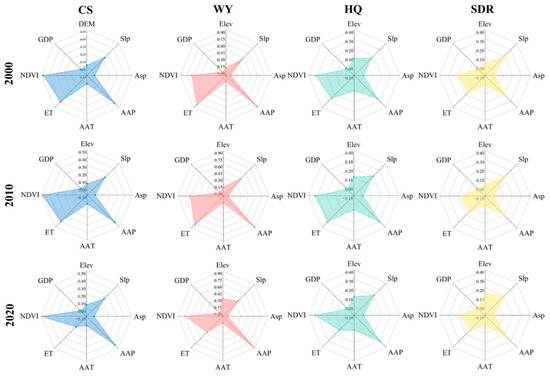
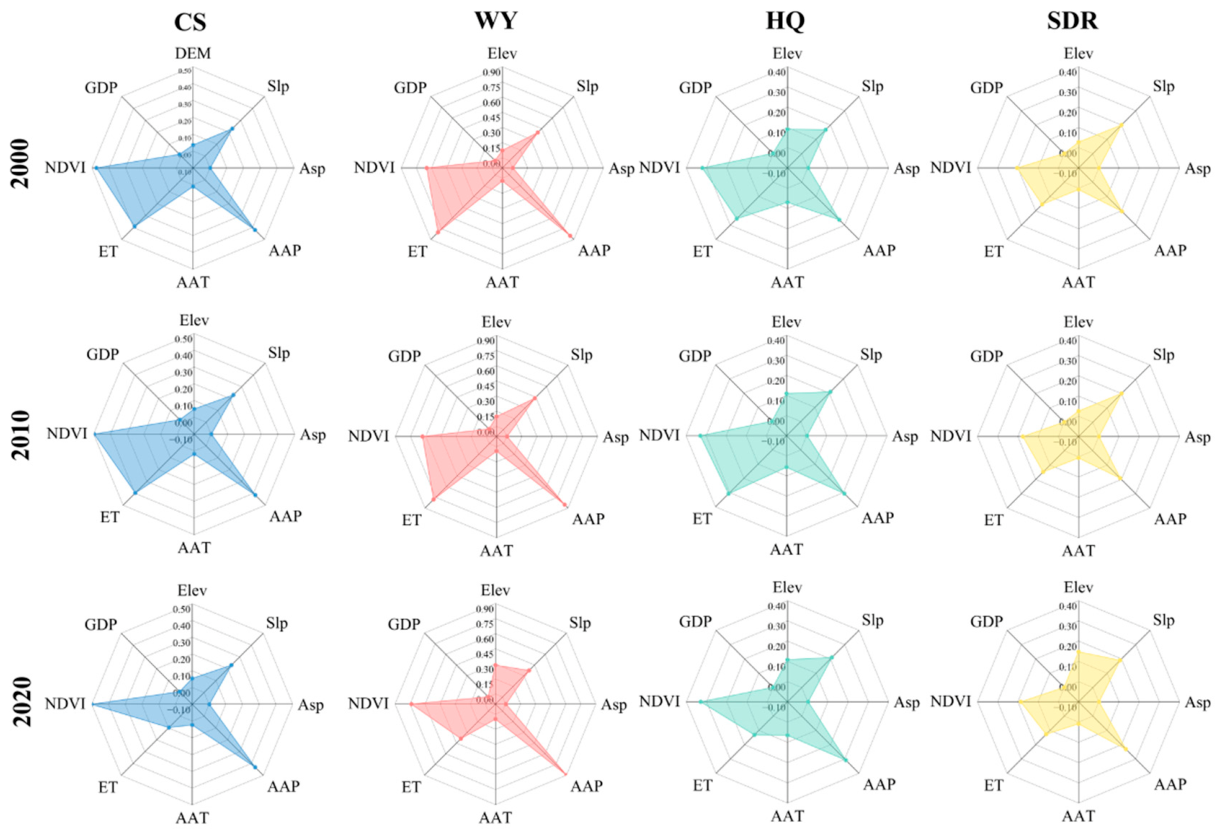
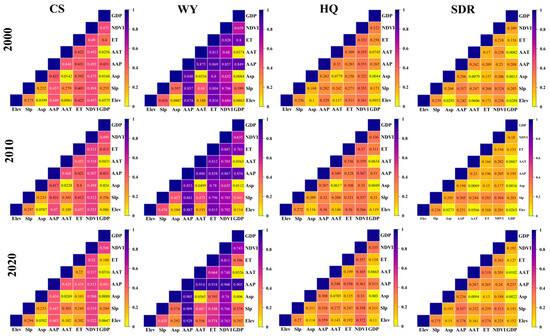
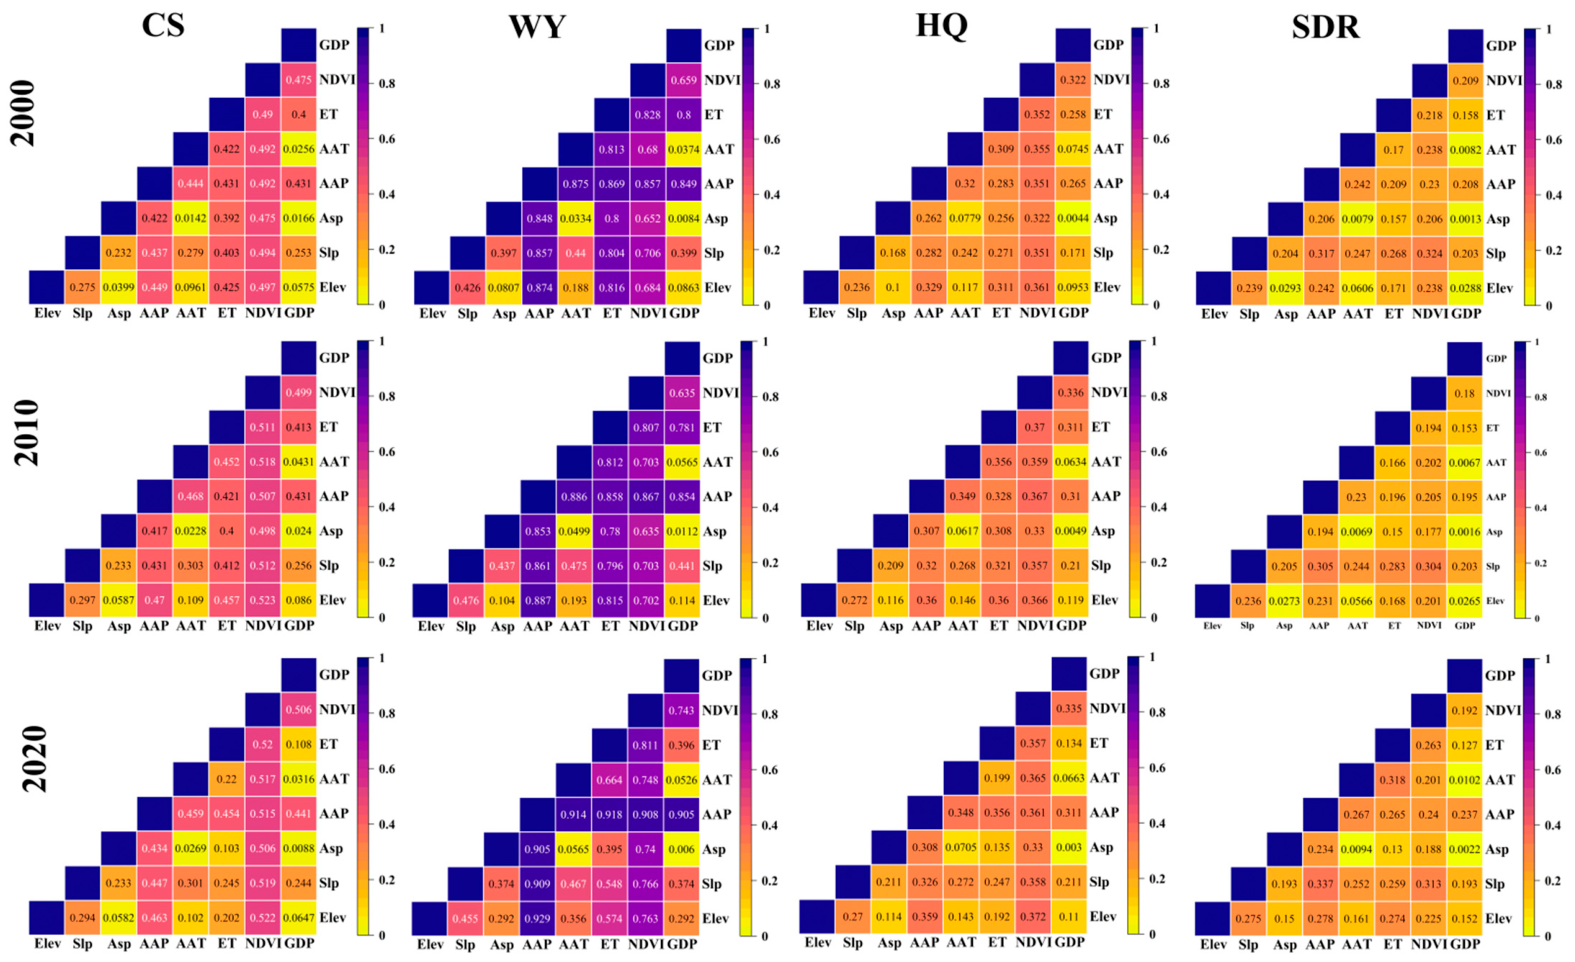
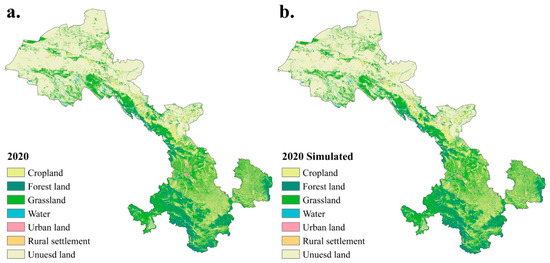
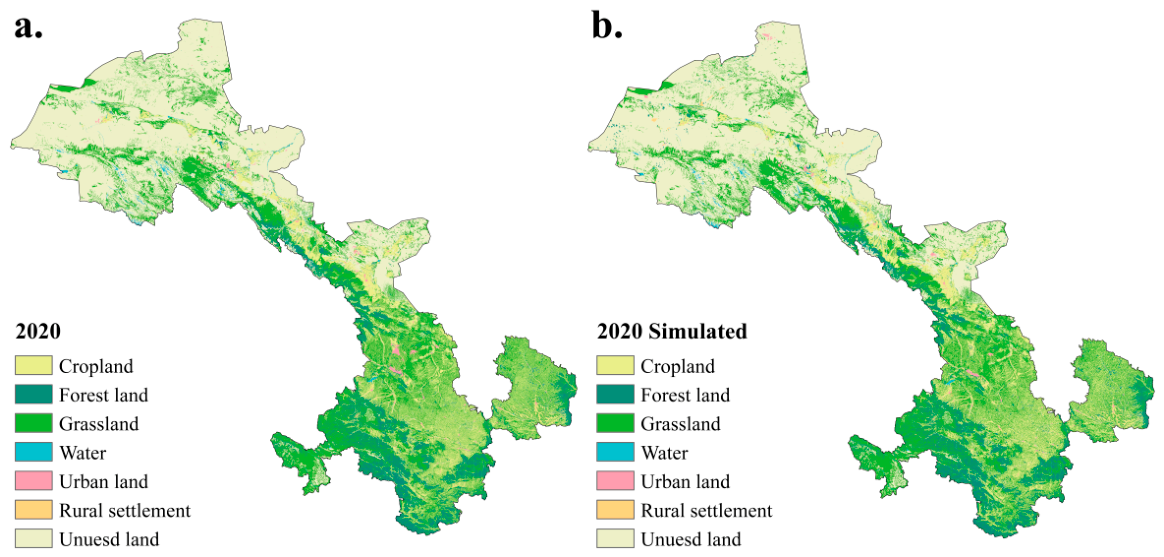
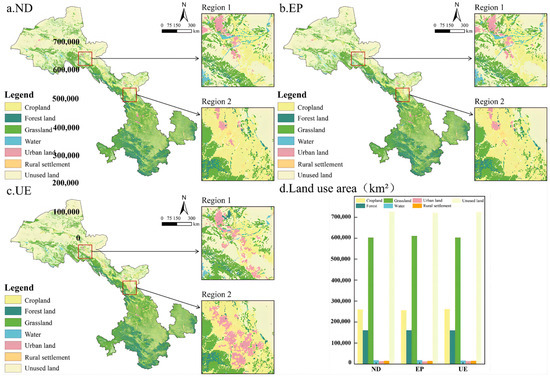
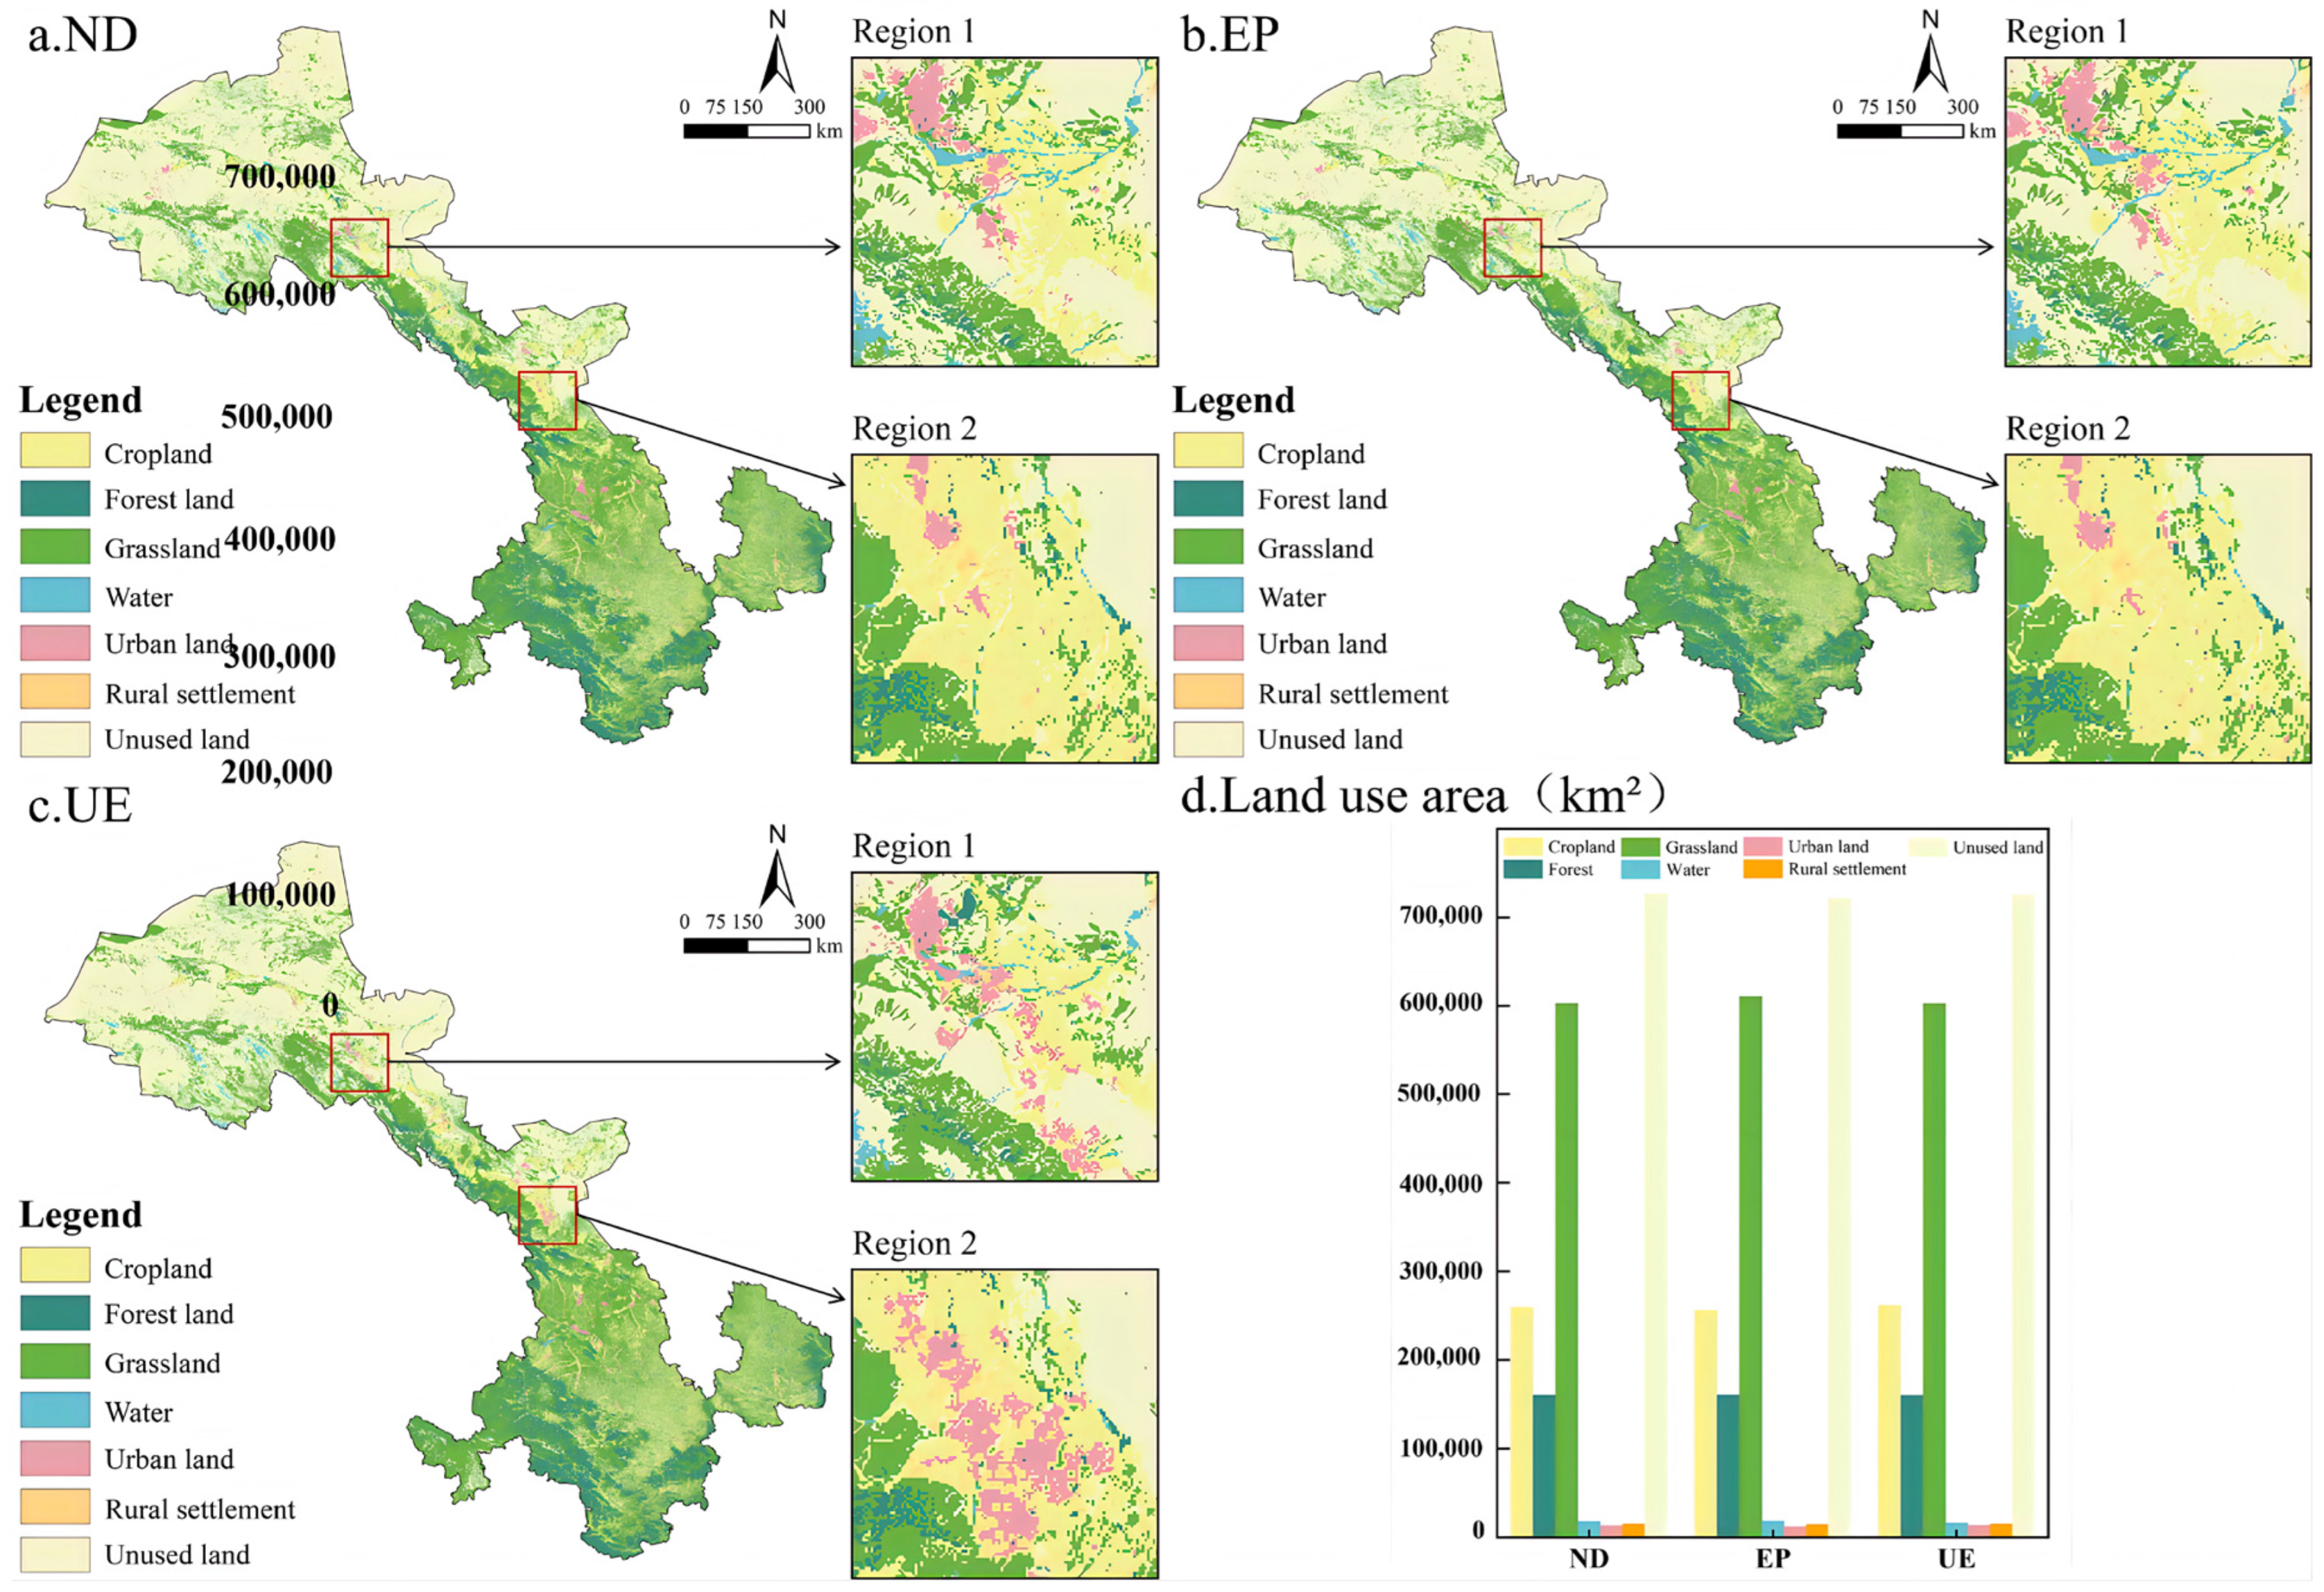
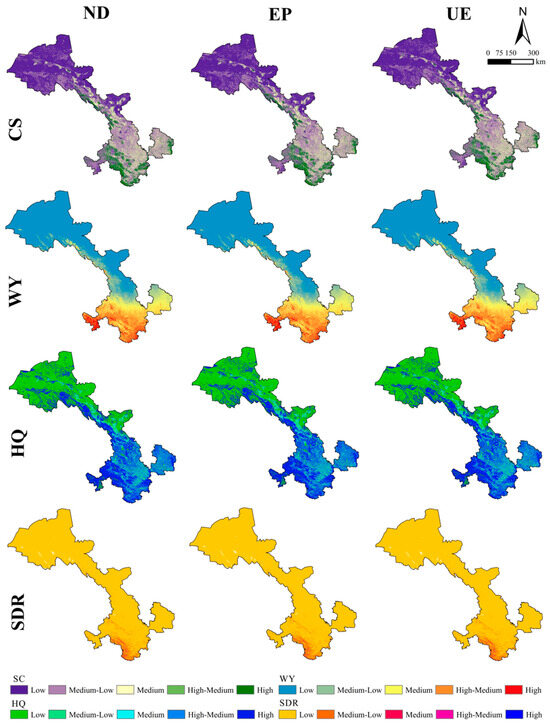
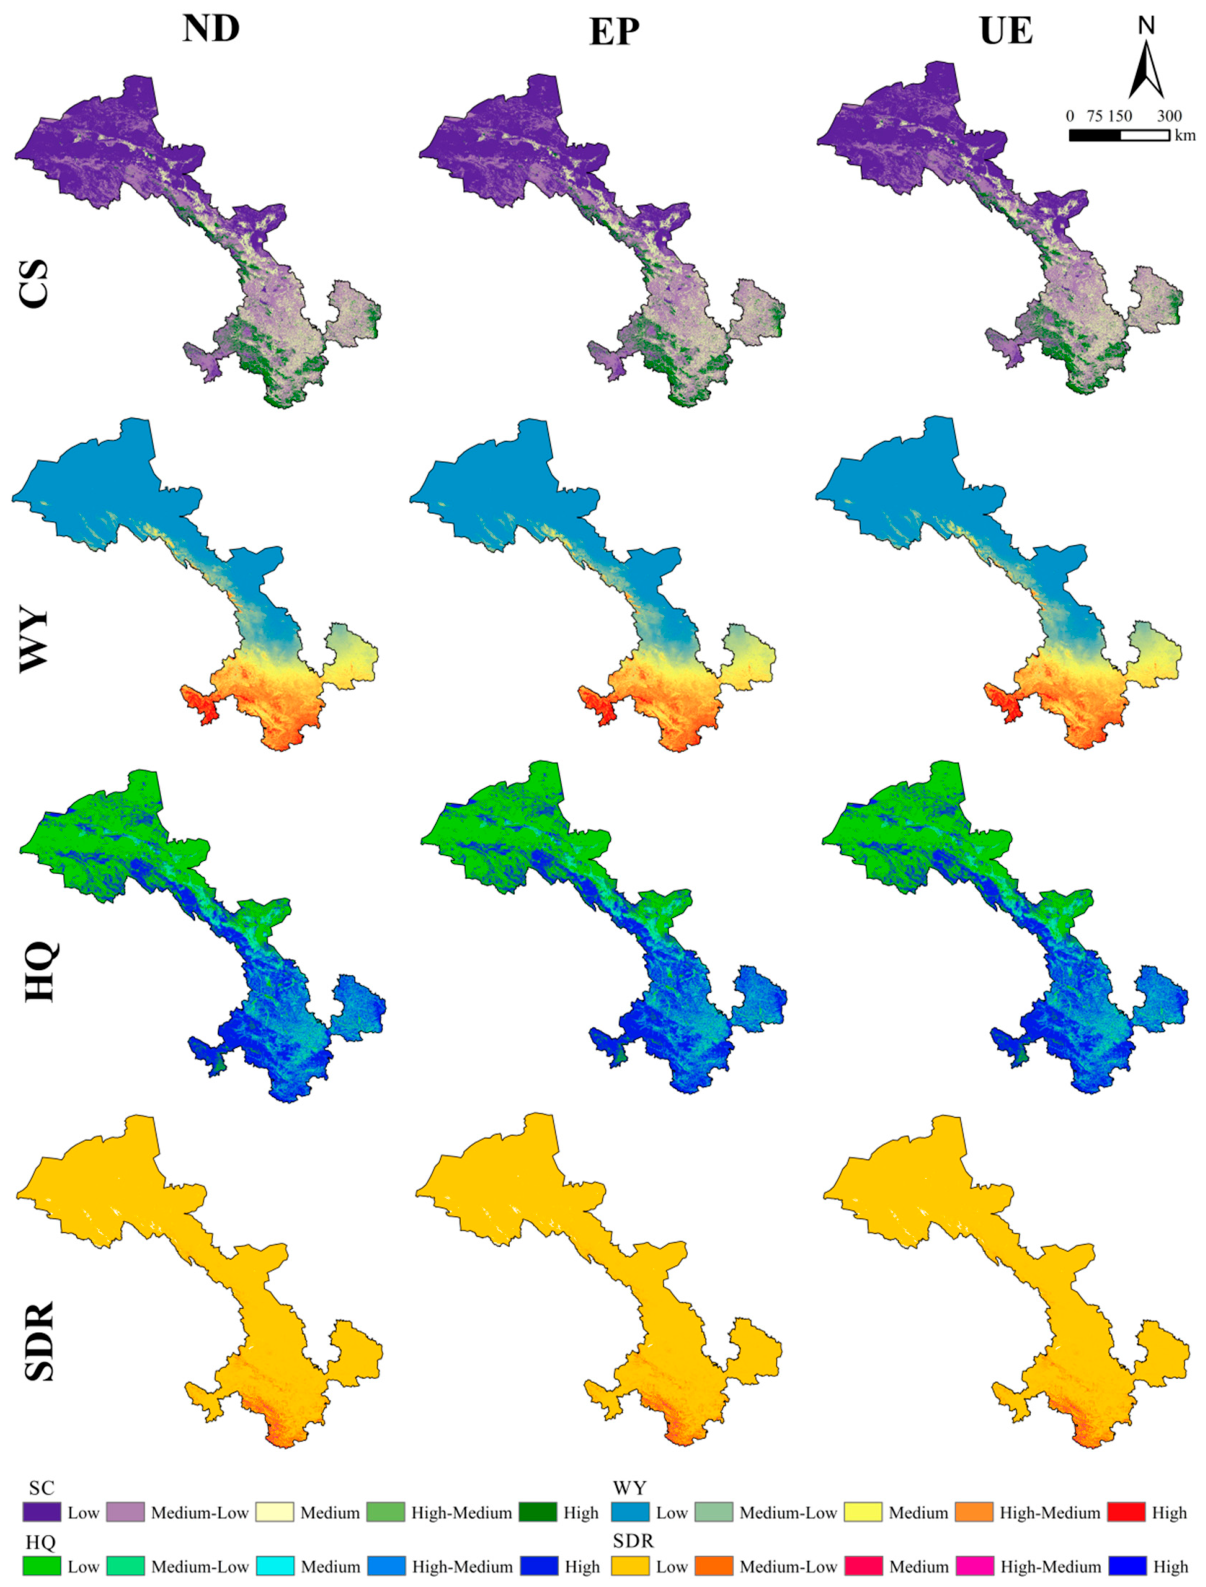

Disclaimer/Publisher’s Note: The statements, opinions and data contained in all publications are solely those of the individual author(s) and contributor(s) and not of MDPI and/or the editor(s). MDPI and/or the editor(s) disclaim responsibility for any injury to people or property resulting from any ideas, methods, instructions or products referred to in the content. |
© 2026 by the authors. Licensee MDPI, Basel, Switzerland. This article is an open access article distributed under the terms and conditions of the Creative Commons Attribution (CC BY) license.