Article

Land Use Structure Evolution in Resource-Based Cities: Drivers and Multi-Scenario Forecasting—Evidence from China’s Huaihai Economic Zone

School of Architecture and Design, China University of Mining and Technology, Xuzhou 221116, China
*
Author to whom correspondence should be addressed.
Land 2026, 15(4), 555; https://doi.org/10.3390/land15040555
Submission received: 14 February 2026 / Revised: 25 March 2026 / Accepted: 25 March 2026 / Published: 27 March 2026

Abstract

Resource-based cities face unique land use challenges due to resource dependence and path lock-in, yet the driving mechanisms and future trajectories of their land use transitions remain underexplored. This study examines the Huaihai Economic Zone (HEZ), a representative coal-rich region in eastern China, to analyze land use changes from 2000 to 2023 and simulate 2036 scenarios under different development pathways. Using land use transfer matrices, dynamic degree metrics, and the Patch-generating Land Use Simulation (PLUS) model, we systematically identified spatiotemporal evolution patterns, quantified the contributions of driving factors, and projected multi-scenario future land use patterns. Results reveal that land use change in the study area was dominated by the conversion of cultivated land to construction land, alongside spatial restructuring from a monocentric to a polycentric network pattern. Notably, construction land expansion was least evident in the central Mining-Affected Zone, where land use changes remained relatively sluggish compared to other sub-regions. Driving factor analysis indicates that socio-economic factors primarily influenced changes in construction and cultivated land, while natural factors strongly affected ecological land and unused land. Multi-scenario simulations for 2036 demonstrate diverging trajectories: an urban development scenario would accelerate cultivated land loss and unused land expansion; a natural development scenario would maintain current pressures; and an ecological protection scenario would effectively curb urban sprawl while actively promoting ecological land recovery. This study concludes that transcending simple land use control to actively orchestrate “mining-urban-rural-ecological” spatial synergy is critical for achieving a sustainable transition in resource-based regions facing similar transformation pressures.

1. Introduction

Rapid global urbanization and industrialization have led to deep changes in patterns of land use. These changes have created several fundamental problems, such as increased carbon emissions, increased conflict between types of land use, and the interruption of ecosystem carbon cycling [1]. In China, fast urban construction since reform and opening-up has exacerbated the need for rational allocation and functional optimization of land use structure [2]. Under this context, coordination of interactions among multiple driving factors and balance of land use types with different functions have become key tasks to realize regional sustainable development [3,4]. This phenomenon is particularly pronounced in resource-based cities [5,6].
The development of resource-dependent cities is highly dependent upon the extraction and processing of natural resources [7,8], which are a critical source of energy and resource security for regional industrialization and urbanization [9]. However, due to the non-renewable nature of these resources, many resource-rich regions face an increasing ‘resource curse’, including the misallocation of land, inefficient use of land, environmental pollution, and rising poverty and unemployment [10,11]. Mining activities inherently introduce geological and environmental risks. For example, underground and open-pit mining often cause surface subsidence [12], alter local hydrological conditions [13], and may destabilize slopes [14], posing long-term hazards to infrastructure and communities. Additionally, these mining-induced disturbances exacerbate urban shrinkage [15], land degradation [16,17], and the homogenization of land use structure [18], collectively constraining the sustainable development of resource-based regions [19].
In response to these challenges, countries throughout the world have developed regional management and redevelopment strategies aiming to improve the sustainability of resource-based cities. In the Ruhr area of Germany, former industrial areas have been transformed from industrial mining land to cultural and recreation areas, with brownfields being converted to museums, design centers, and public parks [20]. In Appalachia, coal mines sites are being converted into solar and battery storage facilities, a move from extractive industrial land to clean energy infrastructure [21]. In the Bangka Belitung Islands of Indonesia, for instance, tin mine reclamation projects have taken an ecosystem-oriented approach in which degraded extraction sites were converted into reforested areas, agroforestry systems, and aquaculture ponds, demonstrating the adaptive potential of post-mining land use structures [22]. These international practices indicate that land use restructuring—the conversion of degraded or industrial land to the alternative use of land—is a fundamental route for spatial optimization in post-mining regions. Therefore, the systematic analysis of the structure evolution and the formulation of specific spatial optimization strategies of land use have become a fundamental approach of the resolution of this multi-faced challenge.
Land Use and Land Cover Change (LUCC) is an instant result of interactions taking place between the Earth and human activities [23]. Due to territorial spatial planning, both regional ecological environments suffer large impact from this process [24]. The intensity and pace of LUCC are simultaneously influenced by various factors, notably natural resources exploitation [25], environmental factors (climate, soil), and socio-economic activities [26]. A detailed analysis of the LUCC driving mechanisms can clarify the pathways that socio-economic drivers and natural drivers have on land use structure [27]. This evidence gives a foundation for developing scientific land management systems with a guide for land use transitions to sustainability and functional diversity [28]. Existing studies have approached the subject of LUCC from various aspects, including urban shrinkage [29], quality of life [30], carbon emissions [31], and carbon storage [32,33], and have suggested corresponding land management strategies.
Furthermore, multi-scenario land use simulations can support the prediction of the future patterns and informing urban development policy formulation [25]. These simulations are also important in countering disorderly development as well as improving land spatial development mechanisms [34]. Previous land use prediction models have used strategies like the CA–Markov model [35], FLUS model [36,37], CLUE-S model [38,39], and EL-CA model [40]. However, as land systems are complex, these methods are often not able to simultaneously integrate multiple endogenous driving factors [32]. In addition, many of these approaches are focused on the single-city scale and do not adequately relate the interactions between drivers at larger regional scales, such as urban agglomerations [41]. More critically, these conventional models do not have the capacity to adequately ex-plain the unique spatial impacts of mining activities, such as subsidence-induced land degradation, industrial land abandonment, and fragmentation of ecological patches, that constitute a particular set of drivers that are especially pronounced in, and characteristic of resource-based cities. While the outcomes of mining-induced disturbances, such as urban shrinkage [15] and landscape fragmentation [29], have been well-documented, the underlying driving mechanisms remain insufficiently explored. Existing research is largely symptom-focused [30], describing land use changes in resource-based regions without systematically disentangling the complex interplay between socio-economic factors and the spatial legacy of mining extraction. This gap in causal understanding fundamentally limits our ability to project future land use trajectories accurately and to design targeted, effective spatial interventions. These constraints restrict the use of the results for land use planning on a regional scale. To address this critical research gap, the present investigation uses the PLUS model to overcome this deficiency in the research. Through the incorporation of rule mining strategies and patch generation mechanisms, the model allows for more accurate quantification of impact magnitudes being exerted by various driving factors [42] as well as effective projection of temporal–spatial dynamics in land-use patches [43,44]. More importantly, this study captures the complex patch-scale evolution processes, such as the expansion of construction land and the fragmentation of ecological land caused by mining activities, to simulate the unique spatial legacy effects and land use transformation patterns of resource-based cities. In addition, several previous studies have validated the reliability of the PLUS model [41,45,46].
Within the global context of resource-based city transition, China is highly representative due to its numerous quantities of these cities, a full range of typology [47], and fast development rate [19]. At the same time, China is facing complex and severe transitional challenges [8]. This paper therefore selects a typical coal-resource region in China, the Huaihai Economic Zone (HEZ), as the empirical case. The HEZ is a key energy base and a concentration of resource-based cities in eastern China [48,49]. Its land use evolution also reflects intense conflicts and adaptive adjustments in territorial space under the combined pressures of resource exploitation, urbanization, and multiple policy objectives. Research based on the HEZ can therefore offer a practical scientific basis for clarifying the logic of land use evolution in other similar resource-based regions and for sustainable spatial planning.
Building upon this very case, the present investigation seeks to answer three fundamental questions: (1) what are the spatiotemporal features of the evolution of land use in this archetypal coal-resource region? (2) What elements are predominantly behind the evolution of land use structure? (3) How would the patterns of land use evolve in the future, under different future scenarios, in this region, and what are the implications of these patterns in terms of sustainable development? By answering these questions, the study aims to unravel the unique patterns of the evolution of land use structure of resource-based regions, to find the underlying cause mechanisms, and to attempt to explore the prospective transition pathway. In so doing, it aims to provide a strong basis for decision-making on sustainable spatial planning for similar resource-dependent regions.

2. Materials and Methods

2.1. Study Area

Worldwide, energy remains a dominant source of energy in the form of coal. According to data from the International Energy Agency (IEA), coal accounted for 27.9% of the world’s primary energy consumed in 2024, which is the second highest compared to petroleum. Global coal production is 9.114 billion tons in the year 2024, where China accounts for 51.2% of the global production. As the biggest coal producer in the world [50], there are 63 officially designated coal-dependent cities in China, and nine of them are located in the Huaihai Economic Zone (HEZ). Among these is Xuzhou, a representative coal city that has accumulated more than 1 billion tons of coal production.
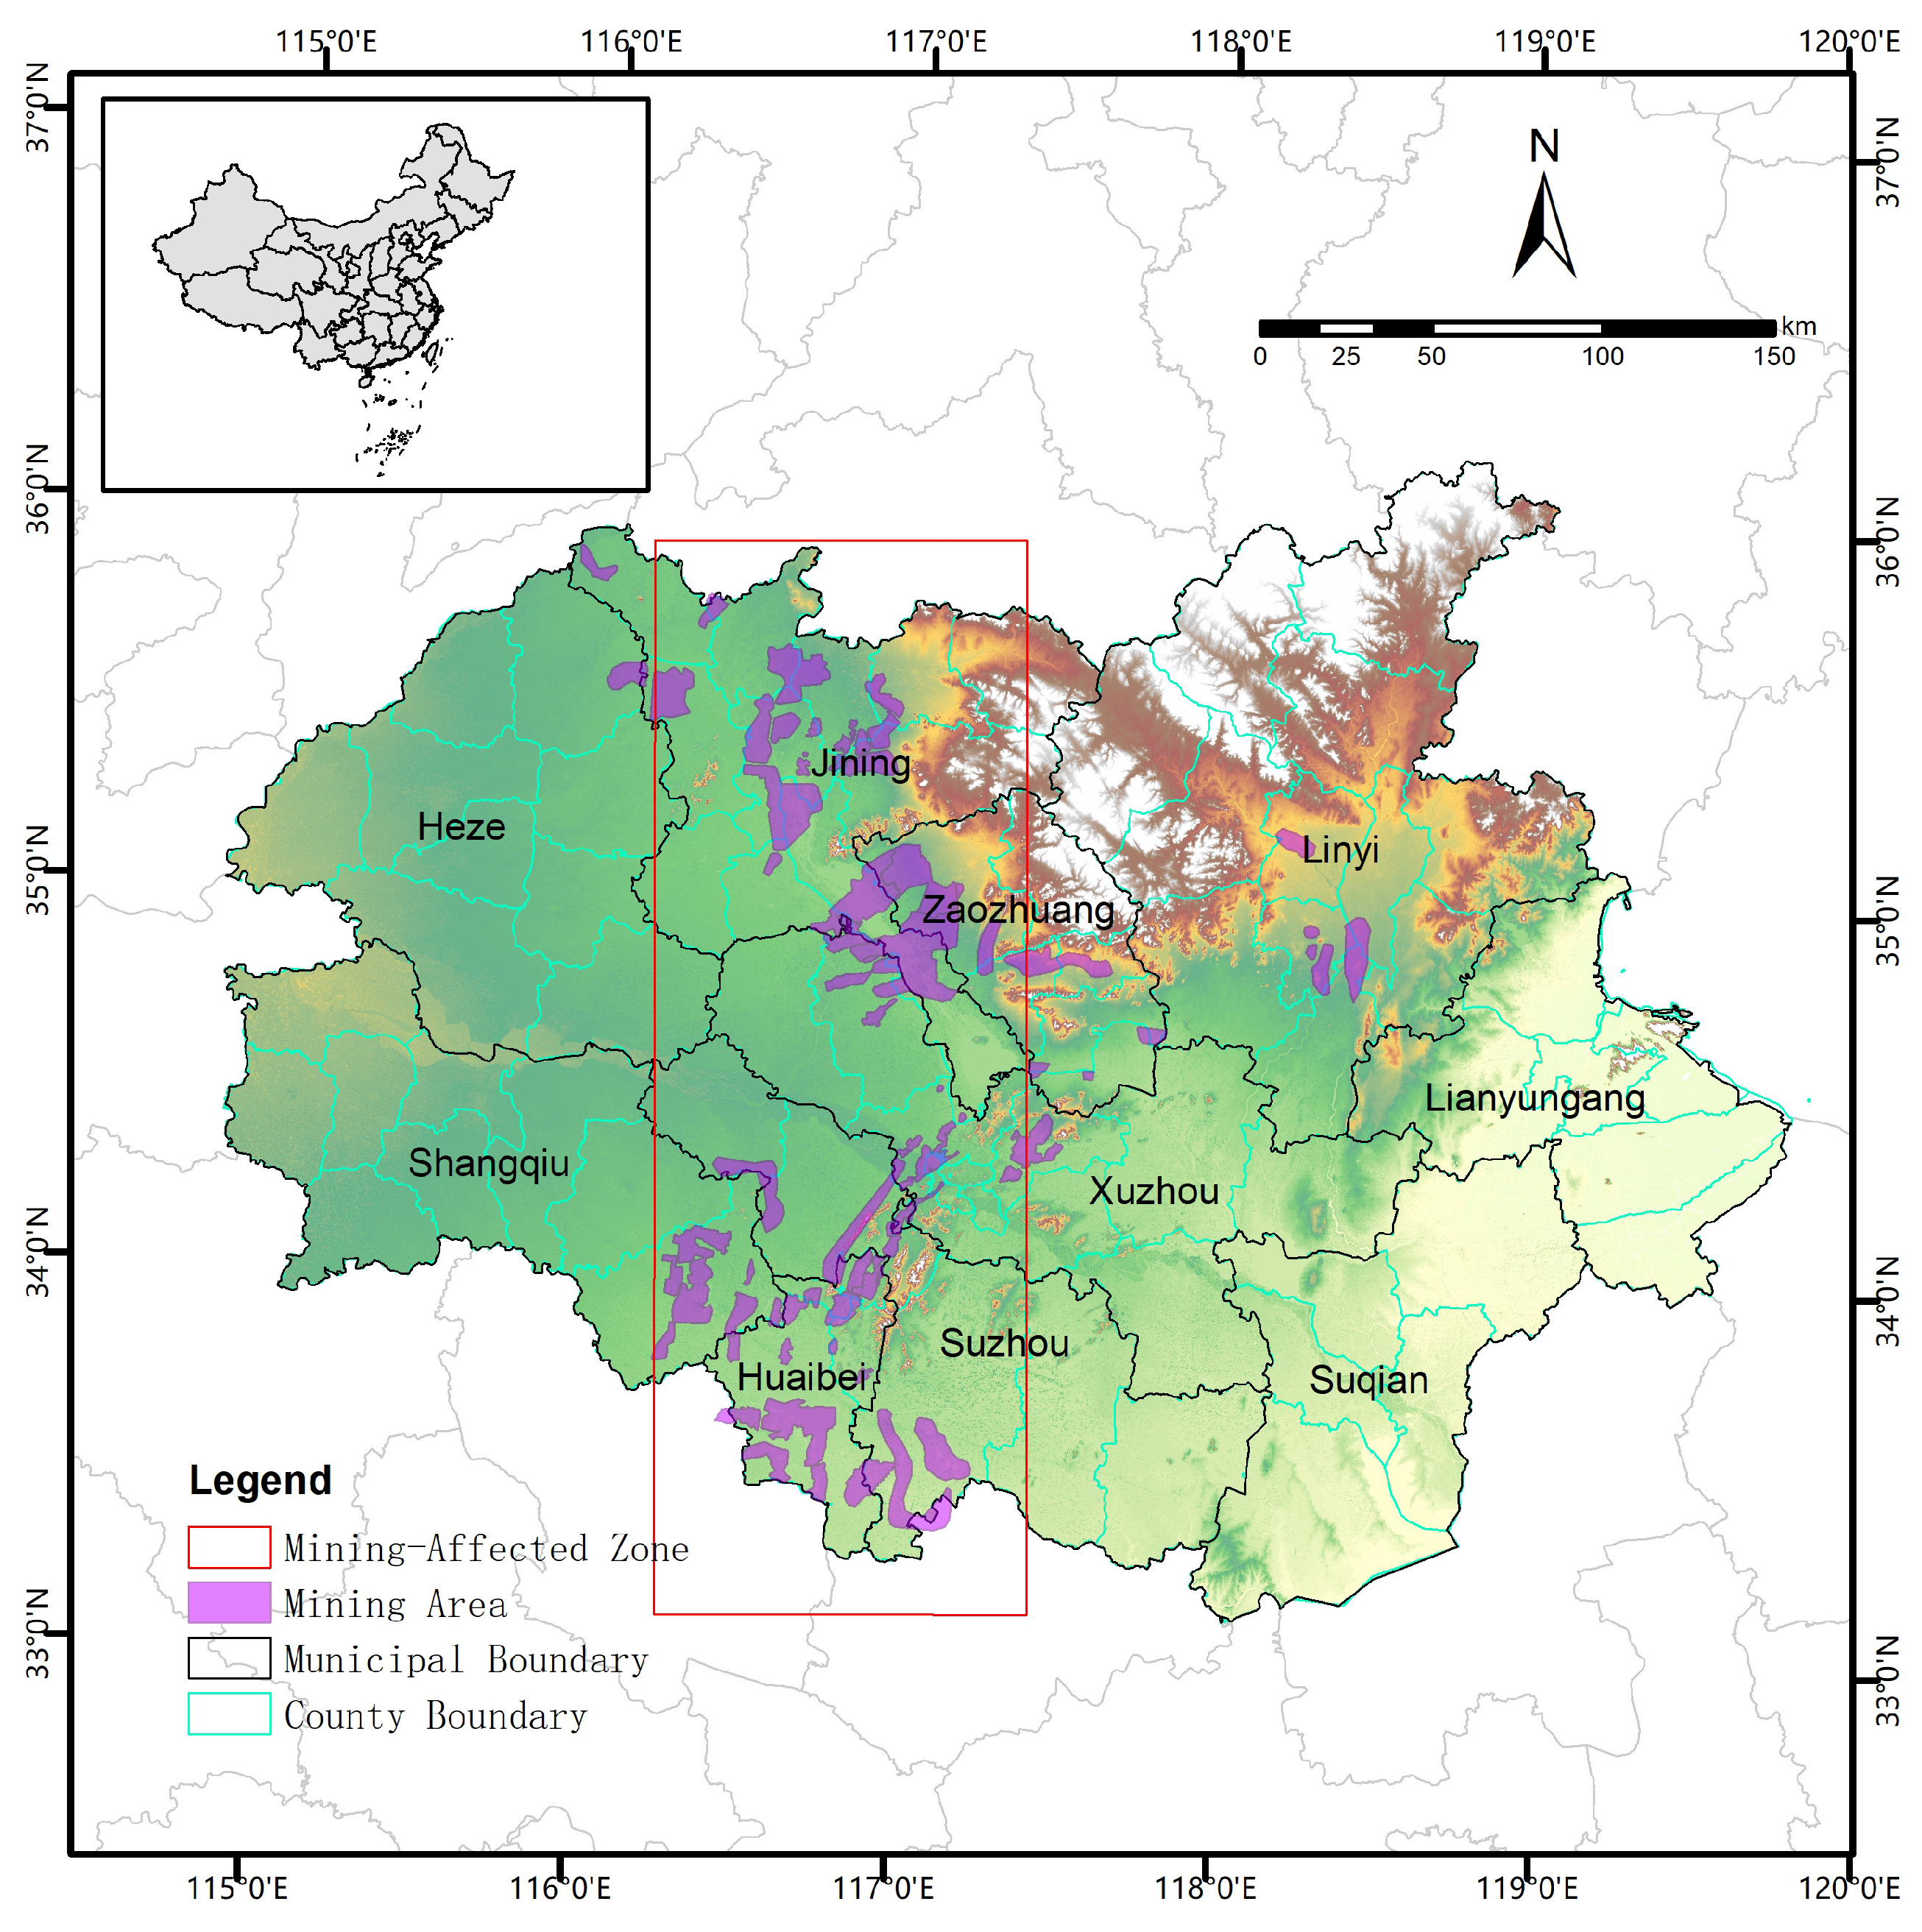
Situated at the intersection of the Anhui, Henan, Shandong, and Jiangsu provinces in China, the HEZ exemplifies a characteristic coal-abundant area that extends across longitudes 110° E to 120° E and latitudes 33° N to 36° N (Figure 1) [51]. An extensive mining legacy and substantial coal deposits distinguish this region, which operates as a major energy supplier and a prominent aggregation of resource-dependent urban centers nationwide. Approval of the “Huaihe River Ecological Economic Belt Development Plan” by the State Council occurred in 2018, formally establishing the HEZ core region to comprise ten municipalities: Jining, Huaibei, Suzhou, Lianyungang, and Xuzhou, among others. Among these, several are representative resource-based cities [52], primarily concentrated within the north–south oriented Mining-Affected Zone in the central part of the HEZ (Figure 1).
This study selects the HEZ as an empirical case because the region is representative of resource-based regional development in China and across Asia. The HEZ has definite characteristics of developments dependent on coal, and it is also similar to typical issues faced in resource-based regions, such as the narrow structure of industrial activity, the high density of land use restructuring, and ecological pressure. However, being a developed mining base, the region has made great steps towards solving the issue of the resource curse. By 2025, 236 km2 of mining subsidence areas had been reused in the central city of Xuzhou alone, reaching a remediation rate of 83. Moreover, the HEZ harbors four categories of resource-based cities, such as growth, mature, declining, and regenerative cities, all at various stages of developmental scale, contributing to its internal heterogeneity. The HEZ, compared to other comparable areas in Asia and in the world, is a sufficient sample in terms of geographical area, internal heterogeneity, and policy context of intervention. These characteristics allow one to analyze the internal logic as well as the external forces that contribute to the evolution of land use in areas that are dependent on the resources. The evolutionary process of the HEZ, using resources as a dependent variable, spatial restructuring, and exploration as a transitory variable, gives an idea on how developing nations and emerging economies can strike a balance between resource exploitation, land use, and sustainable development.

2.2. Data Sources

The data used in this study includes LUCC data, environmental data, and socioeconomic data. The specific data names and sources are shown in Table 1.

2.3. Methods

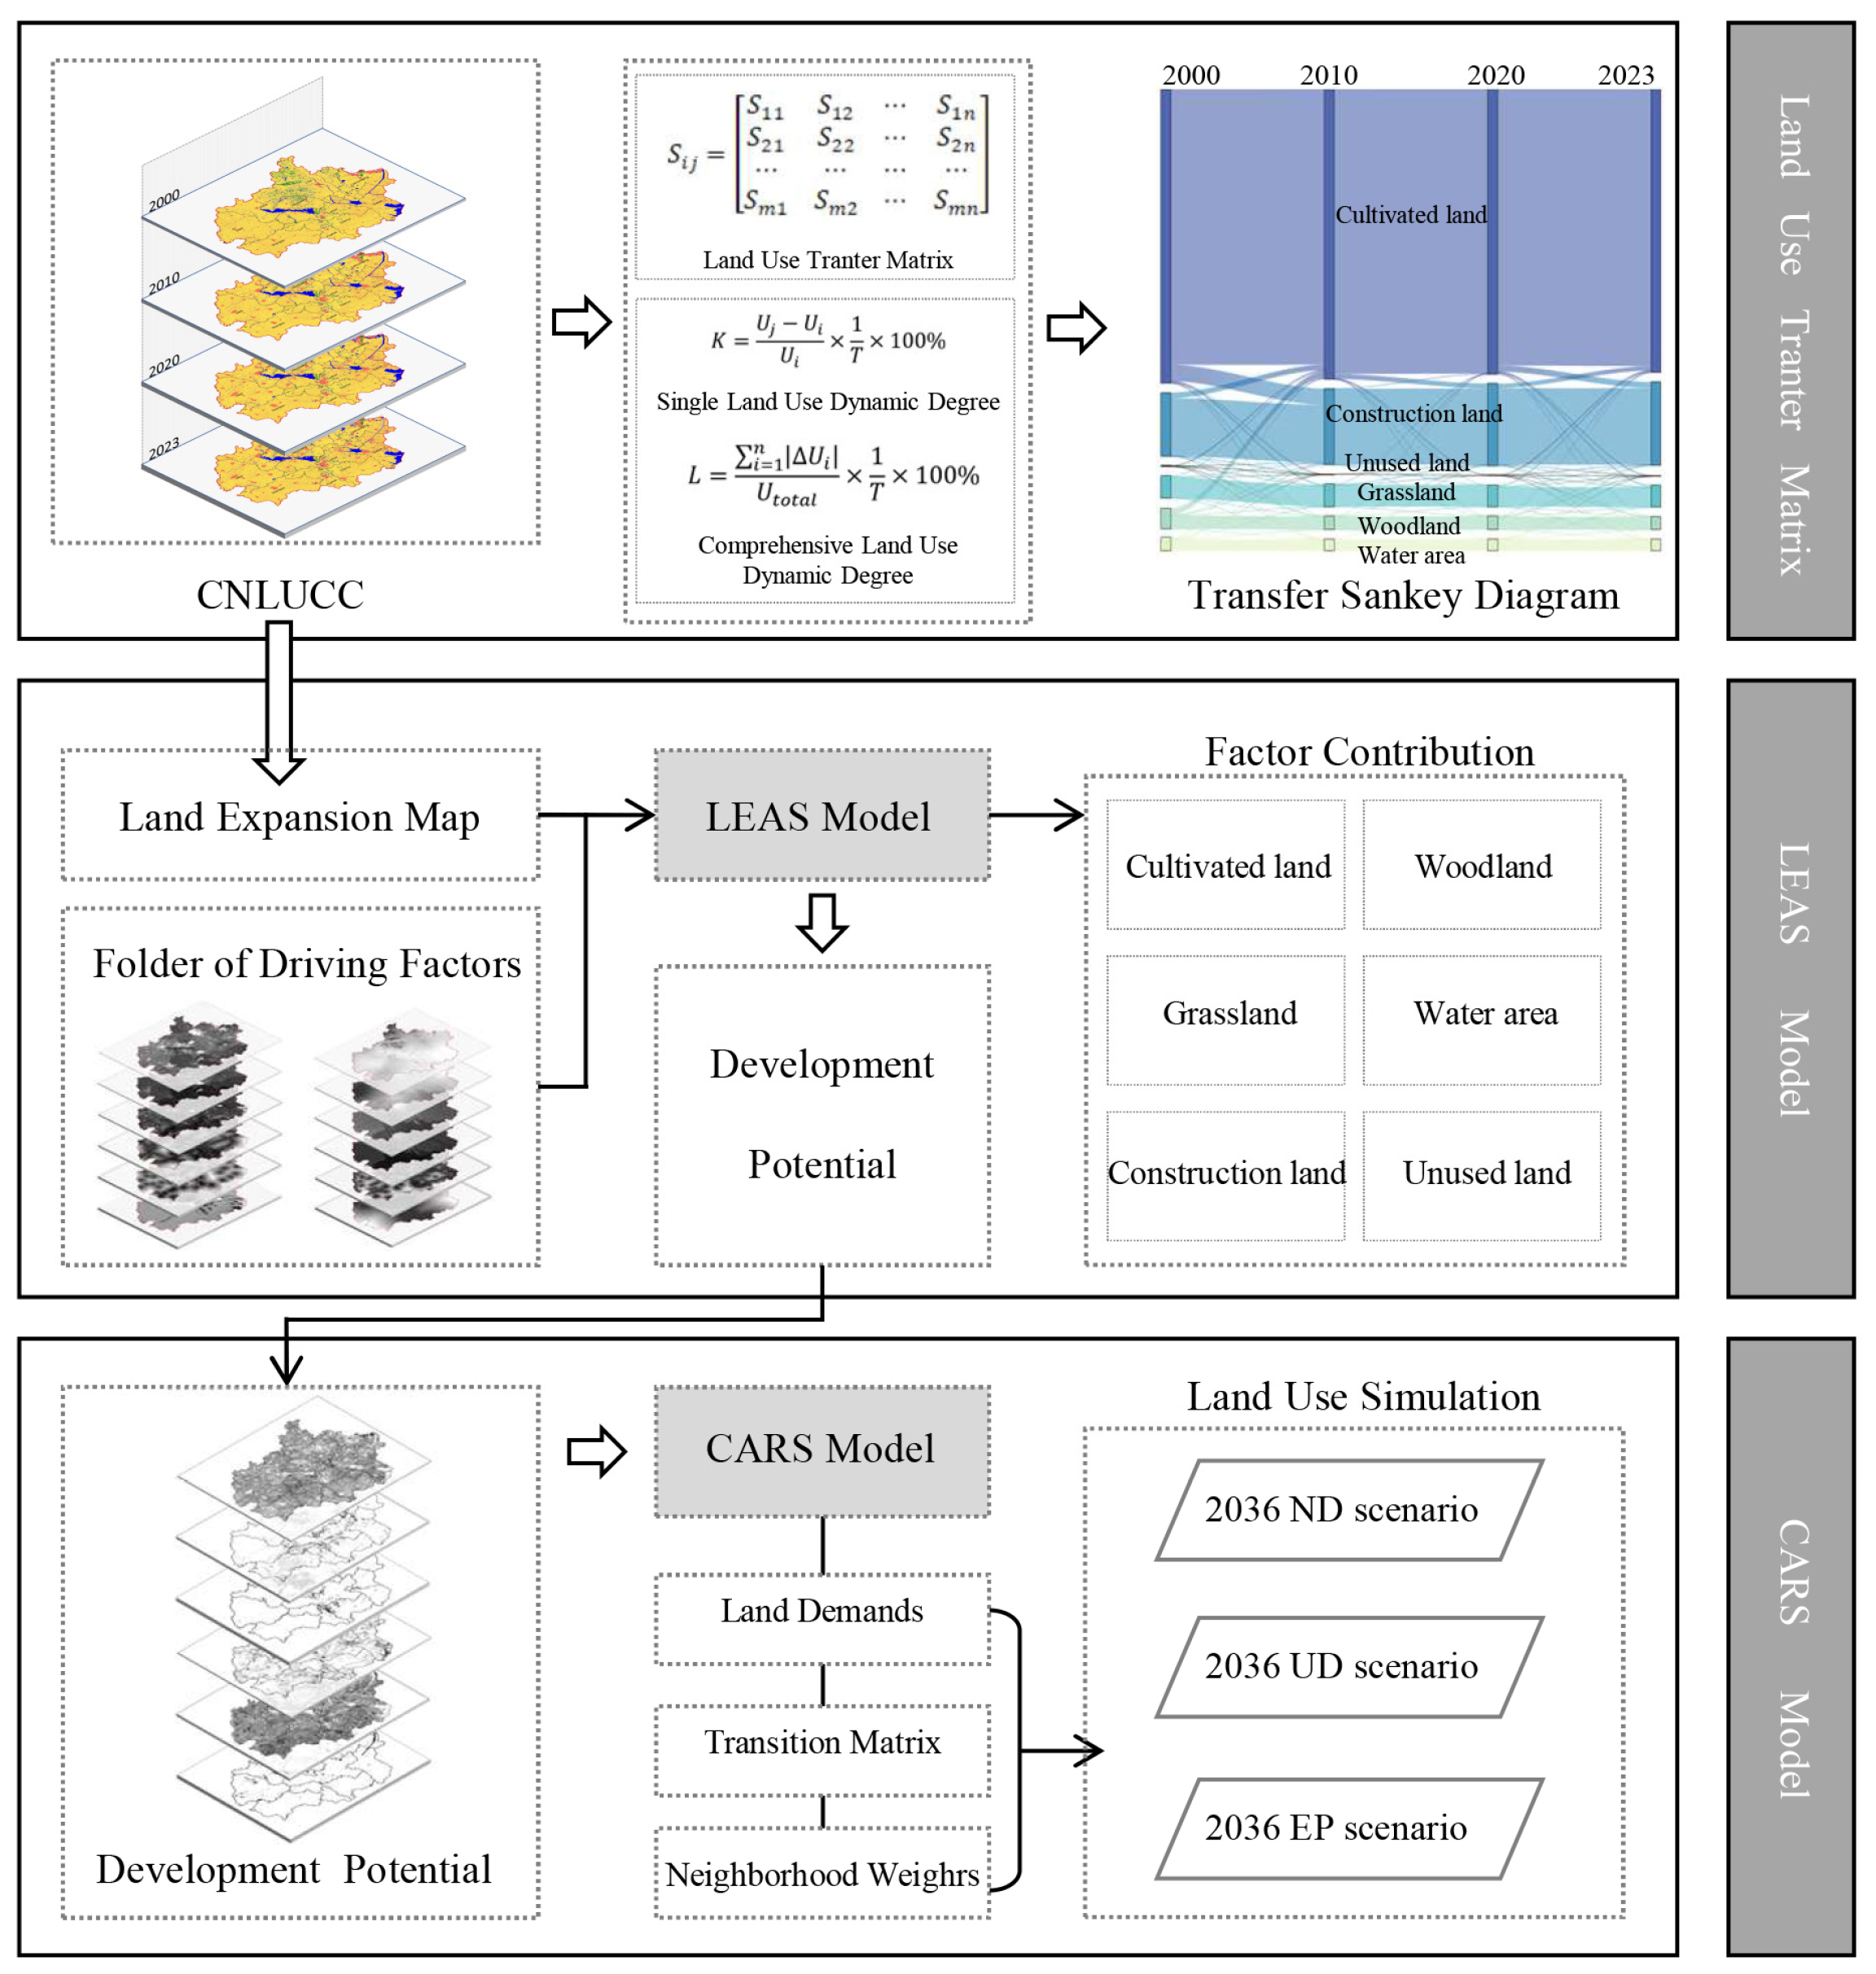
This investigation takes a methodological framework that has two main elements. The land use transfer matrix is the basis for the Markov model, where it is possible to quantify the transition probabilities and represent spatial patterns of land use change. The Patch-generating Land Use Simulation (PLUS) model, which is an upgraded version of the FLUS framework, developed by China University of Geosciences (Wuhan, China), helps simulate the land-use dynamics by using its main components: Land Expansion Analysis Strategy (LEAS) and Cellular Automata based on Multiple Random Seeds (CARS). Detailed methodological procedures adopted in this investigation are shown in Figure 2.

2.3.1. Land Use Transfer Matrix

Through documentation of the proportion or area transferred between different land use categories from 2000 to 2023, the land use transition matrix reveals dynamic inter-category transformations [53]. This matrix appears in the following form:
S ij = S 11 S 12 S 1 n S 21 S 22 S 2 n S m 1 S m 2 S mn
S: Total land area. n: Number of land use categories. i, j: Land use category at the start (i) and end (j) of the period. S i j : Area or proportion of land converted from category i to j.

2.3.2. Land Use Dynamic Degree

Land Use Dynamic Degree is an indicator used to quantify the rate of change in the area of each land use type within a study area. It includes the Single Land Use Dynamic Degree and the Comprehensive Land Use Dynamic Degree [54,55].
(1) Single Land Use Dynamic Degree (SLUD)
The Single Land Use Dynamic Degree expresses the rate of change in the area of a specific land use type over a defined period. The formula is as follows:
K = U j U i U i × 1 T × 100 %
U j is the area of the land use type at the end of the study period. U i is the area of the land use type at the beginning of the study period. T is the length of the study period in years.
(2) Comprehensive Land Use Dynamic Degree (CLUD)
The Comprehensive Land Use Dynamic Degree describes the gross annual change intensity of land use for the study region as a whole within a defined period. Specifically, it measures the annual rate of total land area that is converted to other land use types [54,56]. The formula is given below:
L = i = 1 n U i U total × 1 T × 100 %
U i denotes the area difference for land use type i between the start and the end of the study interval; calculations adopt the magnitude | U i |. The variable n represents the number of land use classes, U t o t a l indicates the overall land area of the study region, and T refers to the duration of the interval (years).

2.3.3. PLUS Model

(1) Selection of Driving Factors
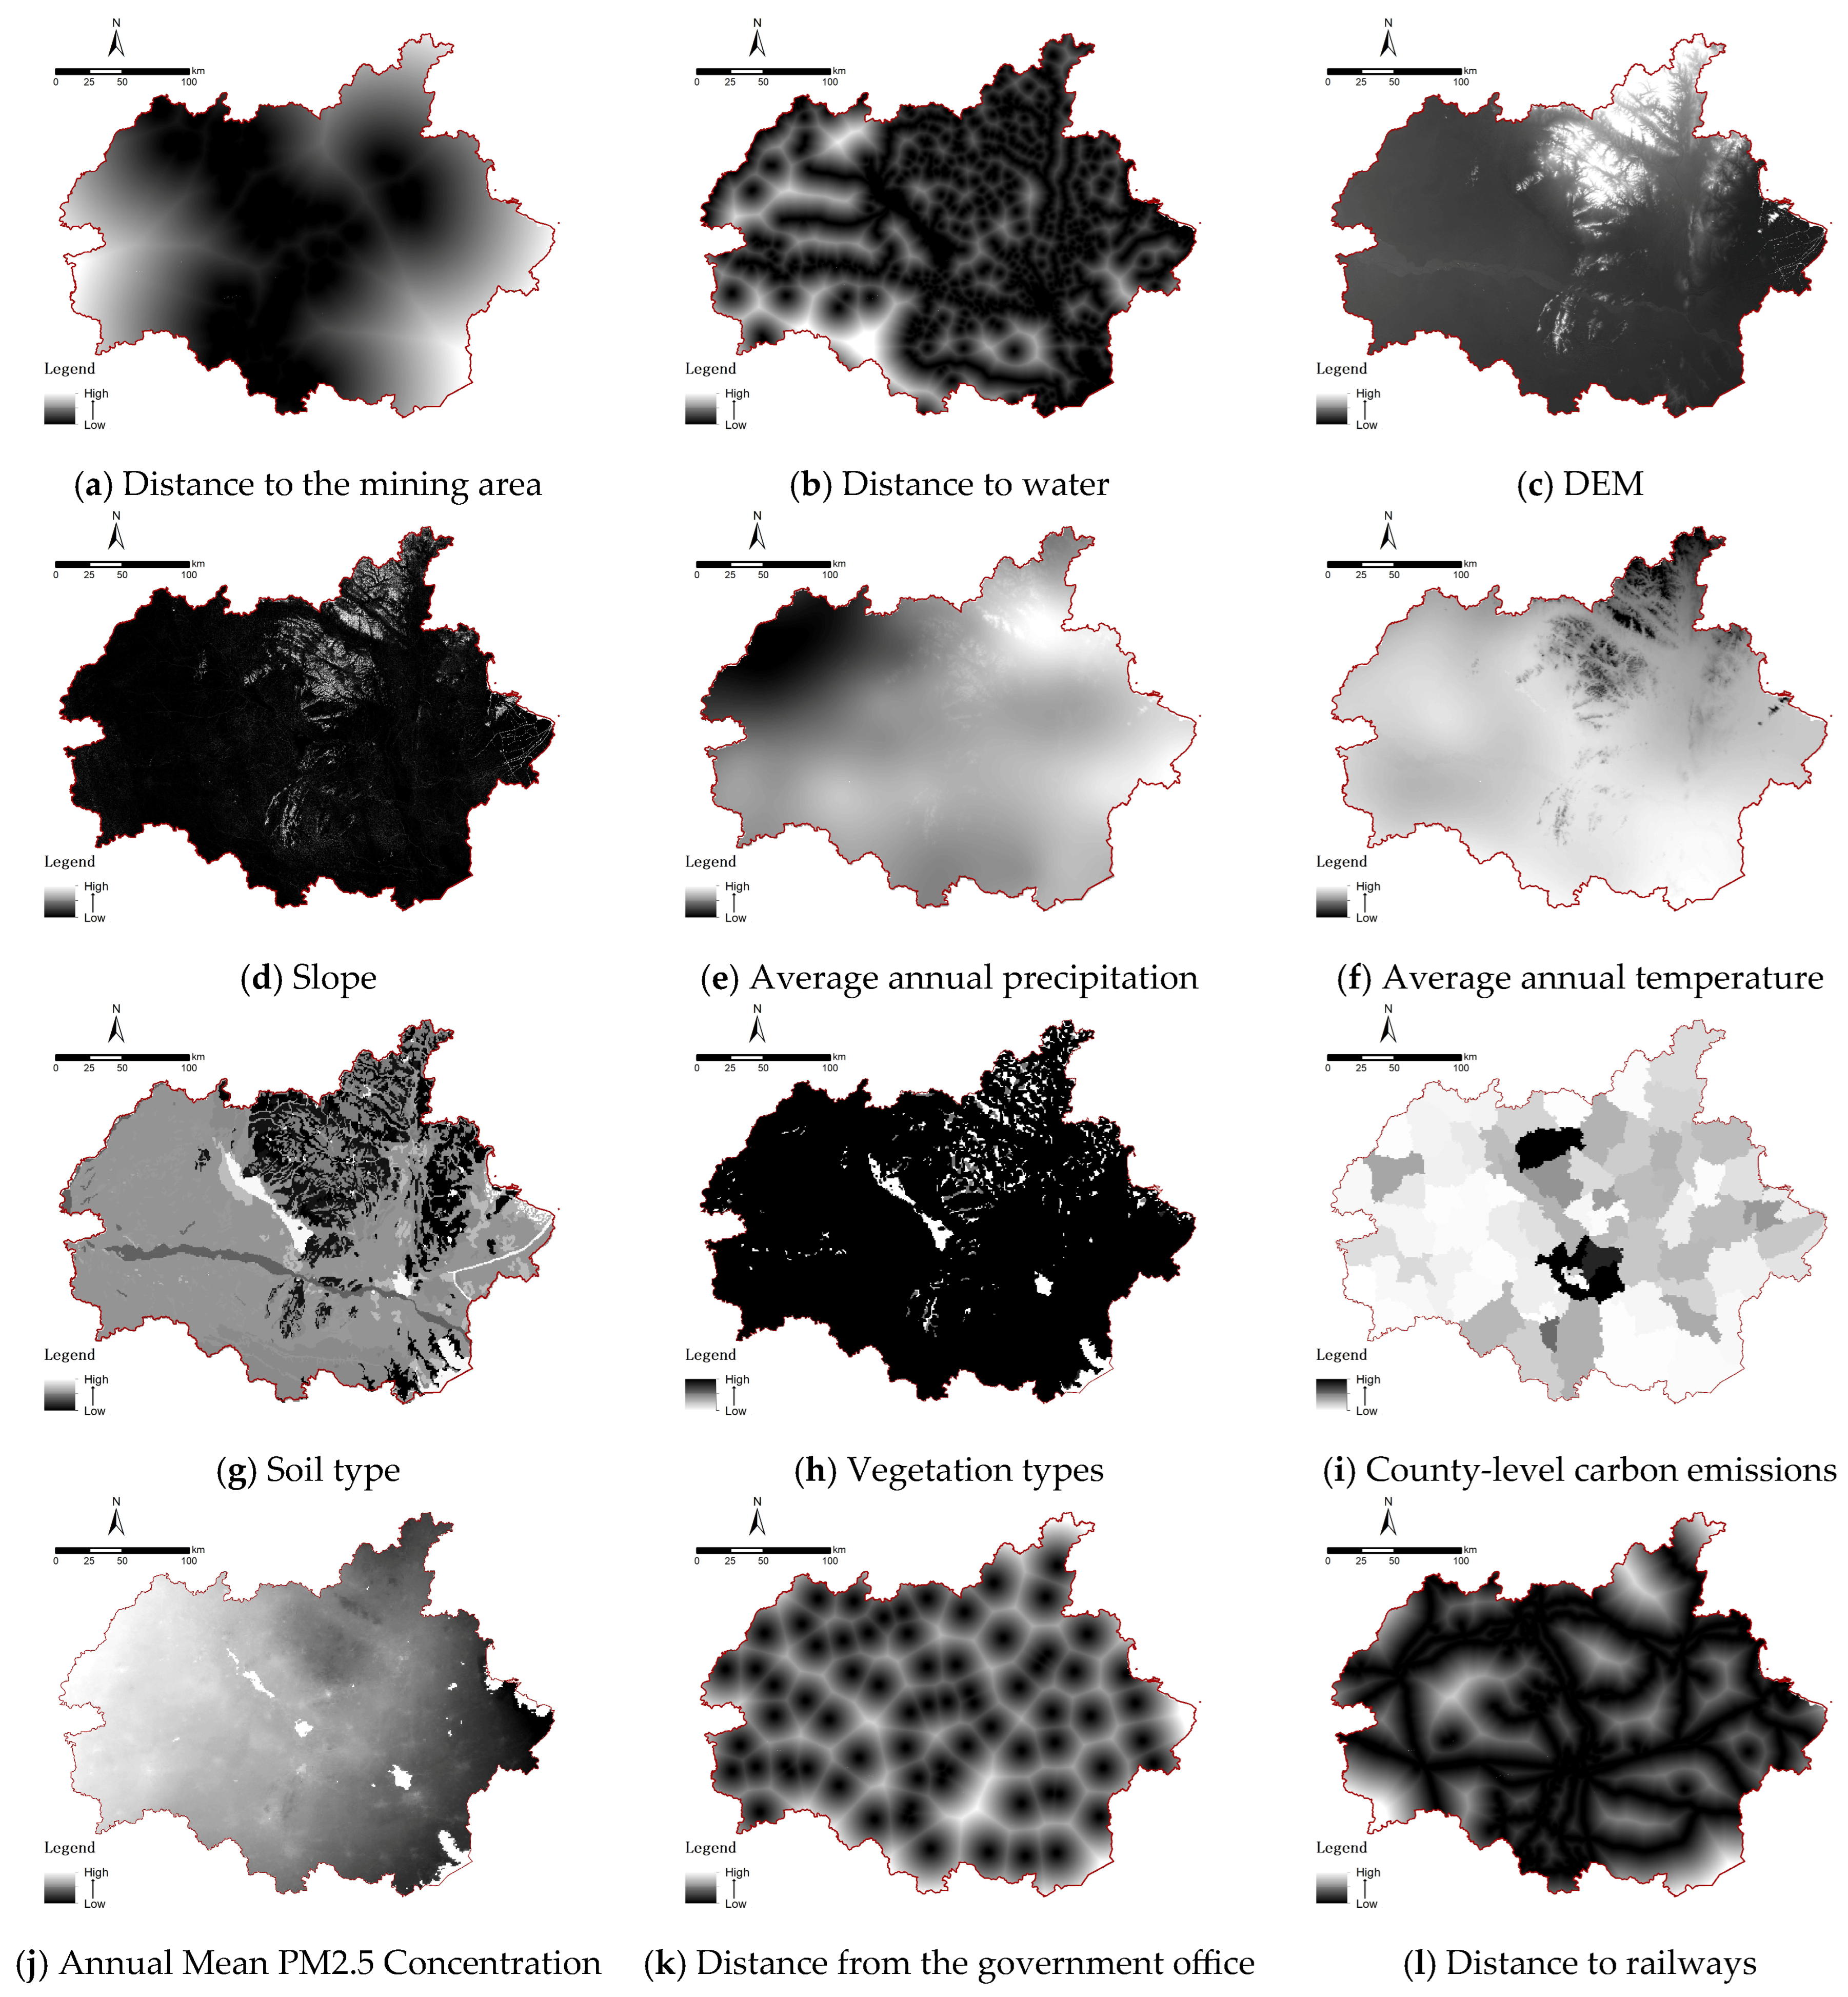
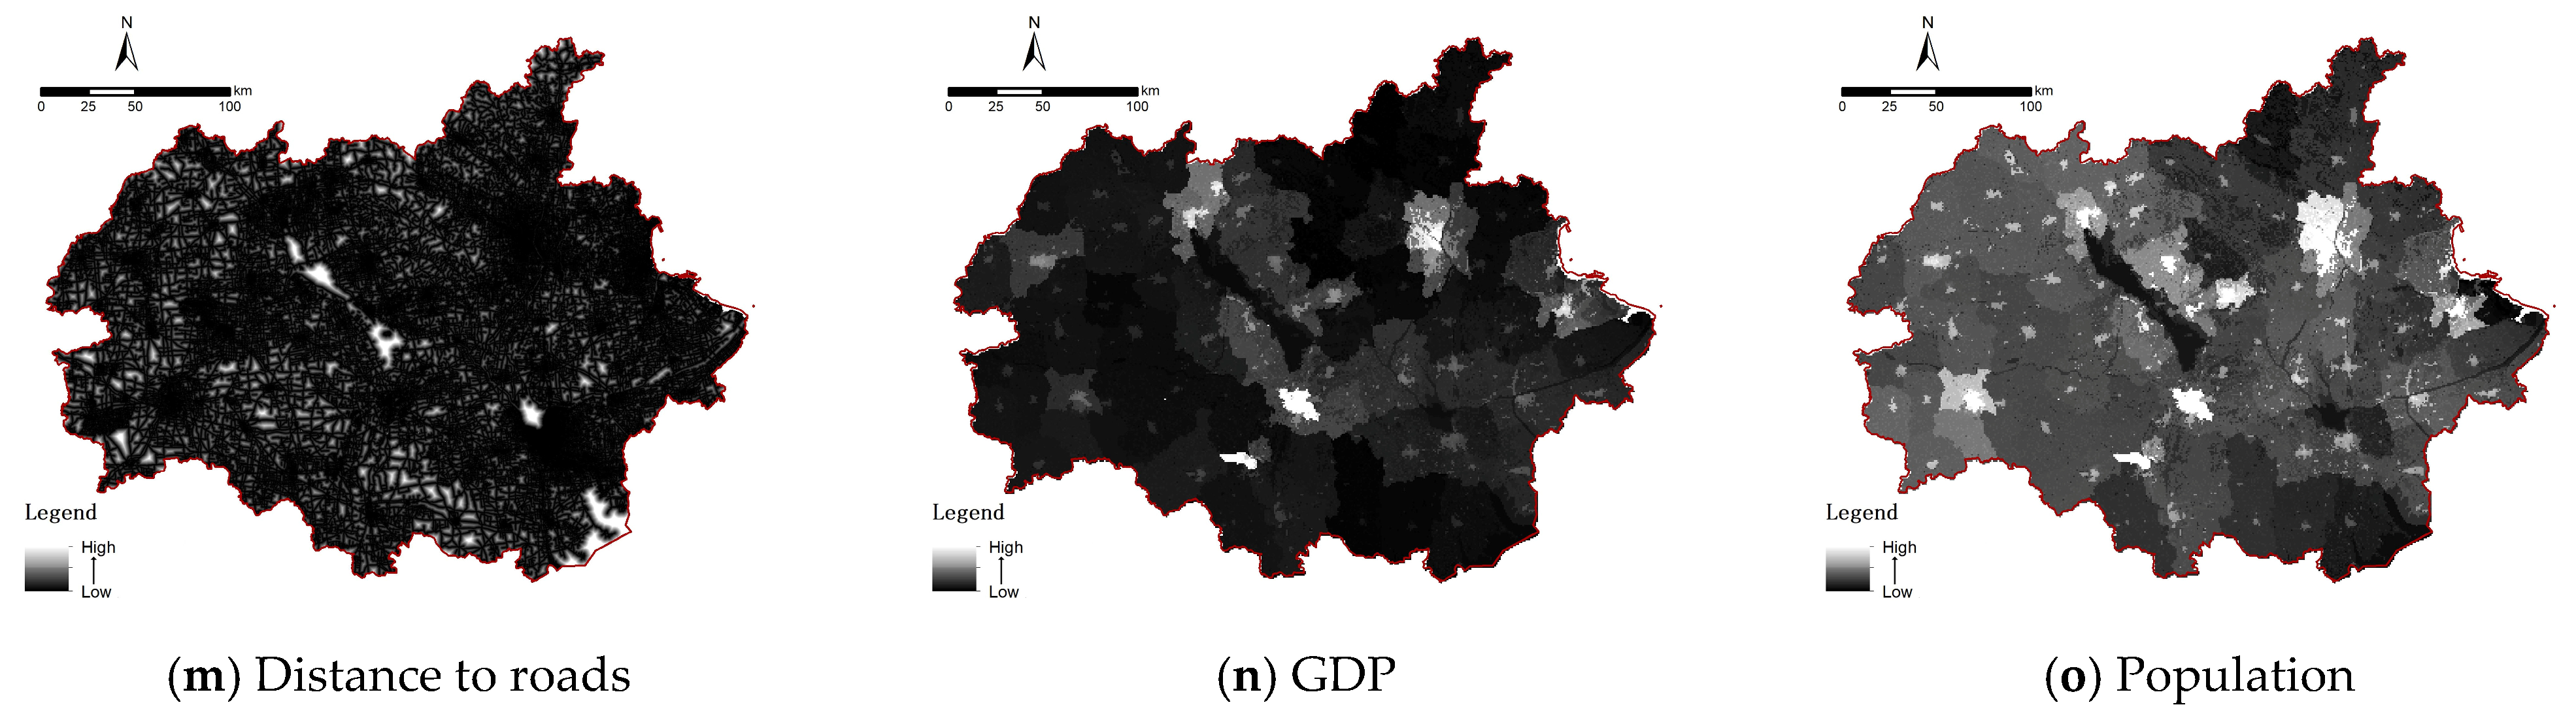
Considering the characteristics of the region and data availability in the HEZ and taking into account the results of previous investigations, 15 driving factors were identified in two categories (Figure 3). Among the variables are natural environmental variables. These are well-known determinants of land suitability and ecological processes that include average annual precipitation, temperature, DEM, slope, soil type, distance to water, and vegetation types [57,58]. Particularly, distance with the mining area was introduced as a critical variable because of the nature of the study area, which is a coal-rich area, and the history of spatial impact of the mining activity on the land cover was well-documented. The other group is made up of socio-economic variables, including population density, GDP, distance to roads, distance to railroads, and distance to the government office. Moreover, because of the nature of the HEZ as a coal-abundant area, in which coal mining and coal processing activities create a considerable amount of atmospheric pollution and carbon emissions [59], two more factors, annual PM2.5 mean concentration and county carbon emission, were included.
(2) Land Expansion Analysis Strategy (LEAS)
Sampling was done in the areas of expansion under different land use over two consecutive time periods, which were identified by overlay analysis. The application of the Random Forest algorithm was then used to generate influences that can cause growth in individual land use categories. This technique produced development probabilities in relation to different land use types, using the effect of every driving factor on the respective expansions in the period under study [42].
(3) CA based on Multiple Random Seeds (CARS)
Simulation of the spatiotemporal variations in the configurations of land utilization was carried out by means of the CARS module incorporated in the PLUS model. Pixel quantities representing individual land uses categories for the selected projection year are included in this component. By calibration of critical parameters that are the probability of random patch seeding, neighborhood weights, and the land use transfer cost matrix, this module projects the configurational development through a cellular automata process that is capable of generating the diverse random patches.
Three independent projection pathways for the selected future year (ten years ahead) were devised using the Markov model, taking the year 2023 as a reference point based on LUCC 2010–2023 datasets, considering the previous patterns of transformation in the land utilization of HEZ area, and respecting the guidelines of urban planning of its municipalities. These pathways include ecological protection (EP), urban development (UD) and natural development (ND). Distinct projection results for each of the pathways were obtained by using different configurations for essential parameters, such as the transfer cost matrix, the total land demand, and the weight of the neighborhoods. Table 2 gives the detailed land use transfer cost matrices associated with the individual pathways.

3. Results

3.1. Spatiotemporal Characteristics of Land Use Change

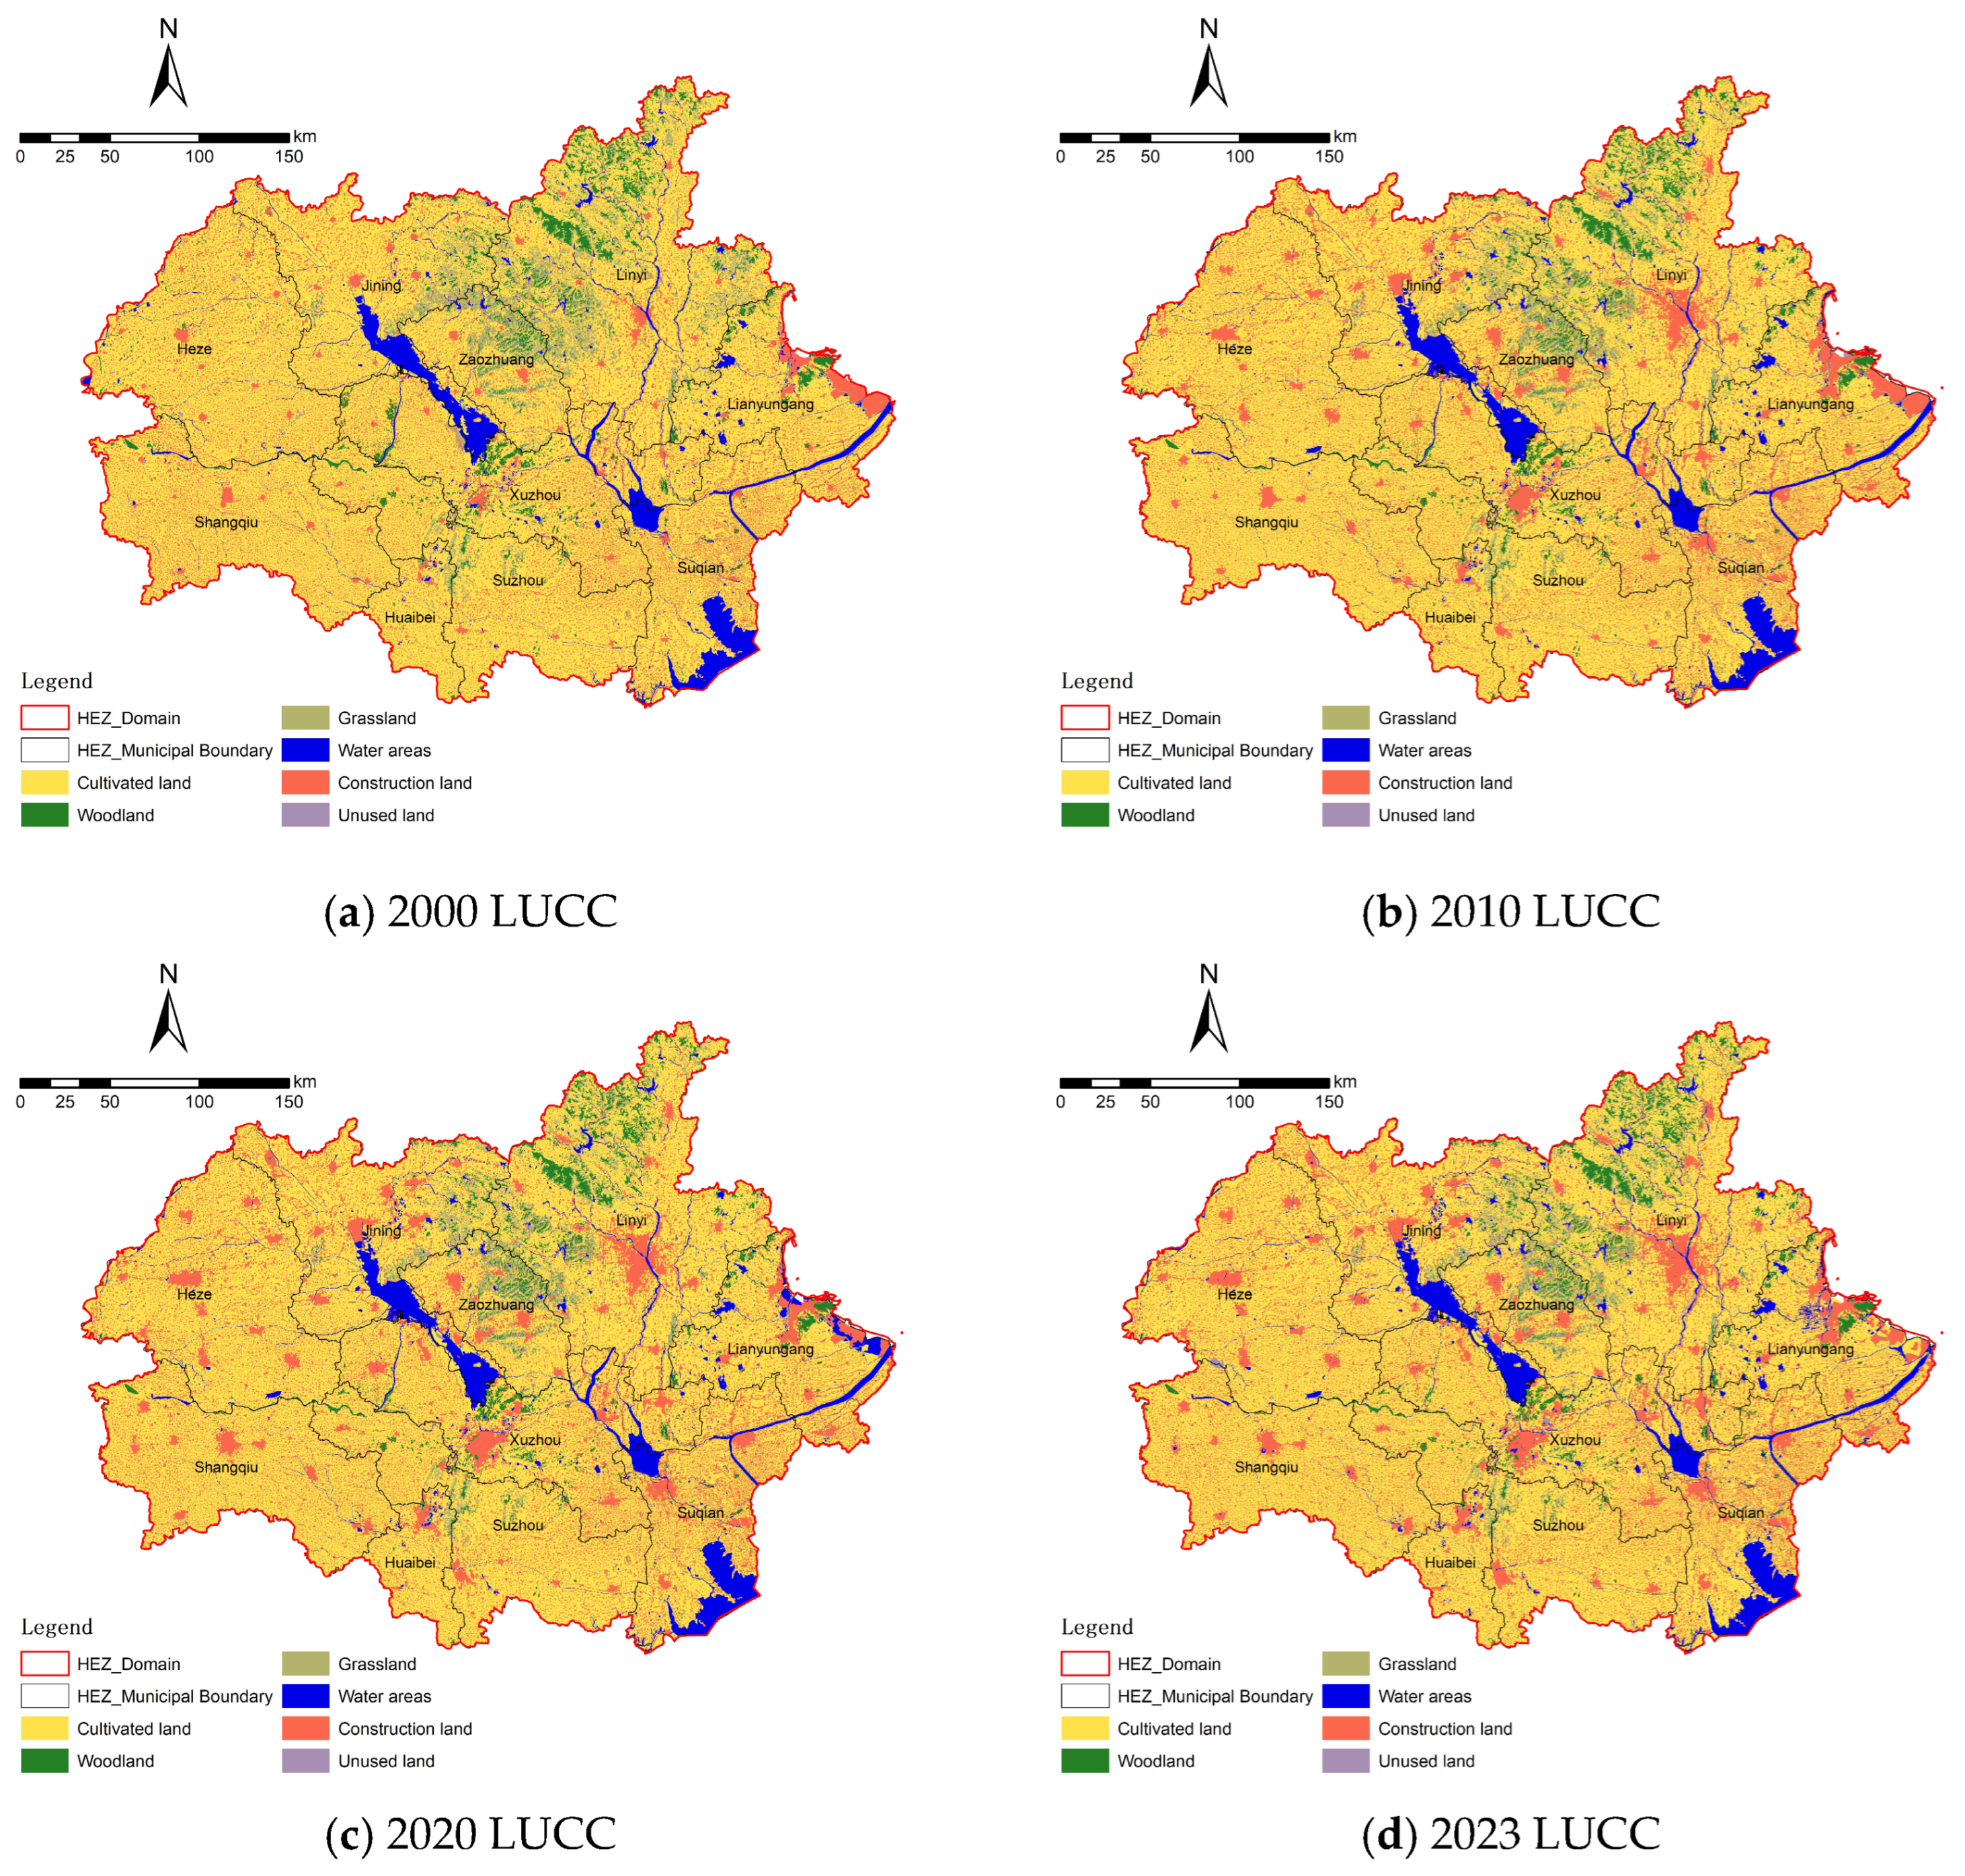
Figure 4 shows the spatial configurations of the utilization of land area in the HEZ in the years 2000, 2010, 2020, and 2023. Across the whole timeframe of the investigation, cultivated land remained the main architectural feature, with over 65% of the total territory covered by this feature, followed by woodland, water bodies, and construction land, in descending order. The region has been subjected to accelerated urban growth for the last 20 years, which has led to significant changes in the use of urban land. Construction land coverage rose rather strongly in all municipalities, mostly by the conversion of cultivated land. This growth was particularly apparent in scattered clusters of townships, especially in the south-eastern part of the study area in Jiangsu Province. Expansion in the central north–south Mining-Affected Zone was the weakest in contrast. Meanwhile, a number of large central cities emerged, which form a triangle core urban cluster with Xuzhou (Jiangsu), Jining (Shandong), and Suqian (Jiangsu) as the key growth areas. These changes altered the pattern of the urban agglomeration, which changed from a single-center pattern dominated by Xuzhou to a multi-nodal development pattern. Moreover, ecological land categories such as grassland and woodland experienced limited variations but were still concentrated mostly in the northern Taiyi Mountains and their extensions into the central-southern sections of the HEZ. This distribution pattern indicates a higher abundance of it in the northern regions than the relative scarcity in the southern zones.
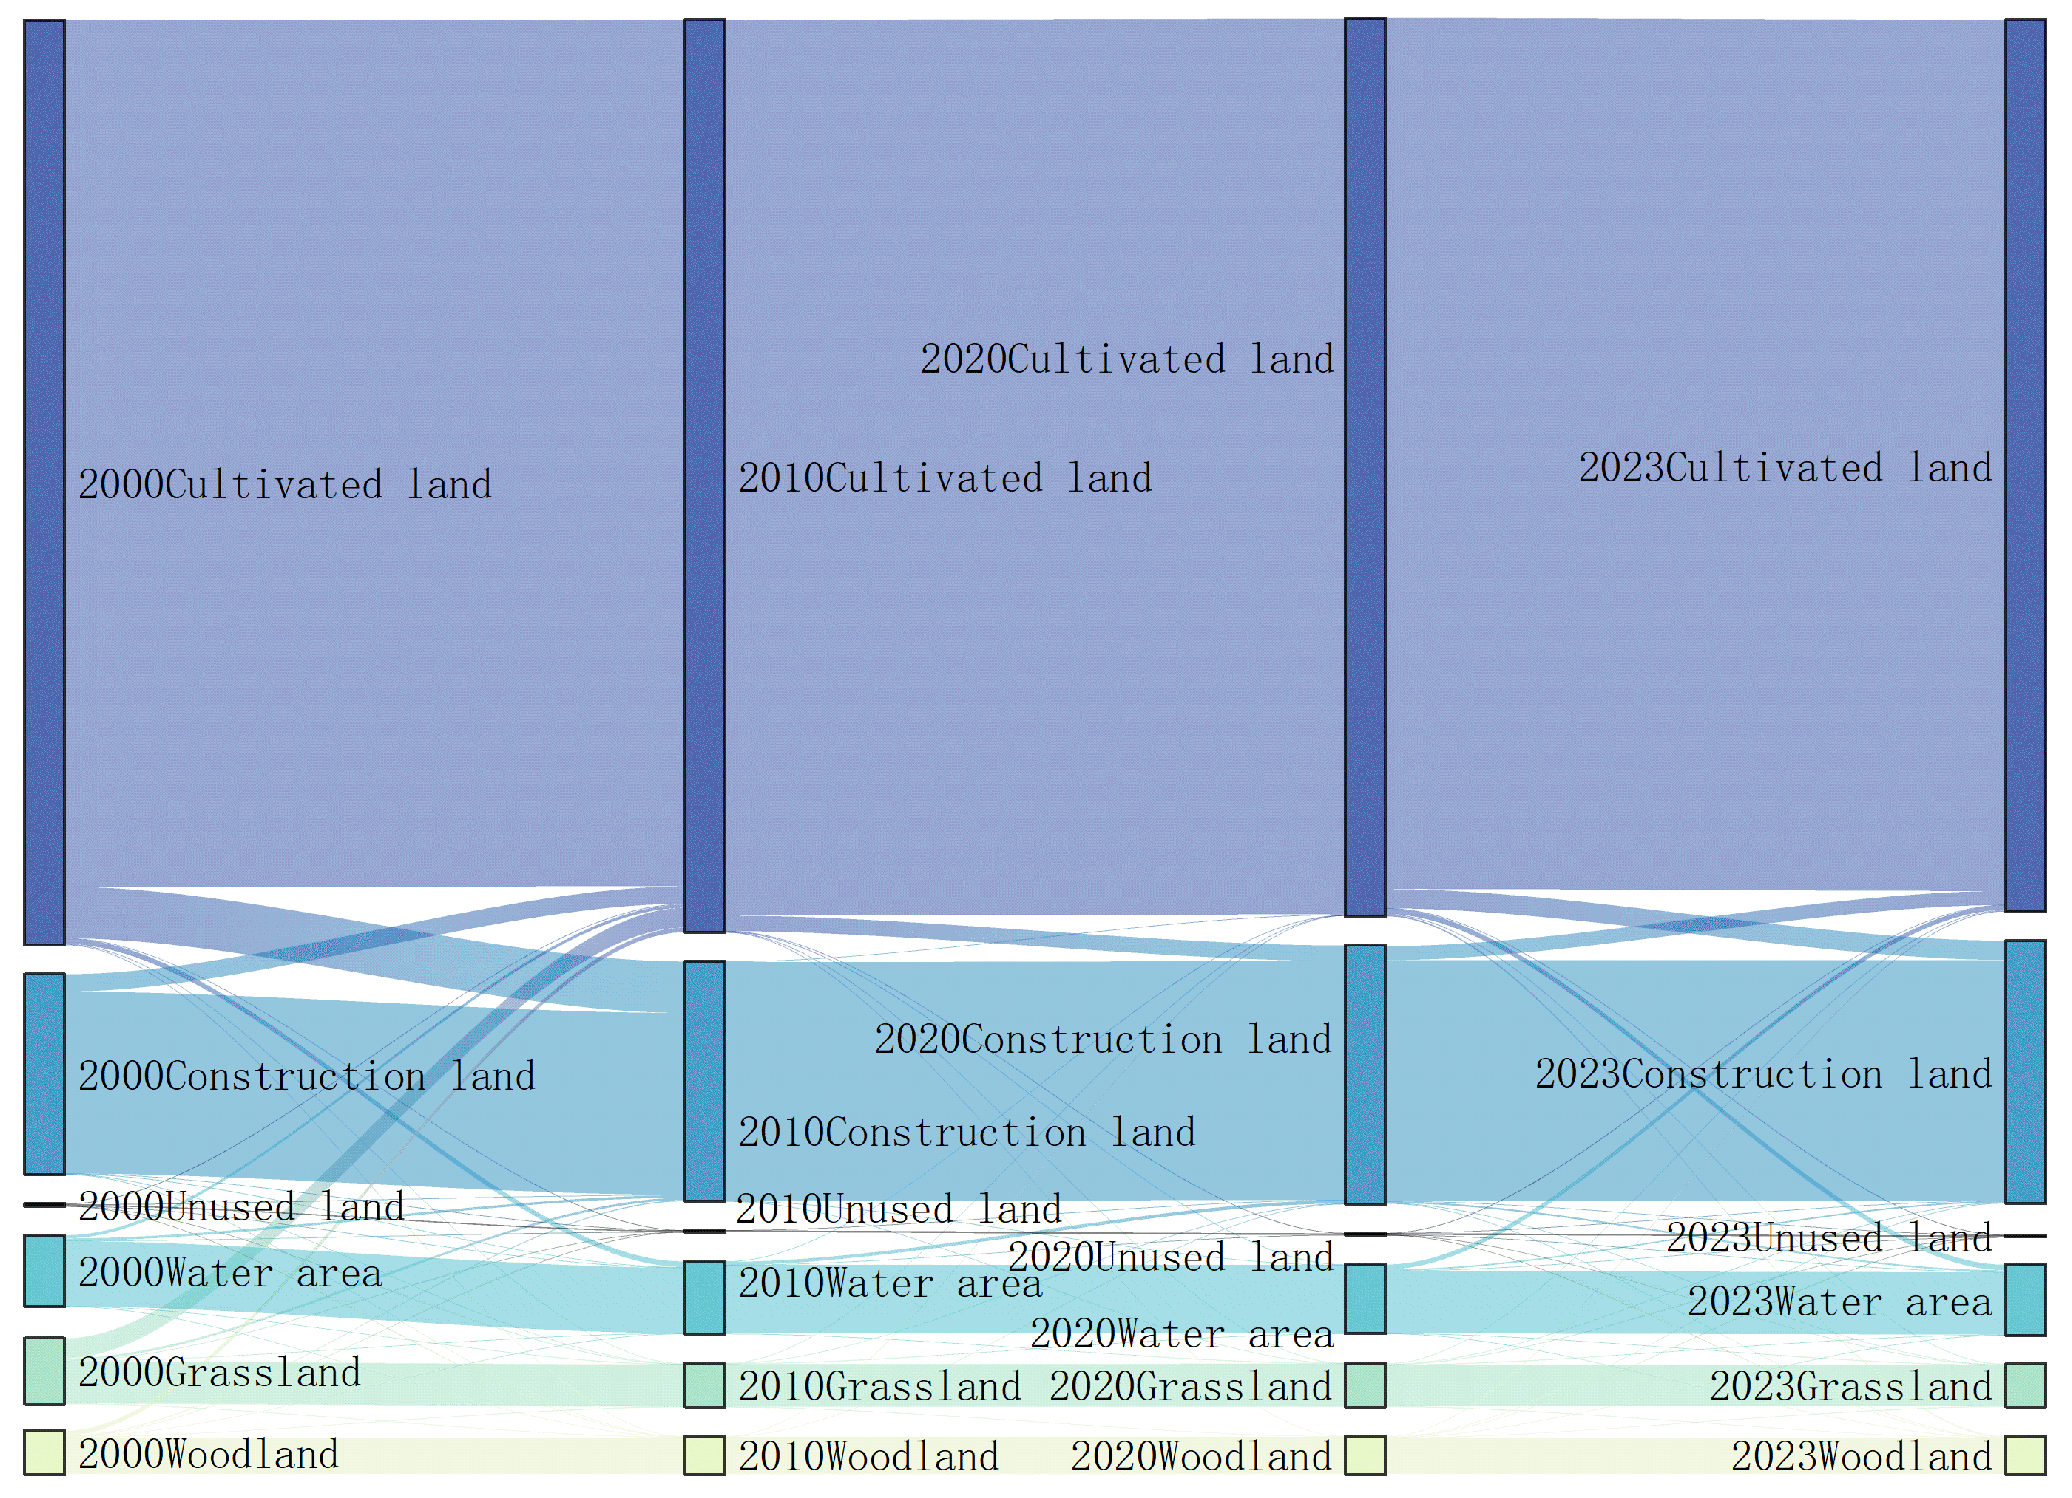
Land use transfer matrices for the three time intervals were calculated using datasets of the four selected years. These matrices helped create Sankey diagrams of land use conversion for the phases of 2020–2023, 2010–2020, and 2000–2010 (Figure 5). Observations show that large changes took place in the composition of land utilization of the HEZ starting from the year 2000, which mainly involved a shift from cultivated land to construction land. With regard to the variation magnitude, the period of 2000–2010 showed the greatest magnitude of land use alteration, followed by attenuation in later stages.
An integrated analysis of the Sankey diagrams and the rate of land change table reveals the following dynamics (Table 3):
(1) 2000–2010: This period had the highest rate of land use change with a Comprehensive Land Use Dynamic Degree of 0.58%. The principal contents of transferred land were cultivated land and grassland, which lost 705.74 km2 and 1592.10 km2, respectively. Construction land became the main beneficiary of transfers with an increment of 2670.92 km2, while the changes in the unused land and water bodies remained negligible. Within the transfer composition, there is a close to 3767 km2 change from cultivated land to construction land. The most important destination for outflows from woodland and grassland remained cultivated land, and respective transfers amounted to 345 km2 and 1446 km2.
(2) 2010–2020: The rate of land change during this period was the lowest, with the Comprehensive Land Use Dynamic Degree at 0.28%. The conversion of cultivated land to construction land was, by far, the most common type of transition. According to the rate of land change, construction land and water areas had the highest change intensities of 0.61% and 0.56%, respectively. The conversion of cultivated land to construction land represented around 6.03 percent of the total cultivated land in 2020. The change in the water area was mainly because it was partly converted into construction land.
(3) 2020–2023: Land transfer rates rose again, mainly due to higher levels of interconversions between construction land and cultivated land. Furthermore, unused land had a Single Land Use Dynamic Degree of 0.35%, and this was the result of predominantly small changes of construction land into unused categories.
Over the period of 2000–2023, the HEZ underwent substantial urban expansion. Construction land exhibited persistent growth in total coverage, rising from 15,079.69 km2 to 19,216.14 km2, equivalent to a mean annual increase of 1.08%, chiefly sourced from cultivated land. Simultaneously, the partial conversion of grassland into cultivated land served to offset cultivated land reductions, ultimately contributing to a net decrease in ecological land extent across the HEZ.

3.2. Driving Factors of Land Use Change

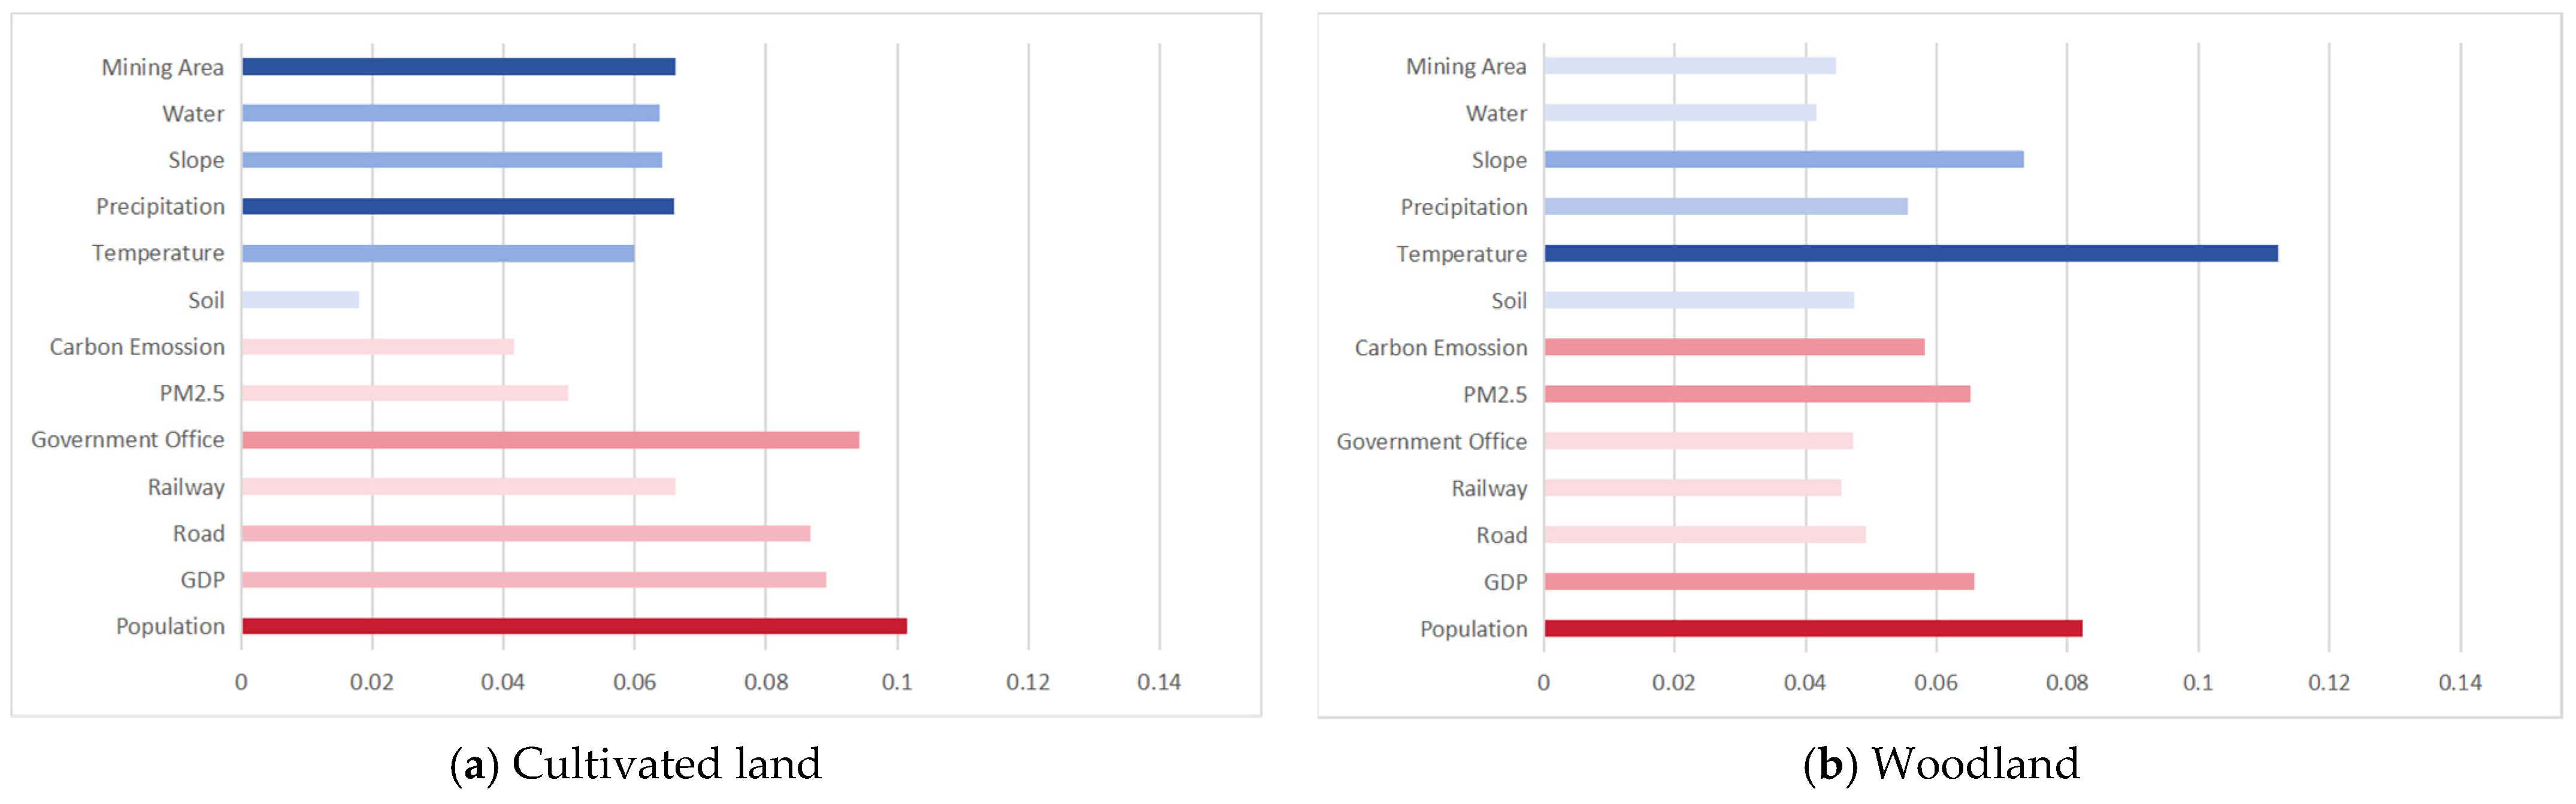
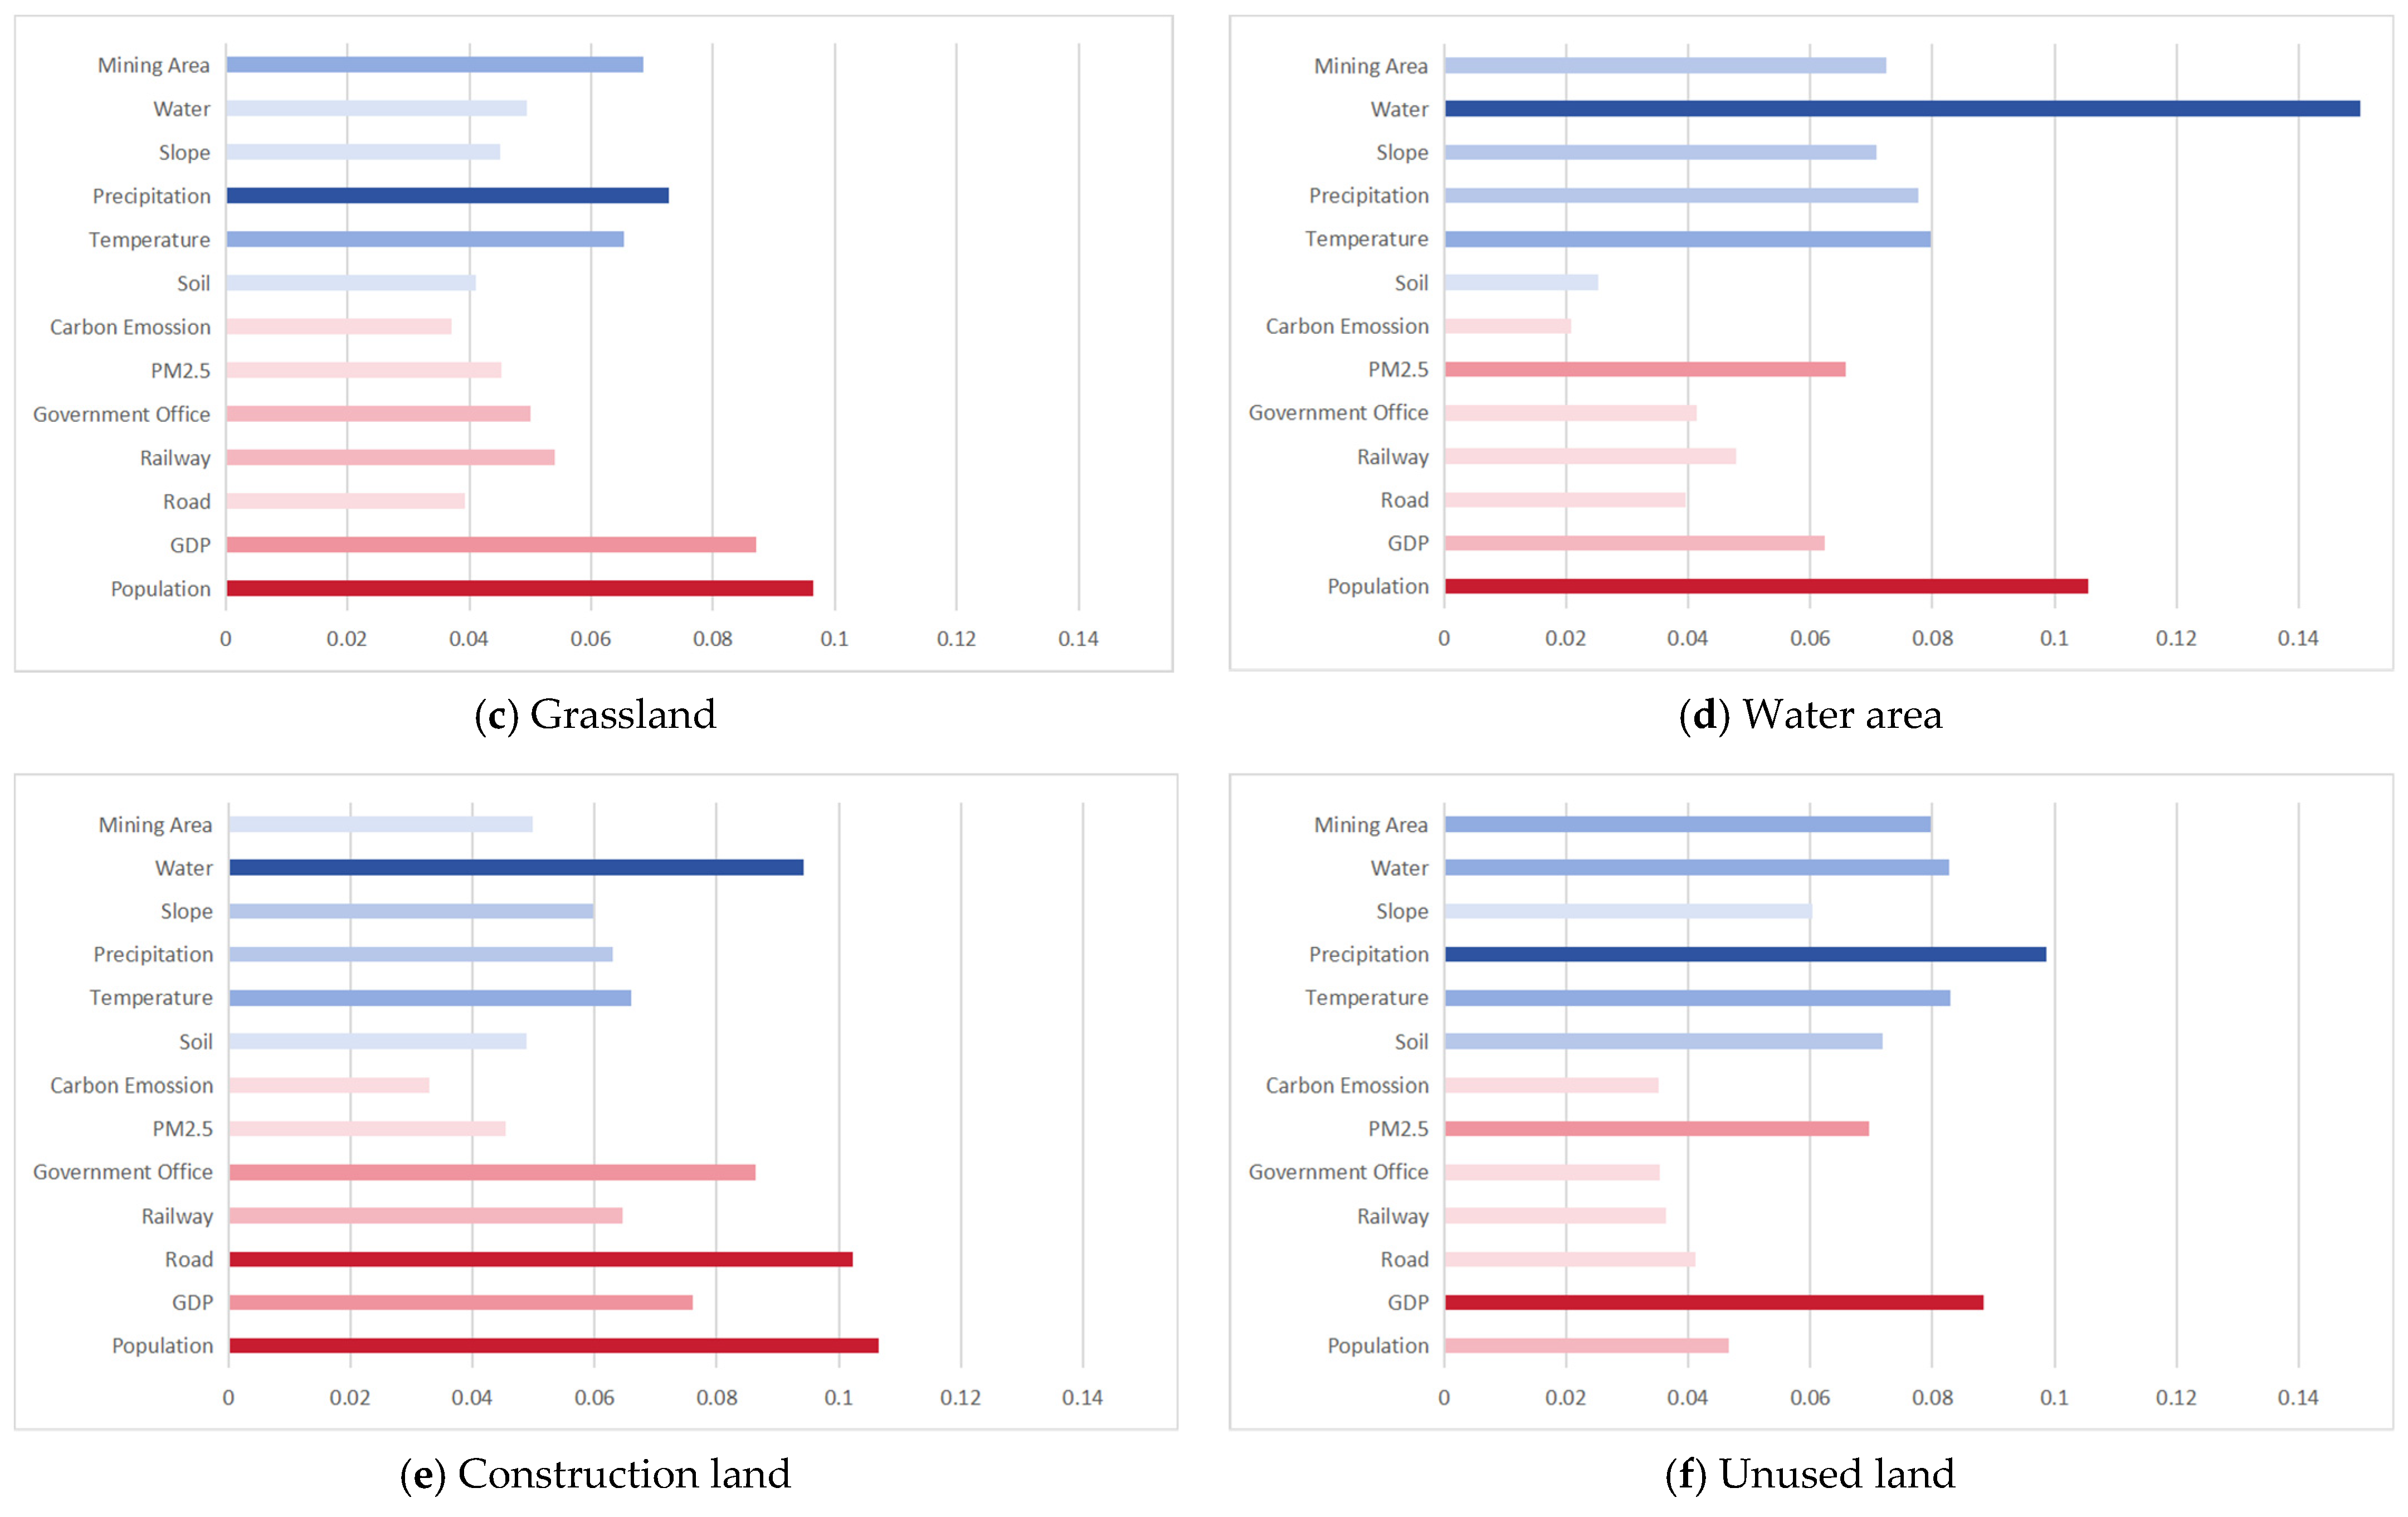
Fifteen driving factors were identified in this investigation (Figure 5) and classified into natural environmental factors and socio-economic factors groups. Contribution rankings of these factors toward growth across the six land use categories were derived from outputs generated by the LEAS component of the PLUS model. For enhanced comparative visibility, visualized representations omitted the least influential element (vegetation type) together with the common dominant factor (DEM) (Figure 6).
For the expansion of cultivated land, population density had the highest contribution (0.1016), followed by the distance from the county government office (0.0943). Overall, the contribution of socioeconomic factors was slightly higher than that of environmental factors. Among the latter, the contributions of individual factors, with the exception of soil type, were relatively similar, ranging around 0.06. This means that the changes in cultivated land were largely caused by human activities.
Some similarities were observed in the changes in ecological land types, such as woodland, grassland, and water area. Across all three types, the influence of environmental factors consistently outweighed that of socio-economic factors. Among the environmental factors, temperature (woodland: 0.1122, grassland: 0.0654) and precipitation (woodland: 0.0556, grassland: 0.0727) were the major contributors, whereas population density (woodland: 0.0474, grassland: 0.0492) and GDP (woodland: 0.0659, grassland: 0.0871) were the secondary contributors among the socioeconomic factors. The expansion of the water area was mainly determined by closeness to already-existing lakes and river systems, with a contribution of about 0.1505.
Changes in building land were mainly caused by population density and proximity to roads, with the contribution values of 0.1065 and 0.1034, respectively. This also means that the socioeconomic factors’ contribution was higher than that of the environmental factors, thus showing a partial consistency with the case of cultivated land.
In contrast to construction and cultivated land, the contribution of environmental factors outweighed that of socioeconomic factors for unused land. Precipitation was the highest contributing factor (0.0987). Other influential factors included distance to mining areas, temperature, and distance to water bodies. Among the socioeconomic factors, the primary contributions came from annual PM2.5 concentration (0.0696) and GDP (0.0883). This suggests that the status and conversion potential of unused land are primarily determined by its natural suitability.

3.3. Multi-Scenario Land Use Simulation

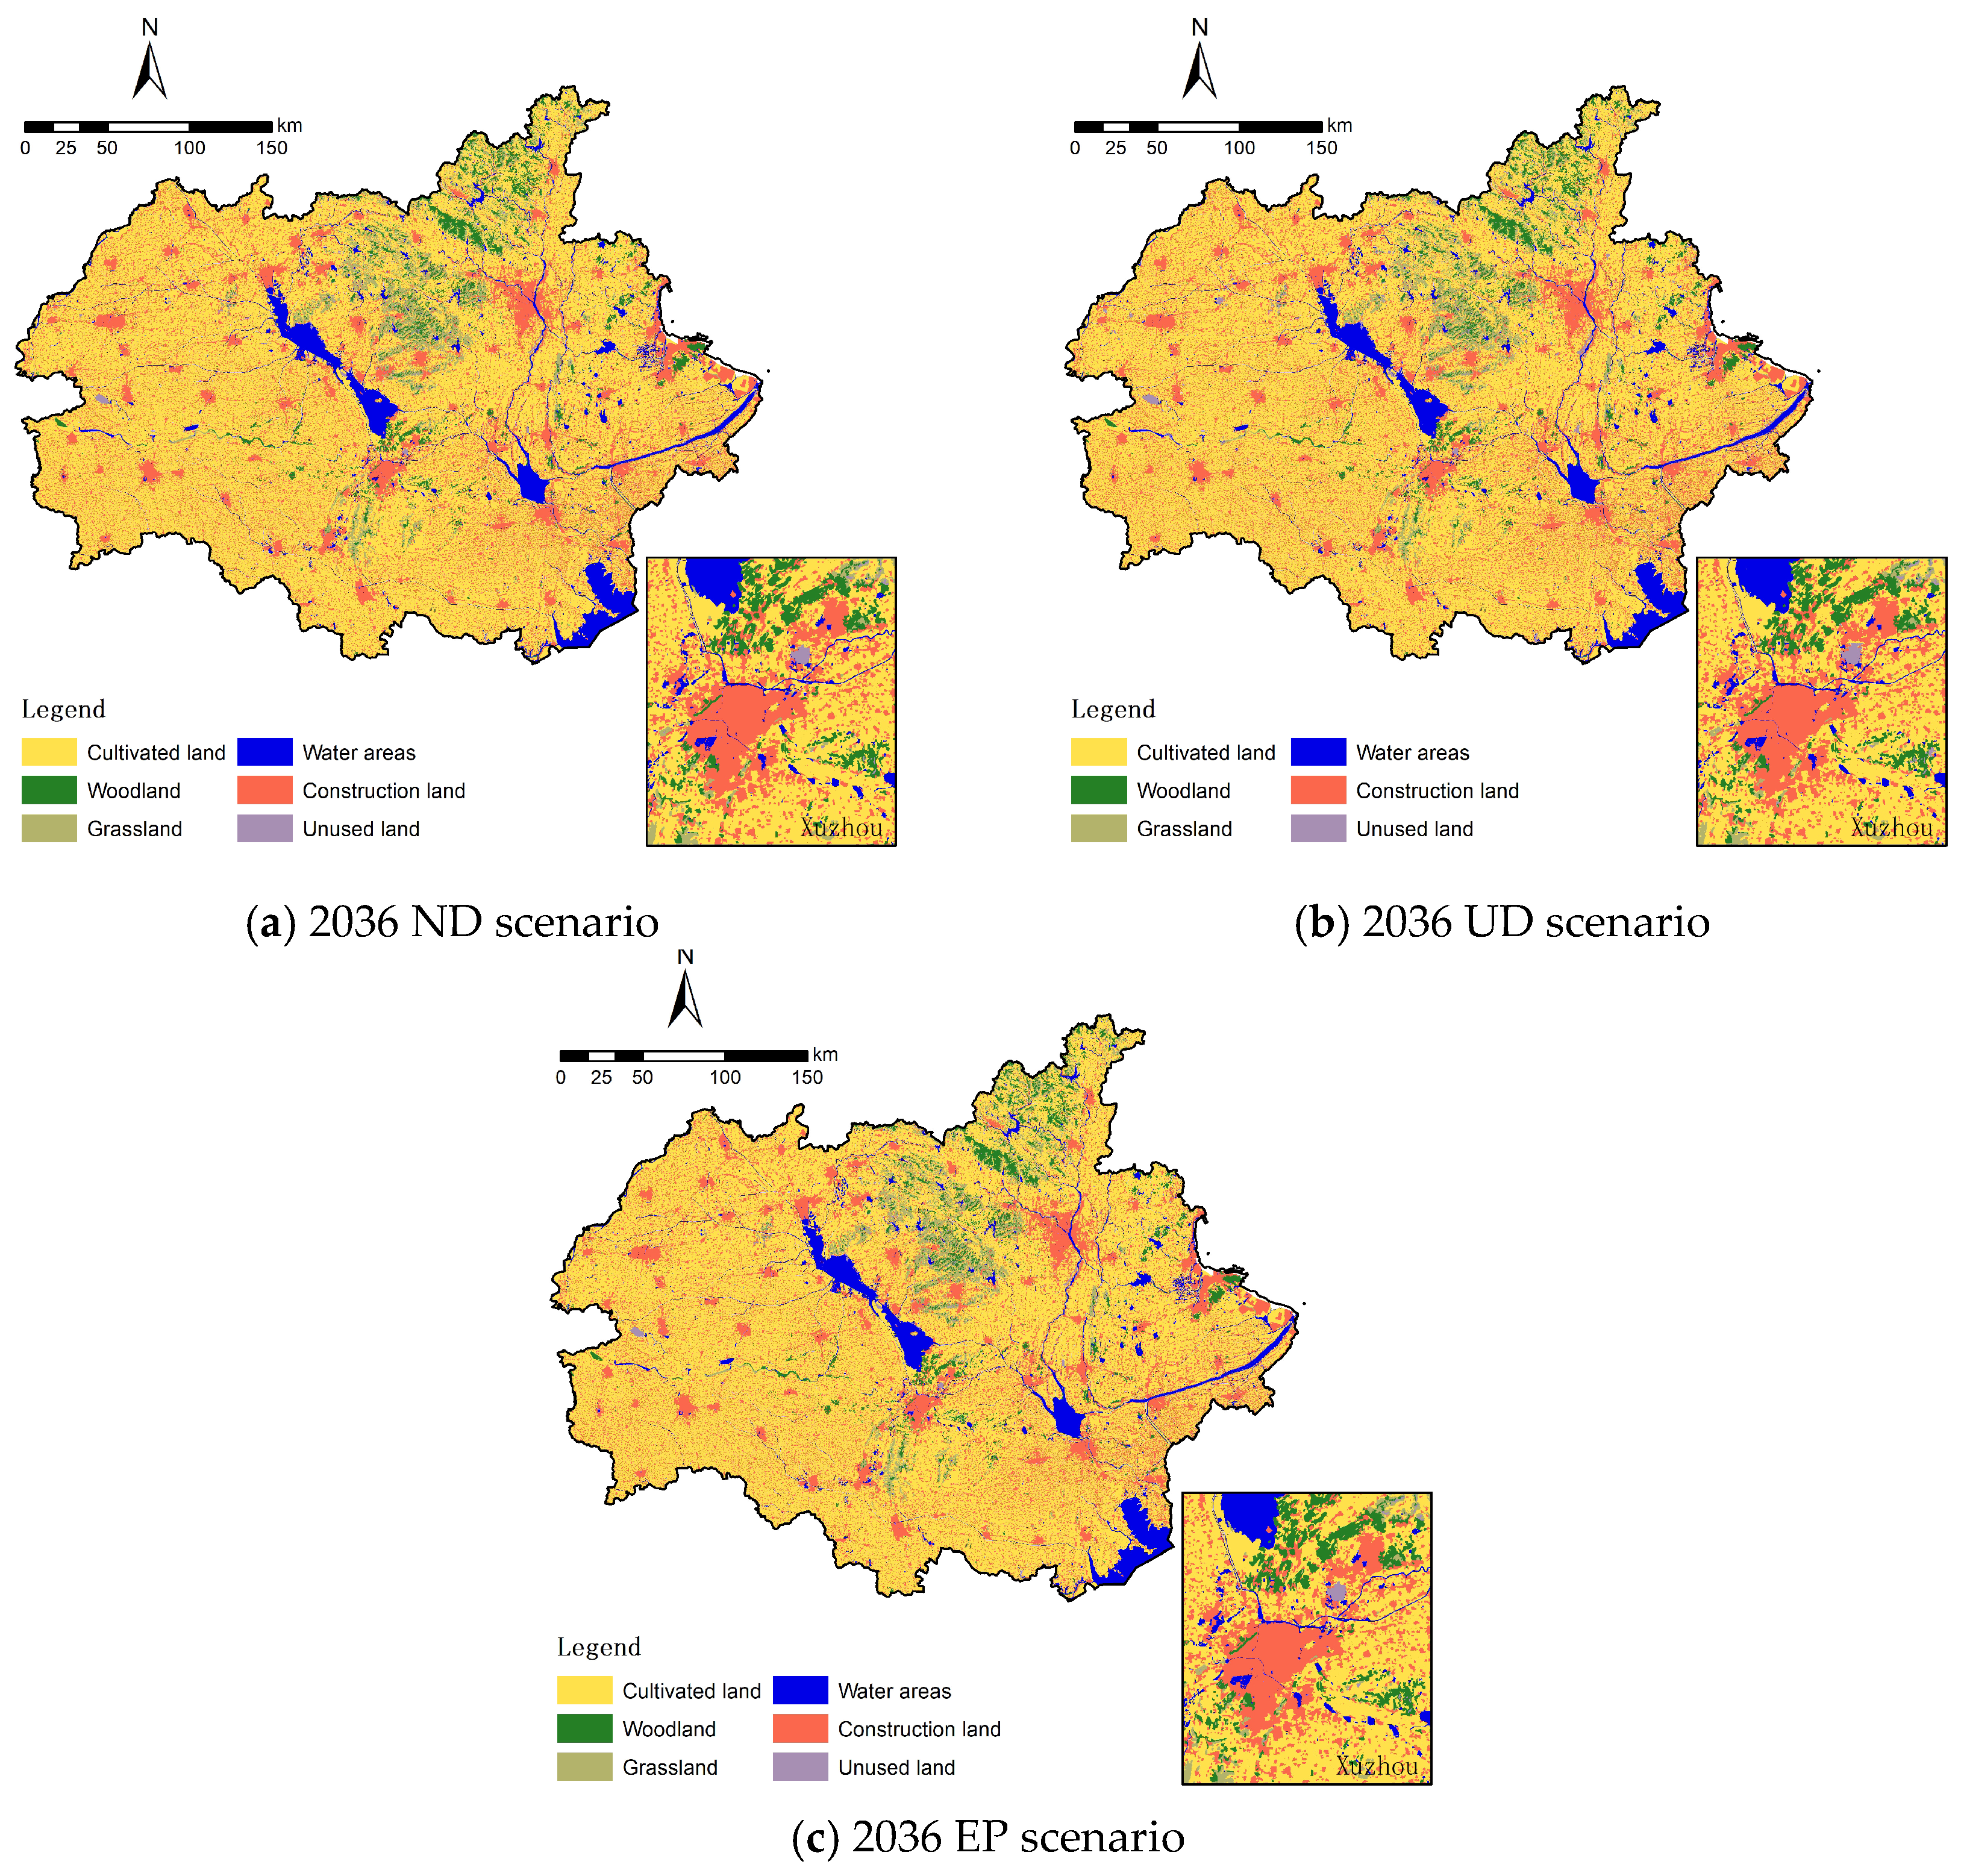
Utilizing the PLUS model together with land utilization datasets covering 2000–2023, projections of spatial configurations for land categories in the HEZ by 2036 were generated across three scenarios, presented in Figure 7. Area variations among land categories from 2023 to 2036 under individual scenarios receive quantitative representation in Table 4. To some extent, the three scenarios share common trends in future land development. Urban construction is most prominent in the eastern coastal towns of the HEZ. In particular, with the growing importance of Lianyungang City, the original triangular core urban cluster is evolving into a new central urban group structure centered around four cities: Xuzhou, Linyi, Suqian, and Lianyungang. At the same time, although the development focus is shifting eastward, a networked pattern is gradually emerging among cities and towns in the western part of the HEZ, indicating a significant increase in inter-city connectivity.
(1) Natural Development (ND) Scenario
This pathway generated land demand forecasts predominantly through the Markov Chain, excluding any incorporation of external policy constraints. Findings indicate that the Comprehensive Land Use Dynamic Degree attains its minimum value of 0.35% under this pathway, reflecting the least pronounced transformation across the three forecasted pathways. Cultivated land extent is forecasted to decline by 1643.70 km2 over the forthcoming decade, equivalent to 2.52% of the 2023 baseline. Additionally, the area of woodland is expected to decline partially. Land converted from these two types primarily transitions into construction land, water areas, grassland, and newly reclaimed-but-unused land.
(2) Urban Development (UD) Scenario
This pathway is the amplifier of urban expansion. Prioritization of economic advancement in approaches to development necessarily results in massive growth in the coverage of construction land. Accordingly, cultivated land extent is forecasted to experience a considerable reduction, with the anticipated loss equivalent to 2.96% of the 2023 baseline. Concurrently, ecological categories that include grassland and woodland display a sign of contraction (Single Land Use Dynamic Degree value of −0.27% and 10.08%, respectively). Particularly prominent is the 5.50% Single Land Use Dynamic Degree of unused land.
(3) Ecological Protection (EP) Scenario
This pathway sets up the land use transfer cost matrix to strictly prevent the expansion of construction land into ecological territories. Ecological rehabilitation programs, such as agricultural land conversion to grassland and forest, are provided with deliberate enhancement, thereby protecting the land categories in the form of water bodies, grassland, and woodland. From projections, it is determined that the growth areas across these three categories are 111.10 km2, 171.53 km2, and 19.86 km2, respectively. Construction land shows even greater slowing of growth velocity but remains a growing trend, as shown by the Single Land Use Dynamic Degree of 0.41%. Unused land coverage shows very little variation, such that such practices as the reclamation of approved construction reserves or expansion of subsidence zones are prevented. With respect to the aggregate transformation intensity, by reaching the maximum Comprehensive Land Use Dynamic Degree of 0.76%, the EP pathway represents the most pronounced alteration as compared to the other two forecasted pathways.

4. Discussion

This analysis shows that land use change in the Huaihai Economic Zone (HEZ), between the years 2000 and 2023, was marked by massive spatial reorganization, and this was largely reflected in the conversion of cultivated land to construction land and the transformation of a monocentric urban pattern with Xuzhou at the center to a polycentric network structure with Xuzhou, Jining, and Suqian. It is interesting to note that the central Mining-Affected Zone was characterized by rather slow urban growth, and the growth of unused land was directly connected to the spatial heritage of mining processes, including subsidence and industrial desertion. These results not only mirror the general urbanization path of breakneck growth but also highlight the special production-city integration pathway and the inherited spatial impacts of the resource curse in resource-seeking areas. The former refers to the distinctive spatial logic shaped by the co-evolution of mining activities and urban expansion, where industrial sites and residential areas developed in close proximity rather than following the conventional separation of production and living spaces. The latter manifests in the persistent land use constraints caused by mining-induced subsidence and abandoned industrial land, which continue to shape the region’s development patterns long after extraction activities have diminished.
Comparing the HEZ’s transition trajectory with international cases of resource-based region transitions helps to clarify its distinctive features. In Germany’s Ruhr area, large-scale coal mining largely ceased by the 1980s, which enabled a phased post-industrial transformation focused on cultural and recreational land uses [20]. In the United States’ Appalachia, federal climate policies drove a direct energy substitution from coal to solar [21]. In Indonesia’s Bangka Belitung Islands, ecosystem-oriented reclamation was prioritized for reforestation and agroforestry [22]. In contrast to these cases, the HEZ was found to remain in a co-existing phase, where coal extraction continued alongside urban expansion and initial ecological restoration efforts. This distinctive trajectory—mining not ceased, urbanization ongoing, and reclamation contending with active disturbances—shaped the region’s land use dynamics and highlights the need for spatially coordinated governance rather than single-pathway solutions.
The following discussion elaborates on the findings from four aspects: direction of land use structure adjustment, policy implications based on multi-scenario simulations, specific policy recommendations, and limitations of the study.

4.1. Direction for Land Use Structure Adjustment

The research shows that, over the past two decades, land change in the HEZ has mainly followed the pattern of “sacrificing cultivated land for construction land”. The region has also transitioned from a monocentric to a polycentric network model. This pattern is consistent with studies on rapid urbanization in developing economies. Notably, however, unlike the balanced polycentric agglomeration patterns typically observed in non-resource-based regions [60], the polycentric transformation in the HEZ reflects a distinctive spatial logic shaped by its resource endowment and the historical layering of mining-induced disturbances. Consequently, this shift is not only a typical feature of rapid urbanization but also reflects the unique “production-city” integration path of resource-based cities [61]. Unlike typical urban areas, the increasing amount of unused land in the HEZ is largely due to the spatial legacy of resource extraction activities, such as mining subsidence and industrial abandonment. Concurrently, the expansion rate of construction land within the central north–south Mining-Affected Zone is significantly slower than in the eastern and western regions. This indicates that, despite the accelerating regional urbanization, the negative spatial effects of the resource curse persist. On the other hand, the compensatory conversion of “grassland and woodland to cultivated land” to ensure food security has further intensified pressure on ecological land. Therefore, the future direction for land use structure adjustment should go beyond merely controlling land use scale and focus on the systematic optimization of the spatial functions and structure of the “mining-urban-rural-ecological” complex. This approach aims to fundamentally transform the territorial spatial pattern from “passively adapting to development demands” to “actively guiding functional synergy and sustainable development”.

4.2. Driving Mechanisms of Land Use Change

The contribution analysis reveals distinct mechanistic pathways through which different factor categories shape land use dynamics in the HEZ. These patterns highlight a double mechanism which includes “socio-economic pull” combined with “natural baseline constraints” within the framework of human-terrestrial relations.
For cultivated and construction land, the predominance of socio-economic factors—particularly population density, distance to administrative centers, and proximity to roads—indicates that agricultural activities and urban development in the HEZ are fundamentally anthropocentric. The dominant role of population density reflects population pressure of urban and rural growth on the agricultural land as the population agglomeration increases the demand for construction land at the expense of cultivated land [62]. While this finding supports classic urban growth theory, which posits that development concentrates around population centers and transport corridors [63], our analysis further reveals that administrative distance—proximity to county government offices—plays a comparably influential role. This additional driver reflects the enduring influence of state-led planning in resource-dependent regions, a dimension less emphasized in conventional urban growth frameworks. The impact of the distance from the county government reflects the importance of planning policies and administrative decisions in regulating the conversion of agricultural lands to other uses, because development tends to concentrate around administrative centers.
For ecological land categories such as woodland and grassland, natural environmental factors—particularly temperature and precipitation—emerged as the dominant contributors. The dependence on temperature and precipitation emphasizes the fundamental role of hydrothermal conditions in regulating vegetation suitability and growth. The rather small contribution of socioeconomic factors implies that, over the period covered in the study, large-scale efforts toward afforestation or deforestation, linked directly to economically human-driven activities, were rather limited.
The expansion of water areas exhibits a unique spatial logic, being primarily determined by their proximity to existing lakes and river systems. This high degree of spatial dependence is a function of the natural continuity and connectivity of hydrological systems. Changes in water bodies, such as reservoir construction, wetland restoration, and regulating of river channels, are usually made to be close to existing water networks with limitations imposed on topography, engineering practicability, and integrity of the ecosystem. This leads to the supposition that human modifications of water bodies in the HEZ often result in extended or optimized natural hydrological patterns and are often not due to random distribution.
A distinctly different pattern emerges for unused land, where environmental factors outweigh socio-economic influences. Lower precipitation likely indicates that arid, low-productivity areas are more prone to remaining unused. The influence of distance to mining areas suggests that some unused land is associated with mining subsidence, abandoned industrial sites, or newly excavated areas, reflecting the spatial legacy of resource-dependent development. The role of the PM2.5 factor may indicate an association between certain unused lands and areas with higher levels of pollution or environmental degradation. Notably, variations in unused land were significantly correlated with the distance to areas of mining activity, and this directly exposes the spatial legacy of mining as a profound spatial legacy that continuously impacts the land cover and conversion potential of regions supported by resources.
These findings demonstrate that land use transformations in the HEZ result from the interplay of natural and socio-economic factors, with dominant drivers varying by land category. The dual mechanism identified—socio-economic forces driving anthropogenic conversion and natural baselines governing ecological spaces—provides a conceptual foundation for targeted interventions in resource-based regions.

4.3. Policy Implications for Sustainable Transition

Multi-scenario simulations based on the PLUS model allow for a quantitative basis of assessment of alternative policy options [58]. Under the ND scenario, the loss of cultivated land is projected to continue, and the pressure on the ecosystem is projected to remain high. The UD scenario exacerbates the conversion of cultivated land and increases the rate of depletion of the ecological space. Given the resource-dependent nature of the HEZ, where maintaining urban progress entails huge energy demand, increased mineral resource exploitation and associated construction infrastructure expansion are likely to occur. These mining-related disturbances—including subsidence, land reclamation, and new excavation—would expand unused territories and reinforce the spatial manifestations of the resource curse. By contrast, the EP scenario shows that strong spatial regulation can support ecological land restoration through limited urban development. The comparison between scenarios shows that the standard extensive expansion pattern fueled by economic growth and resource extraction is not sustainable [64]. For resource-based regions like the HEZ that are in the process of critical transitions, it is required to adopt an ecological-protection-oriented optimized development pathway for coordinated energy security, food security, and ecological security.
Accordingly, the following policy recommendations are proposed from this study:
First of all, to strengthen the control of space with differentiated zones. On the basis of implementing bottom-line constraints, such as ecological conservation redivisions and permanent basic farmland protection zones, a mining impact buffer zone can be mapped. Differentiated land conversion rules should be put in place to prevent mining activities from encroaching on the cultivated land and ecological space.
Second, encourage the systematic restoration and adaptation of mining-related unused land. Ecological restoration, agroforestry, and renewable energy projects can transform degraded areas, such as subsidence areas and mine waste, into productive land resources to enhance regional ecological resilience in these lands.
Third, put in place a spatially differentiated mechanism of evaluation of performance [65]. For the cities which are at different stages of development in the region, differentiated indicators, including land use efficiency and ecological product value, should be formulated in order to guide local governments towards intensive and green connotative development.

4.4. Limitations and Future Research Directions

Although this study systematically examined the mechanisms of land use evolution in the HEZ, several limitations remain. First, the set of driving factors can be further improved. The analysis covers macro-level dimensions, including natural conditions and socio-economic development. However, micro-level and institutional variables are difficult to quantify and integrate. These variables include the intensity of specific industrial policies, fluctuations in energy market prices, and the effectiveness of ecological compensation implementation. Such factors can substantially affect land use decisions in resource-based cities. Second, the integrated assessment of multi-process interactions among natural, economic, and mining processes remains limited. The spatial impacts of mining activities were identified. However, the full causal chain and quantitative feedback linking mining disturbance, ecological restoration, and carbon storage change have not been decoupled and evaluated within a unified framework [66].
Future research can advance data and methods by coupling mining subsidence prediction with a multi-model integration framework. This approach can improve the simulation of land changes under resource extraction disturbances. In addition, future work should be aligned with China’s national Dual Carbon goals and sustainable development indicators [67]. From the perspective of optimizing the territorial spatial pattern, the long-term ecological benefits and policy performance of alternative transition pathways should be quantified to provide direct evidence for decision-making.

5. Conclusions

This study conducted a systematic investigation of the spatiotemporal changes, underlying mechanisms, and future scenario projections of land use in the Huaihai Economic Zone (HEZ), a typical coal-resource-based region in China, over the period of 2000 to 2023. The analysis employed the PLUS model, a land use transfer matrix, and dynamic degree metrics.
The investigation revealed a clear spatial reorganization, marked by the large-scale conversion of cultivated land to construction land and a shift from a monocentric urban system with Xuzhou as the urban core to a polycentric urban network involving Xuzhou, Jining, and Suqian. The central Mining-Affected Zone showed relatively slow urban growth, whereas the increase in unused land was strongly linked to the spatial legacy of mining activities, such as subsidence and industrial abandonment. The Comprehensive Land Use Dynamic Degree showed oscillatory behavior, with the most intense changes observed during the 2000–2010 interval, followed by a decline, and then a rebound in the last few years.
One of the main findings concerns two driving mechanisms sustaining land use transformations. Socio-economic factors, specifically population density, proximity to administrative centers, and roads, had a predominant influence on changes in cultivated land and construction land, reflecting the anthropogenic nature of agricultural activities and urbanization. In contrast, natural factors such as precipitation, temperature, and topography largely governed changes in ecological land categories, including woodland, grassland, water bodies, and unused land. Critically, variation in unused land was significantly correlated with distance to mining areas, thus reflecting the long-term spatial legacy of resource extraction that continues to shape land cover and land conversion potential in resource-dependent areas.
Multi-scenario modeling for 2036 outlines even clearer boundaries between divergent pathways with important policy implications. Under the natural development scenario, continued loss of cultivated land and increasing ecosystem pressure are projected. The urban development scenario would lead to faster occupation of cultivated land and a reduction in ecological space, likely increasing unused land through mining-related disturbance and strengthening the spatial manifestations of the resource curse. In contrast, the ecological protection scenario, through strong spatial regulation, would effectively control urban sprawl while promoting ecological land recovery, thereby achieving a more balanced outcome, although it would also involve the most substantial land use adjustment.
The study concludes that, for resource-based regions facing similar transformation pressures, sustainable transition requires a shift away from simplistic land use control toward the active coordination of “mining-urban-rural-ecological” spatial synergy. An ecological protection development pathway, coupled with stringent regulation of mining-associated land disturbances and spatially differentiated governance mechanisms, is necessary to balance energy security, food security, and ecological security in order to achieve regional sustainability.

Author Contributions

Conceptualization, Y.L.; methodology, B.W.; software, B.W.; validation, B.W. and L.Z.; formal analysis, B.W.; investigation, L.Z.; resources, B.W.; data curation, B.W. and L.Z.; writing—original draft preparation, B.W.; writing—review and editing, B.W. and Y.L.; funding acquisition, Y.L. and L.Z. All authors have read and agreed to the published version of the manuscript.

Funding

This research was funded by the Young Scientists Fund of the National Natural Science Foundation of China, grant number 52308040 (Project Title: “Research on the Multi-Level Place Structure Characteristics and Formation Mechanism of Streets and Alleys in Historical Urban Areas under the Influence of Self-Evolution”), Funder: NSFC (National Natural Science Foundation of China); and the Xuzhou Social Science Fund, grant number 25XSZ-040 (Project Title: “Xuzhou Practice Research on Development Zones Promoting the ‘Mining-Industry-City’ Spatial Integration Development of Resource-Based Cities”), Funder: Xuzhou Federation of Social Sciences; Fundamental Research Funds for the Central Universities, grant number 2022QN1107 (Project Title: “Rural Spatial Restructuring and Planning Response in Metropolitan Suburbs Driven by Agricultural Industrial Parks”), Funder: China University of Mining and Technology. The APC was funded by the China University of Mining and Technology.

Data Availability Statement

The data presented in this study are available from publicly accessible repositories. Detailed information regarding the specific datasets, including their sources, accuracy, and access links, is provided in Table 1 of this manuscript. For researchers requiring only the data specifically extracted or processed for the Huaihai Economic Zone, these data are available upon request from the corresponding author.

Acknowledgments

The authors would like to thank all publicly accessible data sources for providing data support for this study. We also acknowledge the High-Performance Spatial Computing Intelligence Laboratory (HPSCIL) at the China University of Geosciences and the National Engineering Research Center of Geographic Information System for developing and freely sharing the Patch-generating Land Use Simulation (PLUS) model. During the preparation of this study, the authors used the PLUS V1.4.2 model and ArcGIS 10.8 software for land use simulation, data cleaning, and related analyses. The authors have reviewed and edited the outputs and take full responsibility for the content of this publication.

Conflicts of Interest

The authors declare no conflicts of interest. The funders had no role in the design of the study; in the collection, analyses, or interpretation of data; in the writing of the manuscript; or in the decision to publish the results.

Abbreviations

The following abbreviations are used in this manuscript:
HEZHuaihai Economic Zone
PLUSPatch-generating Land Use Simulation
LEASLand Expansion Analysis Strategy
CARSCellular Automata based on Multiple Random Seeds

References

  1. Seto, K.C.; Güneralp, B.; Hutyra, L.R. Global forecasts of urban expansion to 2030 and direct impacts on biodiversity and carbon pools. Proc. Natl. Acad. Sci. USA 2012, 109, 16083–16088. [Google Scholar] [CrossRef] [Scilit]
  2. Li, X.; Lu, Z. Spatiotemporal Evolution of Land Use Structure and Function in Rapid Urbanization: The Case of the Beijing–Tianjin–Hebei Region. Land 2024, 13, 1651. [Google Scholar] [CrossRef] [Scilit]
  3. Li, X.; Fu, J.; Jiang, D.; Lin, G.; Cao, C. Land Use Optimization in Ningbo City with a Coupled GA and PLUS Model. J. Clean. Prod. 2022, 375, 134004. [Google Scholar] [CrossRef] [Scilit]
  4. Riahi, K.; van Vuuren, D.P.; Kriegler, E.; Edmonds, J.; O’Neill, B.C.; Fujimori, S.; Bauer, N.; Calvin, K.; Dellink, R.; Fricko, O.; et al. The Shared Socioeconomic Pathways and Their Energy, Land Use, and Greenhouse Gas Emissions Implications: An Overview. Glob. Environ. Change 2017, 42, 153–168. [Google Scholar] [CrossRef] [Scilit]
  5. Marschalko, M.; Yilmaz, I.; Kubečka, K.; Bouchal, T.; Bednárik, M.; Drusa, M.; Bendová, M. Utilization of Ground Subsidence Caused by Underground Mining to Produce a Map of Possible Land-Use Areas for Urban Planning Purposes. Arab. J. Geosci. 2015, 8, 579–588. [Google Scholar] [CrossRef] [Scilit]
  6. Tang, Q.; Wang, J.; Jing, Z.; Yan, Y.; Niu, H. Response of Ecological Vulnerability to Land Use Change in a Resource-Based City, China. Resour. Policy 2021, 74, 102324. [Google Scholar] [CrossRef] [Scilit]
  7. Yıldız, T.D. Evaluation of Forestland Use in Mining Operation Activities in Turkey in Terms of Sustainable Natural Resources. Land Use Policy 2020, 99, 104638. [Google Scholar] [CrossRef] [Scilit]
  8. Chen, W.; Chen, W.; Ning, S.; Liu, E.N.; Zhou, X.; Wang, Y.; Zhao, M. Exploring the Industrial Land Use Efficiency of China’s Resource-Based Cities. Cities 2019, 93, 215–223. [Google Scholar] [CrossRef] [Scilit]
  9. Lu, S.; Liu, Q.; Xia, S.; Zhang, W. How Does Industrial Transition Drive Low-Carbon Transition? Evidence from China’s Resource-Based Cities. Environ. Dev. Sustain. 2025, 27, 16113–16134. [Google Scholar] [CrossRef] [Scilit]
  10. Imran, M.; Alam, M.S.; Jijian, Z.; Ozturk, I.; Wahab, S.; Doğan, M. From Resource Curse to Green Growth: Exploring the Role of Energy Utilization and Natural Resource Abundance in Economic Development. Nat. Resour. Forum 2024, 49, 2025–2047. [Google Scholar] [CrossRef] [Scilit]
  11. Marais, L.; Cloete, J.; Lenka, M. The Plight of Mining Cities in South Africa: Planning for Growth and Closure. Cities 2022, 130, 103965. [Google Scholar] [CrossRef] [Scilit]
  12. Khanal, M.; Hodgkinson, J.H. Subsidence Prediction versus Observation in Australia: A Short Comment. Environ. Impact Assess. Rev. 2021, 86, 106479. [Google Scholar] [CrossRef] [Scilit]
  13. Ratsep, A.; Liblik, V. Impact of Oil Shale Mining and Mine Closures on Hydrological Conditions of North-East Estonian Rivers. Oil Shale 2004, 21, 137–148. [Google Scholar] [CrossRef] [Scilit]
  14. Chand, K.; Koner, R. Mine Dump Slope Stability and Failure Behaviour Analysis under Geo-Mining Condition Using Hybrid Numerical Modelling. Curr. Sci. 2025, 128, 667–676. [Google Scholar] [CrossRef] [Scilit]
  15. He, S.Y.; Lee, J.; Zhou, T.; Wu, D. Shrinking Cities and Resource-Based Economy: The Economic Restructuring in China’s Mining Cities. Cities 2017, 60, 75–83. [Google Scholar] [CrossRef] [Scilit]
  16. Gumbo, E.B.; Matsa, M.M.; Kowe, P. Bridging Extraction and Environmentalism: A Sustainability-Oriented Framework for Managing Mining-Induced Land Degradation. Environ. Manag. 2026, 76, 33. [Google Scholar] [CrossRef] [Scilit]
  17. Awotwi, A.; Anornu, G.K.; Quaye-Ballard, J.A.; Annor, T. Monitoring Land Use and Land Cover Changes Due to Extensive Gold Mining, Urban Expansion, and Agriculture in the Pra River Basin of Ghana, 1986–2025. Land Degrad. Dev. 2018, 29, 3331–3343. [Google Scholar] [CrossRef] [Scilit]
  18. Zang, S.Y.; Huang, X.; Na, X.D.; Sun, L. An Assessment Approach of Land-Use to Resource-Based Cities: A Case Study on Land-Use Process of Daqing Region. Int. J. Environ. Sci. Technol. 2015, 12, 3827–3836. [Google Scholar] [CrossRef] [Scilit]
  19. Qian, X.; Wang, D.; Wang, J.; Chen, S. Resource Curse, Environmental Regulation and Transformation of Coal-Mining Cities in China. Resour. Policy 2021, 74, 101447. [Google Scholar] [CrossRef] [Scilit]
  20. Kosatica, M.; Ziegler, E.; Buchstaller, I. From Winding Tower to Eiffel Tower (of the Ruhr Area): The Symbolic Economy of Industrial Signs. Multimodality Soc. 2024, 4, 402–432. [Google Scholar] [CrossRef] [Scilit]
  21. Whitington, J.; Oguz, Z. Mining the Sun: Coal-to-Solar Transitions and Energetic Place-Making in Appalachia. Crit. Anthropol. 2024, 44, 276–293. [Google Scholar] [CrossRef] [Scilit]
  22. Pratiwi; Narendra, B.H.; Siregar, C.A.; Iskandar; Mulyanto, B.; Suwardi; Suryaningtyas, D.T.; Dharmawan, I.W.S.; Suharti, S.; Marsandi, F. Tin Mining and Post-Tin Mining Reclamation Initiatives in Indonesia: With Special Reference to Bangka Belitung Areas. Land 2025, 14, 1947. [Google Scholar] [CrossRef] [Scilit]
  23. Sterling, S.M.; Ducharne, A.; Polcher, J. The Impact of Global Land-Cover Change on the Terrestrial Water Cycle. Nat. Clim. Change 2013, 3, 385–390. [Google Scholar] [CrossRef] [Scilit]
  24. Dhakal, B.; Kattel, R.R. Effects of Global Changes on Ecosystems Services of Multiple Natural Resources in Mountain Agricultural Landscapes. Sci. Total Environ. 2019, 676, 665–682. [Google Scholar] [CrossRef] [Scilit]
  25. Leta, M.K.; Demissie, T.A.; Tränckner, J. Modeling and Prediction of Land Use Land Cover Change Dynamics Based on Land Change Modeler (LCM) in Nashe Watershed, Upper Blue Nile Basin, Ethiopia. Sustainability 2021, 13, 3740. [Google Scholar] [CrossRef] [Scilit]
  26. Serra, P.; Pons, X.; Saurí, D. Land-Cover and Land-Use Change in a Mediterranean Landscape: A Spatial Analysis of Driving Forces Integrating Biophysical and Human Factors. Appl. Geogr. 2008, 28, 189–209. [Google Scholar] [CrossRef] [Scilit]
  27. Zhou, H.; Tang, M.; Huang, J.; Mei, X.; Zhao, H. Driving Mechanisms and Multi-Scenario Simulation of Land Use Change Based on National Land Survey Data: A Case in Jianghan Plain, China. Front. Environ. Sci. 2024, 12, 1422987. [Google Scholar] [CrossRef] [Scilit]
  28. Hashimoto, S.; DasGupta, R.; Kabaya, K.; Matsui, T.; Haga, C.; Saito, O.; Takeuchi, K. Scenario Analysis of Land-Use and Ecosystem Services of Social-Ecological Landscapes: Implications of Alternative Development Pathways Under Declining Population in the Noto Peninsula, Japan. Sustain. Sci. 2019, 14, 53–75. [Google Scholar] [CrossRef] [Scilit]
  29. Li, B.; He, C.; Jiang, X.; Zheng, Q.; Li, J. Land Use Evolution and Multi-Scenario Simulation of Shrinking Border Counties Based on the PLUS Model: A Case Study of Changbai County. Sustainability 2025, 17, 6441. [Google Scholar] [CrossRef] [Scilit]
  30. Li, Y.; Ma, J.; Li, Y.; Jia, Q.; Shen, X.; Xia, X. Spatiotemporal Variations in the Soil Quality of Agricultural Land and Its Drivers in China from 1980 to 2018. Sci. Total Environ. 2023, 892, 164649. [Google Scholar] [CrossRef] [Scilit]
  31. Rong, T.; Zhang, P.; Zhu, H.; Jiang, L.; Li, Y.; Liu, Z. Spatial Correlation Evolution and Prediction Scenario of Land Use Carbon Emissions in China. Ecol. Inform. 2022, 71, 101802. [Google Scholar] [CrossRef] [Scilit]
  32. Du, S.; Zhou, Z.; Huang, D.; Zhang, F.; Deng, F.; Yang, Y. The Response of Carbon Stocks to Land Use/Cover Change and a Vulnerability Multi-Scenario Analysis of the Karst Region in Southern China Based on PLUS-InVEST. Forests 2023, 14, 2307. [Google Scholar] [CrossRef] [Scilit]
  33. Gao, F.; Xin, X.; Song, J.; Li, X.; Zhang, L.; Zhang, Y.; Liu, J. Simulation of LUCC Dynamics and Estimation of Carbon Stock under Different SSP-RCP Scenarios in Heilongjiang Province. Land 2023, 12, 1665. [Google Scholar] [CrossRef] [Scilit]
  34. Shooshtari, S.J.; Gholamalifard, M. Scenario-Based Land Cover Change Modeling and Its Implications for Landscape Pattern Analysis in the Neka Watershed, Iran. Remote Sens. Appl. Soc. Environ. 2015, 1, 1–19. [Google Scholar] [CrossRef] [Scilit]
  35. Lei, J.; Chen, Y.; Li, L.; Chen, Z.; Chen, X.; Wu, T.; Li, Y. Spatiotemporal Change of Habitat Quality in Hainan Island of China Based on Changes in Land Use. Ecol. Indic. 2022, 145, 109707. [Google Scholar] [CrossRef] [Scilit]
  36. Ma, R.; Zhou, W.; Ren, J.; Huang, Y.; Wang, H. Multi-Scenario Simulation and Optimization Control of Ecological Security Based on GeoSOS-FLUS Model in Ecological Fragile Area in Northeast Qinghai-Tibet Plateau, China. Ecol. Indic. 2023, 151, 110324. [Google Scholar] [CrossRef] [Scilit]
  37. Chen, Z.; Huang, M.; Zhu, D.; Altan, O. Integrating Remote Sensing and a Markov-FLUS Model to Simulate Future Land Use Changes in Hokkaido, Japan. Remote Sens. 2021, 13, 2621. [Google Scholar] [CrossRef] [Scilit]
  38. Xu, K.; Chi, Y.; Ge, R.; Wang, X.; Liu, S. Land Use Changes in Zhangjiakou from 2005 to 2025 and the Importance of Ecosystem Services. PeerJ 2021, 9, e12122. [Google Scholar] [CrossRef] [Scilit]
  39. Jin, Q.; Liu, G.; Li, L.; He, C.; Huang, Y.; Yao, Y. Land Use Scenarios Simulation Based on the CLUE-S Model of the Lijiang River Basin in Guilin, China. In Proceedings of the 6th Digital Earth Summit, Beijing, China, 7–8 July 2016. [Google Scholar] [CrossRef] [Scilit]
  40. Su, S.; Sun, Y.; Lei, C.; Weng, M.; Cai, Z. Reorienting Paradoxical Land Use Policies towards Coherence: A Self-Adaptive Ensemble Learning Geo-Simulation of Tea Expansion under Different Scenarios in Subtropical China. Land Use Policy 2017, 67, 415–425. [Google Scholar] [CrossRef] [Scilit]
  41. Liu, J.; Liu, B.; Wu, L.; Miao, H.; Liu, J.; Jiang, K.; Gao, W.; Liu, T. Prediction of Land Use for the Next 30 Years Using the PLUS Model’s Multi-Scenario Simulation in Guizhou Province, China. Sci. Rep. 2024, 14, 13143. [Google Scholar] [CrossRef] [Scilit]
  42. Liang, X.; Guan, Q.; Clarke, K.C.; Liu, S.; Wang, B.; Yao, Y. Understanding the Drivers of Sustainable Land Expansion Using a Patch-Generating Land Use Simulation (PLUS) Model: A Case Study in Wuhan, China. Comput. Environ. Urban Syst. 2021, 85, 101569. [Google Scholar] [CrossRef] [Scilit]
  43. Wang, J.; Wu, Y.; Gou, A. Habitat Quality Evolution Characteristics and Multi-Scenario Prediction in Shenzhen Based on PLUS and InVEST Models. Front. Environ. Sci. 2023, 11, 1146347. [Google Scholar] [CrossRef] [Scilit]
  44. Zhang, J.; Zhu, H.; Zhang, P.; Song, Y.; Zhang, Y.; Li, Y.; Rong, T.; Liu, Z.; Yang, D.; Lou, Y. Construction of GI Network Based on MSPA and PLUS Model in the Main Urban Area of Zhengzhou: A Case Study. Front. Environ. Sci. 2022, 10, 878656. [Google Scholar] [CrossRef] [Scilit]
  45. Bai, Y.; Tang, X.; Xue, F.; Long, D.; Li, J.; Tang, Y. Spatiotemporal Variation and Dynamic Simulation of Carbon Stock Based on PLUS and InVEST Models in the Li River Basin, China. Sci. Rep. 2025, 15, 6060. [Google Scholar] [CrossRef] [Scilit] [PubMed]
  46. Wang, L.; Liu, D.; Wu, X.; Zhang, X.; Liu, Q.; Kong, W.; Yang, S. Simulation Analysis of Land Use Change via the PLUS-GMOP Coupling Model. Land 2025, 14, 802. [Google Scholar] [CrossRef] [Scilit]
  47. Fan, F.; Zhang, X. Transformation Effect of Resource-Based Cities Based on PSM-DID Model: An Empirical Analysis from China. Environ. Impact Assess. Rev. 2021, 91, 106648. [Google Scholar] [CrossRef] [Scilit]
  48. Tong, S.; Ji, X.; Chu, Y.; Liu, T.; Wang, F. Spatio-Temporal Analysis About Resource and Environmental Carrying Capacity (RECC) of Mining Cities in Coal-Concentrated Areas: A Case Study of Huaihai Economic Zone in China. Sustainability 2023, 15, 1367. [Google Scholar] [CrossRef] [Scilit]
  49. Teng, G.; Chen, L.; Zhang, T.; Li, L.; Xiao, J.; Ma, L. The Spatiotemporal Evolution of Land Use Ecological Efficiency in the Huaihai Economic Zone: Insights from a Multi-Dimensional Framework and Geospatial Modeling. Land 2025, 14, 883. [Google Scholar] [CrossRef] [Scilit]
  50. IEA. Coal Mid-Year Update 2025; IEA: Paris, France, 2025; Available online: https://www.iea.org/reports/coal-mid-year-update-2025 (accessed on 13 March 2026).
  51. Shen, Y.; Zhang, L.; Fang, X.; Zhao, Z.; Li, X.; Wang, J.; Chai, Q. Long-Term Analysis of Aerosol Optical Depth over the Huaihai Economic Region (HER): Possible Causes and Implications. Atmosphere 2018, 9, 93. [Google Scholar] [CrossRef] [Scilit]
  52. Li, Z.; Chang, J.; Li, C.; Gu, S. Ecological Restoration and Protection of National Land Space in Coal Resource-Based Cities from the Perspective of Ecological Security Pattern: A Case Study in Huaibei City, China. Land 2023, 12, 442. [Google Scholar] [CrossRef] [Scilit]
  53. Hemmavanh, C.; Ye, Y.; Yoshida, A. Forest Land Use Change at Trans-Boundary Laos-China Biodiversity Conservation Area. J. Geogr. Sci. 2010, 20, 889–898. [Google Scholar] [CrossRef] [Scilit]
  54. Quan, B.; Bai, Y.; Römkens, M.J.M.; Chang, K.T.; Song, H.; Guo, T.; Lei, S. Urban Land Expansion in Quanzhou City, China, 1995–2010. Habitat Int. 2015, 48, 131–139. [Google Scholar] [CrossRef] [Scilit]
  55. Huang, F.; Huang, B.; Huang, J.; Li, S. Measuring Land Change in Coastal Zone Around a Rapidly Urbanized Bay. Int. J. Environ. Res. Public Health 2018, 15, 1059. [Google Scholar] [CrossRef] [Scilit] [PubMed]
  56. Quan, B.; Römkens, M.J.M.; Tao, J.; Li, B.; Li, C.; Yu, G.; Chen, Q. Spatial-Temporal Pattern and Population Driving Force of Land Use Change in Liupan Mountains Region, Southern Ningxia, China. Chin. Geogr. Sci. 2008, 18, 323–330. [Google Scholar] [CrossRef] [Scilit]
  57. Luo, J.; Hu, Y.; Chen, Y.; Zhou, W.; Zhang, H.; Liang, T. Spatiotemporal Evolution of Land Use in Ili, Xinjiang, China: A Comparative Evaluation of PLUS and Logistic-CA-Markov Models. Geocarto Int. 2025, 40, 2570049. [Google Scholar] [CrossRef] [Scilit]
  58. Wu, Q.; Wang, L.; Wang, T.; Ruan, Z.; Du, P. Spatial–Temporal Evolution Analysis of Multi-Scenario Land Use and Carbon Storage Based on PLUS-InVEST Model: A Case Study in Dalian, China. Ecol. Indic. 2024, 166, 112448. [Google Scholar] [CrossRef] [Scilit]
  59. Borowski, M.; Zwolińska-Glądys, K.; Cheng, J. Methane Emissions from Coal Mines: Quantification, Capture, and Utilization Strategies for Atmospheric Impact Mitigation—A Case Study from Poland. Atmosphere 2025, 16, 174. [Google Scholar] [CrossRef] [Scilit]
  60. Humer, A.; Cardoso, R.V.; Meijers, E. Breaking with the Spatial-Cycle Model: The Shift towards ‘Syncurbanization’ in Polycentric Urban Regions. Reg. Stud. 2022, 56, 21–35. [Google Scholar] [CrossRef] [Scilit]
  61. Bren d’Amour, C.; Reitsma, F.; Baiocchi, G.; Barthel, S.; Güneralp, B.; Erb, K.H.; Haberl, H.; Creutzig, F.; Seto, K.C. Future Urban Land Expansion and Implications for Global Croplands. Proc. Natl. Acad. Sci. USA 2017, 114, 8939–8944. [Google Scholar] [CrossRef] [Scilit]
  62. Güneralp, B.; Reba, M.; Hales, B.U.; Wentz, E.A.; Seto, K.C. Trends in Urban Land Expansion, Density, and Land Transitions from 1970 to 2010: A Global Synthesis. Environ. Res. Lett. 2020, 15, 044015. [Google Scholar] [CrossRef] [Scilit]
  63. Kulish, M.; Richards, A.; Gillitzer, C. Urban Structure and Housing Prices: Some Evidence from Australian Cities. Econ. Rec. 2012, 88, 303–322. [Google Scholar] [CrossRef] [Scilit]
  64. Bebbington, A.; Hinojosa, L.; Bebbington, D.H.; Burneo, M.L.; Warnaars, X. Contention and Ambiguity: Mining and the Possibilities of Development. Dev. Change 2008, 39, 887–914. [Google Scholar] [CrossRef] [Scilit]
  65. Ma, Y.; Zhang, P.; Zhao, K.; Zhou, Y.; Zhao, S. A Dynamic Performance and Differentiation Management Policy for Urban Construction Land Use Change in Gansu, China. Land 2022, 11, 942. [Google Scholar] [CrossRef] [Scilit]
  66. Tondaś, D.; Ilieva, M.; van Leijen, F.; van der Marel, H.; Rohm, W. Kalman Filter-Based Integration of GNSS and InSAR Observations for Local Nonlinear Strong Deformations. J. Geod. 2023, 97, 109. [Google Scholar] [CrossRef] [Scilit]
  67. Hu, X.; Li, Z.; Cai, Y.; Wu, F. Urban Construction Land Demand Prediction and Spatial Pattern Simulation under Carbon Peak and Neutrality Goals: A Case Study of Guangzhou, China. J. Geogr. Sci. 2022, 32, 2251–2270. [Google Scholar] [CrossRef] [Scilit]
Figure 1. Location map.
Land 15 00555 g001
Figure 2. Research implementation processes.
Land 15 00555 g002
Figure 3. Factors affecting land use change.
Land 15 00555 g003aLand 15 00555 g003b
Figure 4. LUCC of sample years.
Land 15 00555 g004
Figure 5. Land use conversion Sankey diagrams.
Land 15 00555 g005
Figure 6. Factor contribution. The figure does not display the common dominant factor (DEM) and the minimal factor (spatial distribution of vegetation types). Some indicators are simplified, such as: distance to the mining area abbreviated as “Mining area”, distance to water abbreviated as “Water”, average annual precipitation abbreviated as “Precipitation”, annual mean PM2.5 concentration abbreviated as “PM2.5”, etc.
Land 15 00555 g006aLand 15 00555 g006b
Figure 7. Multi-scenario land use simulations for 2036.
Land 15 00555 g007
Table 1. Data source.
TypeDataYearAccuracyResourceWebsite
Land use dataHuaihai Economic Zone LUCC data200030 mResource and Environmental Science Data Platformhttps://www.resdc.cn/DataList.aspx
(accessed on 20 August 2025)
2010
2020
2023
Environmental dataDistance to the mining area202430 mProvincial, Municipal, and County Planning AtlasGovernment official websites
Distance to water202130 mZhongli Data Networkhttps://zldatas.com/
DEM201930 mGeospatial Data Cloudhttps://www.gscloud.cn/
Slope201930 mGenerated from DEM
Average annual precipitation20201000 mResource and Environmental Science Data Platformhttps://www.resdc.cn/DataList.aspx
(accessed on 24 March 2026)
Average annual temperature20201000 m
Soil type201730 m
Vegetation types20011000 mResource and Environmental Science Data Platformhttps://www.resdc.cn/DataList.aspx
Socioeconomic dataCounty-level carbon emissions2024/Emissions Database for Global Atmospheric Researchhttps://edgar.jrc.ec.europa.eu/
(accessed on 15 January 2026)
Annual mean PM2.5 concentration20201000 mNational Tibetan Plateau/Third Pole Environment Data Centerhttps://data.tpdc.ac.cn/zh-hans/data/6168e75d-93ab-4e4a-b7ff-33152e49d0bf
(accessed on 15 October 2025)
Distance from the government office202030 mNational Geographic Information Resource Directory Service Systemhttps://www.webmap.cn/main.do?method=index
(accessed on 15 October 2025)
Distance to railways202030 m
Distance to roads202030 m
GDP20201000 mResource and Environmental Science Data Platformhttps://www.resdc.cn/DataList.aspx
(accessed on 24 March 2026)
Population20201000 m
Table 2. CARS transition matrix.
2036 ND Scenario2036 UD Scenario2036 EP Scenario
abcdefabcdefabcdef
a111111100011111111
b111111111011010000
c111111111011011000
d000100011110011100
e000010000010000010
f111111111111111111
a. Cultivated land, b. woodland, c. grassland, d. water area, e. construction land, f. unused land. ND. Natural development, UD. urban development, EP. ecological protection.
Table 3. Rate of land change.
Type2000–20102010–20202020–2023
SLUDCLUDSLUDCLUDSLUDCLUD
Cultivated land−0.10%0.58%−0.19%0.28%−0.25%0.35%
Woodland−1.27%−0.07%0.04%
Grassland−3.36%−0.03%−0.40%
Water area0.21%0.56%0.51%
Construction land1.77%0.61%0.67%
Unused land−2.75%0.07%2.14%
Table 4. Land use prediction quantification table.
2036 ND2036 UD2036 EP
Area Change (km2)SLUD (%)CLUD (%)Area Change (km2)SLUD (%)CLUD (%)Area Change (km2)SLUD (%)CLUD (%)
Cultivated land−1643.70−0.25%0.35%−1933.53−0.30%0.43%−1087.55−0.17%0.76%
Woodland−9.40−0.03%−23.33−0.08%19.860.07%
Grassland85.210.28%−83.74−0.27%171.530.56%
Water area107.930.22%2.310.00%111.100.23%
Construction land1399.110.73%1825.000.95%784.900.41%
Unused land60.941.57%213.335.50%0.210.01%
Disclaimer/Publisher’s Note: The statements, opinions and data contained in all publications are solely those of the individual author(s) and contributor(s) and not of MDPI and/or the editor(s). MDPI and/or the editor(s) disclaim responsibility for any injury to people or property resulting from any ideas, methods, instructions or products referred to in the content.