


Abstract
Assessing and optimizing regional ecological networks is critical for mitigating fragmentation-driven ecological risks and informing evidence-based territorial spatial planning in China. In this study, we developed a comprehensive evaluation framework integrating ecosystem services, ecological sensitivity, and landscape connectivity to identify ecological sources in Anyang City, China. We then extracted ecological corridors and nodes using circuit theory and constructed the city’s ecological network. Notably, we applied complex network theory combined with topological robustness analysis for optimization to enhance network stability. The analysis identified 43 ecological sources (820.72 km2; 11.16% of the region), predominantly distributed in western Anyang. A total of 82 corridors (460.35 km), 62 pinch points, and 120 barrier points were mapped—primarily in the west, revealing critical connectivity deficits. Network optimization through the addition of 10 strategic corridors significantly enhanced structural balance and functionality, with average degree, closeness centrality, clustering coefficient, eigenvector centrality, and graph density increasing by 5.55–12.19%, and their standard deviations decreasing by an average of 19.32%. Global efficiency (+8.74%), the largest connected component ratio (+0.73%), and node/edge recovery robustness (+17.44%/+18.08%) also improved markedly, confirming greater connectivity and resilience. Our methodology comprehensively integrates ecosystem functional services, disturbance resistance, and spatial structural stability, providing a practical reference for the construction and optimization of regional ecological networks in mountainous–plain transition zones of China.
1. Introduction
Rapid urban expansion and industrialization are driving unprecedented landscape transformation worldwide, resulting in widespread habitat fragmentation, biodiversity loss, ecosystem degradation, and diminished ecosystem services [1,2]. These global environmental challenges not only diminish human ecological well-being but also undermine the sustainability of socio-economic systems development [2]. In response, the United Nations’ 2030 Agenda for Sustainable Development advocates landscape-scale strategies that enhance ecological connectivity and prevent land degradation [3]. Within this context, ecological networks (ENs) have emerged as a pivotal planning and conservation strategy, moving beyond isolated protected areas to foster functional corridors across heterogeneous landscapes [4]. The concept of ecological networks (ENs) serves as an effective tool for curbing biodiversity loss and mitigating climate change while simultaneously optimizing ecosystem service delivery. Recognizing this potential, it has become a cornerstone of modern governance for achieving harmonious human–nature coexistence and guiding the “smart growth” of territorial spaces [5,6,7]. In response, the precise identification and protection of critical ecological elements, coupled with the scientific construction of robust networks, have emerged as focal points in contemporary ecological research [8,9].
The conceptual foundation of ecological networks (ENs) traces back to 19th-century urban park systems [10], with McHarg’s Design with Nature later providing a foundational framework for reconnecting fragmented green spaces into functional networks [11]. The scope of EN planning expanded from urban to regional scales through UNESCO’s biosphere reserve initiatives in the 1970s [12,13], culminating in Forman et al.’s patch–corridor–matrix model—a theoretical cornerstone that continues to shape connectivity-based planning [14,15]. By the late 20th century, ENs had matured into an integrative tool for landscape optimization, biodiversity conservation, and resource management across multiple scales [16,17,18,19]. Contemporary EN construction now follows a standardized three-stage paradigm—source identification, resistance surface parameterization, and corridor extraction [20]—with sources delineated via protected areas, MSPA, or multi-criteria assessments [21,22,23]; resistance surfaces parameterized through expert weighting, suitability inversion, or source–sink modeling [24,25,26]; and corridors extracted initially using minimum cumulative resistance models [27], but increasingly via circuit theory, hydrological analysis, and gravity-based approaches that better represent ecological flows [28,29,30].
With growing methodological sophistication, EN research has shifted from network delineation toward optimization. Early efforts emphasized zoning, corridor prioritization [31], stepping-stone integration [32,33], and structural adjustments such as increasing forest corridor density or reconfiguring patches [34]. More recently, the fusion of landscape ecology and systems science has spurred the application of complex network theory to enhance EN topology and function [35]. Topology-based edge additions have improved carbon sequestration and biodiversity in karst regions [36], while hybrid strategies combining edge augmentation with stepping stones have restored robustness in degraded mining-area networks [37]. Despite these advances, two persistent gaps limit planning applicability: ecological source identification often lacks accuracy and comprehensiveness [38], and many optimization proposals lack empirical validation or contextual tailoring for effective spatial governance [39,40].
China’s vast territory encompasses exceptional ecosystem diversity. To advance ecological civilization and safeguard national ecological security, the Chinese government launched a national strategy in 2020 focused on the protection and restoration of key ecosystems and the optimization of ecological security barriers [41]. Anyang City—situated at the ecologically sensitive transition zone between the Taihang Mountains and the North China Plain—exemplifies the intensifying tension between rapid urbanization and ecological integrity that characterizes many peri-urban frontier regions across China. It serves as both a critical ecological buffer for the densely populated North China Plain [42] and a designated priority area for watershed-scale restoration within the Yellow River Basin [43]. Yet, like numerous rapidly developing cities in ecologically strategic locations, Anyang faces acute land use transformation, escalating human–land conflicts, and mounting pressure on its ecological network—making it a representative case for testing science-based approaches to reinforce ecological security under development stress.
Against this backdrop, we develop a spatially explicit ecological network for Anyang by integrating ecosystem services, ecological sensitivity, and landscape connectivity to identify sources; applying circuit theory to delineate corridors and pinch points; and using complex network analysis with topological robustness assessment to pinpoint vulnerabilities and guide optimization. Our study has two objectives: (1) to delineate a functional regional ecological security framework and map its network structure, and (2) to diagnose topological properties, propose evidence-based enhancements, and evaluate their effectiveness—providing a science-informed basis for strengthening ecological barriers in rapidly urbanizing frontier zones.
2. Study Area and Data Sources
2.1. Overview of the Study Area
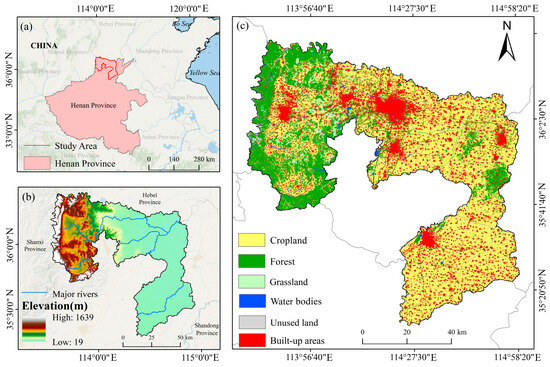
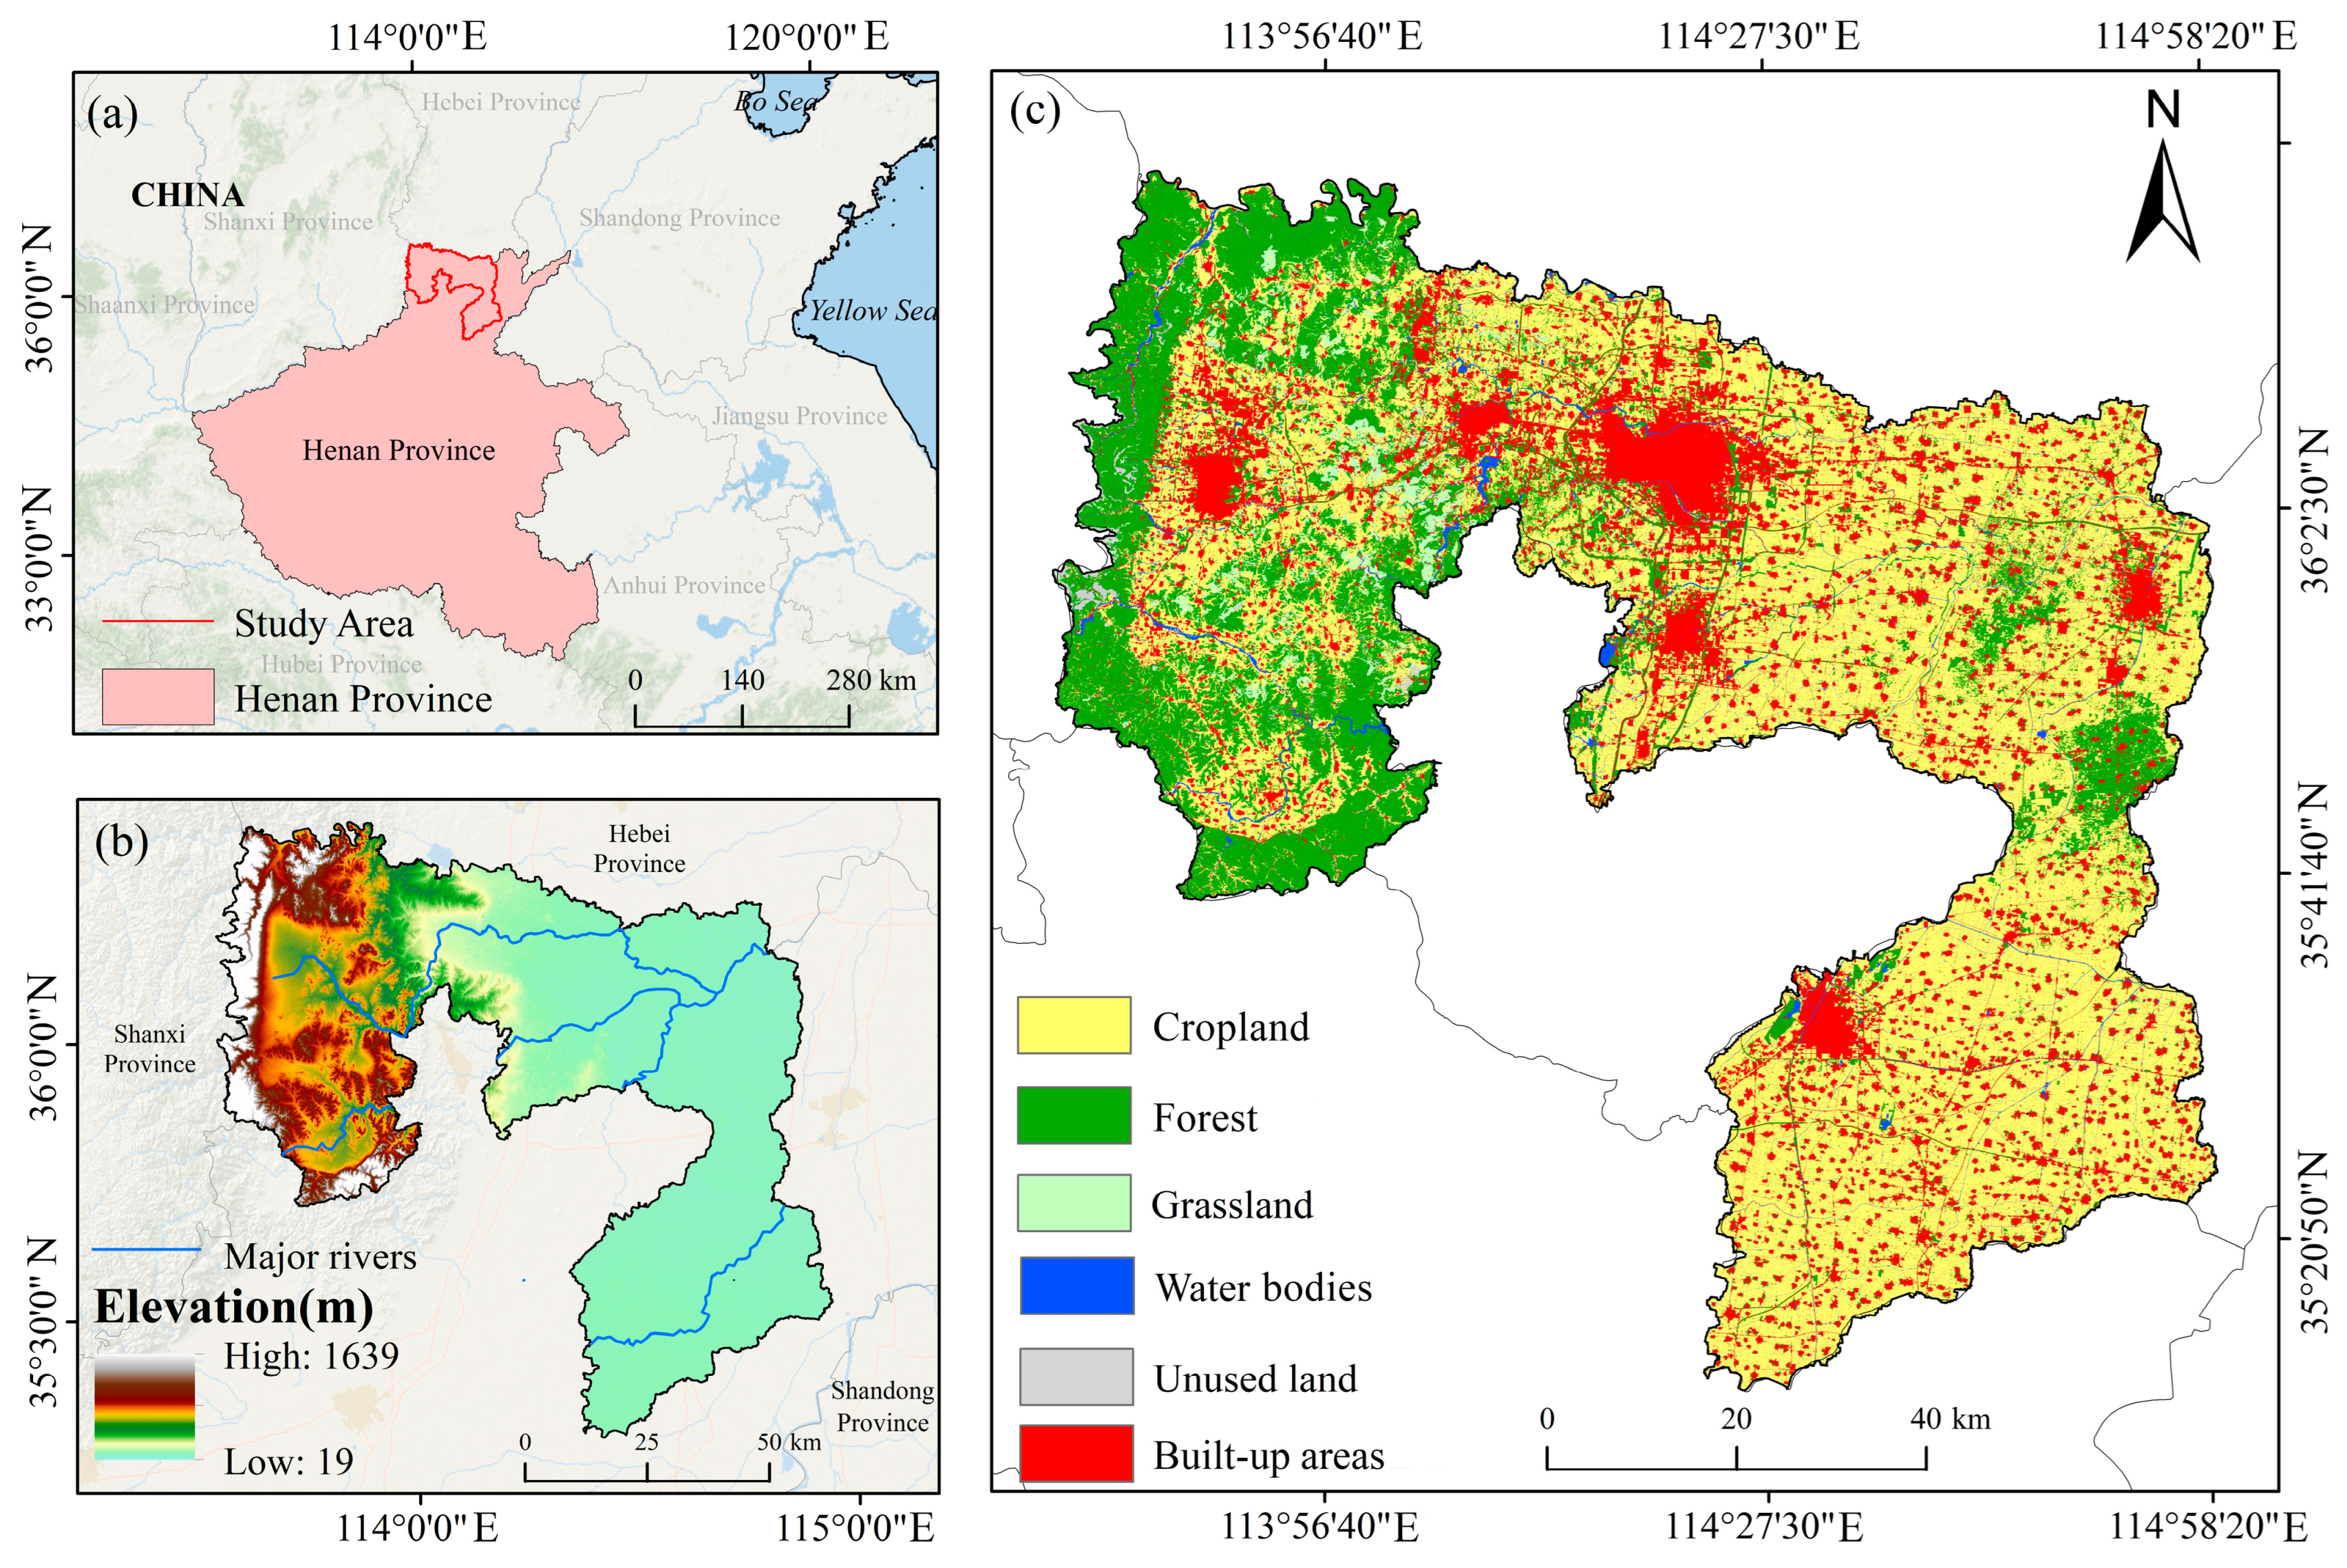
Anyang City (35°41′–36°21′ N, 113°38′–114°59′ E), located in northern Henan Province, occupies a strategic position at the ecotone between the Taihang Mountains and the Huang-Huai-Hai Plain, with a total area of 7351.59 km2 (Figure 1). With a warm temperate semi-humid continental monsoon climate (mean annual temperature: 14.8 °C; decadal average precipitation: 720.73 mm), its terrain descends from west to east across three geomorphologically distinct zones—mountainous (29.7%), hilly (10.8%), and plain (59.5%)—each presenting unique challenges to ecological network integrity. This pronounced mountain–plain transition also informed the subsequent ecosystem service assessment and resistance factor selection. The western Taihang Mountains consist primarily of limestone ranges (elevation: 800–1639 m) with steep slopes and limited vegetation recovery capacity; decades of mining have resulted in severe landscape fragmentation and vegetation degradation. The central hilly zone, composed of loess terraces (200–800 m), faces declining groundwater quality and reduced vegetation cover due to expanding urban development [44]. The eastern lowlands (19–100 m)—home to the majority of the population and economic activity—exhibit high land use intensity and pronounced environmental pressures, including air and soil pollution [45]. As of 2024, Anyang hosted 5.39 million permanent residents, achieved an urbanization level of 56.9%, and generated a Gross Domestic Product (GDP) totaling RMB 267.2 billion, thereby emphasizing its position as a pivotal regional hub in North China. Significantly, it is recognized as a key region prioritized for coordinating ecological preservation with high-quality growth in the context of the Yellow River Basin strategy. Yet, rapid socio-economic growth has intensified ecological stress across all three zones, rendering Anyang a representative case of a development-pressured ecological frontier where science-informed restoration is urgently needed to reconcile urban expansion with long-term ecological security.
Figure 1.
Location of the study area: (a) location; (b) elevation and major rivers; (c) distribution of land use types.
2.2. Data Sources
This research utilized diverse multi-source geospatial datasets. First, the Anyang Municipal Bureau of Natural Resources provided vector layers of roads and rivers, as well as the 2023 land use/cover data. Following the Classification of Current Land Use Status (GB/T 21010-2017 [46]), the dataset was organized into six distinct types: cropland, forest, grassland, water bodies, built-up areas, and unused land. Second, regarding environmental variables, the digital elevation model (DEM) was retrieved from the Geospatial Data Cloud, while data for population density, soil erosion modulus, and Normalized Difference Vegetation Index (NDVI) were obtained from the Resource and Environment Science and Data Center, Chinese Academy of Sciences. Annual precipitation was derived using ordinary kriging. Finally, all datasets underwent preprocessing in ArcGIS 10.8, including reprojection and resampling, to unify the spatial reference and grid size (30 m) for connectivity analysis. Although ordinary kriging may smooth local climatic variability, and the 30 m spatial resolution may not capture fine-scale landscape features, both are generally acceptable for regional-scale ecological network analysis.
3. Research Methods
3.1. Selection of Ecological Sources
3.1.1. Ecosystem Service Importance Assessment
Ecosystem services are key indicators of ecological health and function [47]. To capture the spatial heterogeneity of ecological functions across Anyang’s tripartite landscape—mountainous, hilly, and plain zones—we employed the InVEST model (version 3.14.1) to quantify four critical services: habitat quality, carbon storage, water yield, and soil retention. These services reflect core dimensions of biodiversity support, climate regulation, water security, and land degradation control under intense urbanization pressure. The Ecosystem Service Importance index (ESI) was then computed by integrating these four components [48]:
In this formula, represents the aggregate Ecosystem Service Importance index. The variables, , , and SR correspond to habitat quality, total regional carbon stock, annual water yield, and soil retention capability, respectively.
In this formula, refers to the habitat quality of patch within the land use category . and signify the habitat suitability of category and the threat level impacting patch , respectively, while serves as a scaling constant.
In this formula, denotes the total regional carbon storage. The components , , , and represent the carbon stocks found in soil, aboveground biomass, belowground biomass, and dead organic matter, respectively.
In this formula, stands for the annual water yield of grid cell in land use type . indicates the annual precipitation at grid cell , whereas represents the actual evapotranspiration associated with the land use category .
In this formula, refers to the soil retention capacity. The parameters , , and correspond to the rainfall erosivity, soil erodibility, and topographic factors, respectively, while and denote the vegetation cover and conservation practice factors.
3.1.2. Ecological Sensitivity Assessment
Ecological sensitivity reflects an ecosystem’s capacity to withstand and recover from external disturbances [49]. Given Anyang’s pronounced topographic gradients, intense land use transitions, and mounting anthropogenic pressures, we selected five spatially explicit indicators to characterize ecological vulnerability: slope, vegetation cover, land use/cover type, soil erosion intensity, and proximity to roads (Table 1). Factor weights were determined using the Analytic Hierarchy Process (AHP), and a composite sensitivity map was generated through multi-criteria spatial overlay. AHP was used to reflect relative ecological sensitivity based on expert judgment, which is suitable for heterogeneous regional landscapes. This approach captures the differential susceptibility of mountainous, hilly, and plain zones to human-induced degradation, thereby supporting robust source identification in a landscape where conventional assessments often overlook context-specific stressors [38].
Table 1.
Evaluation index system for ecological sensitivity.
3.1.3. Landscape Connectivity Analysis
To ensure spatial permeability among candidate ecological sources, we integrated Morphological Spatial Pattern Analysis (MSPA) with landscape connectivity metrics to evaluate structural and functional corridors [50]. MSPA, grounded in mathematical morphology, requires binary classification of the landscape into foreground (ecologically permeable) and background (non-permeable) classes. Following established protocols for temperate agro-ecological regions [51,52], we designated forest and grassland as foreground and cropland and water bodies, built-up areas, and unused land as background. The foreground layer was processed in GuidosToolbox 2.8 to delineate seven mutually exclusive morphological classes [53]. Among these, core areas—representing large, internally connected patches with high ecological integrity—were extracted as initial source candidates. Candidate ecological sources were identified using combined thresholds of patch area (>2.5 km2) and dPC (>0.3) to exclude excessively small and fragmented patches while retaining those with relatively important regional connectivity contributions. Their connectivity was quantified using two widely adopted indices in circuit-theoretic and graph-based EN design: the Probability of Connectivity (PC) and the dPC (delta PC) index, which measures the contribution of individual patches to overall network cohesion. Calculations were performed in Conefor 2.6, with the following formulations:
In this formula, and represent the probability of connectivity for the entire landscape and the relative importance of a specific patch, respectively. The parameters and correspond to the total number of patches and the total area of the study region, respectively. Additionally, and denote the areas of patches and , while stands for the maximum dispersal probability between these two patches. Furthermore, stands for the probability of connectivity calculated following the removal of the target patch.
3.2. Ecological Resistance Surface Modeling
The ecological resistance surface represents the degree to which landscape features impede ecological flows [54]. Integrating Anyang’s natural and socio-economic conditions and drawing on established resistance factor frameworks [55,56], we selected a set of indicators strongly correlated with ecological source expansion. Factor weights were determined using Principal Component Analysis (PCA) to minimize subjectivity and multicollinearity (Table 2). In this framework, PCA was used as a data-driven approach to characterize resistance patterns and reduce subjectivity and multicollinearity in resistance weighting. Each factor layer was processed in ArcGIS—including reclassification, standardization, and Euclidean distance transformation where applicable—and subsequently integrated through weighted overlay according to their PCA-derived weights to produce a composite resistance surface for ecological source expansion.
Table 2.
Evaluation index system and weights of resistance factors in Anyang.
3.3. Ecological Corridors and Nodes Extraction
Based on circuit theory, we constructed the ecological network by identifying three key components: corridors, pinch points, and barrier points. First, utilizing the weighted resistance surface, we extracted ecological corridors as least-cost pathways using the Linkage Pathway tool in ArcGIS. These corridors serve as essential channels for biological migration and energy flow [57]. Ecological nodes are critical structural elements that link habitat patches and include two distinct types: pinch points and barrier points. To spatially identify these, we employed the Pinchpoint Mapper and Barrier Mapper modules. These tools generated maps for current density (highlighting vulnerable bottlenecks) and barrier mitigation scores (highlighting flow impediments [58]), respectively.
Finally, we applied the Jenks natural breaks method to classify these raster results into four categories. The areas falling into the highest tier were designated as the final ecological pinch points and barrier points, forming a spatially integrated network for Anyang.
3.4. Ecological Network Optimization
Complex networks provide a topological abstraction of real-world complex systems, capturing the interaction patterns among their constituent components [59]. A typical complex network consists of numerous nodes linked by edges. Given the structural correspondence between the “node–edge” logic of complex networks and the “source–corridor” configuration of ecological networks, this framework enables precise quantification of structural vulnerability and offers a robust basis for targeted network enhancement.
In this study, we applied complex network theory to identify vulnerable components and optimize Anyang’s ecological network using Gephi software (version 0.10.1). The procedure comprised four steps:
- Ecological sources and corridors were abstracted into nodes and edges, respectively, to construct a spatially explicit ecological topology.
- Five topological metrics—degree, betweenness centrality, closeness centrality, clustering coefficient, and eigenvector centrality—were selected to quantitatively assess node importance and overall network structure [60].
- Targeted enhancements were implemented by adding corridors in topologically vulnerable regions to reduce the structural isolation of peripheral nodes and strengthen connectivity between key ecological sources.
- Post-optimization values of these metrics, along with network robustness, were computed to evaluate improvement efficacy [61] (Table 3).Table 3. Topological and robustness metrics of complex networks.
4. Results
4.1. Ecological Source Identification
4.1.1. Results of Ecosystem Service Importance Assessment
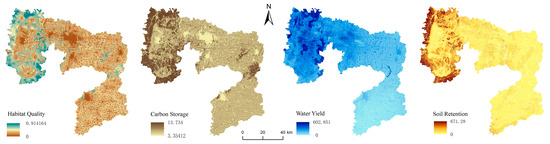
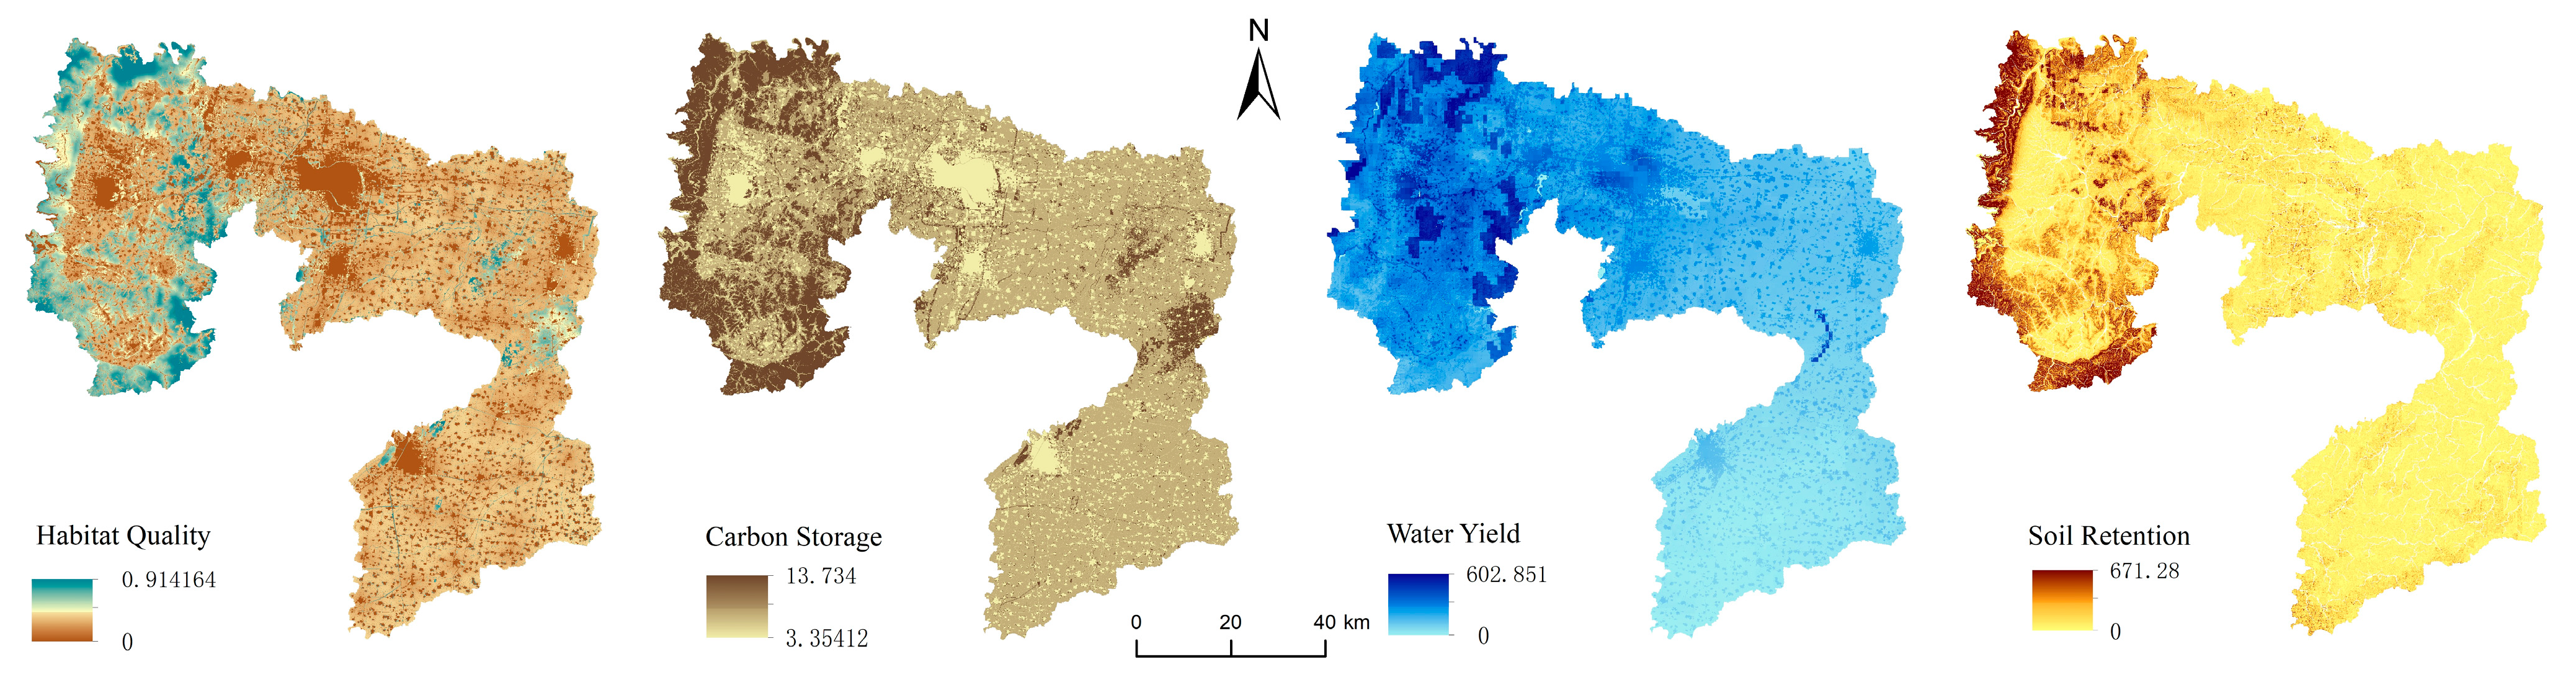
Habitat quality, carbon storage, water yield, and soil retention serve not only as key indicators of regional ecosystem functioning but also as critical criteria for ecological source identification [62]. Figure 2 illustrates that ecosystem services in Anyang display a distinct spatial gradient, characterized by elevated values in the western and northern sectors and comparatively diminished levels in the eastern and southern zones. Specifically, Anyang’s carbon stock totals 6.34 × 10⁷ t, averaging 86.11 t/ha; water yield totals 3.9856 × 10¹⁰ m3, averaging 5.42 × 10⁴ m3/ha; soil retention is 1.88 × 10⁸ t, averaging 255.56 t/ha; and high-value habitat quality zones cover about 1161.80 km2 (15.80% of the city), primarily consisting of forested land.
Figure 2.
Spatial distribution of ecosystem services in Anyang.
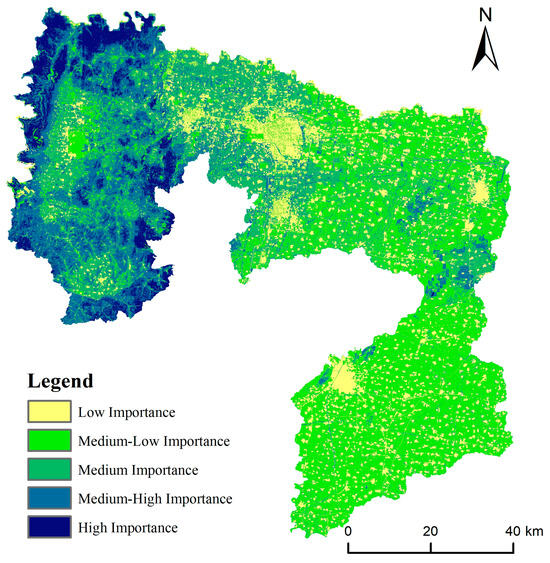
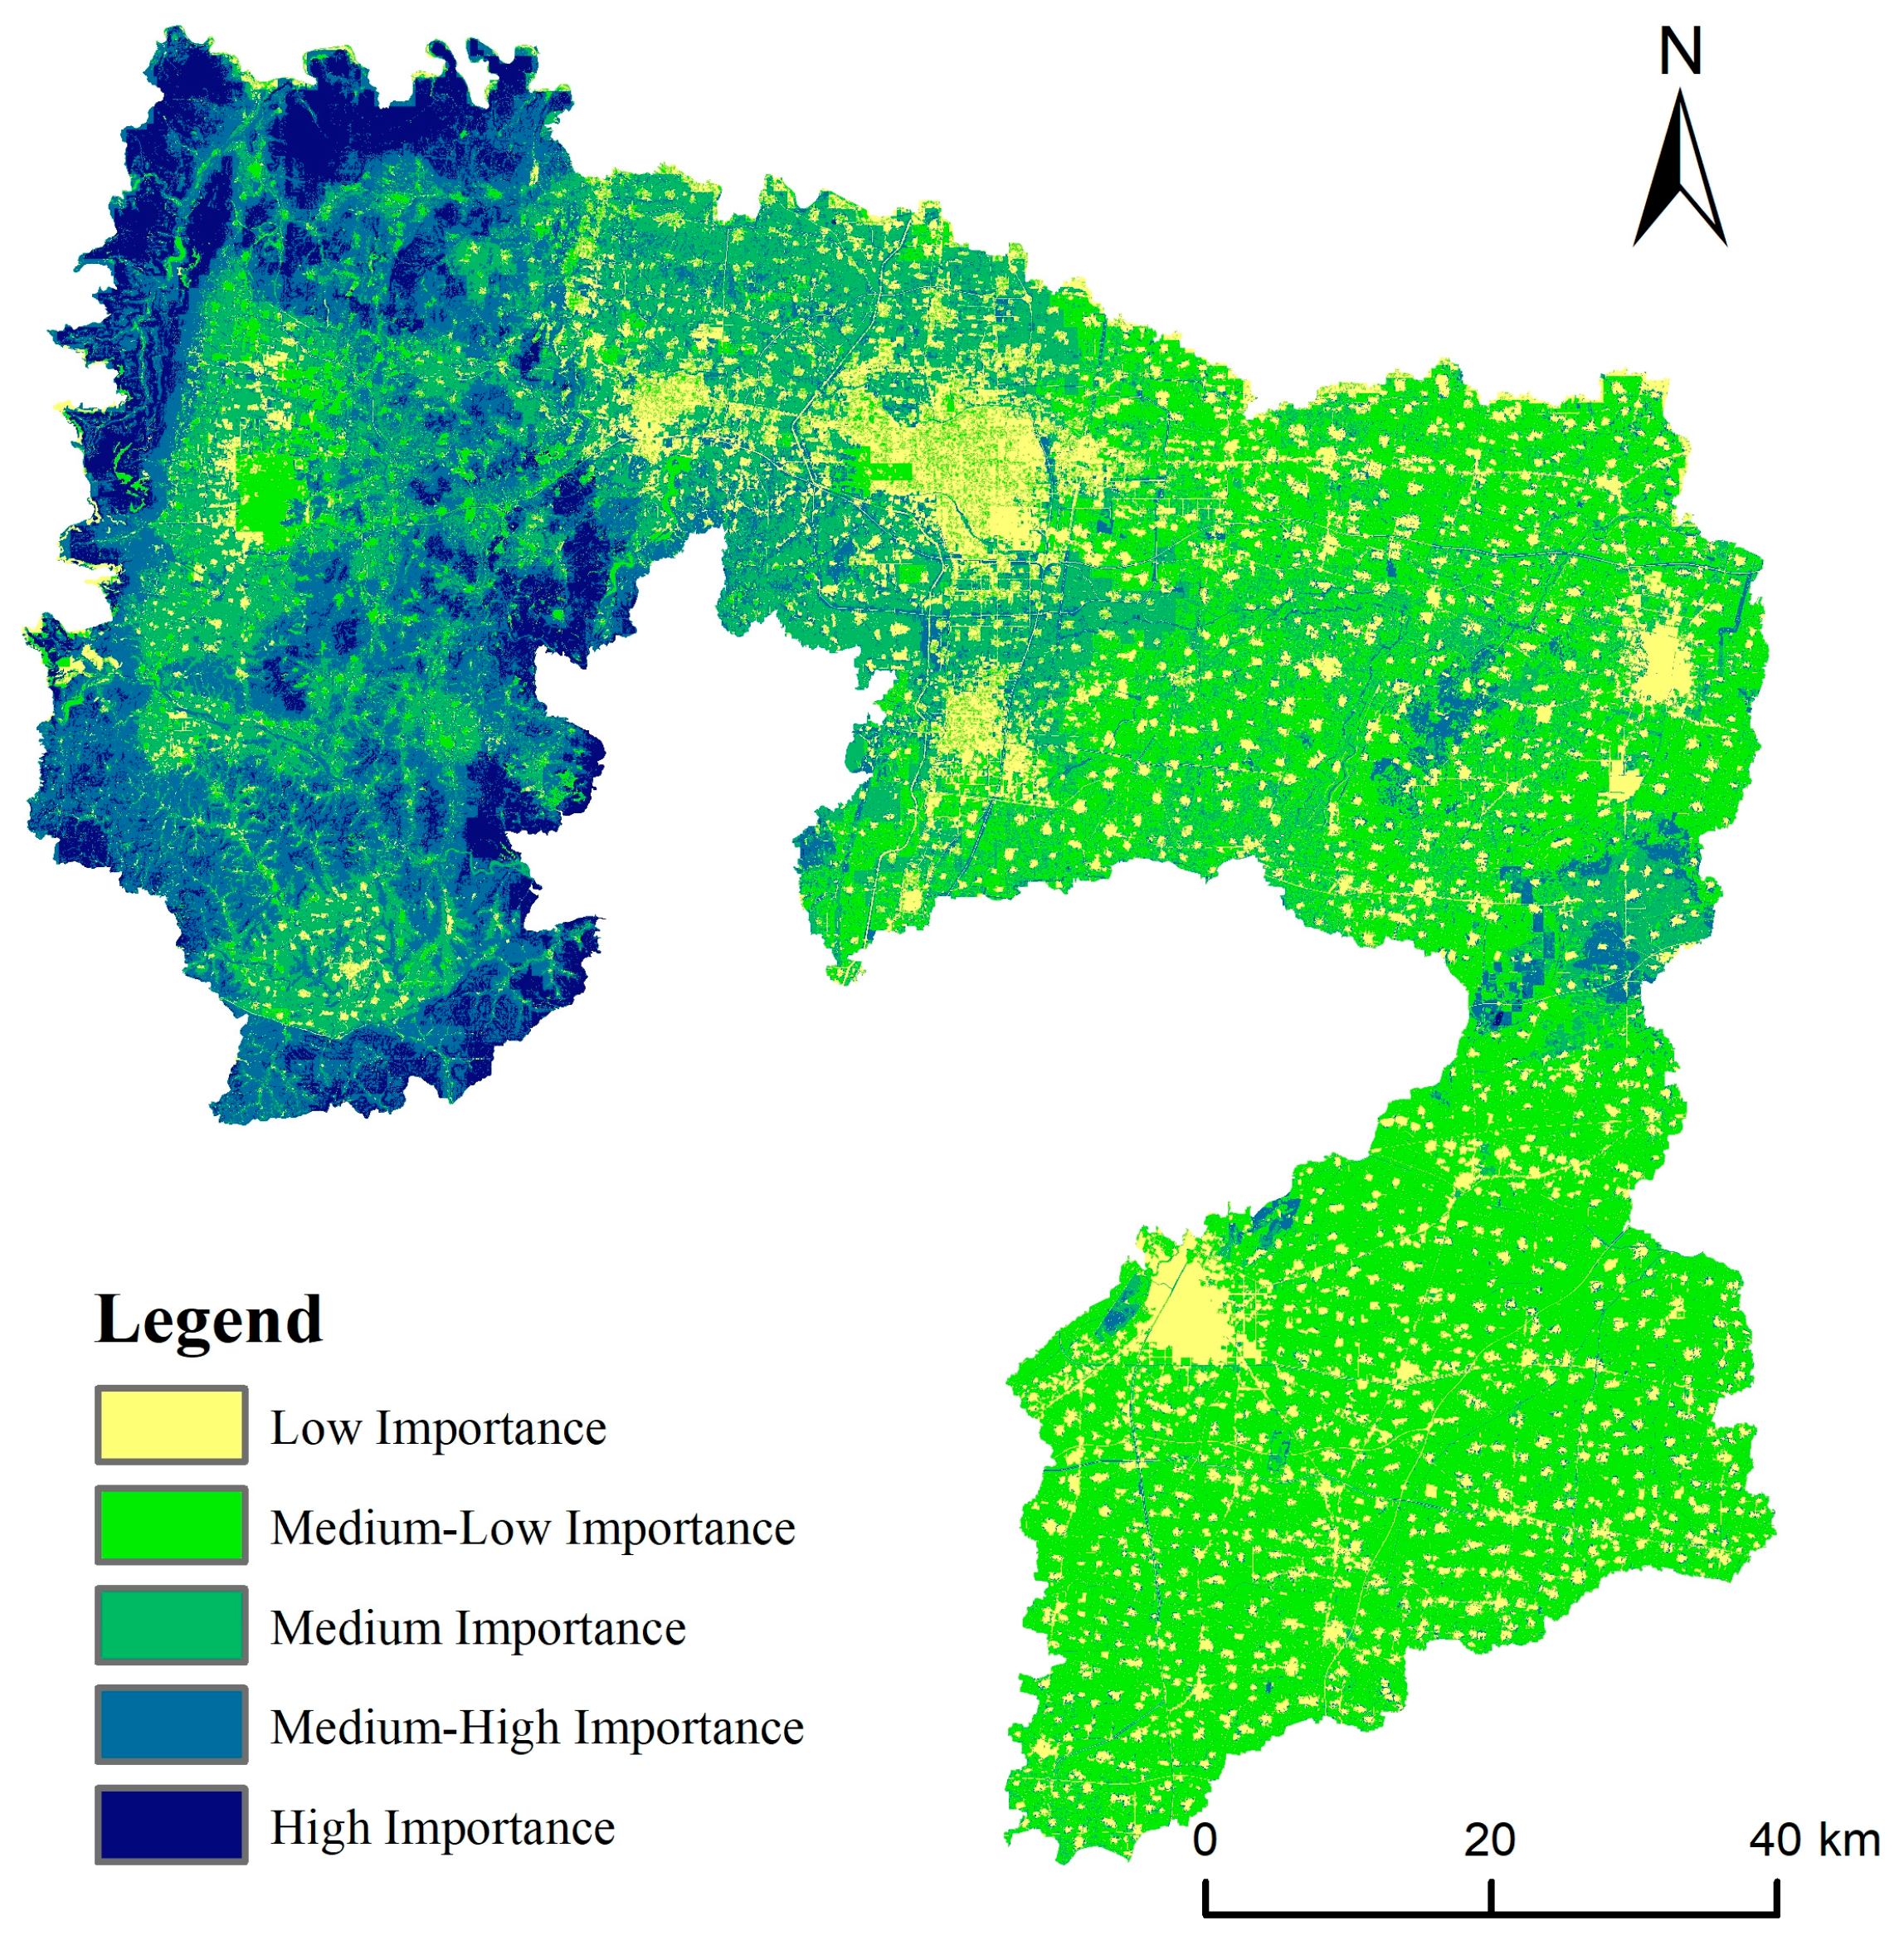
To synthesize these services, the Ecosystem Service Importance index (ESI) was classified into five tiers—high, medium–high, medium, medium–low, and low importance—using the natural breaks (Jenks) method (Figure 3). Overall, Anyang’s ESI shows a clear spatial contrast, with higher levels concentrated in the western and northern regions and lower levels in the eastern and southern areas. Areas of high and medium–high importance occupy 482.49 km2 (6.57%) and 1437.37 km2 (19.55%), mainly in western Linzhou City (the towns of Rencun, Donggang, Shibanyan, and Dongyao), dominated by forest. Medium-importance zones span 1436.91 km2 (19.54%), primarily in Anyang County, Long’an District, and Linzhou City, predominantly comprising farmland and grassland. Medium–low-importance regions total 2825.94 km2 (38.44%), concentrated in eastern Neihuang County and southern Huaxian County, primarily farmland, representing Anyang’s major grain production zones. Low-importance zones, with a total area of 1169.25 km2 (15.90%), are situated in the urban core and county towns, characterized by widespread built-up land, and serve as Anyang’s economic and social hubs.
Figure 3.
Spatial distribution of ESI in Anyang.
4.1.2. Assessment of Ecological Sensitivity
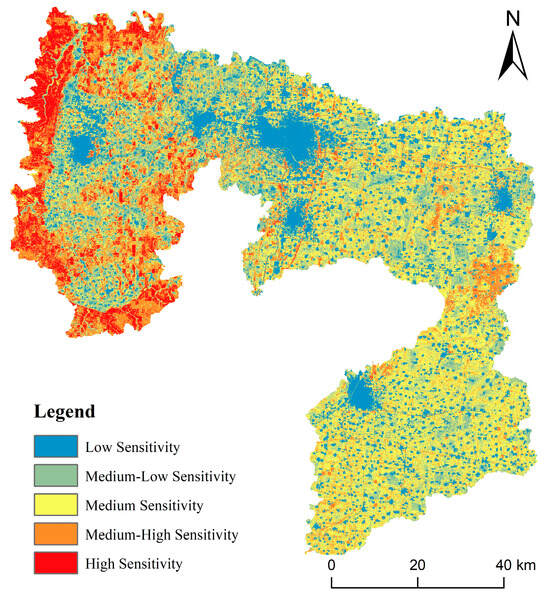
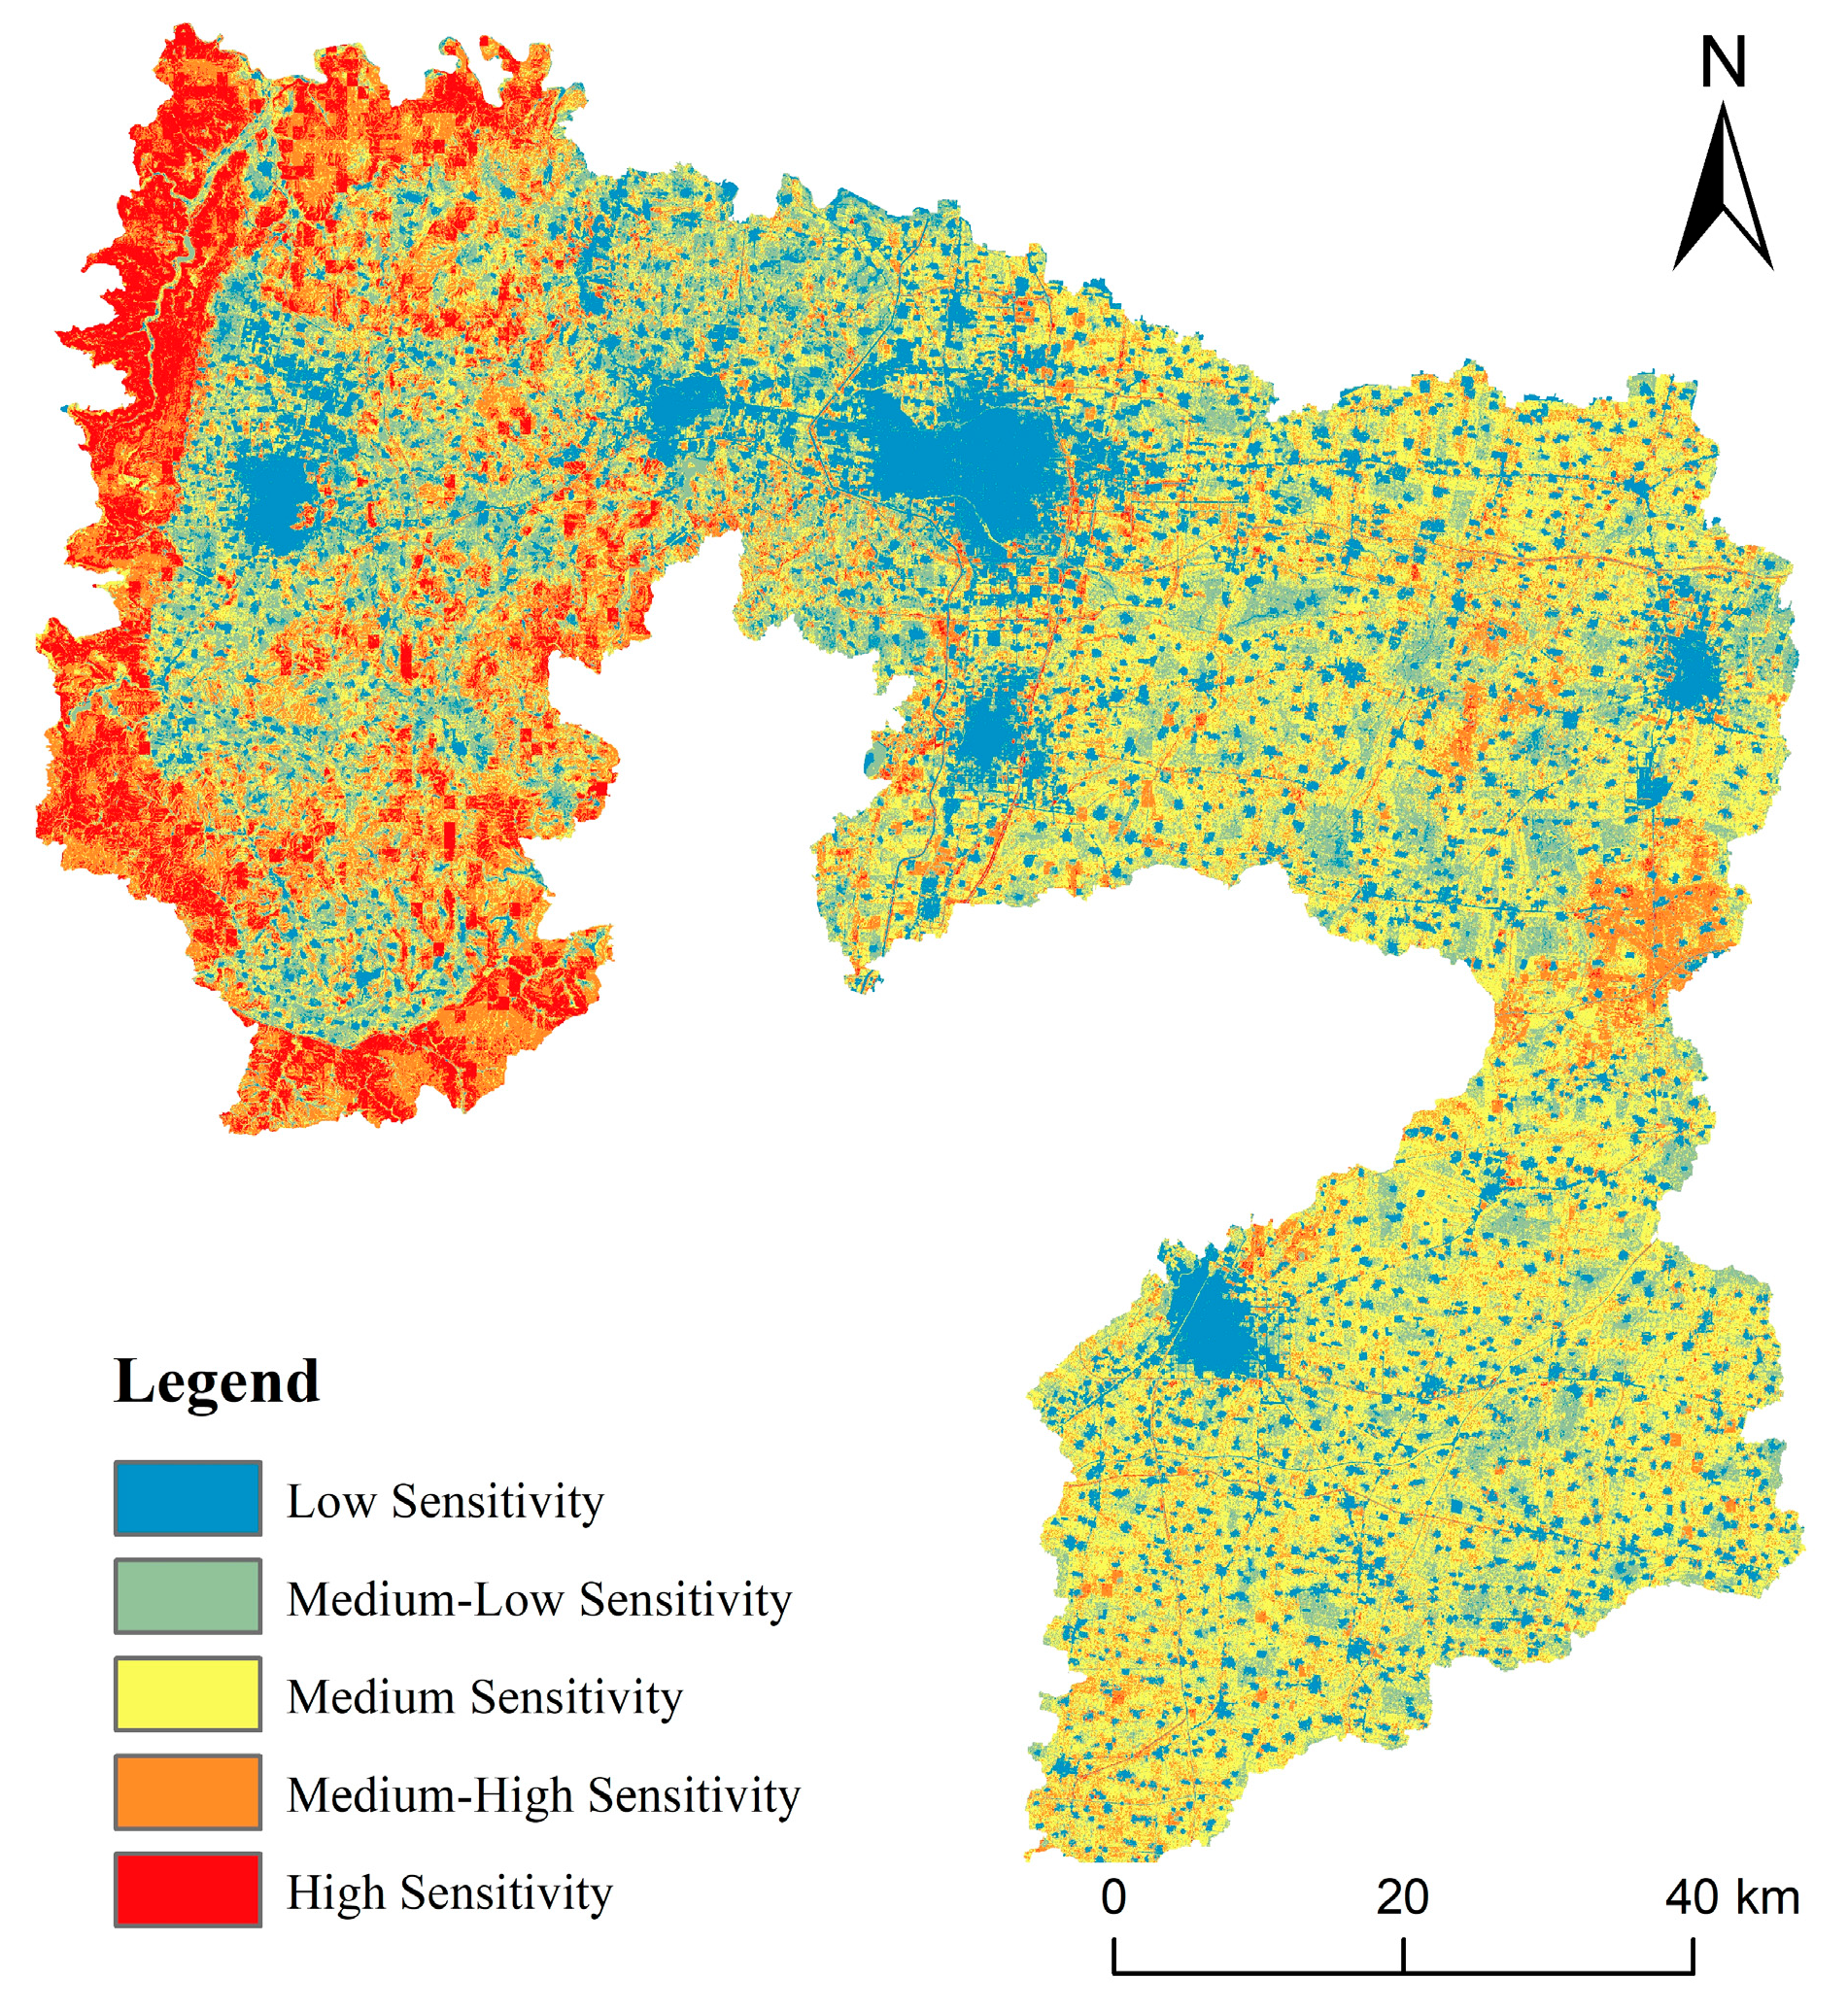
Anyang’s ecological sensitivity ranges from medium–low to medium, with higher values in the west and lower values in the south (Figure 4). High-sensitivity zones occupy 516.02 km2 (7.05%), mainly in western forested areas with slopes exceeding 30°, and are susceptible to soil erosion. Medium–high-sensitivity areas total 1382.55 km2 (18.89%), located adjacent to high-sensitivity zones and extensively in eastern Neihuang County, with slopes of 10–20°. Zones classified as medium, medium–low, and low sensitivity occupy 2705.09 km2 (36.96%), 1540.25 km2 (21.05%), and 1174.22 km2 (16.05%), respectively, primarily in the eastern, northern, and southern plains, dominated by cropland and built-up land.
Figure 4.
Spatial distribution of ecological sensitivity in Anyang.
4.1.3. Assessment of Landscape Connectivity
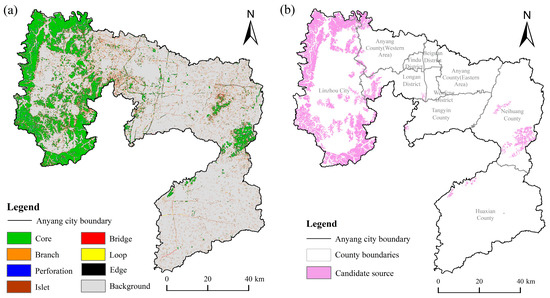
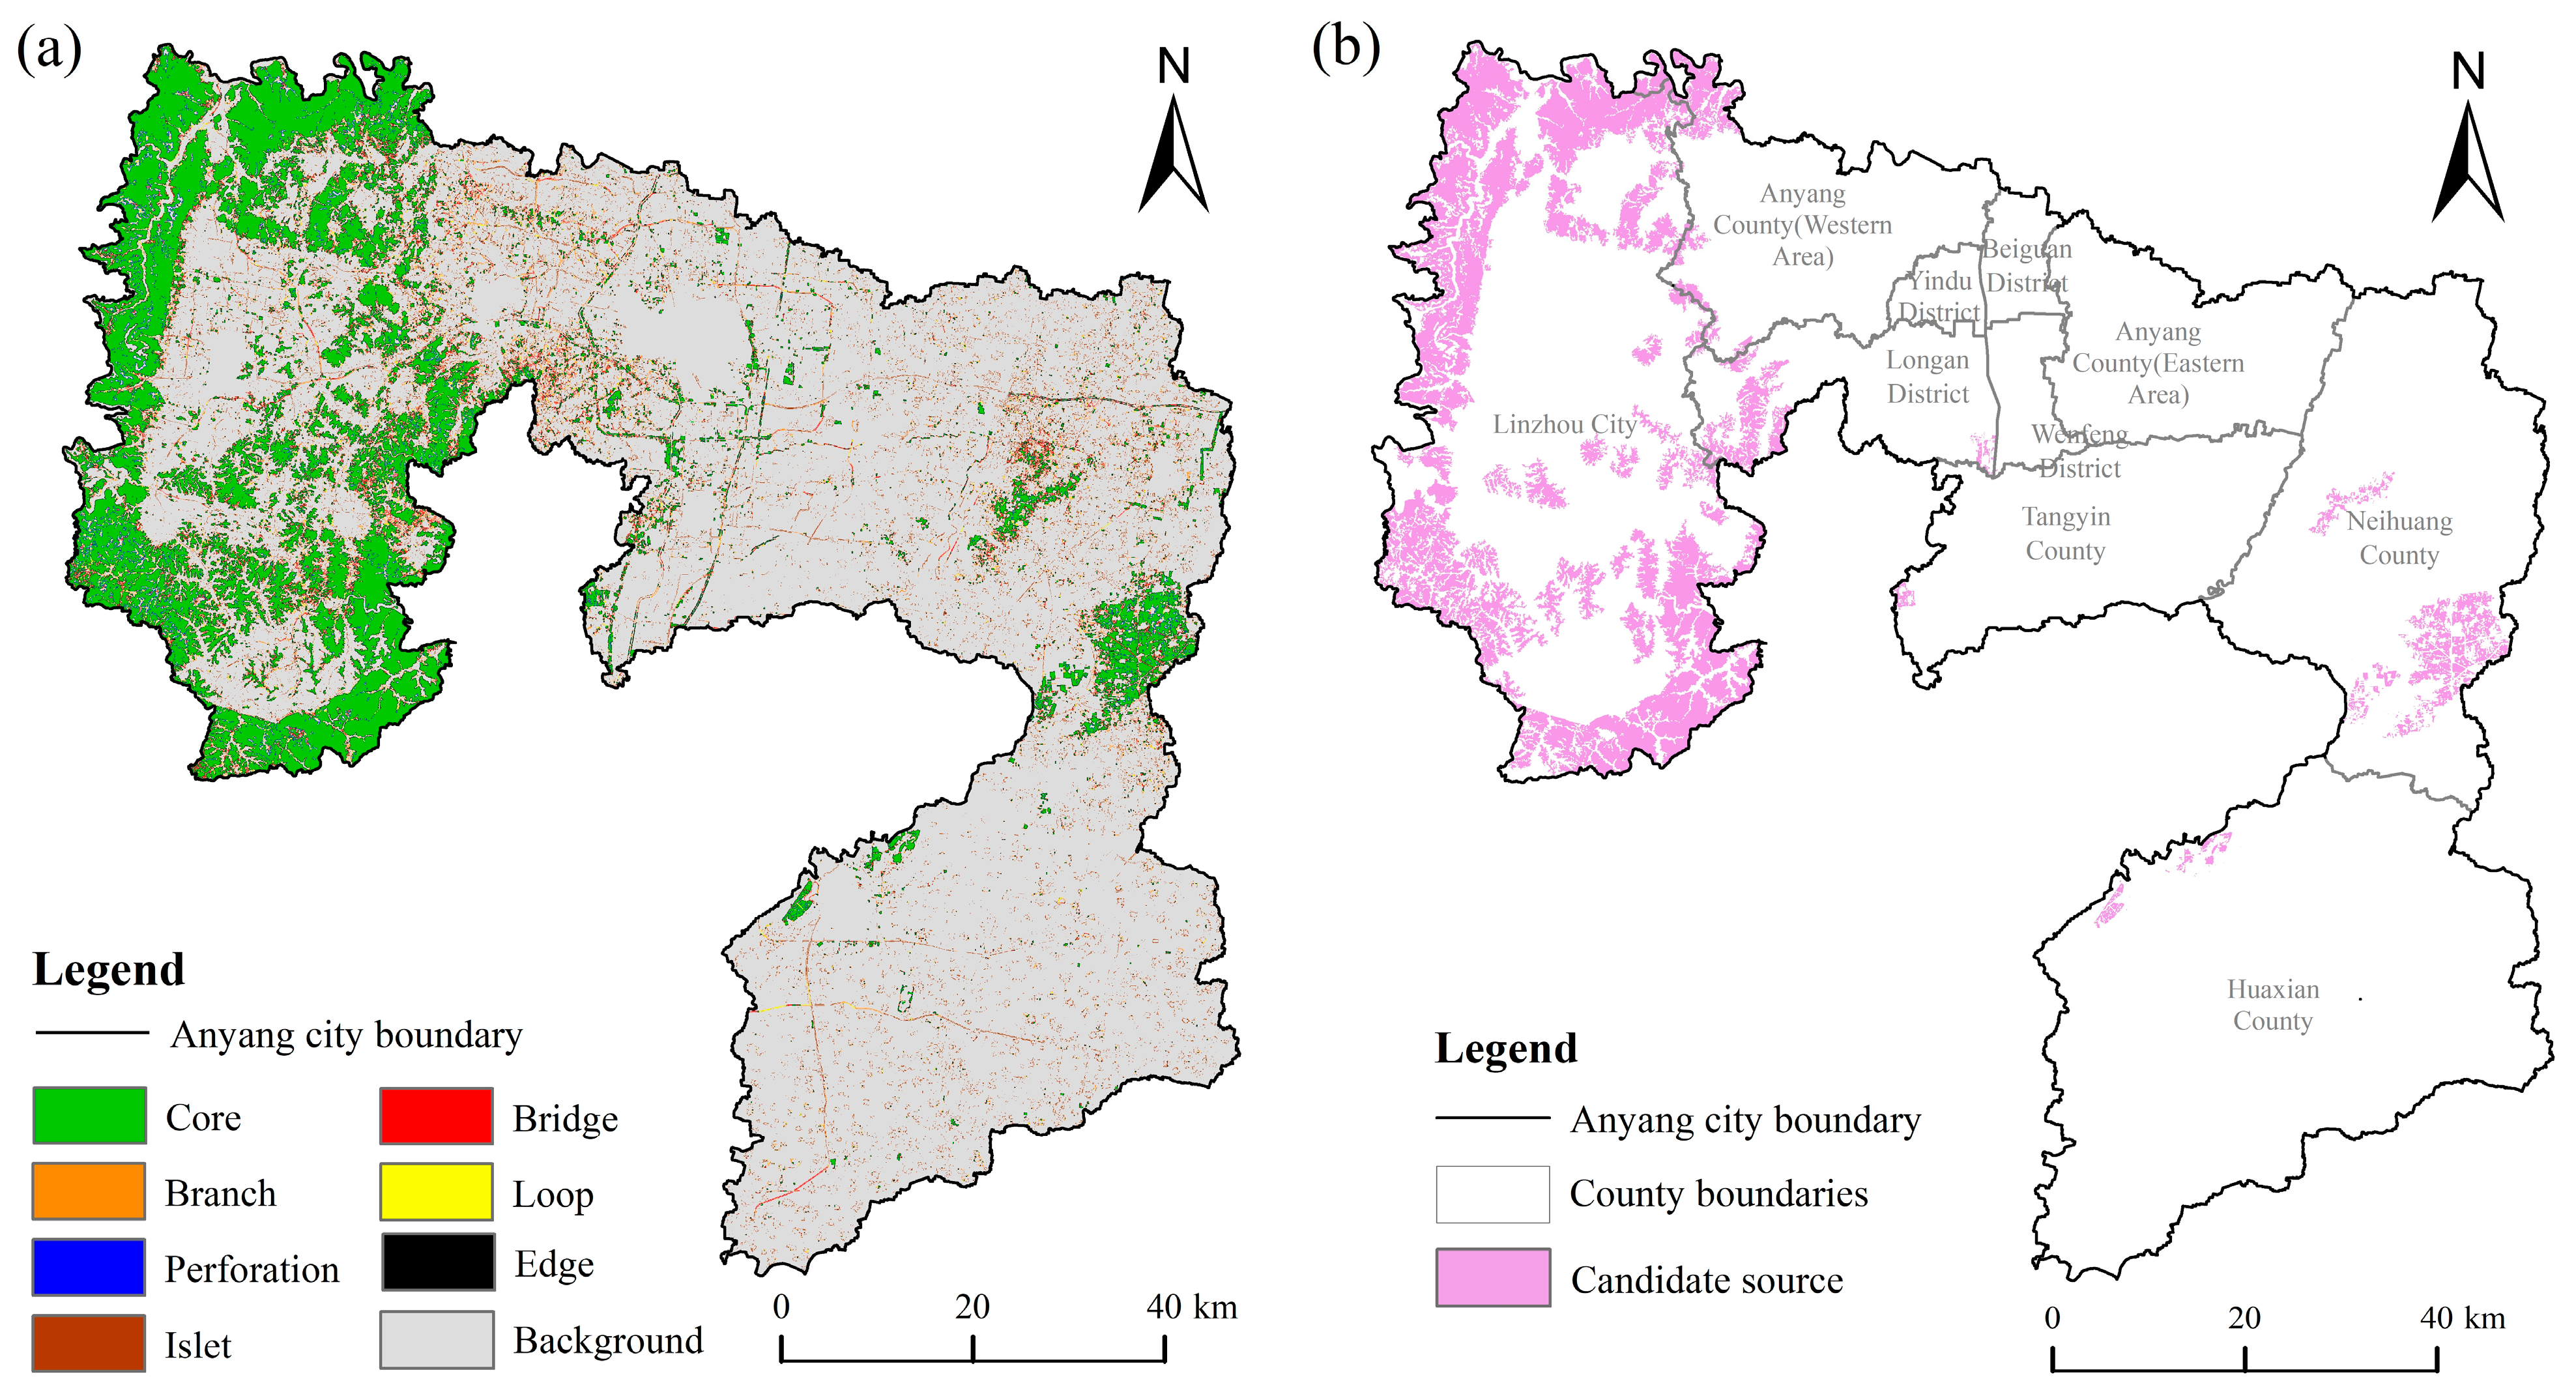
MSPA was employed to assess patch connectivity for identifying core ecological patches, yielding seven types of foreground landscapes (Figure 5a). The core areas of Anyang span 1078.44 km2, accounting for 58.56% of the total foreground landscape, predominantly located in western Linzhou City and eastern Neihuang County. Candidate ecological sources were defined as core patches with an area of >2.5 km2 and dPC > 0.3 (Figure 5b), resulting in 59 patches totaling 848.25 km2, representing 78.66% of the core area and 11.54% of Anyang’s total land area. These candidate sources are unevenly distributed, primarily in western Linzhou City, Anyang County, and Long’an District. Eastern patches are small and dispersed, and central and southern regions contain almost no candidate ecological sources.
Figure 5.
(a) MSPA analysis in Anyang; (b) spatial distribution of candidate sources in Anyang.
4.1.4. Spatial Distribution of Ecological Sources
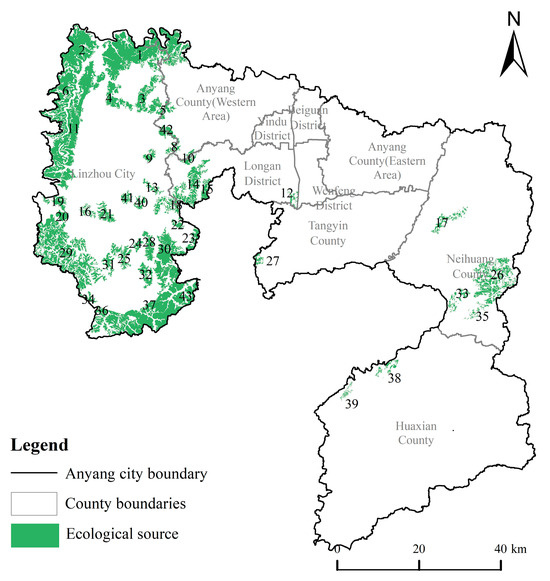
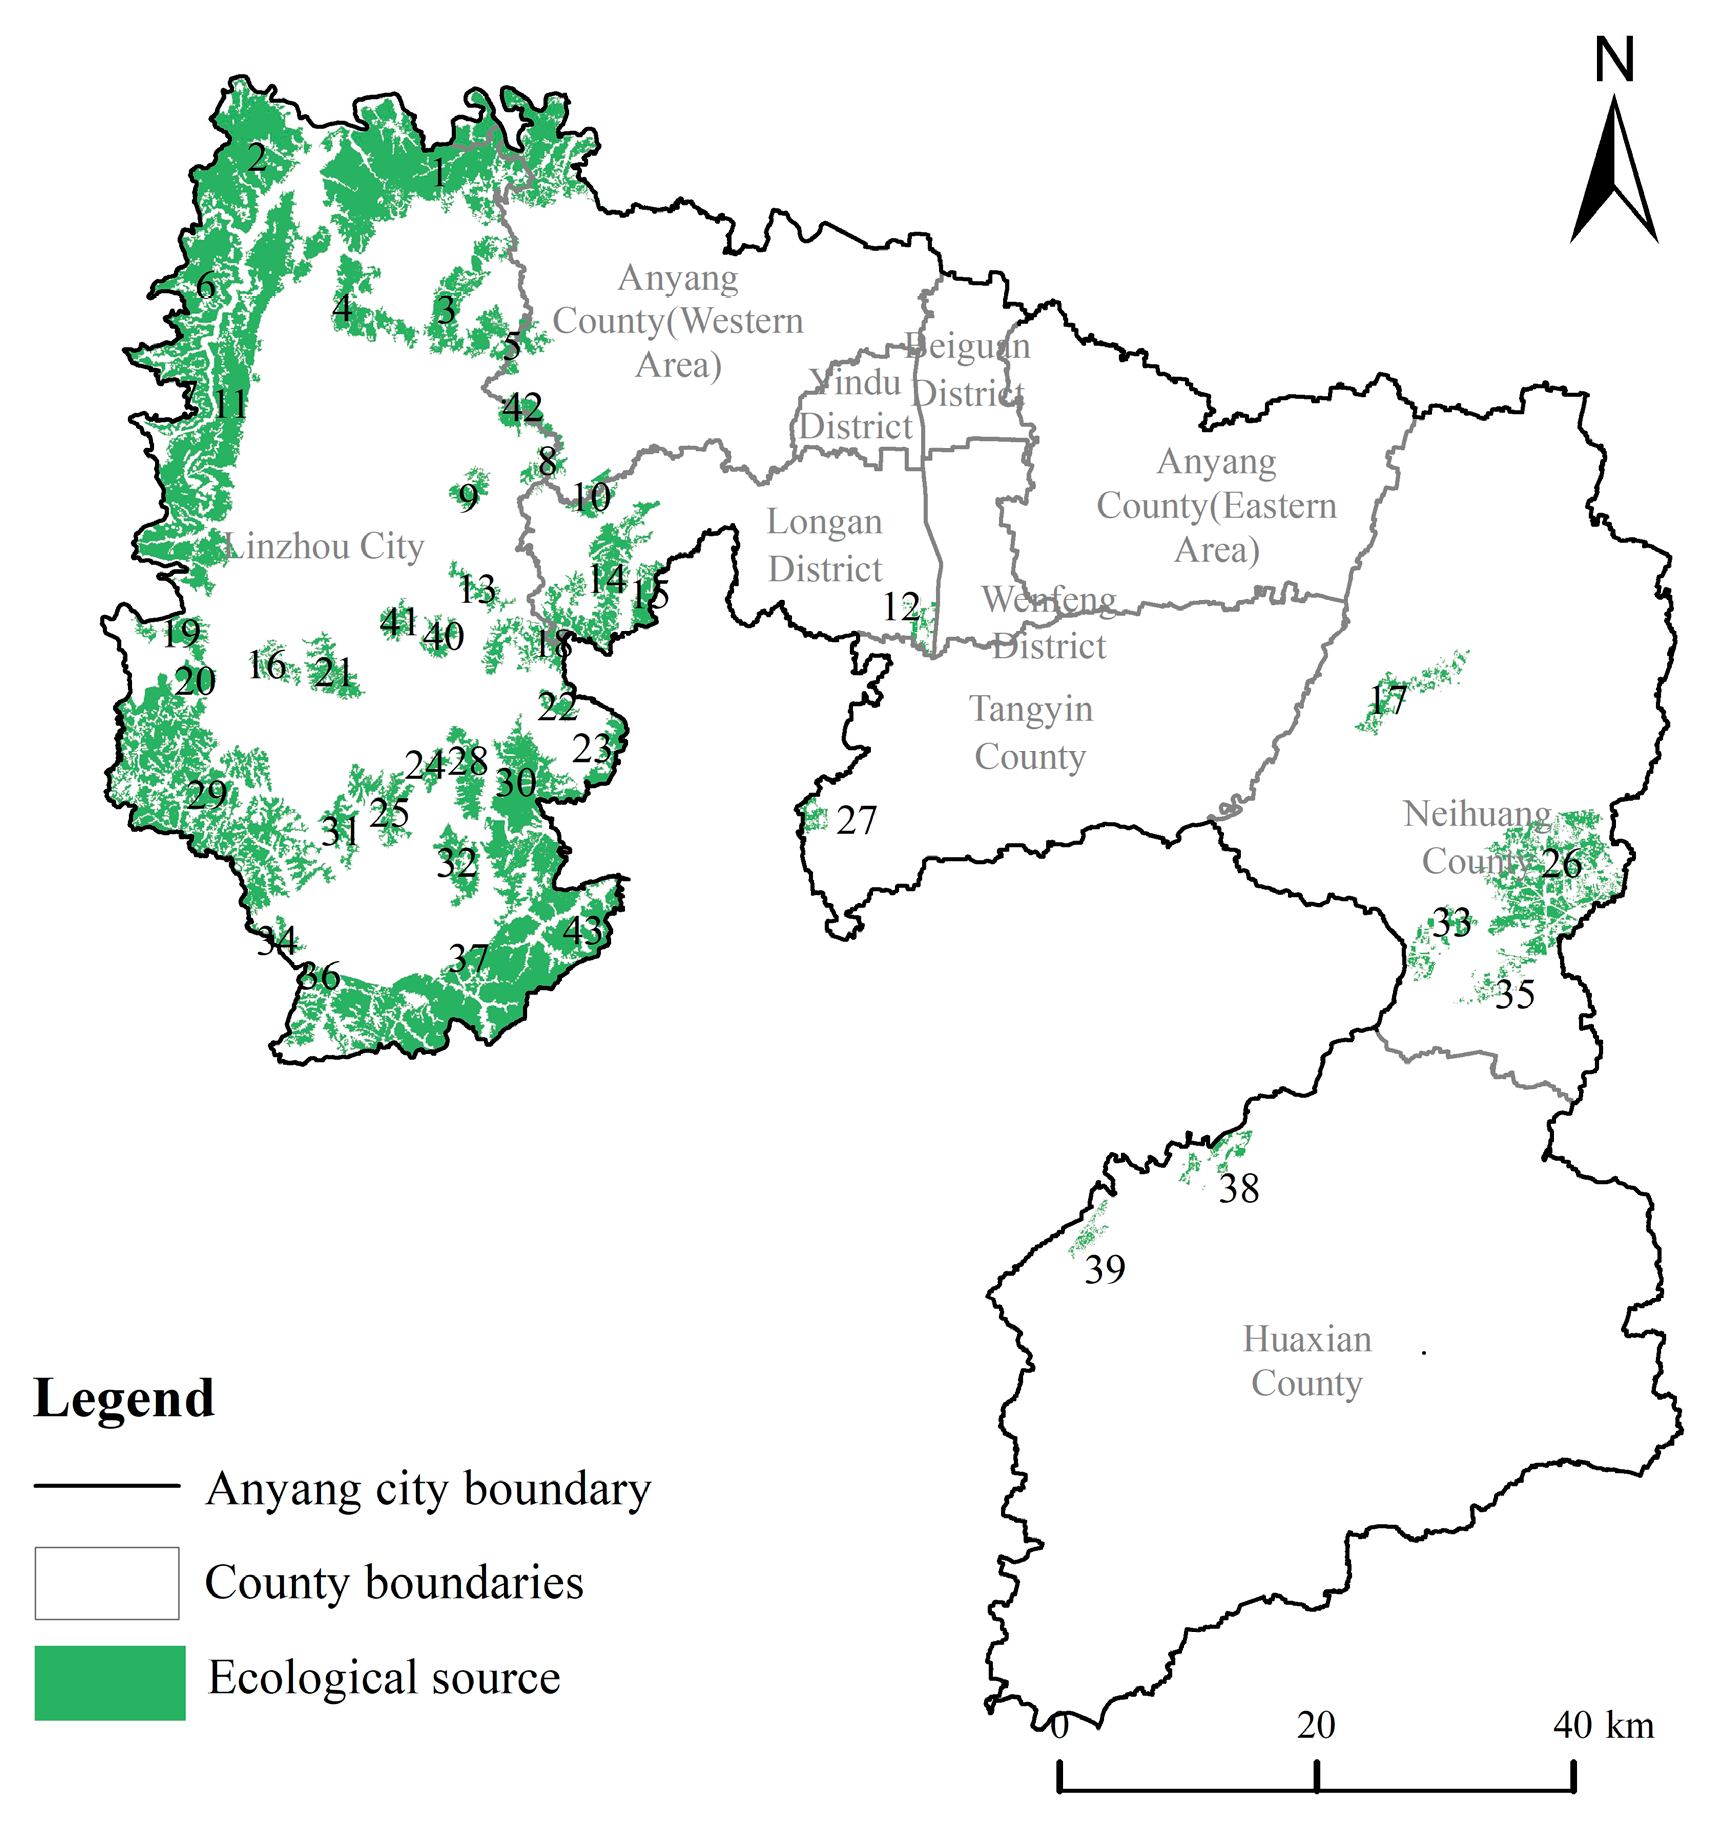
Weighted spatial layers of ESI and ecological sensitivity were combined and classified into five levels: low, medium–low, medium, medium–high, and high. Patches in the medium–high and high categories intersecting candidate ecological sources defined the final spatial distribution of ecological sources in Anyang (Figure 6). A total of 43 ecological sources were identified, with a combined area of 820.72 km2, representing 11.16% of the total land area. The five largest ecological sources (Nos. 1, 37, 11, 29, and 2) cover 113.39, 109.21, 97.60, 92.75, and 48.80 km2, respectively, collectively constituting 56.26% of the entire ecological source territory, and are exclusively located in western Linzhou City.
Figure 6.
Spatial distribution of ecological sources in Anyang. Numbers in the figure indicate the IDs of ecological sources.
Ecological sources are predominantly forest (94.46%, 775.28 km2), with grassland comprising 5.54% (45.44 km2). The spatial distribution is highly clustered, with 674.53 km2 (82.19%) located in the western Taihang Mountains. Eastern and southern regions amount to only 60.63 km2, and no ecological sources are present in the urban core.
4.2. Construction of the Ecological Network
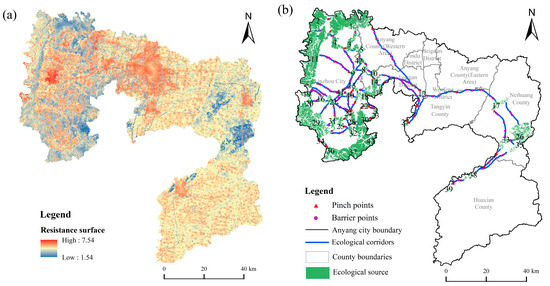
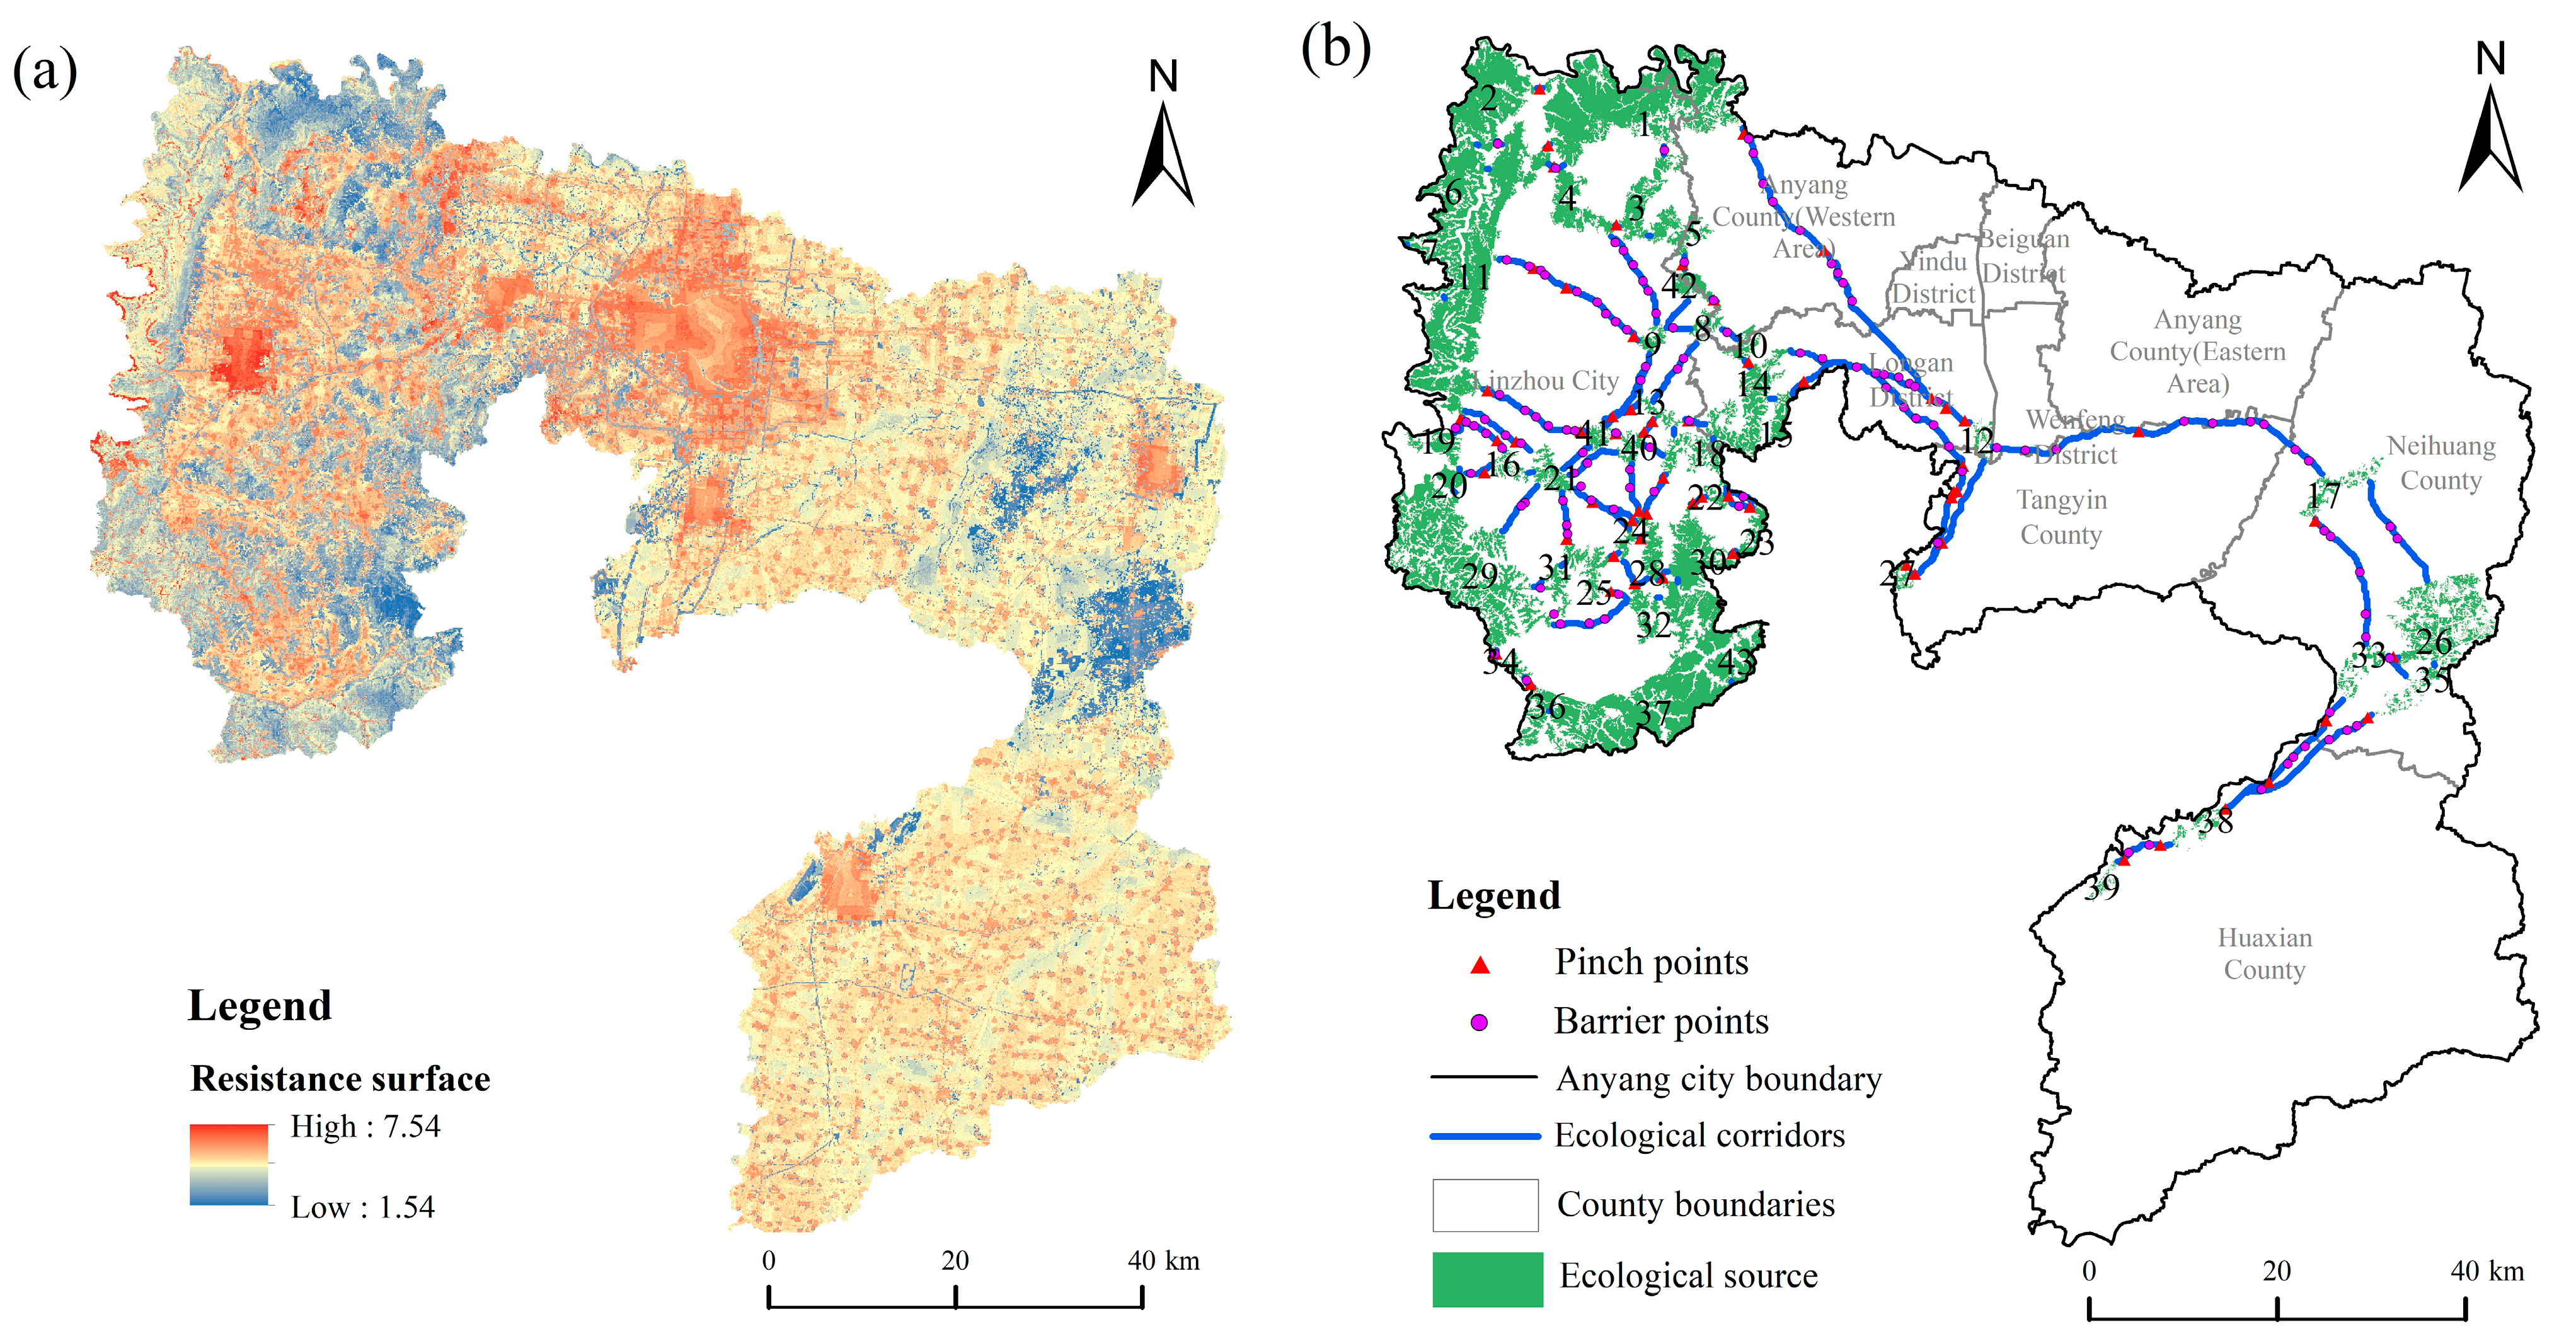
The ecological resistance surface for source expansion in Anyang exhibits a central–high, east–west–low spatial pattern (Figure 7a). High-resistance zones are dominated by built-up land, largely coinciding with city and county centers and major transportation corridors.
Figure 7.
(a) Ecological resistance surface in Anyang; (b) EN in Anyang. Numbers in the figure indicate the IDs of ecological sources.
A total of 82 ecological corridors were extracted using least-cost path analysis in ArcGIS 10.8 (Figure 7b), with a total length of 460.35 km. The density of corridors is higher in the west and lower in the east, with 278.65 km (60.53% of total length) concentrated in western Linzhou City and central Long’an District. Eastern and southern corridors total 78.01 km. The longest corridor (43.50 km) connects ecological sources 1 and 12, followed by the corridor (40.68 km) between sources 1 and 17.
The analysis further revealed 62 ecological pinch points (Figure 7b); notably, 43 of these (constituting 69.35%) are located in western Linzhou City, primarily in forest and grassland areas. Additionally, 120 barrier points were identified, primarily near urban centers and major roads. 59.76% of ecological corridors intersect with at least one barrier point [63].
4.3. Optimization of EN
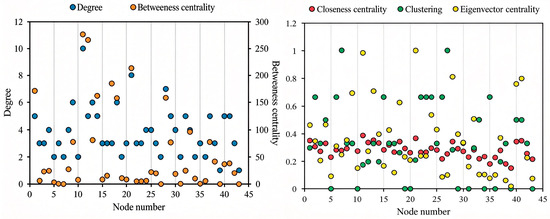
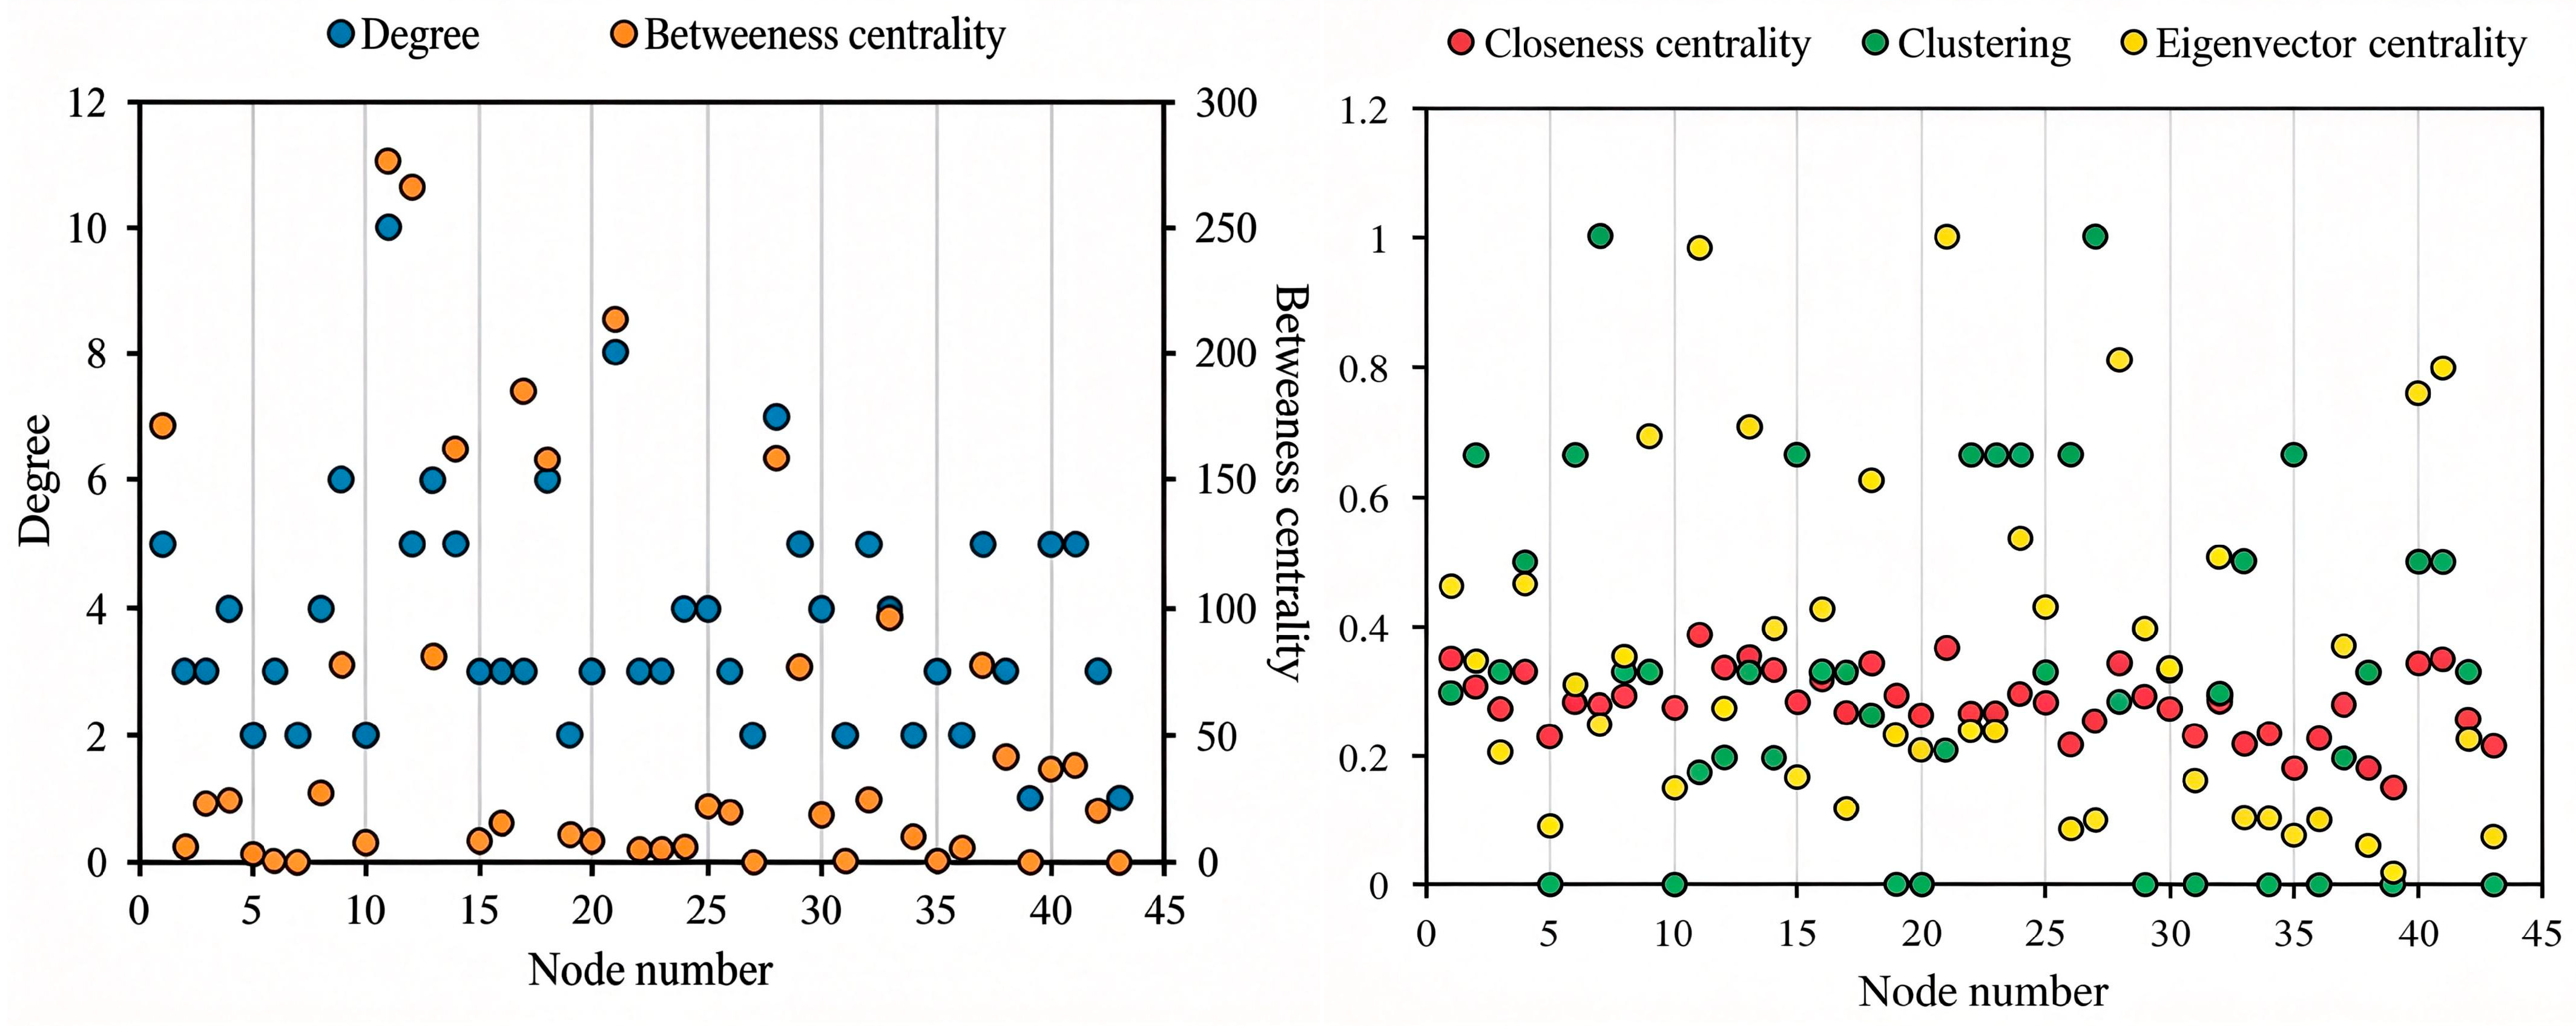
Anyang’s ecological network was represented as a topological network, and complex network modeling was applied to compute its topological metrics (Figure 8). The network exhibits an average graph density of 0.091 and a mean node degree of 3.81 (maximum: 10 at node 11; minimum: 1 at nodes 39 and 43). Six nodes exceed a degree of 5, representing 13.95% of the network.
Figure 8.
Topological characteristics of the EN in Anyang.
Betweenness centrality averages 55.44, peaking at 276.21 (node 11); 36 nodes exceed a value of 3 (83.72%), while four nodes (7, 27, 39, and 43) have a betweenness centrality of 0 (9.30%). Closeness centrality has a mean of 0.29 and a maximum of 0.39 (node 11). The mean clustering coefficient is 0.34, with a maximum of 1.0 (nodes 7 and 27); ten nodes exceed 0.5 (23.26%), while five nodes (5, 10, 19, 20, and 29) have a clustering coefficient of 0 (11.63%). Eigenvector centrality averages 0.35, peaking at 1.0 (node 21); four nodes (11, 21, 28, and 41) exceed 0.8.
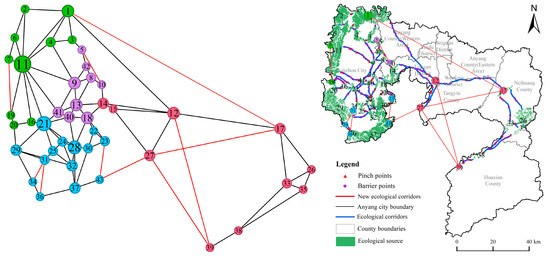
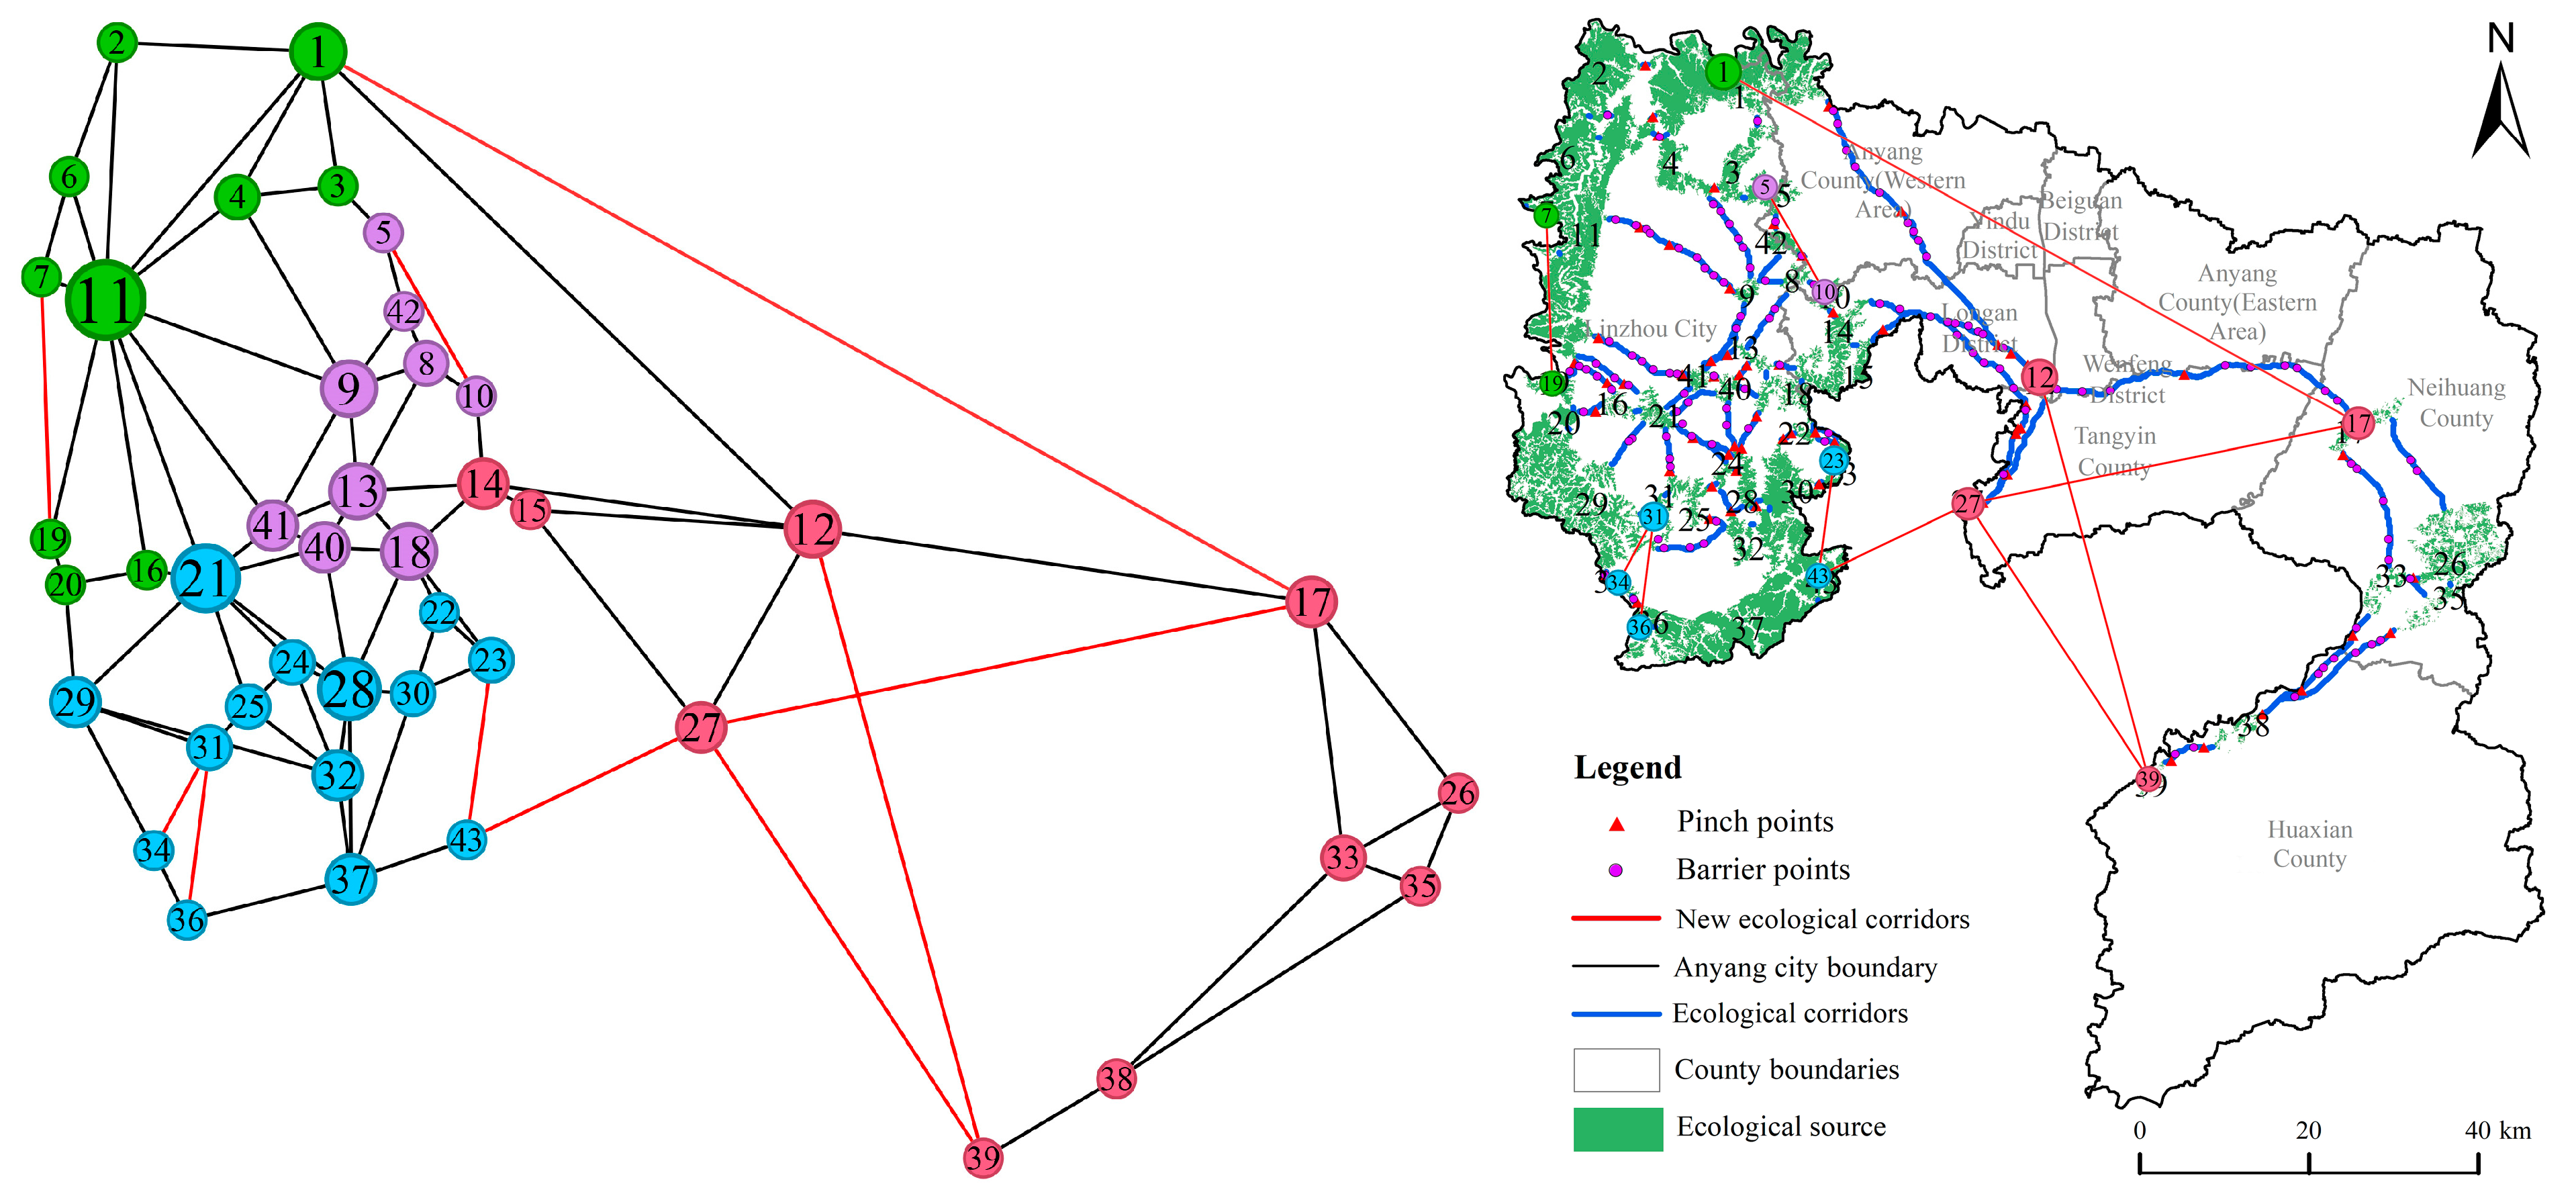
Nodes 11 and 21 exhibit the highest centrality across multiple metrics, indicating their importance for maintaining overall network connectivity. Nodes 5, 7, 10, 19, 27, 31, 34, 36, 39, and 43 show consistently low values across topological indicators, suggesting structural isolation and limited contribution to network cohesion. Nodes 39 and 43 are peripheral, with degree = 1 and betweenness = 0, indicating a higher risk of disconnection within the network. Connectivity is sparse in the southwestern and southeastern regions, which corresponds to areas with more fragmented habitats and higher landscape resistance. Based on this assessment, 10 additional edges (ecological corridors) were added to connect weakly linked nodes and enhance connectivity in low-density regions (Figure 9). After optimization, the newly added corridors extended connectivity from the densely connected western source area to the weaklier connected central and eastern parts of the network, reducing peripheral isolation and improving the spatial balance of ecological connectivity.
Figure 9.
Optimized EN of Anyang. Numbers in the figure indicate the IDs of ecological sources.
5. Discussion
5.1. Key Factors in Ecological Network Construction
Ecological sources play a pivotal role in maintaining ecosystem stability and safeguarding regional ecological security [64]. In this study, a comprehensive framework integrating ecosystem service importance, ecological sensitivity, and landscape connectivity was developed to identify ecological sources, thereby accounting for ecosystem functionality, disturbance resistance, and structural resilience—a methodologically robust approach [65]. The analysis reveals that ecological sources in Anyang are mainly concentrated in the western Taihang Mountains. This spatial pattern is closely associated with the region’s forest-dominated land cover, high forest coverage, and superior performance across multiple ecosystem services—including habitat quality, carbon storage, soil retention, and water yield—relative to other areas. However, these same zones exhibit high ecological sensitivity, significant soil erosion risk, and low disturbance resilience, underscoring their critical need for protection as core ecological sources. In contrast, central, eastern, and southern Anyang—characterized by flat terrain and intensive anthropogenic activities—contain few ecological sources, a finding consistent with studies by Fan et al. [66] and Li [67].
Ecological corridors serve as vital conduits linking ecological sources, essential for maintaining network integrity and facilitating material and energy flows [68]. The construction of a resistance surface is fundamental to corridor delineation. In this study, resistance values were assigned through expert elicitation, and weights were determined via principal component analysis—an integrated strategy that balances empirical knowledge with data-driven objectivity, thereby enhancing result reliability [69]. Due to spatial heterogeneity in land use, elevation, slope, distance to roads or rivers, and population density, ecological corridors in Anyang exhibit a pronounced west-concentrated and east-dispersed pattern. The western mountains, with low land use intensity and sparse road networks, support numerous and densely distributed corridors. Conversely, extensive built-up land and cropland in central, eastern, and southern regions frequently fragment corridors at urban settlements, highways, and hydraulic infrastructure, promoting the formation of ecological islands.
The spatial distribution of pinch points largely mirrors that of corridors, primarily occurring in the topographically fragmented and geologically vulnerable western mountains—areas of high ecological sensitivity. Moreover, corridors intersecting urban centers or major transportation arteries generate numerous barrier points that impede species movement. To enhance pinch point stability and corridor permeability, targeted interventions such as wildlife overpasses, roadside green buffers, and pinch point buffer zones are recommended [70].
5.2. Effectiveness of Ecological Network Optimization
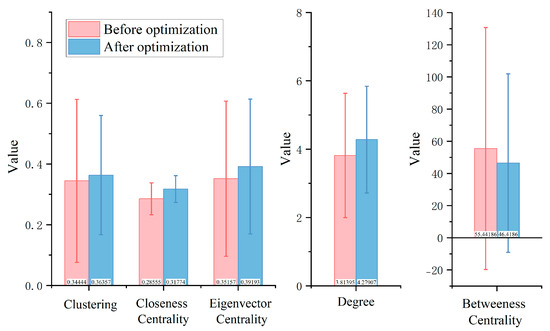
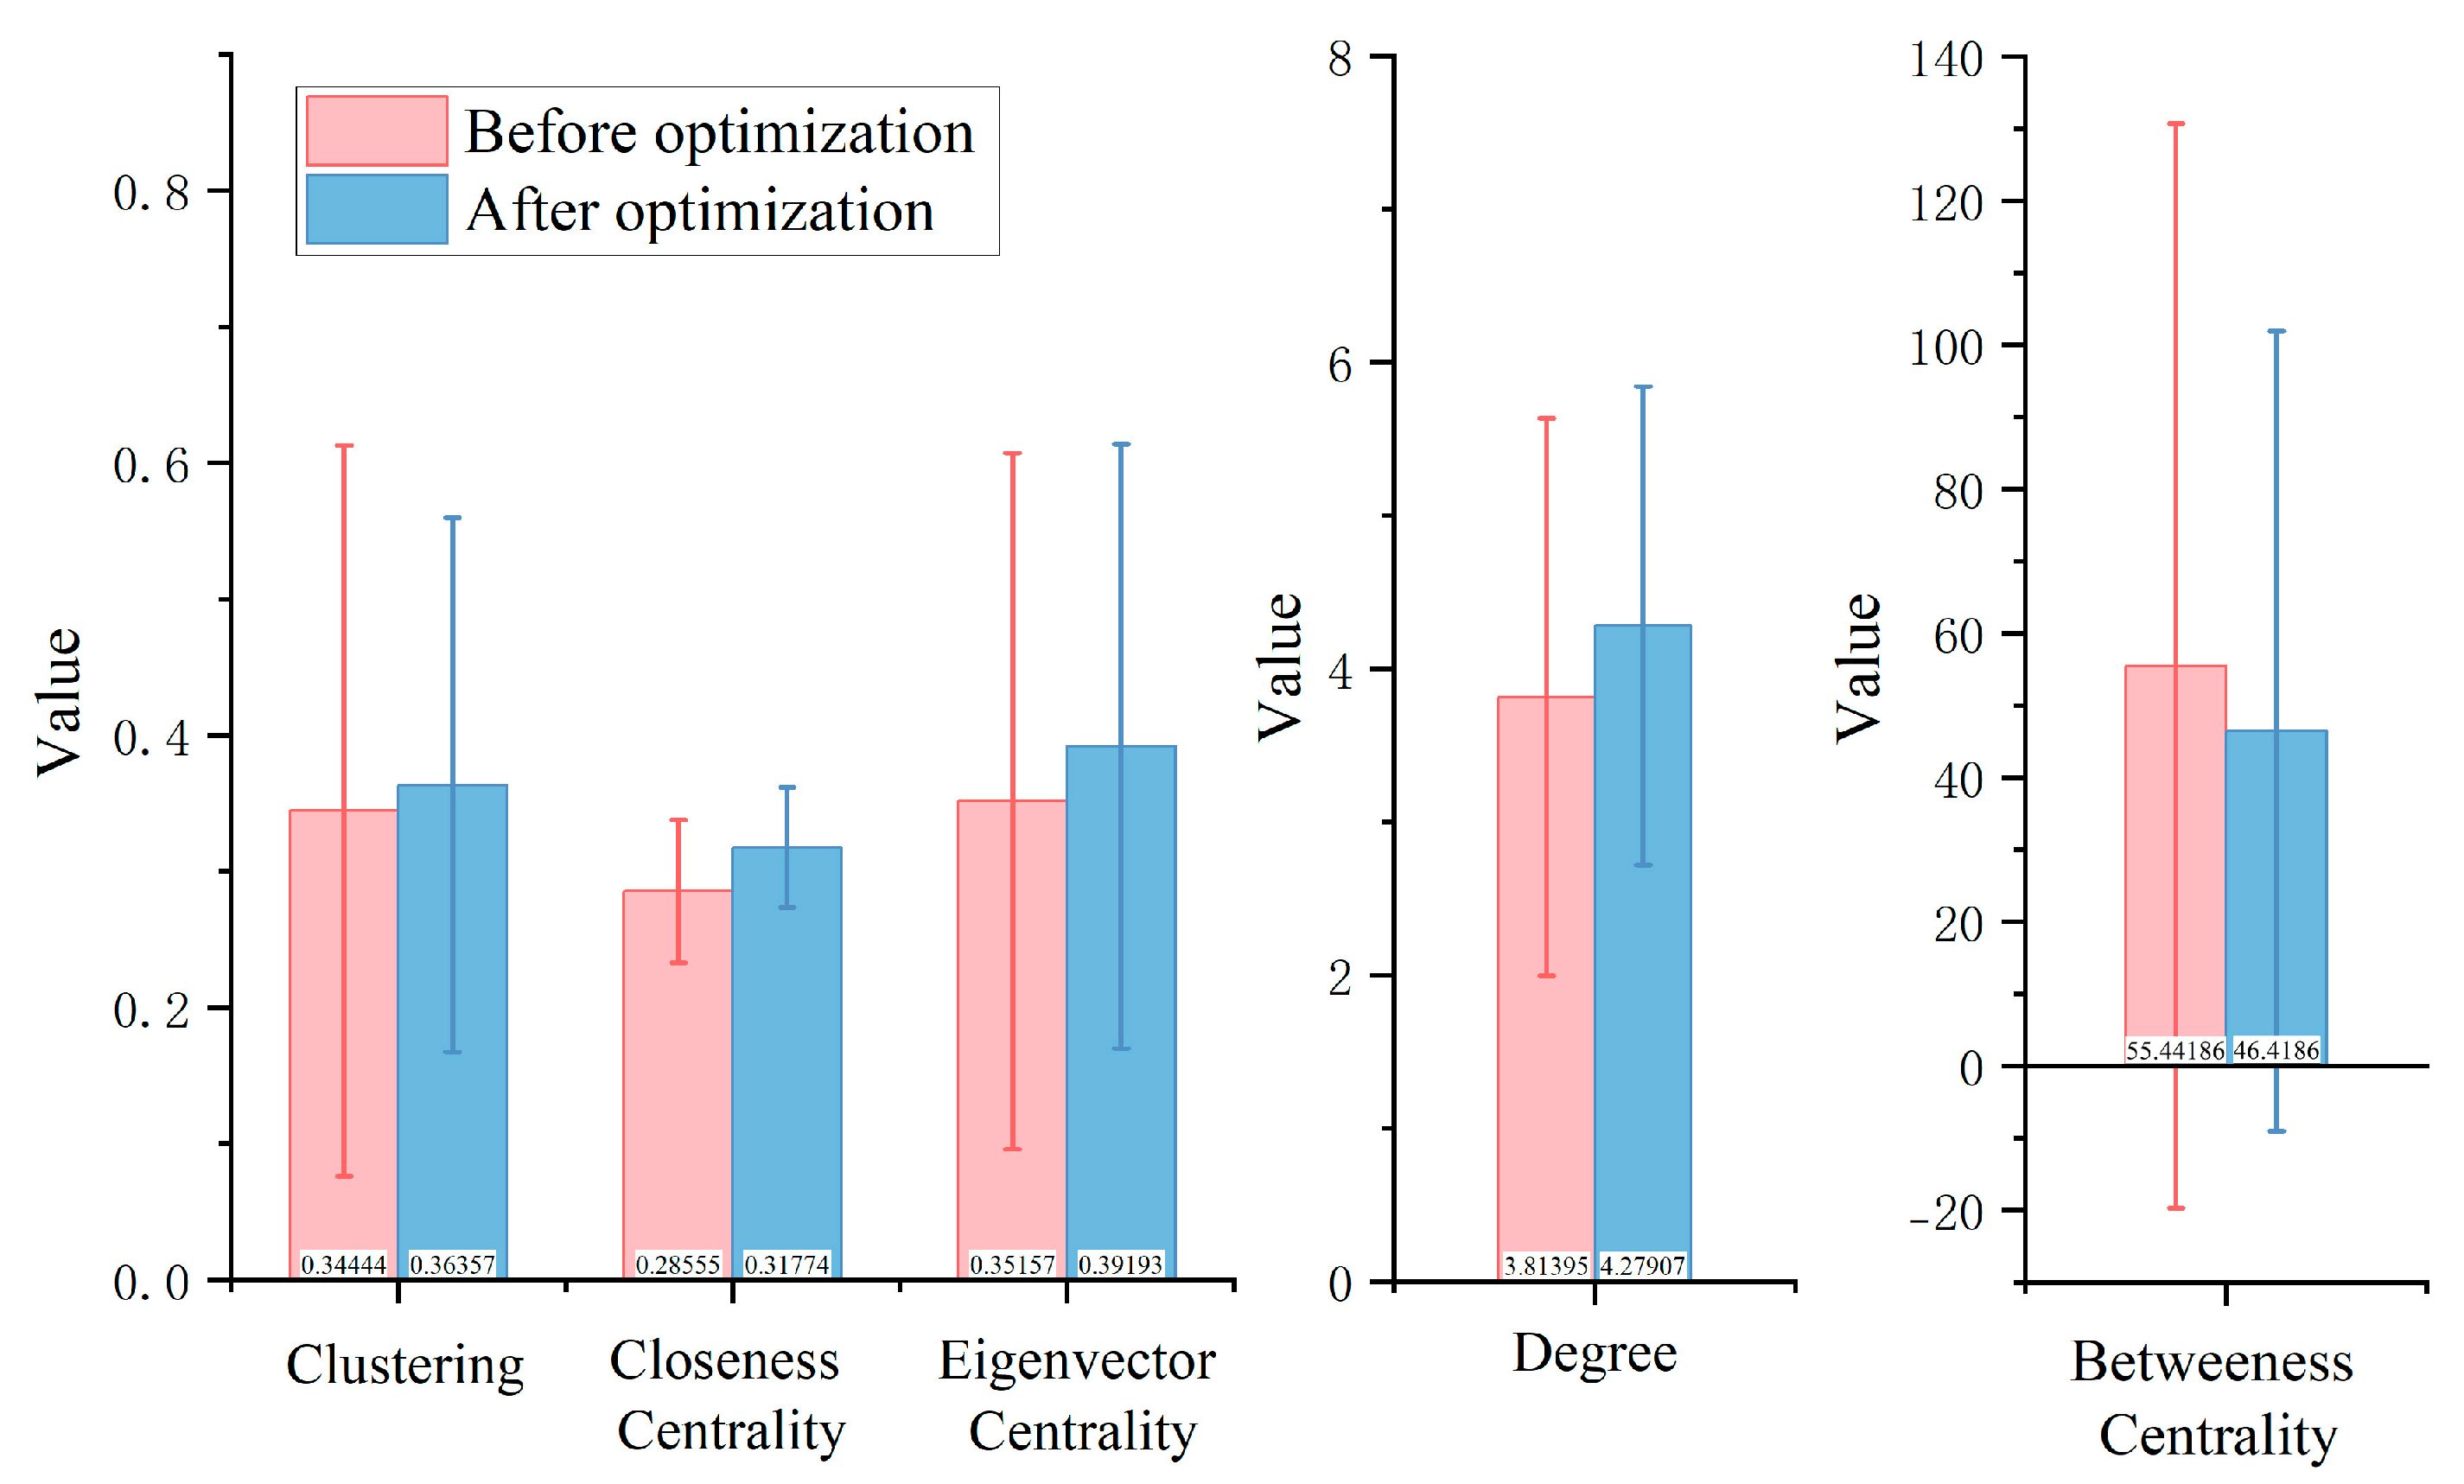
Edge addition is a critical strategy for enhancing the stability and connectivity of ecological networks [71]. After optimization, the standard deviation of topological metrics, mean betweenness centrality, and network diameter in Anyang’s ecological network decreased by 19.32%, 18.09%, and 22.22%, respectively, compared to the pre-optimization state. Conversely, mean degree, mean closeness centrality, mean clustering coefficient, mean eigenvector centrality, and graph density increased by 12.19%, 11.27%, 5.55%, 11.36%, and 12.09%, respectively (Figure 10). These results indicate that the optimization measures not only reduced the network’s dependency on a few critical nodes but also strengthened nodal connectivity, improved network cohesion, and enhanced the efficiency of biological exchange and ecological information flow [72].
Figure 10.
Topological characteristics of Anyang’s EN before and after optimization.
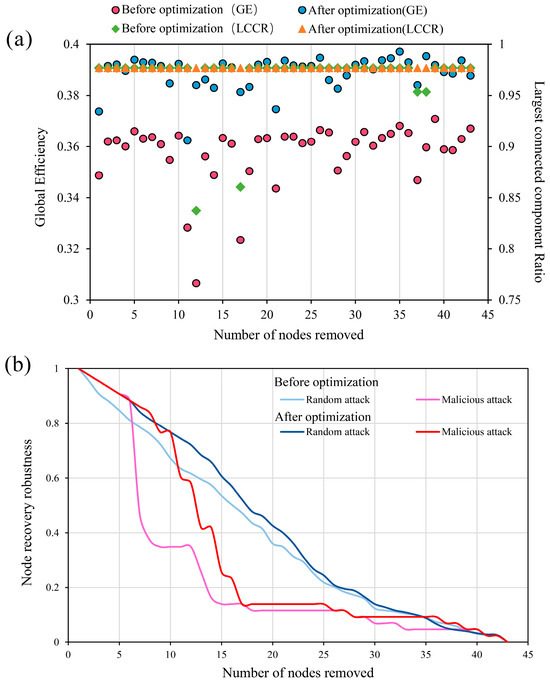
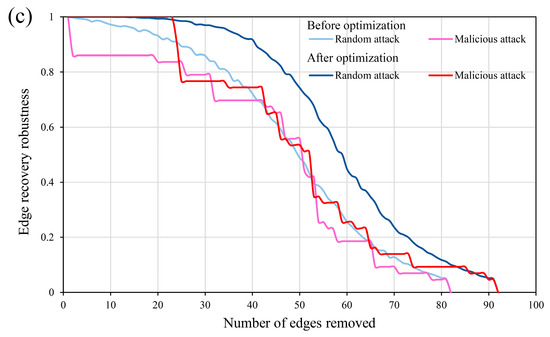
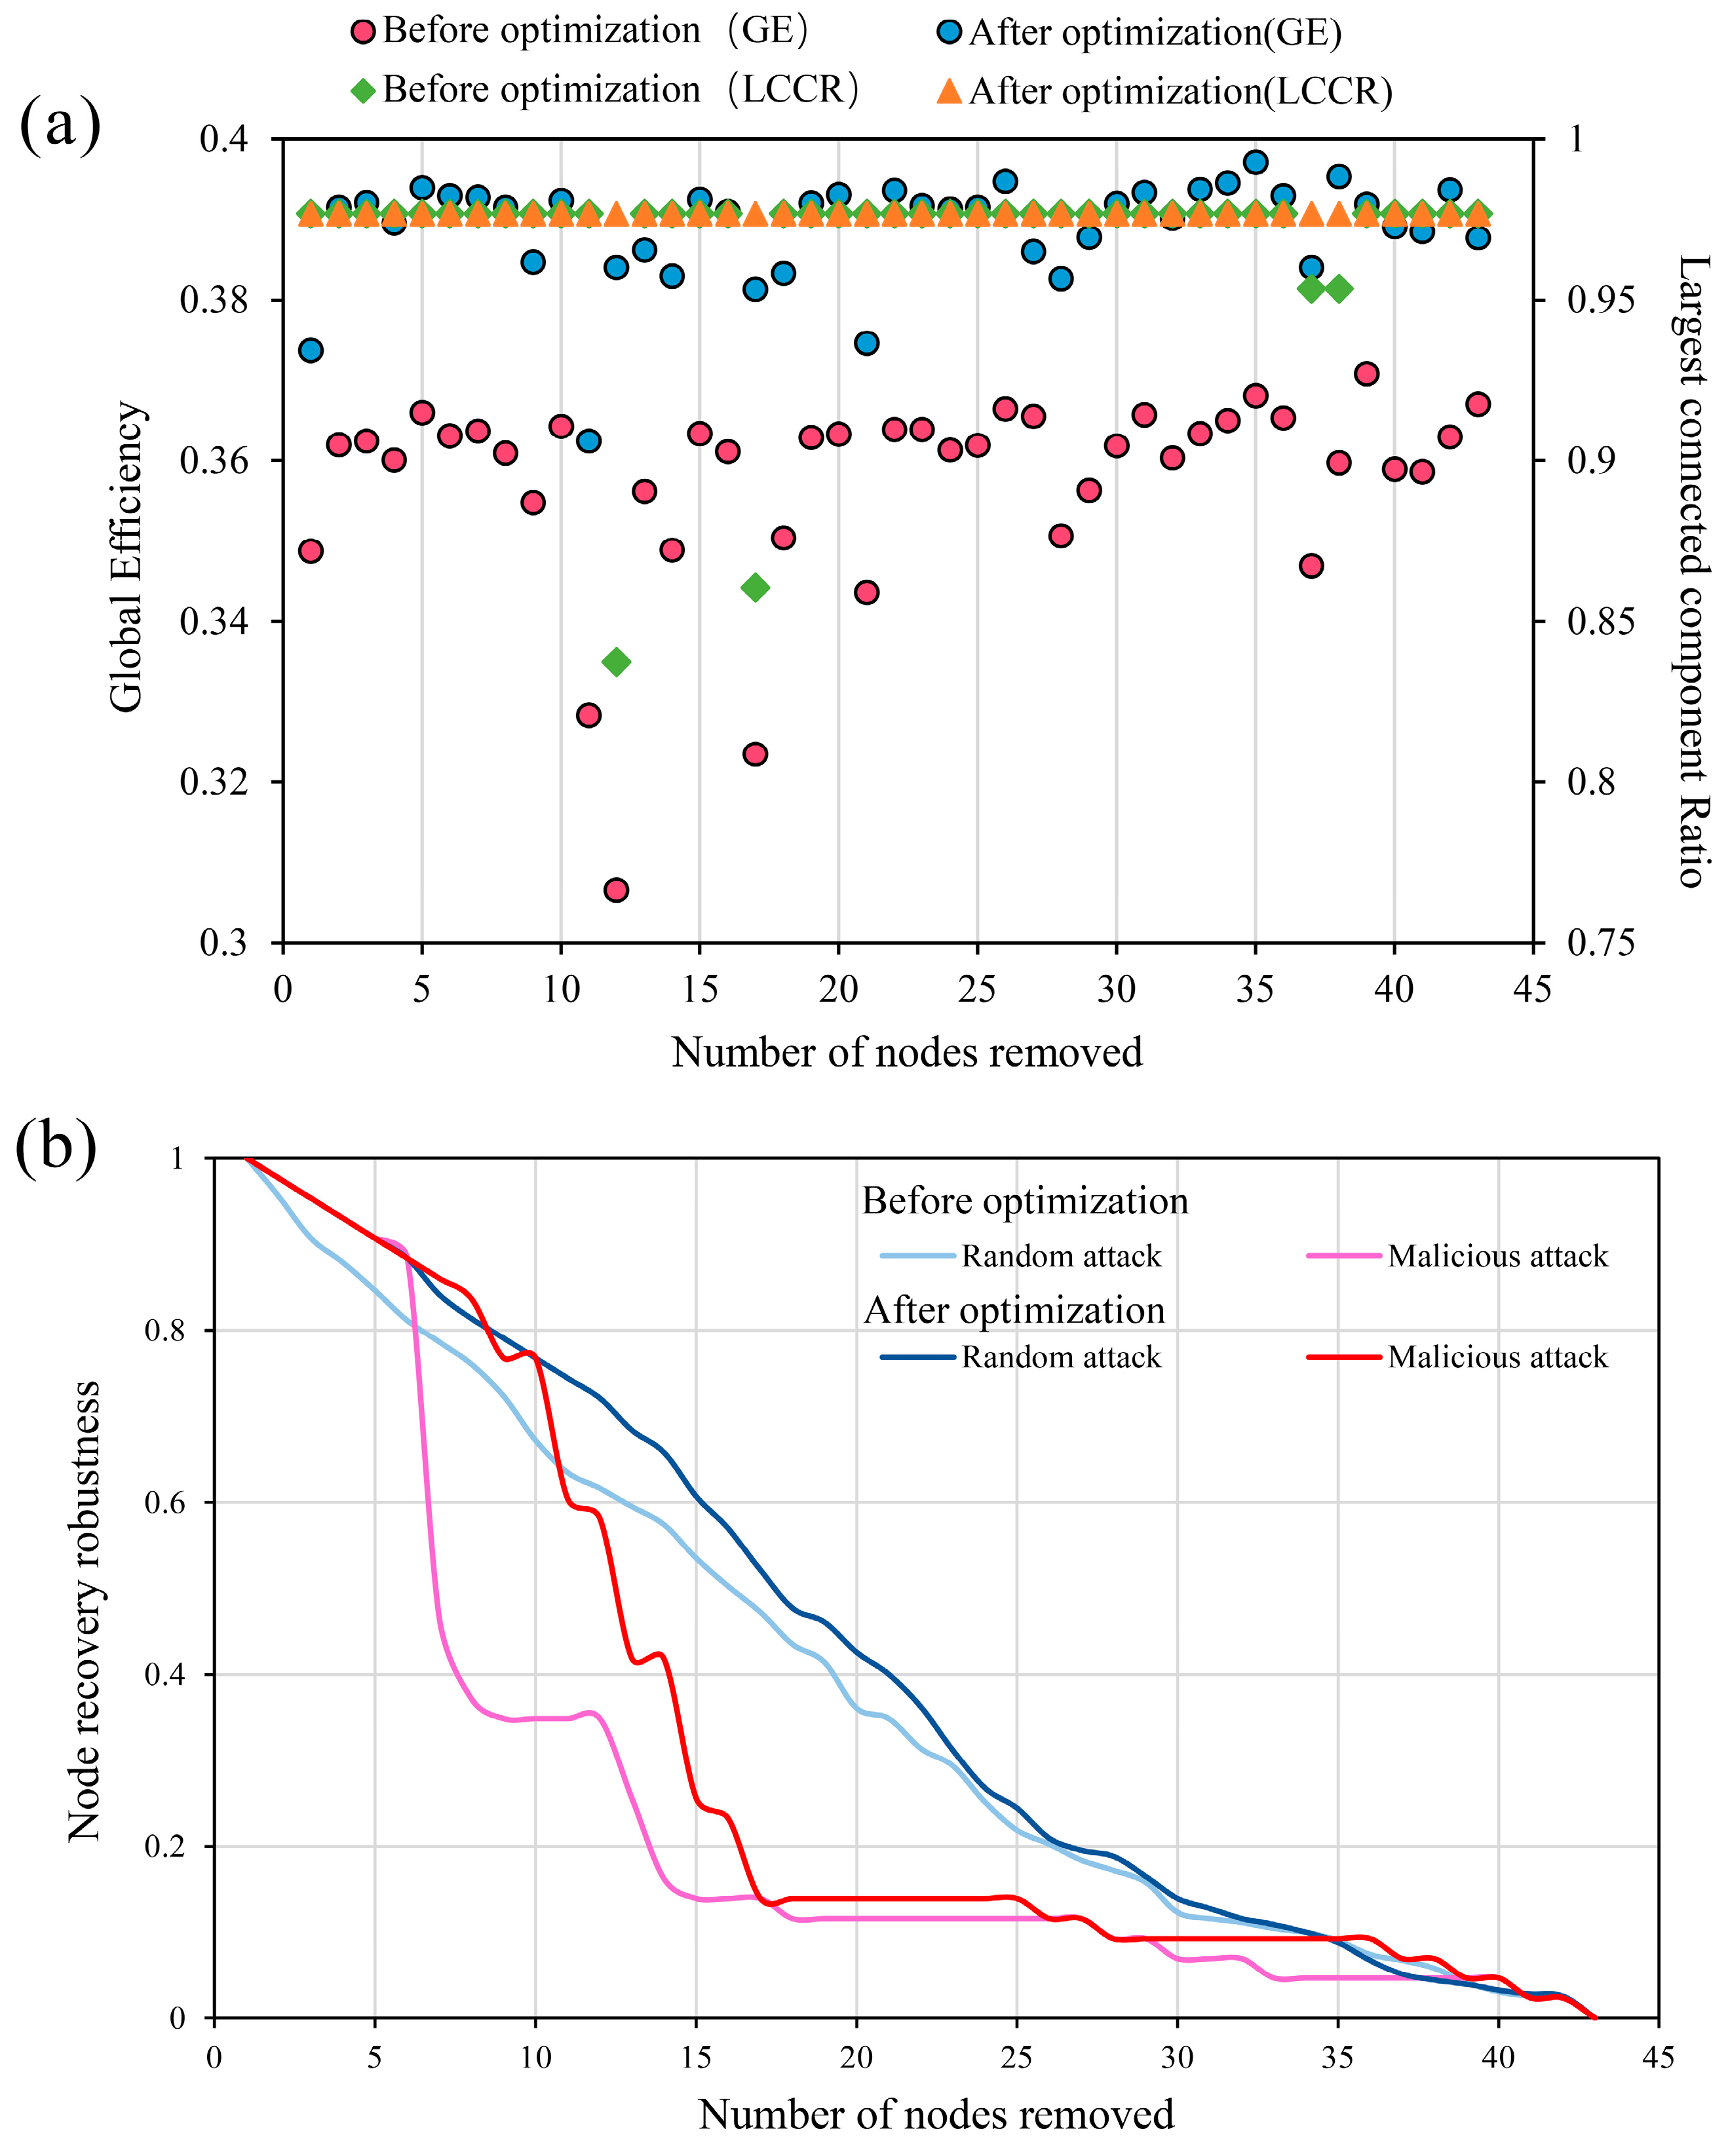
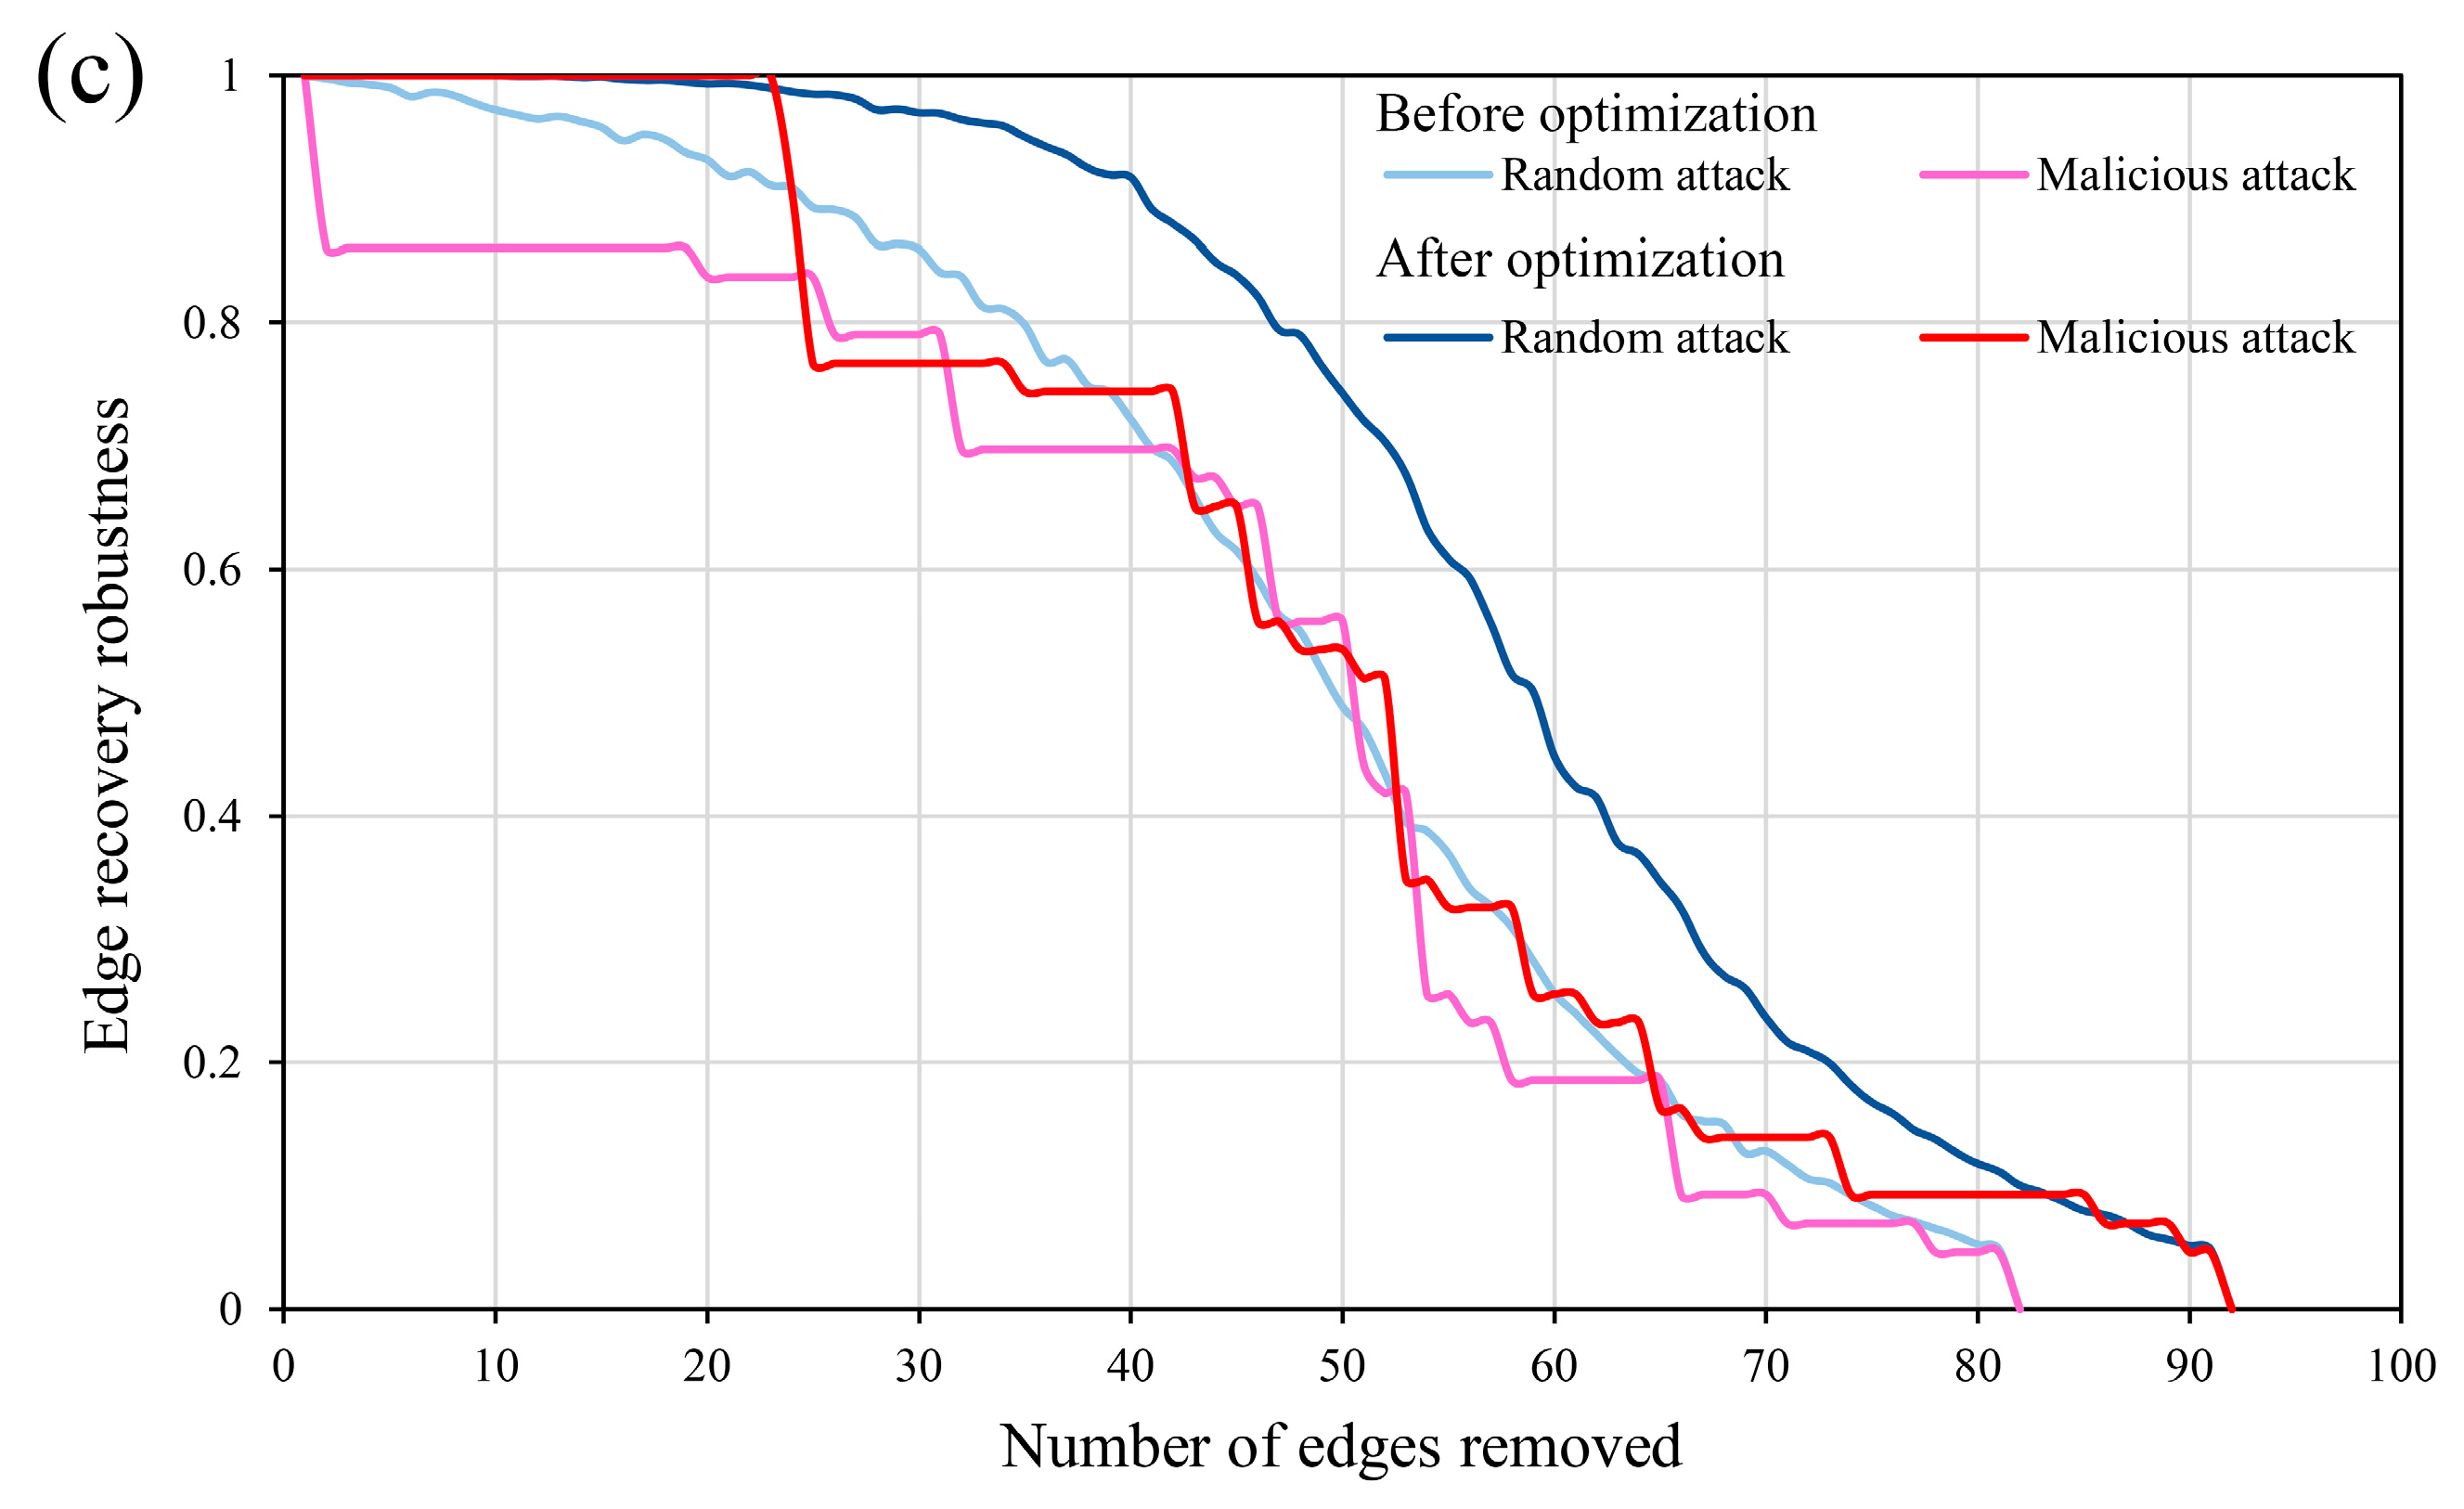
Network robustness refers to the capacity to maintain functional and structural integrity under external disturbances or internal failures [73]. After optimization, the global efficiency (GE) and the largest connected component ratio (LCCR) of the ecological network increased by 8.74% and 0.73%, respectively. Moreover, LCCR remained relatively stable even after the random removal of any single node (Figure 11a), demonstrating improved structural cohesion and functional stability of the ecological network. Additionally, node recovery robustness (NRR) and edge recovery robustness (ERR) of Anyang’s ecological network increased by 17.44% and 18.08% post-optimization (Figure 11b,c), indicating that edge addition optimization effectively delayed and mitigated the decline in corridor connectivity during simulated attacks. The optimization strategy enhances external disturbance resistance, self-repair capability, and ecosystem resilience. The ecological network exhibited significant improvements in operational efficiency and robustness, displaying small-world characteristics such as localized dense connections and overall enhanced connectivity [69].
Figure 11.
Robustness characteristics of the EN in Anyang before and after optimization: (a) global efficiency (GE) and the largest connected component ratio (LCRR); (b) node recovery robustness (NRR); (c) edge recovery robustness (ERR).
5.3. Study Limitations
The construction and optimization of ecological networks involve multiple objectives and dimensions [74]. This study focuses primarily on the ecological functionality, stability, and spatial connectivity of the network, with insufficient consideration of cultural ecosystem services, socio-economic development functions, and food production functions of the ecosystem. Due to data availability constraints, a dynamic assessment of the ecological network was not conducted. Furthermore, discussions on the effective integration of the constructed ecological corridors with territorial spatial planning and their implementation mechanisms remain limited.
Future research could leverage remote sensing data combined with multi-scenario dynamic simulations to investigate how ecological networks respond to global climate change and socio-economic development trajectories. Additionally, incorporating ecosystem assessments into land protection strategies and spatial decision-making could provide support for the planning integration and spatial optimization of ecological networks [75], thereby promoting the formulation of multi-objective synergistic socio-ecological system protection and optimization strategies for regional ecological management. This offers more forward-looking policy guidance for the sustainable use of terrestrial ecosystems.
6. Conclusions
This study constructed the ecological network of Anyang City based on circuit theory and optimized it using complex network theory combined with topological robustness analysis. The main conclusions are as follows:
- (1)
- Ecosystem services in Anyang City, including habitat quality, carbon storage, water yield, and soil retention, generally exhibit a spatial pattern of being higher in the west than in the east and higher in the north than in the south. This indicates that Linzhou City in western Anyang serves as a critical ecosystem service supply area. However, due to its mountainous terrain and steep slopes, this region also exhibits high ecological sensitivity, necessitating urgent measures to mitigate soil erosion risks.
- (2)
- The construction of the ecological network reveals a spatial structural imbalance in ecological sources and corridors, which are concentrated in western Anyang and sparsely distributed in the central and eastern regions. To address this, the network was optimized by adding 10 key ecological corridors. Post-optimization results demonstrate enhanced network connectivity and disturbance resistance, thereby strengthening ecosystem resilience. Nevertheless, the newly added corridors are located in densely populated plains, requiring targeted conservation measures to ensure corridor integrity and promote coordinated regional development.
- (3)
- This study constructed the ecological network based on ecosystem functionality, stability, and spatial connectivity, which offers the advantages of being comprehensive, objective, and reliable. Meanwhile, the study verified the optimization effect of the ecological network’s topological structure (i.e., improved connectivity and anti-disturbance capacity). However, it should be noted that the enhancement of connectivity and anti-disturbance capacity does not necessarily imply a synchronous improvement in ecological functionality. The optimized network is merely a structural hypothesis, and thus its actual ecological effects need to be further verified through subsequent empirical research.
- (4)
- The ecological sources identified in this study are mainly located in Linzhou City—a nationally designated priority area for ecosystem conservation and restoration. The findings align with ongoing regional ecological governance practices, underscoring the study’s practical relevance. To accelerate ecological security construction, (i) western mountainous areas should enforce strict development restrictions and prioritize the protection of key sources and corridors; (ii) central urban zones must reconcile spatial conflicts between ecological corridors and built environments, including transportation infrastructure; and (iii) eastern agricultural regions should incorporate drainage ditches, shelterbelts, and other linear landscape elements into ecological land allocation to strengthen inter-patch connectivity.
Author Contributions
Methodology, Z.Z., X.W., C.Y., Q.W., Y.Y. and X.L.; Software, Z.Z., X.W. and C.Y.; Resources, Q.W.; Data curation, Z.Z., Y.Y. and X.L.; Writing—original draft, Z.Z.; Writing—review and editing, Z.Z., X.W., C.Y., Q.W., Y.Y. and X.L.; Funding acquisition, Q.W. All authors have read and agreed to the published version of the manuscript.
Funding
This research was funded by the Henan Province Philosophy and Social Science Planning Project (grant number 2023BZH002).
Data Availability Statement
The original contributions presented in the study are included in the article; further inquiries can be directed to the corresponding author.
Conflicts of Interest
The authors declare no conflicts of interest.
Abbreviations
The following abbreviations are used in this manuscript:
| AHP | Analytic Hierarchy Process |
| DEM | Digital Elevation Model |
| dPC | Delta Probability of Connectivity |
| ENs | Ecological Networks |
| ERR | Edge Recovery Robustness |
| ESI | Ecosystem Service Importance |
| GE | Global Efficiency |
| LCCR | Largest Connected Component Ratio |
| MSPA | Morphological Spatial Pattern Analysis |
| NDVI | Normalized Difference Vegetation Index |
| NRR | Node Recovery Robustness |
| PC | Probability of Connectivity |
| PCA | Principal Component Analysis |
References
- Bai, X.; McPhearson, T.; Cleugh, H.A.; Nagendra, H.; Tong, X.; Zhu, T.; Zhu, Y.-G. Linking urbanization and the environment: Conceptual and empirical advances. Annu. Rev. Environ. Resour. 2017, 42, 215–240. [Google Scholar] [CrossRef] [Scilit]
- Zhang, Z.; Wang, Q.; Feng, Y.; Sun, Y.; Liu, N.; Yan, S. The spatio-temporal evolution of spatial structure and supply-demand relationships of the ecological network in the Yellow River Delta region of China. J. Clean. Prod. 2024, 471, 143388. [Google Scholar] [CrossRef] [Scilit]
- Liu, H.; Wang, Z.; Zhang, L.; Tang, F.; Wang, G.; Li, M. Construction of an ecological security network in the Fenhe River Basin and its temporal and spatial evolution characteristics. J. Clean. Prod. 2023, 417, 137961. [Google Scholar] [CrossRef] [Scilit]
- Wang, Y.; Zhang, F.; Li, X.; Johnson, V.C.; Tan, M.L.; Kung, H.-T.; Shi, J.; Bahtebay, J.; He, X. Methodology for mapping the ecological security pattern and ecological network in the arid region of Xinjiang, China. Remote Sens. 2023, 15, 2836. [Google Scholar] [CrossRef] [Scilit]
- Huang, Q.; Ma, Y. Ecological Network Construction in High-Density Water Network Areas Based on a Three-Dimensional Perspective: The Case of Foshan City. Sustainability 2024, 16, 7636. [Google Scholar] [CrossRef] [Scilit]
- Burkhard, B.; Kroll, F.; Nedkov, S.; Müller, F. Mapping ecosystem service supply, demand and budgets. Ecol. Indic. 2012, 21, 17–29. [Google Scholar] [CrossRef] [Scilit]
- Nedkov, S.; Borisova, B.; Nikolova, M.; Zhiyanski, M.; Dimitrov, S.; Mitova, R.; Koulov, B.; Hristova, D.; Prodanova, H.; Semerdzhieva, L.; et al. A methodological framework for mapping and assessment of ecosystem services provided by the natural heritage in Bulgaria. J. Bulg. Geogr. Soc. 2021, 45, 7–18. [Google Scholar] [CrossRef] [Scilit]
- Wang, X.; Sun, Y.; Liu, Q.; Zhang, L. Construction and optimization of ecological network based on landscape ecological risk assessment: A case study in Jinan. Land 2023, 12, 743. [Google Scholar] [CrossRef] [Scilit]
- Yu, H.; Wang, Y.; Eme, C.; Fan, X.; Rong, Y.; Zhang, Q.; Liang, Z. Construction of ecological network based on multi-scale conversion and nesting. Water 2021, 13, 1278. [Google Scholar] [CrossRef] [Scilit]
- Jongman, R.H.; Pungetti, G. Ecological Networks and Greenways: Concept, Design, Implementation; Cambridge University Press: Cambridge, UK, 2004. [Google Scholar]
- Qu, Y.; Lu, M. Research Progress and Development Trend of Ecological Network Planning. Urban Dev. Stud. 2016, 23, 29–36. (In Chinese) [Google Scholar]
- Zhang, Y.; Lu, M.; Ma, W.; Meng, Q.; Li, Z.; Wu, Y. Urban multi-scale ecological network sequence and spatial structure optimization: A case study in Nanjing city, China. Ecol. Indic. 2024, 167, 112622. [Google Scholar] [CrossRef] [Scilit]
- Bennett, G.; Wit, P.D. The Development and Application of Ecological Networks: A Review of Proposals, Plans and Programmes; AIDEnvironment: Amsterdam, The Netherlands, 2001. [Google Scholar]
- Forman, R.T.; Godron, M. Patches and structural components for a landscape ecology. BioScience 1981, 31, 733–740. [Google Scholar] [CrossRef] [Scilit]
- Yu, K. Landscape ecological security patterns in biological conservation. Acta Ecol. Sin. 1999, 19, 10–17. (In Chinese) [Google Scholar]
- An, Y.; Liu, S.; Sun, Y.; Shi, F.; Beazley, R. Construction and optimization of an ecological network based on morphological spatial pattern analysis and circuit theory. Landsc. Ecol. 2021, 36, 2059–2076. [Google Scholar] [CrossRef] [Scilit]
- Wang, J.; Gao, J.; Yuan, M.; Sun, Q.; Li, S. Construction of rural landscape ecological security pattern from the perspective of biological protection—A case study of Houjialou Village, Yong’an Town, Fenxi County, Linfen City, Shanxi Province. Ecol. Sci. 2021, 40, 155–161. (In Chinese) [Google Scholar]
- Lu, J.; Jiao, S.; Han, Z.; Yin, J. Promoting ecological restoration of deeply urbanized hilly areas: A multi-scale ecological networks approach. Ecol. Indic. 2023, 154, 110655. [Google Scholar] [CrossRef] [Scilit]
- Lu, J.; Jiao, S.; Hu, J.; Cai, Y.; Ou, L. Construction and hierarchical optimization of Changsha ecological network based on multi-scale collaboration. Acta Ecol. Sin. 2023, 43, 6332–6344. (In Chinese) [Google Scholar]
- Qian, M.; Huang, Y.; Cao, Y.; Wu, J.; Xiong, Y. Ecological network construction and optimization in Guangzhou from the perspective of biodiversity conservation. J. Environ. Manag. 2023, 336, 117692. [Google Scholar] [CrossRef] [Scilit]
- Ding, M.; Liu, W.; Xiao, L.; Zhong, F.; Lu, N.; Zhang, J.; Zhang, Z.; Xu, X.; Wang, K. Construction and optimization strategy of ecological security pattern in a rapidly urbanizing region: A case study in central-south China. Ecol. Indic. 2022, 136, 108604. [Google Scholar] [CrossRef] [Scilit]
- Li, Y.; Zhang, Y. Wilderness network construction in Lincang City of Yunnan Province, Southwest China based on landscape connectivity. Chin. J. Appl. Ecol. 2025, 36, 1233–1243. (In Chinese) [Google Scholar]
- Liu, J.; Zheng, Y.; Li, W.; Yang, Y. Regional prioritization of territorial spatial ecological restoration based on ecological degradation risk: A case study of the Shandong Section of the Yellow River Basin. China Environ. Sci. 2025, 45, 1587–1600. (In Chinese) [Google Scholar]
- Dutta, T.; Sharma, S.; Meyer, N.F.; Larroque, J.; Balkenhol, N. An overview of computational tools for preparing, constructing and using resistance surfaces in connectivity research. Landsc. Ecol. 2022, 37, 2195–2224. [Google Scholar] [CrossRef] [Scilit]
- McCluskey, E.M.; Kuzma, F.C.; Enander, H.D.; Cole-Wick, A.; Coury, M.; Cuthrell, D.L.; Johnson, C.; Kelso, M.; Lee, Y.M.; Methner, D. Assessing habitat connectivity of rare species to inform urban conservation planning. Ecol. Evol. 2024, 14, e11105. [Google Scholar] [CrossRef] [Scilit]
- Tian, Y.; Zhang, M.; Xu, D.; Zhang, S. Landscape ecological security patterns in an ecological city, based on source-sink theory. Acta Ecol. Sin. 2019, 39, 2311–2321. (In Chinese) [Google Scholar] [CrossRef] [Scilit]
- Li, C.; Wu, Y.; Gao, B.; Zheng, K.; Wu, Y.; Wang, M. Construction of ecological security pattern of national ecological barriers for ecosystem health maintenance. Ecol. Indic. 2023, 146, 109801. [Google Scholar] [CrossRef] [Scilit]
- Yang, L.; Suo, M.; Gao, S.; Jiao, H. Construction of an ecological network based on an integrated approach and circuit theory: A case study of Panzhou in Guizhou Province. Sustainability 2022, 14, 9136. [Google Scholar] [CrossRef] [Scilit]
- Wei, B.; Su, J.; Hu, X.; Xu, K.; Zhu, M.; Liu, L. Comprehensive identification of eco-corridors and eco-nodes based on principle of hydrological analysis and Linkage Mapper. Acta Ecol. Sin. 2022, 42, 2995–3009. (In Chinese) [Google Scholar]
- Wei, W.; Wang, S.; Li, X.; Zhou, J.; Zhong, Y.; Li, P.; Zhang, Z. Identification and analysis of ecological corridors in the central urban area of Xuchang based on multi-source geospatial data. ISPRS Int. J. Geo-Inf. 2024, 13, 322. [Google Scholar] [CrossRef] [Scilit]
- Yu, Q.; Yue, D.; Wang, J.; Zhang, Q.; Li, Y.; Yu, Y.; Chen, J.; Li, N. The optimization of urban ecological infrastructure network based on the changes of county landscape patterns: A typical case study of ecological fragile zone located at Deng Kou (Inner Mongolia). J. Clean. Prod. 2017, 163, S54–S67. [Google Scholar] [CrossRef] [Scilit]
- Fan, J.; Wang, Q.; Ji, M.; Sun, Y.; Feng, Y.; Yang, F.; Zhang, Z. Ecological network construction and gradient zoning optimization strategy in urban-rural fringe: A case study of Licheng District, Jinan City, China. Ecol. Indic. 2023, 150, 110251. [Google Scholar] [CrossRef] [Scilit]
- Cui, L.; Wang, J.; Sun, L.; Lv, C. Construction and optimization of green space ecological networks in urban fringe areas: A case study with the urban fringe area of Tongzhou district in Beijing. J. Clean. Prod. 2020, 276, 124266. [Google Scholar] [CrossRef] [Scilit]
- Kang, J.; Qing, Y.; Lu, W. Construction and optimization of the Saihanba ecological network. Ecol. Indic. 2023, 153, 110401. [Google Scholar] [CrossRef] [Scilit]
- Yu, Q.; Yang, L.; Yue, D.; Wang, Y.; Su, K.; Zhang, Q. Investigation on Complex Spatial Ecological Network Structure Based on Complex Network Analysis Method. Trans. Chin. Soc. Agric. Mach. 2018, 49, 214–224. (In Chinese) [Google Scholar]
- Huang, K.; Peng, L.; Wang, X.; Deng, W.; Liu, Y. Incorporating circuit theory, complex networks, and carbon offsets into the multi-objective optimization of ecological networks: A case study on karst regions in China. J. Clean. Prod. 2023, 383, 135512. [Google Scholar] [CrossRef] [Scilit]
- Zhao, J.; Yu, Q.; Xu, C.; Ma, J.; Liu, W.; Sun, W.; Miao, Y.; Nawaz, T. Integrated approach for ecological restoration and ecological spatial network optimization with multiple ecosystem functions in mining areas. Ecol. Indic. 2023, 156, 111141. [Google Scholar] [CrossRef] [Scilit]
- Zhao, Y.; Zhang, P.; Xu, H.; Liu, W. Assessment and Optimization of Ecological Networks in Trans-Provincial Metropolitan Areas—A Case Study of the Xuzhou Metropolitan Area. Land 2024, 13, 45. [Google Scholar] [CrossRef] [Scilit]
- Huang, X.; Xiu, L.; Lu, Z.; Wang, J. Ecological networks construction and optimization in the Longdong Loess Plateau: The advantages of self-organizing map and complex networks. Ecol. Indic. 2025, 170, 113138. [Google Scholar] [CrossRef] [Scilit]
- Anguelovski, C.; Tennant, M. Urban futures: Systemic or system changing interventions? A literature review using Meadows’ leverage points as analytical framework. Cities 2020, 104, 102808. [Google Scholar] [CrossRef] [Scilit]
- He, J.; Shi, X.-Y.; Fu, Y.-J. Optimization of ecological security pattern in the source area of Fenhe River Basin based on ecosystem services. J. Nat. Resour. 2020, 35, 814–825. (In Chinese) [Google Scholar] [CrossRef] [Scilit]
- Jin, F.; Ma, L.; Xu, D. Environmental stress and optimized path of industrial development in the Yellow River Basin. Resour. Sci. 2020, 42, 127–136. (In Chinese) [Google Scholar] [CrossRef] [Scilit]
- National Development and Reform Commission; Ministry of Natural Resources. Master Plan for the Major Projects for the Protection and Restoration of National Key Ecosystems (2021–2035); National Development and Reform Commission: Beijing, China, 2020.
- Han, X.; Cai, W.; Wang, J.; Li, H.; Xu, X.; Tian, S. Groundwater quality characteristics and pollution causes in typical hilly areas of North China: The case of Longan District, Anyang City, Henan Province. J. Environ. Eng. Technol. 2023, 13, 992–1000. (In Chinese) [Google Scholar]
- Zhang, Y. Study on Ecological Restoration Zoning of Land Space: A Case of Anyang City. Master’s Thesis, Henan Agricultural University, Zhengzhou, China, 2022. (In Chinese) [Google Scholar]
- GB/T 21010-2017; Current Land Use Classification. Standardization Administration of the People’s Republic of China: Beijing, China, 2017.
- Peng, J.; Yang, Y.; Liu, Y.; Hu, Y.N.; Du, Y.; Meersmans, J.; Qiu, S. Linking ecosystem services and circuit theory to identify ecological security patterns. Sci. Total Environ. 2018, 644, 781–790. [Google Scholar] [CrossRef] [Scilit]
- Xie, Z.; Lei, M.; Liu, L.; Mo, Y.; Zhan, G.; Liu, P. Evaluation and optimization of ecological landscape pattern for urban agglomeration in the Pearl River Delta, China. Chin. J. Appl. Ecol. 2023, 34, 2481–2488. (In Chinese) [Google Scholar]
- Tsou, J.Y.; Gao, Y.; Zhang, Y.; Sun, G.; Ren, J.; Li, Y. Evaluating urban land carrying capacity based on the ecological sensitivity analysis: A case study in Hangzhou, China. Remote Sens. 2017, 9, 529. [Google Scholar] [CrossRef] [Scilit]
- Uroy, L.; Alignier, A.; Mony, C.; Foltête, J.-C.; Ernoult, A. How to assess the temporal dynamics of landscape connectivity in ever-changing landscapes: A literature review. Landsc. Ecol. 2021, 36, 2487–2504. [Google Scholar] [CrossRef] [Scilit]
- Du, X.; Lyu, F.; Wang, C.; Yu, Z. Construction of ecological network based on MSPA-Conefor-MCR at the county scale: A case study in Yanqing District, Beijing, China. Chin. J. Appl. Ecol. 2023, 34, 1073–1082. (In Chinese) [Google Scholar]
- Fan, X.; Cheng, Y.; Tan, F.; Zhao, T. Construction and Optimization of the Ecological Security Pattern in Liyang, China. Land 2022, 11, 1641. [Google Scholar] [CrossRef] [Scilit]
- Vogt, P.; Riitters, K. GuidosToolbox: Universal digital image object analysis. Eur. J. Remote Sens. 2017, 50, 352–361. [Google Scholar] [CrossRef] [Scilit]
- Huang, Q.; He, H.; Saierjiang, H.; Huang, X.; Zhang, R. Identification and optimization of ecosystem service security patterns based on multi-scenario simulation: A case study of the Tarim River Basin. Acta Ecol. Sin. 2025, 45, 11476–11490. (In Chinese) [Google Scholar]
- Wang, S.; Zhao, Y.; Ren, H.; Zhu, S. Stepwise construction and integration of ecological network in resource-based regions: A case study on Liaoning province, China. Remote Sens. 2024, 16, 3228. [Google Scholar] [CrossRef] [Scilit]
- Liang, Y.-X.; Wu, D.-F.; Wu, Z.-J.; Xu, Y.; Zhu, Z.-W.; Zhang, Y.-C.; Zhu, H. Construction of ecological corridors in karst areas based on ecological sensitivity and ecological service value. Land 2023, 12, 1177. [Google Scholar] [CrossRef] [Scilit]
- Huang, L.; Wang, J.; Fang, Y.; Zhai, T.; Cheng, H. An integrated approach towards spatial identification of restored and conserved priority areas of ecological network for implementation planning in metropolitan region. Sustain. Cities Soc. 2021, 69, 102865. [Google Scholar] [CrossRef] [Scilit]
- Ma, J.; Li, L.; Jiao, L.; Zhu, H.; Liu, C.; Li, F.; Li, P. Identifying Ecological Security Patterns Considering the Stability of Ecological Sources in Ecologically Fragile Areas. Land 2024, 13, 214. [Google Scholar] [CrossRef] [Scilit]
- Zhou, J.; Fan, Y.; Di, Z. Progress in complex networks. J. Beijing Norm. Univ. Nat. Sci. 2023, 59, 691–704. (In Chinese) [Google Scholar]
- Landherr, A.; Friedl, B.; Heidemann, J. A critical review of centrality measures in social networks. Bus. Inf. Syst. Eng. 2010, 2, 371–385. [Google Scholar] [CrossRef] [Scilit]
- Song, S.; Xu, D.; Hu, S.; Shi, M. Ecological network optimization in urban central district based on complex network theory: A case study with the urban central district of Harbin. Int. J. Environ. Res. Public Health 2021, 18, 1427. [Google Scholar] [CrossRef] [Scilit]
- Li, L.; Huang, X.; Yang, H. A new framework for identifying ecological conservation and restoration areas to enhance carbon storage. Ecol. Indic. 2023, 154, 110523. [Google Scholar] [CrossRef] [Scilit]
- Jiao, X.; Tian, Z.; Yang, H.; Shang, G.; Ma, J. Identification of key areas for ecological restoration of territorial space based on ecological security pattern: A case study of Kangbao County. Front. Ecol. Evol. 2024, 11, 1301149. [Google Scholar] [CrossRef] [Scilit]
- Zhang, D.; Ren, H.; Sun, P.; Jing, P.; Guo, B. Construction of multi-level ecological security network in fragmented nature landscape using the three-dimensional framework of ecological adaptability. Ecol. Indic. 2023, 157, 111229. [Google Scholar] [CrossRef] [Scilit]
- Li, Y.; Zhao, J.; Yuan, J.; Ji, P.; Deng, X.; Yang, Y. Constructing the ecological security pattern of Nujiang Prefecture Based on the framework of “Importance–Sensitivity–Connectivity”. Int. J. Environ. Res. Public Health 2022, 19, 10869. [Google Scholar] [CrossRef] [Scilit] [PubMed]
- Fan, S.; Axmacher, J.C.; Shu, H.; Liu, Y. Ecological network design based on optimizing ecosystem services: Case study in the Huang-Huai-Hai region, China. Ecol. Indic. 2023, 150, 110264. [Google Scholar] [CrossRef] [Scilit]
- Li, Z.; Liu, J.; Ma, R.; Xie, W.; Zhao, X.; Wang, Z.; Zhang, B.; Yin, L. Construction of Ecological Security Pattern Based on Ecosystem Services, Sensitivity, Connectivity, and Resistance—A Case Study in the Huang-Huai-Hai Plain. Land 2024, 13, 2243. [Google Scholar] [CrossRef] [Scilit]
- Chen, B.; Zhu, J.; Liu, H.; Zeng, L.; Li, F.; Xiao, Z.; Xiao, W. Construction and Optimization of Ecological Security Patterns Based on Ecosystem Services in the Wuhan Metropolitan Area. Land 2024, 13, 1755. [Google Scholar] [CrossRef] [Scilit]
- Liu, J.; Chen, J.; Yang, Y.; You, H.; Han, X. Construction and optimization of an ecological network in the Yellow River Source Region Based on MSPA and MCR Modelling. Int. J. Environ. Res. Public Health 2023, 20, 3724. [Google Scholar] [CrossRef] [Scilit] [PubMed]
- Zeng, Z.; Ai, J.; Wang, Z.; He, T.; Zheng, Y.-S. Research on the Spatial and Temporal Evolution of Landscape Pattern in Sanming Urban Area and the Construction of Ecological Network. J. Ecol. Rural Environ. 2024, 40, 335–344. (In Chinese) [Google Scholar]
- Zhu, N.; Ai, J.; Zeng, Z.; Zhou, C. Exploring the spatial relationship between the ecological topological network and carbon sequestration capacity of coastal urban ecosystems: A case study of Yancheng city, China. Remote Sens. 2023, 15, 4007. [Google Scholar] [CrossRef] [Scilit]
- Watts, D.J.; Strogatz, S.H. Collective dynamics of ‘small-world’ networks. Nature 1998, 393, 440–442. [Google Scholar] [CrossRef] [Scilit]
- Lou, Y.; Wang, L.; Chen, G. Structural robustness of complex networks: A survey of a posteriori measures [feature]. IEEE Circuits Syst. Mag. 2023, 23, 12–35. [Google Scholar] [CrossRef] [Scilit]
- Peng, J.; Lyu, D.; Dong, J.; Liu, Y.; Liu, Q.; Li, B. Processes coupling and spatial integration: Characterizing ecological restoration of territorial space in view of landscape ecology. J. Nat. Resour. 2020, 35, 3–13. (In Chinese) [Google Scholar] [CrossRef] [Scilit]
- Córdoba Hernández, R.; Camerin, F. The application of ecosystem assessments in land use planning: A case study for supporting decisions toward ecosystem protection. Futures 2024, 161, 103399. [Google Scholar] [CrossRef] [Scilit]

Disclaimer/Publisher’s Note: The statements, opinions and data contained in all publications are solely those of the individual author(s) and contributor(s) and not of MDPI and/or the editor(s). MDPI and/or the editor(s) disclaim responsibility for any injury to people or property resulting from any ideas, methods, instructions or products referred to in the content. |
© 2026 by the authors. Licensee MDPI, Basel, Switzerland. This article is an open access article distributed under the terms and conditions of the Creative Commons Attribution (CC BY) license.