Article

Proxilience Effects on Spatial Disparities in Metropolitan Areas—A Cross-Scale Analysis of “Superbowl” Agglomerations


by
Alexandru Bănică
1,2,*,
Karima Kourtit
3,4,5,
Cristian-Manuel Foșalău
1 and
Oliver-Valentin Dinter
1,6
1
Department of Geography, Faculty of Geography and Geology, “Alexandru Ioan Cuza” University, 700506 Iași, Romania
2
Geographic Research Centre, Romanian Academy, Iași Branch, 700481 Iași, Romania
3
Faculty of Management, Open University, 6419 AT Heerlen, The Netherlands
4
Erasmus School of Economics and Erasmus Happiness Research Organization (EHERO), Erasmus University Rotterdam, 3000 DR Rotterdam, The Netherlands
5
Faculty of Law, University College Wroclaw (WSKZ), 53-329 Wrocław, Poland
6
Research Laboratory on Cities, Territories, Environment and Societies (CITERES), Polytechnic School, University of Tours, 37200 Tours, France
*
Author to whom correspondence should be addressed.
Land 2026, 15(3), 468; https://doi.org/10.3390/land15030468
Submission received: 13 February 2026 / Revised: 12 March 2026 / Accepted: 13 March 2026 / Published: 15 March 2026
(This article belongs to the Special Issue The 15-Minute City: Land-Use Policy Impacts)

Abstract

In the spirit of the recent debate on the 15-minute city, two concepts are central: urban proximity and resilience. They became cornerstones of new urban planning perspectives on sustainability, livability, and inclusiveness in cities and metropolitan areas. Very recently, the notion of ‘proxilience’ has been introduced as an integration of urban planning views on the drivers of citizens’ wellbeing. The present study seeks to conceptualize and operationalize the proxilience concept for the case of metropolitan agglomerations, in which the core is termed here ‘Superbowl Economy’. Consequently, the paper presents a data-driven analytical approach that uses detailed empirical data on spatial density patterns, demographic factors, socioeconomic indicators, environmental quality attributes, infrastructure accessibility, and access to services and amenities. The empirical part of the study is based on a blend of geostatistical and econometric models (correlation and regression analysis, AHP modelling, and Random Forest model). The analysis framework and the underlying propositions on the proxilience impacts on spatial patterns of disparities in wellbeing are applied and tested for the greater Iași Metropolitan Area, which is one of the largest urban poles in Romania. The findings confirm proxilience as a novel, multidimensional tool that advances spatial (urban–regional) livability in a polarized yet fragmented urban system.

1. Introduction

The ‘New Urban World’ [1] depicts a rapidly evolving spatial and socioeconomic landscape in which cities and urban agglomerations are more than ever shaped by an interlinked dynamic force field of disruptions, pressures, and transformations. Urban systems today are challenged to respond not only to global environmental change and socioeconomic polarisation, but also to shifting local demands for livability, inclusiveness, and sustainability. Persistent spatial inequalities, particularly in less privileged and peripheral areas, show structural vulnerabilities stemming from fragmented planning systems, uneven service distribution, and demographic imbalances [2].
Space is a social product and an “objective reality”, and the “right to the city” in both the political sense [3,4] and as related to the physical distribution of resources, services, and access to these is a fundamental right [5,6]. There is a vast body of literature on spatial justice in urban areas, some of which is directly related to proximities, the spatial distribution of infrastructure and opportunities, and (lack of) access to services from a chronospatial and demographic perspective [7,8]. Spatial disparities in access to amenities and services are vulnerabilities that disproportionately affect post-socialist cities and regions, such as Iași (Romania), where outdated infrastructures and governance failures continue to reinforce territorial disparities. To address these challenges, this study introduces and operationalizes the concept of ‘proxilience’—a hybrid framework that strategically integrates urban proximity and urban resilience into a unified planning approach. It is not only a conceptual framework, but also an operational tool for spatial analysis and policy design. The proxilience concept focuses on the ability of urban areas not only to ensure access to essential services but also to adapt, regenerate, and even flourish under socio-spatial vulnerability. This concept builds on recent work that underscores the need to integrate accessibility with adaptive capacity [9,10,11]. This idea can be framed within the 15-minute city (15-minC) model, developed by Carlos Moreno [10,12], which proposes a simple yet transformative idea: that every resident should be able to live, work, access care and education, and thrive within a 15-minute walk or bike ride. From an urban geography perspective, this notion regards spatial structure, functional distribution, and centre-periphery relations as key factors of urban inequality [13]. The present study will specifically address the significance of proxilience in relation to urban socioeconomic disparities and vulnerabilities.
Many cities, particularly in post-socialist contexts such as Romania, are shaped by problematic developments, including pronounced spatial unevenness [14]. Historical layering, unregulated sprawl, and legacy infrastructure contribute to significant territorial disparities between dense urban cores and sprawling peri-urban and rural peripheries [15,16,17,18]. These dynamics are most pronounced at the metropolitan and urban–regional scale, where functional integration contrasts sharply with uneven spatial development. Such spatial patterns exacerbate vulnerabilities by overburdening central areas with traffic and pollution, while leaving peripheral zones with limited access to essential services, including healthcare, education, green spaces, playgrounds, and employment opportunities [19,20,21]. Such depressing developments are particularly evident in large, polycentric urban agglomerations.
This study introduces the metaphor of the ‘Superbowl Economy’ to visualize systemic spatial disparities, positioning the urban core as a visible, resource-intensive hub (the Superbowl), while peripheral zones remain structurally marginalized. The metaphor captures cumulative spatial advantage, visibility, and concentration effects that reinforce the dominance of metropolitan cores over time. This idea also demonstrates how spatial vulnerabilities in peripheral areas can be transformed into opportunities for improvement and resilience through strategic interventions [22]. From an analytical perspective on spatial vulnerability, our study draws on the Vulnerability–Opportunity Model (VOM). This framework identifies spatial and infrastructural weaknesses as important starting points for urban renewal through resilience-based strategies. The VOM emphasises targeted and adaptive actions that prioritise resilience and accessibility, guiding cities toward more equitable and sustainable futures [23,24,25,26]. Instead of focusing solely on spatial gaps, it identifies key transformation zones to guide targeted policy responses in urban areas.
Despite growing interest in proximity-based planning, the empirical integration of proximity, resilience, and vulnerability within a single spatial-analytical framework at the polycentric metropolitan level remains rather limited. Larger urban areas are often characterized by significant socioeconomic disparities. Therefore, it is important to trace the nexus between proxilience and spatial wellbeing. This study is therefore framed along the lines of spatial wellbeing analysis grounded in two core components: (i) Maslow’s hierarchy of human needs, adapted for spatial differentiation [27,28]; (ii) a gravitational model of spatial accessibility [29,30,31]. Maslow’s theory, originally developed in psychology, is adapted here to classify urban services according to human necessity, from physiological and safety needs to belonging, esteem, and self-actualisation. The gravitational model assesses how the spatial clustering of services generates either positive pull (cohesion, accessibility) or negative gravitational forces (congestion, social exclusion) [29,31,32,33,34,35,36]. Resilience and vulnerability are not treated as separate theoretical pillars; rather, they are operationalized by integrating needs-based proximity and spatial accessibility within the VOM-informed proxilience framework.
This integrated structure, employing the VOM model outlined above as an analytical tool, ensures a comprehensive methodological design that combines spatial accessibility measures with socio-functional priorities and resilience assessment. These elements will be integrated into the Proximity Index and a multidimensional Proxilience framework, enabling the empirical testing of accessibility, opportunity, and resilience within diversified, polycentric metropolitan areas. This approach advances existing accessibility studies by explicitly linking service proximity with resilience capacity and transformation potential. The framework provides a structured approach to transform areas of spatial neglect into targets for regenerative policy and inclusive urban development.
The research question of this study is: How can spatial inequalities in heterogeneous metropolitan systems, illustrated by the ‘Superbowl Economy’ effect, be reconceptualised and addressed through a proxilience-based implementation of the 15-minute city concept? The architecture of the present study is based on the following design: (i) it starts from the 15-minute concept and combines proximity and resilience into one integrated concept, viz. proxilience; (ii) it next addresses the association between socioeconomic inequality (or wellbeing disparity) at the level of polycentric and heterogeneous urban agglomerations; (iii) the cornerstones of the analysis are based on both Maslow’s hierarchy of needs and gravitational modelling; (iv) empirical validation and testing will be conducted for the Iași Metropolitan Area (IMA), Romania, based on the above-mentioned VOM model.
The study is organised as follows: Section 2 presents the theoretical and empirical foundations of the 15-minute city and proxilience concepts. Section 3 introduces the conceptual framework, including the ‘Superbowl Economy’ effect, Maslow’s hierarchy of urban needs, and the gravitational model. Section 4 describes the data and methodology used to develop and apply the Proximity and Proxilience Indices. Section 5 details the results of our spatial analysis in the IMA, including a discussion on implications of these findings for urban resilience and planning. Finally, Section 6 provides conclusions and policy recommendations.

2. Resiliency, Proximity and the 15-Minute City: State of the Art

Urban resilience refers not only to the capacity of a city to prepare, withstand and recover from shocks and pressures but also to the need to learn from these extreme situations to adapt to new circumstances while aiming to maintain its functions at all levels [37]. From an evolutionary perspective, adaptive and transformative urban resilience must, as a process, promote knowledge and, from a systemic perspective, integrate physical and non-physical characteristics that are organized to simultaneously ensure response and adaptation at different spatial scales [38].
Cities’ structural and functional resilience and transformation often depend on how connectivity and accessibility are managed. In this sense, connectivity is an intrinsic component of resilience, often associated with urban morphological changes, adaptive design, and urban regeneration [39].
Many cities have adopted chronourbanism as a guiding principle of planning and the concept of the x-minute city as an optimal framework for inclusive and resilient communities [40]. However, transitioning from theoretical studies and models to practical application is not easy, so some cities have remained only as theoretical frameworks [41]. For a concrete application, it is necessary to explore complex spatial, socioeconomic, and environmental urban features, among which the current location of services and facilities, socio-demographic and economic characteristics, and the configuration of the street grid play an important role [42].
Some authors go even further, proposing a perspective of resilient cities that is deeply focused on localism [43,44], stillness [45,46,47], slowness [48,49,50] or immotility [51]. The revalorization of the local, a slower urban rhythm and the reduction of travel (especially motorized travel) is a strategy considered by numerous authors to reduce the continuous acceleration specific to the Anthropocene, directly linked to car and mobility dependency that has become constraining for the current city and puts great pressure on the environment, its quality and natural resources (especially where these are limited), increasing stress and decreasing the quality of life in cities [52,53].
While traditional trends in urban accessibility have been marked by improved mobility through increasingly faster modes of transport, a shift towards re-valuing physical proximity has become evident. We can discuss a pivot from accessibility-based to proximity-based strategies to ensure local access to a broader range of services [54]. Especially during the COVID-19 pandemic, access to services in close physical proximity through slow mobility has proven to have significant benefits for both physical health and quality of life [55]. From this perspective, proximity-centred accessibility is a framework for research and practice that focuses on a much wider variety of mobility-centred approaches, both fast and slow [56,57]. It is an attempt to counteract the effects of hypermobility, linked to motorization and uncontrolled urbanization, on the quality of life through its social, spatial, and environmental impact [58,59].
Accessibility by proximity thus proposes a profound rethinking of both the urban form, functions, and rhythms of cities through planning measures that reduce the spatial and temporal intensity of travel in some urban areas and ensure accessible services and opportunities through travel that involves active mobility, slower but healthier for people and the environment, while also integrating indirect forms of digital access to goods and facilities [60].
Thus, proximity, by definition, implies access to local services and facilities, which some authors consider more important than transit access or regional accessibility [61]. It is primarily because local accessibility is a condition for social and spatial justice and for the inclusion of urban communities, thereby facilitating participation in social life and other activities that contribute to residents’ quality of life [60]. Therefore, access to amenities and services can be considered a spatial proxy indicator of wellbeing [54,62,63].
For this, the first condition is the equitable distribution of services and opportunities in the near proximity of their residences or via the internet to address the diverse needs of different social groups, thereby reducing existing disparities. The second is related to redesigning paths and public spaces in highly walkable and cyclable spaces, prioritizing their quality over speed of movement [59,60,64]. In this post-car vision, however, substantial efforts must be made to identify and measure inequalities in spatial accessibility and optimal urban regeneration modalities, considering that cities are diverse and often have adjacent areas built in different eras that may be less permissive for redevelopment and restructuring.
It is also necessary to assess the addressability of services by accounting for the attraction of services and facilities in the vicinity using gravity measures. These use the distance decay function, i.e., distance friction, to manage the distance decay effect along the shortest path and integrate the number of people in the service area [65].
In close connection with urban resilience, these proximity services should also be considered from the perspective of extreme events that can affect the city. During a critical period of a natural disaster, including pandemics, people need access to goods and services such as food, education, health care, and cultural amenities, in addition to water, power, sanitation, and communications, to return to some semblance of everyday life [66]. Closely related to this is the concept of acceptable access, which assumes the minimum level of facilities suitable for human wellbeing, considering proximity, costs and capacities, and the vulnerabilities of communities [67].
In this context, the 15-minute city (15-minC) model has emerged as a significant framework in urban studies, particularly in response to rising concerns around mobility, accessibility, and social inequalities. The 15-minC is further developed through a contemporary perspective, emphasising proximity, localised access to services, and the spatial redistribution of daily functions to better respond to human needs and enhance quality of life [10,68,69,70,71,72]. This renewed focus on neighbourhood-scale urbanism has been widely recognised for its capacity to support social equity, reduce carbon emissions, and enhance urban livability [54,73,74,75]. Although the 15-minC offers a solid foundation for proximity-based planning, its integration with resilience theory and spatial diagnostics of socio-territorial inequality, particularly in fragmented, post-socialist contexts, remains underexplored in the literature. This gap relates to how proximity-based models intersect with spatial structure, territorial differentiation, and centre–periphery dynamics.
Central to the 15-minC notion is physical proximity, but the model also reflects a broader vision of urban resilience, defined not only as the capacity to absorb shocks and to adapt and renew itself during disruption [9,37,76,77,78]. Moreno expanded the concept through proxilience, which fosters polycentric proximities, including neighbourhood-scale economies, social cohesion, local accessibility, and reduced dependence on distant resources [9,10,11]. The Proxilience Framework integrates the relocalisation of services, soft mobility, and decentralised infrastructure to support wellbeing and adaptive capacity. It promotes short supply chains, community-level production–consumption cycles, and substantial local autonomy, reducing both emissions and vulnerability to global disruptions [79,80,81]. This integration of urban proximity with systemic resilience underpins the concept of proxilience, defined as a spatial condition in which proximity-based access to urban services aligns with systemic resilience capacities, thereby fostering adaptive and inclusive urban territories.
The renewed valuation of proximity functions as a catalyst for social interaction, autonomy, and place-based solidarity [82,83,84] for both local communities [85] and tourists [86,87], shaping cities morphologically by integrating individual accessibility into urban form dynamics and spatial behaviour [88,89]. Local shops, markets, and craft activities enhance employment and civic engagement, while improved public space and street-level amenities strengthen cohesion. These dynamics require an understanding of urban–rural diversity, behavioural shifts toward active mobility, and multi-scalar service delivery, particularly in hybrid territories [90,91,92,93]. These hybrid configurations are particularly significant in metropolitan regions where urban, peri-urban, and rural spaces are functionally interconnected but unevenly serviced. Proxilience could represent a new concept that links resilience, delocalization, and solidarity into a cohesive human-centred urban framework.
Additionally, resilience and vulnerability are no longer viewed as separate conditions; instead, they are seen as interconnected. Under certain conditions, vulnerability becomes a platform for transformation. Provitolo [94] introduced the concept of ‘resiliencery vulnerability’, highlighting that vulnerabilities, if strategically addressed, can become drivers of resilience. This understanding aligns with approaches that view vulnerability as unevenly shaped by space. This is particularly relevant in post-socialist urban contexts, where systemic disparities provide opportunities for regeneration, as demonstrated by previous studies using integrated vulnerability–resilience models [95]. The gravitational model of spatial accessibility complements this view by showing how the spatial distribution of services can either reinforce exclusion or catalyse cohesion. Spatial access is conceptualised not as static but as a dynamic force that shapes opportunities or marginalisation, integral to the proxilience framework. Resilience essentially involves proximity, connectivity, and accessibility [96,97,98]. From a systems-thinking perspective, it also encompasses polycentricity, redundancy, and social learning, principles tied to spatial and territorial planning [99]. Resilience frameworks that integrate spatial proximity are increasingly recognised as essential to adaptive and inclusive city systems [100,101,102]. This study builds directly on these theoretical contributions by offering a spatialized implementation of the proxilience framework in a fragmented post-socialist urban setting, where inequalities are exceptionally distinct.
Maslow’s hierarchy of needs provides a human-centred framework to prioritise accessibility. When spatialized, it allows the assessment of whether urban systems provide access to physiological services (food, shelter), safety (healthcare, air quality), social connection (education, green space), esteem (employment, culture), and self-actualisation (creativity, civic participation) [28,103]. This enables the identification of spatial gaps in essential needs and supports targeted interventions [104]. In a different approach, Omodan and Abejide applied this model to the needs related to access to urban infrastructure to propose more inclusive forms of distribution [105]. Maslow’s framework thus complements the proxilience framework by linking spatial planning to human wellbeing.
Together, these elements enhance livability and build systemic resilience across complex, mixed territories. The present study addresses a key gap in current urban research: the lack of a multidimensional framework that integrates spatial proximity, resilience principles, and stratified human needs into a measurable planning tool. Although proximity and resilience have been explored independently, few empirical approaches have connected them to systemic urban inequalities or operationalised them through a proxilience index at the metropolitan scale. This shortcoming drives the development of the proxilience framework and shapes the hypotheses examined in this study.
While the 15-minC concept, Maslow’s hierarchy of needs, and the gravitational model have been extensively explored in the literature, there is a distinct gap in studies that integrate these frameworks into a cohesive VOM. Moreover, the role of second-tier cities, such as Iași, remains insufficiently examined, despite their significant contributions to national development. Also, while proxilience components—proximity, resilience, spatial accessibility, and human needs—are well covered in the literature, an integrated vulnerability–opportunity framework remains underdeveloped. By connecting these elements with spatial indicators, this study frames proxilience as both a theoretical construct and an operational planning tool. The foregoing literature review identifies several important research challenges. To explore these, the following hypotheses are tested:
H1:
High spatial centralisation of services and amenities (the ‘Superbowl Economy’ effect) correlates with increased urban vulnerability and reduced wellbeing in peripheral neighbourhoods.
H2:
Areas with higher proximity-based access to services aligned with all levels of Maslow’s urban needs exhibit significantly greater resilience and wellbeing outcomes.
H3:
Proxilience—the integration of proximity and resilience within the Proxilience Framework—provides an explanation of urban–regional sustainability and quality of life.
The remaining part of the paper will be devoted to an empirical testing of these propositions.

3. From a Conceptual Framework to an Empirical Model of Proxilience

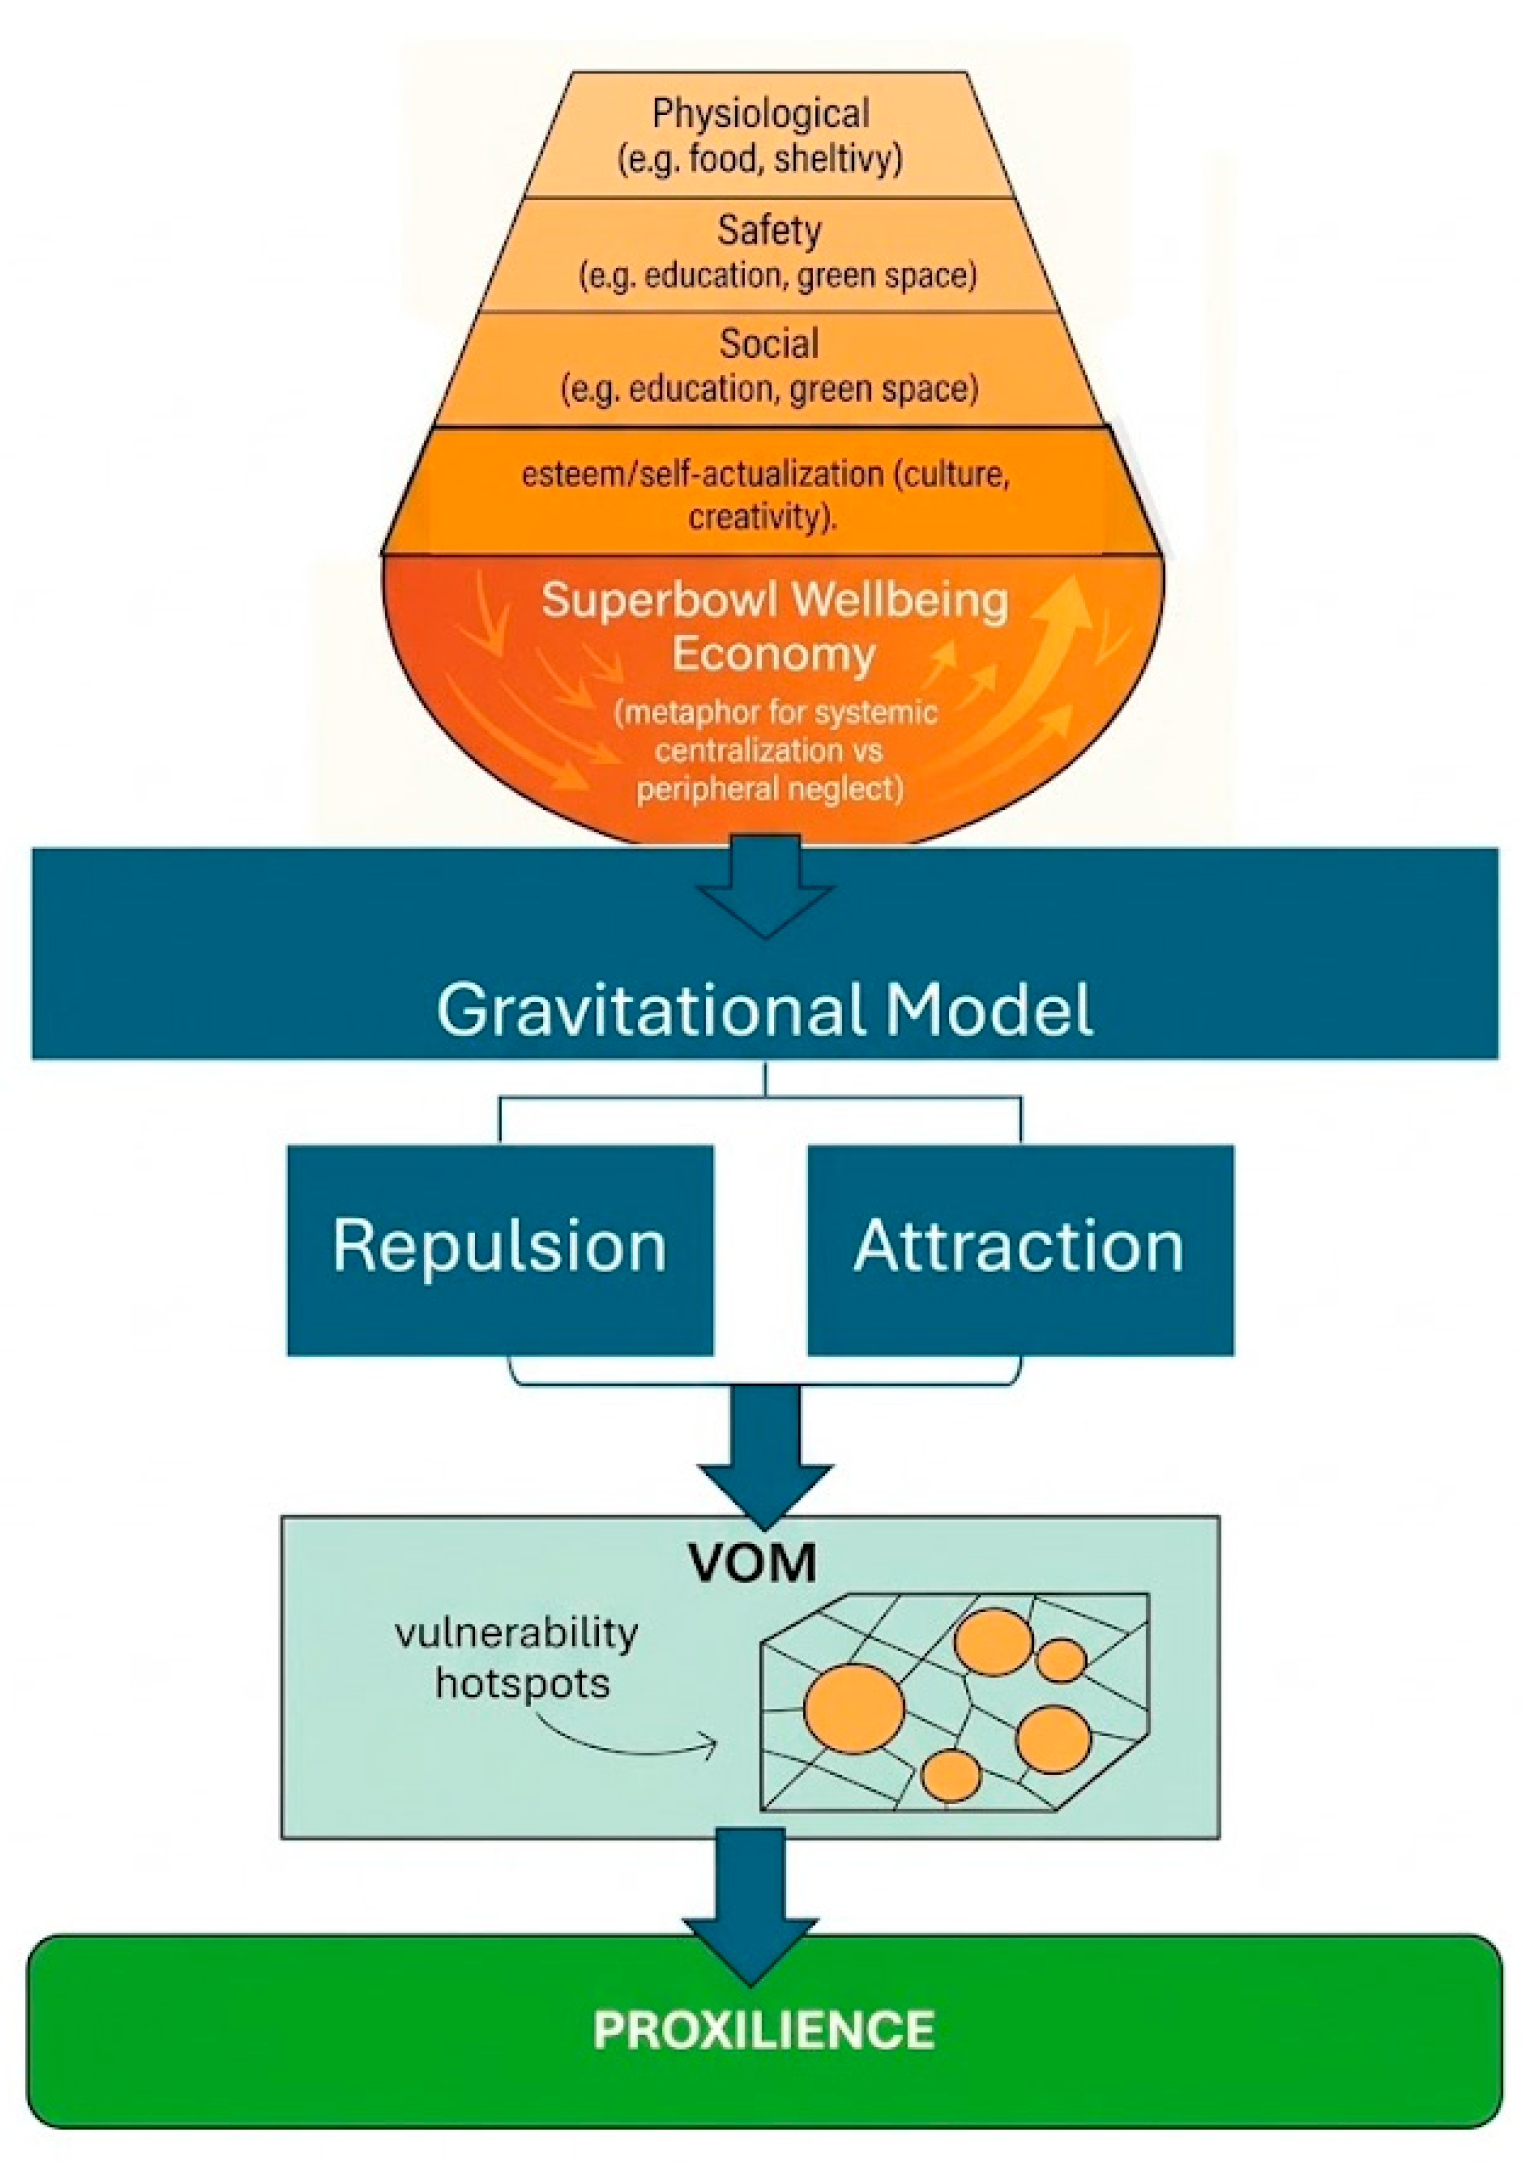
This study develops a multidimensional framework that integrates proximity, resilience, and spatial justice into a cohesive analytical perspective, termed the proxilience framework. Spatial justice here refers to the equitable distribution of access, opportunities, and adaptive capacity across metropolitan space. Figure 1 presents the three conceptual layers (Maslow’s hierarchy, the gravitational model, and the VOM) that structure the analytical framework of proxilience with the ‘Superbowl Economy’ introduced as a metaphor to illustrate the consequences of systemic centralisation and peripheral neglect. The figure serves as both a conceptual synthesis and a guide for operationalizing the framework.
The conceptual model integrates these three interconnected layers: (1) Maslow’s hierarchy of needs, which classifies urban services based on their role in human wellbeing; (2) the gravitational model, which measures spatial attraction/repulsion to assess service accessibility and urban flow dynamics; and (3) the VOM, which identifies areas of risk and potential for resilience-based transformation. This figure shows how unfulfilled needs (Maslow) in low-access areas (gravity) create vulnerability hotspots (VOM), from which proxilient strategies can develop. This logic connects neighbourhood accessibility to broader metropolitan inequality.
The first layer builds on Maslow’s hierarchy, adapted for urban analysis to categorise human necessities spatially, from physiological (e.g., food, shelter) to safety (health, security), social (education, green space), and esteem/self-actualisation (culture, creativity). This structure is used not only thematically but also as the foundation for the Proximity Index, assigning weights using the Analytical Hierarchy Process (AHP). This weighting aligns accessibility measures with wellbeing priorities and supports quantitative comparison across urban functions.
The second layer introduces the gravitational model, widely used in spatial interaction theory to explain urban flow. Here, it measures the density and diversity of accessible services and translates them into attraction (positive) or repulsion (negative) forces. When combined with Maslow’s framework, this creates a dynamic Proximity Index that reflects both service urgency and spatial flow. Zones of strong positive gravity cluster around dense services; weak or scattered zones create ‘blind spots’, territories of exclusion and disconnection. Together, these two layers illustrate the ‘Superbowl Economy’. These concepts directly inform H1.
The third layer introduces the VOM, originally developed in urban risk research [23], which reframes vulnerability as a potential for regeneration rather than a deficit. Rather than functioning separately, VOM is embedded within the spatial structure by pinpointing where unsatisfied needs (Maslow) coincide with weak attraction (gravity). These areas, neglected, fragmented, and underserved, become strategic targets for transformation through proxilient planning. This approach supports H2 and H3, which posit that urban wellbeing increases where accessibility and resilience converge.
To capture the impact of these layered inequalities, the ‘Superbowl Wellbeing Economy’ metaphor is used to illustrate how visibility, attention, and investment concentrate in central zones (‘the bowl’), while peripheral areas remain disconnected. This metaphor complements the gravitational and vulnerability models by visualising spatial exclusion as a systemic, not incidental, pattern of development.
Together, the above-mentioned three layers converge in the analytical core of the proxilience framework. It functions as both a conceptual structure and the basis for the operational composite indicator—the Proxilience Index—which measures the intersection of spatial access (Maslow and gravity) and transformation potential (VOM).
The Proxilience Index builds on the Proximity Index by also incorporating environmental quality (NDVI, air pollution), demographic stability (ageing, attractivity), infrastructure access (healthcare, roads), and socioeconomic robustness (income, education). This composite indicator measures not only access, but also the capacity to advance and transform. This makes proxilience distinct from traditional accessibility indices. It operationalises H2 and H3 by testing whether proxilience, rather than accessibility, predicts resilience and wellbeing outcomes.
The framework is implemented at the local administrative units (LAU2) level, using fine-grained demographic, infrastructure, and environmental data. This enables detailed, place-based comparisons across Iași’s fragmented urban–rural system. The multi-scalar design allows for broader replication in similar post-socialist or hybrid urban systems.
In conclusion, the proxilience framework addresses an underexplored area: the absence of an integrated model that connects spatial accessibility, human needs, and resilience transformation. It provides a testable structure to support inclusive urban regeneration and guide spatial policy through empirical indicators, such as the Proxilience Index. The framework is also designed to be adaptable to other metropolitan contexts with similar structural conditions.

4. Materials and Methods

4.1. Spatial Empirics of the Study Area

The area selected for this empirical analysis applies the above-described theoretical framework in the Iași Metropolitan Area (IMA). Iași is one of the oldest Romanian cities, boasting a strong cultural identity. It is the centre of a metropolitan area covering 787.87 km2 and home to 507,100 inhabitants (the second-largest metropolitan area in Romania). It is also one of the largest cities on the European Union’s eastern border. The discontinuous but significant economic development over the past 35 years, combined with some inhabitants’ preference for living in less agglomerated areas, has led to population and built-up surface overflow in the peri-urban areas, with surrounding municipalities recording increases of up to fivefold. Therefore, the authorities were unable to keep up with service provision to meet the continuously increasing demand, resulting in significant gaps in access to facilities across many peri-urban communes. This has increased the need for daily travel among the peri-urban population, not only for commuting to work but also for accessing essential services, including food, education, healthcare, recreation, and cultural amenities [106]. In addition, the IMA is highly heterogeneous, and the differentiation between the centre and the periphery is substantial; the communes located in the outer ring (especially those without access to a national road) are often rural, with lower densities and a high percentage of ageing population, and a lack of access to critical physical facilities. This context highlights the need to rethink infrastructure development and proximity services. Iași is a typical post-socialist city, characterized by rapid peri-urban growth, fragmented functions, and clear centre–periphery inequalities.
This study employs spatial and geostatistical methods, including gravitational modelling and multivariate analysis. The methodological design combines microscale accessibility analysis with LAU2-level aggregation to capture cross-scale spatial inequalities. At the microscale, defined as service-level and pedestrian-accessibility analysis, the study uses various indicators from multiple data sources—such as the Open Street Maps (OSM) and web-scraped data on urban services, the Global Human Settlement Database (GHSL) GHS-POP R2023A Package for population density and GHS-BUILT-S R2023A Package built area data by the Joint Research Centre (JRC) of the European Commission, Copernicus Sentinel imagery for 2022–2024 (used for computing the NDVI), and the European Environmental Agency (EEA) air quality 1 km grid for environmental quality for 2018–2022 (retrieved from the Air Quality Download service, first edition). These datasets were used to create spatial accessibility models to evaluate and optimise urban accessibility within the proxilience framework. Thus, spatial accessibility was calculated (at the microscale) in terms of time–distance, as well as user pressure on proximity services (normalised by the density of potential users) to account for demand–supply imbalances across space. Key analytical steps included a buffer-based service-area analysis to identify spatial clusters and cold spots and the differentiation of the urban core, peri-urban areas, and peripheral metropolitan areas.
Second, at the local level (LAU2), the approach develops and applies two integrative measures: the Proximity Index and the Proxilience Index. LAU2 is the most relevant administrative scale for spatial planning and service provision in Romania. These indices are built on a layered data strategy that combines microscale results (aggregated to the LAU2 level) with statistical social, economic, and environmental indicators (available at the LAU2 level). We used the available official data from the Romanian National Institute of Statistics, including 2022 Census Data on population density (DENSIT), urbanization (URBANIZ), migratory growth (ATRACTIV), ageing population (AGED), income (INCOME), health staff (HEALTH), and average floor area per capita (sqm/inhabit.) (HOUSE). Additionally, data from the Romanian Urban Policy Report (2019) for persons with disabilities (DISAB), access to national roads (NAT_ROAD), and access to regional roads (REG_ROAD) were utilized (Table 1).
Besides all indicators shown above that were used to construct a proximity index and to analyse proxilience, additional indicators had to be added as proxies for wellbeing: Local Attractivity/Migration Rate (ATRACTIV), Local Human Development Index (LHDI), Life Expectancy at 65 years (LIFE_EXPEC65), and Local Material Capital (L_MAT_CAP). These wellbeing proxies serve as dependent variables in the spatial regression models described later, allowing for evaluation of how proxilience index shapes urban quality of life. These variables are not part of the Proxilience Index itself.
All indicators, time frames, and sources are described in Table 1, which also includes an assessment of the indicators’ relevance from the VOM’s perspective.

4.2. Composite Index Construction and Modelling

4.2.1. The Proximity Index

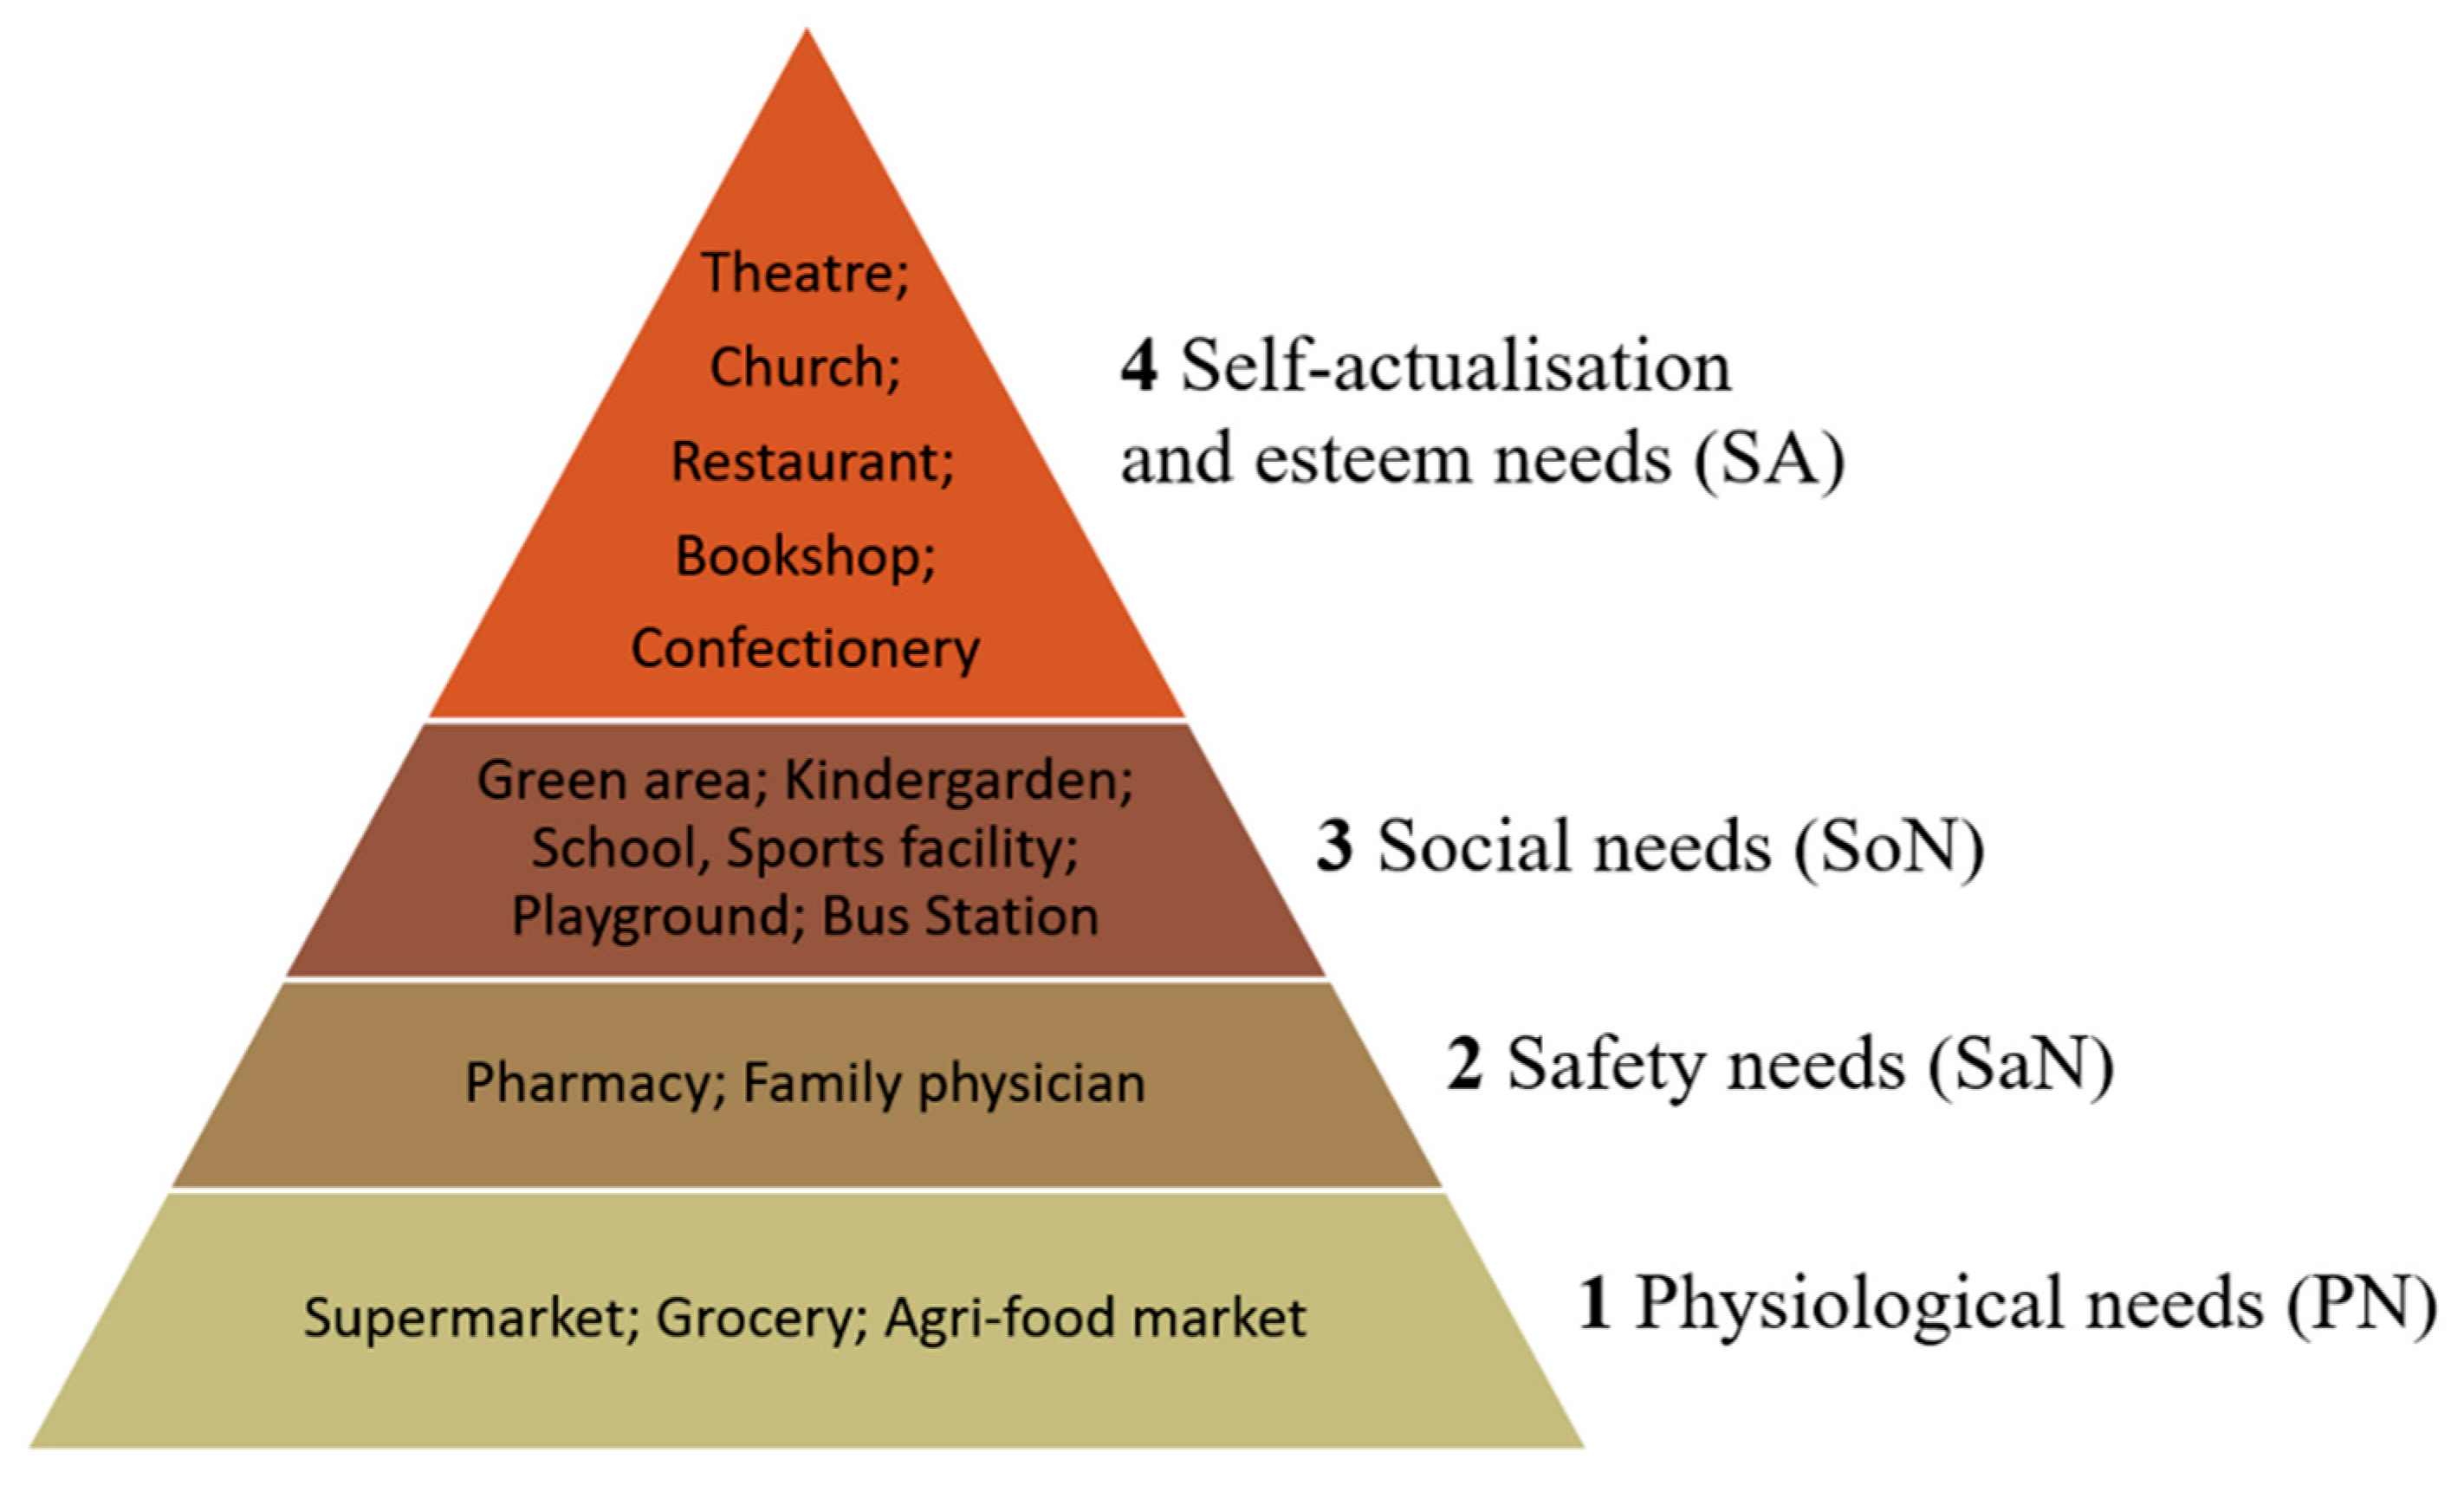
A Proximity Index (PI) was developed to assess urban spatial accessibility based on Maslow’s hierarchy of needs, translated into categories of proximity-based services. The hierarchy is thus grounded in both psychological and spatial planning literature. This conceptual framing supports operationalisation of proxilience by offering a practical basis for weighting and aggregating accessibility across different service types and spatial contexts. This ensures that accessibility is interpreted as a spatially differentiated process, rather than a uniform condition. Services were grouped into four hierarchical levels, with weights assigned to reflect their relative importance. The closer a service lies to the base of Maslow’s pyramid (see Figure 2), the higher its weight. This approach enables the prioritisation of essential services in spatial planning, thereby aligning psychological wellbeing, urban spatial structure, and territorial organisation.
To assign weights, an Analytical Hierarchy Process (AHP) analysis was applied using the AHP Priority Calculator (https://bpmsg.com/ahp/ahp-calc.php, accessed on 15 August 2025), developed by Goepel [107]. The AHP method, developed by Saaty [108], was used to determine the indicator weights. The method is a multi-criteria decision-making tool that uses a matrix model to integrate indicators, based on a systemic interpretation of a list of factors, options, or alternatives through pairwise comparisons. AHP is particularly effective for incorporating qualitative judgments into the construction of spatial indicators. Each factor is rated against every other factor using predefined scores (ranging from 1 to 9) that indicate their relative importance. To ensure that the pairwise criterion weights are not random, AHP uses the consistency ratio (CR). A panel of academics from Alexandru Ioan Cuza University, Iași, Romania, experts in human geography and urban planning, provided the scores. Their general assumption was that one must prioritize fulfilling the basic needs of the population by first ensuring access to critical services necessary for subsistence, and then their more complex needs from the highest levels of the hierarchy. The consistency ratio verifies the internal coherence of the expert judgments. In Table 2, the resulting weights for each of the four criteria are presented, derived from pairwise comparisons. These weights represent the contribution of each needs-based service category to the composite Proximity Index, reflecting expert judgment on their importance for spatial accessibility. Higher weights for physiological and safety needs indicate their prioritization in proximity-based urban planning.
The very low consistency ratio confirms a high level of agreement among experts and validates the robustness of the weighting scheme. After z-score normalization of indicators and aggregation into weighted means, all indicators were transformed to ensure comparability across units and scales. The AHP weights were applied as follows:
P I i = j = 1 n w j z i j ,
where w j are the AHP weights.
Consequently, the Proximity Index (PI) was calculated as
P I = P N × 0.467 + S a N × 0.277 + S o N × 0.160 + S A × 0.095 ,
This formulation ensures that access to essential services has a greater impact on the index than access to higher-order needs, consistent with the Maslow hierarchy.

4.2.2. The Proxilience Index

In addition to the Proximity Index, a Proxilience Index was created by integrating the Proximity Index and the selected V–O indicators (see Table 2). This composite index provides a multidimensional view of resilience by combining socioeconomic indicators, service accessibility, and environmental conditions. It expands the proximity model by incorporating elements from the VOM, reframing spatial gaps as potential transformation zones—an essential step in operationalizing H2 and H3 by integrating exposure, capacity, and transformation potential. This process illustrates how theoretical components are translated into measurable dimensions. The integration of green infrastructure and health access ensures a holistic approach to spatial vulnerability analysis.
To aggregate the indicators, they were standardized and normalized. Principal Component Analysis (PCA) was then applied to reduce dimensionality and prevent multicollinearity, ensuring that each factor contributes uniquely to the Proxilience Index. The PCA was used to compute the weights for each indicator. The stages of index calculation1 were as follows [109]:
-
extraction of latent factors (eigenvalues > 1);
-
calculation of a composite factor index (CFI) for each latent factor (J):
W K J = ( F a c t o r   l o a d i n g K J ) 2 E x p l a i n e d   v a r i a n c e J ,
-
for each indicator, we have selected the maximum WKJ and have computed:
α K J = M a x i m u m   W K J E x p l a i n e d   v a r i a n c e J T o t a l   v a r i a n c e ,
-
computation of final weights:
w K J = α K J α J ,
Consequently, the Proxilience Index was calculated as:
P R = P O P D E N S × 0.067 + U R B A N I Z × 0.069 + A T R A C T I V × 0.124 + I N C O M E × 0.065 + A G E D I N V × 0.028 + D I S A B I N V × 0.019 + E D U C × 0.080 + H E A L T H S T A F F × 0.129 + H O U S E × 0.093 + N D V I × 0.012 + P O L U T ( I N V ) × 0.062 + R E G _ R O A D × 0.030 + N A T _ R O A D × 0.097 + F A C I L I T I E S × 0.053 + P R O X I M I T Y I N D E X × 0.072 ,
where INV indicates inversion for indicators that are negatively associated with proxilience, ensuring directional consistency across all indicators.

4.2.3. Quality of Life (QoL)

To explore how proximity and proxilience relate to Quality of Life (QoL), linear correlations (see Section 5.4, Table 3) and regression models (see Supplementary S2) were applied. These models tested the hypotheses outlined in Section 2, using QoL proxies as dependent variables. The QoL proxies were excluded from index construction unless explicitly tested separately. The spatial distribution reflects socio-demographic differences across localities and illustrates specific geographic patterns and clusters of administrative units. These typologies provide actionable spatial categories to guide targeted interventions and inform policy responses. They are directly tied to the framework’s conceptual components and show how proxilience can be spatially operationalised. To strengthen the robustness of results, particularly across peri-urban communes, a Random Forest classification was employed, which:
-
Assessed variable importance
-
Overcame sample-size limitations
-
Explained relationships across urban typologies
The model evaluated the influence of selected vulnerability–resilience indicators, including the Proximity Index, on QoL outcomes using the following proxies:
-
Local Human Development Index (LHDI)—classified into four levels: high, medium-high, medium-low, low;
-
Life expectancy at 65 years (LIFE_EXPEC65);
-
Local Material Capital (L_MAT_CAP).
We also tested the influence of two proxies that are included in the proxilience index:
-
Migratory growth rate (ATRACTIV);
-
Average income (INCOME).
This approach helped identify which indicators most strongly shape QoL patterns across diverse urban contexts.
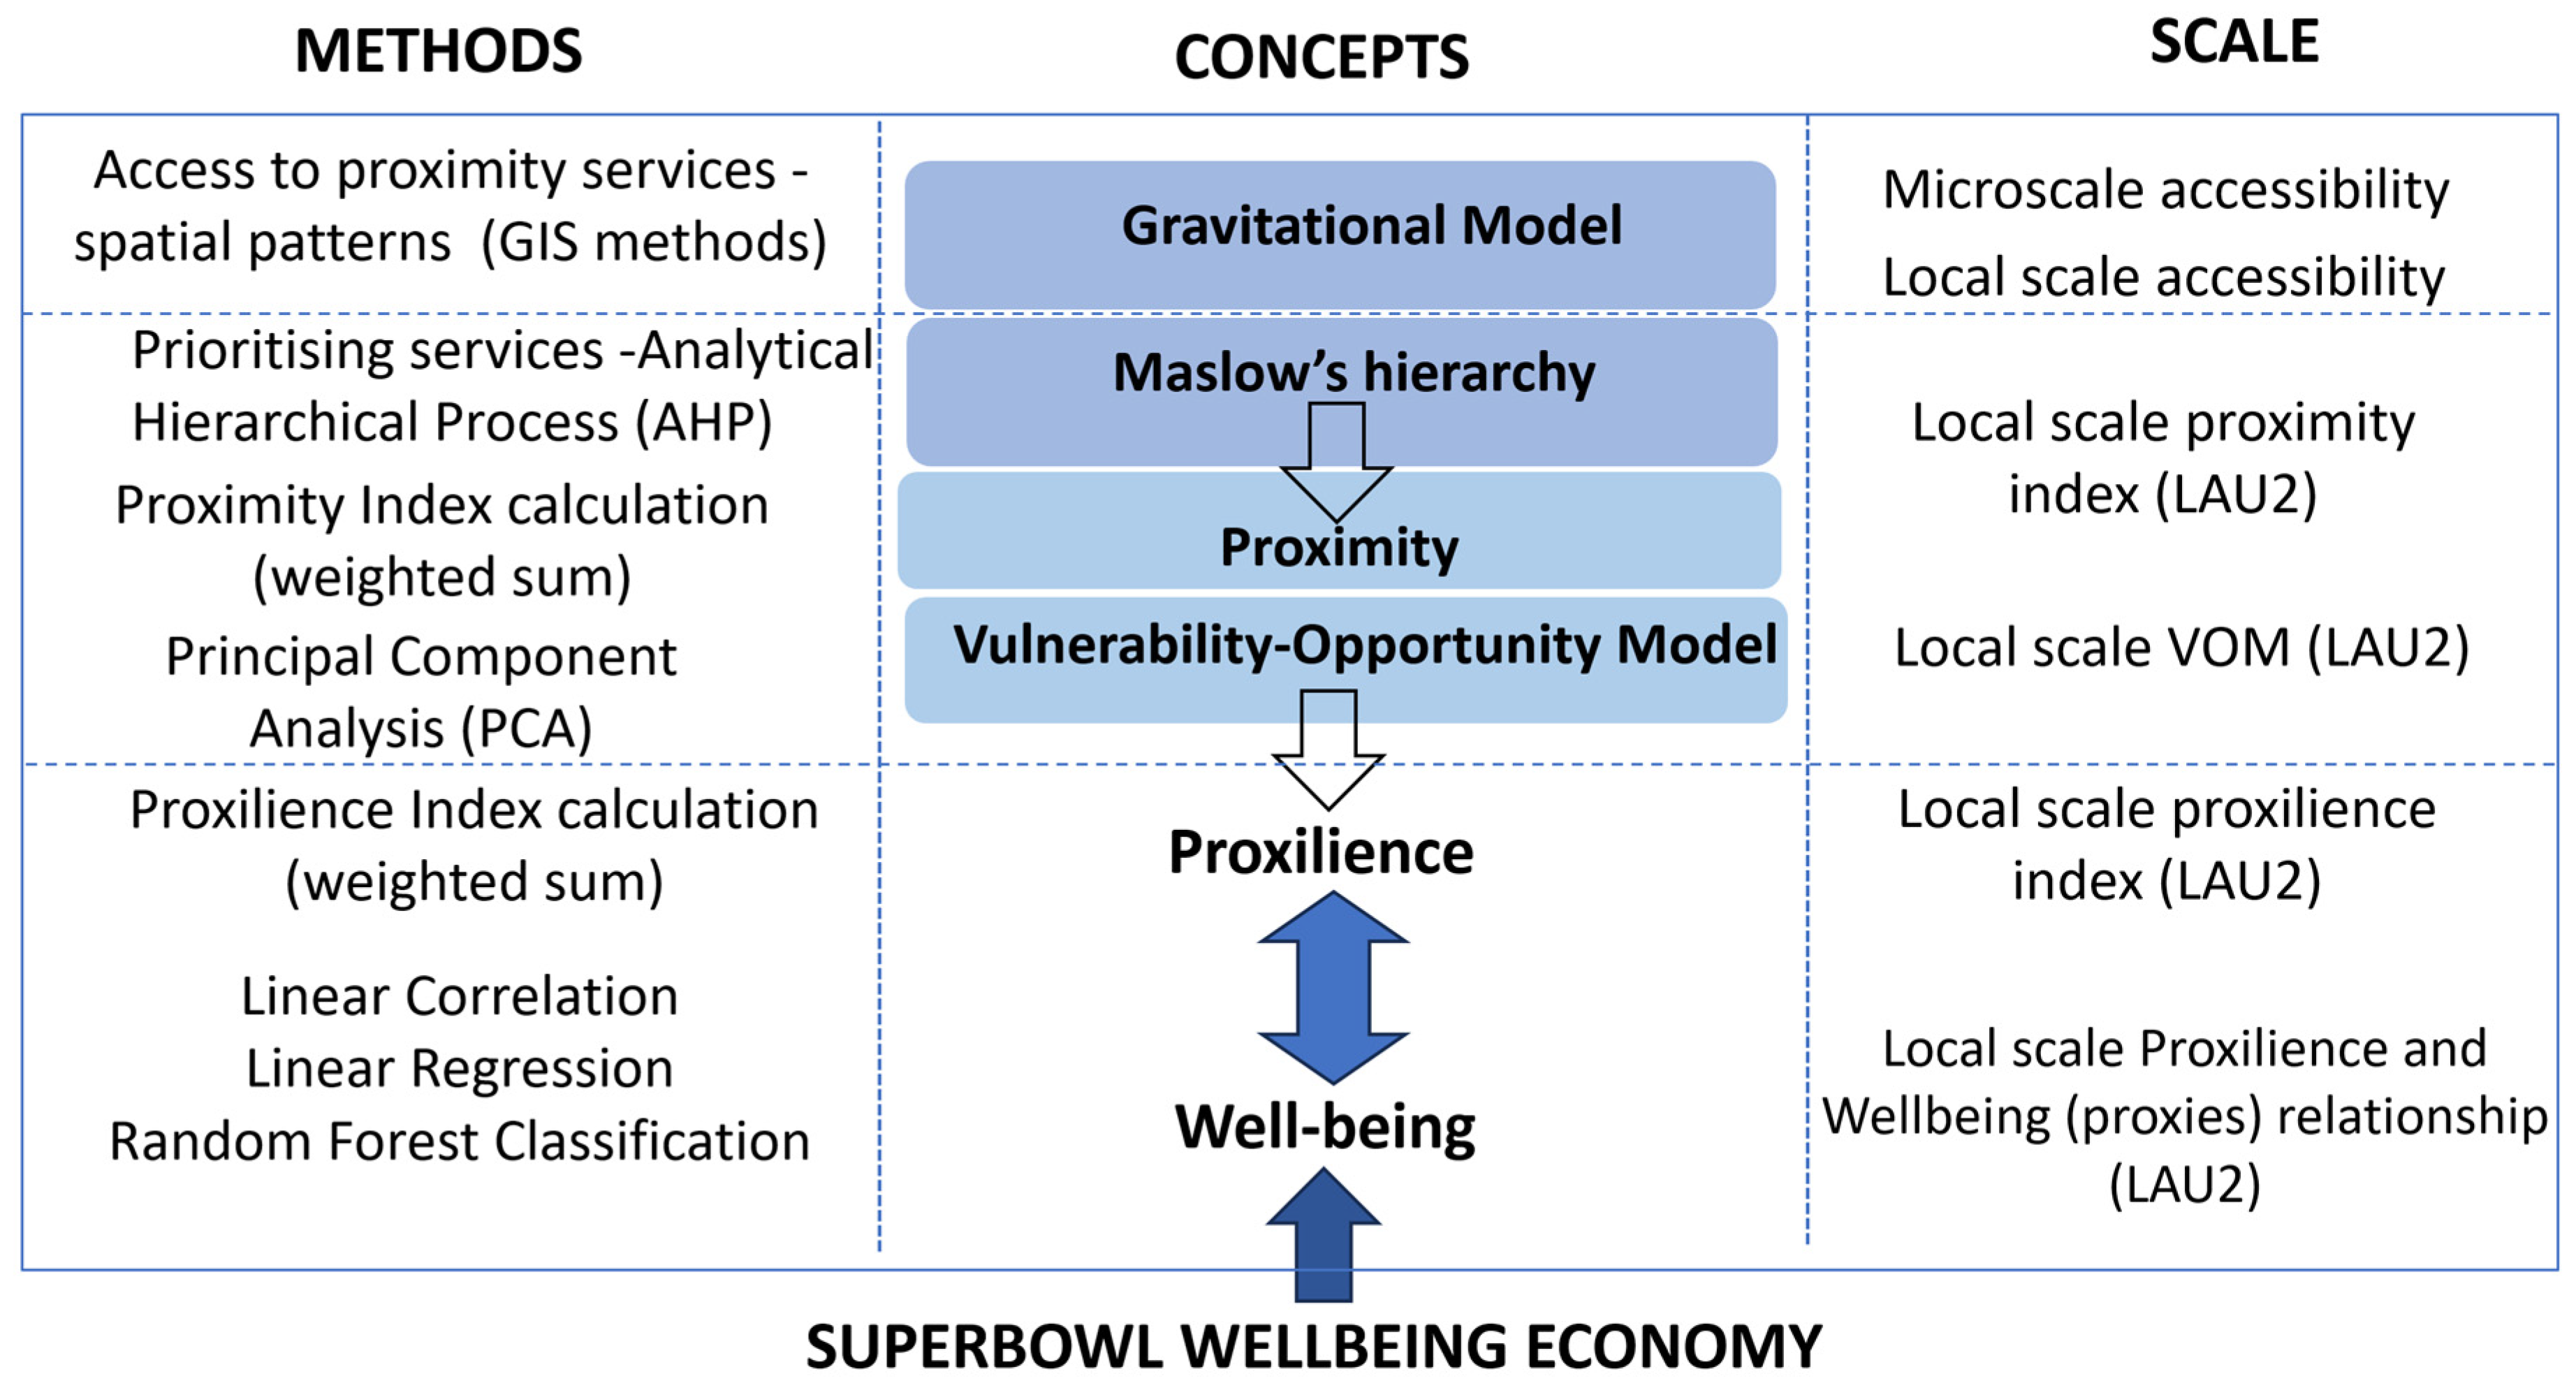
Overall, this methodology that combines various theories, concepts, and technical analysis methods (see Figure 3) enables detailed spatial analysis across central, peri-urban, and peripheral areas, offering data-driven insights for targeted planning.
This complex, exploratory analysis connects the proposed concepts to an empirical evaluation based on available indicators. It represents a first attempt to provide a coherent operational framework for integrating proximity and resilience analysis (proxilience) with QoL proxies in both dense, compact urban areas and more heterogeneous, dispersed metropolitan areas.

5. Results

5.1. Proximity and Accessibility of Services in Iași MA

The application of the Proximity and Proxilience Indices across the IMA revealed several insights into spatial accessibility and vulnerability. The results highlight differentiated performances across space, in line with the conceptual typologies introduced earlier. This section operationalises both indices to assess how spatial inequalities reflect layered human needs and systemic imbalances. Drawing on the VOM framework, the Superbowl metaphor, and gravity-based accessibility, the analysis generates a typology of territorial performance and gaps across LAU2 units. These findings directly address the research question by quantifying territorial disparities and identifying opportunity zones for proxilient urban transformation.
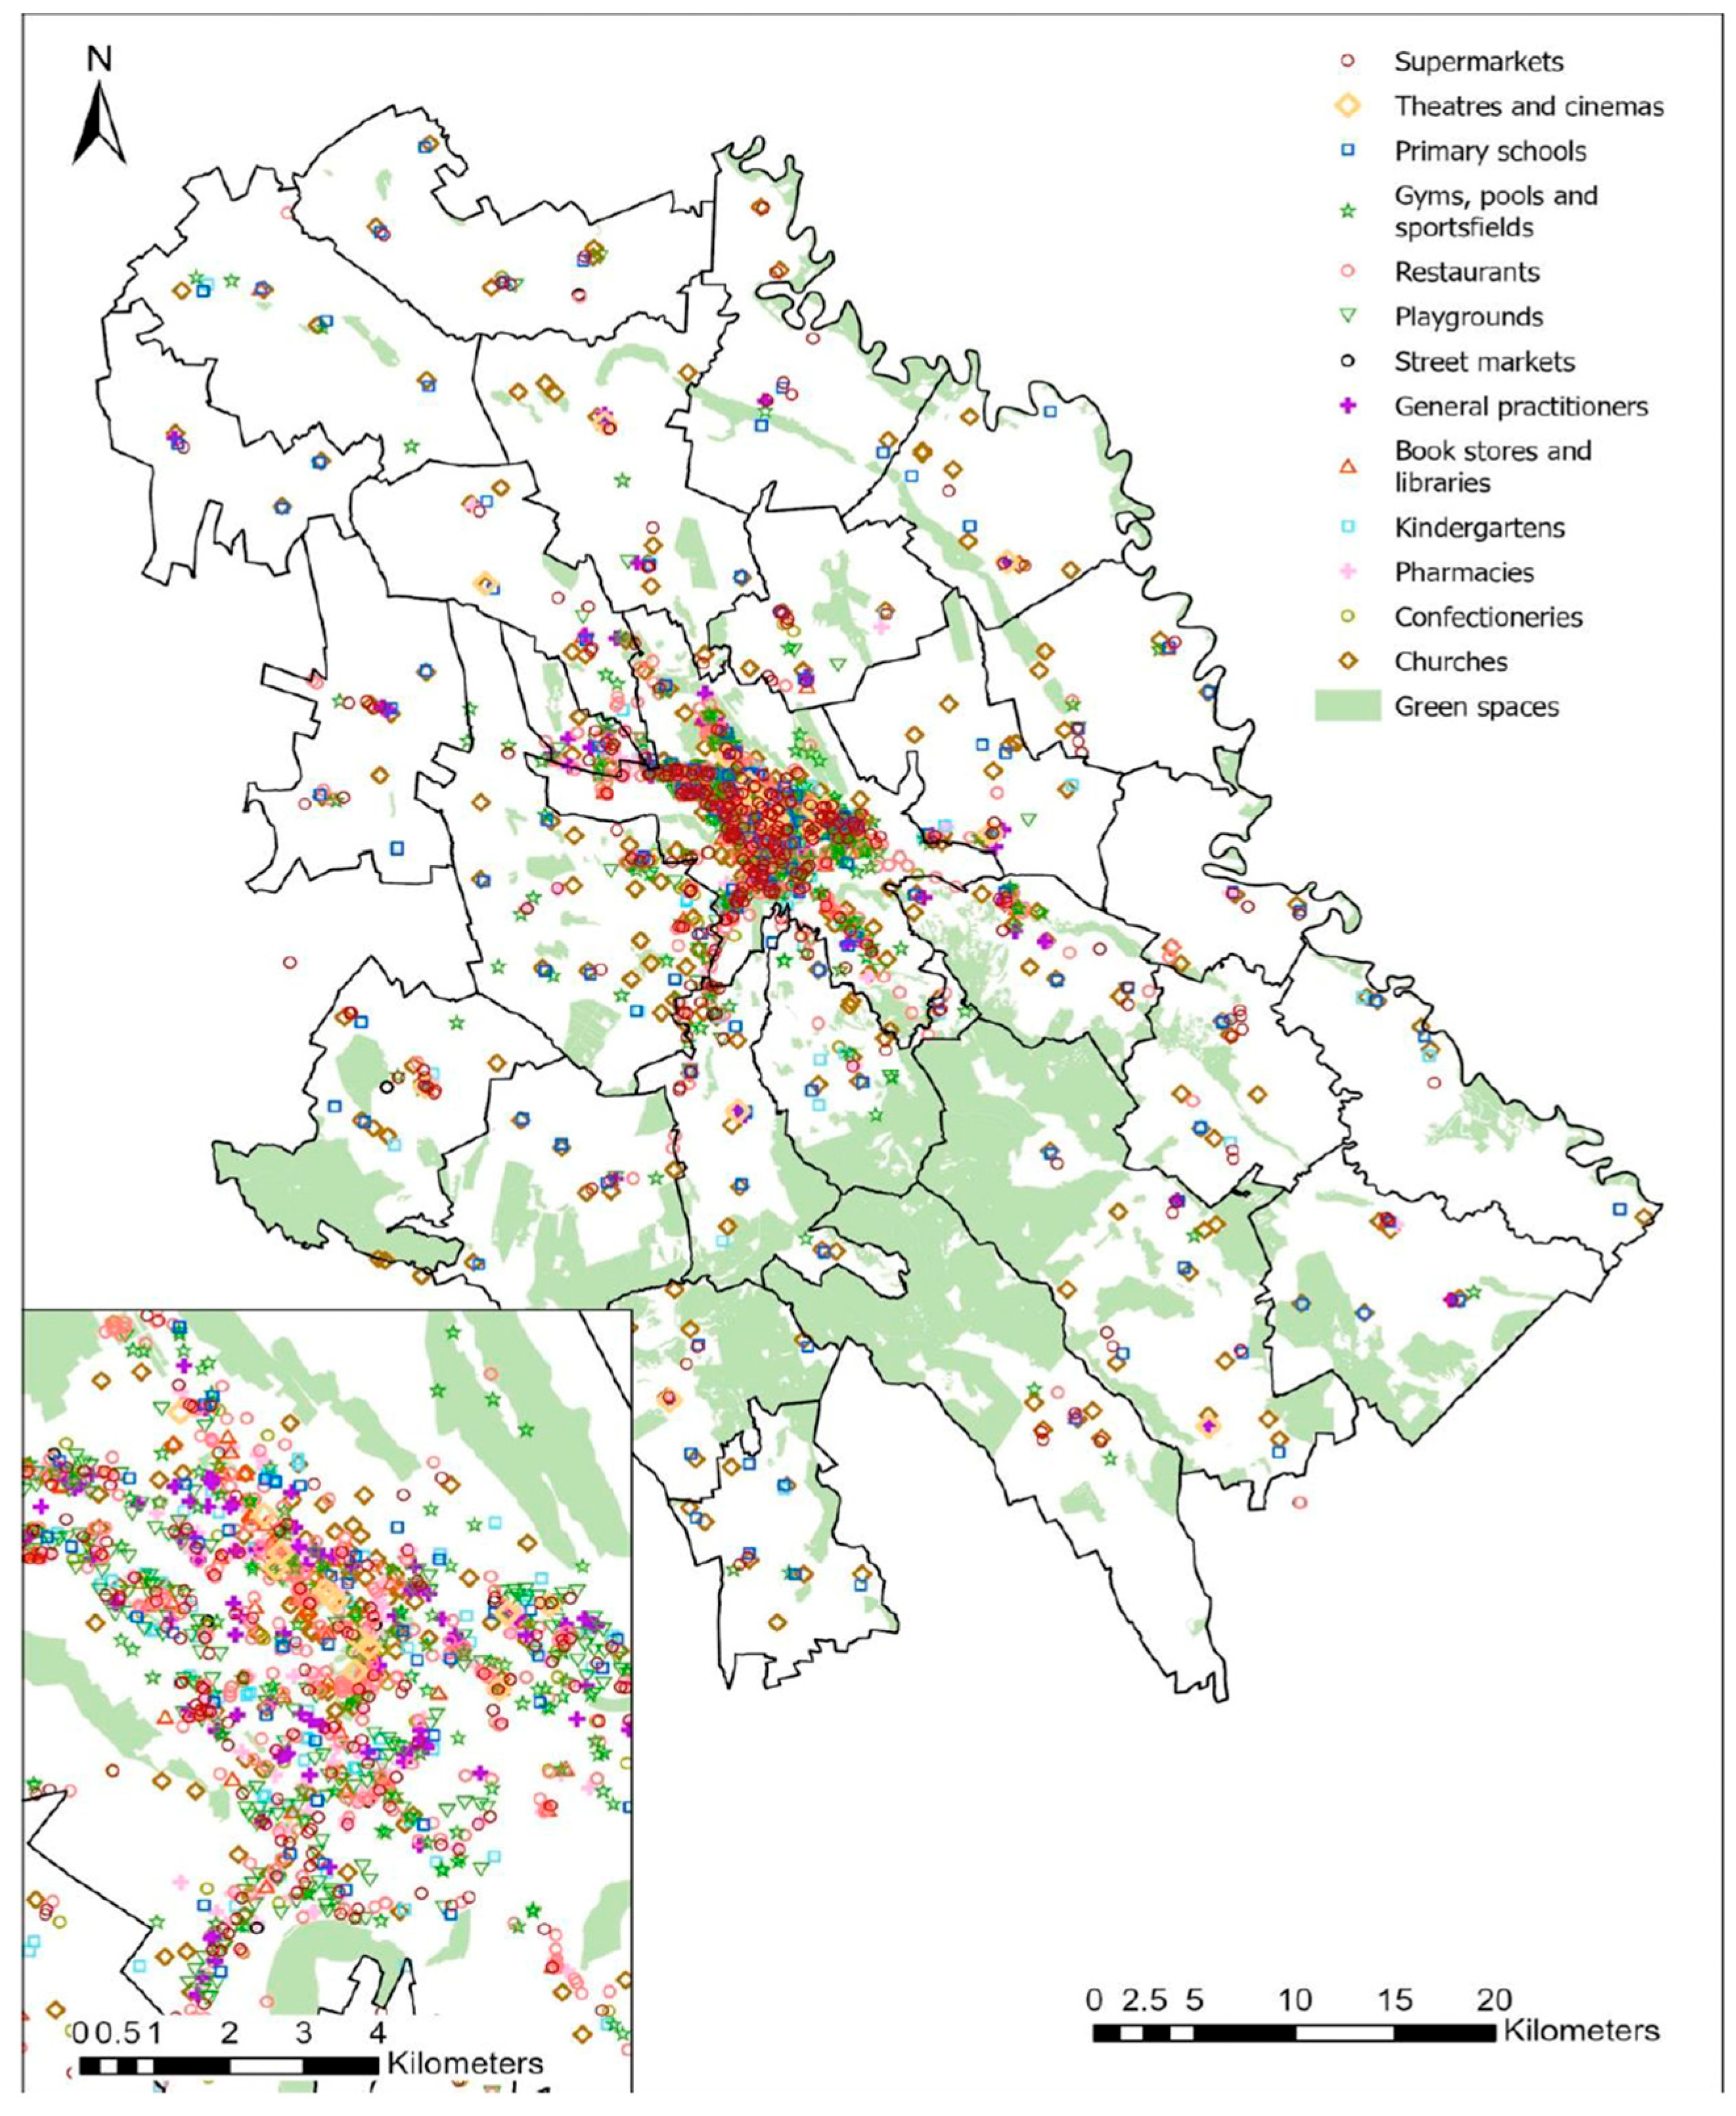
The first step involved identifying available services via web scraping (Botsol 4.0.1.) and field verification to map underserved zones and those with excessive amenity concentration. The results illustrate the spatial distribution of services across IMA, showing a clear concentration in the city core and a gradual dispersion towards peripheral regions. Additionally, peri-urban commune centres and localities along major national roads exhibit notable service clusters. In contrast, the outer ring of the metropolitan area experiences a pronounced service deficit, which influences daily mobility patterns.
Figure 4 illustrates this spatial patterning, showing service clustering and absence levels across Maslow-aligned categories. The structure validates the ‘Superbowl Economy’ effect, where central zones benefit from disproportionate visibility and investment, while peripheral LAUs remain structurally excluded.
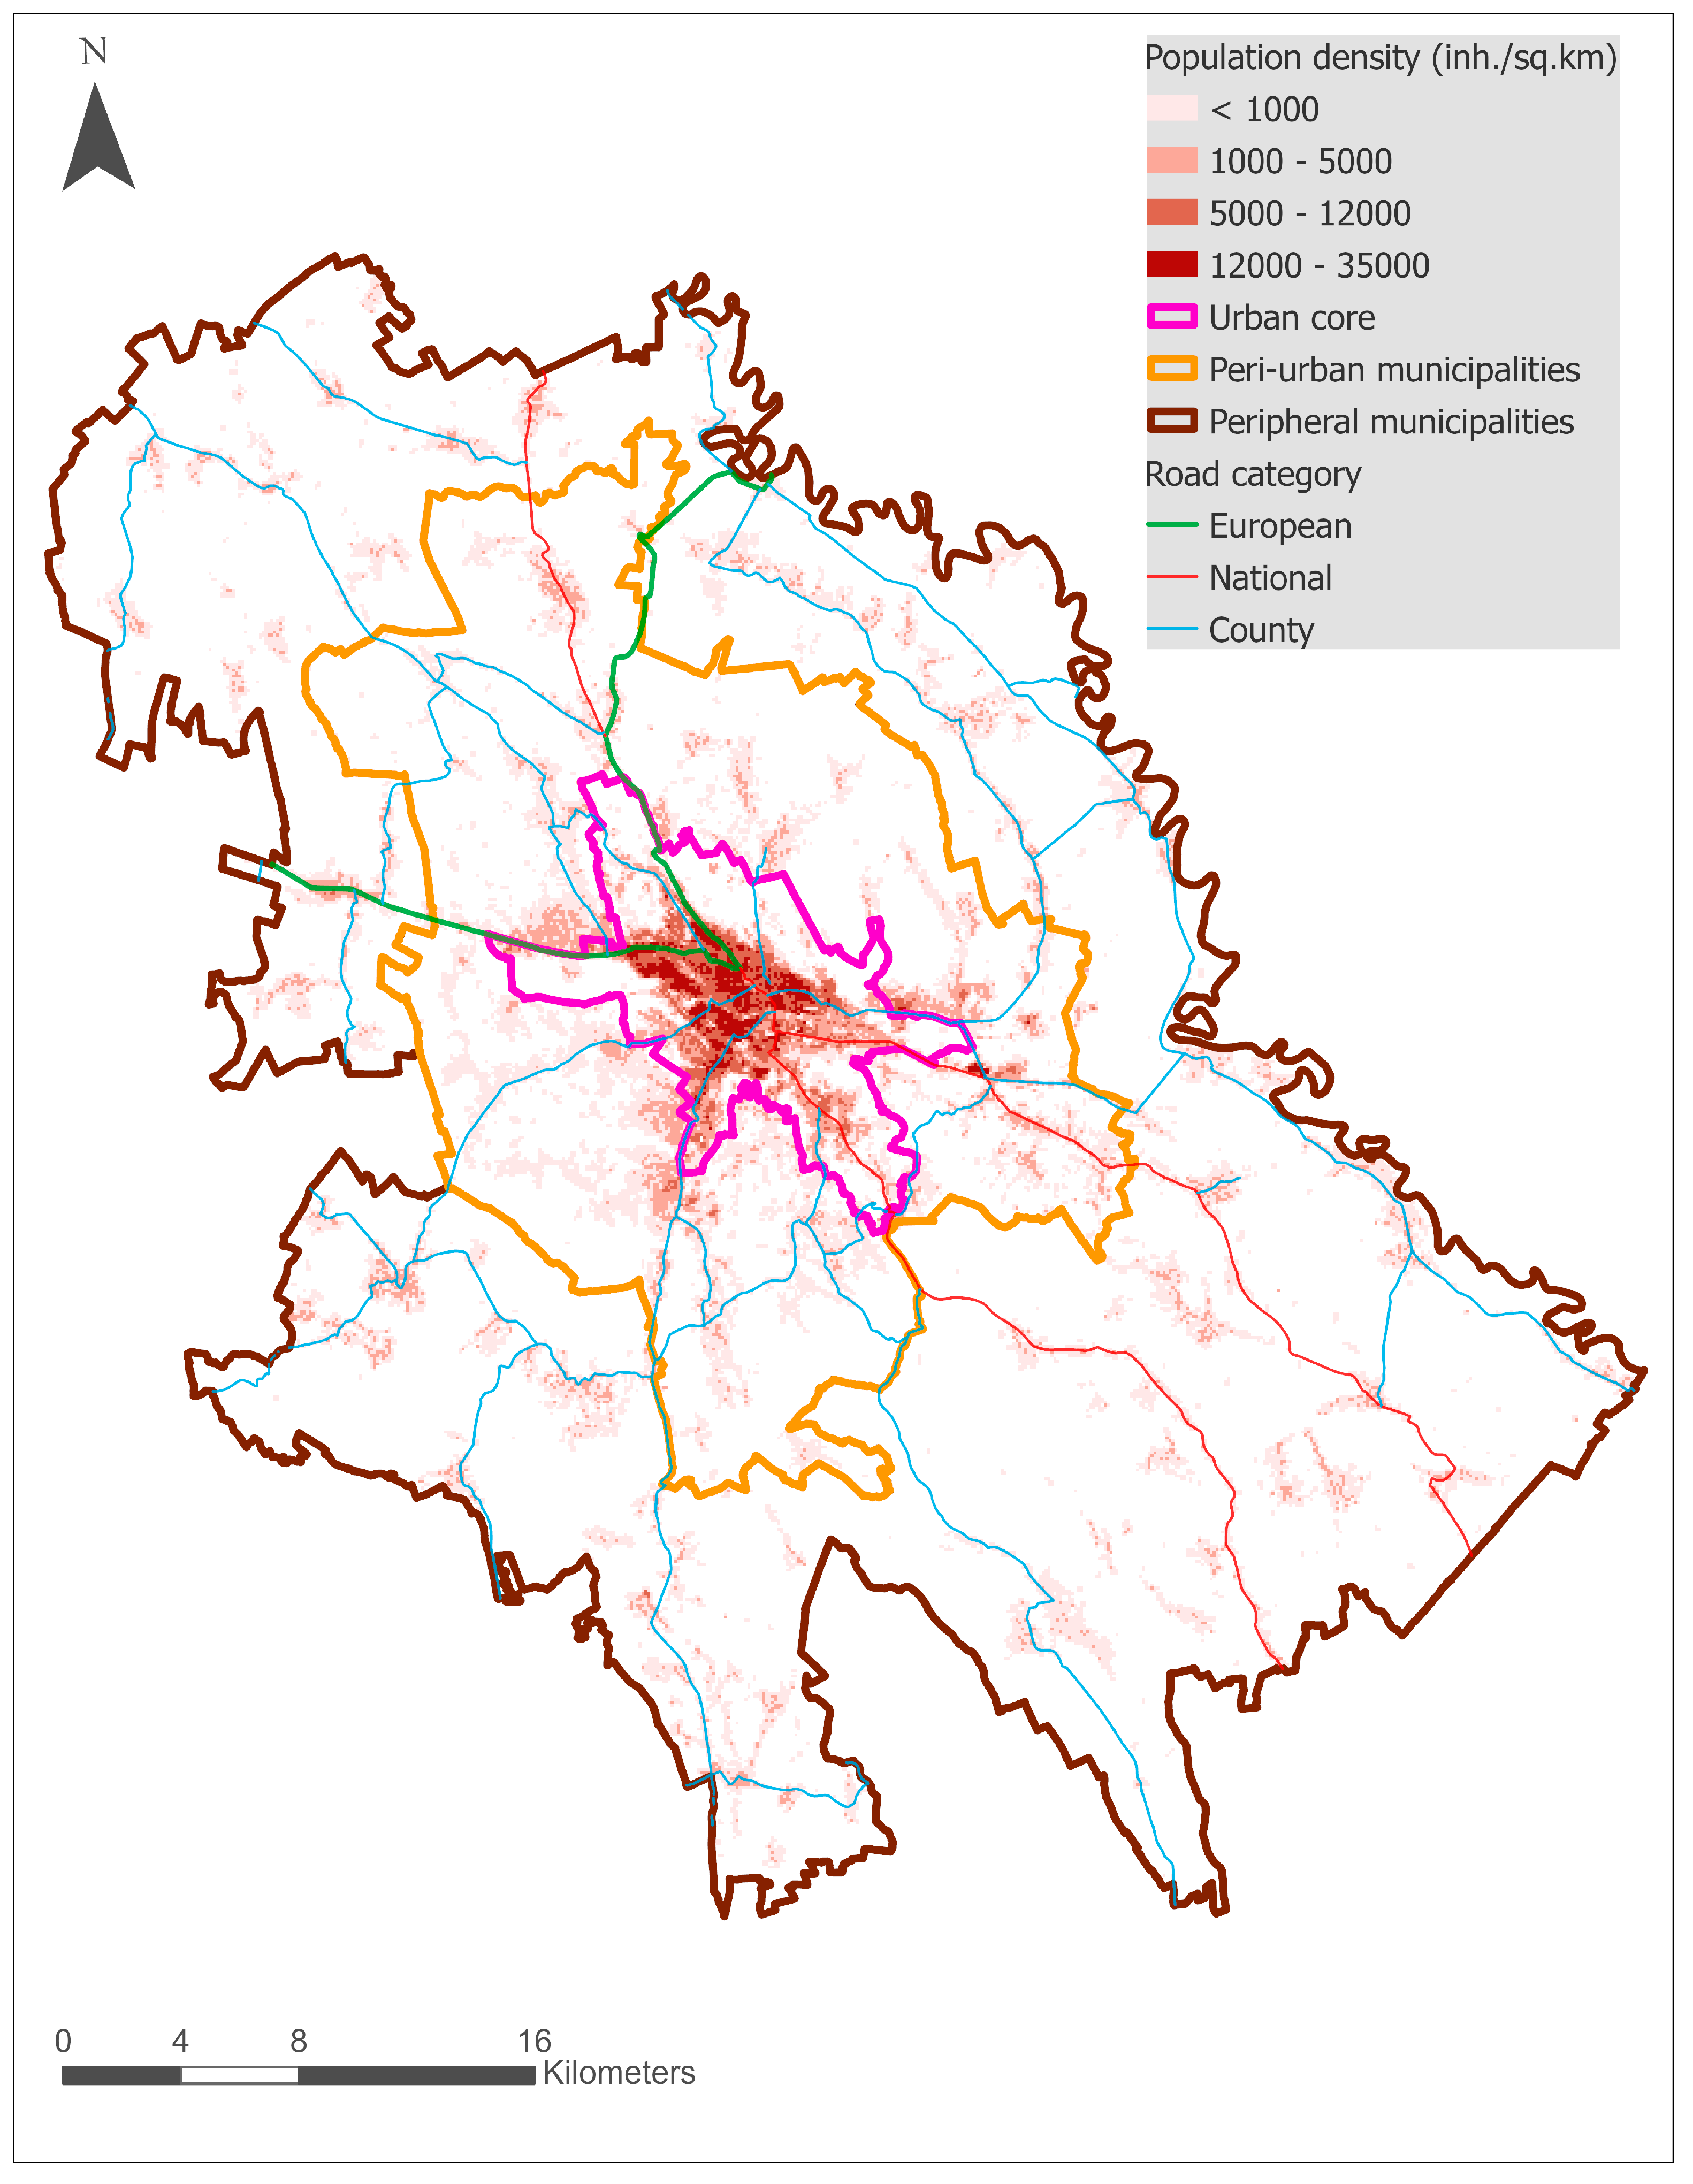
This figure presents the high concentration of services in the urban core and along major transit corridors. In contrast, outer areas remain largely underserved, reinforcing spatial segregation. Dense central clusters align with commercial and administrative hubs, whereas scattered peripheral clusters indicate localised reliance on services. However, service accessibility must be considered in relation to where people live and the areas those services are intended to serve. As shown in Figure 5, population density is a key determinant of urban facility locations. In areas with few residents, providing certain services may be economically infeasible.
This population density map highlights why services are disproportionately located in central zones: higher population density makes service provision economically viable. The limited population density in peripheral areas correlates with service inaccessibility, which intensifies mobility dependence and vulnerability. High-density zones correspond to urban cores, while peripheral areas show lower densities, each with distinct strengths and vulnerabilities:
  • Peripheral areas: lower density, higher environmental quality, but poor service access.
  • Urban cores: greater access to services and employment, but often experience stress, congestion, and pollution.
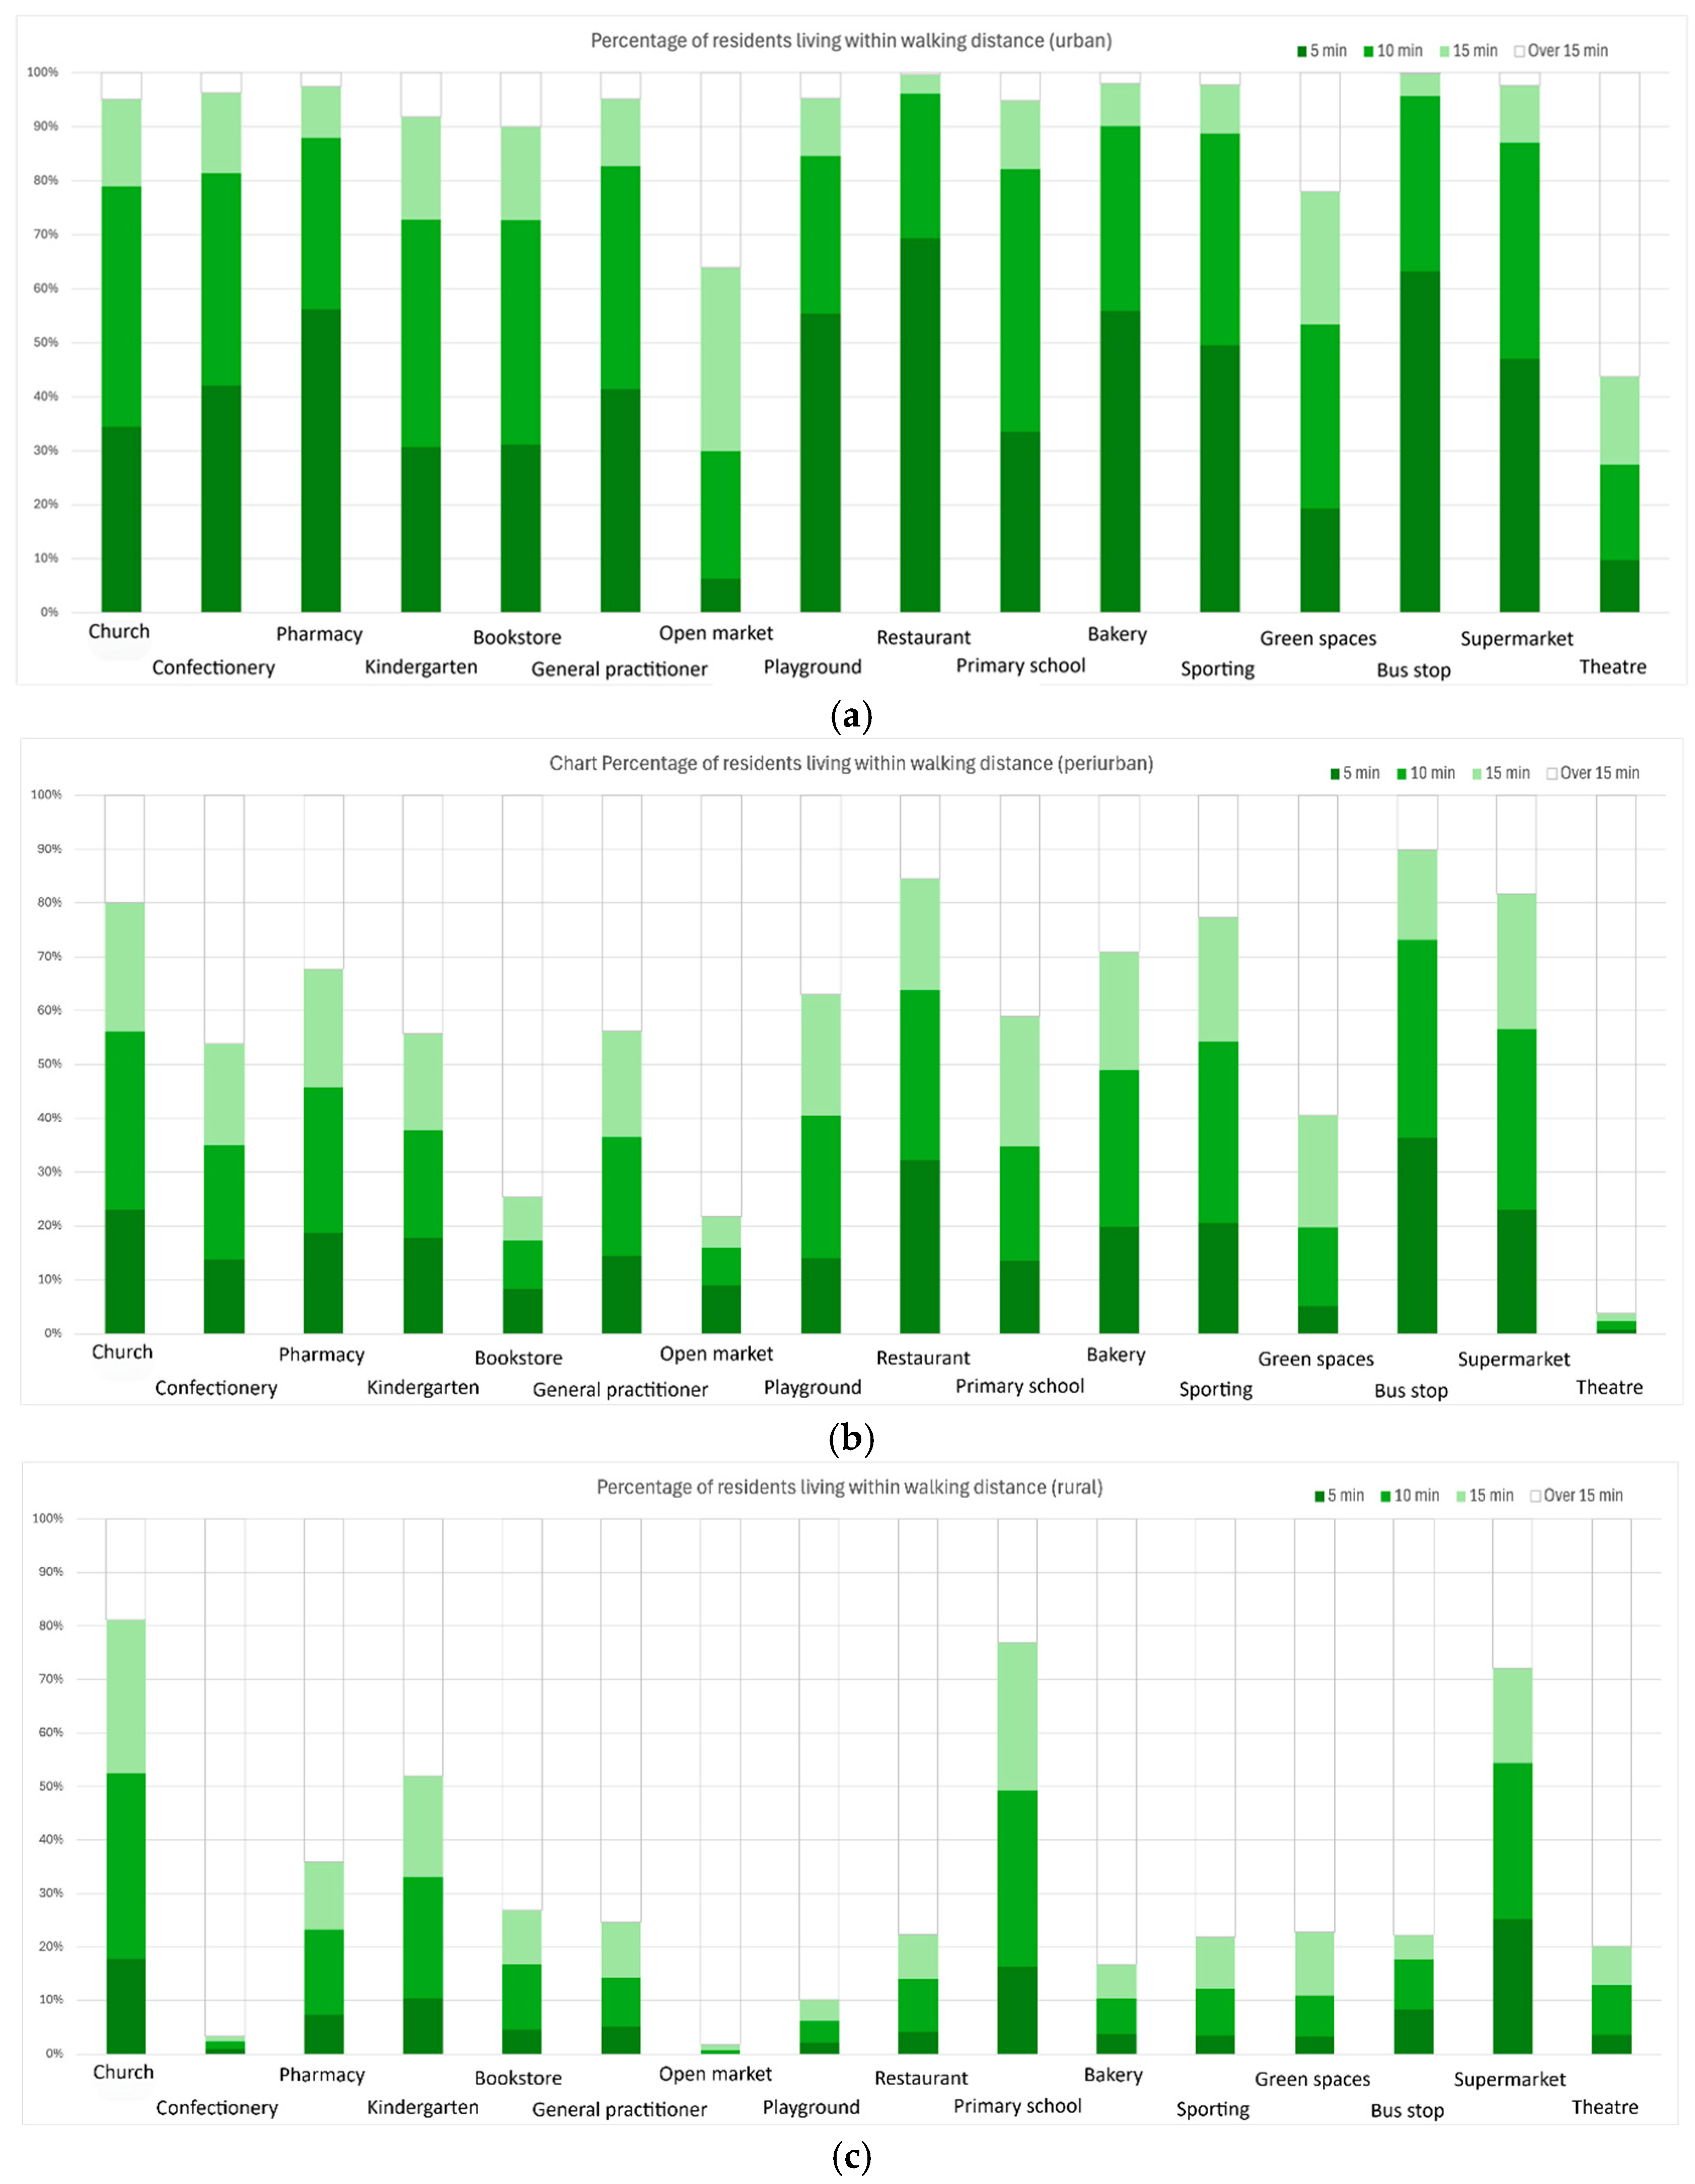
Figure 6a–c illustrate intra-urban accessibility by walking distance (5, 10, and 15 min), showing sharp contrasts among urban, peri-urban, and rural zones.
The comparative maps show how proximity accessibility declines outward from the centre. Core areas benefit from widespread 5–10-minute access, while peripheral LAUs fall beyond 15-minute thresholds. This confirms that the 15-minC ideal is more applicable to the urban core. The results show significant inequalities in walking access. Urban zones offer the best conditions, with most residents within a 5- to 10-minute range of essential services. Peri-urban areas exhibit uneven access, while rural communities are consistently underserved, often located more than 15 min away from basic services. This confirms an urban-to-rural pattern in service access, highlighting the need for context-specific planning interventions that extend beyond urban densification. The Proxilience framework is applied directly here to measure both physical access (proximity) and exclusion (vulnerability), extending beyond basic accessibility indicators to examine multiple dimensions of service access.
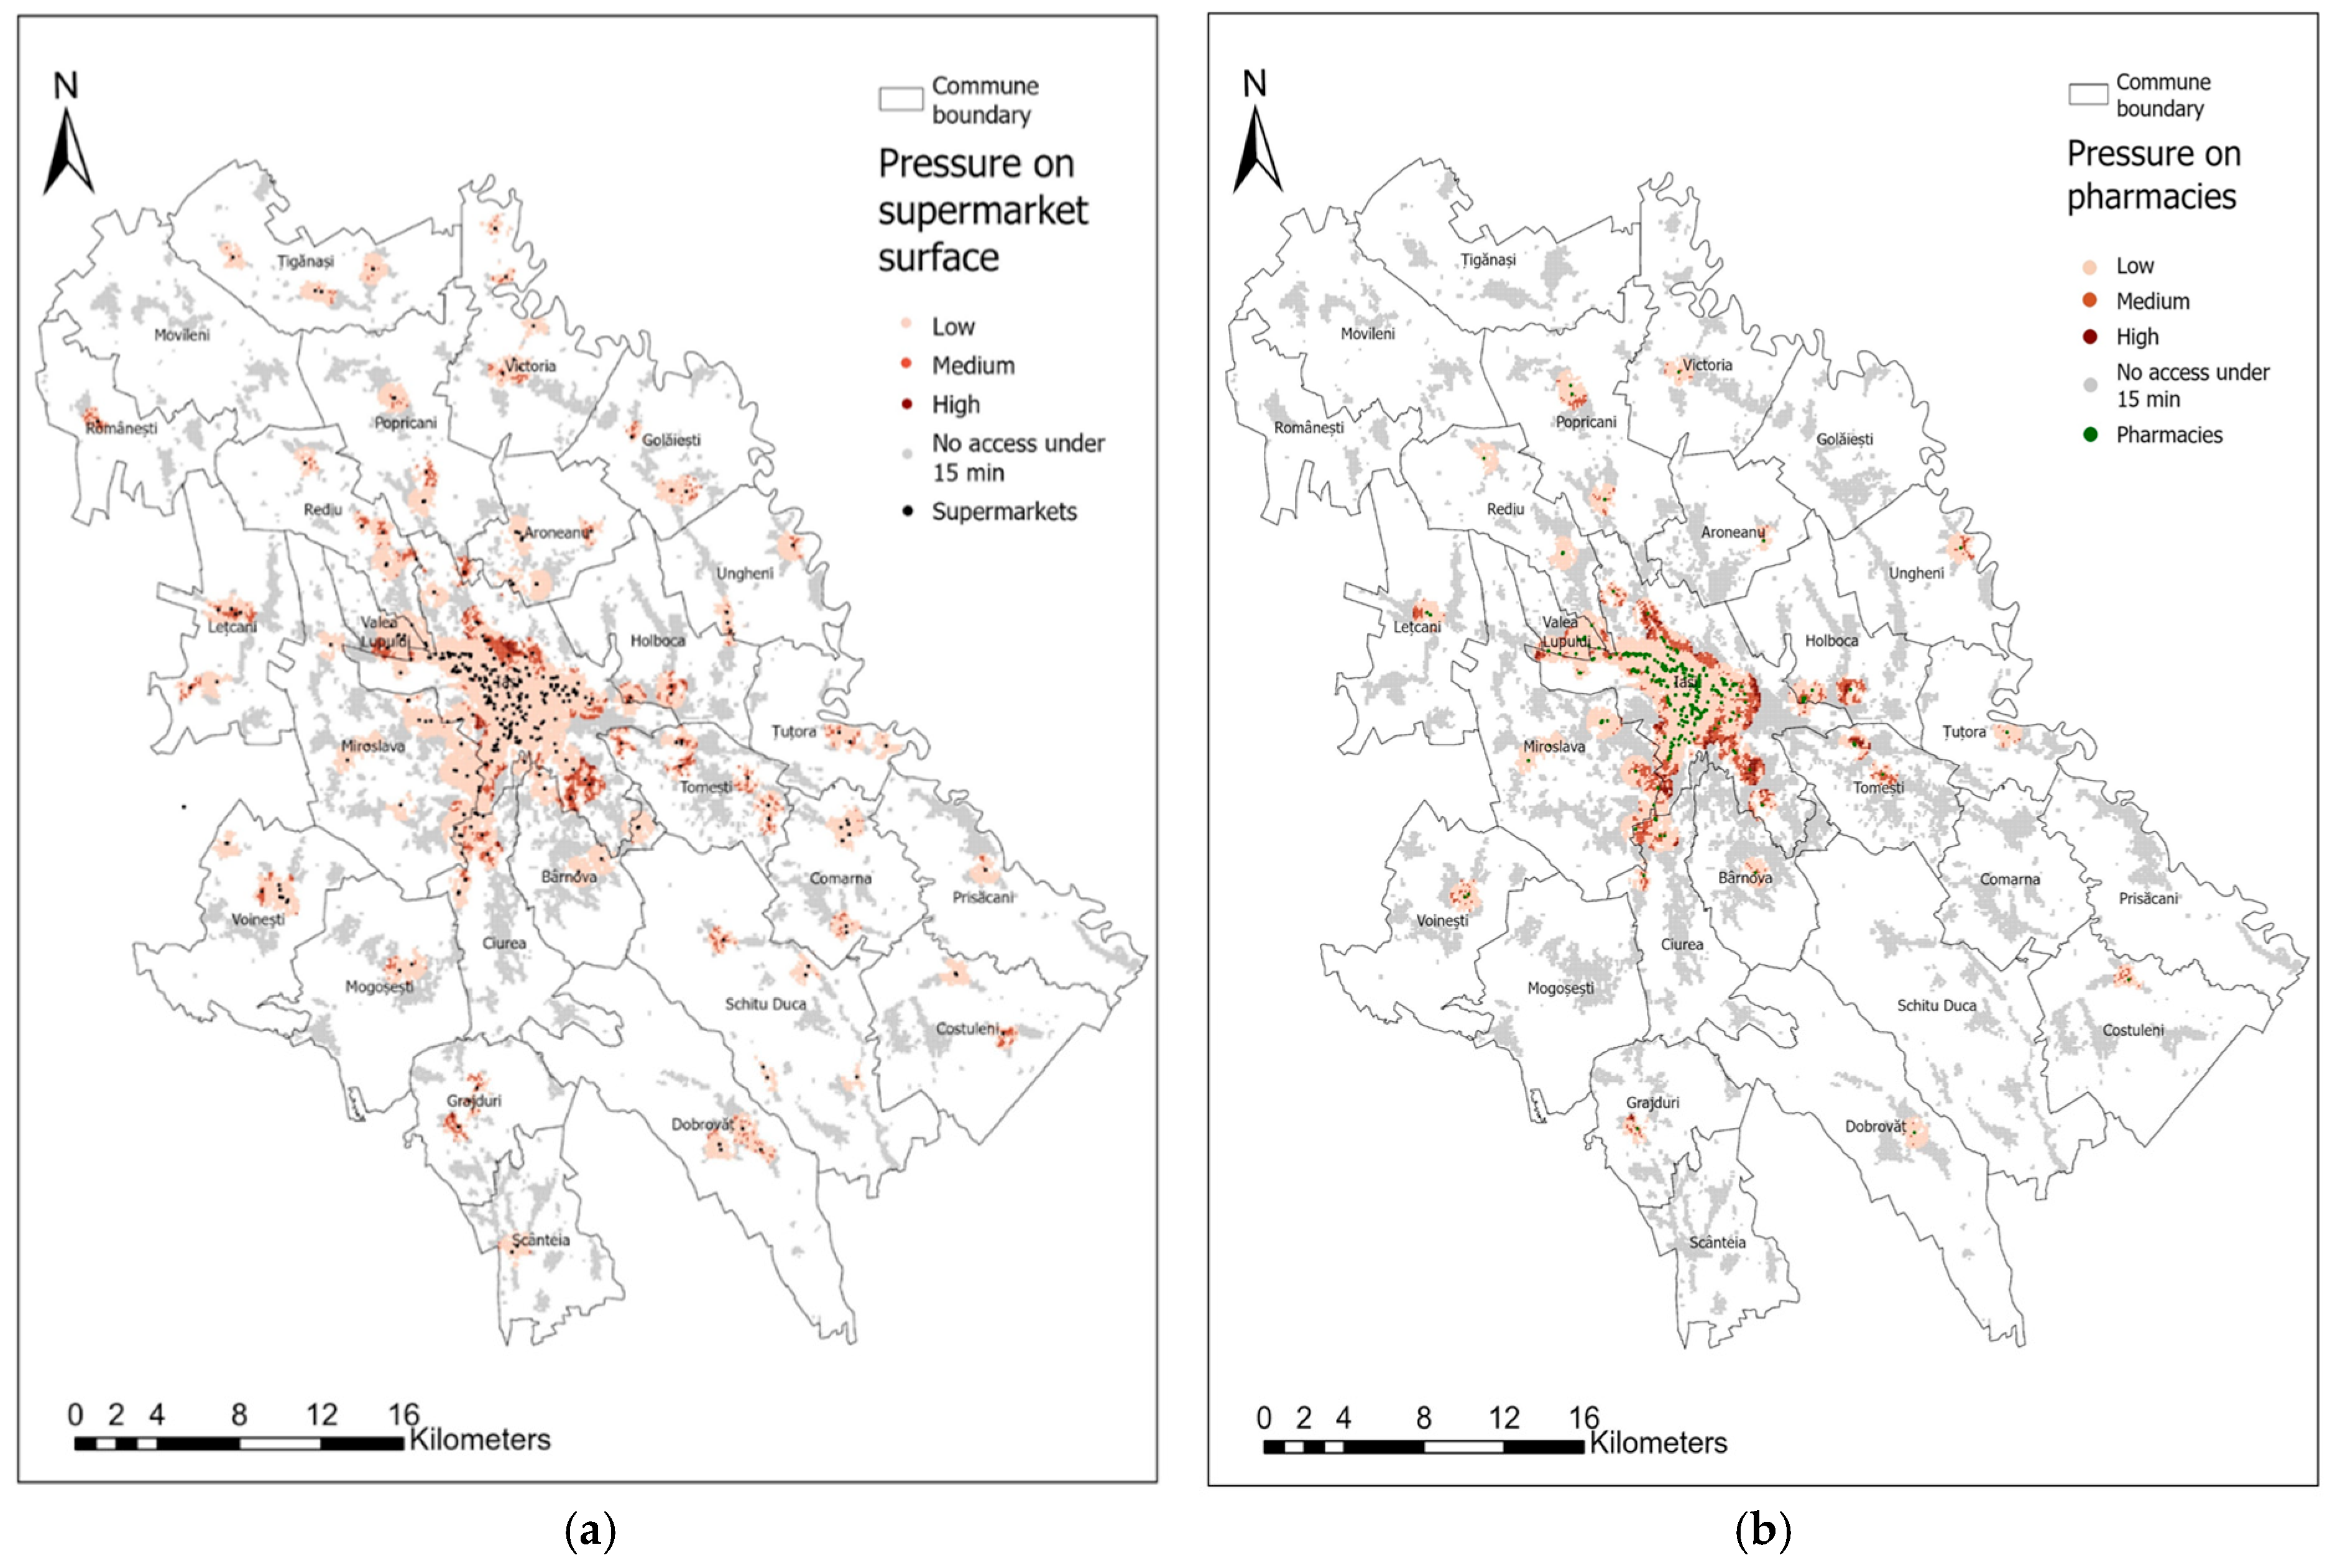
Assuming proximity is key to the 15-minute neighbourhood model, service access serves as a proxy for pressure on local amenities. A gravity model was employed to investigate the interaction between population density and service accessibility, specifically examining the presence of supermarkets and pharmacies within a 15-minute walking radius.
As shown in Figure 7, the IMA shows a heterogeneous pattern in pressure on supermarket and pharmacy access.
The pressure maps highlight areas where services are either over-utilised or insufficient. Supermarkets experience high demand in peri-urban residential areas, indicating that population growth has outpaced the development of retail infrastructure. Pharmacy access, on the other hand, shows critical gaps in rural LAUs, indicating significant barriers to basic healthcare. These spatial trends reflect both long-term patterns shaped by historical urban development and the effects of recent expansion. Central areas and the high-density neighbourhoods (such as Alexandru cel Bun, Cantemir, and Tătărași, located, respectively, to the west, south, and northeast of the historical centre) developed during the communist era maintain relatively balanced service-to-population ratios. In contrast, newer residential districts, such as Bucium and Valea Lupului, shaped by contemporary urban sprawl, often lack adequate amenities. Gaps also persist in large, underutilized industrial zones and in the expanding urban peripheries. Outside the urban core, supermarkets become increasingly scarce. In villages with a history of local centrality, such as Lețcani and Tomești, population growth has intensified pressure on already limited services. Other peripheral communes, like Movileni and Prisăcani, remain severely underserved. Figure 7b illustrates the distribution of pharmacies, showing a clustered pattern concentrated around the city and secondary socioeconomic centres. While pharmacy locations generally follow population density, significant disparities persist, ranging from dense concentrations in urban cores to entire communes without a single facility. In some rural areas, even essential medical services, such as those provided by general practitioners, are inconsistently available.
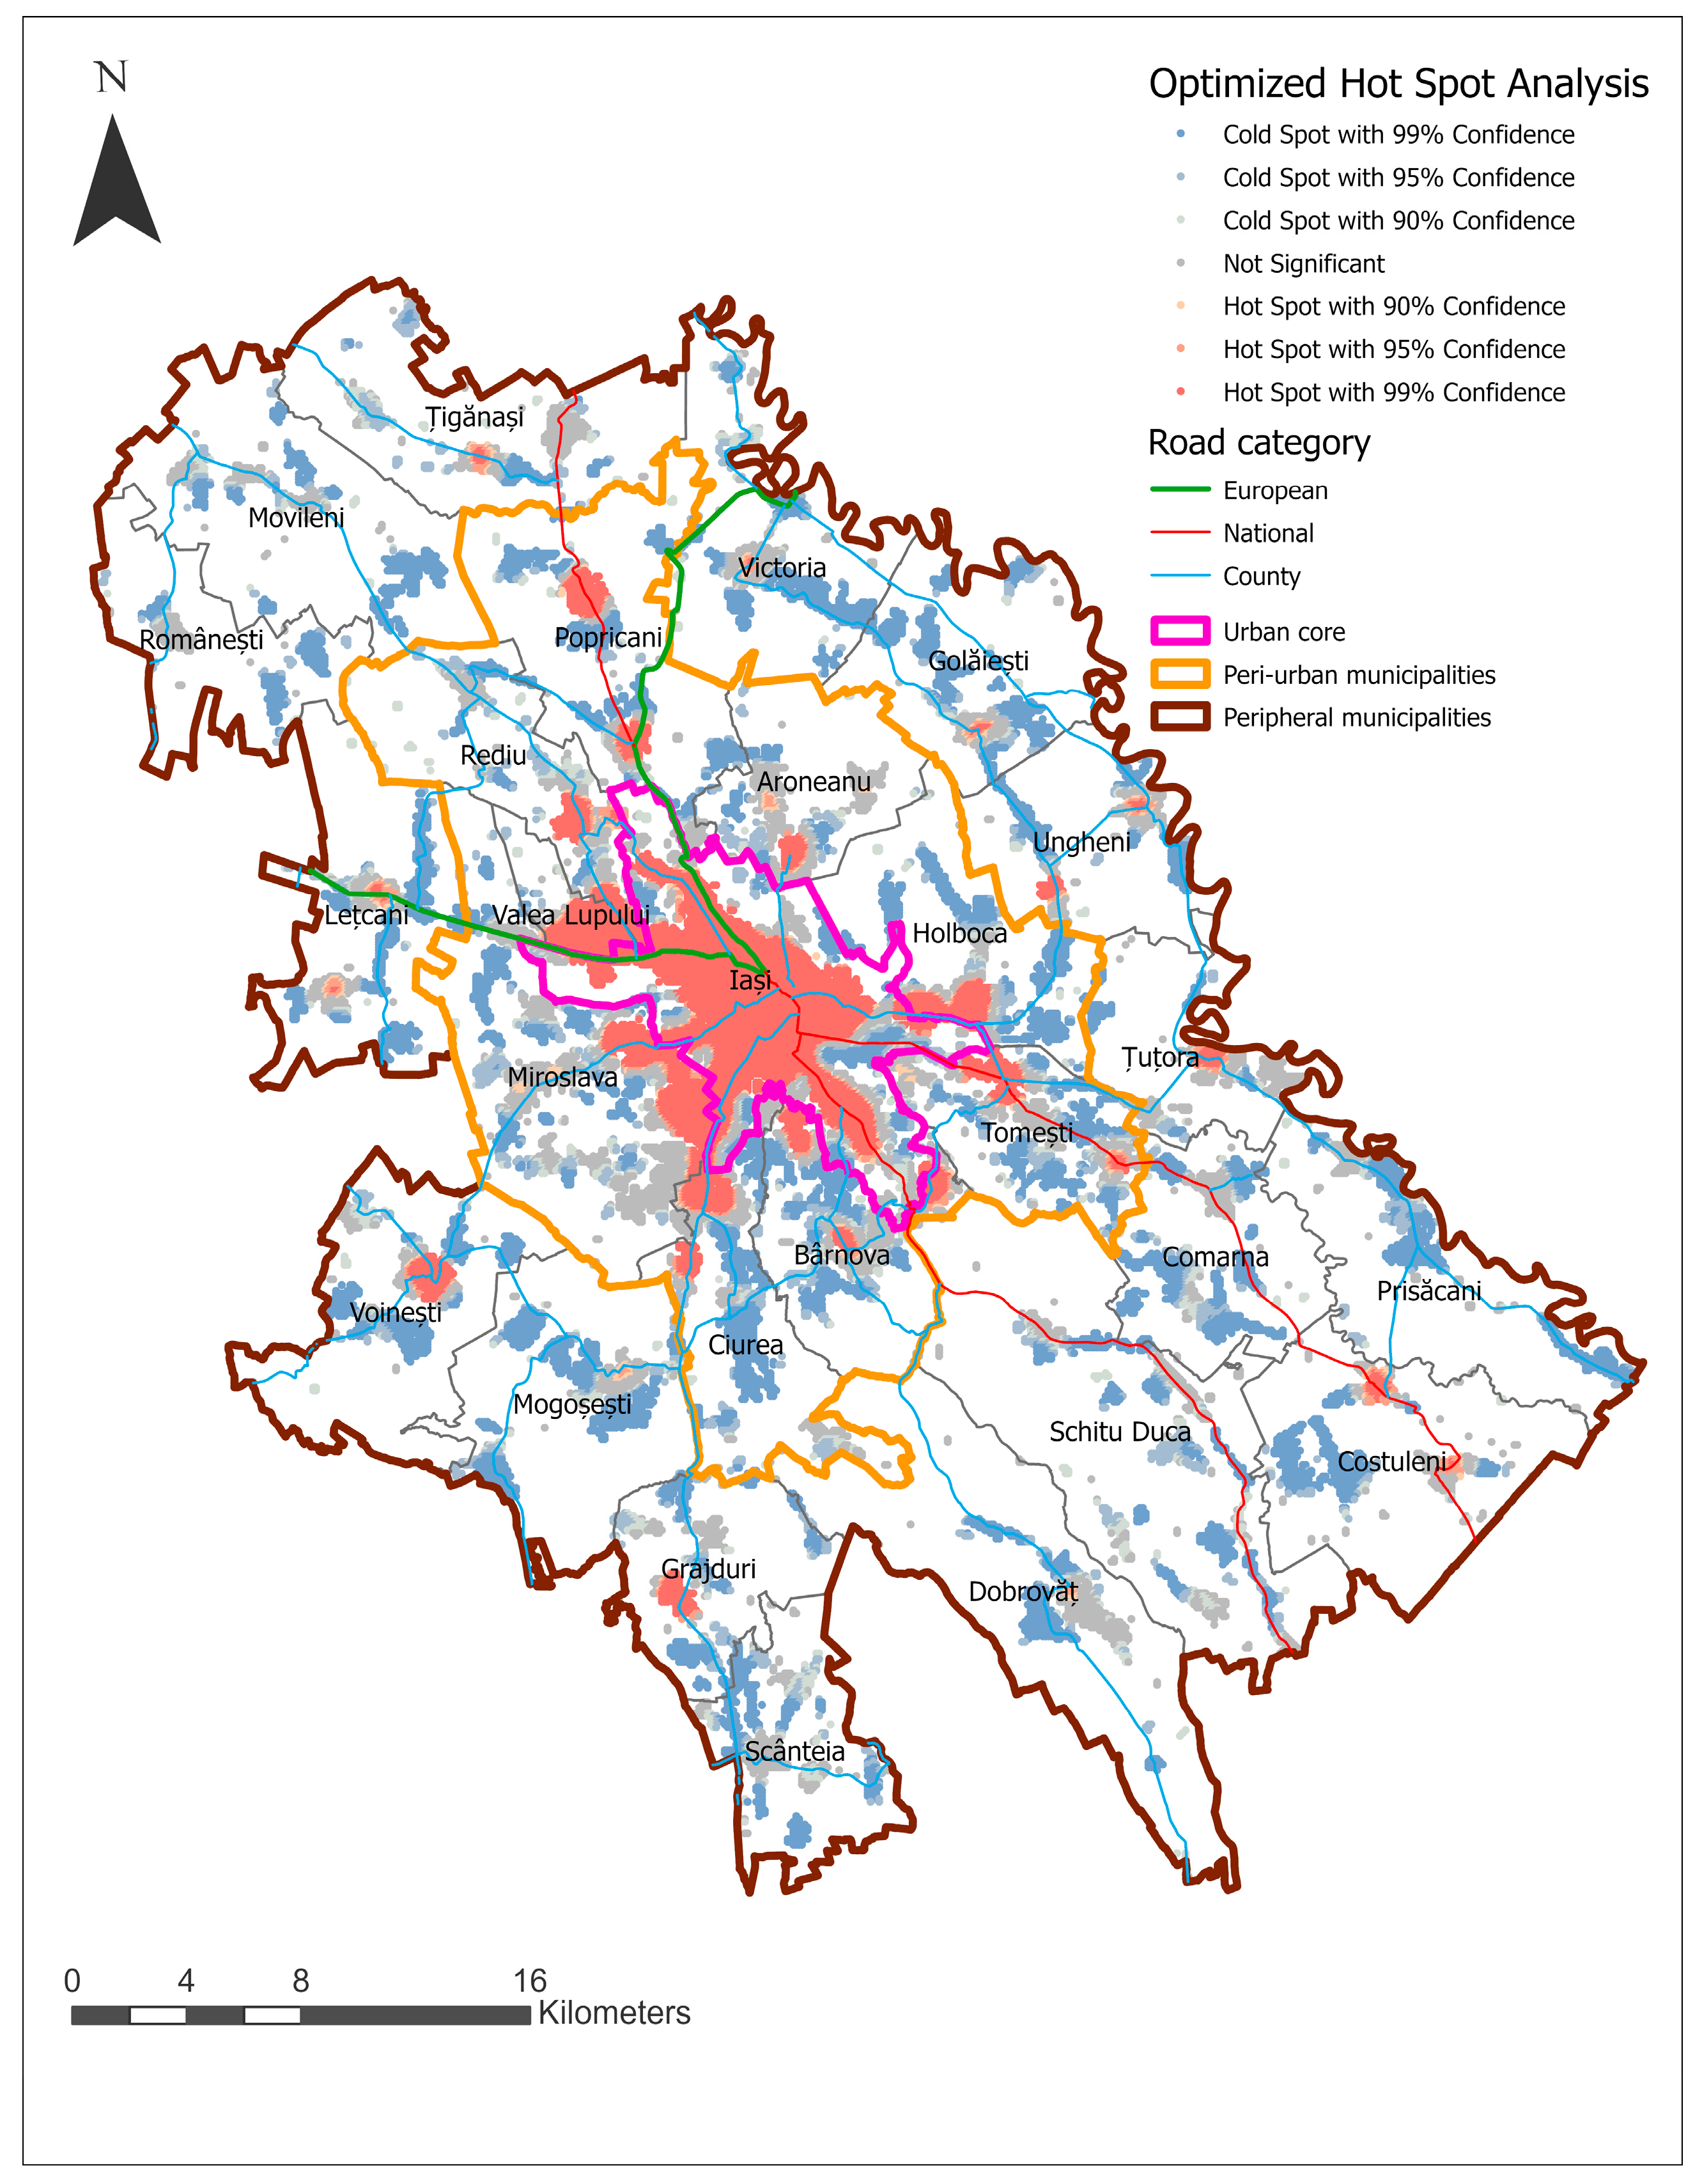
Figure 8 maps gravitational hot and cold spots of access. Cold spots, concentrated mainly in southern and eastern LAUs, are ‘urban blind zones’: isolated, underserved, and excluded areas. These zones lack safety and social services, despite recent residential growth. In contrast, hotspot analysis identifies areas of high accessibility gravitation, particularly in central Iași and communes along major road corridors. Persistent cold spots in the peripheral east and south visually confirm service marginalisation and spatial exclusion. These areas emerge as clear priorities for infrastructure investment, as they remain deprived of essential services despite ongoing population growth.
The results reinforce the gravitational accessibility model, identifying critical tipping points where proximity gaps intersect with structural vulnerabilities. The interaction between limited-service clustering and unaddressed needs intensifies fragmentation and territorial inequality. Hot- and cold-spot mapping (Figure 8), in correlation with population pressure on different services (Figure 7), directly contributes to operationalising the Gravitational Model and provides empirical confirmation of proximity–vulnerability convergence zones.
The pressure on proximity services can be characterized by three distinct situations. Two relate to the negative pull exerted by certain areas within the core city or metropolitan region, relative to more balanced or resilient zones. The analysis identifies three spatial conditions:
-
Overburdened urban zones: High demand and concentrated services generate stress and excessive flows. Although services are available, they are often overcrowded or insufficient given population density, resulting in congestion, urban stress, pollution, and noise.
-
Underserved low-density areas: Weak demand continues to result in unmet basic needs and induced trips. These zones may have smaller populations but lack essential services nearby, prompting additional travel to the main urban centre for daily needs.
-
Balanced zones (‘Goldilocks effect’): Peri-central areas with adequate services and manageable pressure. This category typically includes residential neighbourhoods developed before 1989 and nearby newer areas, where investments have supported proximity-based access.
These three spatial archetypes underscore the need for proxilient (proximity + resilience) urban strategies tailored to the conditions of each typology.

5.2. The Hierarchy of Urban Needs Facilities and the Proximity Index

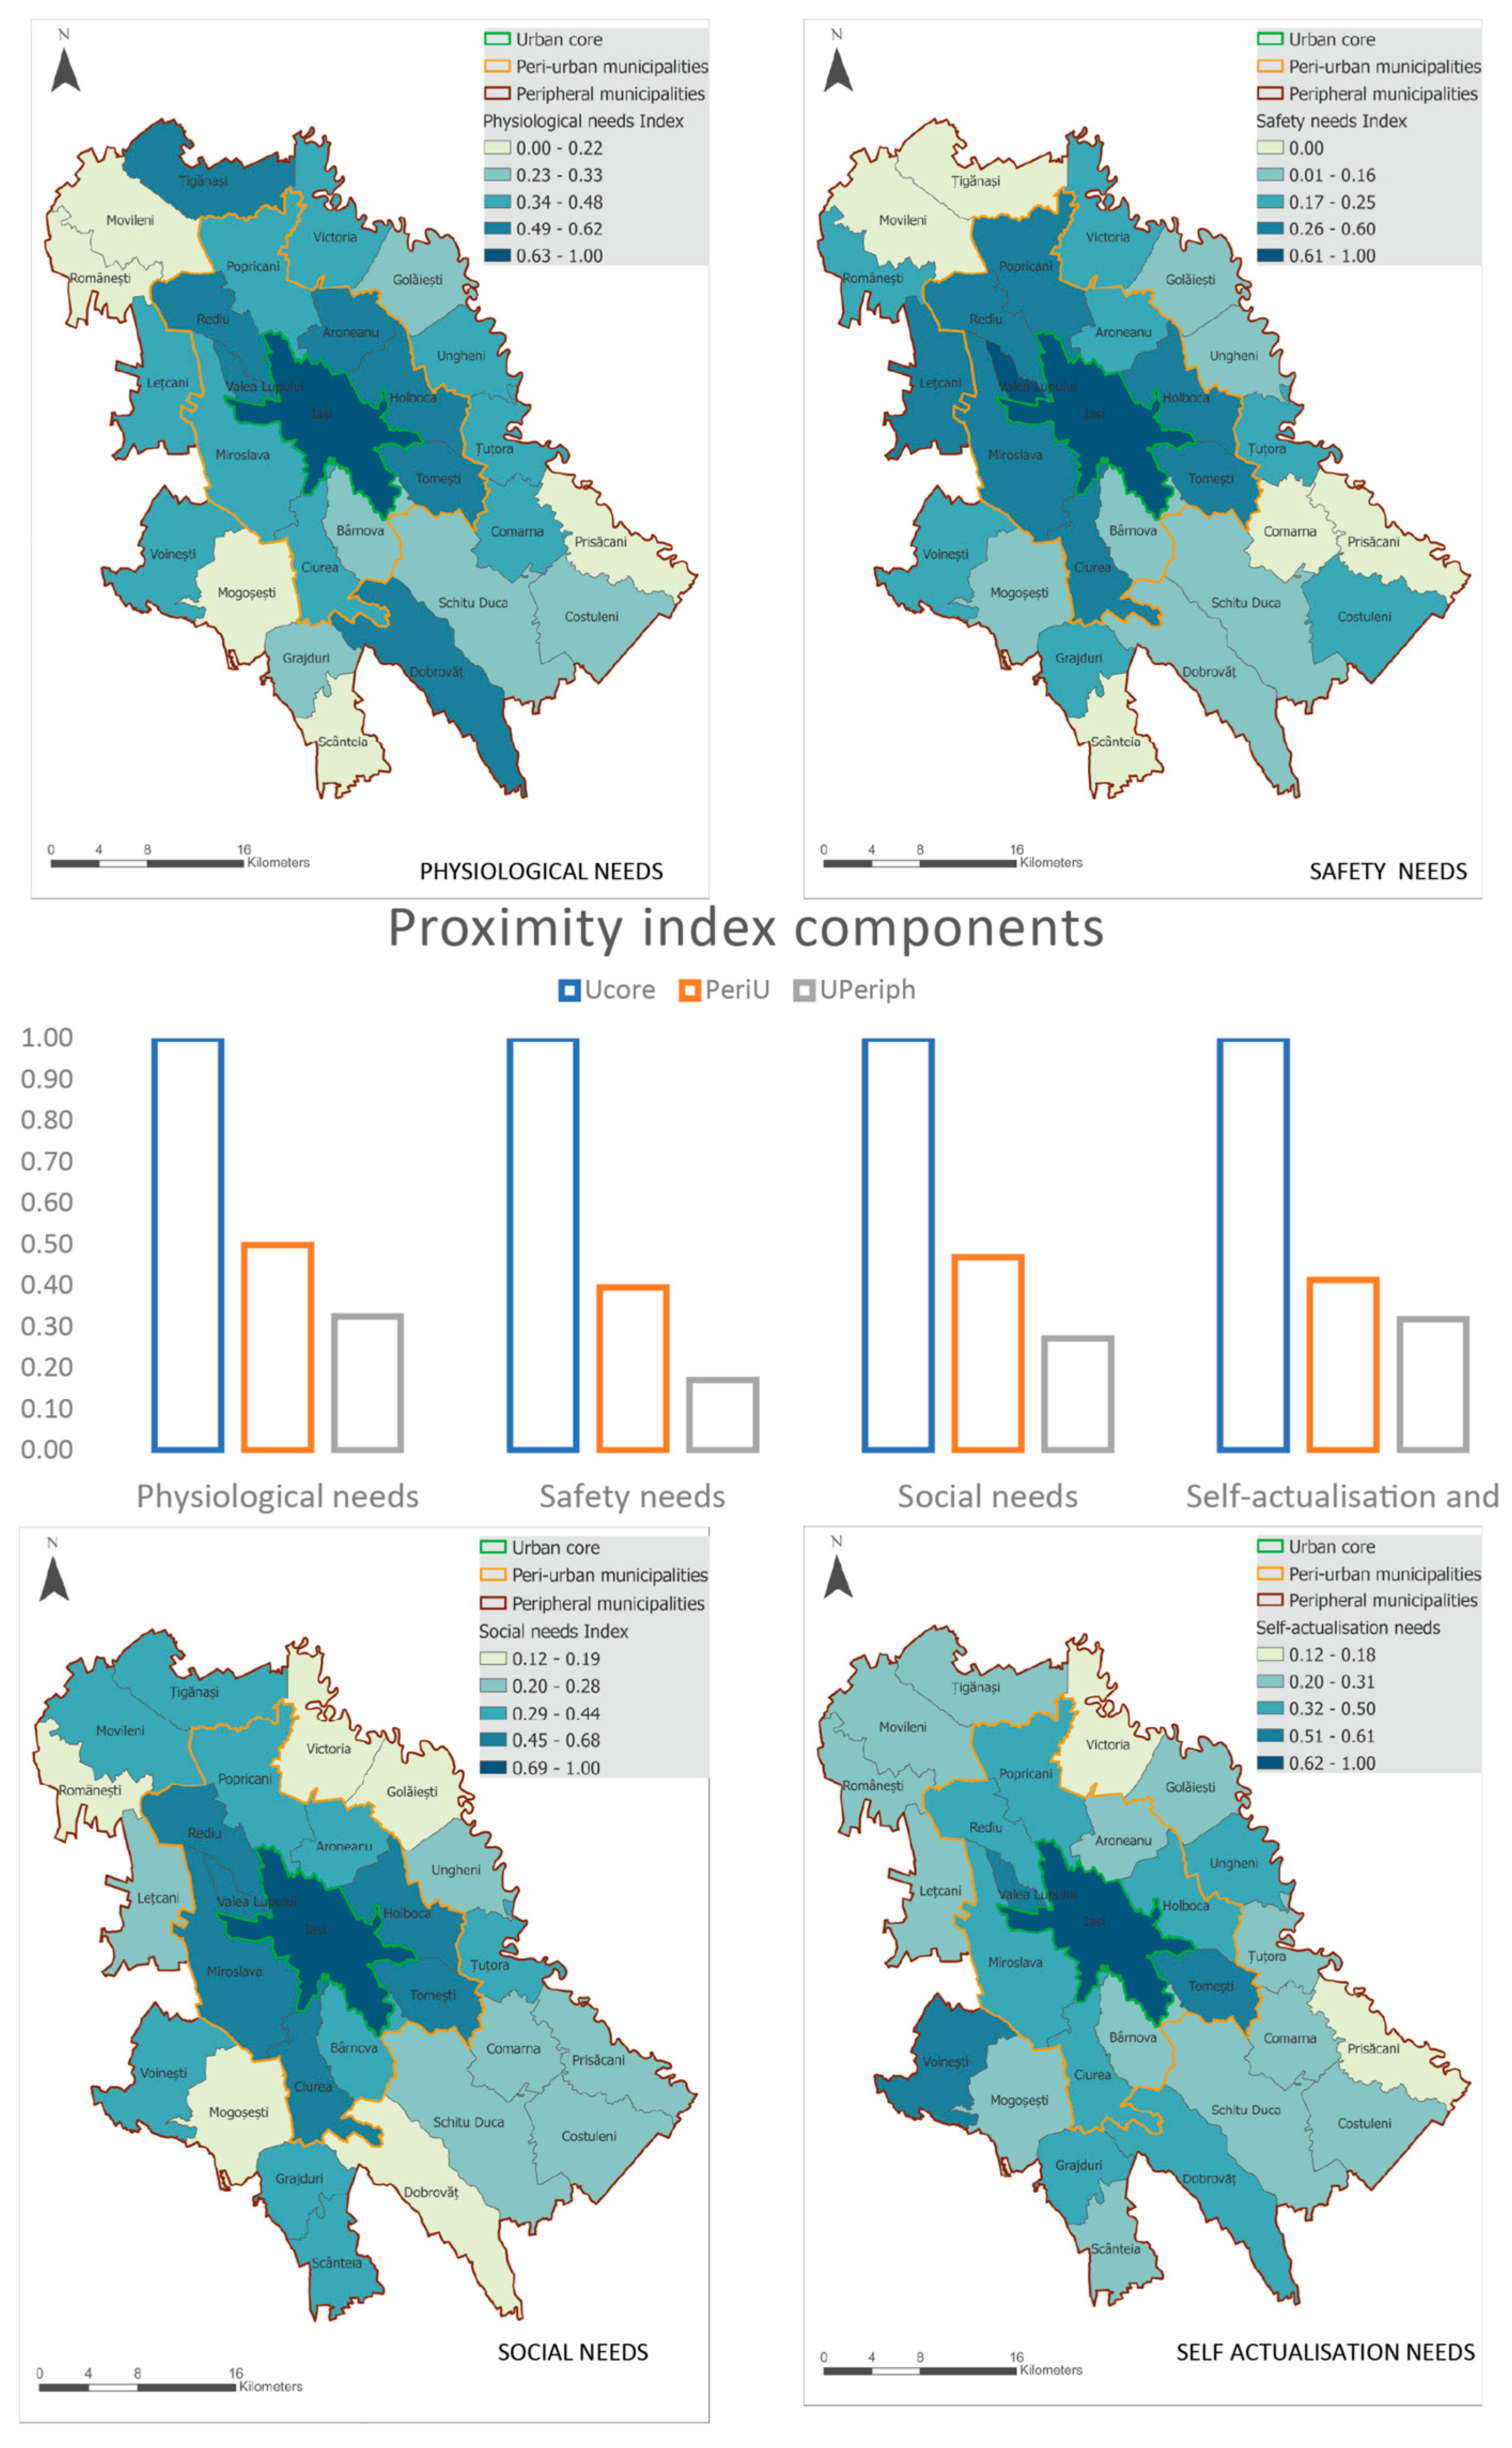
Most chrono-urbanism models primarily measure the physical presence of services, paying less attention to their quality or importance. This study ranks services based on Maslow’s hierarchy of needs, turning human needs (Maslow) into spatial analysis. Physiological needs, such as access to food and housing, score high in peri-urban areas, not just in the urban core. Peripheral areas show lower access, as some residents rely on self-provision. Health services (linked to safety needs) are less available in peri-urban areas and are very limited in peripheral areas due to long travel distances. Social, self-esteem, and self-actualisation needs are best met in urban cores and peri-urban areas, with peripheral areas, especially those located away from major roads, having limited access. These disparities confirm a pattern of stratified spatial dichotomy within the framework of a ‘Superbowl Economy’: urban cores increasingly meet multiple levels of need, while peripheral communes face ongoing challenges in addressing even their basic needs.
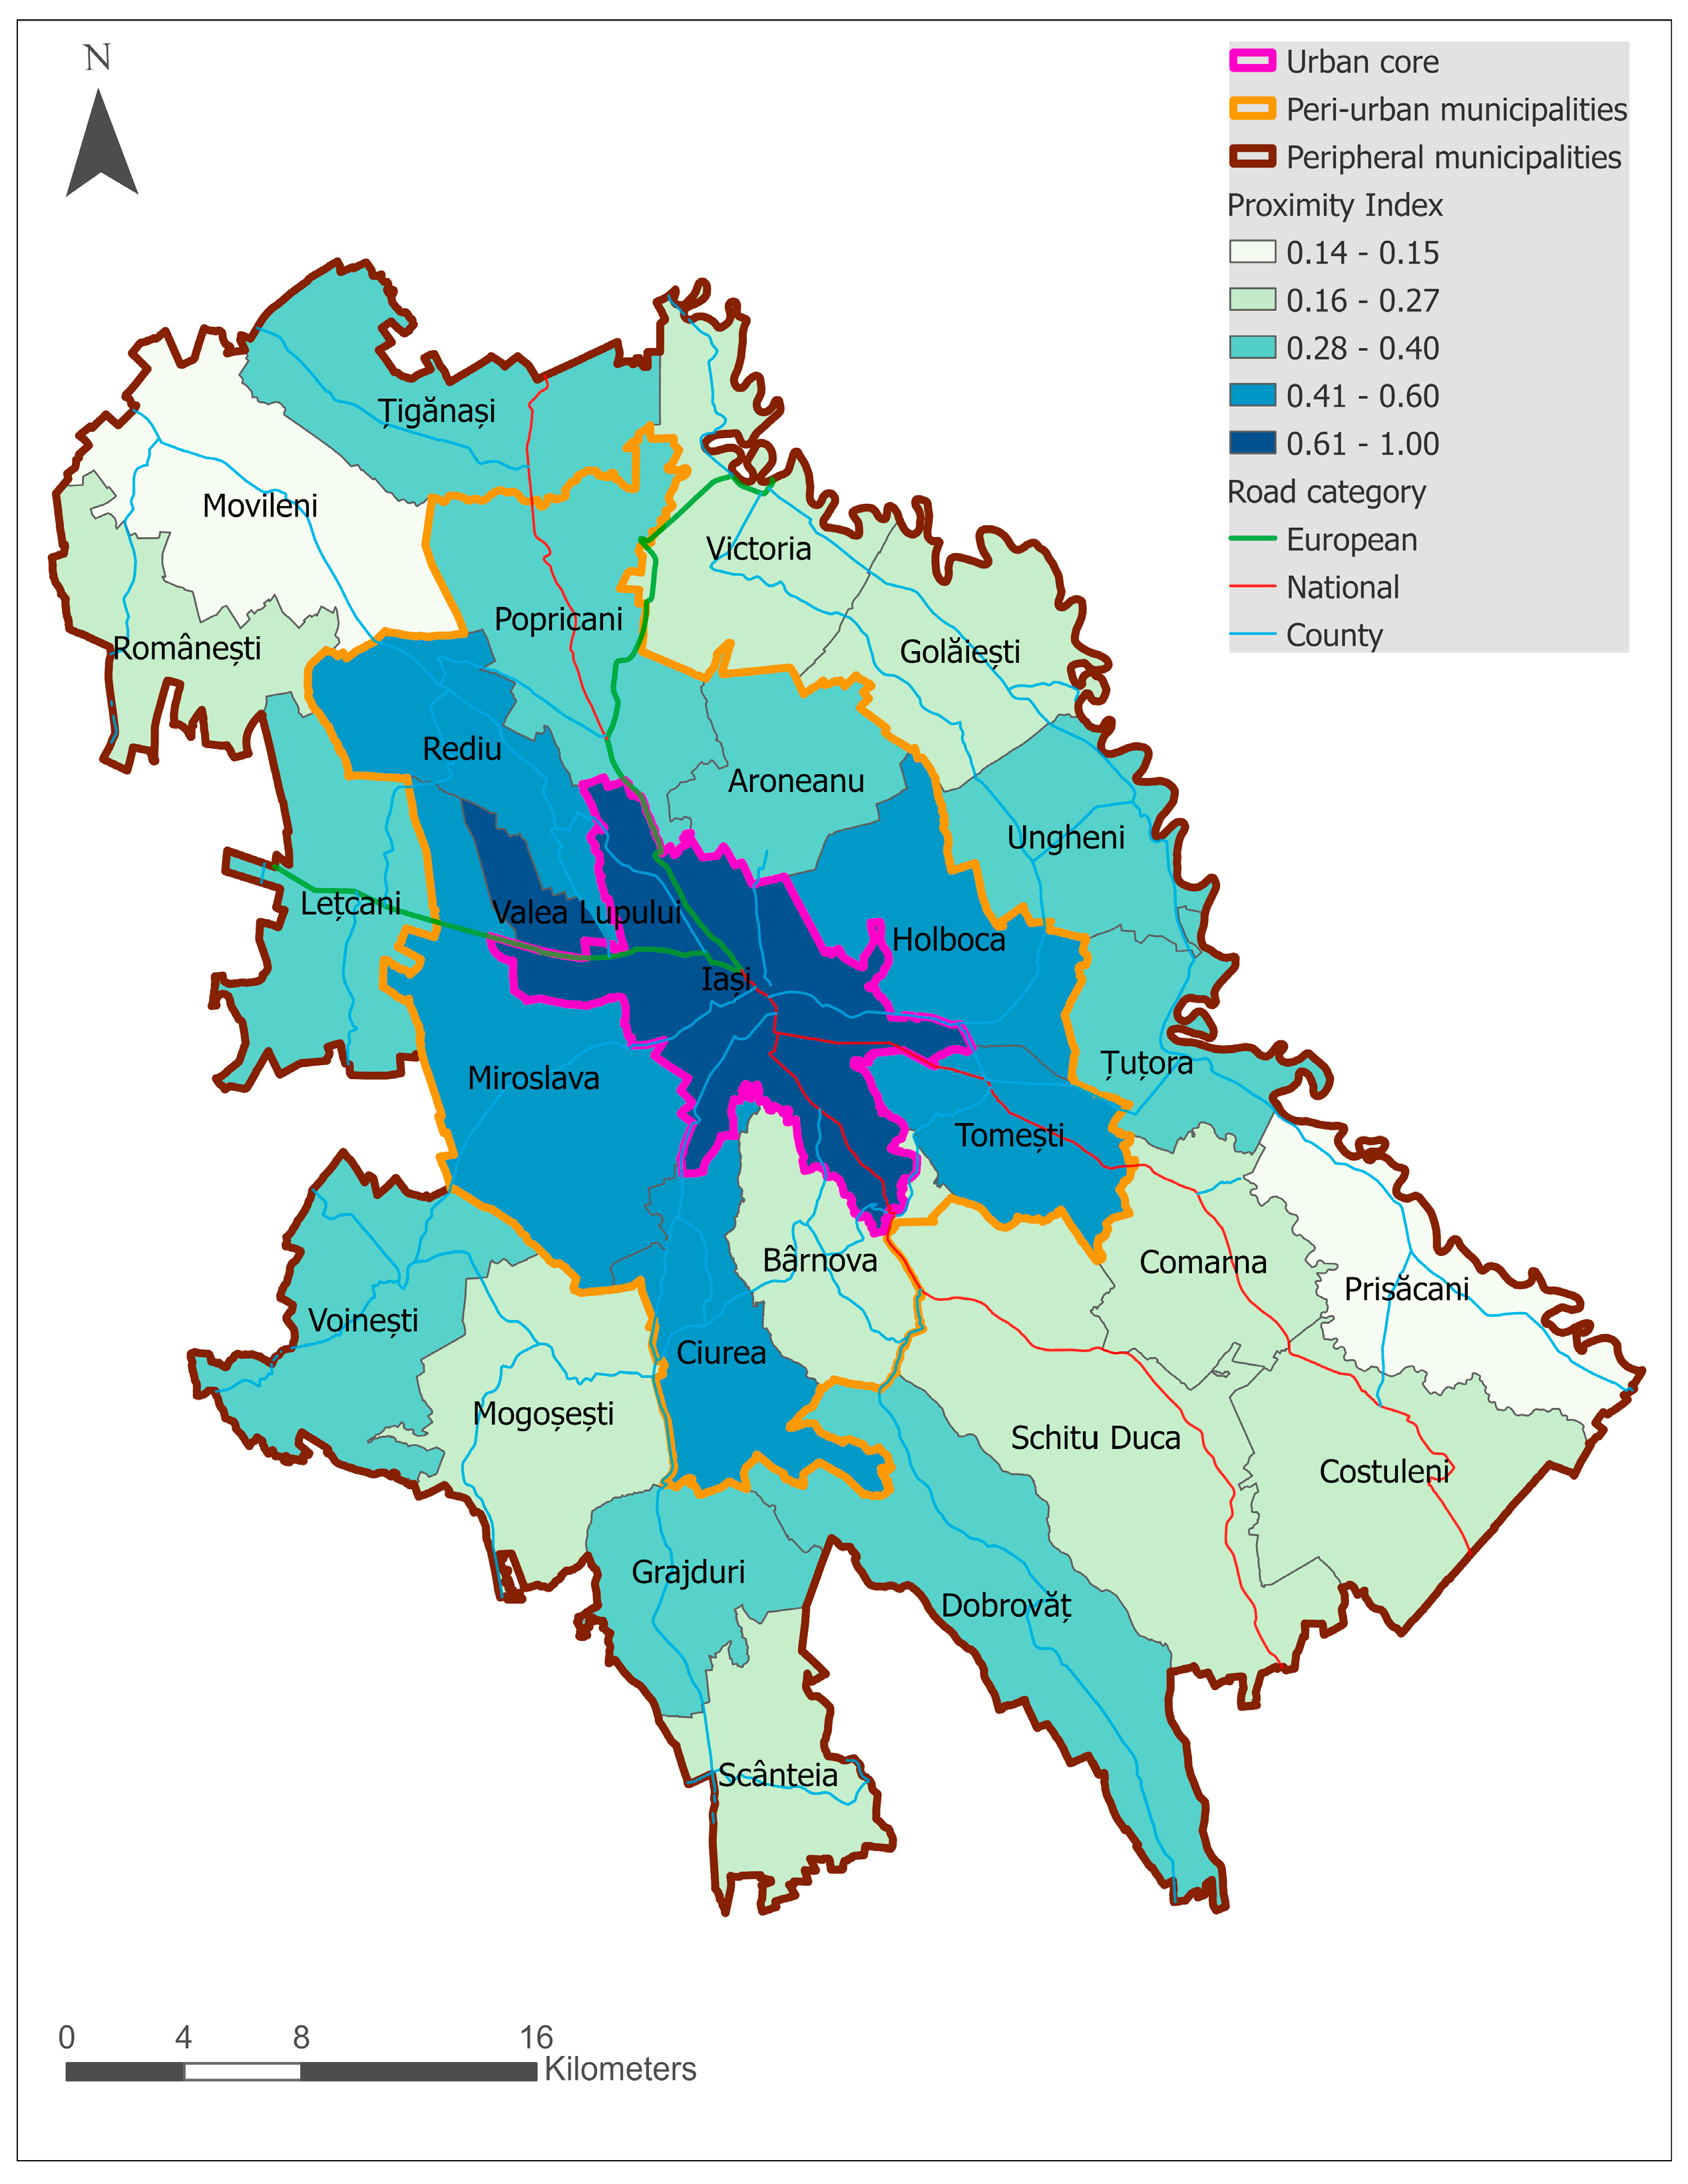
The Proximity Index, which combines access to all types of services, reflects a clear pattern: access is highest in the urban core, moderate in peri-urban areas, and lowest in peripheral zones. Physiological needs, such as food and housing, remain particularly high in peri-urban areas due to recent suburban growth.
Peripheral areas show lower access, as some residents rely on self-provision. Health services (linked to safety needs) are less available in peri-urban areas and even lower in peripheral areas due to long travel distances. Social, self-esteem, and self-actualisation needs are best met in urban cores and peri-urban areas, with peripheral areas, especially those located away from major roads, having limited access.
These findings reinforce the stratified spatial exclusion observed earlier: core zones can meet a wide range of needs, while peripheral LAUs continue to face challenges in securing even basic services. This imbalance reflects the layered inequalities of the ‘Superbowl Economy’.
Figure 9 illustrates the components of the Proximity Index and their average scores across urban core, peri-urban, and peripheral areas. The composite index mirrors the same urban-peri-urban-peripheral gradient seen in individual dimensions. A component-wise breakdown reveals significant disparities: peripheral areas consistently underperform across all categories, especially in social and esteem-related needs, indicating systemic exclusion. Peri-urban zones perform moderately, reflecting a transitional spatial condition. Integrating these dimensions into a single index of urban service accessibility demonstrates the same gradient observed in the separate dimensions.
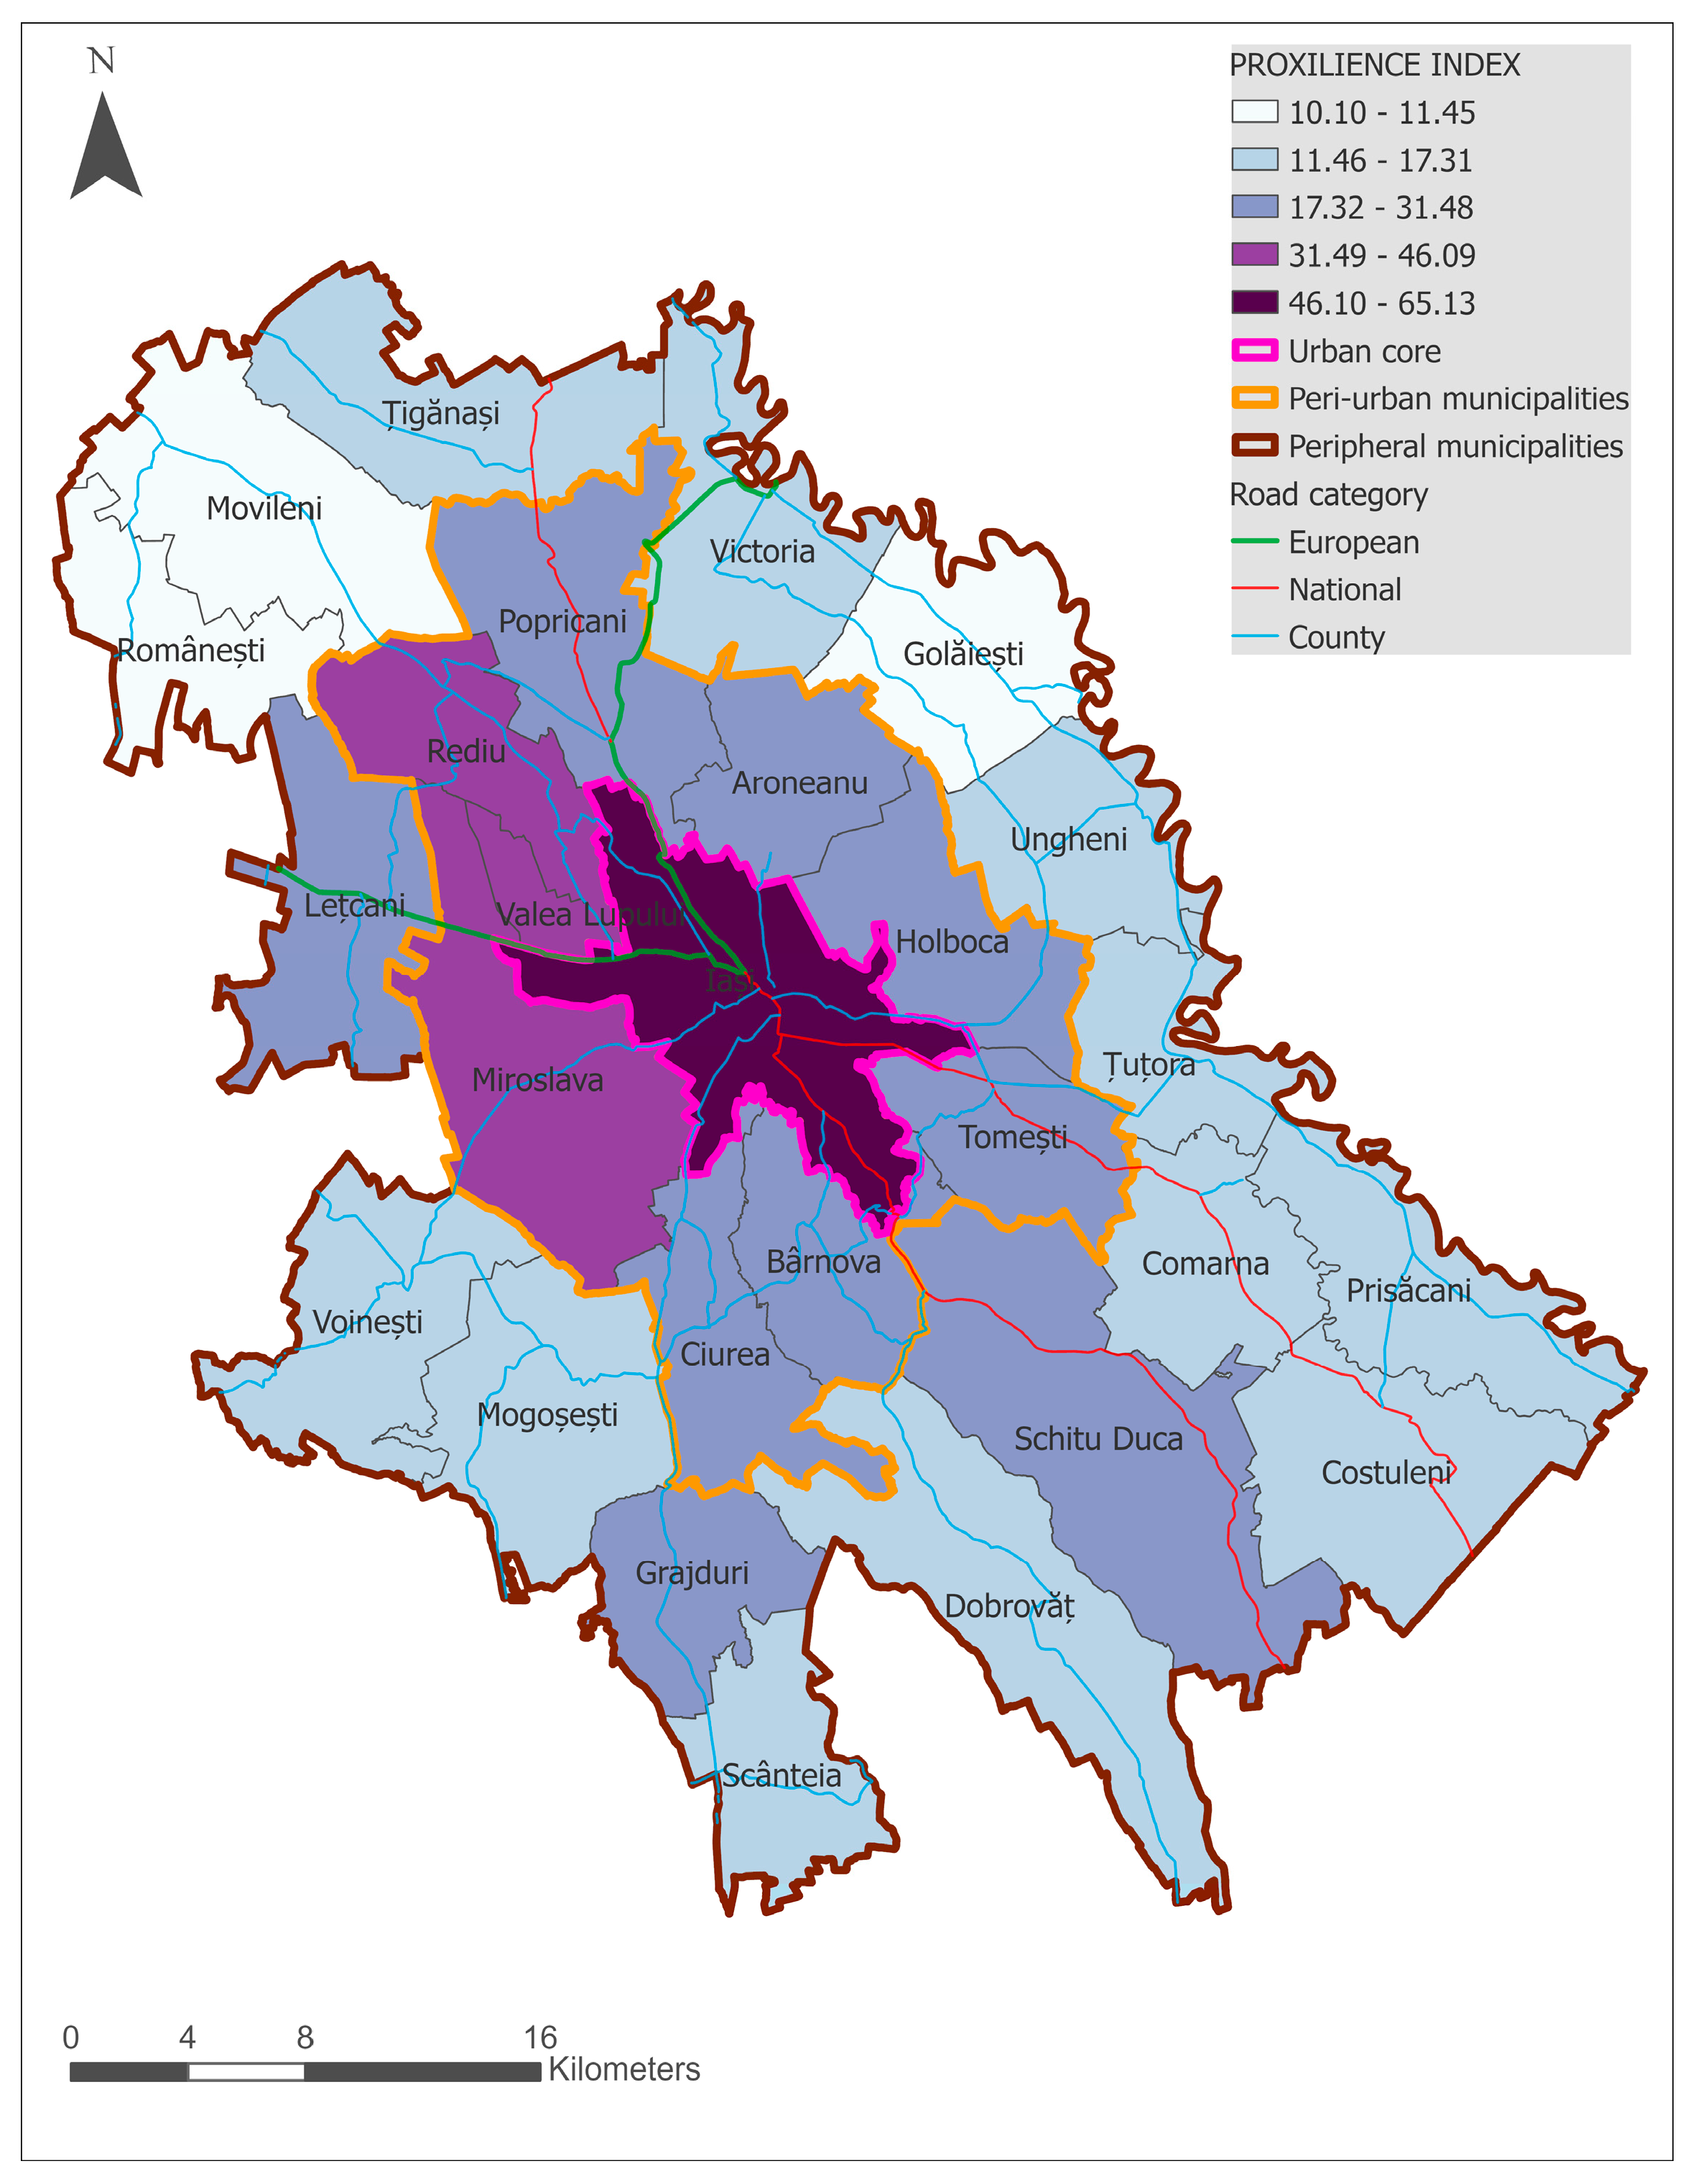
Figure 10 illustrates the Proximity Index results for the IMA, highlighting sharp disparities between rural peripheral communes and the urban core, as well as peri-urban growth along main transport routes. Some peri-urban communes have a quality of life that is equal to or exceeds that of the central city, supporting H1. This composite spatial output integrates the typology findings: dense urban cores achieve high scores, while peripheral zones exhibit fragmented and insufficient accessibility. Intermediate scores in western communes indicate ongoing development.

5.3. The Proxilience Index (PR)

Compared with the proximity index, this first attempt to measure proxilience shows, in the case of the IMA, spatial patterns with higher levels of contiguity. As expected, the maximum value is identified in the urban core, followed by a western proxilient area that includes three communes with recent exponential development of the real estate sector and productive economic activities, including the industrial and service sectors (Rediu, Valea Lupului, Miroslava) (Figure 11). Beyond this area, the following high values for proxilience are observed in a ring of communes that are either directly adjacent to the city of Iași or located along the main communication routes of the county to the south and west.
In contrast, the peripheral status of other communes—particularly those in the northern part of the second metropolitan crown—is highlighted by their low proxilience index values. For the external validation of this index, the equal-weighted comparative method was employed. The results show relatively stable performance of the indicators used, with rank variations reduced for most units in the sample (18 out of 27 units varying by only 1–3 positions, and 7 maintaining their positions in the hierarchy).

5.4. Proxilience and Quality of Life Proxies

Strong correlations with LHDI and social needs indicate that higher proximity access enhances both perceived and measured quality of life. Weaker correlations with life expectancy suggest that service proximity alone is insufficient without effective healthcare outcomes for ageing populations. Significant relationships exist between the Proximity and Proxilience Indices and quality of life proxies:
Standard-of-living indicators (material capital and the LHDI) show strong correlations with the aggregate index and its components.
Life expectancy at age 65 (LIFE_EXPEC65) shows a weaker correlation, indicating less adaptation of proximity services to older adults’ needs.
These findings support H2 and H3, which suggest that proxilience, an integration of proximity, vulnerability, and resilience, better predicts urban wellbeing (correlation coefficient 0.784) than proximity data alone (correlation coefficient 0.697).
Table 3 presents correlation coefficients between QoL proxies and the Proximity Index and its components, highlighting significant values.
Table 3. Correlations between Quality-of-Life proxies and the Proximity Index, its components, and the Proxilience Index.
VariablesLHDILIFE_EXPEC65L_MAT_CAP
LHDI10.4890.954
LIFE_EXPEC650.48910.337
L_MAT_CAP0.9540.3371
Physiological needs0.5400.1580.563
Safety needs0.7030.4000.697
Social needs0.7590.4120.716
Self-actualisation and esteem0.5180.3070.496
PROXIMITY INDEX0.6970.3570.685
PROXILIENCE INDEX0.7840.3280.794
Values in bold are different from 0 with a significance level alpha = 0.05.
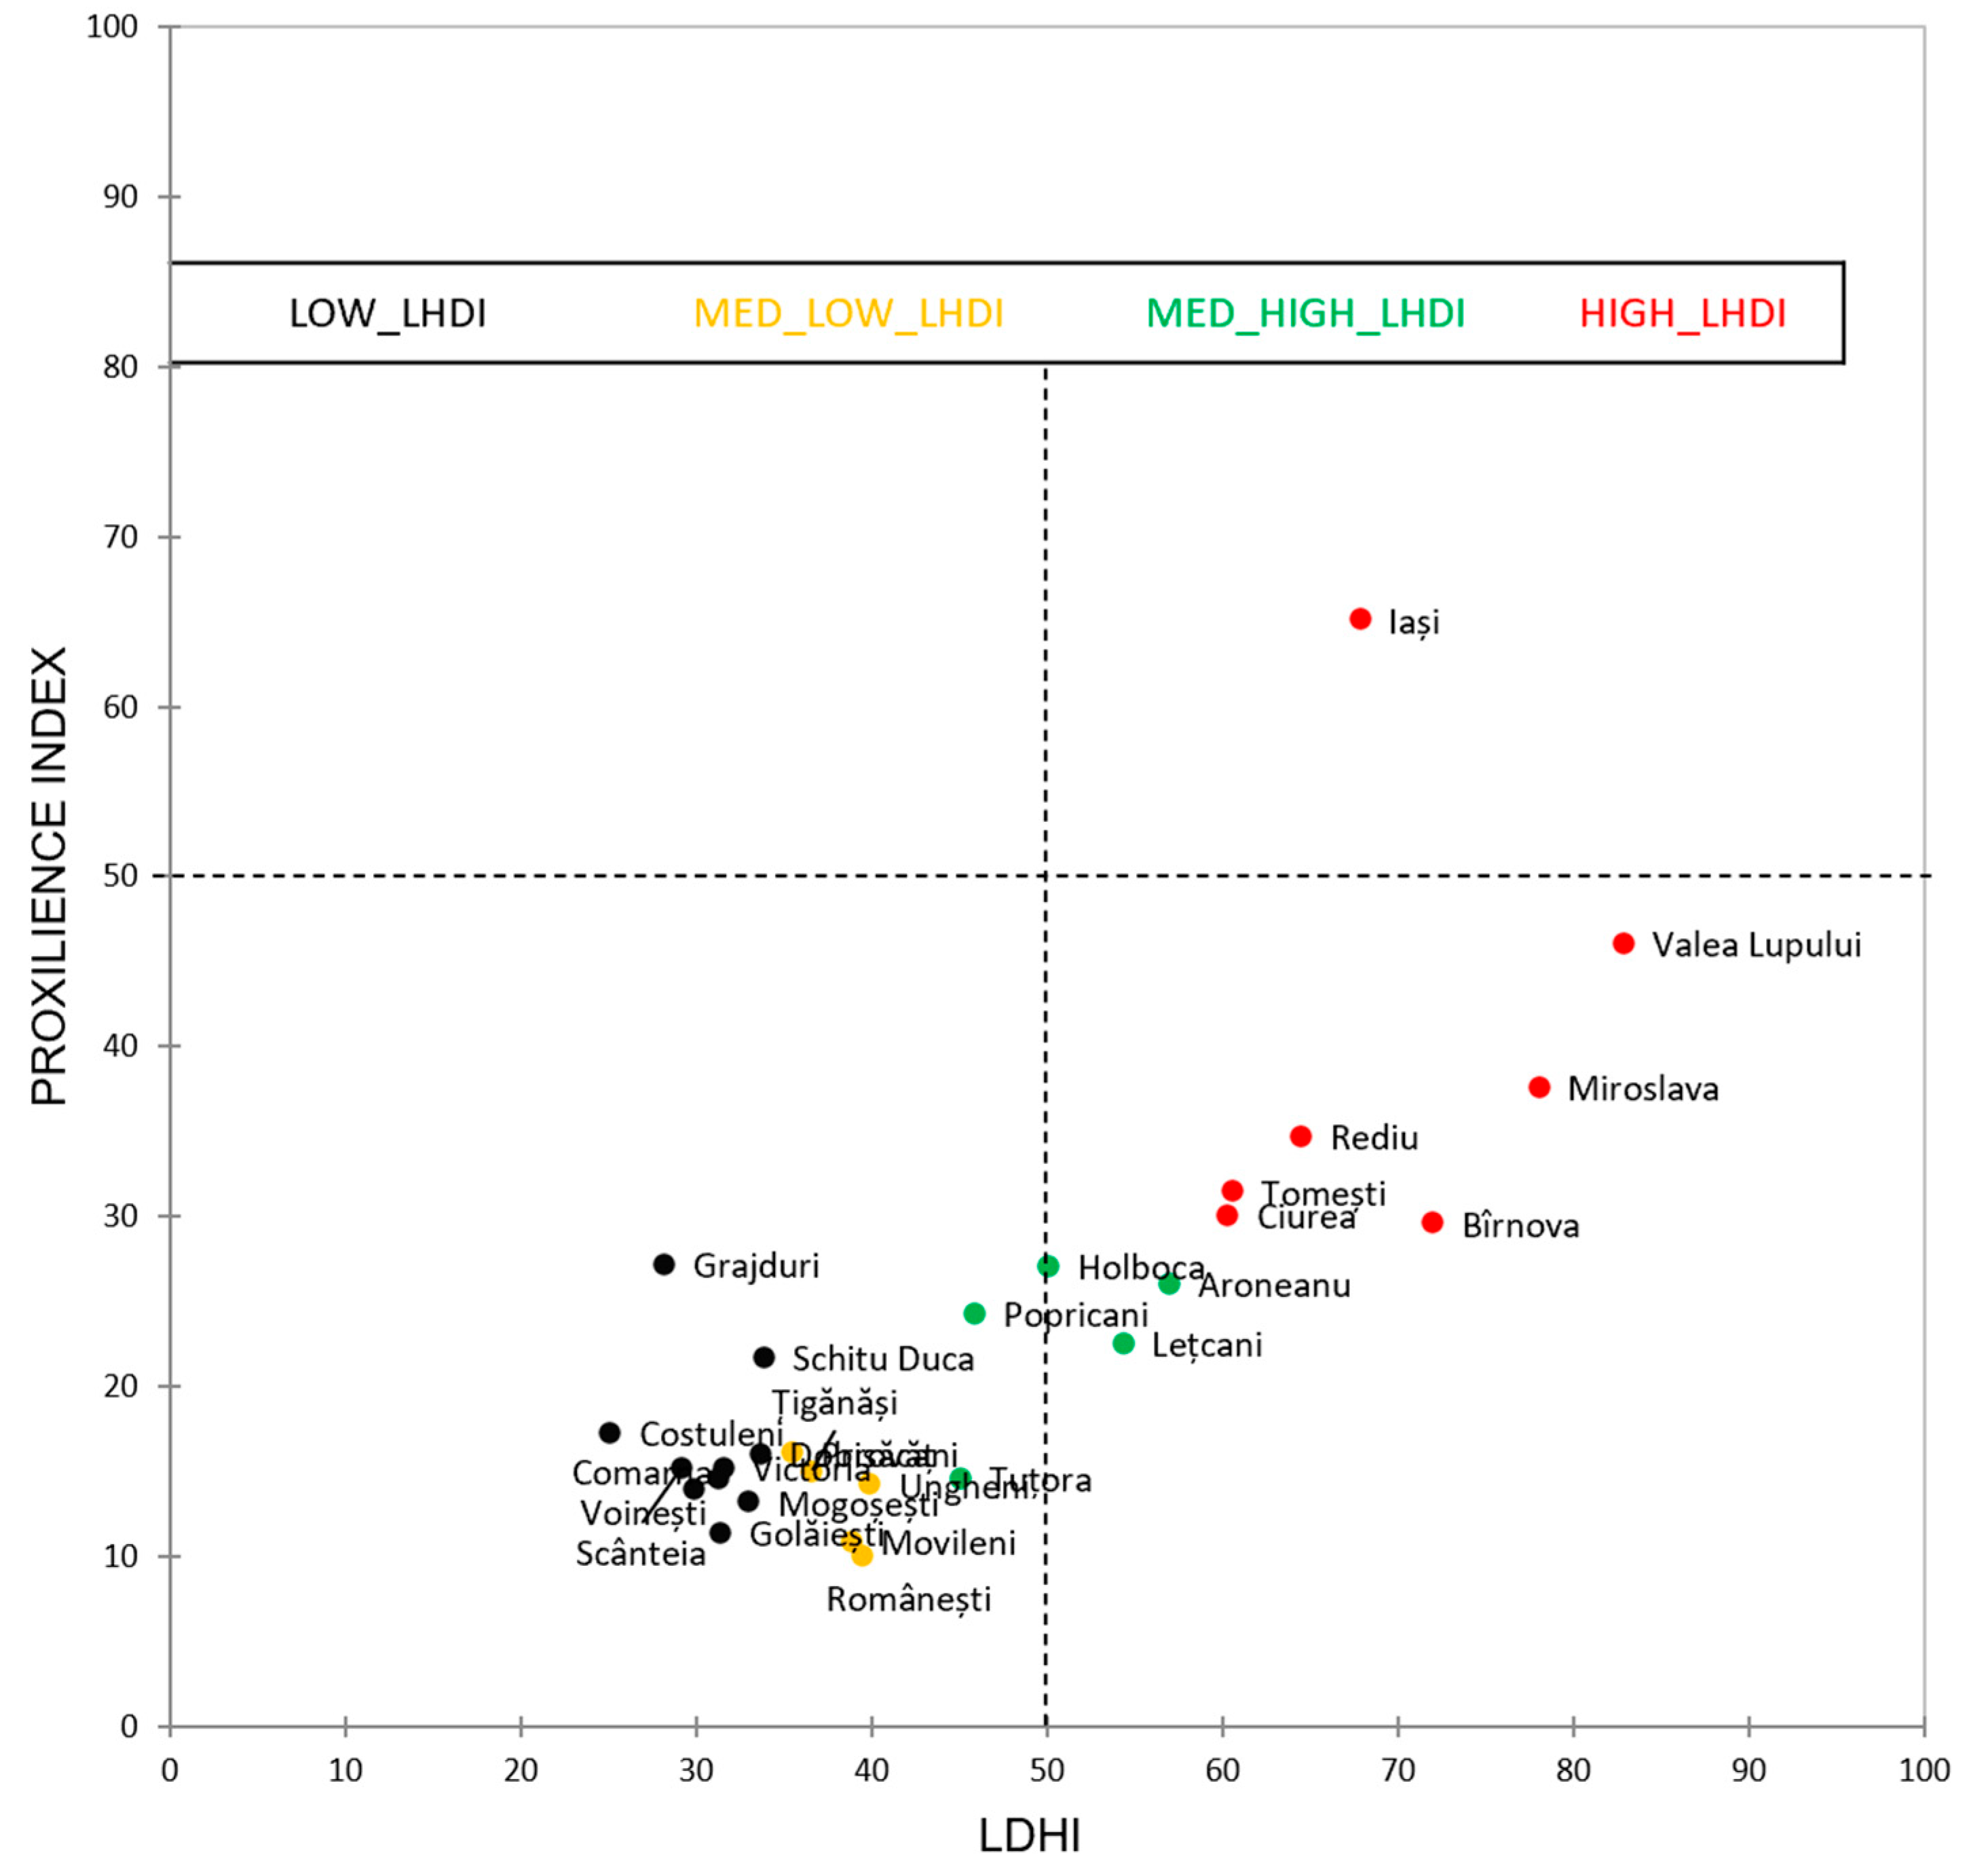
The correlation between LHDI and the Proxilience Index (Figure 12) shows an R2 of 0.615 and a Pearson correlation coefficient of 0.784, indicating that further empirical analyses can substantiate this new concept across multiple aspects of QoL and wellbeing. Supplementarily, a linear regression was applied (see Supplementary S2), which further demonstrated the close statistical relationship between LHDI and the proposed Proxilience Index.
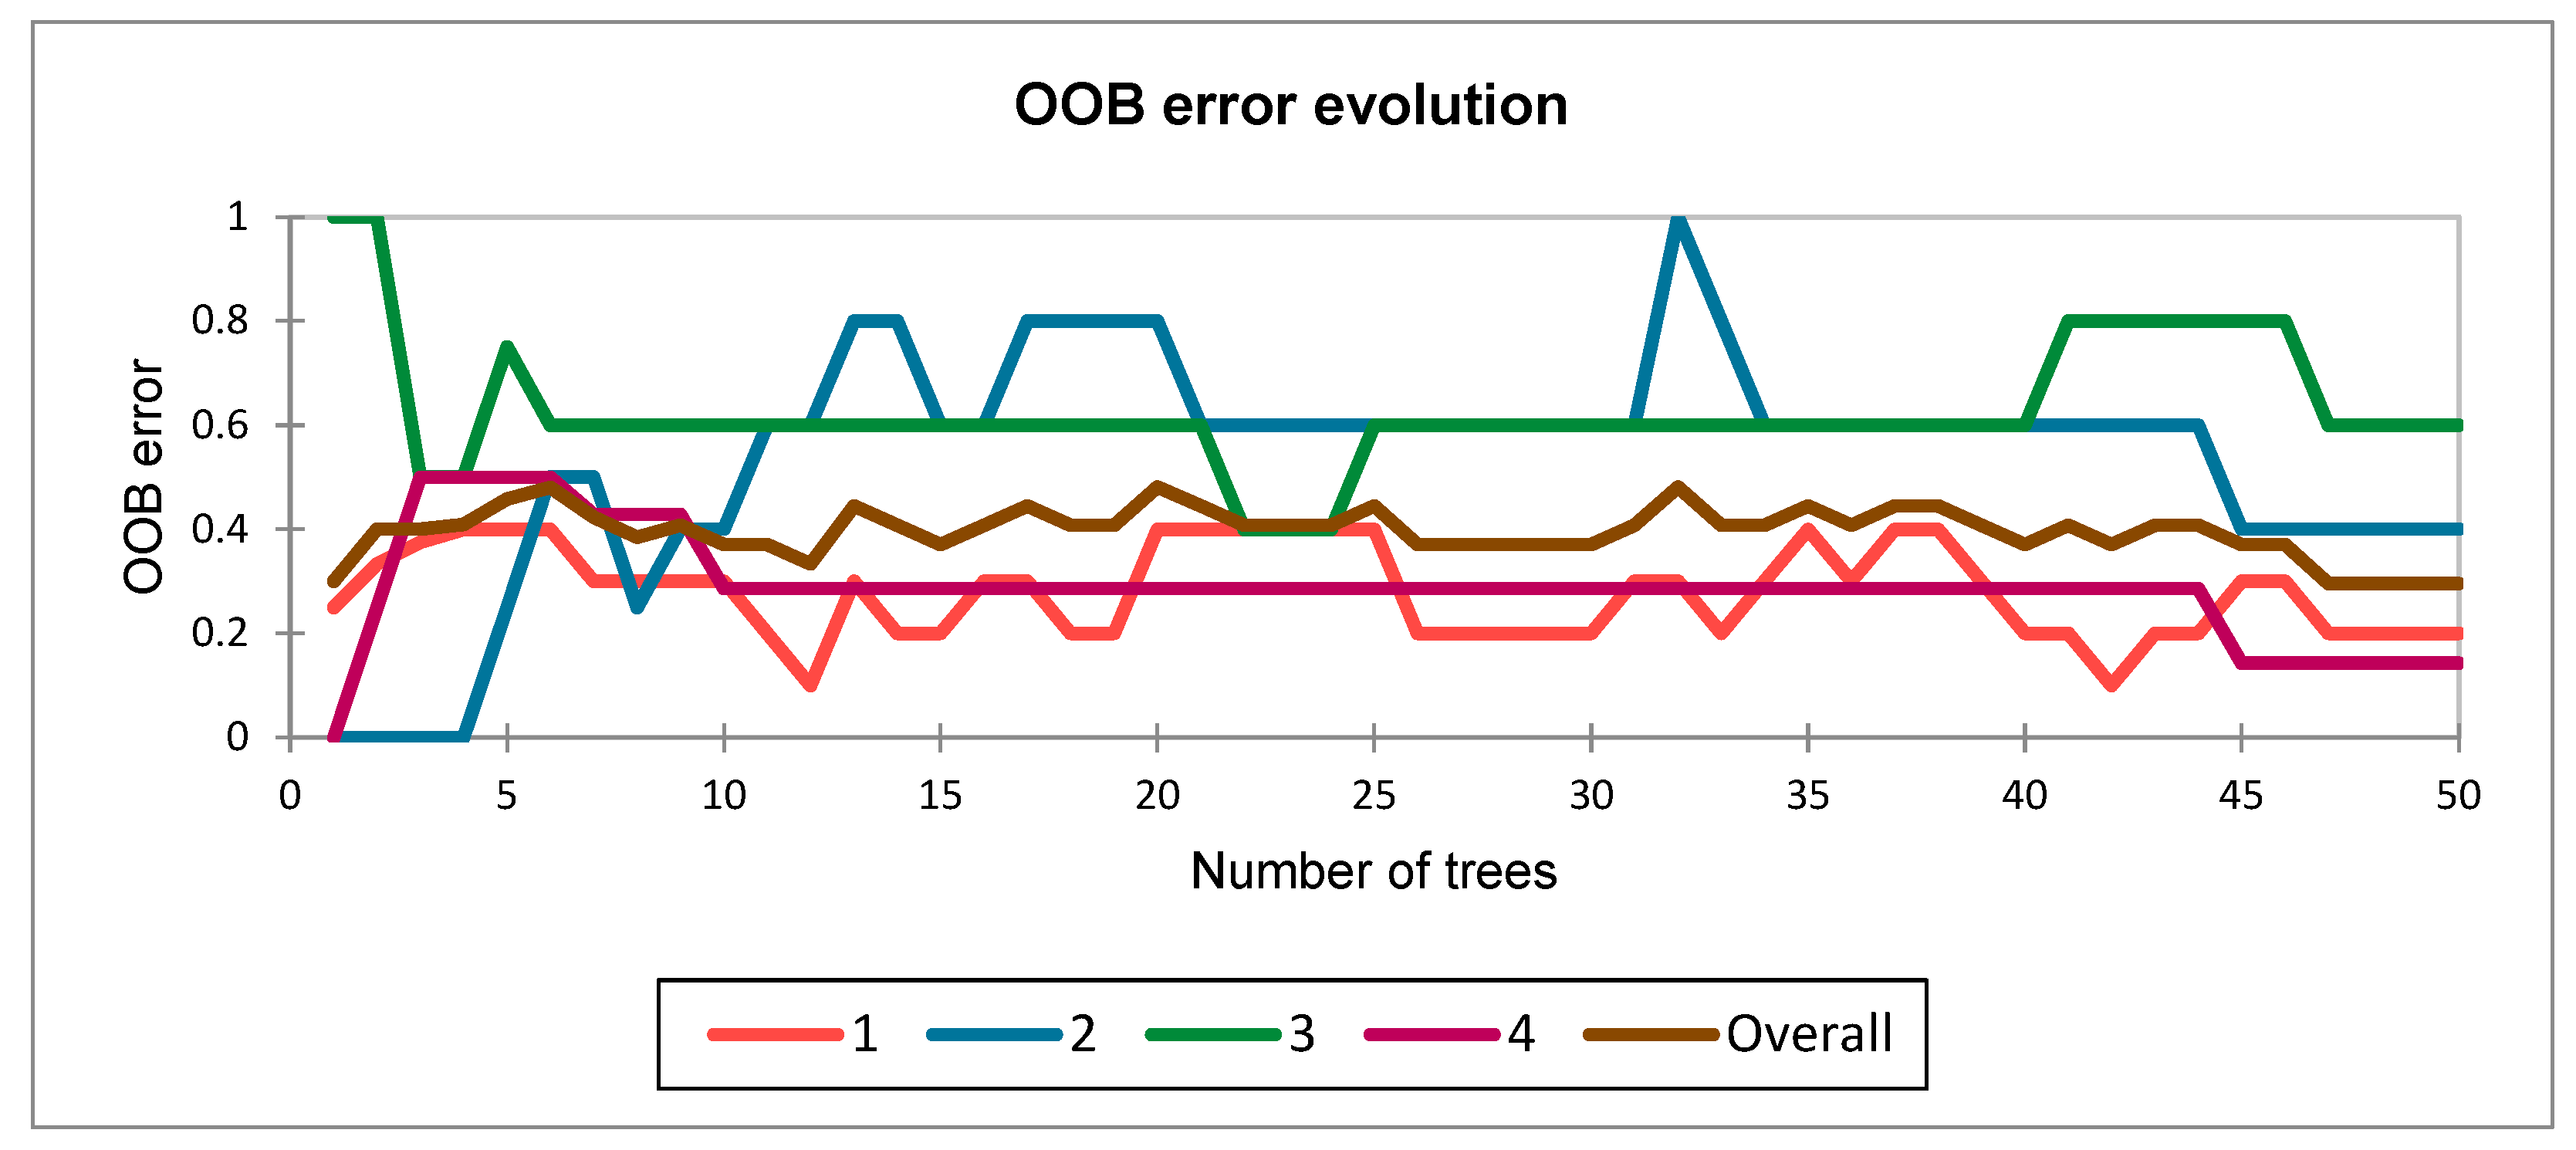
To further explore the contribution of proxilience components to wellbeing, we applied a random forest (RF) model. Using RF with LHDI classes as the dependent variable and resilience–opportunity indicators as predictors yielded a model with reasonable accuracy (misclassification rate = 0.296).
Figure 13 displays the Out-of-bag (OOB) error rate evolution during Random Forest training. The low and stable error rate (below 30%) confirms the reliability of the selected indicators for predicting territorial development patterns using machine learning.
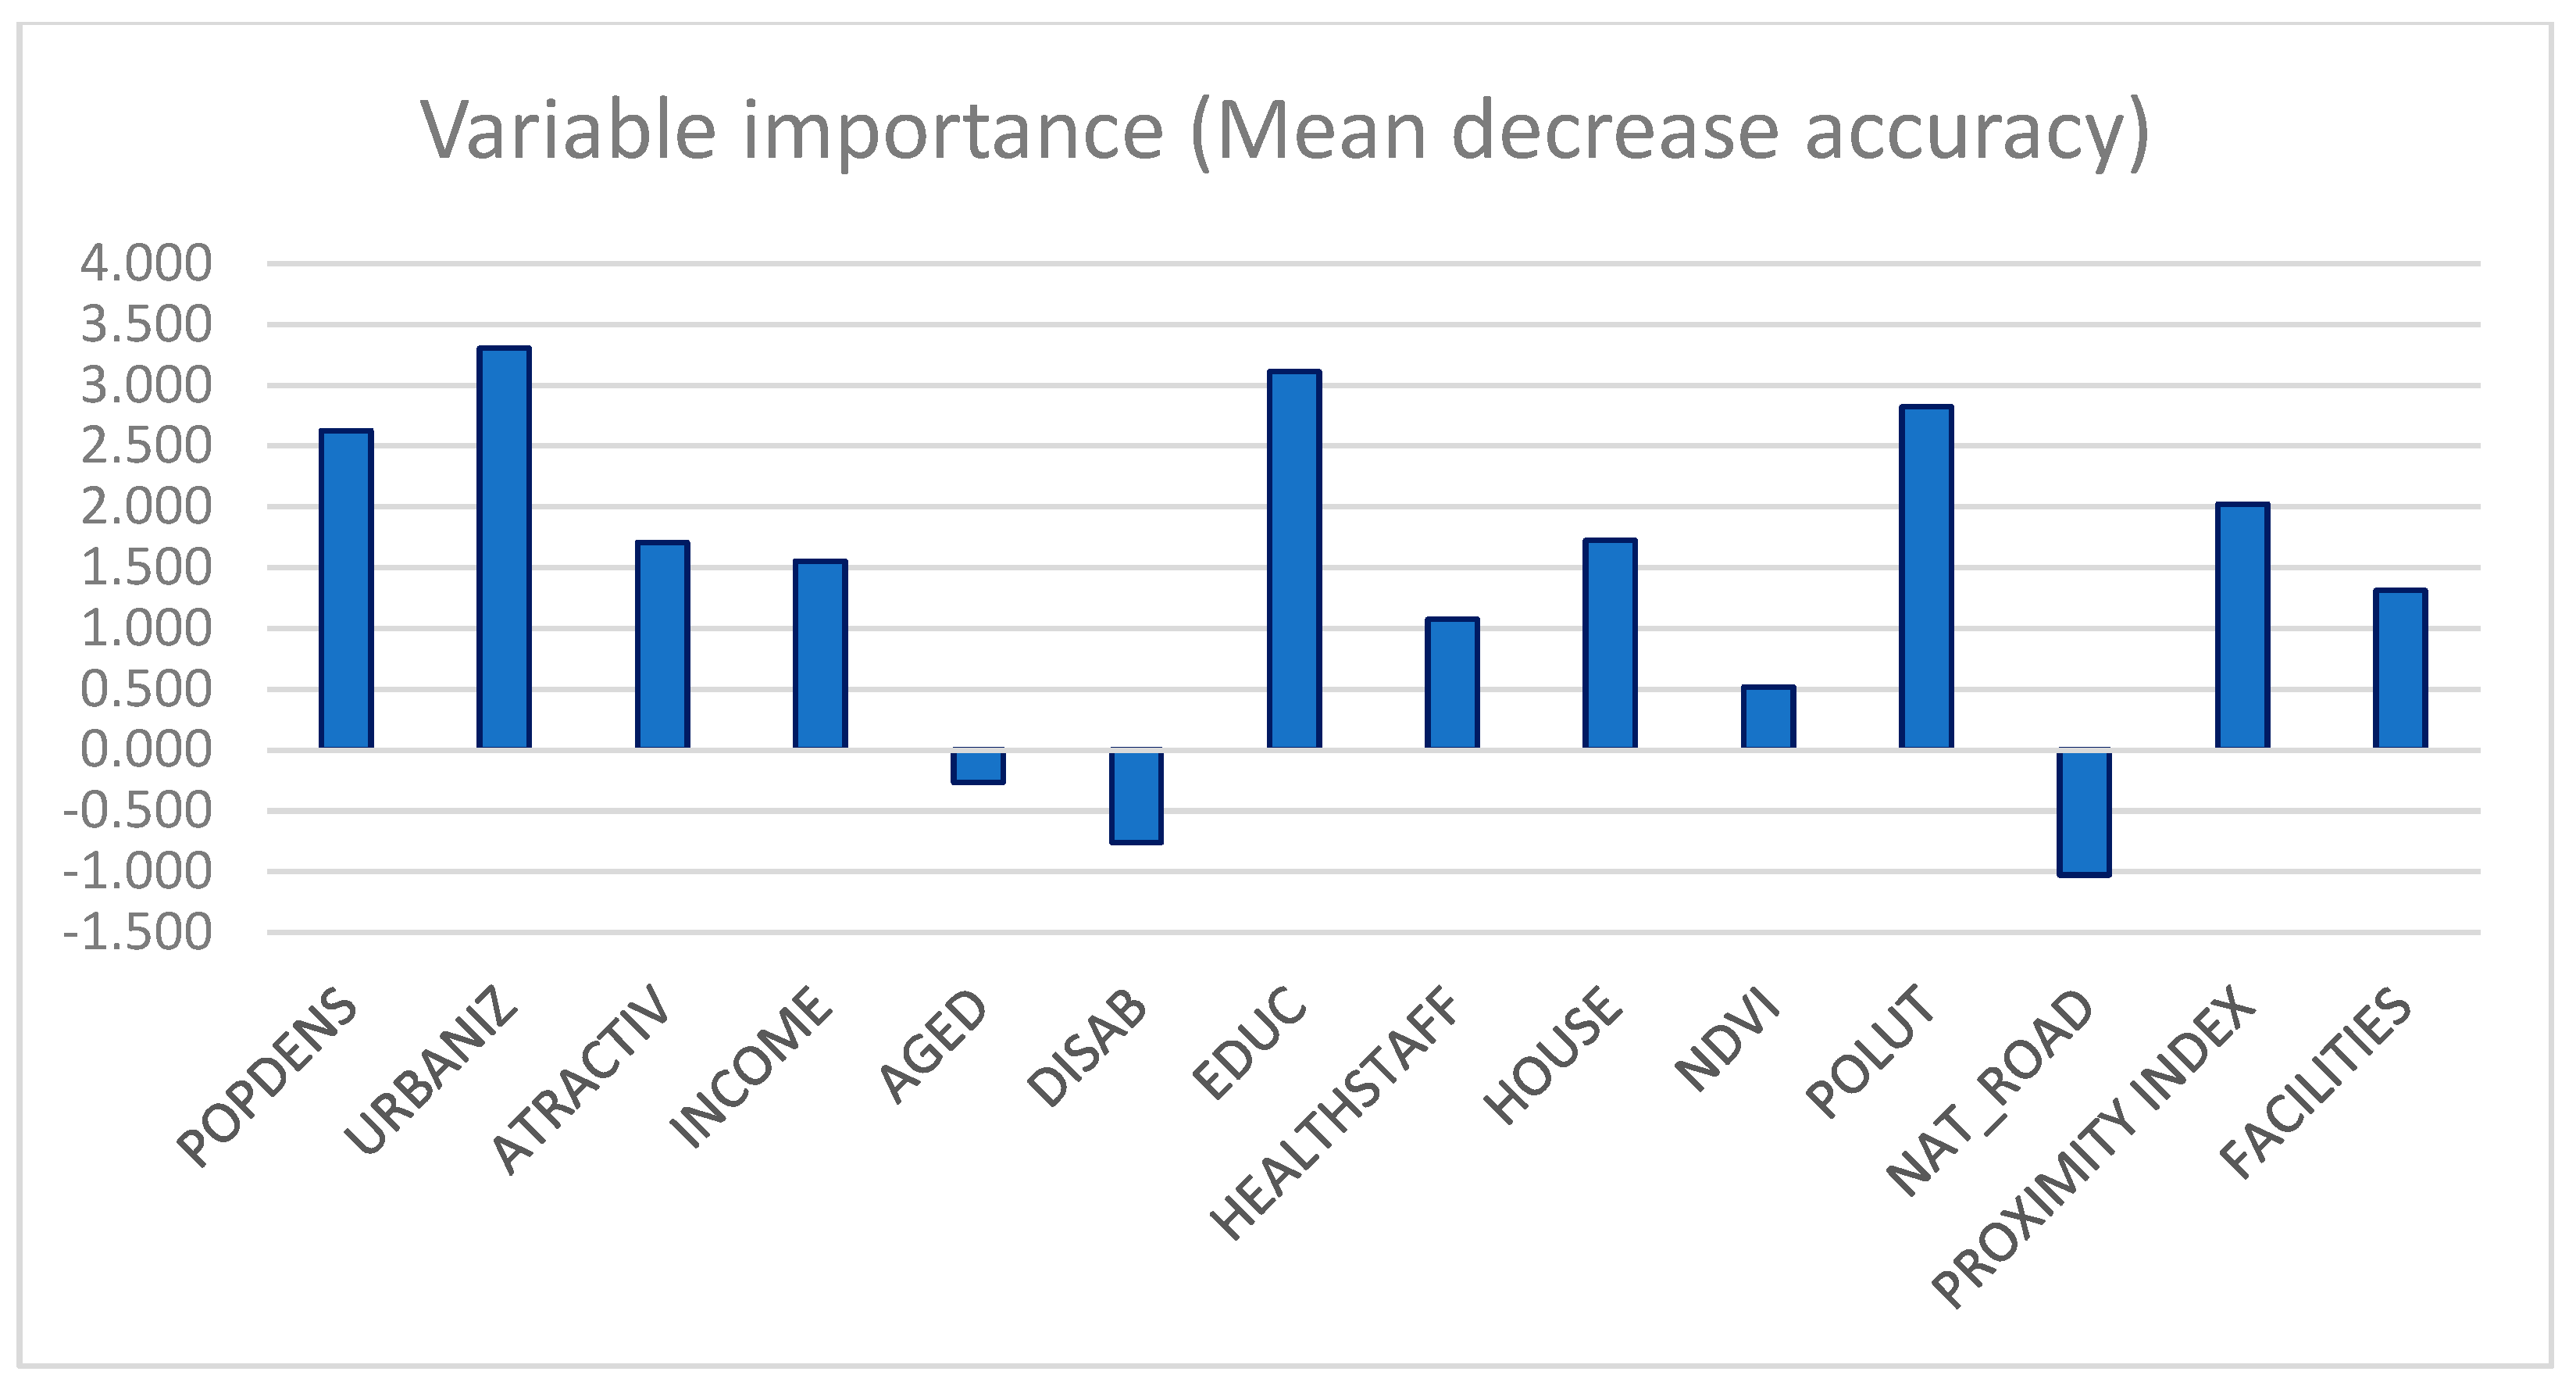
Figure 14 shows the overall importance of variables based on the model’s Mean Decrease Accuracy. The Proximity Index emerges as a highly influential predictor, alongside pollution and material capital, validating its role as a key indicator for spatial planning and equity.
Table 4 presents variable importance by LHDI class, identifying the key factors most influencing development in each group.
Table 4. Variable importance by LHDI class (Mean Decrease Accuracy from Random Forest model).
VariablesLOW_LHDIMED_LOW_LHDIMED_HIGH_LHDIHIGH_LHDI
POPDENS2.1222.777−3.6623.869
URBANIZ2.0961.4280.0002.212
ATRACTIV1.0101.414−0.7641.286
INCOME0.6350.0000.0001.713
AGED−0.318−1.443−0.2001.443
DISAB−1.4280.000−1.3660.549
EDUC2.4410.643−0.3932.520
HEALTHSTAFF1.443−1.7861.7132.019
HOUSE2.044−1.4430.7181.366
NDVI1.0270.436−1.4280.000
POLUT3.053−0.8280.0000.905
NAT_ROAD−1.0100.000−1.4280.000
FACILITIES1.5751.849−1.5931.713
PROXIMITY INDEX1.1231.5641.4431.010
Table 4 shows that Low-LHDI areas are strongly affected by education and pollution levels, indicating foundational challenges in human capital and lower environmental quality. In contrast, high-LHDI areas prioritise health services and infrastructure, reflecting a shift toward sustaining wellbeing and advanced amenities. The Proximity Index remains a consistent predictor across all classes, underscoring the critical role of accessibility in human development/wellbeing. This variation suggests that development drivers evolve with socioeconomic status: the first stages depend on basic education and environmental conditions, while the advanced layers emphasise healthcare and service availability.
The proxilience framework, supported by cold-spot mapping and gravitational accessibility analysis, robustly identifies spatial disparities and pressure zones. These findings are promising initial results from this exploratory approach, which aims to operationalize proxilience as a novel, multidimensional tool integrating accessibility, needs hierarchy, and resilience for urban–regional planning.
These results could be adapted and replicated in other urban contexts to support strategic recommendations aligned with the dynamics of the wellbeing economy and the emerging ‘Superbowl effect’, where urban concentration, equity, and liveability intersect. This strengthens the spatial understanding of the ‘Superbowl effect’.

6. Discussions and Conclusions

Shocks can enhance or create new capabilities in this context by reorganising urban planning systems around access to amenities in proximity through active mobility. During the COVID-19 pandemic, the 15-minC concept was adopted as a form of resilience, not merely as a solution to a specific problem, but as an adaptive measure capable of producing a long-term transformation of cities into more sustainable and liveable systems.
This study demonstrates that proximity alone is insufficient to ensure wellbeing; urban planning must integrate resilience capacity and opportunity-based strategies to create inclusive environments. Proximity matters, but it should be integrated with the territory’s resilience capacity, which sometimes emerges as vulnerabilities (weaknesses) are transformed into opportunities (future strengths).
The 15-minC is often treated as a buzzword, a renewed yet familiar approach, a practical yet contested concept, sometimes appearing overly normative but flexible in its content. This study seeks to offer a different perspective by integrating vulnerability–opportunity indicators, Maslow’s hierarchy of needs, and gravitational analysis into the 15-minC framework. By linking the hierarchy of needs to spatial attraction dynamics in a vulnerability–opportunity context, proxilience offers both a conceptual perspective and a spatial policy tool for enhancing urban wellbeing.
Additionally, this study introduces and operationalises the concept of proxilience as an analytical tool that combines resilience and proximity frameworks to assess the 15-minC model within Romanian urban contexts, thereby bridging the urban–rural gap.
The results of our exploratory analysis, using basic GIS and statistical tools, suggest several opportunities for future development, showing that the effects of the ‘Superbowl Economy’ are not linear. First, not only the quantity (access to numerous amenities/services), but also the quality (hierarchy of needs) and diversity of services matter. Furthermore, it should account not only for access to individual services but also for service pressures and the availability of multiple opportunities. Crowded urban neighbourhoods may offer various services, but the population pressure is high and increasing (agglomeration, traffic, pollution). Rural peripheries, by contrast, exhibit lower densities but lack essential services. Here, one could also consider applying the 30-min territory model, which includes green public transport and longer access times to some services, instead of the 15-minC approach [10]. However, the “sweet spot” comprises less-dense neighbourhoods with diverse services and a cleaner environment. This typology reflects the Goldilocks zone discussed earlier and empirically demonstrates the spatial logic of the ‘Superbowl Economy’.
Services address different human needs and can be prioritised based on their impacts. In rural areas, some higher needs might be lacking. Urban–rural collaboration and partnerships should be promoted to facilitate the integration of resources and shared infrastructure, thereby reducing vulnerabilities and promoting just growth and spatial equity in a polycentric system [110,111]. Creating new centralities based on proximity services and possibilities for active mobility in these areas could improve the overall quality of life. This underscores the policy relevance of proxilience as a driver of regeneration, not only in deprived areas but also in enabling new forms of inclusive urban–rural connectivity. Therefore, proximity and proxilience in urban sustainability approaches should also enhance multiple choices and people’s higher capabilities to enhance wellbeing. By integrating proximity, vulnerability, and capacity, proxilience offers a robust conceptual and empirical framework to support more just, resilient, and efficient urban–regional development.
Proxilience also provides an analytical tool to identify priority intervention areas, such as cold spots in the east, north, and south of IMA, as well as peripheral areas often overlooked in top-down policy frameworks. Its multidimensional structure enables the adjustment of responses based on typology-specific gaps: social services in peripheral communes, pressure reduction in urban hubs, and opportunity scaling in peri-urban zones.
In Iași, chrono-urbanism could be a viable solution to infrastructural problems, traffic agglomeration, and air pollution. Currently, the lack of access to specific amenities and services results in extensive flows (primarily by car) toward the city. The old central areas and the communist-era neighbourhoods align more closely with the 15-minC model in terms of facilities, while the most significant issues arise in the peripheral areas of recent urban sprawl. Currently, there are sharp urban–rural contrasts and abrupt discontinuities between the peri-urban area and the peripheries of the metropolitan area. The Proxilience Index effectively captures this fragmentation, indicating which communes approximate a functional 15-minC model and which are critically excluded, thereby enabling strategic, localised planning.
These findings confirm our main hypotheses and demonstrate how the Proxilience Index can be used to target spatial interventions and reduce inequality in fragmented and heterogeneously polarised systems. In particular, the index identifies priority areas where low service proximity co-occurs with limited resilience capacity, enabling spatially targeted interventions rather than uniform application. In the context of post-socialist Central and Eastern European countries, an integrated urban–rural policy and planning approach to metropolitan vulnerabilities and accessibility could include proxilience as the primary driver for reducing spatial disparities. Here, proxilience serves as a coordination tool that links accessibility gaps with socioeconomic and environmental vulnerabilities at the local scale. This study thus offers a transferable framework—linking proximity with resilience—that can inform policy, planning, and research in hybrid urban systems beyond Romania. The framework is data-driven, scalable, and adaptable to different metropolitan configurations and governance contexts. It also reinforces the importance of tailoring urban planning strategies to the unique characteristics of each typology, ensuring policies extend beyond the central urban core and adapt to diverse spatial ecologies. This enables differentiated strategies for urban cores, peri-urban transition zones, and peripheral areas based on their specific proximity–resilience profiles.
There are some limitations of the present study. While formulating new concepts and integrating them into a complex framework, the study also tests an initial operationalisation of this model, proposing two new indices (the Proximity and Proxilience Indices) applied to the IMA case. Because it is an exploration of a single case study, it is not easy to generalise to other urban areas without careful analysis. The selected indicators are often proxies for specific model dimensions, and the temporal scale differs across cases. Although some internal and external robustness tests have been conducted, future validation is necessary using indicators of temporal evolution and comparisons across metropolitan-area instances. The Random Forest method is suitable for assessing variable importance; however, more comprehensive statistical approaches are needed for detailed analysis of causal relationships that empirically substantiate the links between accessibility, vulnerability, and human development at the local level, thereby reducing the likelihood of empirically demonstrating the proximality hypotheses. We consider this study to be an exploratory investigation that proposes new concepts and an innovative theoretical and methodological framework, but that requires further development.

Supplementary Materials

The following supporting information can be downloaded at: https://www.mdpi.com/article/10.3390/land15030468/s1.

Author Contributions

Conceptualization, A.B. and K.K.; methodology, A.B., K.K., C.-M.F. and O.-V.D.; software, C.-M.F. and O.-V.D.; formal analysis, A.B.; investigation, A.B., K.K. and C.-M.F.; resources, A.B. and C.-M.F.; data curation, A.B. and C.-M.F.; writing—original draft preparation, A.B. and K.K.; writing—review and editing, A.B. and K.K.; visualization, A.B., C.-M.F. and O.-V.D.; supervision, A.B. and K.K.; project administration, A.B. and K.K. All authors have read and agreed to the published version of the manuscript.

Funding

This research received no external funding.

Data Availability Statement

Geolocalised urban facilities using Botsol 4.0.1. software for web scraping and data for the selected indicators from the Romanian Institute of Statistics, Romanian Urban Policy, Copernicus Sentinel Imagery, European Environmental Agency, Directorate for Personal Records and Database Administration, and the 2011 and 2021 Population Censuses were used in this study.

Acknowledgments

Alexandru Bănică, Cristian-Manuel Foșalău, and Oliver-Valentin Dinter acknowledge the support of the project ‘City: Future Organisation of Changes in Urbanisation and Sustainability’ (CF 23/27.07.2023), financed by the Ministry of Investment and European Projects through the National Recovery and Resilience Plan (PNRR-III-C9-2023-I8_round 2). Karima Kourtit acknowledges support from the HORIZON-CL2-2022 TRANSFORMATIONS-01 Programme for the WISER project, under grant agreement No. 101094546.

Conflicts of Interest

The authors declare no conflicts of interest.

Abbreviations

The following abbreviations are used in this manuscript:
15-minC15-minute city
AHPAnalytical Hierarchy Process
CRConsistency Ratio
IMAIași Metropolitan Area
LAULocal Administrative Unit
LHDILocal Human Development Index
NDVINormalized Difference Vegetation Index
PIProximity Index
PRProxilience Index
RFRandom Forest
VOMVulnerability–Opportunity Model

Note

1
Following the Handbook on Constructing Composite Indicators—OECD 2008, in XLStat Premium [109].

References

  1. Kourtit, K. The New Urban World—Economic-Geographical Studies on the Performance of Urban Systems; Shaker: Aachen, Germany, 2019. [Google Scholar]
  2. Feitosa, F.O.; Wolf, J.H.; Lourenço Marques, J. Operationalizing spatial justice in urban planning: Bridging theory with practice. Urban Res. Pract. 2024, 17, 720–736. [Google Scholar] [CrossRef] [Scilit]
  3. Lefebvre, H. Le Droit a la Ville; Anthopos: Paris, France, 1968. [Google Scholar]
  4. Lefebvre, H. Writings on Cities; Blackwell: Oxford, UK, 1996. [Google Scholar]
  5. Harvey, D. Social Justice and the City; Johns Hopkins University Press: Baltimore, MD, USA, 1973. [Google Scholar]
  6. Soja, E. Seeking Spatial Justice; University of Minnesota Press: Minneapolis, MN, USA, 2010. [Google Scholar]
  7. Özcelik, Z.; Hamamcioglu, C. From district to street: A multi-scale analysis of spatial justice through the 15-minute city framework in Beyoğlu, Istanbul. J. Urban Mobil. 2025, 8, 100163. [Google Scholar] [CrossRef] [Scilit]
  8. Dadashpoor, H.; Rostami, F. Measurement of Integrated Index of Spatial Justice in the Distribution of Urban Public Services Based on Population Distribution, Accessibility and Efficiency in Yasuj City. Urban-Reg. Stud. Res. J. 2011, 3, 1–22. [Google Scholar]
  9. Moreno, C.; Allam, Z.; Chabaud, D.; Gall, C.; Pratlong, F. Introducing the ‘15-Minute City’: Sustainability, Resilience, and Place Identity in Future Post-Pandemic Cities. Smart Cities 2021, 4, 93–111. [Google Scholar] [CrossRef] [Scilit]
  10. Moreno, C. The 15-Minute City; John Wiley: New York, NY, USA, 2024. [Google Scholar]
  11. Allam, Z.; Moreno, C.; Chabaud, D.; Pratlong, F. Proximity-Based Planning and the ‘15-Minute City’: A Sustainable Model for the City of the Future. In The Palgrave Handbook of Global Sustainability; Palgrave Macmillan: Cham, Switzerland, 2022. [Google Scholar] [CrossRef] [Scilit]
  12. Moreno, C. La Ville du Quart d’Heure: Pour un Nouveau Chrono-Urbanisme. La Tribune. 2016. Available online: https://www.moreno-web.net/la-ville-du-quart-dheure-pour-un-nouveau-chrono-urbanisme/ (accessed on 20 January 2026).
  13. Nijkamp, P.; Kourtit, K.; Krugman, P.; Moreno, C. Old wisdom and the New Economic Geography: Managing uncertainty in 21st century regional and urban development. Reg. Sci. Policy Pract. 2024, 16, 100124. [Google Scholar] [CrossRef] [Scilit]
  14. Marcińczak, S.; Gentile, M.; Rufat, S.; Chelcea, L. Urban Geographies of Hesitant Transition: Tracing Socioeconomic Segregation in Post-Ceaușescu Bucharest. Int. J. Urban Reg. Res. 2014, 38, 1399–1417. [Google Scholar] [CrossRef] [Scilit]
  15. Vasilevska, L.; Vranic, P.; Marinkovic, A. The Effects of Changes to the Post-Socialist Urban Planning Framework on Public Open Spaces in Multi-Story Housing Areas: A View from Niš, Serbia. Cities 2014, 36, 83–92. [Google Scholar] [CrossRef] [Scilit]
  16. Kinossian, N. Rethinking the Post-Socialist City. Urban Geogr. 2022, 43, 1240–1251. [Google Scholar] [CrossRef] [Scilit]
  17. Foșalău, C.-M.; Roșu, L.; Iațu, C.; Dinter, O.-V.; Cristodulo, P.-M. Mapping Urban Changes Through the Spatio-Temporal Analysis of Vegetation and Built-Up Areas in Iași, Romania. Sustainability 2025, 17, 11. [Google Scholar] [CrossRef] [Scilit]
  18. Sarkar, S.; Cottineau-Mugadza, C.; Wolf, L.J. Spatial Inequalities and Cities: A Review. Environ. Plan. B 2024, 51, 1391–1407. [Google Scholar] [CrossRef] [Scilit]
  19. Tuvikene, T.; Sgibnev, W.; Neugebauer, C.S. Post-Socialist Urban Infrastructures; Routledge: New York, NY, USA, 2019. [Google Scholar]
  20. Mariotti, J.; Koželj, J. Tracing post-communist urban restructuring: Changing centralities in central and eastern European capitals. Urbani Izziv 2016, 27, 113–122. [Google Scholar] [CrossRef] [Scilit]
  21. Bănică, A.; Roșu, L.; Serban, L.; Muntele, I. Children’s playgrounds for urban sustainability:(in) accessibility,(un) attractiveness and social (in) equity in Iași and Bacău municipalities (Romania). Present Environ. Sustain. Dev. 2023, 17, 371. [Google Scholar] [CrossRef] [Scilit]
  22. Patel, R.; Sanderson, D.; Sitko, P.; De Boer, J. Investigating Urban Vulnerability and Resilience: A Call for Applied Integrated Research to Reshape the Political Economy of Decision-Making. Environ. Urban. 2020, 32, 589–598. [Google Scholar] [CrossRef] [Scilit]
  23. Krellenberg, K.; Welz, J.; Link, F.; Barth, K. Urban Vulnerability and the Contribution of Socio-Environmental Fragmentation: Theoretical and Methodological Pathways. Prog. Hum. Geogr. 2016, 41, 408–431. [Google Scholar] [CrossRef] [Scilit]
  24. Bai, J. Accessibility to Essential Services and Facilities by Aged Population in the Local Government Area of Monash: A GIS-Based Case Study. Master’s Thesis, RMIT University, Melbourne, Australia, 2013. [Google Scholar]
  25. Mendizabal, M.; Feliu, E.; Tapia, C.; Rajaeifar, M.A.; Tiwary, A.; Sepúlveda, J.; Heidrich, O. Triggers of change to achieve sustainable, resilient, and adaptive cities. City Environ. Interact. 2021, 12, 100071. [Google Scholar] [CrossRef] [Scilit]
  26. Carramiñana, D.; Bernardos, A.M.; Besada, J.A.; Casar, J.R. Towards Resilient Cities: A Hybrid Simulation Framework for Risk Mitigation Through Data-Driven Decision Making. Simul. Model. Pract. Theory 2024, 133, 102924. [Google Scholar] [CrossRef] [Scilit]
  27. Maslow, A.H. Motivation and Personality; Harper and Row: New York, NY, USA, 1954. [Google Scholar]
  28. Zhai, T.; Chang, M.; Li, Y.; Huang, L.; Chen, Y.; Ding, G.; Zhao, C.; Li, L.; Chen, W.; Zhang, P.; et al. Integrating Maslow’s Hierarchy of Needs and Ecosystem Services into Spatial Optimization of Urban Functions. Land 2023, 12, 1661. [Google Scholar] [CrossRef] [Scilit]
  29. Sen, A.; Smith, T.E. Gravity Models of Spatial Interaction Behavior, Advances in Spatial and Network Economics; Springer: Berlin/Heidelberg, Germany, 1995. [Google Scholar]
  30. Geurs, K.T.; van Wee, B. Accessibility Evaluation of Land-Use and Transport Strategies: Review and Research Directions. J. Transp. Geogr. 2004, 12, 127–140. [Google Scholar] [CrossRef] [Scilit]
  31. Apparicio, P.; Gelb, J.; Dubé, A.S.; Kingham, S.; Gauvin, L.; Robitaille, É. The Approaches to Measuring the Potential Spatial Access to Urban Health Services Revisited: Distance Types and Aggregation-Error Issues. Int. J. Health Geogr. 2017, 16, 32. [Google Scholar] [CrossRef] [Scilit]
  32. Guagliardo, M.F. Spatial Accessibility of Primary Care: Concepts, Methods and Challenges. Int. J. Health Geogr. 2004, 3, 3. [Google Scholar] [CrossRef] [Scilit]
  33. Nijkamp, P. Reflections on Gravity and Entropy Models. In Planning Models; Reggiani, A., Button, K., Nijkamp, P., Eds.; Edward Elgar: Cheltenham, UK, 2006; pp. 99–121. [Google Scholar]
  34. McLafferty, S. Place and Quantitative Methods: Critical Directions in Quantitative Approaches to Health and Place. Health Place 2020, 61, 102232. [Google Scholar] [CrossRef] [Scilit] [PubMed]
  35. Christodoulou, A.; Christidis, P. Evaluating Congestion in Urban Areas: The Case of Seville. Res. Transp. Bus. Manag. 2021, 39, 100577. [Google Scholar] [CrossRef] [Scilit]
  36. Stacherl, B.; Sauzet, O. Gravity Models for Potential Spatial Healthcare Access Measurement: A Systematic Methodological Review. Int. J. Health Geogr. 2023, 22, 34. [Google Scholar] [CrossRef] [Scilit]
  37. Meerow, S.; Newell, J.P.; Stults, M. Defining Urban Resilience: A Review. Landsc. Urban Plan. 2016, 147, 38–49. [Google Scholar] [CrossRef] [Scilit]
  38. Shafiei Dastjerdi, M.; Lak, A.; Ghaffari, A.; Sharifi, A. A conceptual framework for resilient place assessment based on spatial resilience approach: An integrative review. Urban Clim. 2021, 36, 100794. [Google Scholar] [CrossRef] [Scilit]
  39. Nel, D.; Bruyns, G.; Higgins, C. Urban Design, Connectivity and its Role in Building Spatial Resilience. In Proceedings of the XXV International Seminar on Urban Form 2018, Krasnoyarsk, Russia, 5–9 July 2018; Kukina, I., Fedchenko, I., Chui, I., Eds.; Urban Morphology, Regeneration and Newest Urban Design; Siberian Federal University: Krasnoyarsk, Russia, 2018; pp. 921–930. [Google Scholar]
  40. Megahed, G.; Elshater, A.; Afifi, S.; Elrefaie, M.A. Reconceptualizing Proximity Measurement Approaches through the Urban Discourse on the X-Minute City. Sustainability 2024, 16, 1303. [Google Scholar] [CrossRef] [Scilit]
  41. Ferrer-Ortiz, C.; Marquet, O.; Mojica, L.; Vich, G. Barcelona under the 15-minute city Lens: Mapping the accessibility and proximity potential based on pedestrian travel times. Smart Cities 2022, 5, 146–161. [Google Scholar] [CrossRef] [Scilit]
  42. Elshater, A.; Abusaada, H.; Tarek, M.; Afifi, S. Designing the socio-spatial context urban infill, liveability, and conviviality. Built Environ. 2022, 48, 341–363. [Google Scholar] [CrossRef] [Scilit]
  43. Handy, S.; Clifton, K. Local shopping as a strategy for reducing automobile travel. Transportation 2001, 28, 317–346. [Google Scholar] [CrossRef] [Scilit]
  44. Hines, C. Localization: A Global Manifesto; Earthscan: London, UK, 2000. [Google Scholar]
  45. Bissell, D. Thinking habits for uncertain subjects: Movement, stillness, susceptibility. Environ. Plan. A 2011, 43, 2649–2665. [Google Scholar] [CrossRef] [Scilit]
  46. Bissell, D.; Fuller, G. Stillness in a Mobile World; Routledge: London, UK, 2013. [Google Scholar]
  47. Cresswell, T. Mobilities II: Still. Prog. Hum. Geogr. 2012, 36, 645–653. [Google Scholar] [CrossRef] [Scilit]
  48. Alfonzo, M.A. To walk or not to walk? The hierarchy of walking needs. Environ. Behav. 2005, 37, 808–836. [Google Scholar] [CrossRef] [Scilit]
  49. Bergmann, S.; Tore, S. In between standstill and hypermobility: Introductory remarks to a broader discourse. In The Ethics of Mobilities: Rethinking Place, Exclusion, Freedom and Environment; Bergmann, S., Sager, T., Eds.; Ashgate: Aldershot, UK, 2008; pp. 1–9. [Google Scholar]
  50. Pink, S. Sense and sustainability: The case of the Slow City movement. Local Environ. 2008, 13, 95–106. [Google Scholar] [CrossRef] [Scilit]
  51. Ferreira, A.; Bertolini, L.; Næss, P. Immotility as resilience? A key consideration for transport policy and research. Appl. Mobilities 2017, 2, 16–31. [Google Scholar] [CrossRef] [Scilit]
  52. Kesselring, S. The mobile risk society. In Tracing Mobilities: Towards a Cosmopolitan Perspective; Canzler, W., Kaufmann, V., Kesselring, S., Eds.; Ashgate: Aldershot, UK, 2008; pp. 77–102. [Google Scholar]
  53. Rosa, H. Social Acceleration: A New Theory of Modernity; Columbia University Press: New York, NY, USA, 2015. [Google Scholar]
  54. Pozoukidou, G.; Chatziyiannaki, Z. 15-Minute City: Decomposing the New Urban Planning Eutopia. Sustainability 2021, 13, 2. [Google Scholar] [CrossRef] [Scilit]
  55. Champlin, C.; Sirenko, M.; Comes, T. Measuring social resilience in cities: An exploratory spatio-temporal analysis of activity routines in urban spaces during COVID-19. Cities 2023, 135, 104220. [Google Scholar] [CrossRef] [Scilit] [PubMed]
  56. Levine, J.; Grengs, J.; Shen, Q.; Shen, Q. Does accessibility require density or speed? A comparison of fast versus close in getting where you want to go in US metropolitan regions. J. Am. Plan. Assoc. 2012, 78, 157–172. [Google Scholar] [CrossRef] [Scilit]
  57. Silva, C.; Büttner, B.; Seisenberger, S.; Rauli, A. Proximity-centred accessibility—A conceptual debate involving experts and planning practitioners. J. Urban Mobil. 2023, 4, 100060. [Google Scholar] [CrossRef] [Scilit]
  58. Jian, I.Y.; Luo, J.; Chan, E.H.W. Spatial justice in public open space planning: Accessibility and inclusivity. Habitat Int. 2020, 97, 102122. [Google Scholar] [CrossRef] [Scilit]
  59. King, D.; Krizek, K. The power of reforming streets to boost access for human-scaled vehicles. Transp. Res. Part D 2020, 83, 102336. [Google Scholar] [CrossRef] [Scilit]
  60. Lanza, G.; Pucci, P.; Carboni, L. Planning for a fair and resilient city. An Inclusive Accessibility by Proximity index. Transp. Res. Procedia 2025, 82, 2089–2108. [Google Scholar] [CrossRef] [Scilit]
  61. Zhang, W.; Zhao, Y.; Cao, X.; Lu, D.; Chai, Y. Nonlinear effect of accessibility on car ownership in Beijing: Pedestrian-scale neighborhood planning. Transp. Res. Part D Transp. Environ. 2020, 86, 102445. [Google Scholar] [CrossRef] [Scilit]
  62. Biloria, N.; Reddy, P.; Fatimah, Y.A.; Mehta, D. Urban wellbeing in the contemporary city. In Data-Driven Multivalence in the Built Environment; Springer: Berlin/Heidelberg, Germany, 2020; pp. 317–335. [Google Scholar]
  63. Ettema, D.; Schekkerman, M. How do spatial characteristics influence wellbeing and mental health? Comparing the effect of objective and subjective characteristics at different spatial scales. Travel Behav. Soc. 2016, 5, 56–67. [Google Scholar] [CrossRef] [Scilit]
  64. O’Sullivan, F. Paris Mayor: It’s Time for a “15-Minute City”. Bloomberg CityLab. 18 February 2020. Available online: https://www.bloomberg.com/news/articles/2020-02-18/paris-mayor-pledges-a-greener-15-minute-city (accessed on 10 December 2025).
  65. Sevtsuk, A. Estimating Pedestrian Flows on Street Networks: Revisiting the Betweenness Index. J. Am. Plan. Assoc. 2021, 87, 512–526. [Google Scholar] [CrossRef] [Scilit]
  66. Logan, T.M.; Guikema, S.D. Reframing Resilience: Equitable Access to Essential Services. Risk Anal. 2020, 40, 1538–1553. [Google Scholar] [CrossRef] [Scilit]
  67. Doorn, N.; Gardoni, P.; Murphy, C. A multidisciplinary definition and evaluation of resilience: The role of social justice in defining resilience. Sustain. Resilient Infrastruct. 2018, 4, 112–123. [Google Scholar] [CrossRef] [Scilit]
  68. Yasin, H.; Mohíno, I.; Carpio-Pinedo, J. Exploring the Relationship Between 15 Minute Access and Life Satisfaction. Land 2025, 14, 2259. [Google Scholar] [CrossRef] [Scilit]
  69. Allam, Z.; Chabaud, D.; Gall, C.; Pratlong, F.; Moreno, C. (Eds.) On Proximity-Based Dimensions and Urban Planning: Historical Precepts to the 15-Minute City, Chapter 7. In Resilient and Sustainable Cities; Elsevier: Amsterdam, The Netherlands, 2023; pp. 107–119. [Google Scholar] [CrossRef] [Scilit]
  70. Peng, C.; Yip, P. Access to Neighbourhood Services and Subjective Poverty in Hong Kong. Appl. Res. Qual. Life 2023, 18, 1015–1035. [Google Scholar] [CrossRef] [Scilit]
  71. Chiaradia, F.; Lelo, K.; Monni, S.; Tomassi, F. The 15-Minute City: An Attempt to Measure Proximity to Urban Services in Rome. Sustainability 2024, 16, 9432. [Google Scholar] [CrossRef] [Scilit]
  72. Bouzouina, L.; Kourtit, K.; Nijkamp, P. 15-Minute Cities: Sustainable Mobility and Urban Livability; Springer: Berlin/Heidelberg, Germany, 2026. [Google Scholar]
  73. Lewicka, M. What Makes Neighborhood Different from Home and City? Effects of Place Scale on Place Attachment. J. Environ. Psychol. 2010, 30, 35–51. [Google Scholar] [CrossRef] [Scilit]
  74. Johnston, R.; Jones, K.; Burgess, S.; Propper, C.; Sarker, R.; Bolster, A. Scale, Factor Analyses, and Neighborhood Effects. Geogr. Anal. 2004, 36, 350–368. [Google Scholar] [CrossRef]
  75. Larimian, T.; Freeman, C.; Palaiologou, F.; Sadeghi, N. Urban Social Sustainability at the Neighbourhood Scale: Measurement and the Impact of Physical and Personal Factors. Local Environ. 2020, 25, 747–764. [Google Scholar] [CrossRef] [Scilit]
  76. Capasso Da Silva, D.; King, D.A.; Lemar, S. Accessibility in Practice: 20-Minute City as a Sustainability Planning Goal. Sustainability 2020, 12, 129. [Google Scholar] [CrossRef] [Scilit]
  77. Logan, T.M.; Hobbs, M.H.; Conrow, L.C.; Reid, N.L.; Young, R.A.; Anderson, M.J. The X-Minute City: Measuring the 10, 15, 20-Minute City and an Evaluation of Its Use for Sustainable Urban Design. Cities 2022, 131, 103924. [Google Scholar] [CrossRef] [Scilit]
  78. Knap, E.; Ulak, M.B.; Geurs, K.T.; Mulders, A.; van der Drift, S. A Composite X-Minute City Cycling Accessibility Metric and Its Role in Assessing Spatial and Socioeconomic Inequalities: A Case Study in Utrecht, The Netherlands. J. Urban Mobil. 2023, 3, 100043. [Google Scholar] [CrossRef] [Scilit]
  79. Abbar, S.; Zanouda, T.; Borge-Holthoefer, J. Robustness and Resilience of Cities Around the World. arXiv 2016, arXiv:1608.01709. Available online: https://arxiv.org/pdf/1608.01709 (accessed on 20 January 2026). [CrossRef] [Scilit]
  80. Abbiasov, T.; Heine, C.; Glaeser, E.; Ratti, C.; Sabouri, S.; Salazar-Miranda, A.; Santi, P. The 15-Minute City Quantified Using Mobility Data. arXiv 2022, arXiv:2211.14872. Available online: https://arxiv.org/pdf/2211.14872 (accessed on 20 January 2026). [CrossRef] [Scilit]
  81. Slingerland, G.; Edua-Mensah, E.; Van Gils, M.; Kleinhans, R.; Brazier, F. We’re in this together: Capacities and relationships to enable community resilience. Urban Res. Pract. 2023, 16, 418–437. [Google Scholar] [CrossRef] [Scilit]
  82. Levasseur, M.; Généreux, M.; Bruneau, J.F.; Vanasse, A.; Chabot, É.; Beaulac, C.; Bédard, M.-M. Importance of Proximity to Resources, Social Support, Transportation, and Neighborhood Security for Mobility and Social Participation in Older Adults: Results from a Scoping Study. BMC Public Health 2015, 15, 503. [Google Scholar] [CrossRef] [Scilit]
  83. Atkinson, S.; Bagnall, A.M.; Corcoran, R.; South, J.; Curtis, S. Being Well Together: Individual Subjective and Community Wellbeing. J. Happiness Stud. 2020, 21, 1903–1921. [Google Scholar] [CrossRef] [Scilit] [PubMed]
  84. Mouratidis, K. Urban Planning and Quality of Life: A Review of Pathways Linking the Built Environment to Subjective Well-being. Cities 2021, 115, 103229. [Google Scholar] [CrossRef] [Scilit]
  85. Lee, C.; Choi, S.; Yoon, J. The Influence of Access to Urban Amenities on Urban Environment Satisfaction: A Case Study of Four New Towns in the Vicinity of Seoul, South Korea. Appl. Res. Qual. Life 2023, 18, 3111–3139. [Google Scholar] [CrossRef] [Scilit]
  86. Feeney, B.C.; Collins, N.L. A new look at social support: A theoretical perspective on thriving through relationships. Pers. Soc. Psychol. Rev. 2015, 19, 113–147. [Google Scholar] [CrossRef] [Scilit]
  87. Kourtit, K.; Nijkamp, P.; Östh, J.; Türk, U. A Digital ‘Smiley’ Analysis of the Appreciation for Tourist Amenities by Visitors to London. Appl. Res. Qual. Life 2025, 21, 329–352. [Google Scholar] [CrossRef] [Scilit]
  88. Horner, M.W. Exploring Metropolitan Accessibility and Urban Structure. Urban Geogr. 2004, 25, 264–284. [Google Scholar] [CrossRef] [Scilit]
  89. Weber, J.; Kwan, M.-P. Evaluating the Effects of Geographic Contexts on Individual Accessibility: A Multilevel Approach1. Urban Geogr. 2003, 24, 647–671. [Google Scholar] [CrossRef] [Scilit]
  90. Lydon, M.; Garcia, A. Tactical Urbanism: Short-Term Action for Long-Term Change; The Streets Plans Collaborative, Inc.: South Miami, FL, USA, 2015. [Google Scholar]
  91. Rauws, W.; De Roo, G. Adaptive Planning: Generating Conditions for Urban Adaptability: Lessons from Dutch Organic Development Strategies. Environ. Plan. B Urban Anal. City Sci. 2016, 43, 1052–1074. [Google Scholar] [CrossRef] [Scilit]
  92. Silva, P. Tactical Urbanism: Towards an Evolutionary Cities’ Approach? Environ. Plan. B Urban Anal. City Sci. 2016, 43, 1040–1051. [Google Scholar] [CrossRef] [Scilit]
  93. Tricarico, L.; De Vidovich, L. Proximity and Post-COVID-19 Urban Development: Reflections from Milan, Italy. J. Urban Manag. 2021, 3, 302–310. [Google Scholar] [CrossRef] [Scilit]
  94. Provitolo, D. Resiliencery Vulnerability Notion—Looking in Another Direction in Order to Study Risks and Disasters. In Resilience and Urban Risk Management; Serre, D., Barocca, B., Laganier, R., Eds.; CRC Press: Boca Raton, FL, USA, 2013; p. 192. [Google Scholar]
  95. Bănică, A.; Muntele, I. Urban vulnerability and resilience in post-communist Romania (comparative case studies of Iași and Bacău cities and metropolitan areas). Carpathian J. Earth Environ. Sci. 2015, 10, 159–171. Available online: https://www.cjees.ro/viewTopic.php?topicId=584 (accessed on 20 January 2026).
  96. Phua, S.Z.; Hofmeister, M.; Tsai, Y.-K.; Peppard, O.; Lee, K.F.; Courtney, S.; Mosbach, S.; Akroyd, J.; Kraft, M. Fostering urban resilience and accessibility in cities: A dynamic knowledge graph approach. Sustain. Cities Soc. 2024, 113, 105708. [Google Scholar] [CrossRef] [Scilit]
  97. Wang, X.; Yu, C.; Gou, B.; Lau, S.S.Y. Resilience-Oriented Study on Pedestrian Accessibility Between Subway Stations and Commercial Complexes in Cities. Land 2026, 15, 266. [Google Scholar] [CrossRef] [Scilit]
  98. Pascariu, G.C.; Banica, A.; Nijkamp, P. A Meta-Overview and Bibliometric Analysis of Resilience in Spatial Planning—The Relevance of Place-Based Approaches. Appl. Spat. Anal. Policy 2023, 16, 1097–1127. [Google Scholar] [CrossRef] [Scilit]
  99. Kourtit, K.; Nijkamp, P. The Corona Dashboard in Context (‘Dutchboard’). Scholarly Community Encyclopedia. 2023. Available online: https://encyclopedia.pub/entry/20078 (accessed on 11 February 2026).
  100. Losasso, M. Urban Regeneration: Innovative Perspectives. TECHNE J. Technol. Archit. Environ. 2015, 10, 4–5. [Google Scholar] [CrossRef] [Scilit]
  101. Romero-Lankao, P.; Bulkeley, H.; Pelling, M.; Burch, S.; Gordon, D.J.; Gupta, J.; Johnson, C.; Kurian, P.; Lecavalier, E.; Simon, D.; et al. Urban Transformative Potential in a Changing Climate. Nat. Clim. Change 2018, 8, 754–756. [Google Scholar] [CrossRef] [Scilit]
  102. Wardekker, A. Resilience Principles as a Tool for Exploring Options for Urban Resilience Solutions. Solutions 2018, 9, 1–13. Available online: https://www.thesolutionsjournal.com/article/resilience-principles-tool-exploring-options-urban-resilience/ (accessed on 10 December 2025).
  103. Rojas, M.; Méndez, A.; Watkins-Fassler, K. The Hierarchy of Needs Empirical Examination of Maslow’s Theory and Lessons for Development. World Dev. 2023, 165, 106185. [Google Scholar] [CrossRef] [Scilit]
  104. Sheikh, W.T.; Van Ameijde, J. Promoting livability through urban planning: A comprehensive framework based on the “theory of human needs”. Cities 2022, 131, 103972. [Google Scholar] [CrossRef] [Scilit]
  105. Omodan, B.I.; Abejide, S.O. Reconstructing Abraham Maslow’s hierarchy of needs towards inclusive infrastructure development needs assessment. J. Infrastruct. Policy Dev. 2022, 6, 1483. [Google Scholar] [CrossRef] [Scilit]
  106. Blageanu, A.; Rosu, L. Accessibility to general amenities; determining the attractivity of metropolitan area of Iasi city. Geogr. Timisiensis 2013, 22, 39–49. [Google Scholar]
  107. Goepel, K.D. Implementation of an Online Software Tool for the Analytic Hierarchy Process (AHP-OS). Int. J. Anal. Hierarchy Process 2018, 10, 469–487. [Google Scholar] [CrossRef] [Scilit]
  108. Saaty, T.L. A scaling method for priorities in hierarchical structures. J. Math. Psychol. 1977, 15, 234–281. [Google Scholar] [CrossRef] [Scilit]
  109. OECD/European Union/EC-JRC. Handbook on Constructing Composite Indicators: Methodology and User Guide; OECD Publishing: Paris, France, 2008. [Google Scholar] [CrossRef] [Scilit]
  110. Bentlage, M.; Müller, C.; Thierstein, A. Becoming more polycentric: Public transport and location choices in the Munich Metropolitan Area. Urban Geogr. 2021, 42, 79–102. [Google Scholar] [CrossRef] [Scilit]
  111. Rey, R.; Manta, O. Rural-Urban Partnership, Challenges, and Opportunities in the Current Multi-Crisis Context. In Europe in the New World Economy: Opportunities and Challenges; Chivu, L., Ioan-Franc, V., Georgescu, G., De Los Ríos Carmenado, I., Andrei, J.V., Eds.; Springer Proceedings in Business and Economics; Springer: Cham, Switzerland, 2024. [Google Scholar] [CrossRef] [Scilit]
Figure 1. Conceptual Model of Proxilience and Superbowl Effect (Source: own design).
Land 15 00468 g001
Figure 2. Hierarchy of urban services/facilities aligned with this needs-based framework (Source: own design).
Land 15 00468 g002
Figure 3. Integrated conceptual and methodological framework of the paper (Source: own design).
Land 15 00468 g003
Figure 4. Spatial distribution of proximity services and facilities in IMA.
Land 15 00468 g004
Figure 5. Population density distribution in IMA.
Land 15 00468 g005
Figure 6. Walking distance accessibility to proximity services in core (a), peri-urban (b), and peripheral (c) areas of the IMA.
Land 15 00468 g006
Figure 7. Population pressure on (a) supermarkets and (b) pharmacies in the IMA.
Land 15 00468 g007
Figure 8. Gravitational hot and cold spots of access to services in the IMA (“Superbowl Economy” Effect).
Land 15 00468 g008
Figure 9. Components of the Proximity Index and average scores by spatial typology (urban core, peri-urban, peripheral) (Source: own calculations).
Land 15 00468 g009
Figure 10. Proximity Index results in the IMA.
Land 15 00468 g010
Figure 11. Proxilience Index results in the IMA.
Land 15 00468 g011
Figure 12. The correlation between the LHDI and proxilience index by LHDI classes.
Land 15 00468 g012
Figure 13. Out-of-bag (OOB) error rate evolution from the Random Forest model.
Land 15 00468 g013
Figure 14. Overall variable importance (Mean Decrease Accuracy) from Random Forest analysis.
Land 15 00468 g014
Table 1. Overview of selected indicators, time periods, descriptions, and sources.
IndicatorYear/PeriodDescription/UnitSourcesVulnerabilities (V)/Opportunities (O)
Vulnerability–Opportunity indicators
Population density (DENS)2022Population density on 1 July 2020National Institute of Statistics of RomaniaO for interaction, V at very high or very low values
Urbanisation degree (URBANIZ)2022The share of employees in non-agricultural activities from the total number in 2020 (%)National Institute of Statistics of RomaniaUsually higher O, but also V to specific crises
Attractivity (ATRACTIV)2002–2022The migratory rate in the last two decadesNational Institute of Statistics of RomaniaShows O, but creating V above certain values or when not properly planned
Income (INCOME)2022Estimated income by reference to the employed population and the average income by category of employees in 2020, the average incomes of pensioners and beneficiaries of social allowancesNational Institute of Statistics of RomaniaO and resilience capacity
Share of the ageing population (AGED)2022Ageing index on 1 July 2020 (+65 years/0–14 years)National Institute of Statistics of RomaniaV at high values—inverted in the index
Share of the disabled population (DISAB)2018The share of the population with learning disabilitiesRomanian Urban PolicyV at high values—inverted in the index
Share of the educated population (EDUC)2022The share of the population with secondary and higher educationNational Institute of Statistics of RomaniaO and resilience capacity
Health staff
(HEALTHSTAFF)
2022The average number of health personnel per 100,000 inhabitants in 2020National Institute of Statistics of RomaniaO and resilience capacity
The density of housing (HOUSE)2022Number of sqm per inhabitant in residential buildingsNational Institute of Statistics of RomaniaShows O, but creating V if not properly planned
Normalised Difference Vegetation Index (NDVI)2022–2024Quantifies the health and density of vegetation using sensor data.Copernicus Sentinel images with a spatial resolution of 10 mO and resilience capacity
Air pollution (POLUT)2018–2022Air pollution with PM10 and PM2.5—extrapolated data from the monitoring stationEuropean Environmental AgencyV at high values—inverted in the index
Access to a national road (NAT_ROAD)2018The accessibility of metropolitan localities to a national roadRomanian Urban PolicyO and resilience capacity
Access to all facilities in 15 min (FACILITIES)2022
(2025)
The standardised average number of facilities to access within 15 min at the commune levelGoogle Maps processed in ArcGIS Pro 3.4.0O and resilience capacity
Quality of Life (QoL) proxies
Local Human Development Index (LHDI)2022It is a measure of the level of human development for Romanian communes in 2018. The closer these values are to 100, the more developed the locality is, richer in stocks of human, material, and health capital. Values close to zero indicate poverty.Directorate for Personal Records and Database Administration.O and resilience capacity
Life expectancy at 65 years (LIFE_EXPEC65)2022Calculated as the average number of years a person would have to live at age 65, if they lived under the age-specific mortality conditions of the reference period of the mortality table.National Institute of StatisticsO and resilience capacity
Local Material Capital (L_MAT_CAP)2022Factor score for material capital, standardized mortality rate, and internet penetration rate through fixed lines, in households. Romanian Urban Policy
2011, 2021 Population Census
O and resilience capacity
Table 2. AHP—resulting weights.
Category IDCategoryPriorityRank(+)(−)
1Physiological46.7%17.0%7.0%
2Safety27.7%23.5%3.5%
3Social16.0%32.2%2.2%
4Self-actualization and Esteem9.5%41.5%1.5%
Number of comparisons = 6; Consistency Ratio (CR) = 1.1%; Principal eigen value = 4.031; Eigenvector solution: 4 iterations, delta = 4.3 × 10⁻¹⁰.
Disclaimer/Publisher’s Note: The statements, opinions and data contained in all publications are solely those of the individual author(s) and contributor(s) and not of MDPI and/or the editor(s). MDPI and/or the editor(s) disclaim responsibility for any injury to people or property resulting from any ideas, methods, instructions or products referred to in the content.