


Abstract
Extreme rainfall events can trigger widespread landsliding and fluvial erosion, exerting a disproportionate influence on sediment production and landscape evolution in mountainous watersheds. However, hillslope–channel coupling during individual extreme events remains poorly quantified due to the scarcity of event-scale topographic observations. This study investigates event-scale hillslope–channel coupling by quantifying landslide-driven hillslope erosion and channel incision associated with Typhoon Morakot (2009) in the Sinwulu River watershed, southeastern Taiwan. High-resolution pre- and post-event digital surface models (DSMs) were reconstructed using an aerial structure-from-motion multi-view stereo (SfM–MVS) photogrammetry workflow and corrected for canopy height to derive meter-scale topographic changes. Hillslope and channel domains were delineated, and linked hillslope–channel units were used to examine spatial relationships between erosion processes and topographic and hydraulic factors. Results indicate that landslide erosion dominated sediment production during the event with watershed-average erosion of 544.35 mm, while channel responses exhibited strong spatial contrasts, with pronounced incision in upstream reaches and substantial deposition downstream of major knickpoints. Event-scale analysis provides evidence for a strong correspondence between channel incision and hillslope landslide erosion, whereas correlations with commonly used hydraulic proxies such as unit stream power are comparatively weaker. These findings highlight the value of event-scale topographic measurements for elucidating transient hillslope–channel coupling processes during extreme rainfall events.
1. Introduction
Extreme precipitation events play a critical role in driving geomorphic and hydrological adjustments within mountainous watersheds globally. Under the influence of global climate change, the frequency and intensity of these extreme events are projected to increase significantly [1]. Infrequent high-magnitude events often dominate the long-term evolution of landscapes by triggering widespread erosion and massive sediment production [2,3,4]. These events can rapidly transform channel morphology through significant aggradation, migration, expansion, and narrowing [5,6,7,8,9], leading to cascading impacts such as accelerated reservoir sedimentation and exacerbated downstream flooding risks [10,11,12]. Consequently, a single extreme event can leave a long-lasting geomorphic legacy, determining the trajectory of river recovery and sediment export for decades [13,14]. For instance, landslide erosion triggered by Typhoon Morakot was equivalent to 22–24 years of decadal basin-averaged erosion [4], generating an extreme sediment pulse that increased sediment discharge by more than 10-fold, with observed yields reaching 2.1 to 222 times pre-event median levels [15].
During extreme precipitation events, large volumes of sediment are rapidly mobilized by landslides on hillslopes and delivered into river channels, while concurrent flood flows promote both lateral erosion of channel banks and vertical incision of the riverbed [16,17]. Such fluvial erosion can undercut hillslope toes, reduce basal support, and further destabilize adjacent slopes, forming strong feedbacks between hillslope failure and channel adjustment [2,18]. These coupled processes operate over short timescales during extreme events, yet they can exert a first-order control on sediment redistribution and geomorphic change at the catchment scale. Consequently, understanding hillslope–channel interactions is essential for interpreting how mountainous watersheds respond to extreme rainfall events.
Previous studies explored hillslope–channel coupling primarily at watershed or regional scales by estimating landslide erosion rates from landslide inventories and volume–area relationships [17,19], providing valuable insights into hillslope processes. However, quantitative measurements of channel incision are relatively scarce, and many studies focus on observations at individual hillslopes or channel reaches [18]. At broader scales, river incision is commonly inferred using hydraulic proxies such as unit stream power [17,19] or reconstructed from river terraces over geological timescales [20,21]. While these approaches are well suited for assessing long-term river incision and landscape evolution, they offer limited insight into direct, event-scale fluvial erosion processes during individual extreme rainfall events. As a result, the mechanisms and spatial expression of hillslope–channel coupling at the watershed scale during individual extreme events remain insufficiently quantified.
High-resolution digital elevation models (DEMs) enable direct quantification of hillslope and channel topographic changes before and after rainfall events at the watershed scale [22]. Airborne LiDAR provides highly accurate DEMs [23,24] but has only been widely available over the past one to two decades, and its relatively high acquisition costs often limit temporal resolution, making it difficult to capture topographic responses to past extreme rainfall events. In contrast, aerial photogrammetry offers a cost-effective alternative with extensive historical image archives that potentially cover pre- and post-event conditions; however, traditional stereo-derived digital surface models (DSMs) have been constrained by lower accuracy, geometric distortions from film scanning [25], dependence on ground control points (GCPs), and difficulties in accounting for vegetation effects [14]. Recent advances in structure-from-motion multi-view stereo (SfM–MVS) photogrammetry [7,14,26,27,28], point-cloud filtering [29,30], and DEM alignment algorithms [28,31,32] have substantially reduced these limitations, enabling the construction of multi-temporal topographic datasets and providing new opportunities to investigate event-scale geomorphic responses, including landslide evolution [33,34,35,36], channel morphology change [7,37], and debris-flow dynamics [14,38].
To address this gap, this study investigates hillslope–channel coupling at the event scale by quantifying both hillslope landslide erosion and channel incision associated with a single extreme rainfall event, Typhoon Morakot in 2009, in Taiwan. We used a high-resolution aerial SfM–MVS photogrammetry workflow to reconstruct pre- and post-event digital surface models (DSMs), combined with canopy-height correction, to quantify topographic changes on both hillslopes and channels within the Sinwulu River watershed. By further delineating linked hillslope–channel units, this study enables a spatially explicit comparison between landslide-driven hillslope erosion and channel incision within a unified geomorphic framework. This event-based approach provides direct measurements of incision and erosion generated during an extreme rainfall event, offering new insights into the transient coupling between hillslope and fluvial processes under high-magnitude rainfall conditions.
2. Materials and Methods
2.1. Study Area
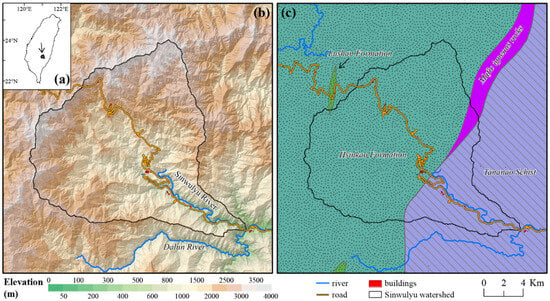
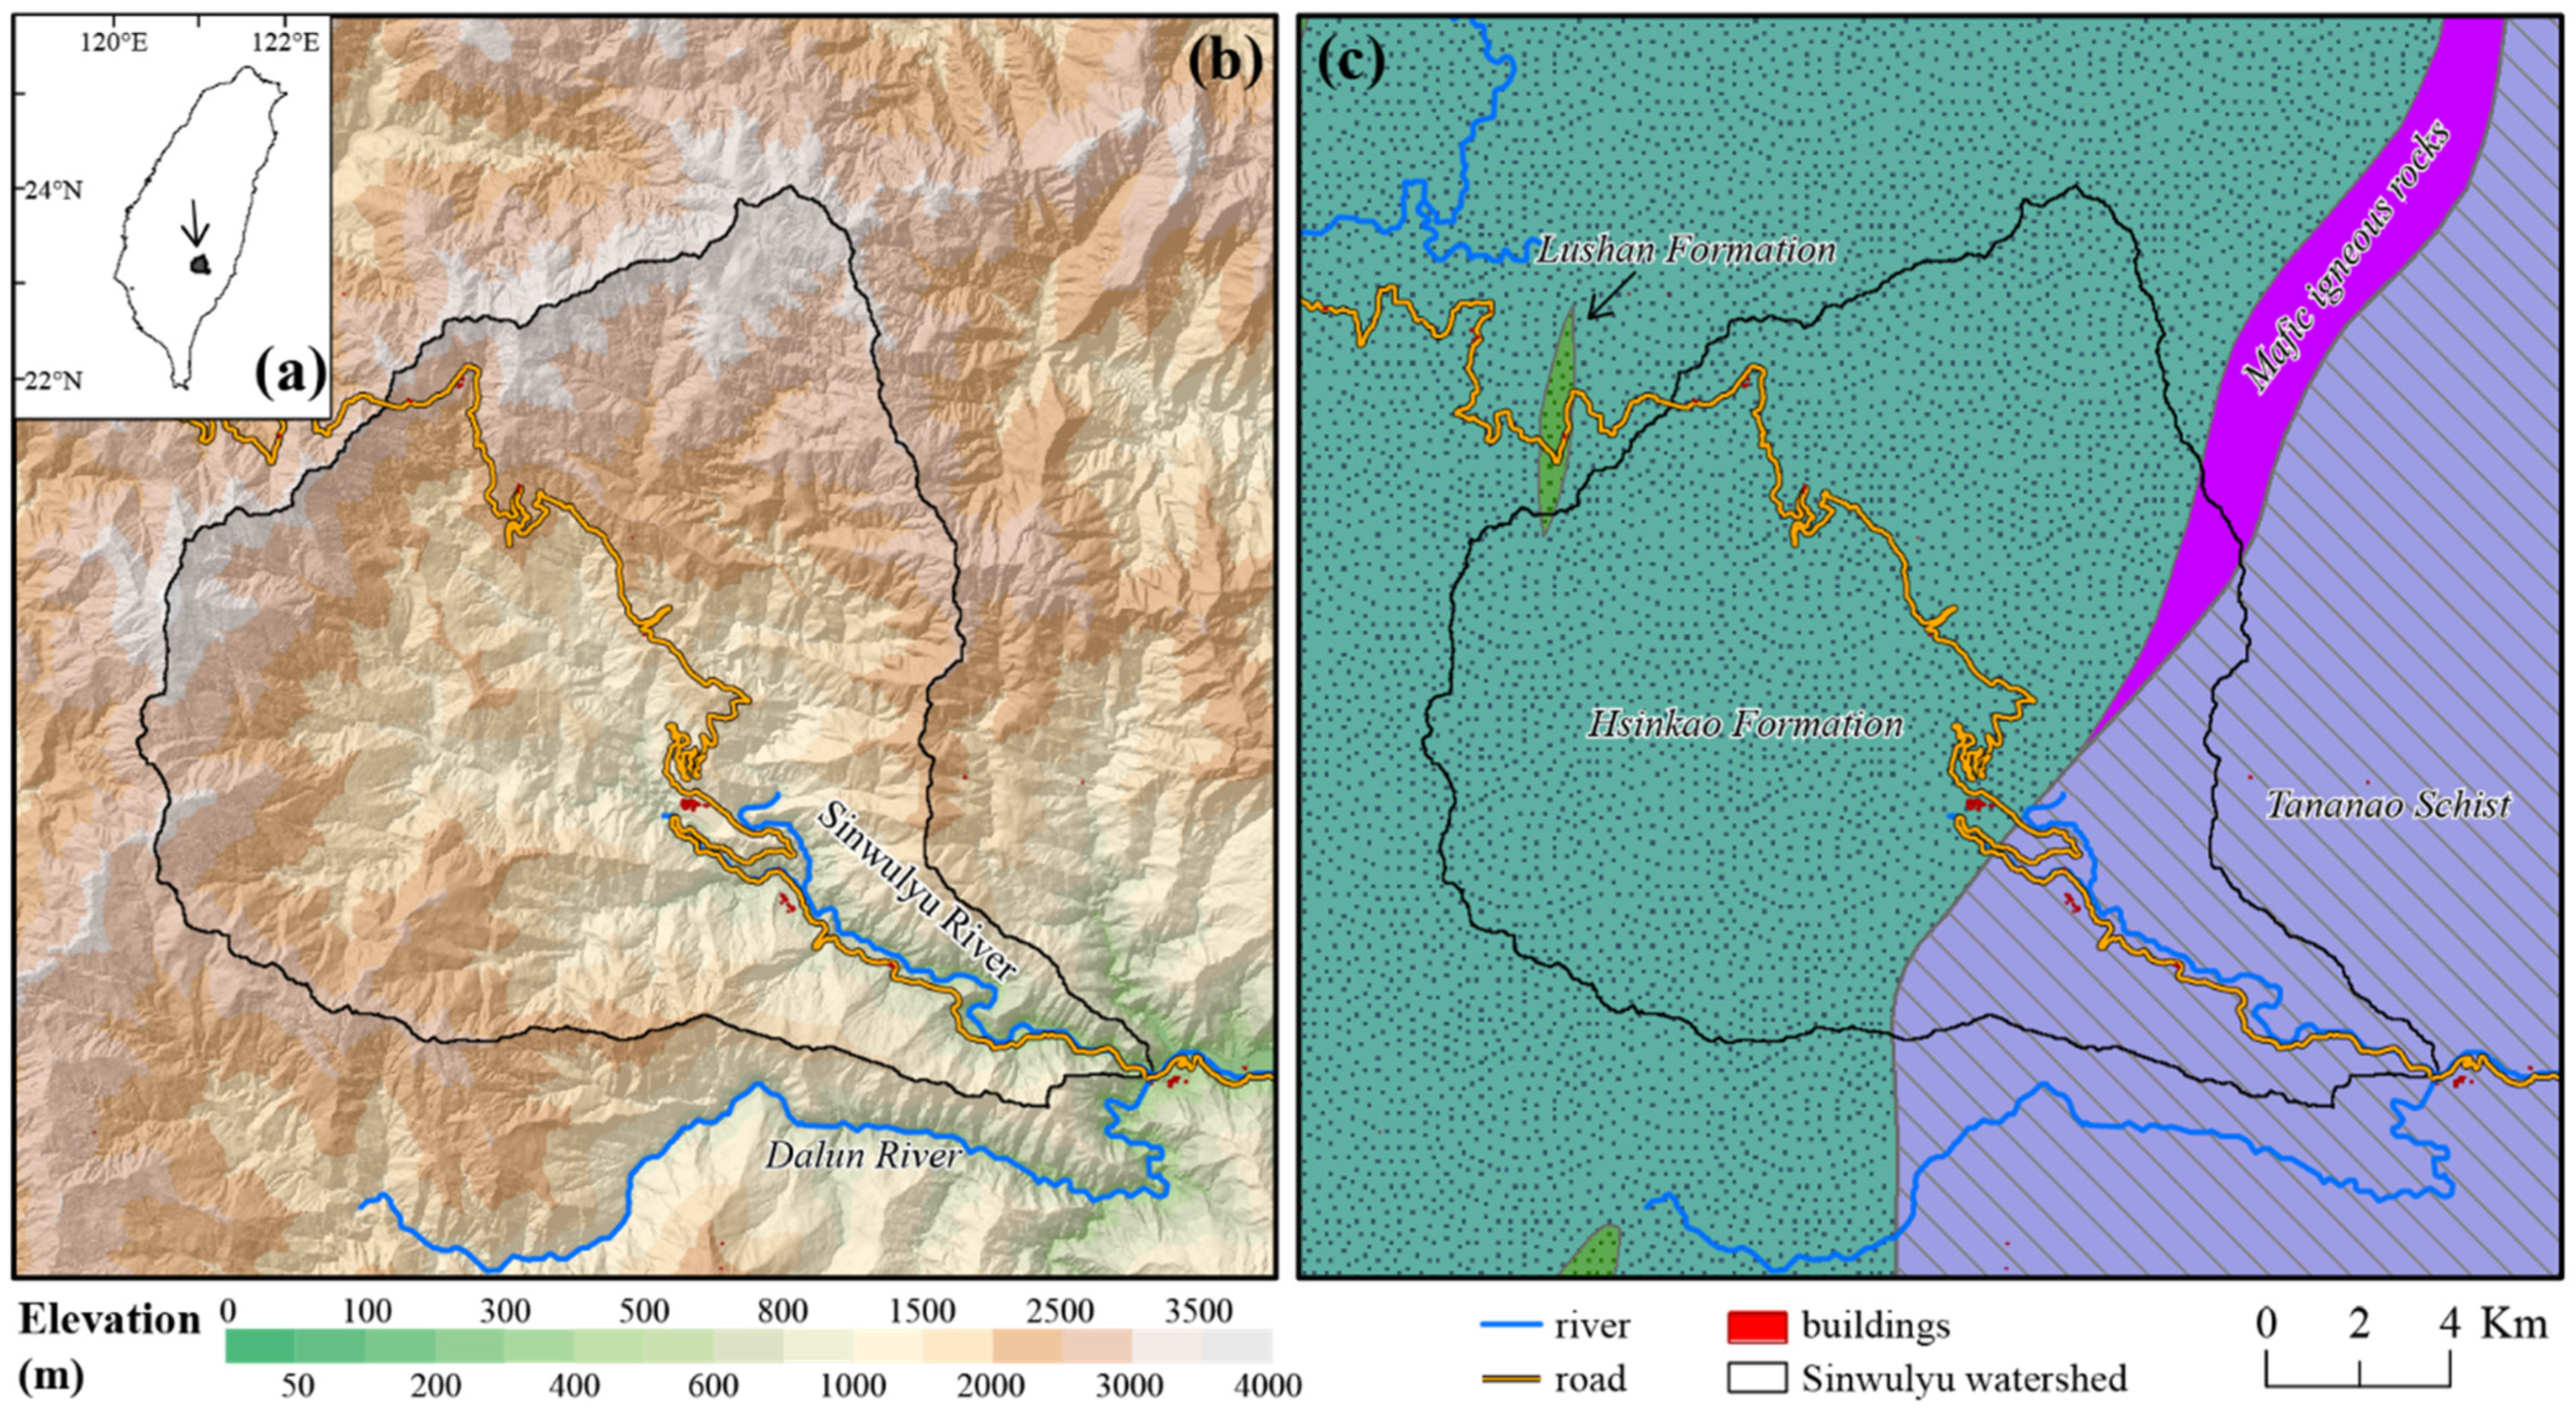
The Sinwulu River watershed is located on the eastern flank of the Central Range in Taiwan (Figure 1a) and covers an area of approximately 247 km2. The Sinwulu River is a tributary of the Beinan River. It originates near Mt. Guanshan in the Central Mountain Range (3668 m a.s.l.) and flows ~37 km downstream to the watershed outlet at Xinwulu Bridge (367 m a.s.l.), where it converges with the Dalun River (Figure 1b). The watershed is predominantly covered by primary forest and contains a largely natural river system with minimal engineered structures. The Southern Cross-Island Highway traverses the northern part of the watershed, and settlements are mainly distributed along the highway corridor.
Figure 1.
(a) Location of the study area. (b) Topography and (c) lithology of the Sinwulu River watershed, southeastern Taiwan.
Geologically, the western part of the watershed is underlain by Hsinkao Formation, consisting of slate and phyllite with an average uniaxial compressive strength of approximately 29 MPa. The southeastern part is composed of Tananao Schist, which is relatively stronger with a compressive strength of 73–87 MPa (Figure 1c) [39]. The regional structural grain is characterized by discontinuities striking NE–SW and dipping 35–70° toward the SE. This alignment creates prominent dip slopes on southeast-facing hillslopes, particularly in the western domain where the lithology is mechanically weaker [39]. During 1979–2005, the mean annual sediment yield was estimated to be ~7.8–15.2 Mt/year. Sediment export from the watershed is strongly episodic and is largely concentrated during typhoon-driven extreme rainfall events in the summer season. Individual typhoon events accounted for approximately 6.6% to 25.3% of the annual sediment load [39]. The basin-averaged erosion rate inferred from sediment yield was estimated to be 6.6 mm yr−1 during 1970–1999 [20], and increased by a factor of 2.58 following the 1999 Chi-Chi earthquake (Mw 7.6) [39]. In addition, the watershed experiences rapid tectonic uplift, with reported uplift rates of ~10–20 mm yr−1 [40]. The rapid uplift promotes active channel incision into previously deposited valley fills, leaving gravel terraces tens of meters above the modern channel. These terraces record repeated cycles of major aggradation followed by renewed incision.
Typhoon Morakot affected Taiwan between 7 and 10 August 2009 and produced exceptionally intense rainfall over the island. Cumulative precipitation reached an unprecedented total of 3059 mm at the Mount Ali rain gauge, representing the highest rainfall recorded for a single typhoon event in Taiwan. Rainfall intensity increased markedly as Morakot approached southern Taiwan, when persistent southwesterly moisture transport interacted with the Central Mountain Range, resulting in strong orographic enhancement of precipitation [41,42]. The prolonged and spatially concentrated rainfall generated widespread geomorphic disturbances, including extensive landsliding and debris-flow activity [12,43,44,45,46,47]. Within the Sinwulu River watershed, maximum 24-h rainfall exceeded approximately 1000 mm in upstream areas and decreased progressively downstream to about 400 mm, leading to numerous slope failures and debris flows that caused severe disruption to transportation routes crossing the watershed.
2.2. Development of DSM from Aerial Photogrammetry
To reconstruct topography before and after Typhoon Morakot, we generated high-resolution historical digital surface models (DSMs) using a digital aerial photogrammetry workflow based on SfM–MVS. Aerial photographs covering the study area were purchased from the Taiwan’s Aerial Survey and Remote Sensing Branch (ASRSB). Among the available imagery, Digital Mapping Camera (DMC) imagery provides superior radiometric quality and negligible geometric distortion [48], and is therefore well suited for producing high-accuracy DSMs and orthophotos [14]. The DMC images have an effective size of 7680 × 13,824 pixels and include RGB and near-infrared (NIR) bands. The forward overlap exceeds 60% along flight lines and the side overlap exceeds 35% between adjacent flight lines, providing sufficient stereo coverage for DSM and orthophoto generation.
Two aerial imagery datasets were used to reconstruct pre- and post-Morakot topography (Table 1). The pre-Morakot dataset includes 168 images acquired between 2007 and 2009, whereas the post-Morakot dataset consists of 179 images acquired between 2010 and 2015. Because the Sinwulu River watershed is large, has strong relief, and is frequently affected by cloud and fog, no single aerial survey provided complete coverage of the watershed. We therefore combined images from several post-event surveys (2010, 2011, 2013, and 2015) to cover the main landslide-affected areas. Topographic changes during 2010–2015 were assumed to be small relative to the Morakot-induced disturbance, allowing these images to be co-registered and processed together. Overall, the pre- and post-event datasets cover most of the watershed, although a few areas remain unmapped due to persistent data gaps.
Table 1.
Ground sampling distance (GSD) and positional accuracy (RMSE) of the pre- and post-Morakot SfM–MVS photogrammetry products. RMSE values are reported for the east (E), north (N), and vertical (H) components.
We processed historical DMC aerial imagery in Pix4Dmapper (Version 4.7.5, Pix4D SA, Lausanne, Switzerland) to generate pre- and post-Morakot DSMs and orthophotos. For each dataset, the camera focal length and exterior orientation parameters (camera position and attitude) provided by the ASRSB were used as initial inputs for image alignment. The workflow then proceeded with SfM-based feature matching and bundle adjustment constrained by GCPs, followed by MVS-based dense point-cloud reconstruction and rasterization to DSMs and orthophotos (RGB and NIR).
To evaluate model accuracy, we surveyed 52 stable ground features across the Sinwulu River watershed (e.g., road markings, intersections, and school playground corners) using GPS-RTK. The measurement accuracy was ~2 cm in the horizontal and ~3 cm in the vertical direction (RMSE). Among the surveyed points, 15 were used as GCPs for georeferencing, and the remaining 37 points were treated as independent check points (ICPs) to quantify horizontal and vertical errors.
The accuracy assessment of the SfM–MVS products is summarized in Table 1. The pre-Morakot DSM has a ground sampling distance (GSD) of 0.359 m. We resampled the DSMs to a 1 m resolution for further analysis. The accuracy of the pre- and post-event DSMs was assessed using GCPs and independent check points (IGCs). For the pre-Morakot DSM, the root mean square errors (RMSEs) of the GCPs are 0.833 m in the east (E), 0.188 m in the north (N), and 0.108 m in height (H), while the corresponding IGC RMSEs are 0.278 m (E), 0.225 m (N), and 0.993 m (H). The post-Morakot DSM has a ground sampling distance (GSD) of 0.354 m. Its GCP RMSEs are 0.039 m (E), 0.003 m (N), and 0.179 m (H), and the IGC RMSEs are 1.467 m (E), 0.854 m (N), and 0.390 m (H).
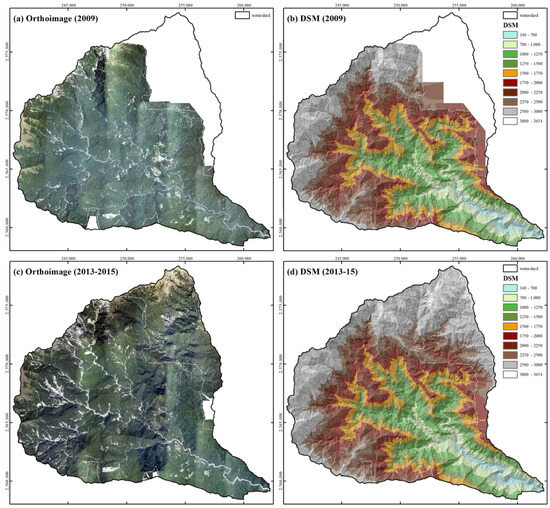
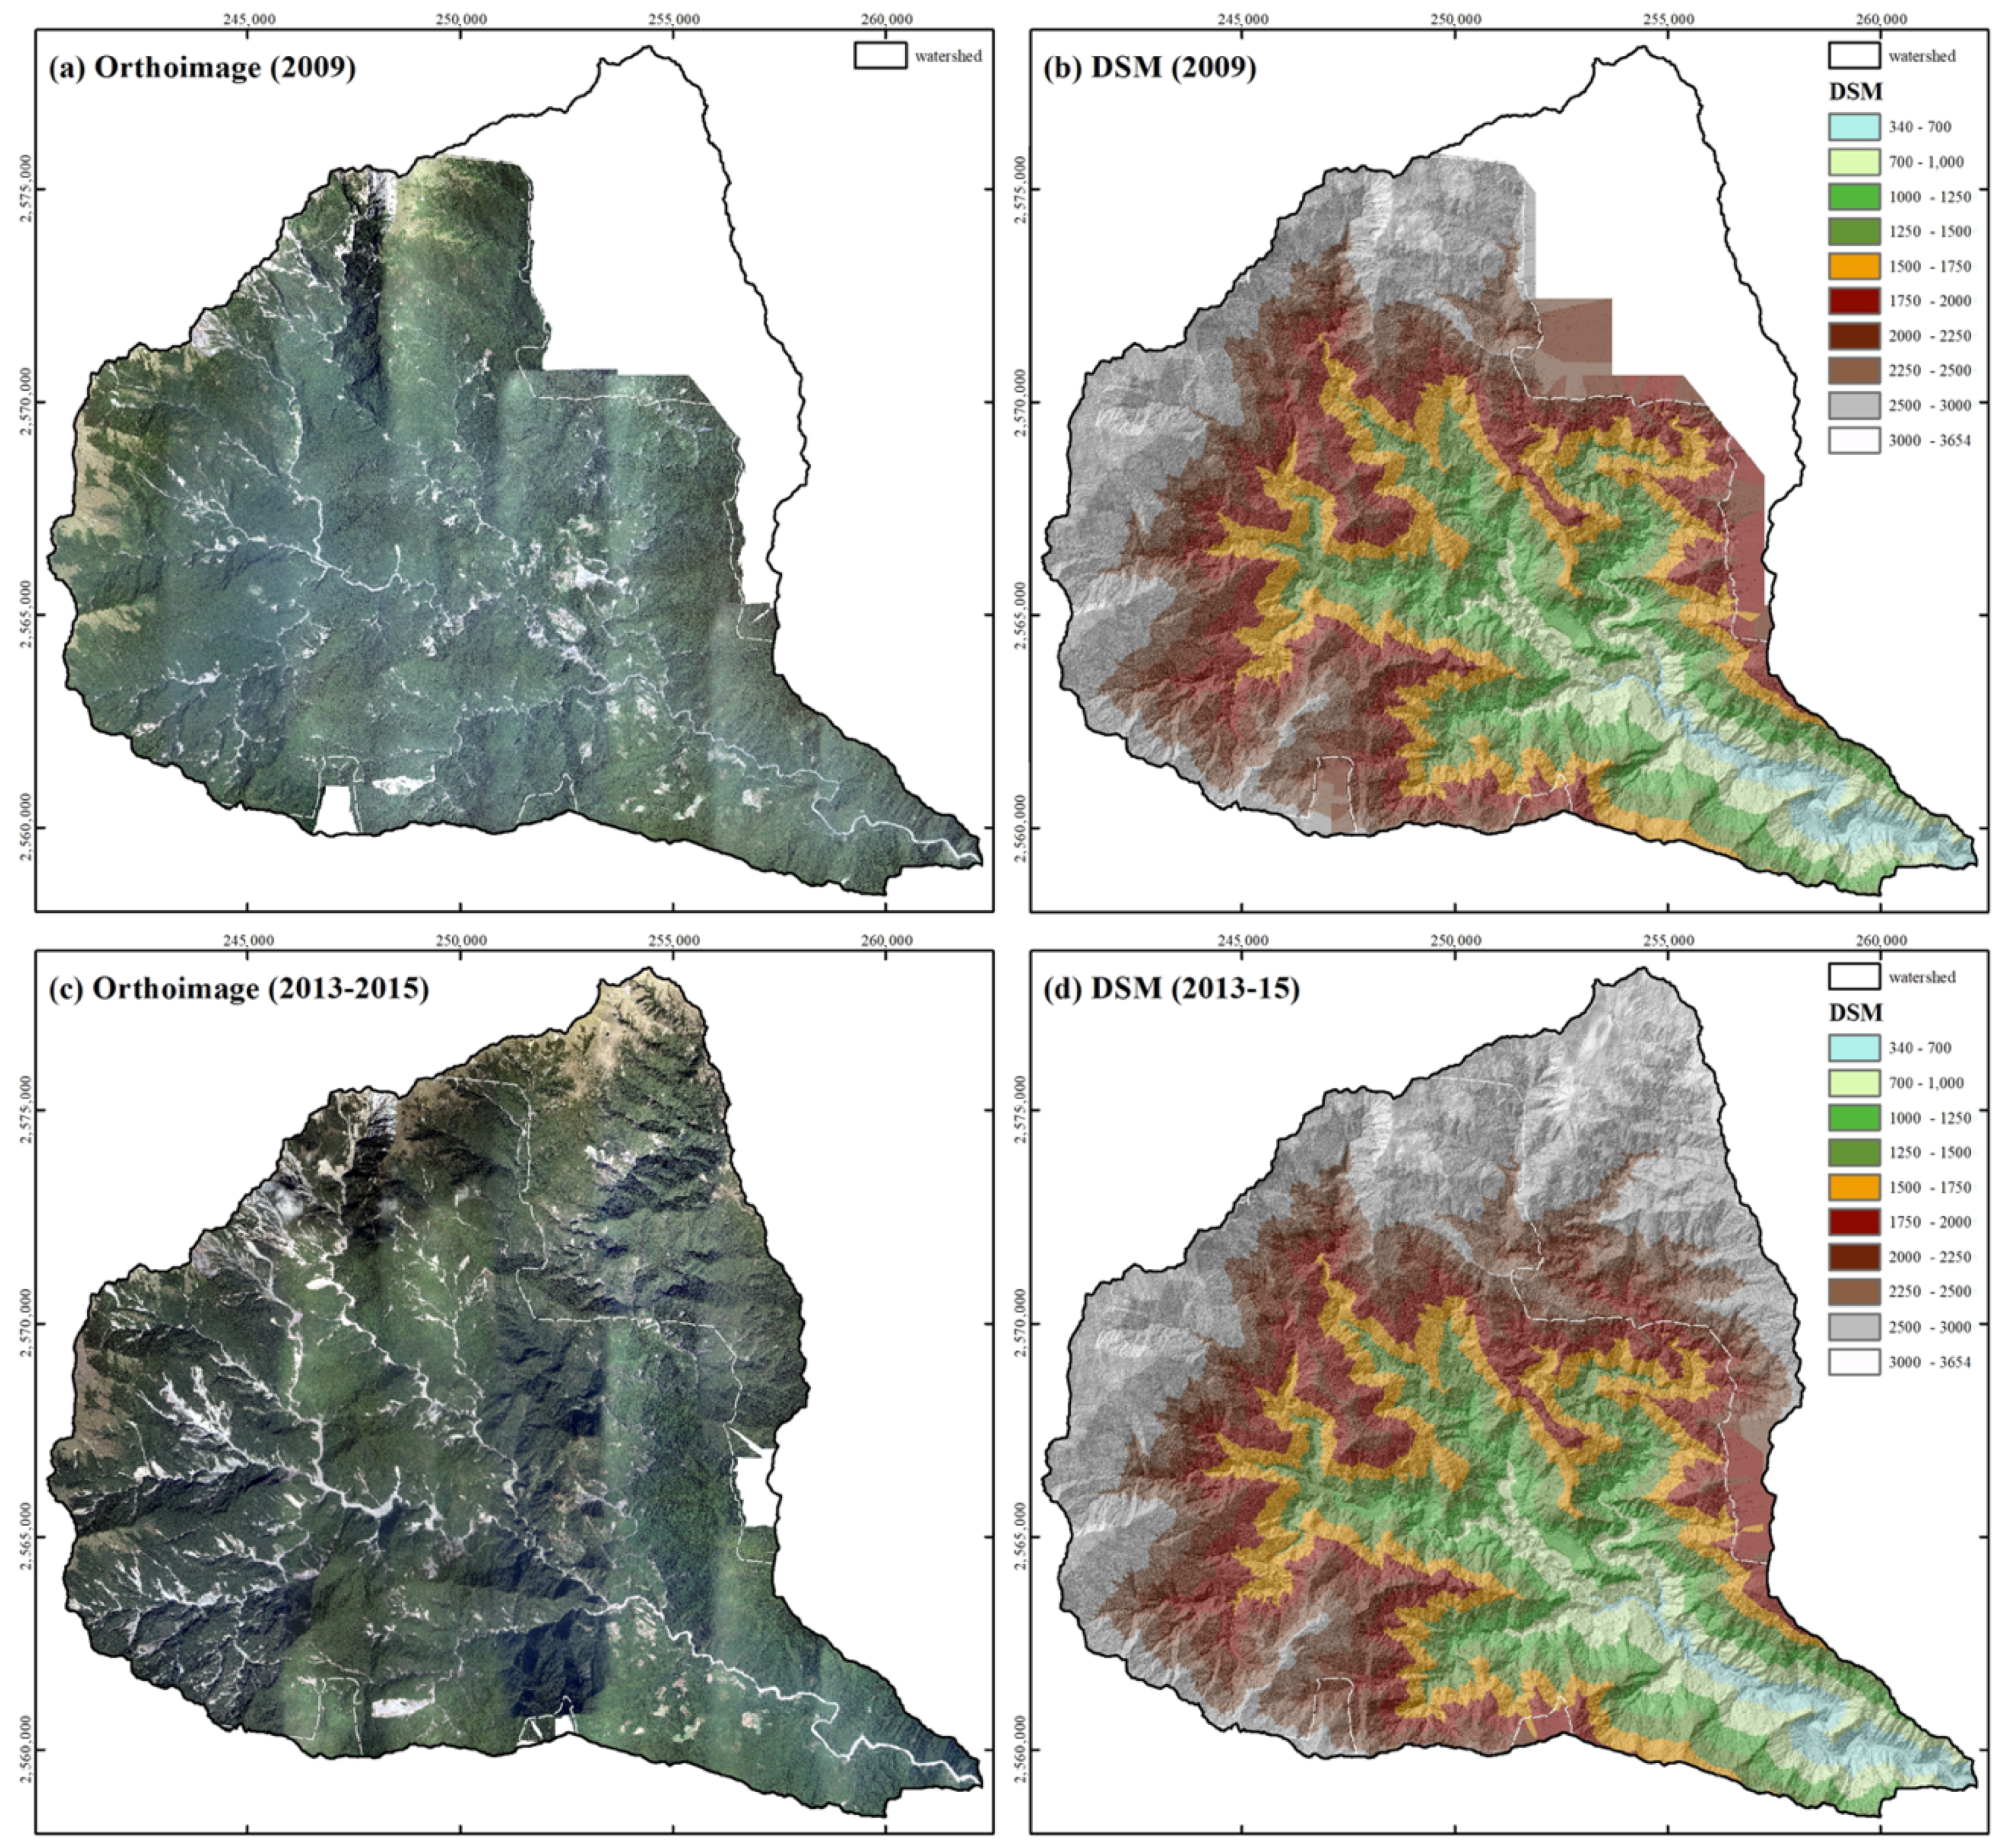
Overall, the horizontal and vertical uncertainties are generally below 1 m, except for the east component of the post-Morakot IGC RMSE (1.467 m). Following standard error propagation, the uncertainty of DSM differencing (DoD) at the 95% confidence level is 2.091 m for the pre- vs. post-Morakot comparison. Therefore, meter-scale topographic changes can be robustly detected, and we adopted a minimum level of detection threshold of 2 m for the DoD analysis [7]. Figure 2 shows the DSMs and orthoimages pre- and post- Typhoon Morakot.
Figure 2.
Pre- and post-Morakot digital surface models (DSMs) and orthophotos of the Sinwulu River watershed. (a) Pre-Morakot orthophoto and (b) DSM. (c) Post-Morakot orthophoto and (d) DSM. DSM elevation classes are displayed to highlight the basin-wide topographic structure, and the watershed boundary is outlined in black.
2.3. Canopy Height Correction
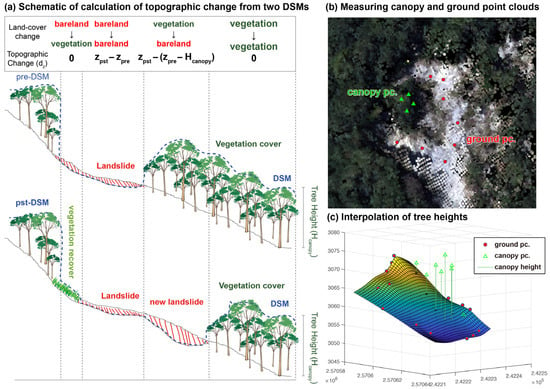
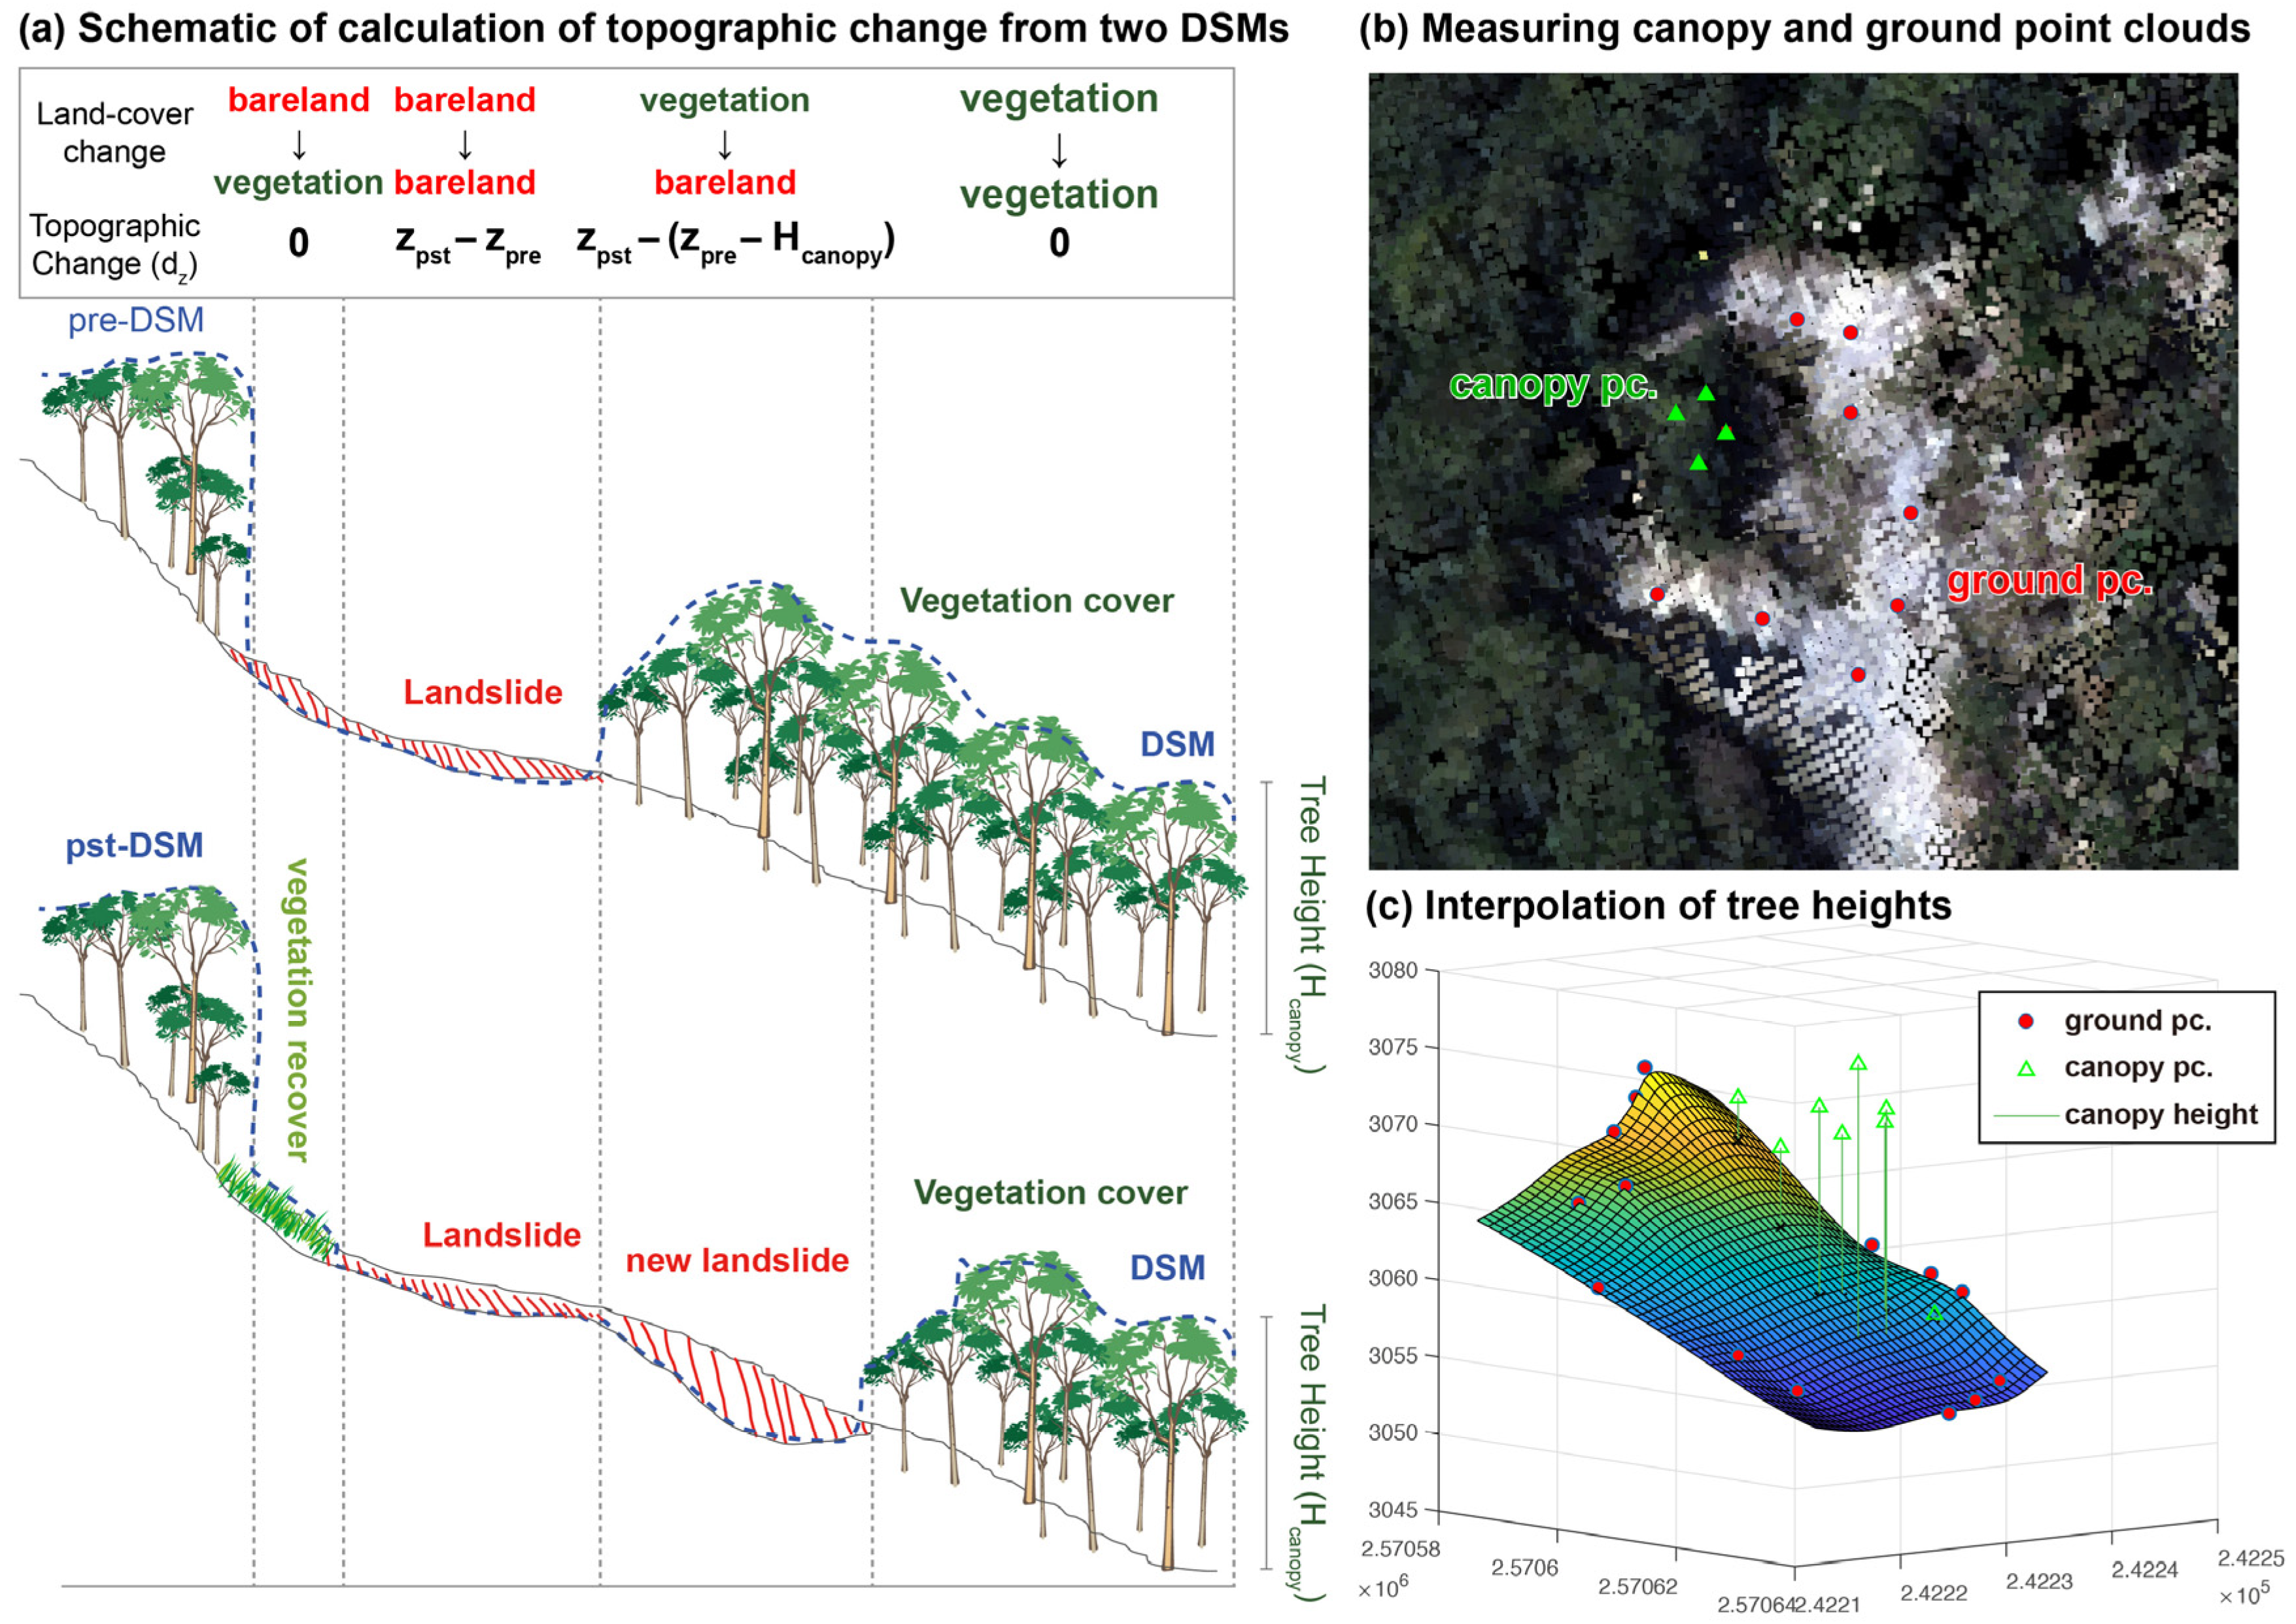
The DSMs generated from ASRSB aerial photographs represent surface elevations that include canopy and built structures. Therefore, canopy height must be corrected before DSM differencing to quantify true topographic change (Figure 3). We corrected canopy effects using land-cover transitions and an estimated canopy height surface (Figure 3a). When both periods were classified as vegetation, no disturbance was assumed and topographic change was set to zero. When bareland transitioned to vegetation, vegetation recovery was assumed and topographic change was also set to zero. When both periods were classified as bareland, topographic change was calculated as Zpst − Zpre. When vegetation transitioned to bareland (e.g., newly formed landslides or channel widening), canopy height was added to avoid overestimating erosion, and topographic change was calculated as:
where Zpst and Zpre are the post- and pre-event DSM elevations, respectively, and Hcanopy is the estimated canopy height. This canopy-height correction was implemented using a two-step approach: (1) vegetation–bareland classification and (2) canopy height estimation from the DSM–DEM difference.
Figure 3.
Schematic of DSM differencing and vegetation-height correction. (a) Conceptual calculation of dz from two DSMs. (b) Measurement of tree and ground coordinates. (c) Interpolation of tree heights for correcting vegetation-related bias.
2.3.1. Land-Cover Classification
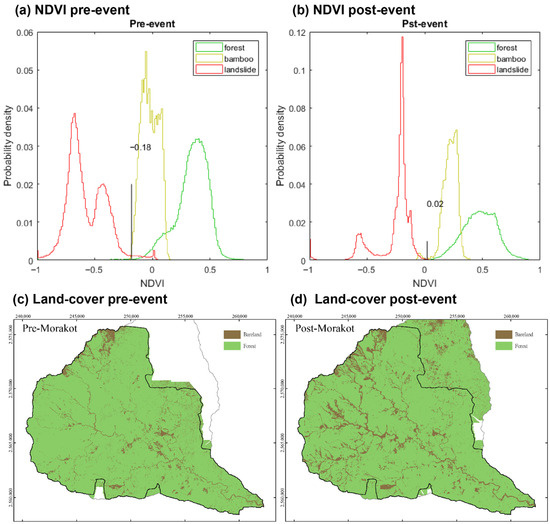
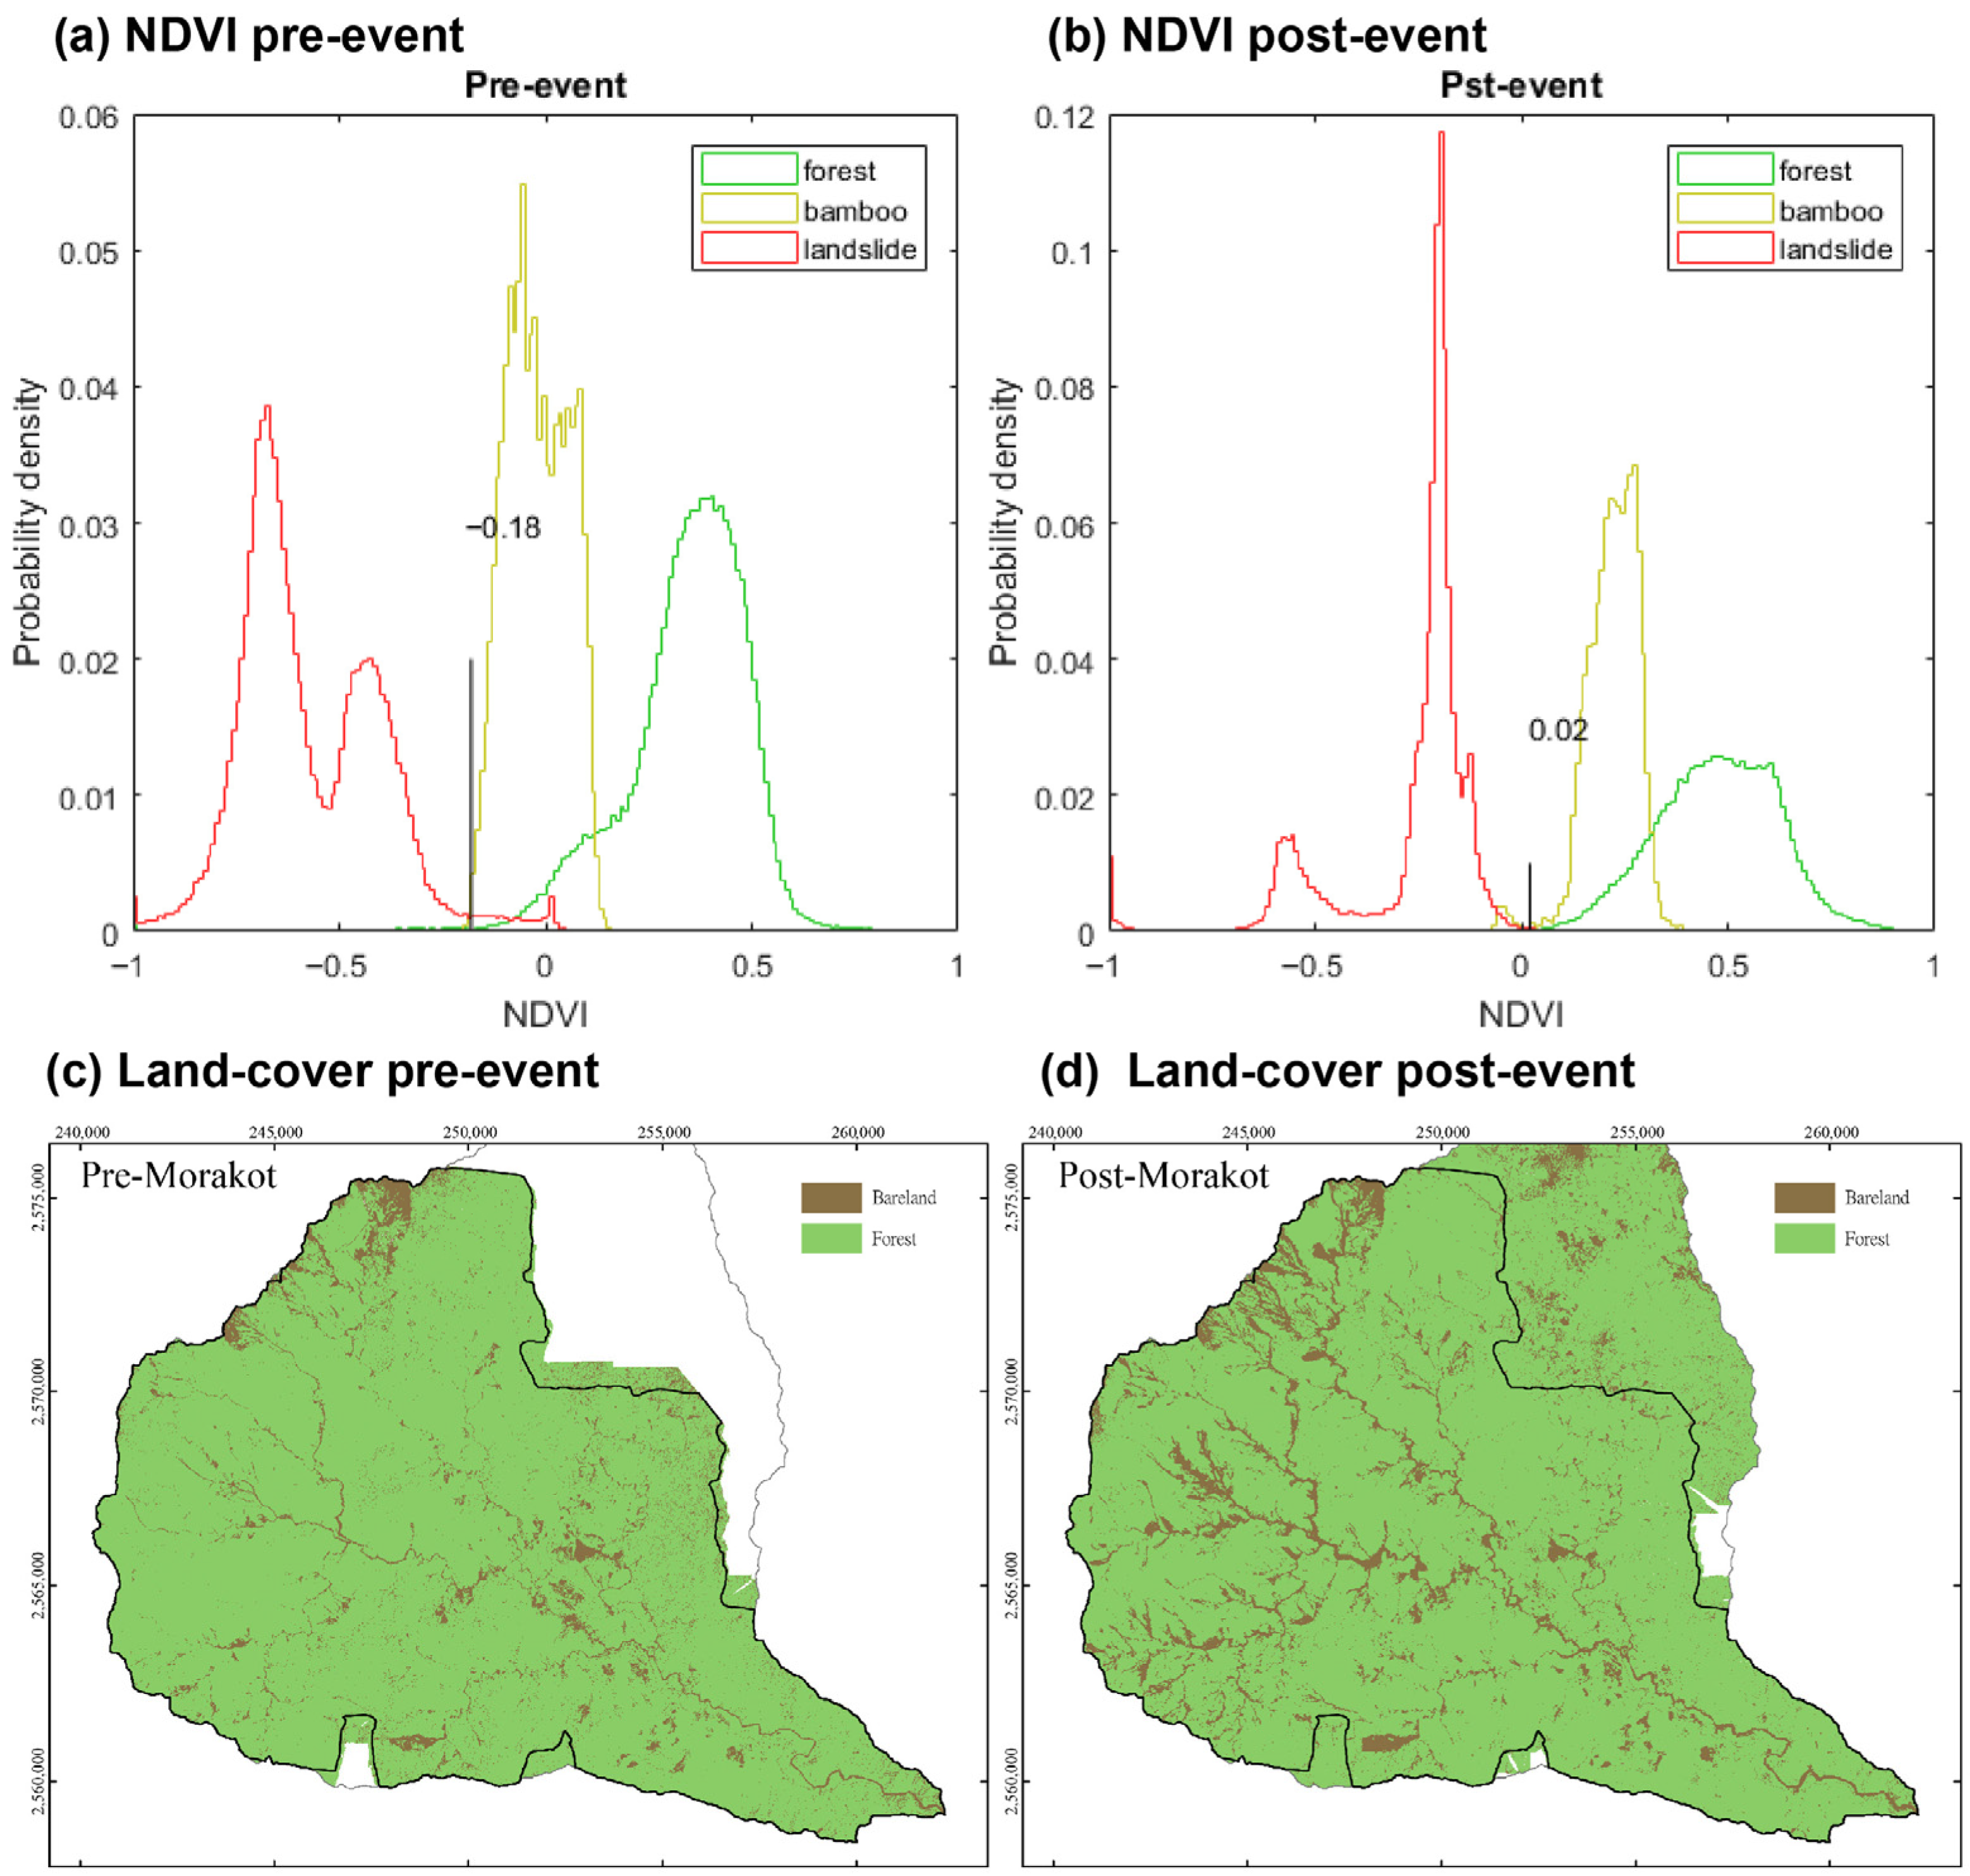
To apply the canopy-height correction rules (Figure 3a), we mapped vegetation and bareland for each dataset using NDVI derived from the red and near-infrared (NIR) bands of the orthophotos (Figure 4). Representative sample areas of vegetation (forest and alpine bamboo) and bareland (mainly landslide scars and exposed surfaces) were manually selected. For each class, NDVI frequency distributions were compiled to determine an optimal separation threshold (Figure 4a,b). The NDVI distributions show clear separation among land-cover types, and the selected thresholds (black vertical lines in Figure 4) were −0.18 for the pre-event dataset and 0.02 for the post-event dataset. Because the DMC images were not subjected to formal atmospheric correction, the shift in NDVI thresholds is likely a radiometric artifact resulting from differences in atmospheric conditions and solar geometry during the various flight years. These thresholds were then applied to classify the watershed into vegetation and bareland, producing the final land-cover maps shown in Figure 4c,d.
Figure 4.
NDVI-based classification of vegetation and bareland before and after Typhoon Morakot. Upper panels show NDVI probability density functions for forest (green), bamboo (yellow), and landslide/bareland surfaces (red) in the (a) pre-event and (b) post-event datasets. The vertical black line marks the NDVI threshold used to separate vegetation from bareland (−0.18 for the pre-event dataset and 0.02 for the post-event dataset). Lower panels show the resulting vegetation (green) and bareland (brown) maps within the watershed boundary in the (c) pre-event and (d) post-event datasets.
2.3.2. Canopy Height
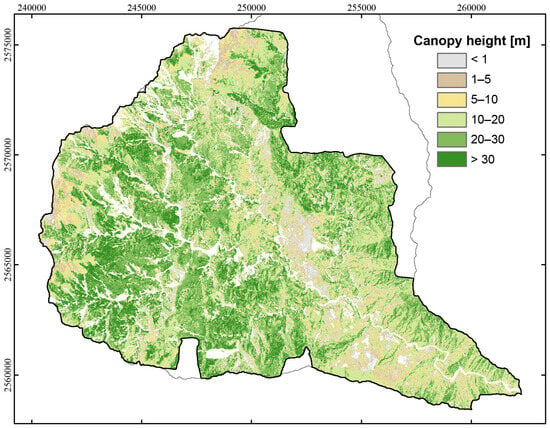
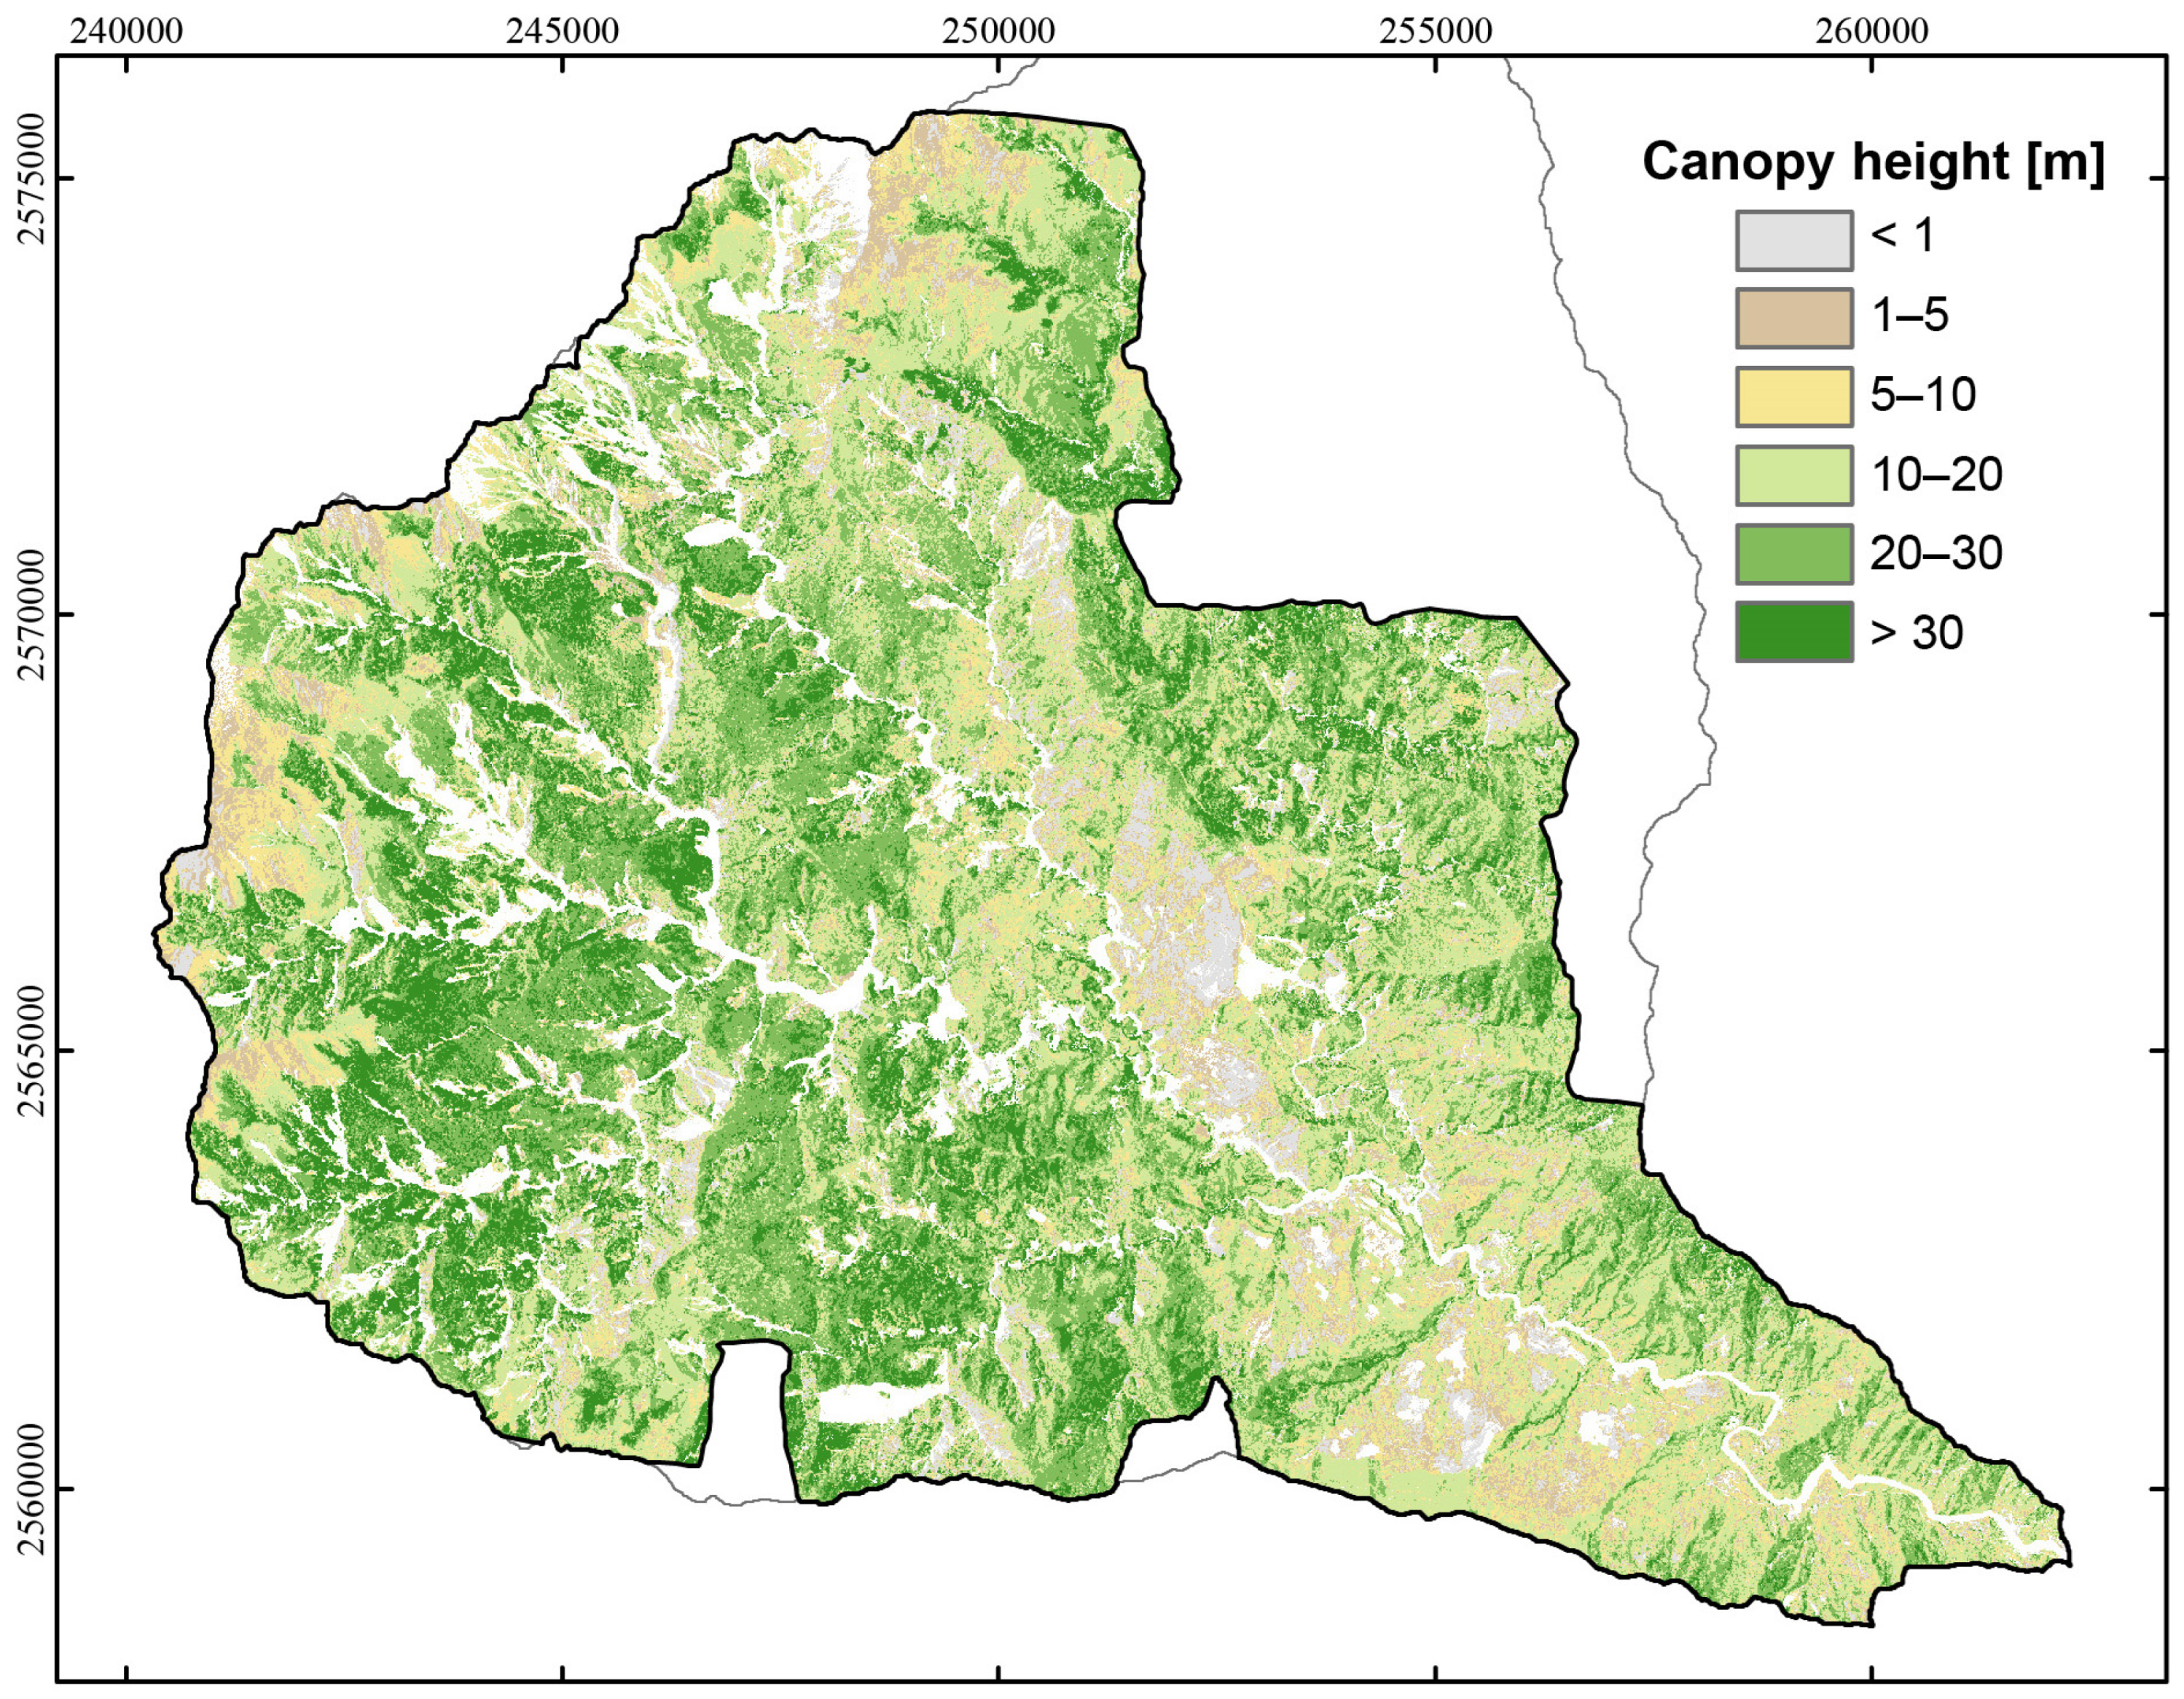
To estimate canopy height, we used a 20 m-resolution LiDAR-derived DEM provided by the Ministry of the Interior, acquired in 2014. The DEM was resampled to 1 m resolution using spline interpolation to match the spatial resolution of the photogrammetric products. A canopy height model (CHM) was then derived by subtracting the LiDAR DEM from the post-Morakot DSM (Figure 5). Because bareland areas contain no canopy returns, CHM values over bare surfaces may be undefined or underestimated. We therefore infilled canopy height over bareland by iteratively applying a moving-average filter within a 10 m radius using surrounding canopy values until no gaps remained.
Figure 5.
Map of estimated canopy height in the Sinwulu River watershed. Tree heights are classified into six ranges (m) for vegetation correction.
We evaluated CHM accuracy using two independent approaches. First, we manually measured tree height from the dense point cloud and compared it with the CHM. We selected locations where both treetops and adjacent exposed ground were visible (Figure 3b). For each site, 10–20 canopy points and nearby ground points were sampled. The ground surface was interpolated from the ground points using ordinary kriging to estimate local ground elevation, and tree height was calculated as the difference between canopy elevations and the interpolated ground surface (Figure 3c). A total of 68 tree-height measurements were obtained and compared with the CHM, yielding a mean error of 0.176 m and an RMSE of 2.420 m.
Second, we used stable bare surfaces, such as road and concrete pavement, where canopy height should be zero (e.g., roads, parking lots, school playgrounds, and exposed farmland). The CHM values at these sites were compared against 0 m to quantify error. Based on 25 validation sites, the mean error was 1.066 m and the RMSE was 1.799 m. Overall, the CHM uncertainty ranges from ~1.8 to 2.4 m, which is sufficient for correcting canopy effects in DSM-based topographic change analysis.
2.4. Analysis of Erosion and Topographic Factors on Hillslope and Channel
To separately quantify hillslope- and channel-related topographic changes, accurately delineating hillslope and river-channel domains is a key step in this study. However, no reliable automated approach is currently available to robustly separate hillslope and channel areas in this steep, forested mountain catchment. We therefore manually digitized the channel extent from high-resolution orthophotos. Channel boundaries were interpreted based on image color and texture and were cross-checked using the DSM and hillshade to distinguish river channels from adjacent hillslopes.
To analyze the relationships between erosion and topographic factors on hillslopes and channels, we adopted the channel–hillslope linking approach proposed by Chen, Chang, Wang, Ho and Chen [17]. This method partitions the river network into discrete channel reaches and assigns each reach an adjacent contributing hillslope unit using the D8 flow direction algorithm, enabling paired analysis of channel and hillslope processes within the same geomorphic unit. Using a 20 m-resolution LiDAR-derived DEM, we delineated 1178 channel sections and their corresponding hillslope units using a contributing area threshold of 0.1 km2. Mean erosion was calculated separately for each channel–hillslope pair. Hillslope factors include slope gradient and rolling maximum 24-h rainfall [3,4], whereas channel factors include contributing area, slope gradient, channel width, total stream power, unit stream power [19,49], and channel sinuosity [17]. Among the channel-related variables, unit stream power was used as a commonly adopted indicator of fluvial erosive potential [19]. Unit stream power represents the rate of energy dissipation exerted by flowing water on bedrock or channel banks per unit channel width (b), and is expressed as:
where ρw is water density (1000 kg/m3), g is gravitational acceleration (9.81 m/s2), Q is water discharge (m3/s), approximated using upstream contributing area, Sc is the local channel slope gradient (-), and b is channel width (m), which was manually measured from orthoimages taken after Typhoon Morakot.
3. Results
3.1. Topographic Change After the 2009 Typhoon Morakot
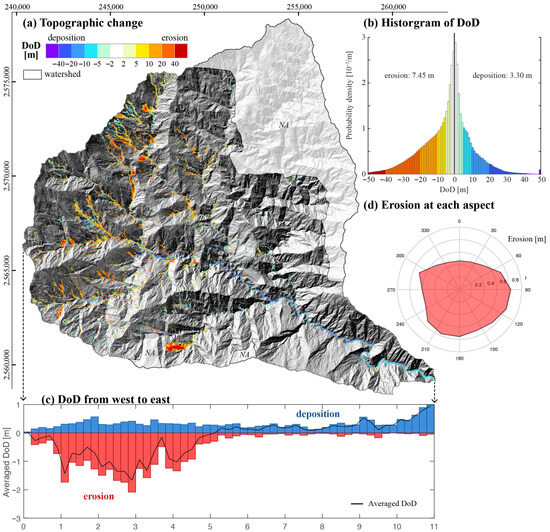
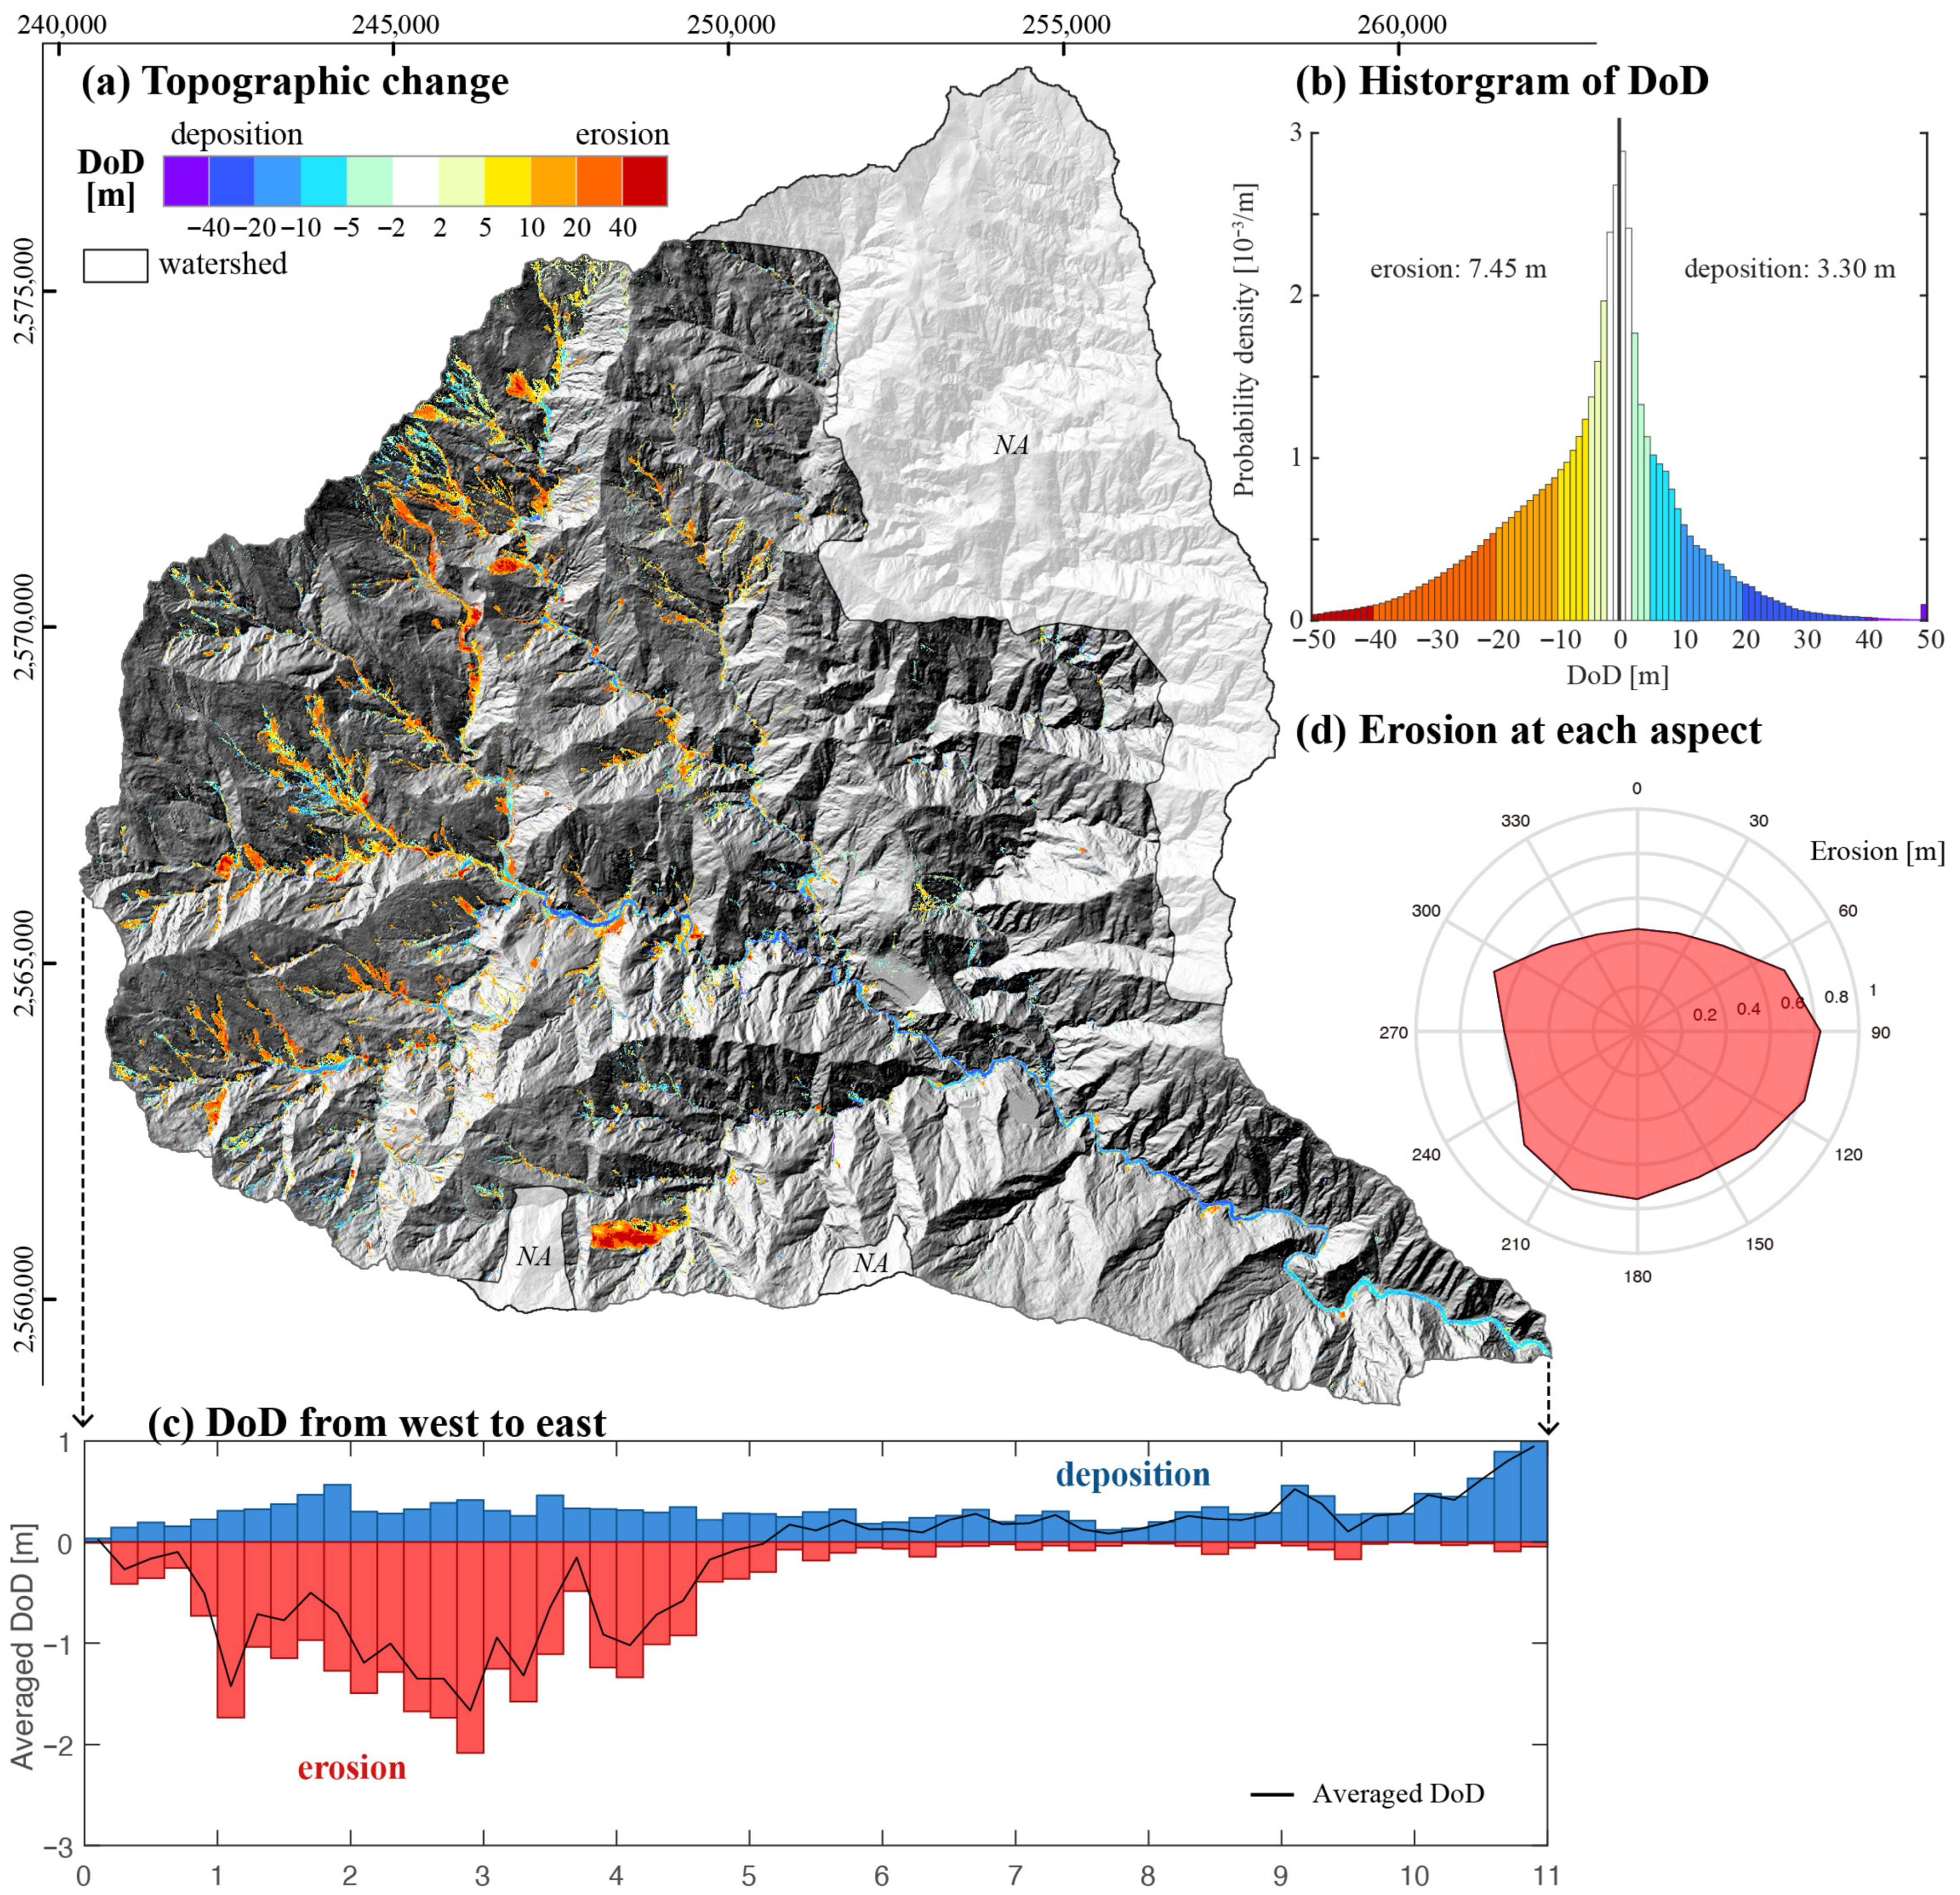
This study used aerial photogrammetry to generate DSMs with canopy height correction to analyze the topographic change triggered by the 2009 Typhoon Morakot (Figure 6). Over the area covered by both datasets (254.47 km2), the total erosion volume was estimated at 138.52 Mm3, corresponding to a watershed-average erosion of 544.35 mm. Total deposition amounted to 58.56 Mm3, yielding a net erosional volume of 79.96 million m3. Based on these values, the sediment delivery ratio (SDR) for the study area is 57.7%. These results illustrate that the sediment volume generated by Typhoon Morakot far exceeds that produced under typical background conditions.
Figure 6.
Spatial patterns of Typhoon Morakot-induced topographic change in the Sinwulu River watershed. (a) DEM of difference (DoD) map derived from pre- and post-event DSMs, where warm colors indicate erosion and cool colors indicate deposition (units: m). (b) Probability distribution of DoD values within the watershed, summarizing the overall magnitude of erosion and deposition. (c) West–east variation in the averaged DoD, indicating predominant erosion in the western part of the watershed and predominant deposition toward the eastern part. (d) Aspect-dependent mean erosion, showing the highest erosion on east-facing slopes (825 mm) and the lowest on north-facing slopes (461 mm). NA indicates no-data areas.
The DoD histogram (Figure 6b) is asymmetric, with a longer negative tail, indicating that erosional changes dominate over depositional changes. The mean erosion depth is 7.45 m, whereas the mean deposition depth is 3.30 m. The longitudinal profile of average elevation change from west to east (Figure 6c) shows net erosion in the western part of the watershed, while deposition gradually increases toward the eastern part. The western part of the Sinwulu River watershed is predominantly underlain by the Hsinkao Formation, which exhibits lower rock strength and is more susceptible to failure. In contrast, the eastern part is underlain by the Tananao Schist, which possesses higher mechanical competence. Consequently, landslide occurrence and associated erosional magnitude are substantially higher in the western Hsinkao Formation than in the eastern domain.
Erosion magnitude varies systematically with slope aspect (Figure 6d), with higher erosion values observed on east- and southeast-facing slopes and lower values on north-facing slopes. Although the prevailing wind direction during the 24-h maximum rainfall was from the northeast [50], the results indicate that the preferential landslide orientation (E and SE) was more closely aligned with the lithological settings. Specifically, the SE-dipping bedding planes (35–70°) within the weak slates of the Hsinkao Formation exerted a more dominant control on slope failure than the windward rainfall distribution. This alignment results in a high prevalence of dip slopes on east- and southeast-facing hillslopes, which significantly facilitates landslide initiation and enhances erosional magnitude during extreme rainfall events [43].
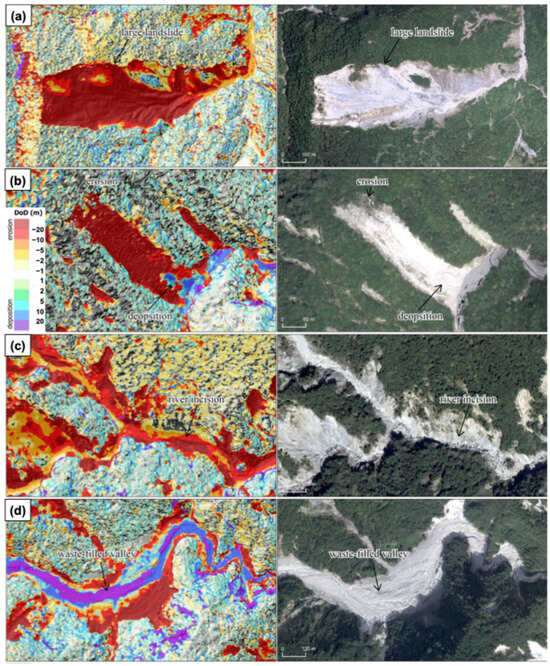
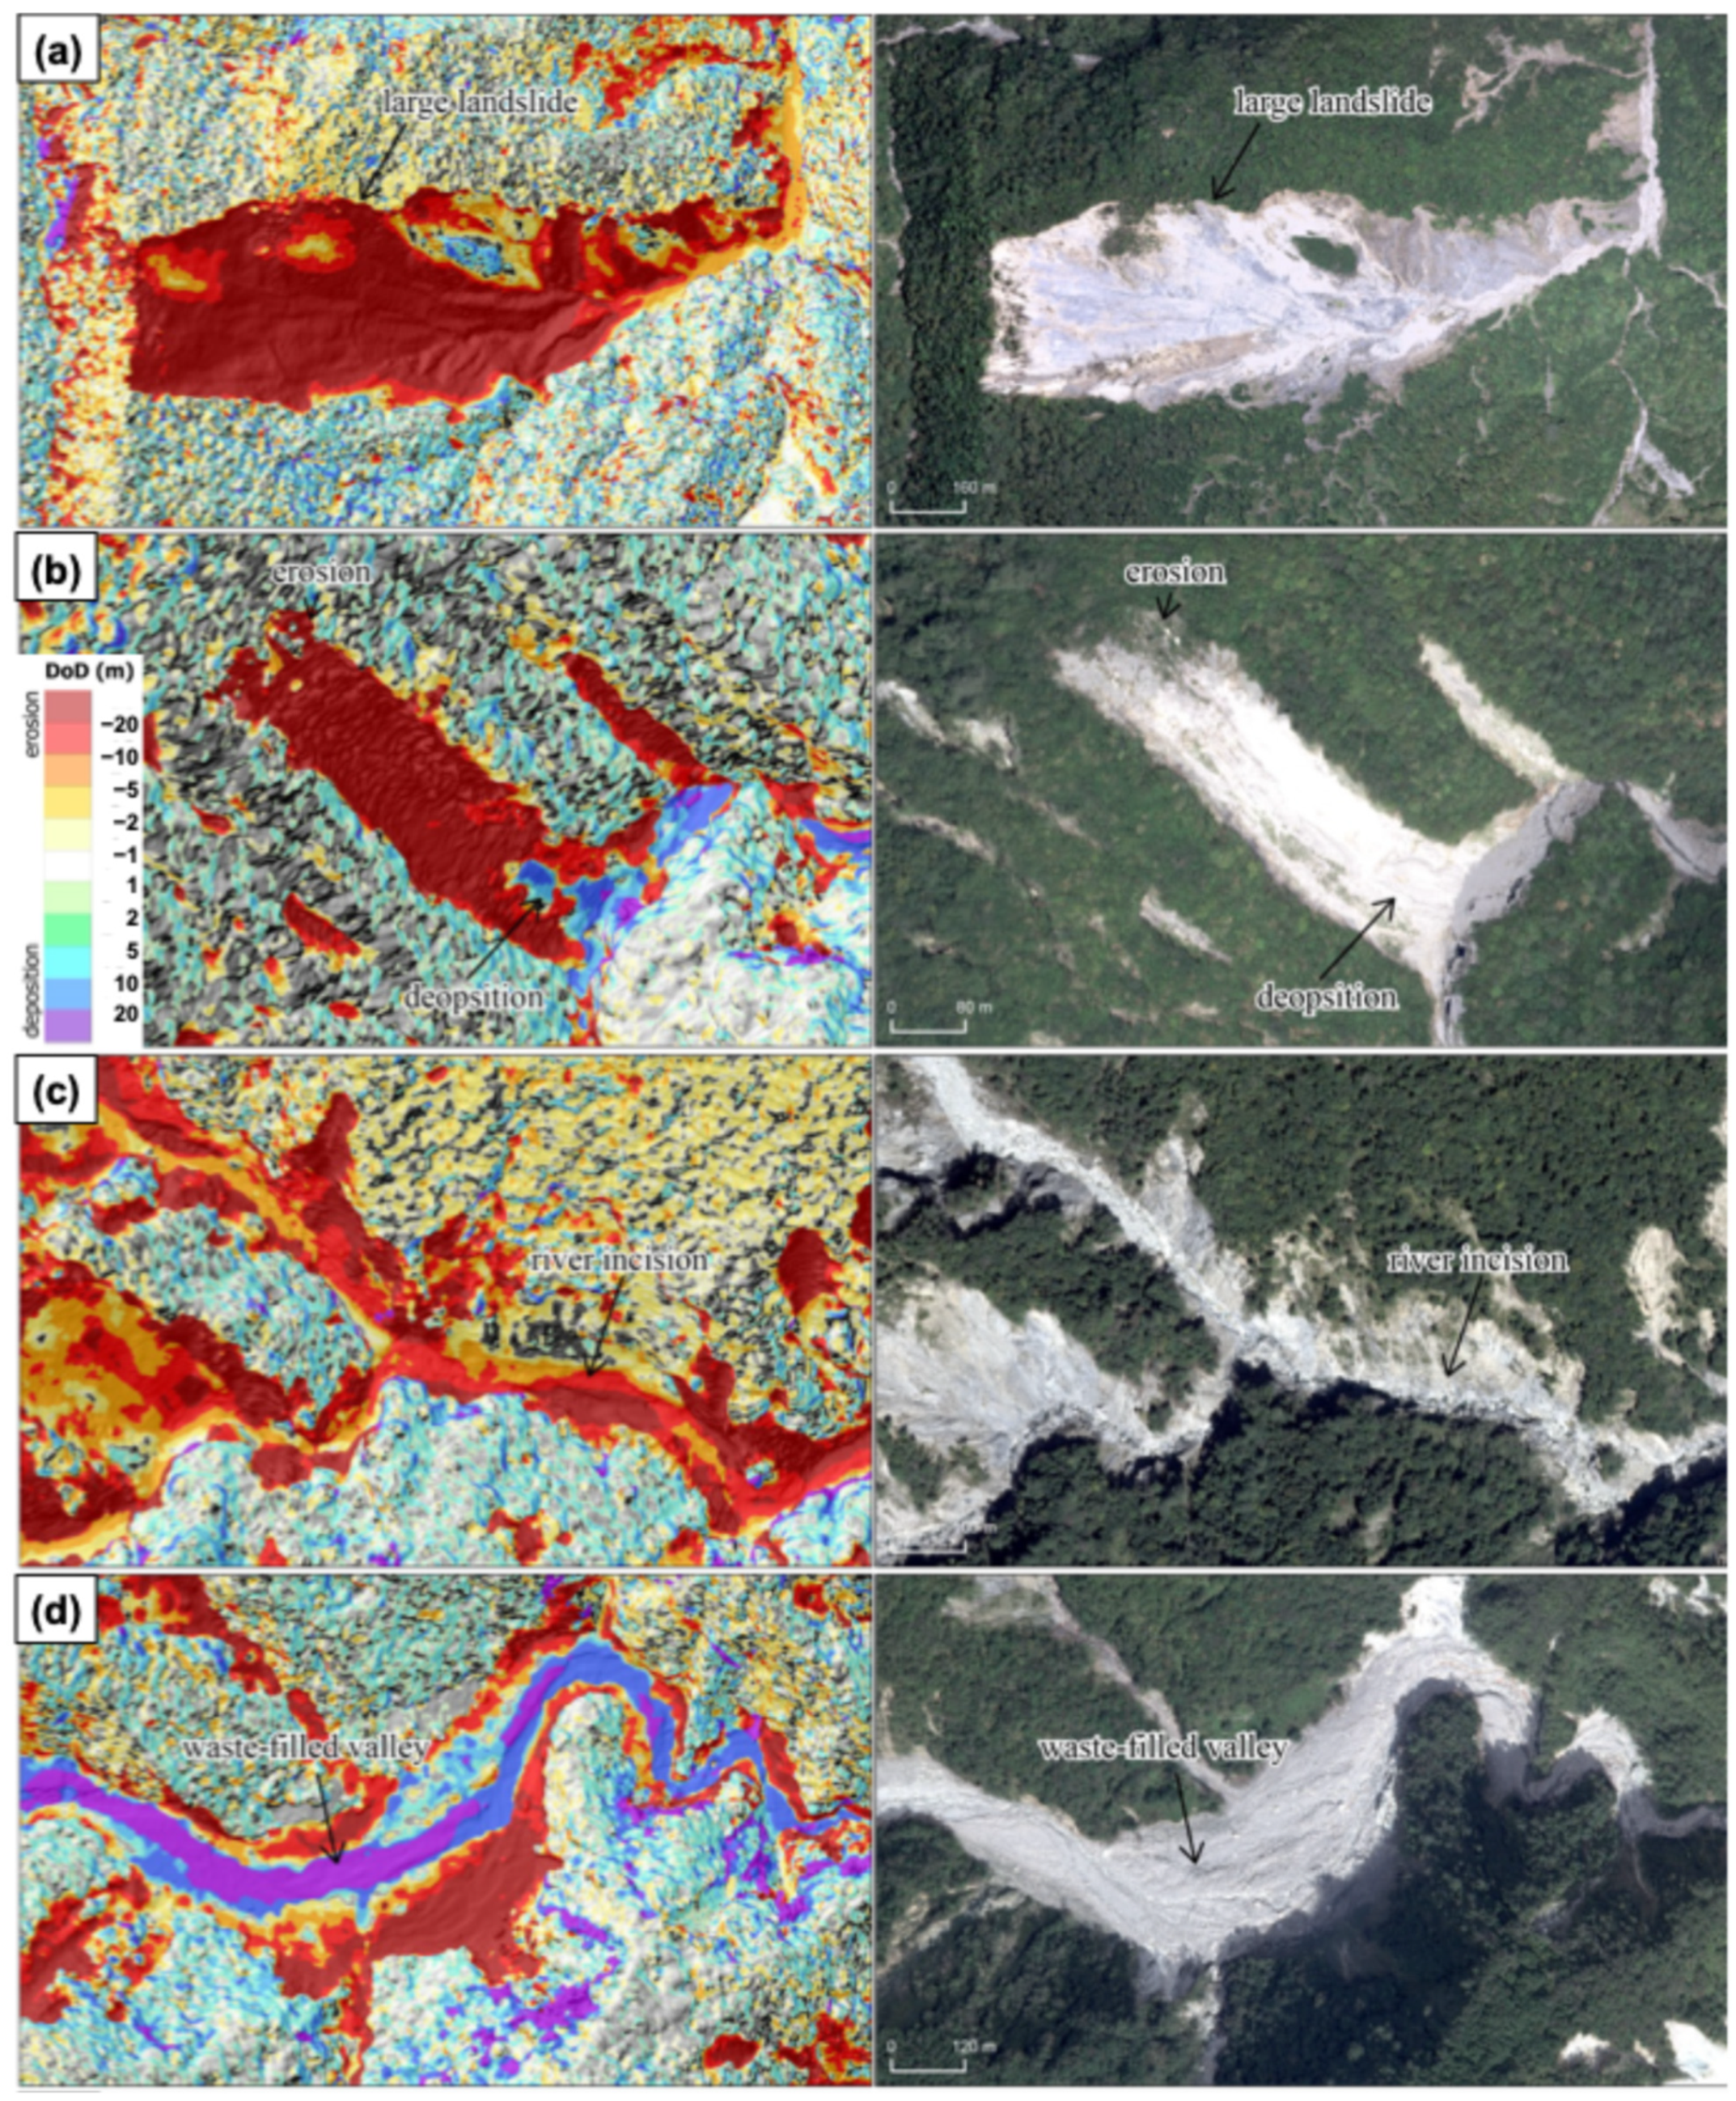
On hillslopes, the total erosion volume reached 122.85 Mm3, accounting for approximately 87% of the total erosion volume within the watershed, whereas hillslope deposition amounted to 36.65 Mm3, representing about 63% of the total depositional volume. Figure 7a, b illustrates representative landslide-driven hillslope erosion during Typhoon Morakot. The large landslide shown in Figure 7a covers an area of 47.52 ha, with an estimated erosion volume of 13.43 Mm3 and an average erosion depth of 28.25 m, and shows no significant sediment accumulation on the adjacent hillslope or within the associated gully. Moreover, the smaller landslide example in Figure 7b has an area of 4.05 ha, an erosion volume of 0.86 Mm3, and an average erosion depth of 21.28 m, with only minor sediment deposition observed at the hillslope toe. Overall, the hillslope results indicate that landslide erosion dominated sediment production during Typhoon Morakot, while sediment storage on hillslopes remained limited.
Figure 7.
Representative examples of hillslope and channel geomorphic responses to Typhoon Morakot. Hillslope areas (a,b) are dominated by large landslide erosion with minimal sediment storage, whereas channel areas (c,d) show incision and valley-floor deposition. (Left) panels display canopy-corrected elevation change (DoD), and (right) panels show corresponding orthophotos.
On channels, the total erosion volume was estimated at 15.67 Mm3, accounting for approximately 13% of the total erosion within the watershed, whereas channel deposition reached 21.92 Mm3, representing about 37% of the total depositional volume. As illustrated in Figure 6a, channel-related topographic changes exhibit strong spatial contrasts between upstream and downstream reaches. In the upstream channel, widespread channel incision is evident, with erosion depths of approximately 2–30 m extending across much of the channel width (Figure 7c). In contrast, the downstream channel is characterized by substantial valley-floor aggradation, where sediment deposition locally reaches depths of approximately 10–20 m (Figure 7d). Overall, channel topographic change following Typhoon Morakot is marked by pronounced upstream erosion and downstream deposition.
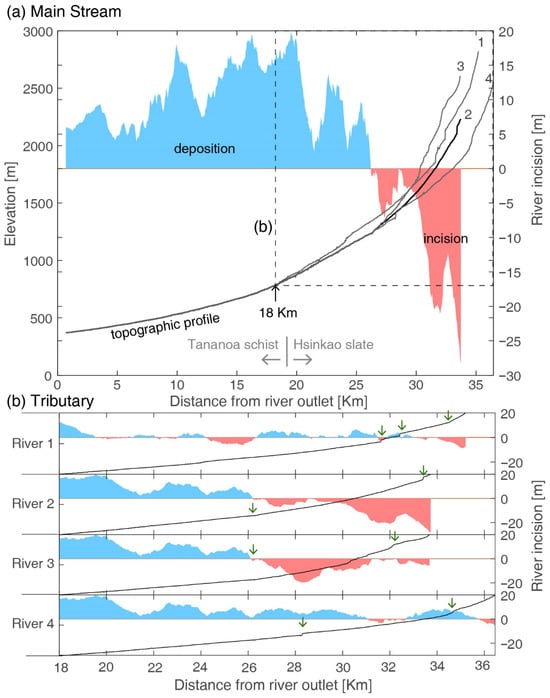
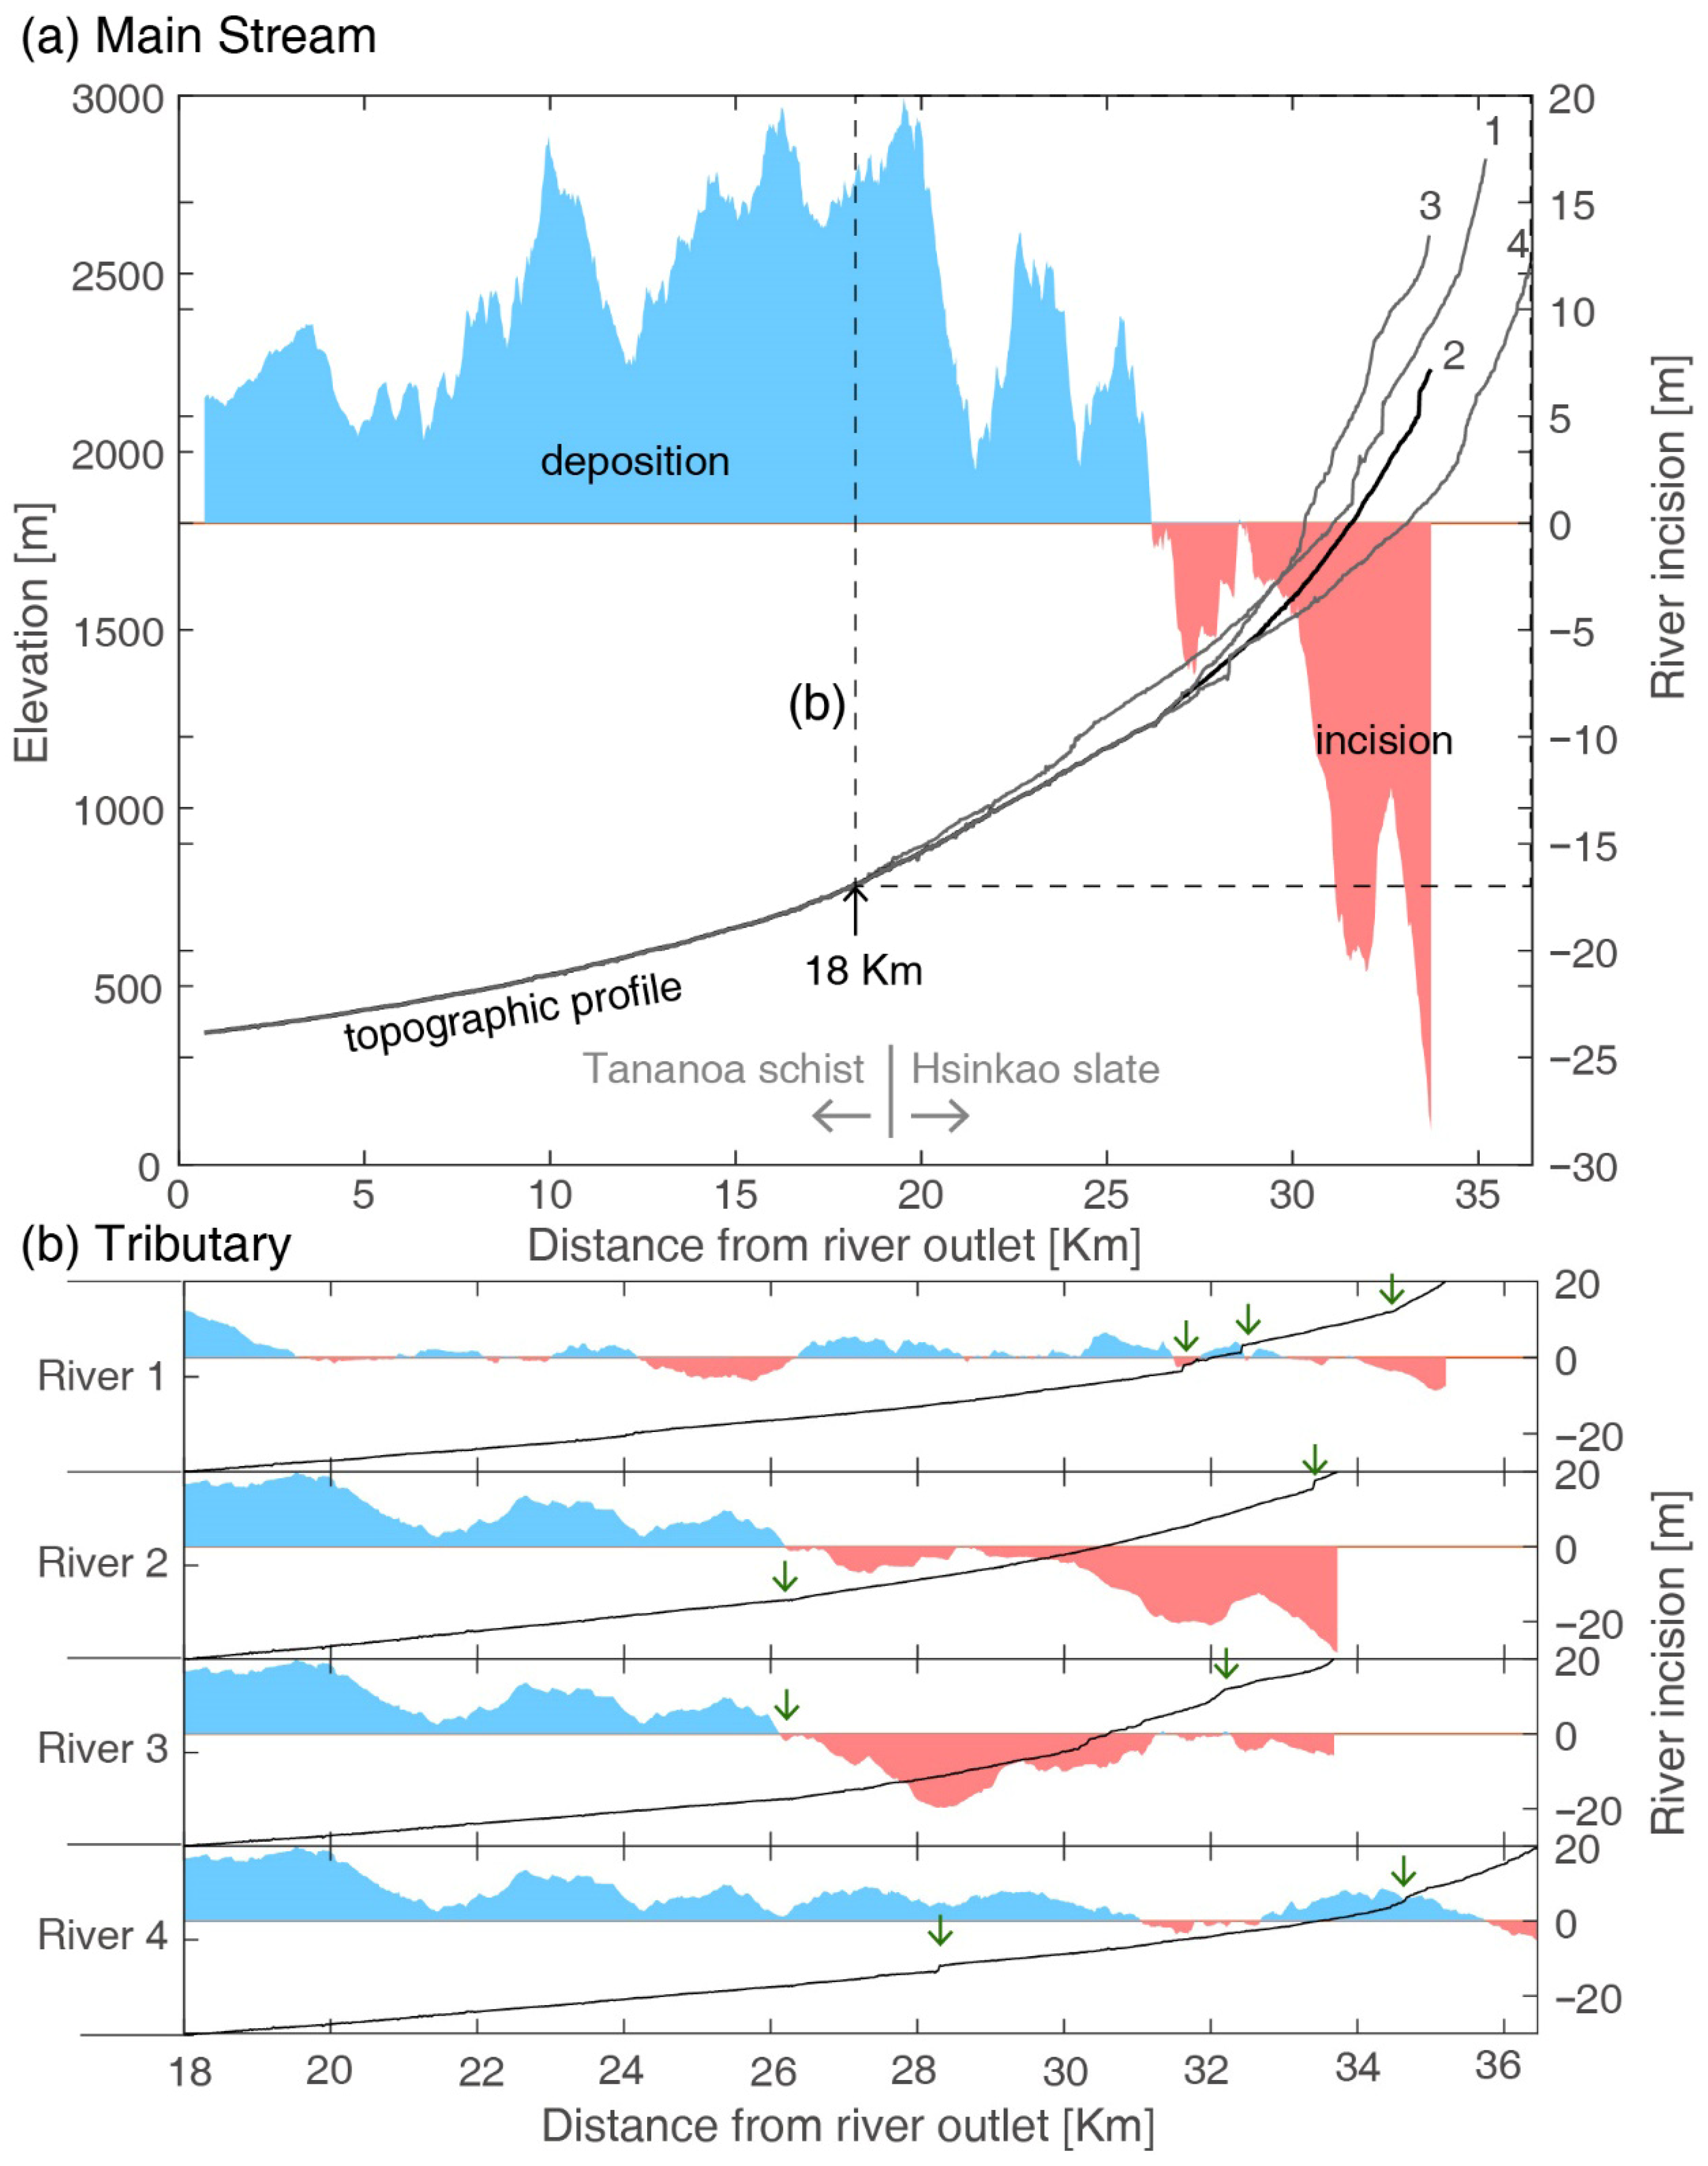
To further examine the spatial distribution of channel incision and deposition, longitudinal profiles were extracted along the channel thalweg for the main stream and four major tributaries. Topographic changes before and after Typhoon Morakot were sampled along these profiles to quantify river incision and aggradation as a function of downstream distance (Figure 8). Figure 8a shows the longitudinal profile of the main channel. A clear transition between net incision and net deposition occurs at a flow distance of approximately 25 km from the watershed outlet. Upstream of this point, channel incision dominates, with maximum incision depths reaching ~30 m and an average incision of approximately 7 m. Downstream reaches are characterized by net deposition, where sediment accumulation commonly ranges from 5 to 15 m and locally exceeds 20 m. This transition zone coincides with a prominent knickpoint along the main channel profile. Figure 8b shows enlarged longitudinal profiles for four upstream tributaries. Each tributary exhibits two to three knickpoints along the channel profile. In Rivers 1, 2, and 3, the locations of these knickpoints correspond closely to the transition between upstream incision and downstream deposition. In contrast, River 4 does not show a clear correspondence between knickpoint position and the incision–deposition boundary. Overall, the longitudinal profiles present that channel erosion and sediment storage during Typhoon Morakot are spatially organized along the river network, with incision concentrated upstream of knickpoints and deposition preferentially occurring downstream.
Figure 8.
Longitudinal profiles and along-channel patterns of incision and deposition for the main stem and tributaries. (a) Main stream profile showing elevation (black line) and net channel change, where blue shading denotes deposition and red shading denotes incision (units: m). The horizontal axis represents the distance from the river outlet. The dashed line marks the location corresponding to subfigure (b), and the lithological boundary between the Tananao Schist and Hsinkao Slate is indicated. (b) Tributary profiles (Rivers 1–4) showing the distribution of incision (red) and deposition (blue); green arrows indicate the locations of knickpoints.
3.2. Relationships Between Hillslope Erosion, Channel Incision, and Topographic Factors
Spearman rank correlation analysis was used to quantify the relationships between landslide-related hillslope erosion, channel incision, and associated topographic and hydraulic factors using the linked channel–hillslope units. Because downstream reaches are dominated by deposition and experience lower rainfall intensity, the analysis was conducted separately for the entire watershed and for the upstream domain (flow distance > 18 km). The correlation results are summarized in Table 2.
Table 2.
Correlation analysis between the erosion and topographic factors on hillslope and channel.
Based on the correlation analysis (Table 2), hillslope erosion exhibits several statistically significant relationships with topographic and hydrologic factors. For the entire watershed, hillslope erosion is strongly and positively correlated with channel incision (r = 0.81, p < 0.01) and maximum 24-h rainfall (r = 0.52, p < 0.01). Hillslope erosion also shows significant but weaker correlations with contributing area (r = 0.35, p < 0.01), total stream power (r = 0.34, p < 0.01), channel width (r = 0.25, p < 0.01), unit stream power (r = 0.39, p < 0.01), and channel sinuosity (r = −0.11, p < 0.01). In contrast, the correlation between hillslope erosion and hillslope slope gradient is weak and not significant (r = 0.02).
When the analysis is restricted to the upstream watershed, which contains the primary erosion area, hillslope erosion remains significantly correlated with channel incision (r = 0.79, p < 0.01). Significant but relatively weaker correlations are also observed with maximum 24-h rainfall (r = 0.30, p < 0.01), contributing area (r = 0.28, p < 0.01), total stream power (r = 0.33, p < 0.01), channel width (r = 0.25, p < 0.01), and unit stream power (r = 0.36, p < 0.01). Similar to the whole-watershed results, hillslope slope gradient does not show a significant correlation with hillslope erosion in the upstream domain (r = 0.13).
Channel incision exhibits correlation patterns similar to those of hillslope erosion (Table 2). For the entire watershed, channel incision is strongly and positively correlated with hillslope erosion (r = 0.81, p < 0.01) and maximum 24-h rainfall (r = 0.54, p < 0.01). Channel incision also shows significant but weaker positive correlations with contributing area (r = 0.26, p < 0.01), total stream power (r = 0.28, p < 0.01), channel width (r = 0.16, p < 0.01), and unit stream power (r = 0.33, p < 0.01). In contrast, channel slope gradient does not show a significant correlation with channel incision (r = −0.05). Channel sinuosity exhibits a weak but significant negative correlation with channel incision (r = −0.11, p < 0.01).
When the analysis is restricted to the upstream watershed, channel incision remains significantly correlated with hillslope erosion (r = 0.79, p < 0.01) and maximum 24-h rainfall (r = 0.33, p < 0.01). Significant positive correlations are also observed with contributing area (r = 0.20, p < 0.01), total stream power (r = 0.28, p < 0.01), channel width (r = 0.17, p < 0.01), and unit stream power (r = 0.31, p < 0.01), whereas channel slope gradient and channel sinuosity do not show significant correlations.
4. Discussion
4.1. Erosion Rate Triggered by Typhoon Morakot
It is widely recognized that infrequent, high-magnitude events play a disproportionately important role in shaping Earth surface processes [3,51]. Landslide erosion induced by Typhoon Morakot in the Kaoping River basin and the Tsengwen Reservoir watershed has been shown to correspond to approximately 22–24 years of long-term average erosion, indicating that, over decadal timescales, extreme rainfall events contribute about 64–79% of the average landslide erosion rate and dominate regional sediment budgets [3,4].
In the Sinwulu River watershed, the total erosion triggered by Typhoon Morakot is equivalent to approximately 32–82 years of background erosion, based on previously estimated average erosion rates of 6.6 mm yr−1 (1970–1999) and 17.03 mm yr−1 (post the 1999 Chi-Chi earthquake). This magnitude is comparable to, but slightly higher than, estimates reported for other major basins in southern Taiwan affected by the same event [4]. Together, these results reinforce the concept that catchment-scale erosion in active mountain belts is strongly dominated by rare, high-magnitude rainfall events rather than by frequent, moderate storms.
4.2. Topographic Change on Upstream Channels
Extreme rainfall events can trigger widespread landsliding and deliver large volumes of sediment to river channels. This raises a fundamental question: does such sediment input promote channel aggradation, or does it instead trigger channel incision in upstream reaches? Previous studies have documented contrasting responses. For example, DeLisle, et al. [52] reported that following the 2009 Typhoon Morakot in Taiwan, steep areas experienced channel sediment aggradation exceeding 10 m, and that thick sediment cover may suppress bedrock incision for up to half of a given time period, producing an erosional buffering effect. In contrast, Lancaster [53] showed that steepland valleys subject to debris flows can still experience bedrock incision despite transient aggradation, with sediment evacuation occurring episodically through rapid fluvial incision during large storms in the Oregon Coast Range, USA.
The results of our study show that Typhoon Morakot produced a distinct spatial pattern of topographic change along the river network, characterized by severe channel incision in upstream reaches and large-scale sediment deposition in mid- and downstream valley segments. In the in upstream reaches (Figure 7c and Figure 8), despite the enormous volume of landslide-derived sediment generated in the headwaters, little sediment accumulation was observed in upstream channels; instead, these reaches experienced pronounced erosion, a pattern more consistent with the findings of Lancaster [53]. This upstream incision is attributed to the extremely steep channel gradients in the upper basin, which promote high transport capacity and debris-flow activity, allowing landslide-derived sediment to be efficiently evacuated downstream rather than stored locally.
In contrast, downstream reaches exhibit markedly reduced channel gradients and transport capacity, favoring sediment storage and aggradation, which is similar to the DeLisle, Yanites, Chen, Shyu, and Rittenour [52]. The transition from upstream incision to downstream deposition coincides spatially with major knickpoints and abrupt changes in channel slope, indicating that longitudinal profile geometry plays a critical role in modulating sediment routing during extreme events. The severity of channel incision in the upstream reaches is further amplified by the inherent weakness of the slate-dominated Hsinkao Formation. In these steep valleys, fluvial erosion acts as a primary driver of landscape instability by undercutting the toes of adjacent hillslopes. This mechanism is particularly effective in the western part of the watershed, where the removal of basal support triggers failure along pre-existing SE-dipping bedding planes.
However, it should be noted that our DoD-based measurements represent the net topographic results after a sequence of erosion and deposition processes. This approach may overlook transient geomorphic processes during Typhoon Morakot, such as the formation of erosion hollows that were subsequently infilled by aggrading material. Characterizing such high-frequency vertical oscillations would require multi-temporal topographic monitoring during the event or detailed stratigraphic analysis of channel deposits, which is beyond the scope of this event-scale topographic analysis.
While this study documents the spatial transition from incision to deposition along the river network, the underlying hydrologic and geomorphic mechanisms driving this transition remain to be explored in detail. Future work integrating hydraulic modeling and sediment transport dynamics is needed to fully elucidate the controls governing erosion–deposition patterns in steep mountain catchments during extreme rainfall events.
4.3. Coupling Between Hillslope Erosion and Channel Incision
In actively uplifting orogenic belts, river incision lowers local base levels and increases valley relief, thereby steepening adjacent hillslopes and promoting bedrock landsliding as a primary mechanism for relieving excess topographic relief [54]. Numerous studies have demonstrated that channel incision, lateral erosion, and headward erosion can destabilize adjacent hillslopes through toe undercutting, thereby promoting landslide initiation [19,55,56]. Conversely, landslides can also influence fluvial systems by delivering large volumes of sediment to channels, altering sediment fluxes and hydraulic conditions, and potentially enhancing bed and bank erosion [6,12,18,57,58]. These bidirectional interactions highlight that explicit consideration of hillslope–channel coupling is essential for understanding event-scale geomorphic and hydrological adjustments in mountainous watersheds subjected to extreme rainfall.
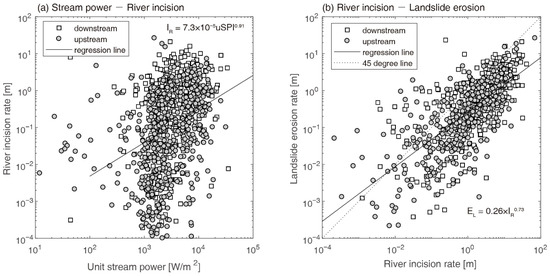
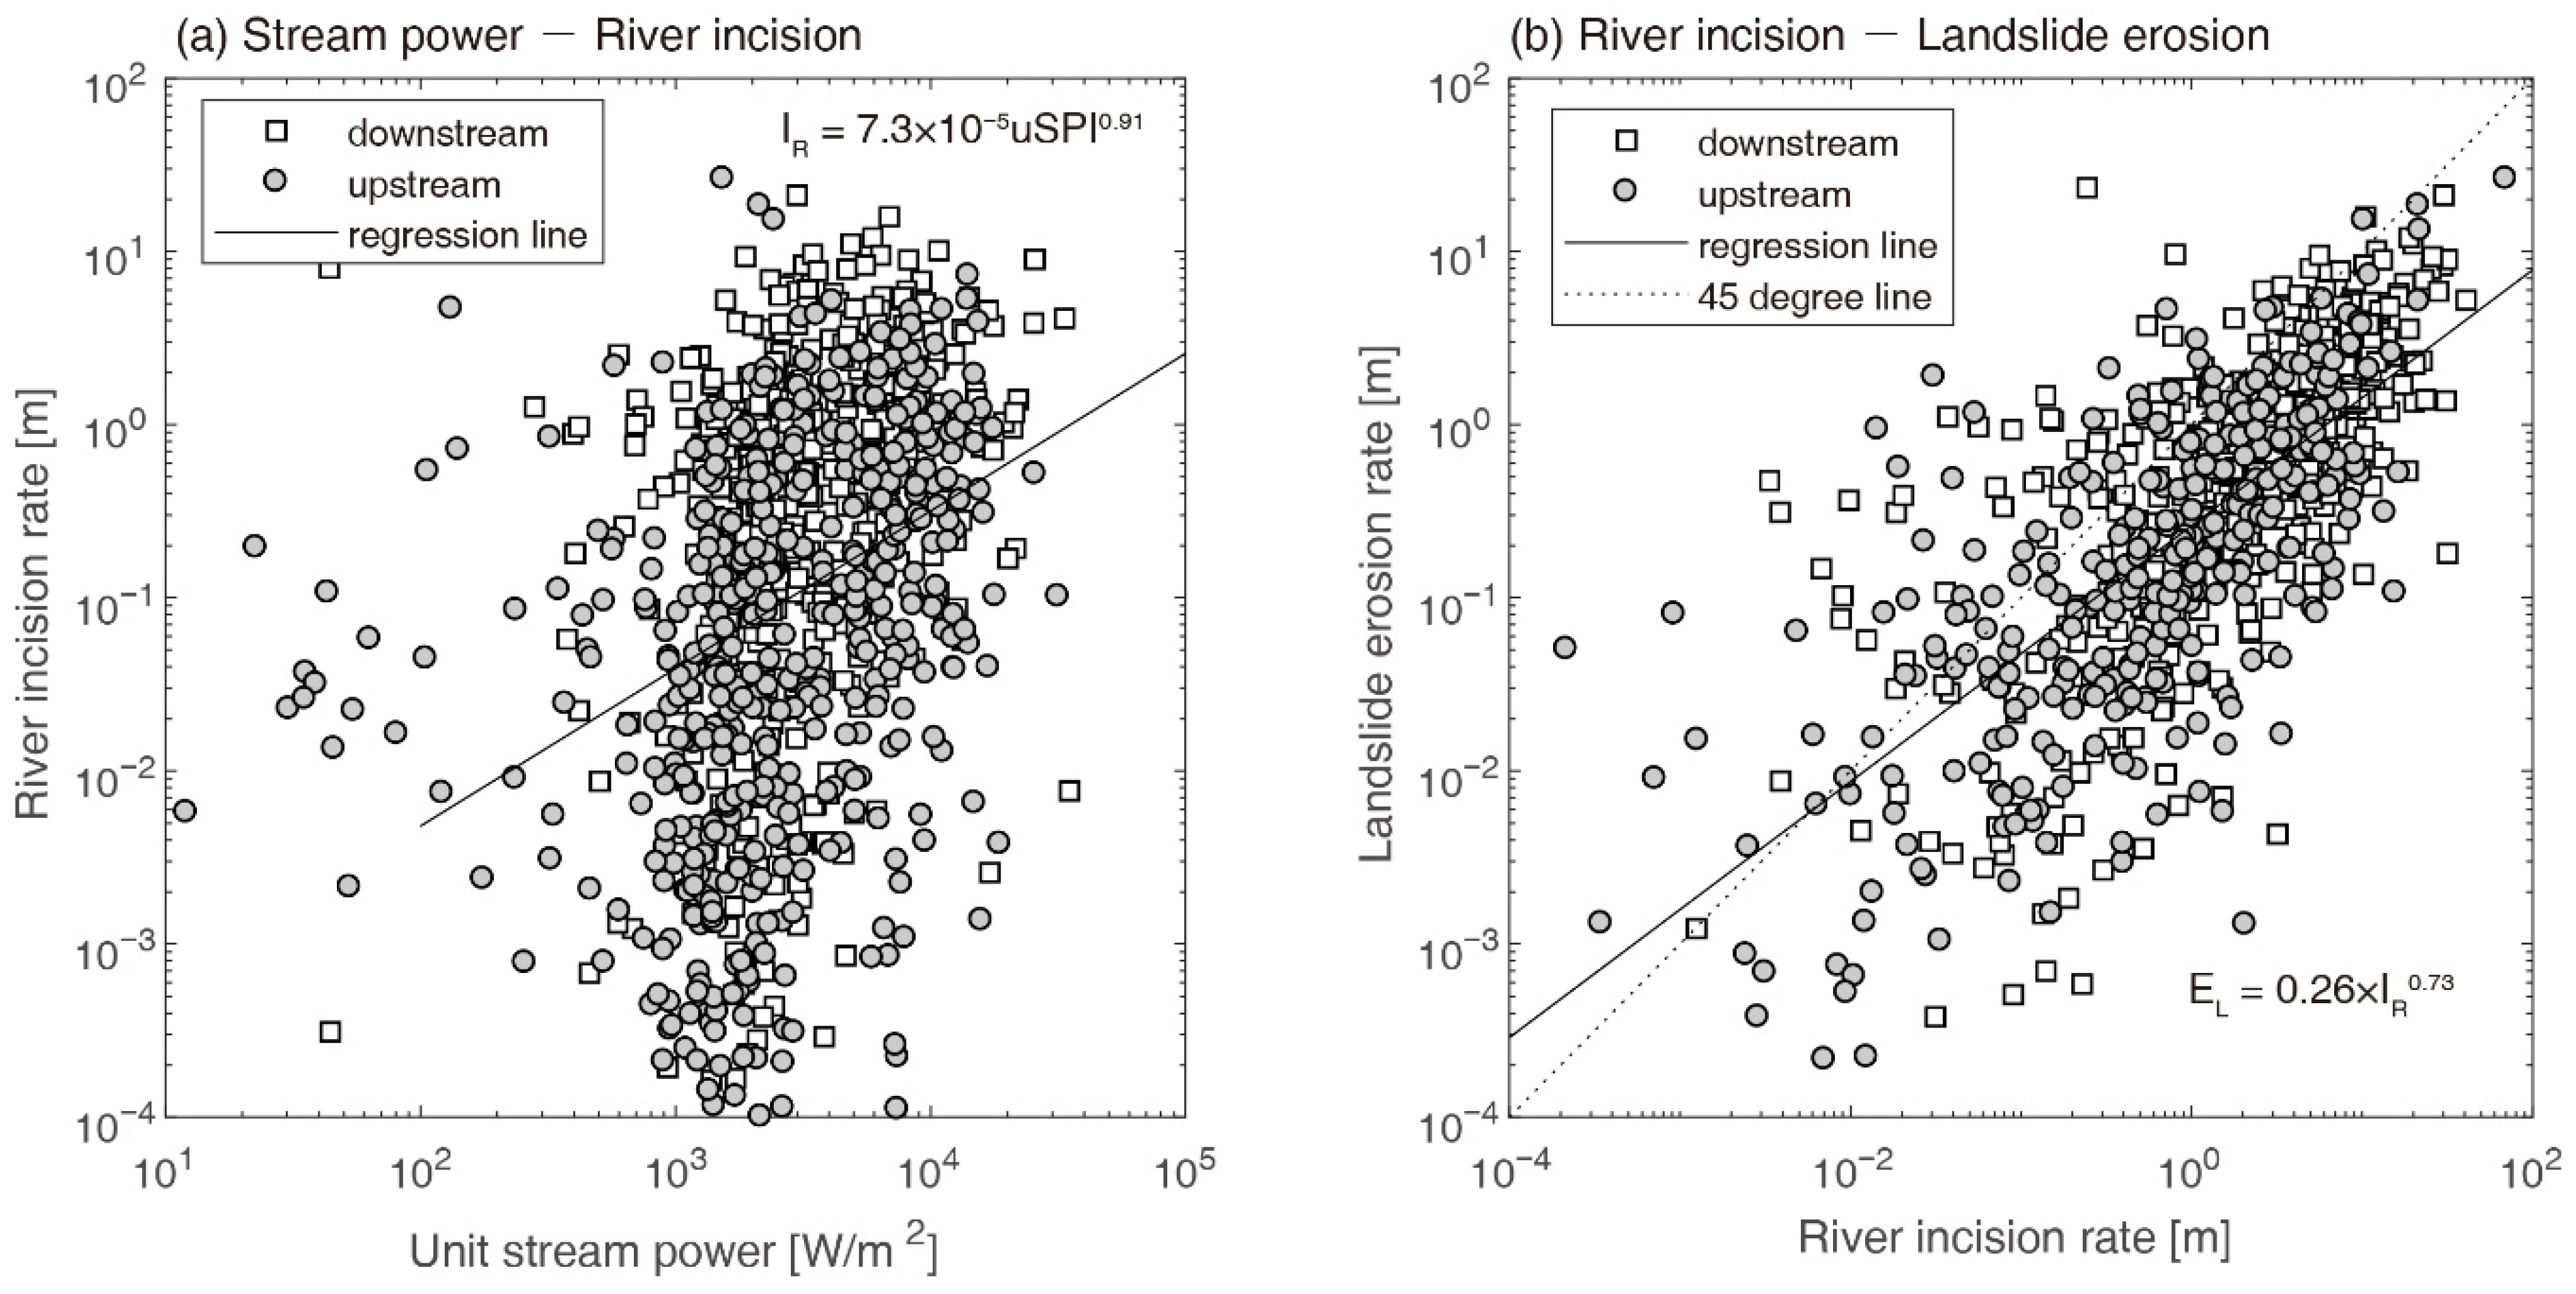
Larsen and Montgomery [19] demonstrated that long-term landslide erosion rates (1974–2007) in the Himalaya are significantly correlated with unit stream power (R2 = 0.36; p < 10−7), corresponding to a Pearson correlation coefficient of r = 0.60. In contrast, our results provide evidence for a different pattern at the event scale. Hillslope landslide erosion in the Sinwulu River watershed shows only weak but statistically significant correlations with unit stream power (Spearman r = 0.39 ** for the entire watershed and r = 0.36 ** for the upstream domain; Table 2). This weak relationship is consistent with Chen, Chang, Wang, Ho and Chen [17], who showed that unit stream power is strongly linked to landslide erosion mainly in a bedrock river watersheds in Taiwan. In contrast, the flow energy in high-sediment-load channels is often dispersed by braided patterns or mid-channel bars, reducing effective lateral undercutting and weakening the coupling between reach-averaged hydraulic indices and hillslope response. Consequently, unit stream power may be less effective in capturing incision-driven base-level lowering at the event scale. As shown in Figure 9a, river incision exhibits only weak but significant correlations with unit stream power (Spearman r = 0.39 ** for the entire watershed and r = 0.36 ** for the upstream domain), and their relationship can be described by the scaling law: IR = 7.3 × 10⁻⁵ USP0.91.
Figure 9.
Relationships among fluvial hydraulic forcing, channel incision, and hillslope landslide erosion. (a) Relationship between the hydraulic erosion index and channel incision. (b) Relationship between channel incision and landslide-derived hillslope erosion. Downstream reaches are shown as white squares, whereas upstream reaches are shown as gray circles. The solid black line denotes the logarithmic regression fit, and the dashed black line indicates the 1:1 (45°) reference line.
Instead, we observe a strong coupling between channel incision (IR) and hillslope landslide erosion (EL) during Typhoon Morakot, with Spearman correlation coefficients of r = 0.81 ** for the entire watershed and r = 0.79 ** for the upstream domain (Table 2; Figure 9b). The scaling relationship can be expressed as: EL = 0.26 × 10⁻⁵ IR0.73, indicating a systematic increase in landslide erosion with increasing channel incision magnitude. However, both the coefficient and the exponent are smaller than unity, implying a sub-linear response in which hillslope landslide erosion does not keep pace with channel incision during the observation period. This event-scale relationship highlights a key contribution of this study: directly measured channel incision provides a more effective indicator of hillslope response than unit stream power, discharge, channel gradient [59], and channel width.
Two mechanisms may explain the observed coupling between channel incision and hillslope landslide erosion. First, extreme hydrologic forcing (floods) drives rapid channel incision directly destabilizing adjacent hillslopes through toe erosion and local steepening, leading to landslide initiation [19,54]. Under this scenario, hillslope erosion should be most strongly linked to incision within the same reach. An alternative mechanism involves landslide-derived sediment enhancing abrasive erosion of the channel bed and banks during downstream transport, producing cumulative incision effects [8,52]. Although our results cannot exclude a contribution from sediment-enhanced abrasion to river incision, excessively high sediment loads may also induce a sediment cover effect that limits bed and bank erosion [7,60]. In our results, the absence of clear downstream amplification in longitudinal channel profiles in the whole watershed (Figure 6a), together with the strong reach-scale correspondence between channel incision and hillslope erosion (Figure 9b), supports the first mechanism. This tight coupling is evidenced by the strong correlation (r = 0.81) between channel incision and hillslope erosion. In the mechanically weak slates of the Hsinkao Formation, river incision creates a ‘perfect structural storm’ by stripping away the stabilizing toe material from dip-slope configurations. The loss of basal support leads to rapid, large-scale slope failure, explaining why direct topographic measurements of incision are such a high-fidelity indicator of hillslope response in this orogenic belt. These observations suggest that, during Typhoon Morakot, channel incision primarily acted as a local driver of adjacent hillslope failure, rather than being dominated by cumulative downstream abrasion effects. While the strong correspondence suggests tight coupling, the observational nature of this study does not allow definitive separation of cause and effect between incision and landsliding.
Taken together, these findings illustrate that hillslope–channel coupling during extreme events cannot be fully captured by proxy-based hydraulic metrics alone. Instead, event-scale topographic observations provide critical insights into the transient feedback between fluvial incision and landslide erosion, offering a complementary perspective to long-term erosion frameworks. This event-based approach has important implications for understanding sediment production, channel evolution, and landscape response to increasingly frequent extreme rainfall events under a changing climate.
5. Conclusions
This study presents an event-scale analysis of hillslope–channel interactions by quantifying landslide-related hillslope erosion and channel incision associated with Typhoon Morakot (2009) in the Sinwulu River watershed, Taiwan. Using high-resolution aerial SfM–MVS photogrammetry with canopy-height correction, we reconstructed pre- and post-event topography and quantified meter-scale geomorphic changes across the watershed. The results indicate that landslide erosion constituted the dominant source of sediment during the event, while channel responses exhibited clear spatial variability, characterized by incision in upstream reaches and deposition in downstream valley segments.
By delineating linked hillslope–channel units, this study identifies a statistically significant correspondence between channel incision and hillslope landslide erosion at the event scale. Although commonly used hydraulic proxies such as unit stream power show measurable relationships with erosion, the observed correlations are comparatively weaker than those based on directly measured incision. These findings suggest that direct topographic measurements provide complementary information to proxy-based metrics when examining geomorphic responses to extreme rainfall events.
Overall, the results highlight the value of event-scale topographic observations for examining hillslope–channel coupling during extreme rainfall. While the findings are specific to a single event and watershed, they illustrate how transient geomorphic responses may differ from patterns inferred from long-term or averaged datasets. Continued application of similar event-based approaches across different settings will be necessary to further constrain the mechanisms governing hillslope–channel interactions under extreme hydrometeorological forcing. Although this study focuses on a single extreme event, the analytical framework and event-scale metrics developed here are transferable to other steep, landslide-prone mountain catchments.
Funding
This research was supported by a grant from the National Science and Technology Council (MOST 107-2119-M-239-001 and MOST 108-2119-M-006-007).
Data Availability Statement
The data presented in this study are available on request from the corresponding author.
Acknowledgments
The authors appreciate the anonymous reviewers for their critical reviews and constructive comments.
Conflicts of Interest
The author declares no conflicts of interest. The funders had no role in the design of the study; in the collection, analyses, or interpretation of data; in the writing of the manuscript; or in the decision to publish the results.
Abbreviations
The following abbreviations are used in this manuscript:
| SfM-MVS | Structure-from-Motion Multi-View Stereo |
| DSM | Digital Surface Model |
| DEM | Digital Elevation Model |
| DMC | Digital Mapping Camera |
| ASRSB | Aerial Survey and Remote Sensing Branch |
| NIR | Near-infrared |
| GCP | Ground Control Point |
| ICP | independent Check Point |
| RMSE | Root Mean Square Error |
| CHM | Canopy Height Model |
| DoD | DSM differencing |
| USP | Unit Stream Power |
| SDR | Sediment Delivery Ratio |
References
- Naylor, L.A.; Spencer, T.; Lane, S.N.; Darby, S.E.; Magilligan, F.J.; Macklin, M.G.; Möller, I. Stormy geomorphology: Geomorphic contributions in an age of climate extremes. Earth Surf. Process. Landf. 2017, 42, 166–190. [Google Scholar] [CrossRef] [Scilit]
- Benda, L.; Dunne, T. Stochastic forcing of sediment routing and storage in channel networks. Water Resour. Res. 1997, 33, 2865–2880. [Google Scholar] [CrossRef] [Scilit]
- Chen, Y.-C.; Chang, K.-T.; Lee, H.-Y.; Chiang, S.-H. Average landslide erosion rate at the watershed scale in southern Taiwan estimated from magnitude and frequency of rainfall. Geomorphology 2015, 228, 756–764. [Google Scholar] [CrossRef] [Scilit]
- Chen, Y.-C.; Chang, K.-T.; Chiu, Y.-J.; Lau, S.-M.; Lee, H.-Y. Quantifying rainfall controls on catchment-scale landslide erosion in Taiwan. Earth Surf. Process. Landf. 2013, 38, 372–382. [Google Scholar] [CrossRef] [Scilit]
- Pinto, F.M.; Schuch, F.S.; Brentano, D.M. Extreme precipitation events and geomorphic adjustments in the riverscape: A case study in Southern Brazil. Resour. Environ. Sustain. 2023, 13, 100124. [Google Scholar] [CrossRef] [Scilit]
- Ho, J.-Y.; Lee, W.-L.; Liu, C.-H.; Sakai, N.; Chen, Y.-C.; Chang, C.-H.; Chen, H. River rejuvenation on a fluvial fan induced by typhoons and earthquakes. npj Nat. Hazards 2025, 2, 48. [Google Scholar] [CrossRef] [Scilit]
- Chen, W.-T.; Chen, Y.-C. Channel aggradation decelerates downstream sweep erosion in Daan river Gorge, Taiwan. Geosci. Lett. 2025, 12, 62. [Google Scholar] [CrossRef] [Scilit]
- Bennett, G.L.; Panici, D.; Rengers, F.K.; Kean, J.W.; Rathburn, S.L. Landslide-channel feedbacks amplify channel widening during floods. npj Nat. Hazards 2025, 2, 7. [Google Scholar] [CrossRef] [Scilit]
- Tunnicliffe, J.; Howarth, J.; Massey, C. Controls on fluvial sediment evacuation following an earthquake-triggered landslide: Observations from LiDAR time series. Sci. Adv. 2024, 10, eadi5560. [Google Scholar] [CrossRef] [Scilit] [PubMed]
- Huang, C.-C.; Ho, H.-C.; Lai, J.-S.; Lee, F.-Z. Experimental study with hydraulic modeling of a reservoir desilting operation using a sediment bypass tunnel. Environ. Earth Sci. 2023, 82, 313. [Google Scholar] [CrossRef] [Scilit]
- Kumcu, S.Y.; Kokpinar, M.A. Reservoir Sedimentation Under Changing Climate. In Hydrology and Urban Water Supply; Bahadir, A.M., Haarstrick, A., Karadirek, I.E., Aydin, M.E., Kumcu, S.Y., Bandyopadhyay, A., Eds.; Springer Nature: Cham, Switzerland, 2024; pp. 67–76. [Google Scholar]
- Liu, K.-F.; Wu, Y.-H.; Chen, Y.-C.; Chiu, Y.-J.; Shih, S.-S. Large-scale simulation of watershed mass transport: A case study of Tsengwen reservoir watershed, southwest Taiwan. Nat. Hazards 2013, 67, 855–867. [Google Scholar] [CrossRef] [Scilit]
- Death, R.G.; Fuller, I.C.; Macklin, M.G. Resetting the river template: The potential for climate-related extreme floods to transform river geomorphology and ecology. Freshw. Biol. 2015, 60, 2477–2496. [Google Scholar] [CrossRef] [Scilit]
- Jen, W.-H.; Chen, Y.-C. Photogrammetric Reconstruction of Multi-decadal Topographic Changes from Historical Aerial Imagery for Landslide and Debris-flow Hazard Assessment. Remote Sens. Appl. Soc. Environ. 2026, 41, 101866. [Google Scholar] [CrossRef] [Scilit]
- Ruetenik, G.A.; Ferrier, K.L.; Marc, O. Decadal-scale decay of landslide-derived fluvial suspended sediment after Typhoon Morakot. Earth Surf. Dyn. 2024, 12, 863–881. [Google Scholar] [CrossRef] [Scilit]
- Cook, K.L.; Turowski, J.M.; Hovius, N. River gorge eradication by downstream sweep erosion. Nat. Geosci. 2014, 7, 682–686. [Google Scholar] [CrossRef] [Scilit]
- Chen, Y.-C.; Chang, K.-T.; Wang, S.-F.; Ho, J.-Y.; Chen, J.-P. Influences of channel-hillslope characteristics on landslide erosion in meandering bedrock rivers. Catena 2024, 245, 108327. [Google Scholar] [CrossRef] [Scilit]
- Golly, A.; Turowski, J.M.; Badoux, A.; Hovius, N. Controls and feedbacks in the coupling of mountain channels and hillslopes. Geology 2017, 45, 307–310. [Google Scholar] [CrossRef] [Scilit]
- Larsen, I.J.; Montgomery, D.R. Landslide erosion coupled to tectonics and river incision. Nat. Geosci. 2012, 5, 468–473. [Google Scholar] [CrossRef] [Scilit]
- Dadson, S.J.; Hovius, N.; Chen, H.; Dade, W.B.; Hsieh, M.-L.; Willett, S.D.; Hu, J.-C.; Horng, M.-J.; Chen, M.-C.; Stark, C.P.; et al. Links between erosion, runoff variability and seismicity in the Taiwan orogen. Nature 2003, 426, 648–651. [Google Scholar] [CrossRef] [Scilit]
- Pazzaglia, F.J.; Gardner, T.W.; Merritts, D.J. Bedrock Fluvial Incision and Longitudinal Profile Development Over Geologic Time Scales Determined by Fluvial Terraces. In Rivers Over Rock: Fluvial Processes in Bedrock Channels; American Geophysical Union: Washington, DC, USA, 2013; pp. 207–235. [Google Scholar]
- Yang, Y.-E.; Yu, T.-T. Volumetric estimation of landslide-induced terrain change using conditional GAN with multi-temporal DEMs and satellite imagery. Int. J. Appl. Earth Obs. Geoinf. 2025, 144, 104864. [Google Scholar] [CrossRef] [Scilit]
- Li, P.; Li, D.; Hu, J.; Fassnacht, F.E.; Latifi, H.; Yao, W.; Gao, J.; Chan, F.K.S.; Dang, T.; Tang, F. Improving the application of UAV-LiDAR for erosion monitoring through accounting for uncertainty in DEM of difference. Catena 2024, 234, 107534. [Google Scholar] [CrossRef] [Scilit]
- Pawlik, Ł.; Kasprzak, M.; Ignatiuk, D.; Głowacki, T.; Milczarek, W.; Kajdas, J. Evaluation of the hillslope fine-scale morphology under forest cover with pit-mound topography—Integration of geomorphometry, geophysical methods, and soil features. Geomorphology 2024, 460, 109283. [Google Scholar] [CrossRef] [Scilit]
- Lu, L.; Zhou, Y.; Walker, R.T. Using historical aerial photographs to measure earthquake deformation: Testing the effects of scan resolution. Remote Sens. Environ. 2021, 252, 112118. [Google Scholar] [CrossRef] [Scilit]
- Smith, M.W.; Vericat, D. From experimental plots to experimental landscapes: Topography, erosion and deposition in sub-humid badlands from Structure-from-Motion photogrammetry. Earth Surf. Process. Landf. 2015, 40, 1656–1671. [Google Scholar] [CrossRef] [Scilit]
- Duan, Y.; Wu, K.; Zhou, J.; Yang, X.; Gao, D.; Liu, S. Automated high-resolution 3D crevasse extraction and dynamic linkages: An integrated UAV-LiDAR, photogrammetry, and C-TransUNet framework. Int. J. Appl. Earth Obs. Geoinf. 2025, 144, 104881. [Google Scholar] [CrossRef] [Scilit]
- Belloni, V.; Fugazza, D.; Hanson, K.; Scaioni, M.; Di Rita, M. Assessing glacier thickness changes with multi-temporal UAV-derived DEMs: The evolution of Forni Glacier over the period 2014–2022. Int. J. Appl. Earth Obs. Geoinf. 2025, 140, 104547. [Google Scholar] [CrossRef] [Scilit]
- Vosselman, G. Slope based filtering of laser altimetry data. Int. Arch. Photogramm. Remote Sens. 2000, 33, 935–942. [Google Scholar]
- Zhang, K.; Chen, S.-C.; Whitman, D.; Shyu, M.-L.; Yan, J.; Zhang, C. A progressive morphological filter for removing nonground measurements from airborne LIDAR data. IEEE Trans. Geosci. Remote Sens. 2003, 41, 872–882. [Google Scholar] [CrossRef] [Scilit]
- Peppa, M.V.; Mills, J.P.; Moore, P.; Miller, P.E.; Chambers, J.E. Automated co-registration and calibration in SfM photogrammetry for landslide change detection. Earth Surf. Process. Landf. 2019, 44, 287–303. [Google Scholar] [CrossRef] [Scilit]
- Kumar, G.; Yu-Chang, C.; Cheng-Wei, S.; Chen, C.-T. Decadal-scale assessment of sediment denudation rates in the Zhoukou River Basin, Taiwan: Insights from improved DEMs of differencing based on spectral analysis. Geomat. Nat. Hazards Risk 2024, 15, 2363428. [Google Scholar] [CrossRef] [Scilit]
- Choanji, T.; Jaboyedoff, M.; Yuskar, Y.; Samsu, A.; Fei, L.; Derron, M.-H. Evolution of Rockfall Based on Structure from Motion Reconstruction of Street View Imagery and Unmanned Aerial Vehicle Data: Case Study from Koto Panjang, Indonesia. Remote Sens. 2025, 17, 1888. [Google Scholar] [CrossRef] [Scilit]
- Fu, S.; de Jong, S.M.; Nijland, W.; Gravey, M.; Kraaijenbrink, P.; de Haas, T. Retrieving 4D landslide displacement using Pléiades satellite stereo pairs on the La Valette landslide. Int. J. Appl. Earth Obs. Geoinf. 2025, 140, 104613. [Google Scholar] [CrossRef] [Scilit]
- Lou, P.; Wu, T.; Chen, J.; Fu, B.; Zhu, X.; Chen, J.; Wu, X.; Yang, S.; Li, R.; Lin, X. Recognition of thaw slumps based on machine learning and UAVs: A case study in the Qilian Mountains, northeastern Qinghai-Tibet Plateau. Int. J. Appl. Earth Obs. Geoinf. 2023, 116, 103163. [Google Scholar] [CrossRef] [Scilit]
- He, H.; Ming, Z.; Zhang, J.; Wang, L.; Yang, R.; Chen, T.; Zhou, F. Robust estimation of landslide displacement from multitemporal UAV photogrammetry-derived point clouds. IEEE J. Sel. Top. Appl. Earth Obs. Remote Sens. 2024, 17, 6627–6641. [Google Scholar] [CrossRef] [Scilit]
- La Salandra, M.; Nicotri, S.; Donvito, G.; Italiano, A.; Colacicco, R.; Miniello, G.; Lapietra, I.; Roseto, R.; Dellino, P.; Capolongo, D. Observation and Geoinformation. Int. J. Appl. Earth Obs. Geoinf. 2024, 132, 103996. [Google Scholar]
- Yousefi, S.; Imaizumi, F. A comparative study of machine learning algorithms for sediment classification in debris flow fans using UAV imagery: A case study in the Ohya landslide scar, Japan. Landslides 2025, 22, 1123–1138. [Google Scholar] [CrossRef] [Scilit]
- Lu, M.-H. The Relationships Between Landslide and Sediment Discharge in the Periods of Earthquake and Typhoon Events Along the Catchment of the Sinwulyu River. Master’s Thesis, National Taiwan University, Taipei, Taiwan, 2007. [Google Scholar]
- Ching, K.E.; Hsieh, M.L.; Johnson, K.M.; Chen, K.H.; Rau, R.J.; Yang, M. Modern vertical deformation rates and mountain building in Taiwan from precise leveling and continuous GPS observations, 2000–2008. J. Geophys. Res. Solid Earth 2011, 116, B08406. [Google Scholar] [CrossRef] [Scilit]
- Lin, C.-Y.; Hsu, H.-M.; Sheng, Y.-F.; Kuo, C.-H.; Liou, Y.-A. Mesoscale processes for super heavy rainfall of Typhoon Morakot (2009) over Southern Taiwan. Atmos. Chem. Phys. 2011, 11, 345–361. [Google Scholar] [CrossRef] [Scilit]
- Yu, C.-K.; Cheng, L.-W. Distribution and mechanisms of orographic precipitation associated with Typhoon Morakot (2009). J. Atmos. Sci. 2013, 70, 2894–2915. [Google Scholar] [CrossRef] [Scilit]
- Chen, Y.-C.; Chang, K.-T.; Wang, S.-F.; Huang, J.-C.; Yu, C.-K.; Tu, J.-Y.; Chu, H.-J.; Liu, C.-C. Controls of preferential orientation of earthquake- and rainfall-triggered landslides in Taiwan’s orogenic mountain belt. Earth Surf. Process. Landf. 2019, 44, 1661–1674. [Google Scholar] [CrossRef] [Scilit]
- Wu, C.-H.; Chen, S.-C.; Chou, H.-T. Geomorphologic characteristics of catastrophic landslides during typhoon Morakot in the Kaoping Watershed, Taiwan. Eng. Geol. 2011, 123, 13–21. [Google Scholar] [CrossRef] [Scilit]
- Wu, Y.-H.; Liu, K.-F.; Chen, Y.-C. Comparison between FLO-2D and Debris-2D on the application of assessment of granular debris flow hazards with case study. J. Mt. Sci. 2013, 10, 293–304. [Google Scholar] [CrossRef] [Scilit]
- Huang, J.-C.; Milliman, J.D.; Lee, T.-Y.; Chen, Y.-C.; Lee, J.-F.; Liu, C.-C.; Lin, J.-C.; Kao, S.-J. Terrain attributes of earthquake- and rainstorm-induced landslides in orogenic mountain Belt, Taiwan. Earth Surf. Process. Landf. 2017, 42, 1549–1559. [Google Scholar] [CrossRef] [Scilit]
- Tseng, C.-W.; Song, C.-E.; Wang, S.-F.; Chen, Y.-C.; Tu, J.-Y.; Yang, C.-J.; Chuang, C.-W. Application of High-Resolution Radar Rain Data to the Predictive Analysis of Landslide Susceptibility under Climate Change in the Laonong Watershed, Taiwan. Remote Sens. 2020, 12, 3855. [Google Scholar] [CrossRef] [Scilit]
- Wang, Y.-H.; Chen, L.-H. An Overview of the Operations of the Forest Aerial Survey Institute, Forestry Bureau, Council of Agriculture. J. Cadastr. Surv. 2011, 30, 38–46. (In Chinese) [Google Scholar]
- Chen, S.-C.; Tsai, J.-T.; Chen, Y.-C.; Tsai, F.-H.; Liang, C.-Y.; Chiu, Y.-Y. Stream power curve–loop–spiral conceptual method and an application to rivers of Taiwan. J. Hydrol. Reg. Stud. 2023, 48, 101472. [Google Scholar] [CrossRef] [Scilit]
- Chen, T.-H.K.; Prishchepov, A.V.; Fensholt, R.; Sabel, C.E. Detecting and monitoring long-term landslides in urbanized areas with nighttime light data and multi-seasonal Landsat imagery across Taiwan from 1998 to 2017. Remote Sens. Environ. 2019, 225, 317–327. [Google Scholar] [CrossRef] [Scilit]
- Wolman, M.G. A method of sampling coarse river-bed material. EOS Trans. Am. Geophys. Union 1954, 35, 951–956. [Google Scholar]
- DeLisle, C.; Yanites, B.J.; Chen, C.-Y.; Shyu, J.B.H.; Rittenour, T.M. Extreme event-driven sediment aggradation and erosional buffering along a tectonic gradient in southern Taiwan. Geology 2022, 50, 16–20. [Google Scholar] [CrossRef] [Scilit]
- Lancaster, S.T. Evolution of sediment accommodation space in steady state bedrock-incising valleys subject to episodic aggradation. J. Geophys. Res. Earth Surf. 2008, 113, F04002. [Google Scholar] [CrossRef] [Scilit]
- Schmidt, K.M.; Montgomery, D.R. Limits to relief. Science 1995, 270, 617–620. [Google Scholar] [CrossRef] [Scilit]
- Burbank, D. Rates of erosion and their implications for exhumation. Mineral. Mag. 2002, 66, 25–52. [Google Scholar] [CrossRef] [Scilit]
- Wenske, D.; Jen, C.-H.; Böse, M.; Lin, J.-C. Assessment of sediment delivery from successive erosion on stream-coupled hillslopes via a time series of topographic surveys in the central high mountain range of Taiwan. Quat. Int. 2012, 263, 14–25. [Google Scholar] [CrossRef] [Scilit]
- Chen, Y.-C.; Wu, Y.-H.; Shen, C.-W.; Chiu, Y.-J. Dynamic Modeling of Sediment Budget in Shihmen Reservoir Watershed in Taiwan. Water 2018, 10, 1808. [Google Scholar] [CrossRef] [Scilit]
- Teng, T.-Y.; Huang, J.-C.; Lee, T.-Y.; Chen, Y.-C.; Jan, M.-Y.; Liu, C.-C. Investigating Sediment Dynamics in a Landslide-Dominated Catchment by Modeling Landslide Area and Fluvial Sediment Export. Water 2020, 12, 2907. [Google Scholar] [CrossRef] [Scilit]
- Baynes, E.R.C.; Kincey, M.E.; Warburton, J. Extreme Flood Sediment Production and Export Controlled by Reach-Scale Morphology. Geophys. Res. Lett. 2023, 50, e2023GL103042. [Google Scholar] [CrossRef] [Scilit]
- Sklar, L.S.; Dietrich, W.E. A mechanistic model for river incision into bedrock by saltating bed load. Water Resour. Res. 2004, 40, W06301. [Google Scholar] [CrossRef] [Scilit]

Disclaimer/Publisher’s Note: The statements, opinions and data contained in all publications are solely those of the individual author(s) and contributor(s) and not of MDPI and/or the editor(s). MDPI and/or the editor(s) disclaim responsibility for any injury to people or property resulting from any ideas, methods, instructions or products referred to in the content. |
© 2026 by the author. Licensee MDPI, Basel, Switzerland. This article is an open access article distributed under the terms and conditions of the Creative Commons Attribution (CC BY) license.