Article

Coupling Invasive Cattail (Typha spp.) Harvest and Biochar Application to Enhance Harvestable Chloride Pollution in Roadway-Associated Wet Bioswales


1
School of Environmental Sustainability, Loyola University Chicago, Chicago, IL 60660, USA
2
School for Environment and Sustainability, University of Michigan, Ann Arbor, MI 48109, USA
*
Author to whom correspondence should be addressed.
Water 2026, 18(6), 709; https://doi.org/10.3390/w18060709
Submission received: 20 February 2026 / Revised: 13 March 2026 / Accepted: 16 March 2026 / Published: 18 March 2026
(This article belongs to the Special Issue Wetland Conservation and Ecological Restoration, 2nd Edition)

Abstract

In cold climatic zones, highway transportation routes are significant contributors to sediment-accumulated chloride ions (Cl). Bioswale projects are designed to slow and treat roadway runoff and thereby meter the release of salts, but bioswale function is compromised over time as sediments become saturated with pollutants. This two-year project sought to test innovative practices to improve the function of Illinois Tollway (hereafter, Tollway) bioswales by investigating the effect of biochar addition (20 T/ha) and invasive plant harvesting on: (1) invasive cattail (Typha) dominance, (2) bioswale sediment chloride retention, and (3) harvestable chloride ions associated with living-green Typha tissues across a two-year field study in northeastern Illinois. We found that a single 20 T/ha biochar application resulted in significant increases in Typha [Dry Mass (g/m2) and Stem Count (count/m2), p ≤ 0.05] and sediment chloride concentration (ppm) [p ≤ 0.05]. Harvest did not significantly influence Typha standing stocks (p > 0.05) but did lead to a significant increase in harvestable chloride associated with living-green Typha tissues over the two-year study. This research demonstrates that a single 20 T/ha biochar application coupled with harvest of aboveground Typha biomass is a pathway for scalable management strategies to remove chloride and invasive standing stocks.

1. Introduction

Highway transportation routes in cold climatic zones significantly contribute chloride ions (Cl) to roadway-adjacent soils, particularly after spring stormflows and snowmelt [1]. De-icing salt applications to impervious surfaces are the primary source of anthropogenic chloride in these roadway systems. Throughout the northeastern United States, state transportation agencies apply up to one million metric tons of salt solids and 45 million liters of salt brines annually, resulting in region-scale pulses of water-soluble chloride ions that pollute nearby watersheds [2]. Annual flushes of salt ions can persist at chronic levels throughout the year despite short application windows [3], which reduces native plant growth and food web biodiversity while facilitating the spread of salt-tolerant invasive wetland plants [4,5]. Watershed salinization also diminishes drinking water quality, corrodes water infrastructure, and mobilizes toxic compounds [6,7]. Therefore, large-scale salt mitigation pathways via wetland conservation and restoration practices are critical for improving ecological services and biogeochemical cycles to reduce the impacts of road salt within watersheds.
Roadway-associated bioswale projects are an engineered Best Management Practice designed to slow and treat precipitation runoff with the intent to mitigate salts and heavy metals released to the watershed. Research indicates that bioswale infrastructure significantly reduces sodium and chloride loads in effluent surface water via soil storage and groundwater infiltration [8]. Although effective pollutant sinks, wet bioswales often inadvertently harbor invasive plant populations due to their degraded wetland conditions [9,10]. High-density invasive plant standing stocks reduce both sightlines and bioswale function by clogging inlets/outlets, reducing infiltration rates, and limiting water storage capacity. Specifically in North America, invasive cattails (Typha × glauca and Typha angustifolia, hereafter Typha) and common reed (Phragmites australis, haplotype M) are ubiquitous and aggressive invasive aquatic plants common in roadside ditches, detention basins, and wet bioswales. North American transportation routes maintain invasive plant source populations as roadside ditches act as invasion corridors that exacerbate propagule spread to uninvaded wetlands [10].
Typha and P. australis invasions result in reduced diversity of wetland plants, amphibians, invertebrates, and birds driven by accumulated living-green and standing-dead biomass [11,12,13,14]. Typha and P. australis dominate degraded, eutrophic systems as they actively assimilate macronutrients to support rapid annual growth rates and deploy multiple strategies for tolerating high salinity levels [14,15,16,17]. In terms of removable salt ions, research has demonstrated that monotypic stands of invasive wetland plants (specifically Typha) in highway retention basins readily accumulate high quantities of chloride in their tissues [18]. Typha has also been shown to accumulate significantly greater quantities of chloride in aboveground tissues compared to P. australis [19], indicating a greater chloride removal potential in Typha tissues. Thus, this current research focuses on novel wetland restoration strategies to understand the potential removal of living-green Typha tissue-associated chloride and sediment retention of chloride in wet bioswales.
The integration of nature-based solutions into novel highway-maintenance strategies is anticipated to improve chloride capture and ecological function. Harvesting and removing Typha biomass from wet bioswales provides a salt sequestration management pathway to capture tissue-associated salts [20,21]. Furthermore, invasive plant harvesting has demonstrated additional ecological co-benefits by increasing native plant diversity in tandem with reducing plant-available nutrient pools associated with Typha tissues [22,23,24]. Thus, harvesting Typha standing stocks in polluted roadway-associated sediments is projected to provide ecological, phytoremediation, and engineering benefits within wet bioswales [25], but practical barriers remain.
Biochar is a carbon-rich and porous material derived by heating organic waste biomass (i.e., wood waste, manure, municipal biosolids) in a low-oxygen environment to restrict combustion to ash. As a potential amendment in wet bioswales, biochar’s high porosity and negatively charged surface are projected to increase surface absorption of macronutrients, organic compounds, and salts [26,27,28]. Studies of biochar application to wetlands indicate that nutrients (N and P) are retained at higher levels [29,30], while methane (CH4) emissions are typically reduced with flooded soils [31]. Research on biochar in saline systems shows enhanced plant growth [32], which may provide a subsequent increase in Typha salt uptake in bioswale systems. In terrestrial systems, biochar application has been shown to alleviate salt stress in plant rooting zones, but mechanisms are unknown when applied to wetlands [26,33,34,35]. To date, it is unclear how biochar applications will influence chloride pools within Typha harvesting management practices in wet bioswales.
Harvesting Typha standing stocks to enhance wet bioswale function results in high quantities of low-value biomass that can hinder cost-effective adoption on a practical scale. Post-harvest biomass utilization pathways are emerging for energy production (anaerobic digestion and biofuel pellets) and as an agricultural input (soil amendment, compost, and cattle bedding), but remain rarely implemented [36]. An emerging soil amendment, biochar production from harvested invasive plant biomass, is a promising approach projected to reduce initial feedstock volume and produce a high-value soil amendment to remediate wetland pollutants. As biochar production and application are relatively new technologies, many basic research questions still must be addressed as industry ramps up biochar production globally. Research investigating multi-year soil and plant responses to biochar has garnered attention in agricultural spheres due to increases in crop productivity, carbon sequestration, and nutrient retention properties [37]. The use of biochar application specifically in ecosystem restoration as a tool to improve plant community biodiversity has been reviewed [38,39,40,41] but sparsely explored in wetlands outside of water treatment plant applications [42,43,44].
Small-scale biochar production research from invasive species feedstocks is emerging but understudied for on-site reapplication or alternative large-scale soil amendment applications [45,46,47]. Barriers to production include transportable biochar equipment, initial cost, and protocol buy-in for land managers and restoration practitioners. Despite a lack of invasive species biochar production on-site, industrialized biochar production from waste-stream feedstocks (i.e., wood waste) has accelerated as a readily available management solution for practitioners in roadway systems [48,49]. In this manuscript, we investigate commercially available biochar applications to degraded wetlands to explore basic research insights into biochar until technological innovations overcome barriers for invasive species biochar production pathways.
Coupling aboveground Typha harvesting and biochar application is a practical remediation strategy anticipated to enhance plant growth and tissue-associated salt concentrations in wet bioswales. This research scales biochar application in roadway-associated bioswales to investigate management-level pathways for road salt mitigation to improve downstream watershed quality. We experimentally investigated a full-factorial multi-year wet bioswale field study to evaluate chloride pools after wood-waste biochar addition and Typha biomass harvesting to enhance chloride removal potential within northern Illinois bioswales.

2. Materials and Methods

2.1. Study Area: Illinois Tollway Bioswale Characteristics and Selection

The Tollway maintains 470 km of toll roads across 12 counties in northern Illinois, USA. As the Tollway system services nearly nine million people, winter road salt application coupled with plowing is required to maintain safe driving conditions on roadways. The Tollway deploys liquid salt brines composed of NaCl and CaCl2, designed to effectively coat roadways and reduce annual salt application rates. During Tri-State Tollway (I-294) reconstruction, bioswale stormwater management systems were installed to mitigate runoff volumes and pollutant loads to downstream natural areas [50]. The Tollway defines bioswales as a swale that utilizes vegetation and amended soils to treat stormwater by filtering out contaminants being conveyed in stormwater [51]. To evaluate bioswale efficacy, research has compared pre- and post-construction bioswale water quality to demonstrate that both wet and dry bioswales attenuate chlorides and decrease total suspended solids, total dissolved solids, and roadway metals (chromium, copper, lead, nickel, and zinc) along the Tollway’s I-294 corridor [52]. Despite bioswale efficacy, mean chloride concentrations exceeded the Illinois General Use Standard of 500 mg/L in all but one researched bioswale between 2012 and 2016, indicating chronic exceedance of the chloride standard [52].

2.2. Experimental Design

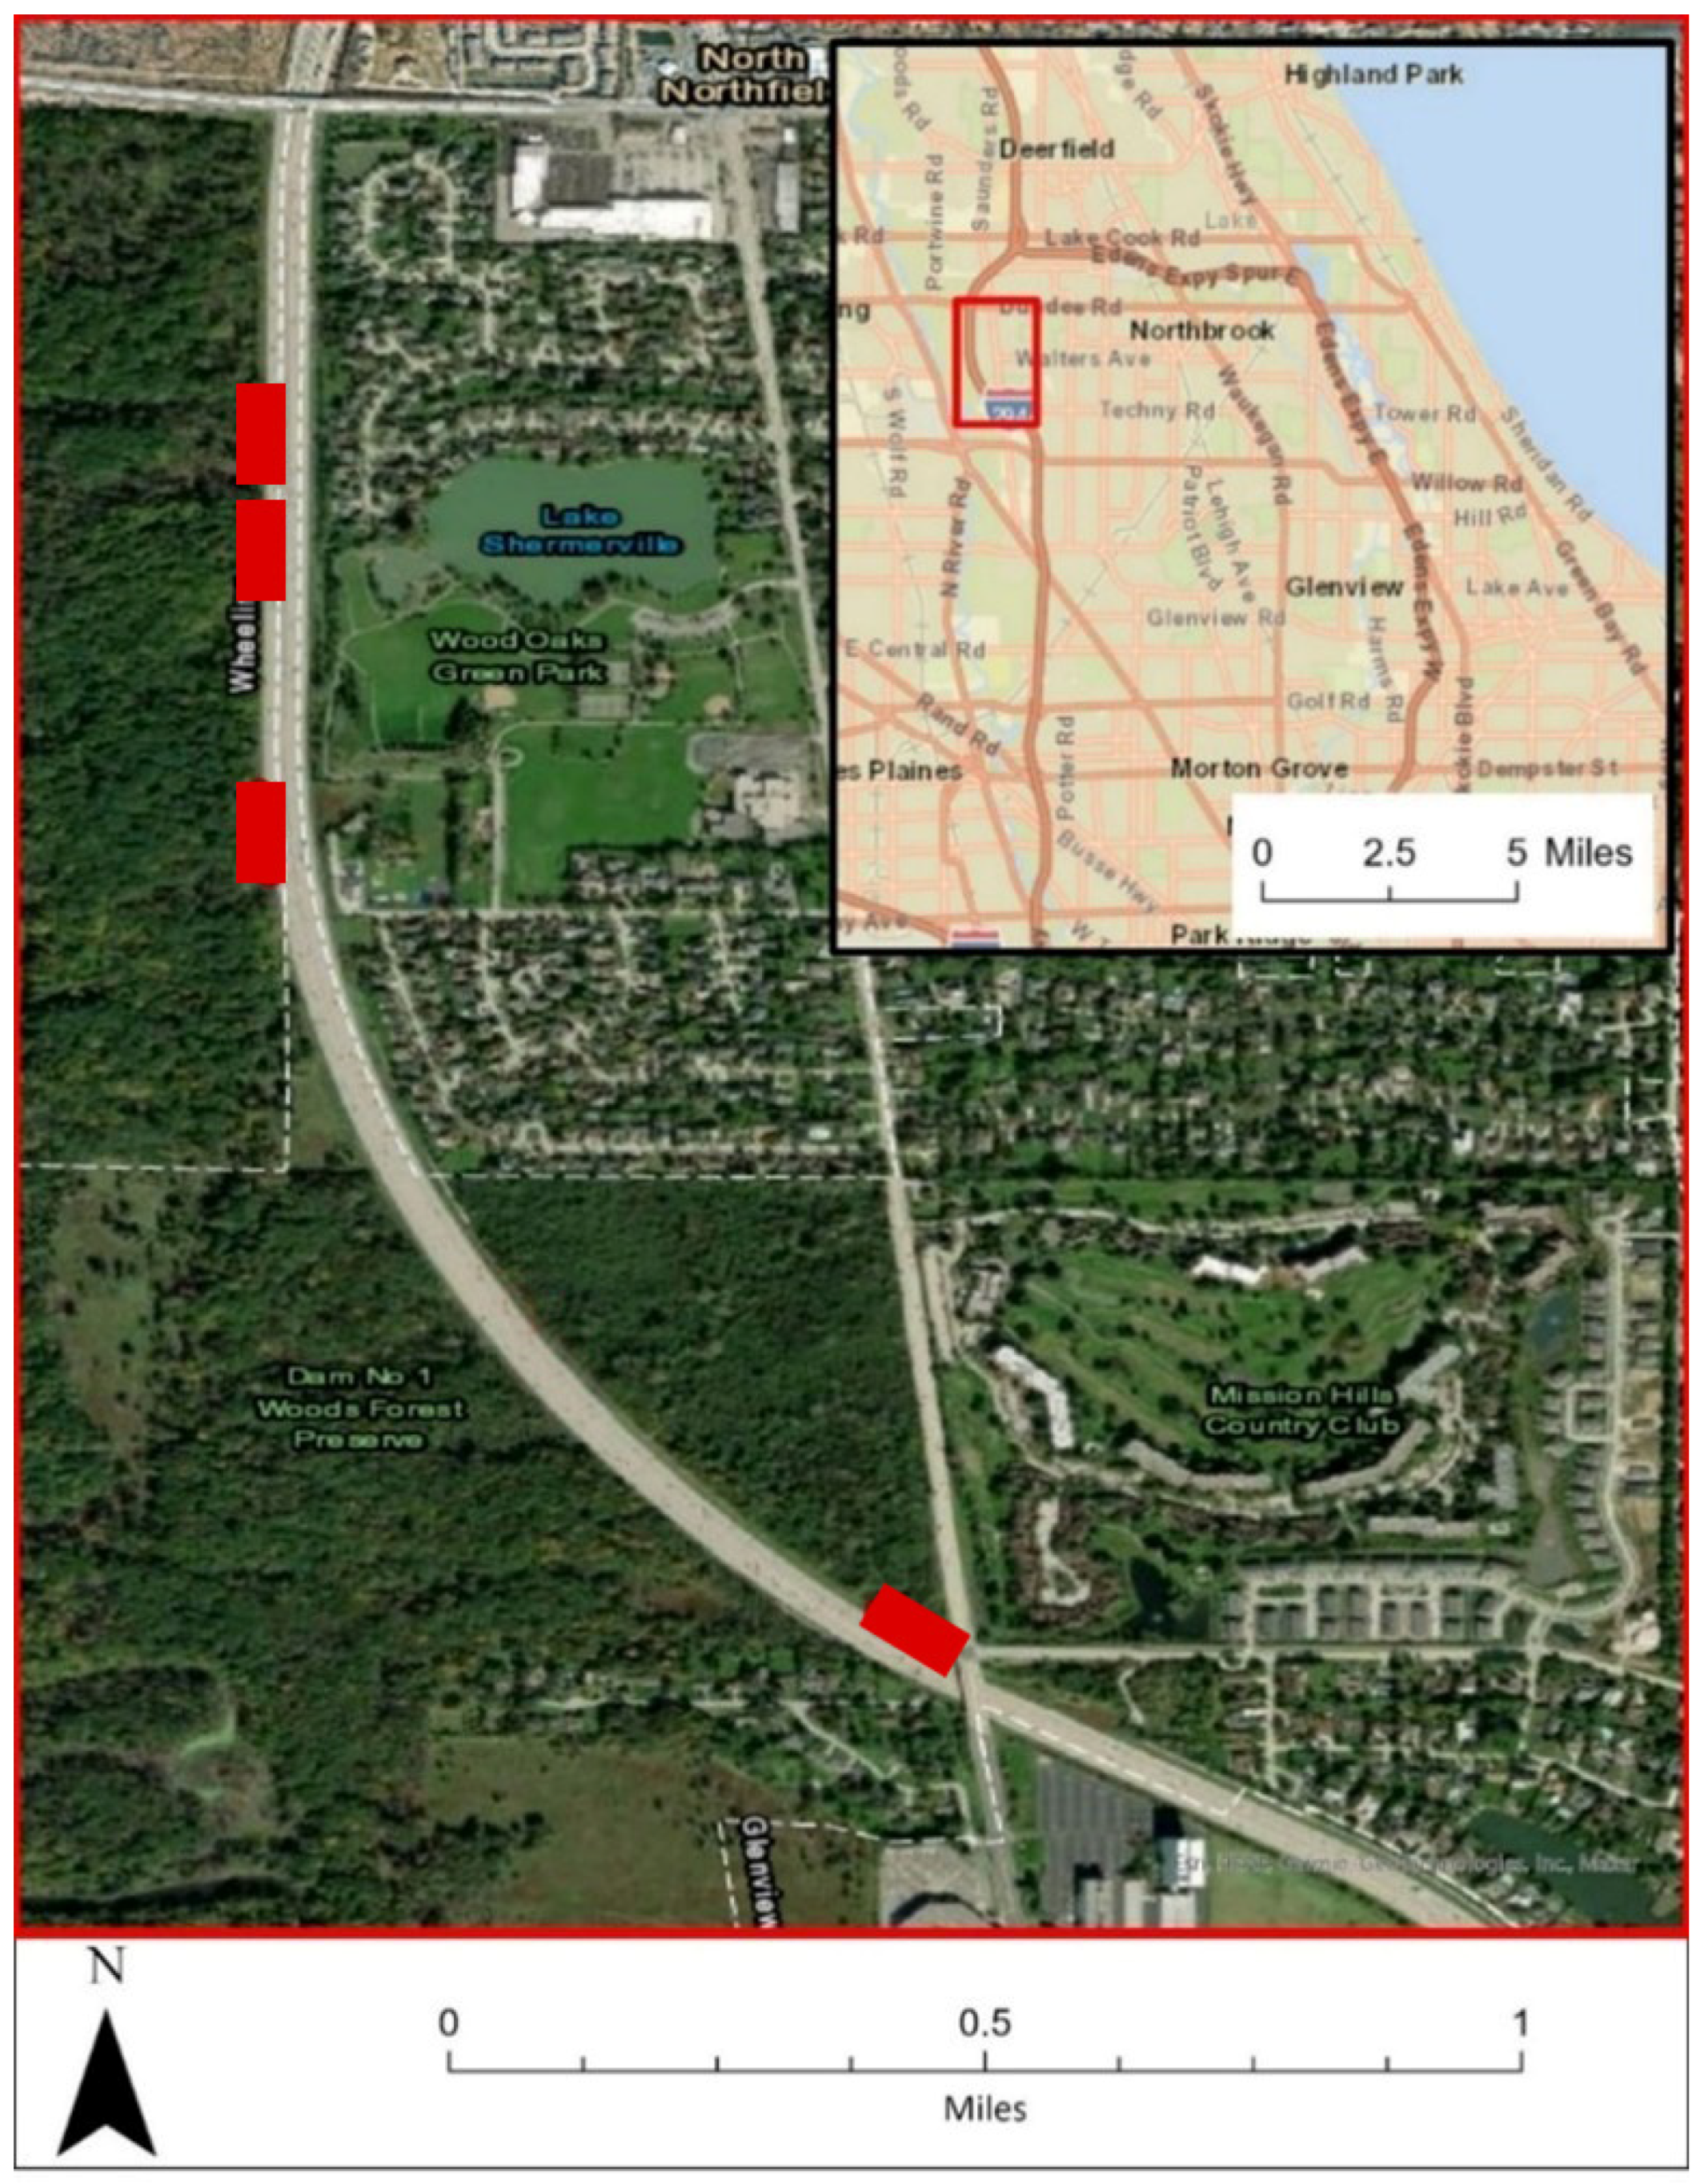
To select experimental sites, we employed the Tollway’s internal Illinois Tollway Cartegraph system to identify bioswales that met the following criteria: (1) Bioswale Type: Type 2—Wet; (2) Route: I-294; and (3) Length: 46–457 m. We selected 4 of 28 bioswales along the Tri-State Tollway (I-294) corridor that accommodated the study’s experimental design (Figure 1). Bioswales were scouted and selected based on vegetation similarity along the length of the bioswale, presence of our target plant species (Typha) along the bioswale, minimal apparent external hydrological inputs, and hydrological similarity. All selected bioswales resided within a span of 2.1 km along the I-294 corridor.
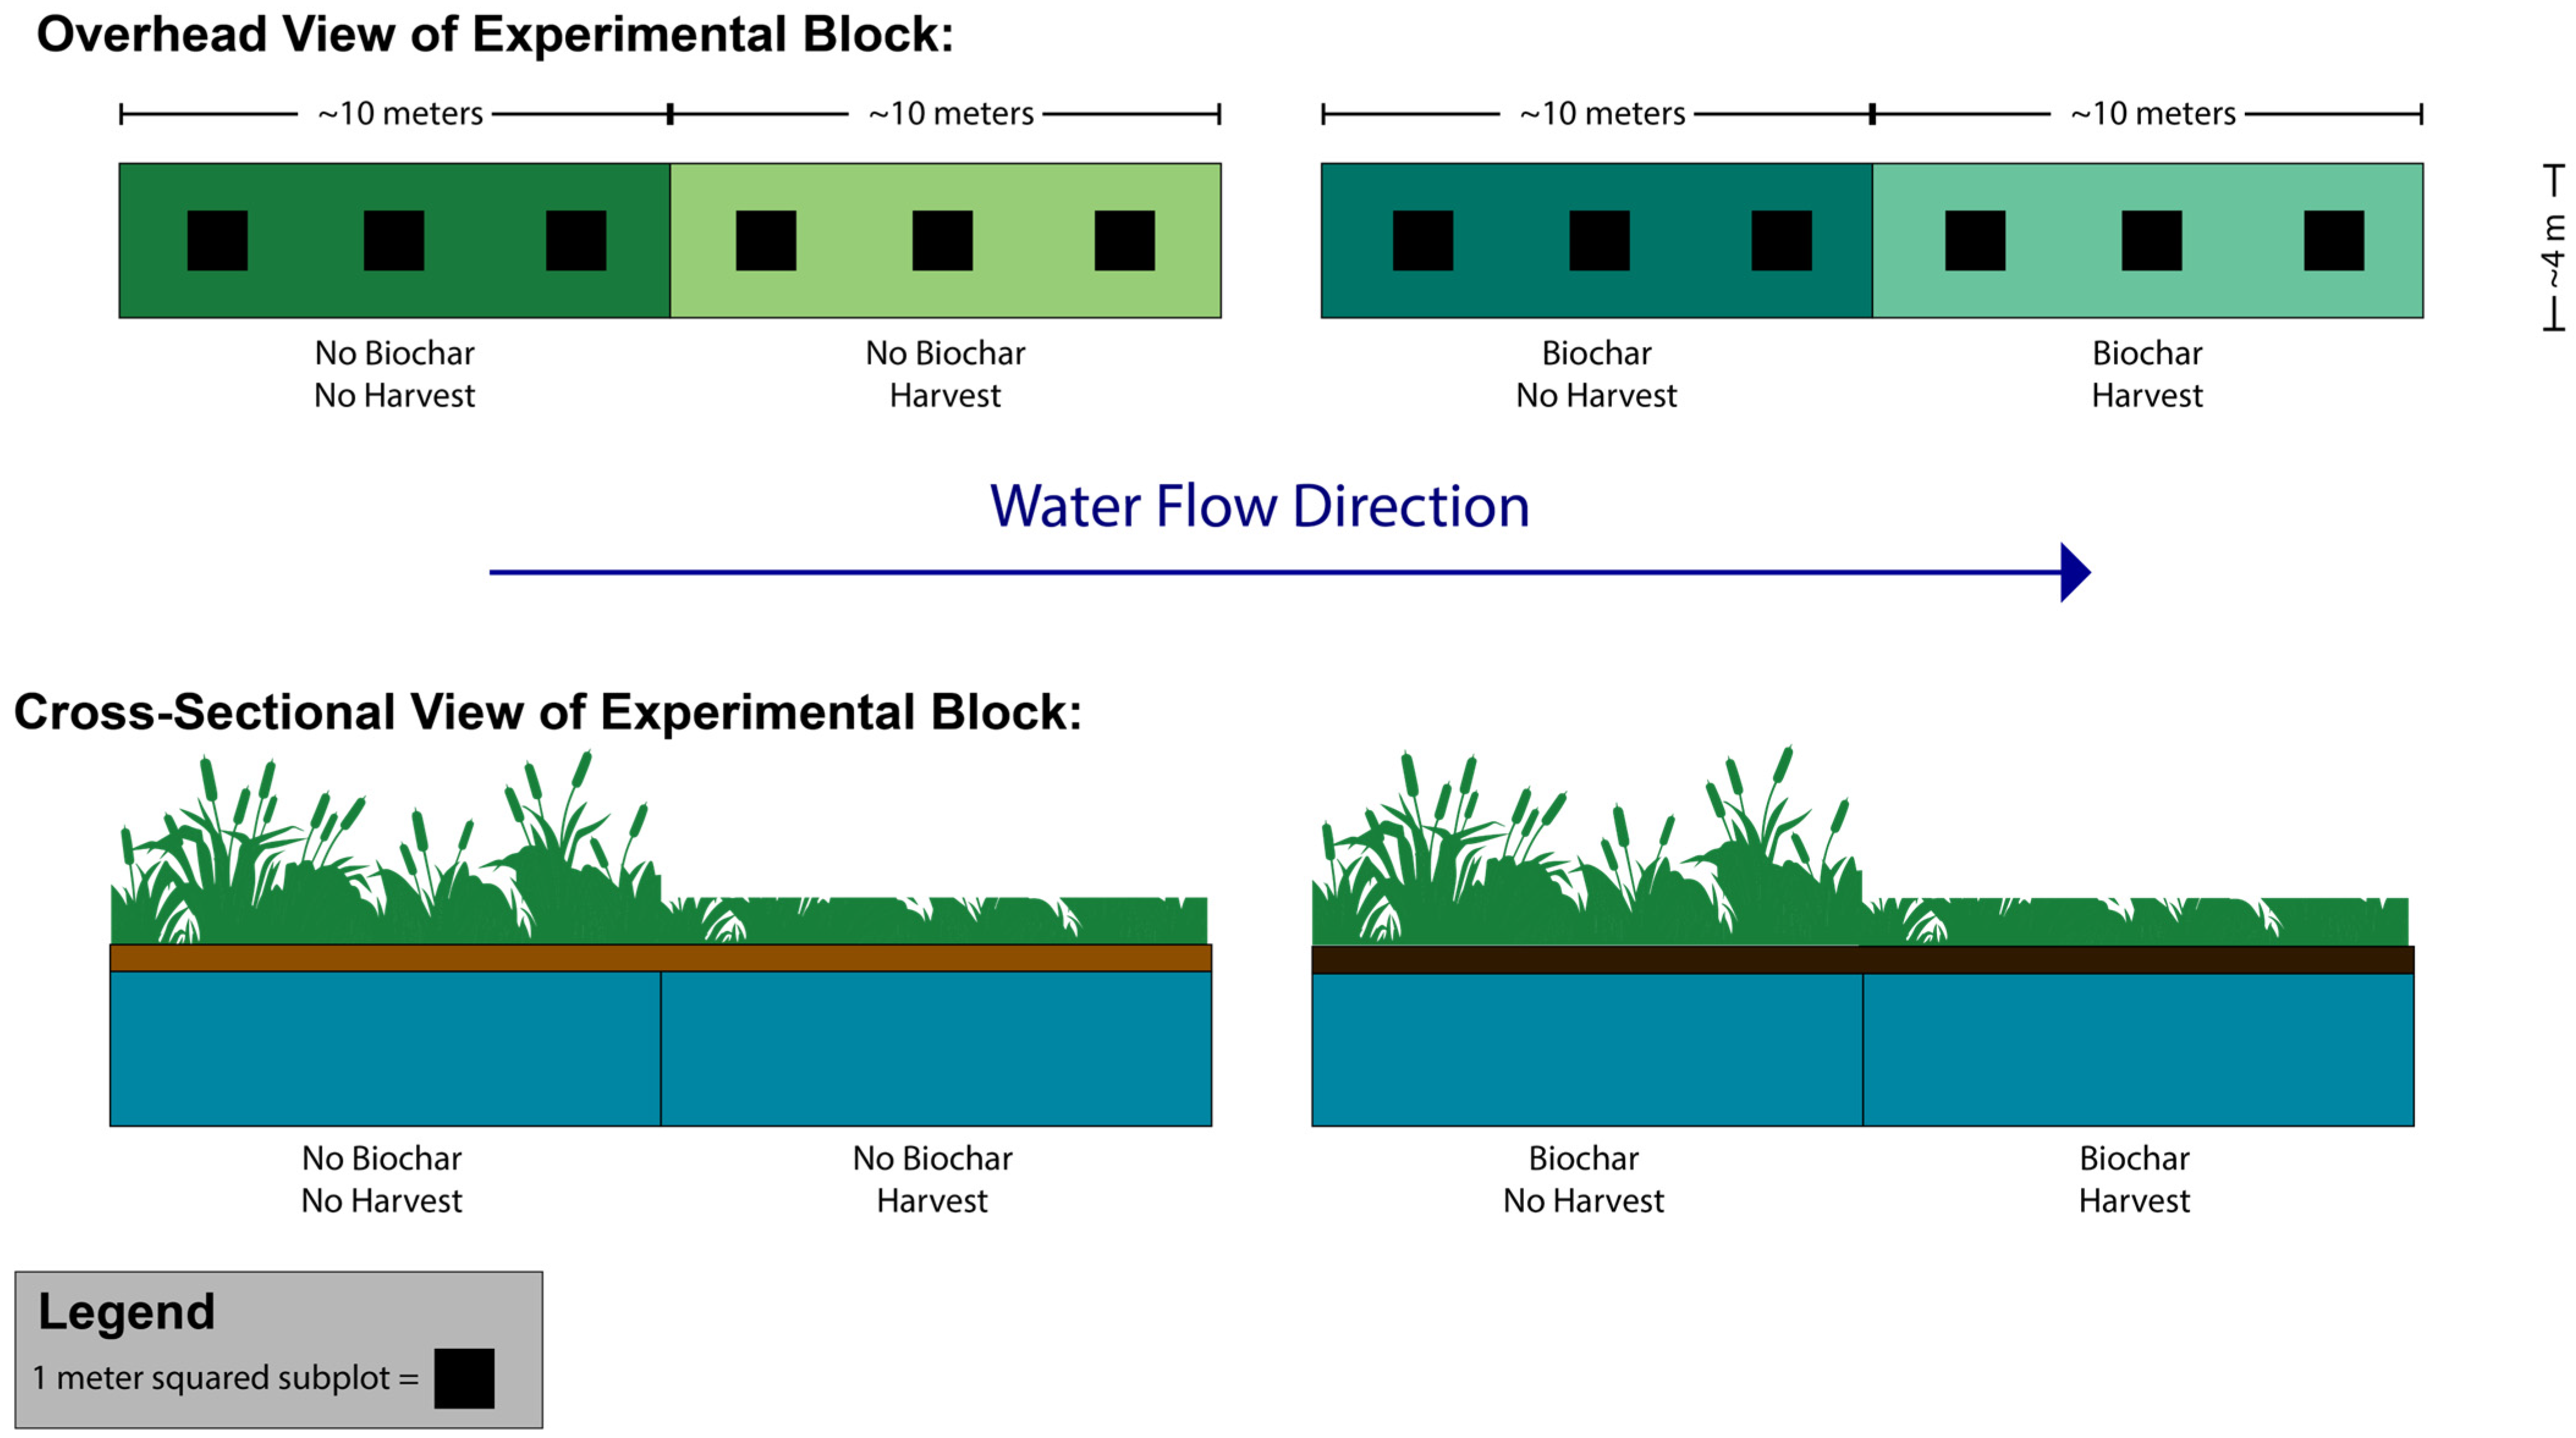
Between fall 2022 and fall 2024, we conducted a multi-year, full-factorial experiment within Tollway wet bioswales investigating the following treatments: (1) twenty (20) metric tons [T]/hectare [ha] wood-waste biochar [20 T/ha biochar/0 T/ha biochar], and (2) annual aboveground Typha biomass harvest and removal at peak growing season [harvest/no harvest] across four (4) Tollway wet bioswales. We deployed a full-factorial, blocked experiment design with each replicate block measuring 4 m wide × 40 m long, containing established Typha populations. Each block was divided into 4 m wide × 10 m long plots containing three (3) subplots (Figure 2). To minimize hydrological movement of applied biochar, note that the biochar application plots (20 T/ha) were positioned downstream of the 0 T/ha plots. Prior to treatment implementation in fall 2022, pre-treatment data were collected [Typha cover, plant litter cover, and chloride ion concentration in sediments] in each block to determine block similarities.
In November 2022, the first aboveground vegetative biomass harvest was conducted with aquatic weedwhackers capable of cutting biomass underwater in corresponding treatments. Living and standing-dead biomass was clipped near the sediment surface, raked, and hand-removed from respective treatments to simulate aboveground Typha mowing and removal. Following harvest, we hand-applied a one-time wood-waste biochar application [Wakefield® BioChar] to corresponding treatments at a rate of 20 T/ha. Following Year 1 vegetative and sediment sampling [October 2023], a second vegetative biomass harvest was conducted as described above.

2.3. Vegetation Sampling

Between fall 2022 and fall 2024, we collected annual vegetation data from all bioswales to capture peak plant community growth prior to fall vegetative senescence. Within each 1 × 1 m subplot (Figure 1), we estimated plant species richness to the nearest percentage value. To assess predicted Typha biomass non-destructively in the field, stem heights and inflorescence presence were recorded in each subplot in fall 2023 and fall 2024. Individual Typha stem heights and inflorescence presence values were used to estimate grams of Typha Dry Mass/m2 following a modified published prediction method [53]. In this study, our Typha biomass predictive model employed the 75 samples collected in northern Michigan [53] and 262 samples collected within the Illinois Tollway system as described [20]. In total, our predictive model was developed with 337 Typha measures (i.e., Typha stem heights and inflorescence presence) coupled with dry Typha biomass to derive our Typha biomass prediction estimations. In this field study, the second-highest-resolution predictive model (Typha stem heights and inflorescence presence) was employed in the field to estimate total subplot Typha biomass [53].

2.4. Chemical Analysis of Plant Tissues and Sediments

We collected plant tissue and sediment samples in spring 2023/spring 2024 and fall 2023/fall 2024 sampling periods. At each time point, we randomly collected a single Typha stem for chemical tissue analyses at each subplot. Sediment samples in each subplot were collected using a 3.6 cm radius × 10 cm depth bulb planter. Living Typha tissue samples were frozen, oven-dried at 60 °C, and subsequently ground in a Thomas Wiley® mill prior to chemical analyses. Plant tissue and sediment samples were prepared for ionic analyses following a protocol modified from Cataldi et al. [54]. Specifically, dried and ground samples were standardized to 1500 mg, suspended in 30 mL of deionized water (18.2 MΩ·cm resistivity, obtained using a Milli-Q water purification system, Millipore, Bedford, MA, USA), and extracted by mechanical shaking at 220 rpm for 20 min at room temperature. Water extraction was selected specifically to avoid contamination of the chloride target analyte, as the common use of hydrochloric acid (HCl) would introduce chloride ions and interfere with accurate measurement. This water extraction approach was adopted by Cataldi et al. [54] to determine select anion concentrations. Following extraction, suspensions were filtered through 0.22-μm polytetrafluoroethylene (PTFE) syringe filters (TISCH Scientific, Inc., Cleveland, OH, USA) to yield approximately 6 mL of filtered extract prior to ion chromatography analysis.
All anion (i.e., chloride) analyses were performed using a Metrohm 940 Vario ion chromatograph equipped with a Metrohm 858 Sampler (Metrohm USA, Riverview, FL, USA) for automated sample injection and analysis at Loyola University Chicago’s School of Environmental Sustainability. The anion analytical system consisted of a Metrohm A Supp 5 150/4.0 column with a Metrohm A Supp 4/5 Guard column (Metrohm USA, Riverview, FL, USA). The anion eluent was prepared daily by diluting 10 mL of Metrohm USA A SUPP 19 (Anion Suppressor Eluent Concentrate, Metrohm USA, Riverview, FL, USA) to 1000 mL with deionized water. Anion calibration standards were prepared from certified reference materials (TraceCERT®, Sigma-Aldrich Produktion GmbH, Schaffhausen, Switzerland) at 1000 mg/L nominal concentrations, including chloride, fluoride, phosphate, nitrite, nitrate, bromide, and sulfate. The anion stock solution for calibration was prepared by combining 9 mL of each individual anion standard and diluting to 100 mL with Milli-Q deionized water (18.2 MΩ·cm resistivity). Working calibration standards were prepared by appropriate dilution of this stock solution to establish a calibration curve prior to sample analysis. Data acquisition and processing were performed using MagICNet software 3.3 (Metrohm USA, Riverview, FL, USA).
Following Typha Dry Mass predictions (g/m2) and Typha tissue chloride concentrations (ppm) per subplot, total harvestable chloride (g/m2) was scaled and estimated based on total aboveground living Typha stock in fall 2023 and fall 2024.

2.5. Statistical Analyses

Data analyses required linear mixed-effects (LME) modeling to account for the multi-year, nested block design in the experiment. Using the lme4 package (version 2.0-1) [55] in R (version 4.5.2) [56], LME models included both fixed-effects terms (i.e., harvest/no harvest; 20 T/ha biochar/0 T/ha biochar) and a random-effect term (1|time/block) to account for repeated measurements at each block and subplot location. To choose the most parsimonious model, Bayesian Information Criteria (BIC) model selection statistically selected the best-fitting model from a matrix of log- and square-root-transformed models that included treatment main effects and interactions. BIC model values with delta ≤ 2 were considered statistically equivalent. After selecting the best-fitting model, estimated marginal means (EMMs) were calculated to determine treatment-level contrasts using the emmeans package (version 2.0.2) in R [57]. Reported significant p-values (p ≤ 0.05) and trends (0.10 ≥ p > 0.05) for each statistical contrast are displayed graphically for each LME analysis. All LME model assumptions were assessed to confirm residual normality and residual homogeneity of variance.

3. Results

3.1. Pretreatment Data Results

In fall 2022, total plant cover (%/m2), Typha cover (%/m2), and sediment chloride concentration (ppm) were assessed to establish detectable differences in baseline plant community metrics. Total plant cover (p > 0.05), Typha cover (p > 0.05), and sediment chloride concentrations (p > 0.05) were not significantly different prior to treatment establishment in fall 2022 [Linear Mixed Effects Models: random effect (1|block)]. Baseline plant community metrics were determined to be statistically similar, indicating no significant environmental bias in pre-treatment conditions.

3.2. Vegetative Responses

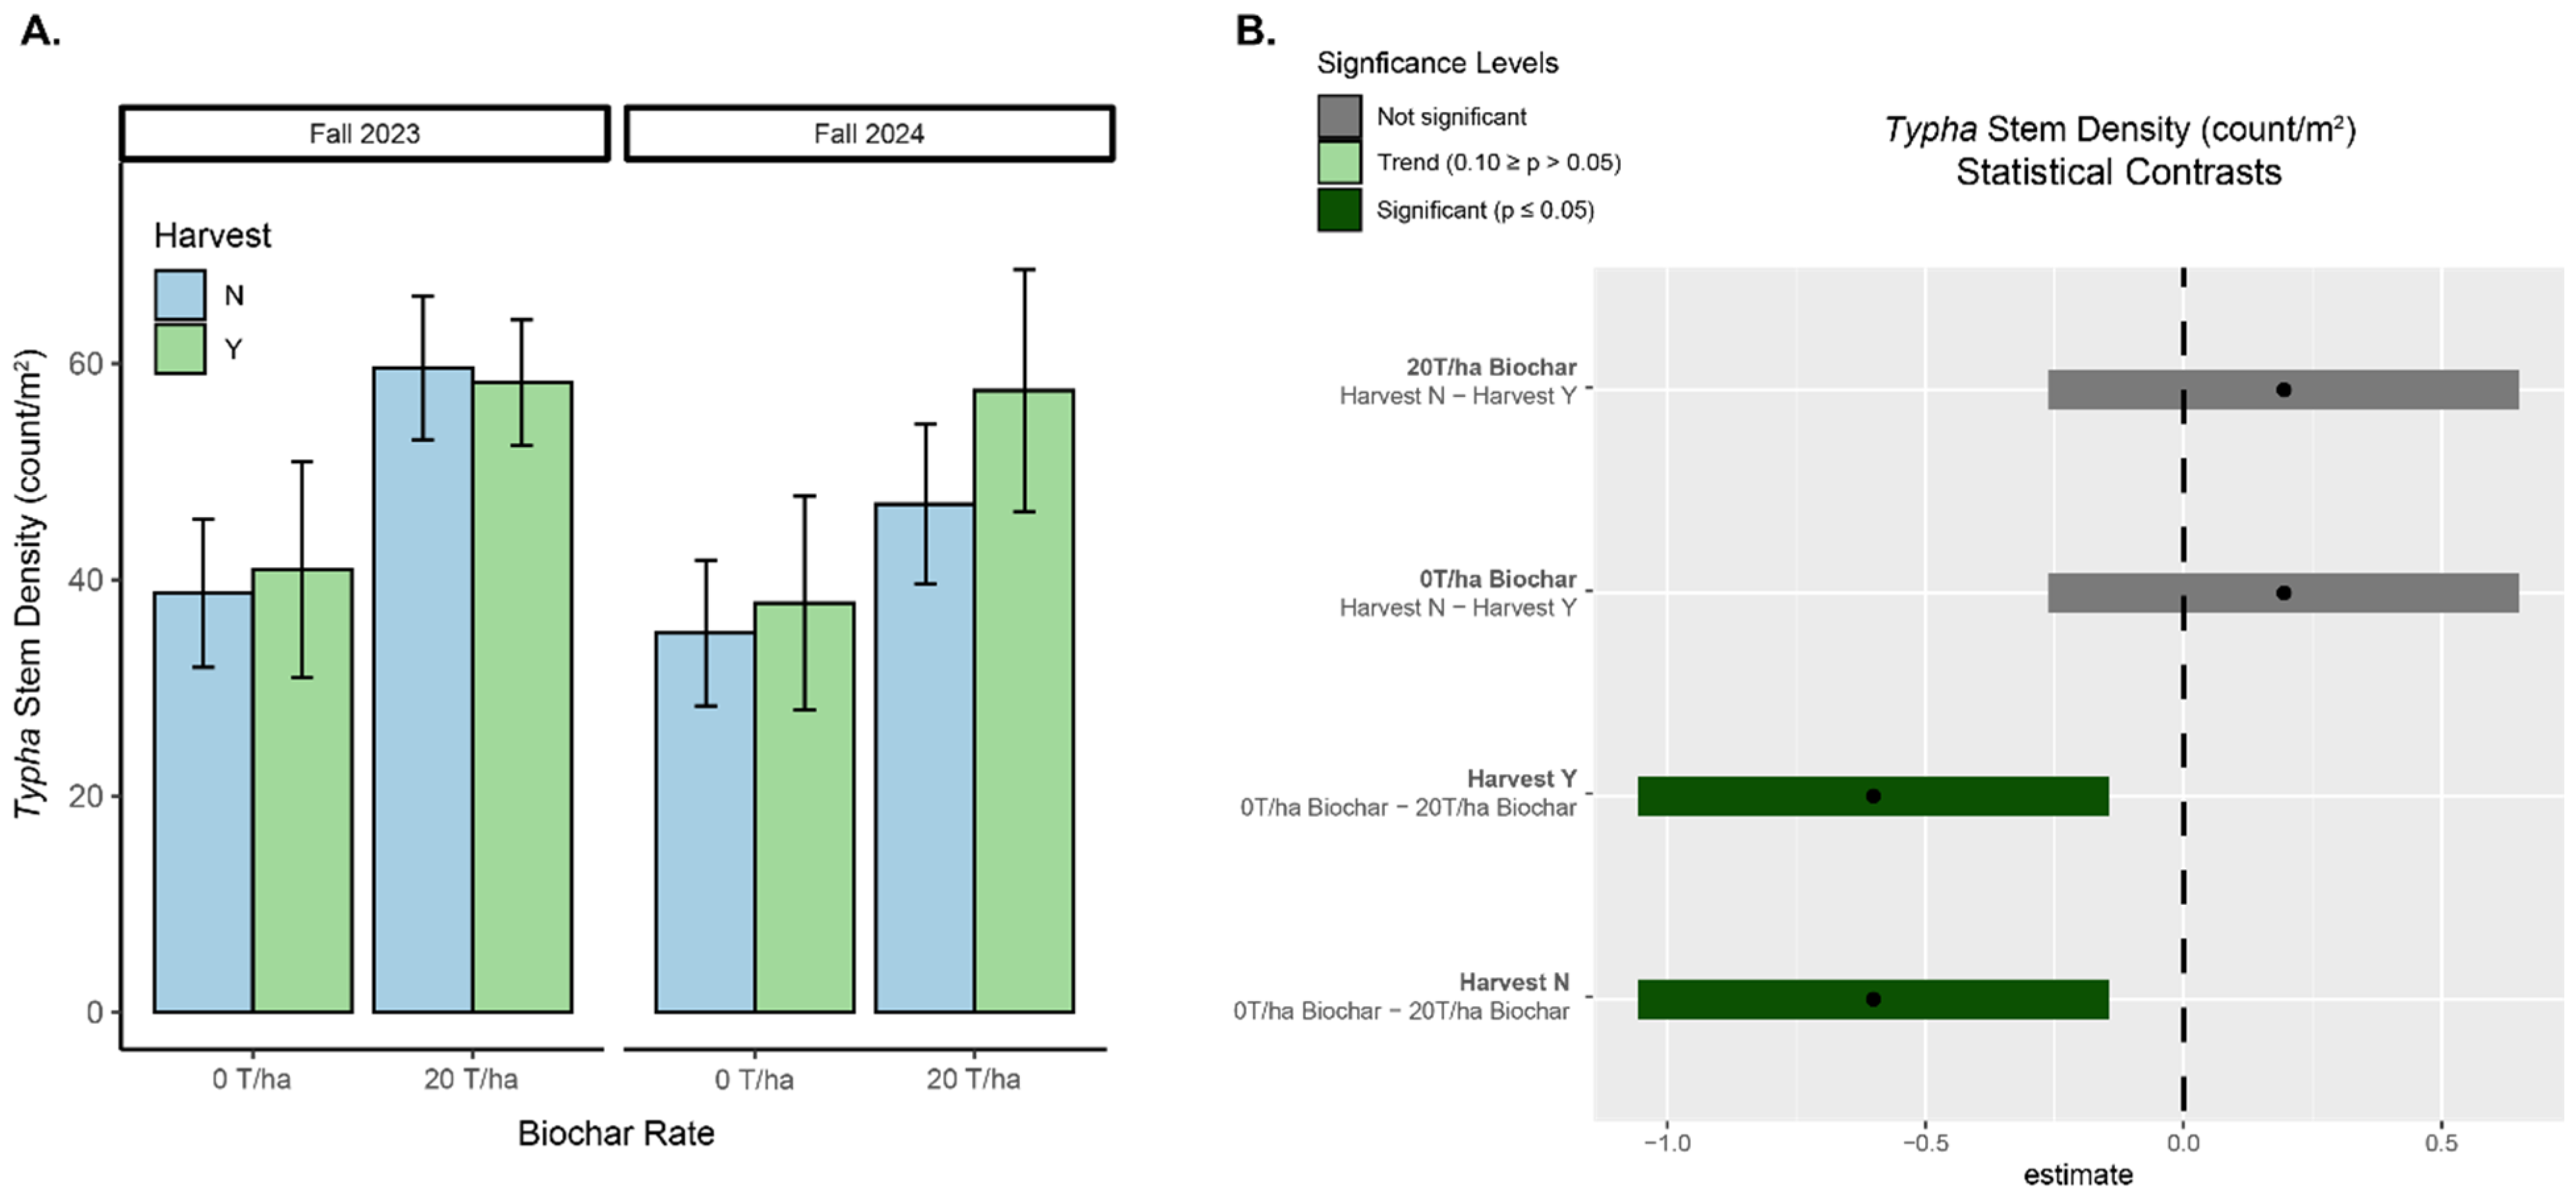
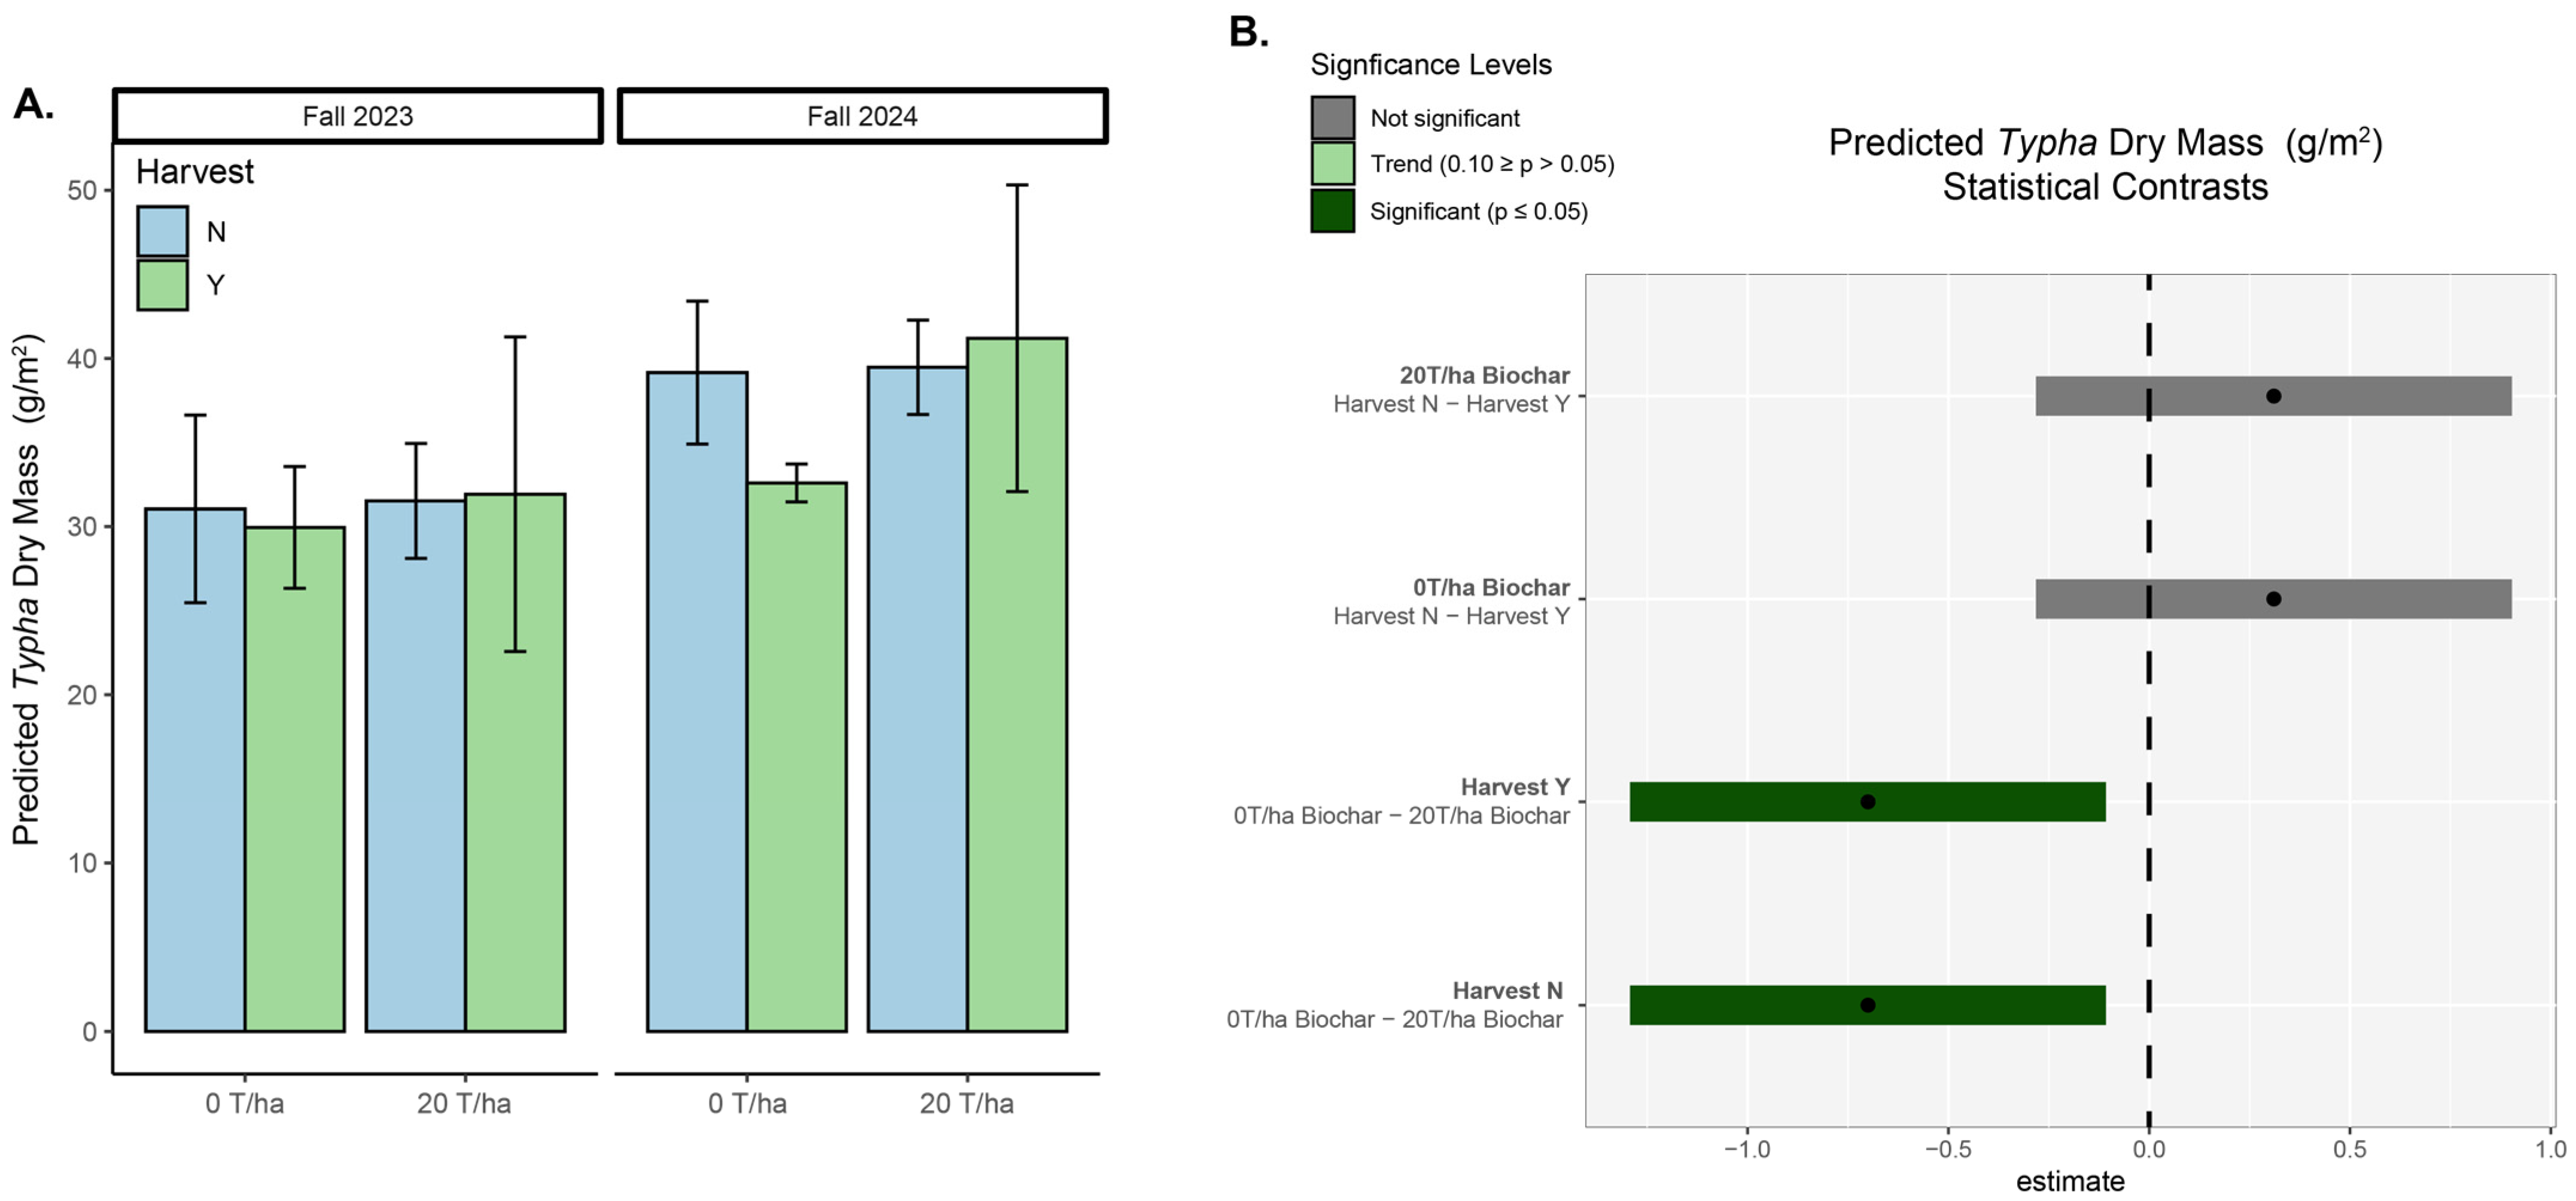
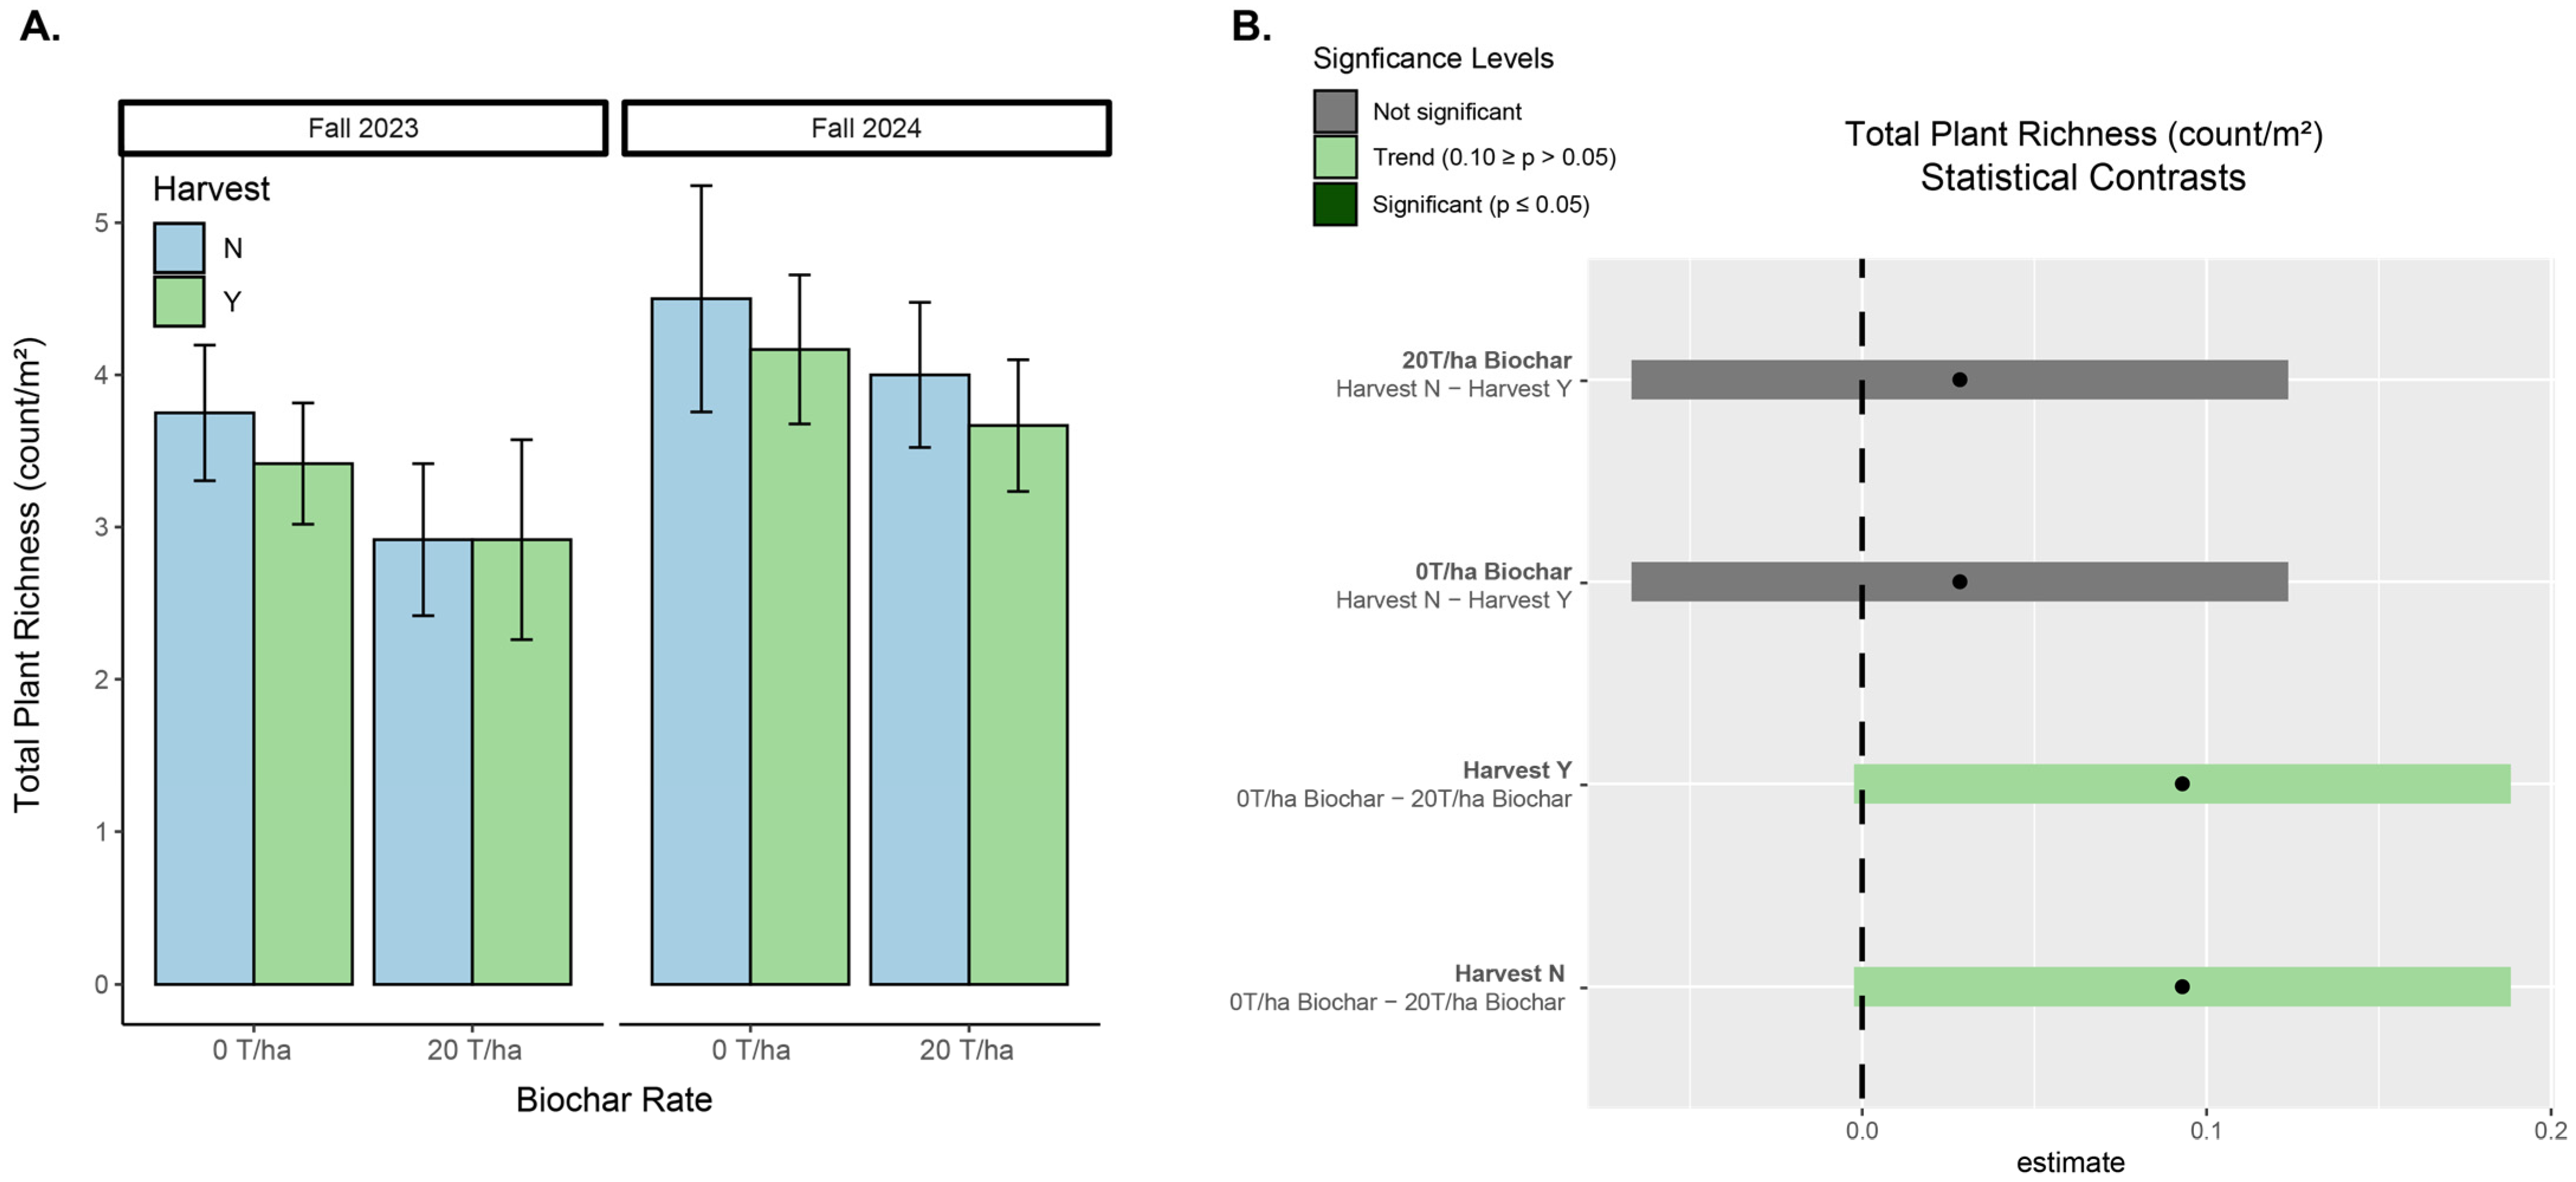
Compared to control biochar application rates, bioswale Typha measurements [Typha Stem Density, Predicted Typha Dry Mass] were significantly influenced by the single 20 T/ha biochar application in the two-year field study (p ≤ 0.05). All selected LME models for the vegetative analyses resulted in the same selected transformation model for the dependent variable: log10(y) ~ biochar treatments + harvest treatment + random effect (1|time/block). Our focal invasive plant group, Typha, resulted in significant increases for both Predicted Typha Dry Mass and Typha Stem Density following the single fall 2022 biochar application compared to controls across the two-year field study (EM Means Contrasts: p ≤ 0.05, Figure 3 and Figure 4). Comparatively, both Predicted Typha Dry Mass and Typha Stem Density had no detected significant response to aboveground plant harvest compared to no-harvest controls over the same sampling period (EM Means Contrasts: p > 0.05, Figure 3 and Figure 4). Total plant richness (plant species count/m2) did not significantly respond to the annual aboveground harvest compared to the no-harvest controls (EM Means Contrasts: p > 0.05). Conversely, a negative trend was detected between total plant richness and the 20 T/ha biochar application rate compared to 0 T/ha biochar controls (EM Means Contrasts: p = 0.059, Figure 5).

3.3. Sediment and Typha Tissue Chloride Pools

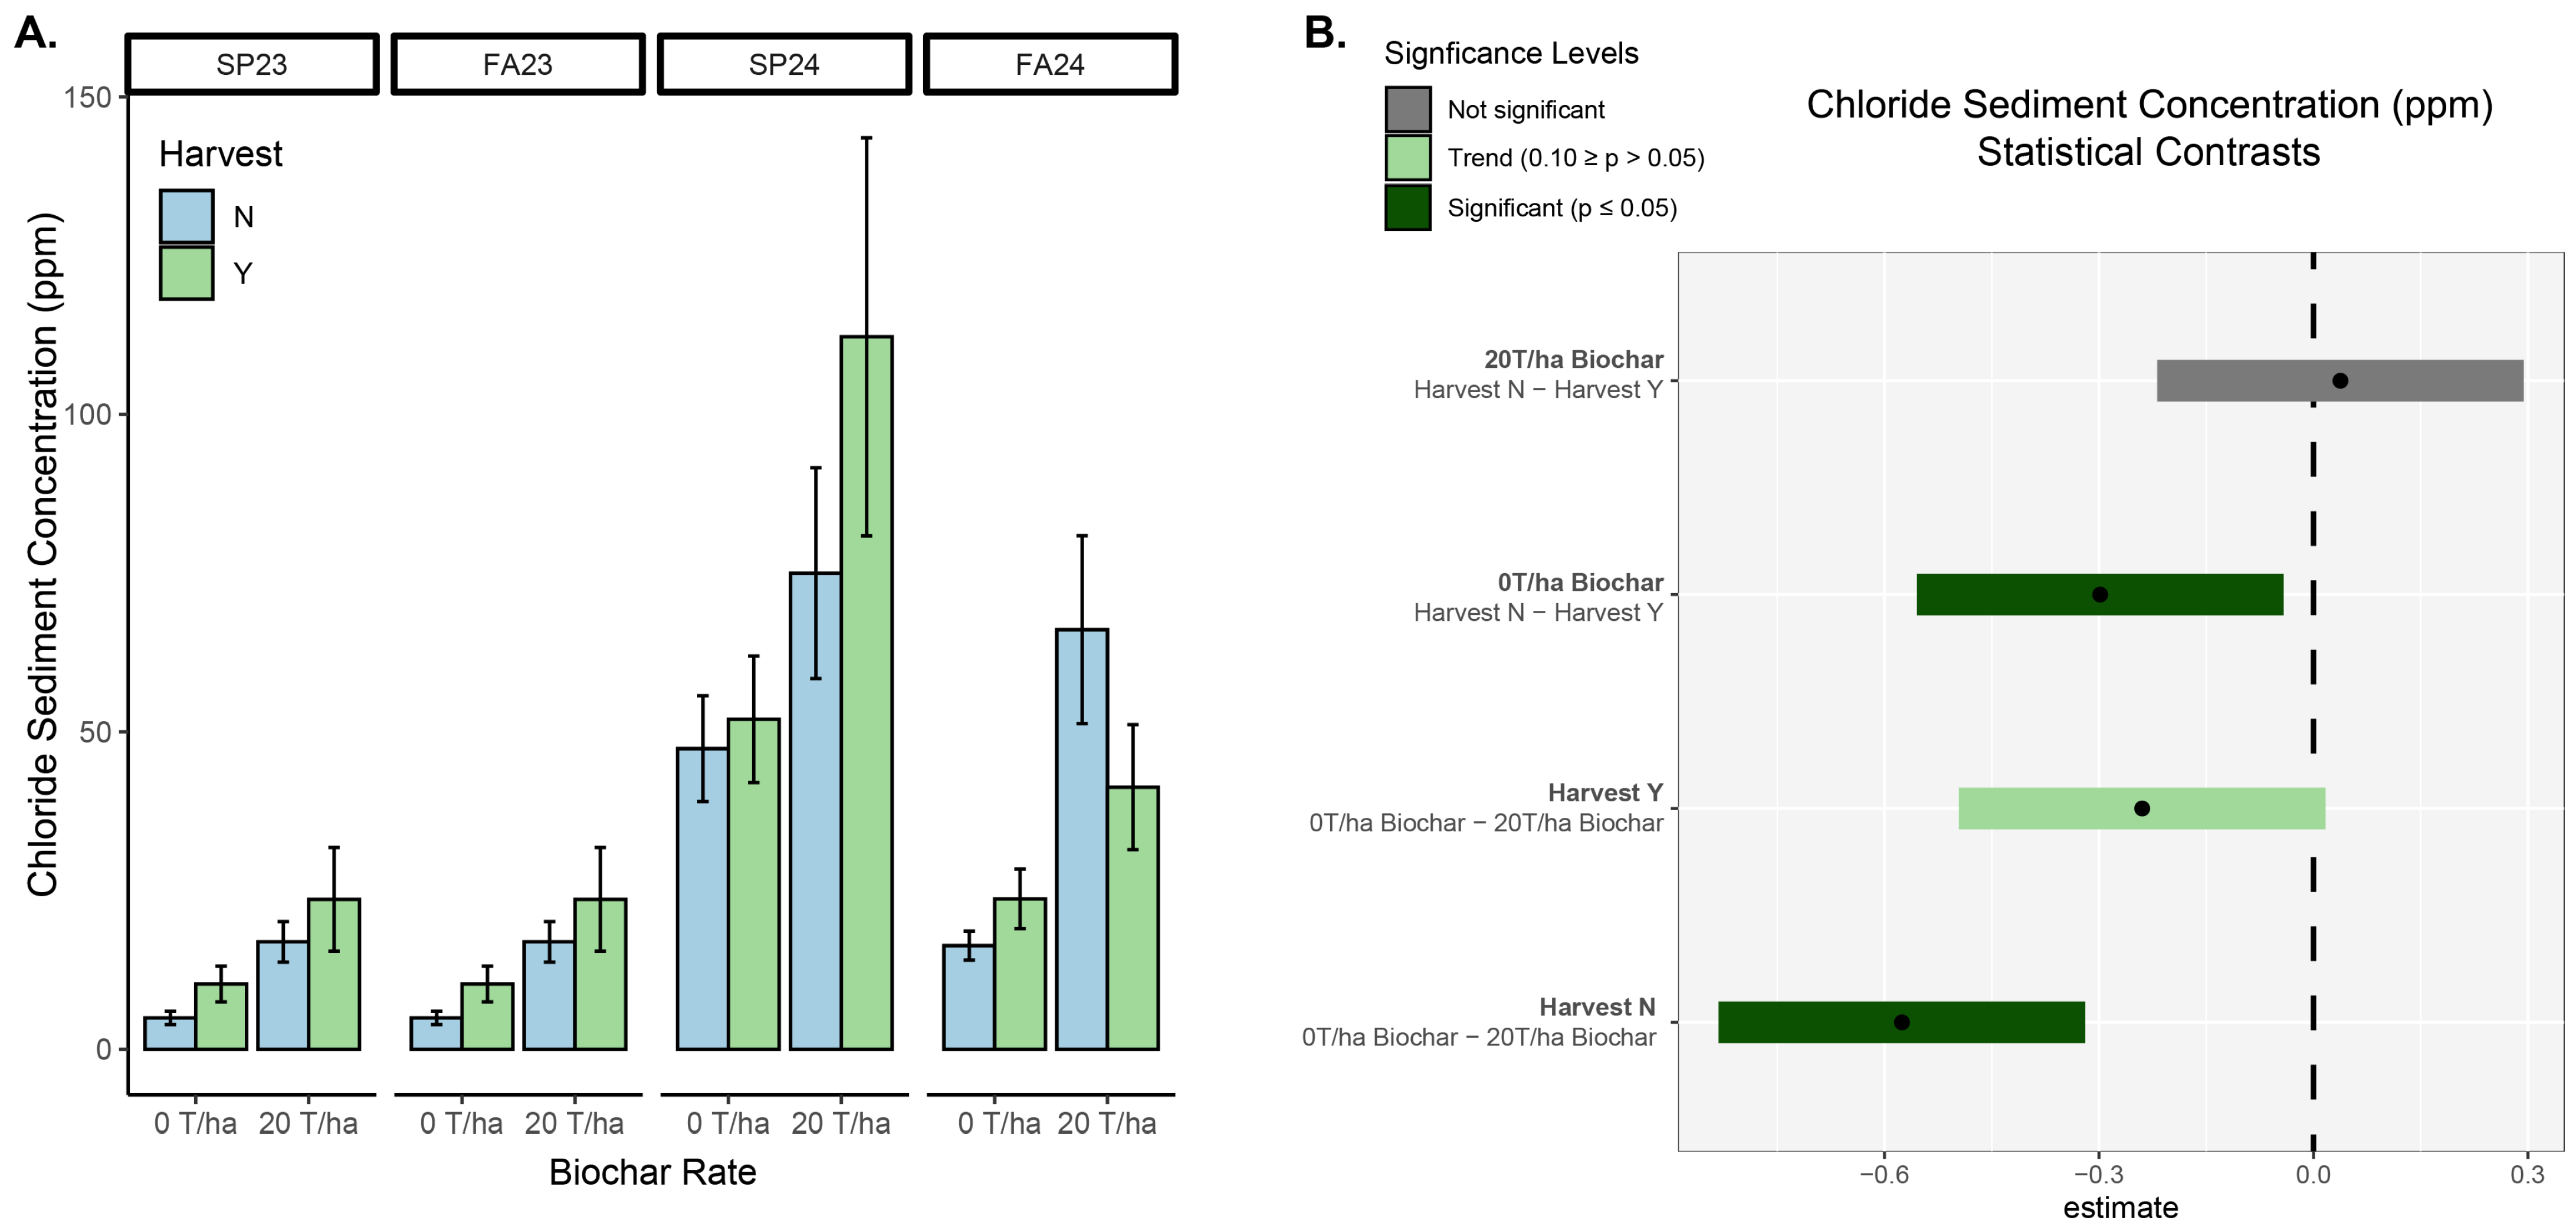
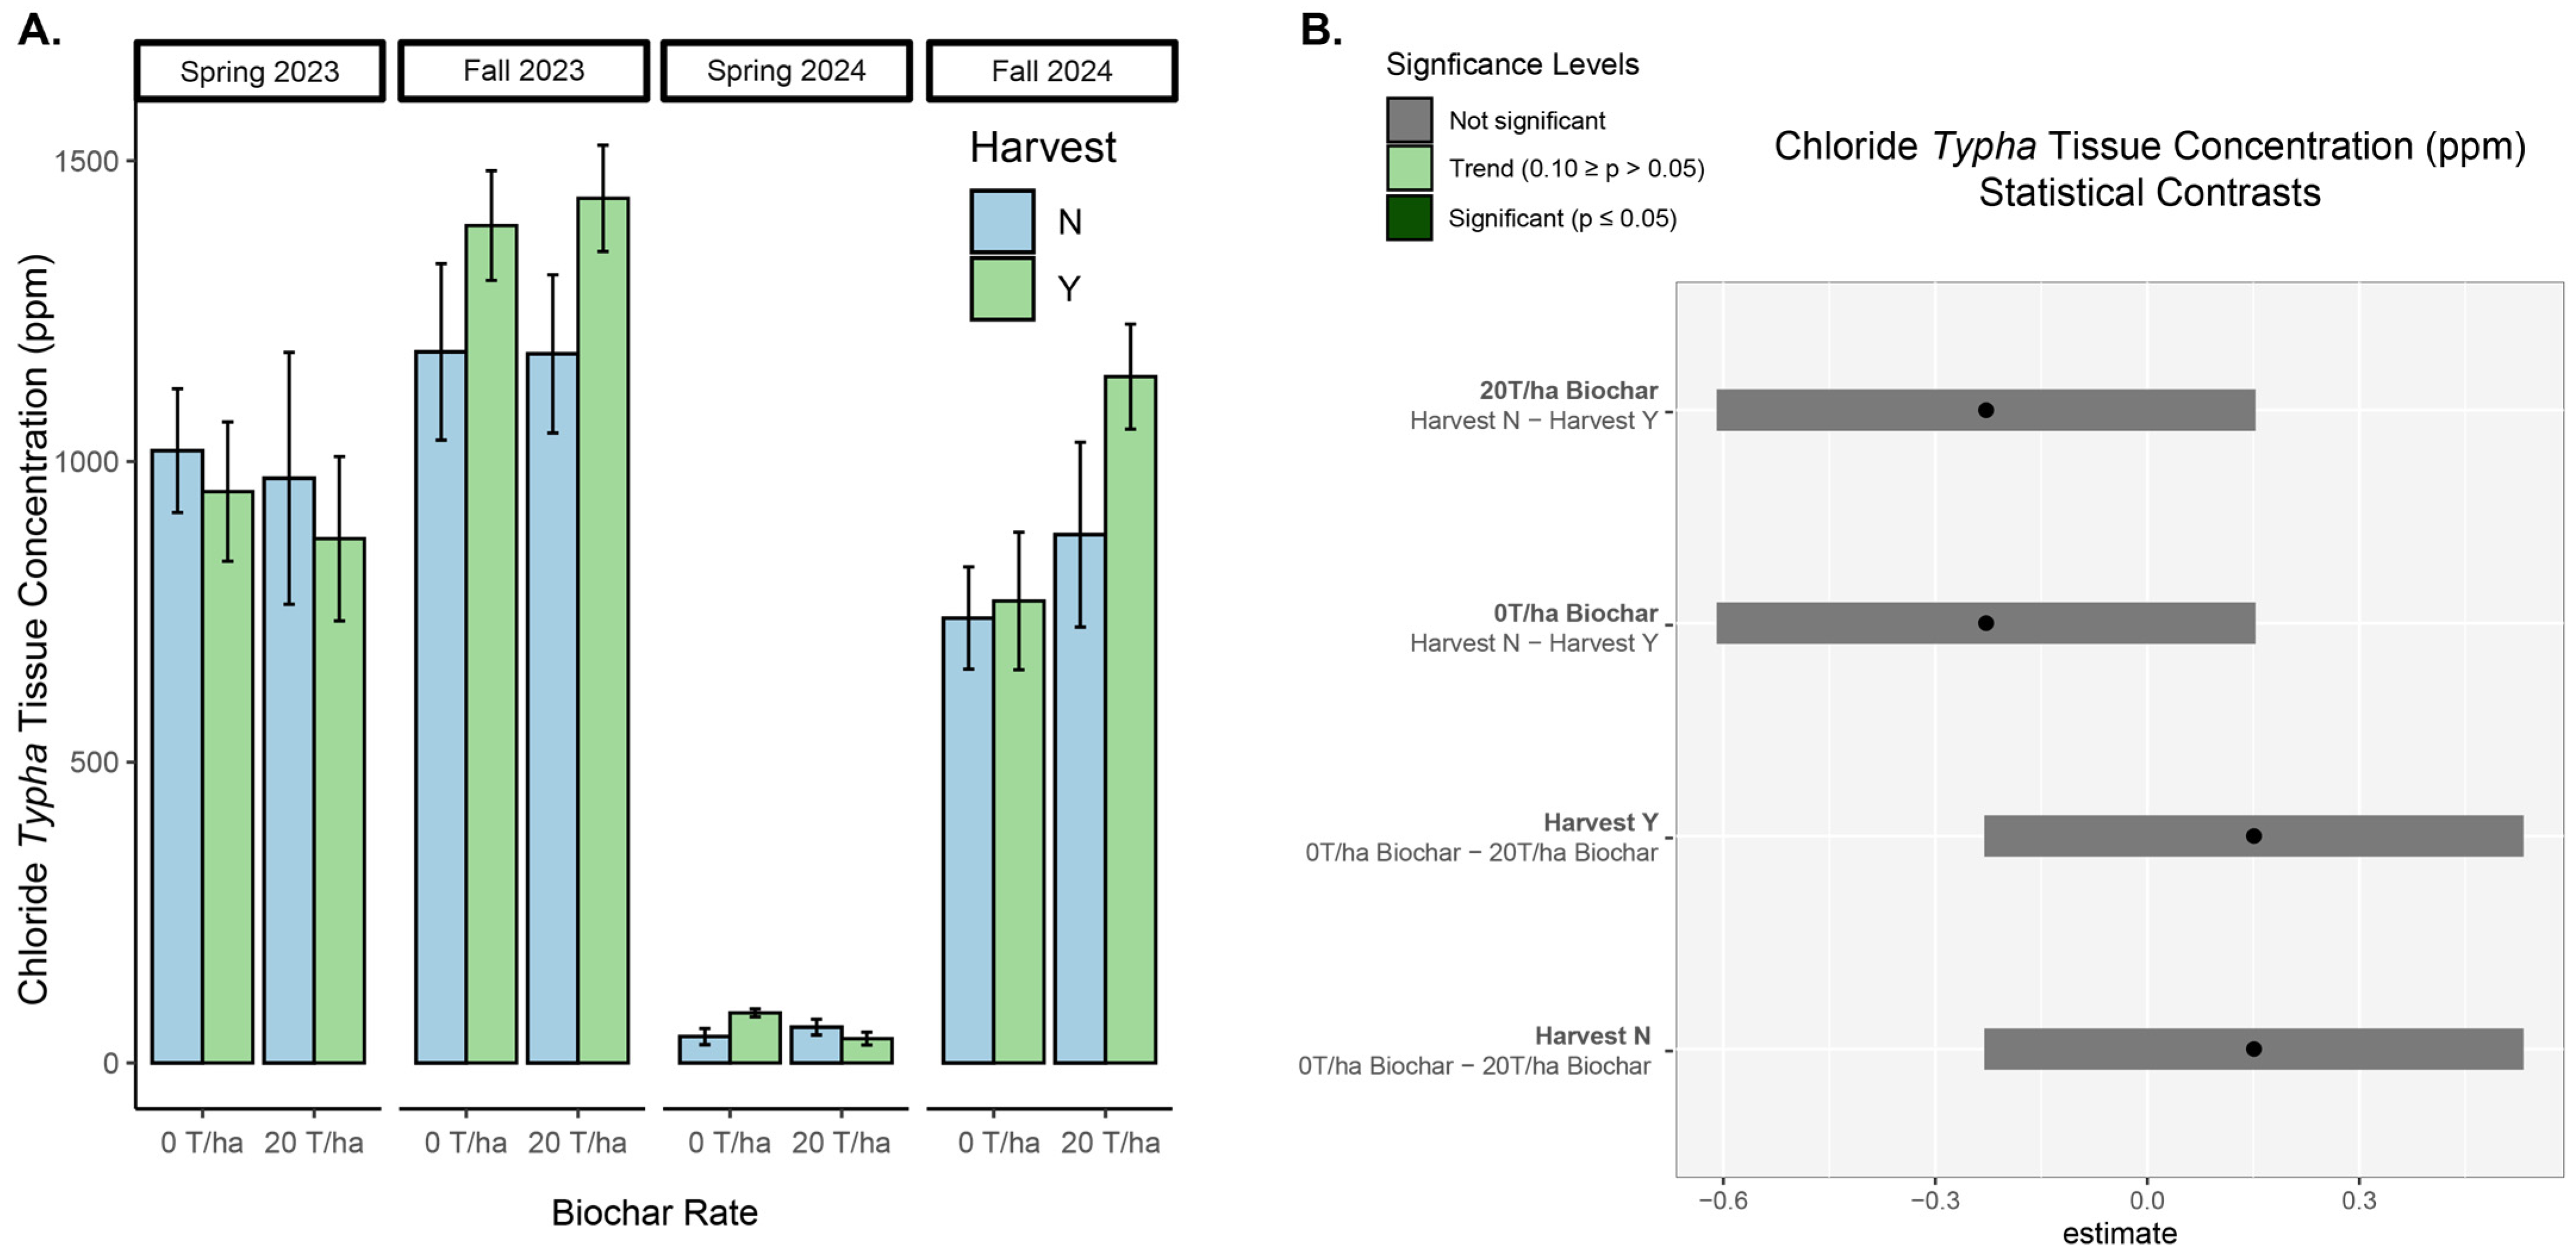
Compared to the control biochar application rates, chloride ion concentrations in collected sediments were significantly increased by the single 20 T/ha biochar application in the four sampling periods across a two-year field study (EM Means Contrasts: p ≤ 0.05, Figure 6). Conversely, sediment chloride concentrations were not significantly influenced by the annual aboveground plant harvest compared to No-harvest controls (EM Means Contrasts: p = 0.808, Figure 6). Chloride ion concentrations (ppm) in living aboveground Typha stem tissues were not significantly influenced by either biochar application or aboveground plant harvest (EM Means Contrasts: p > 0.05, Figure 7). Biochar application at 20 T/ha and aboveground plant harvest had no significant influence on chloride ion tissue concentrations compared to controls (p > 0.05) (Figure 7). The selected LME models for the sediment and Typha tissue chloride concentrations were given by the selected transformation model: log10(y) ~ biochar treatments + harvest treatment + random effect (1|time/block).
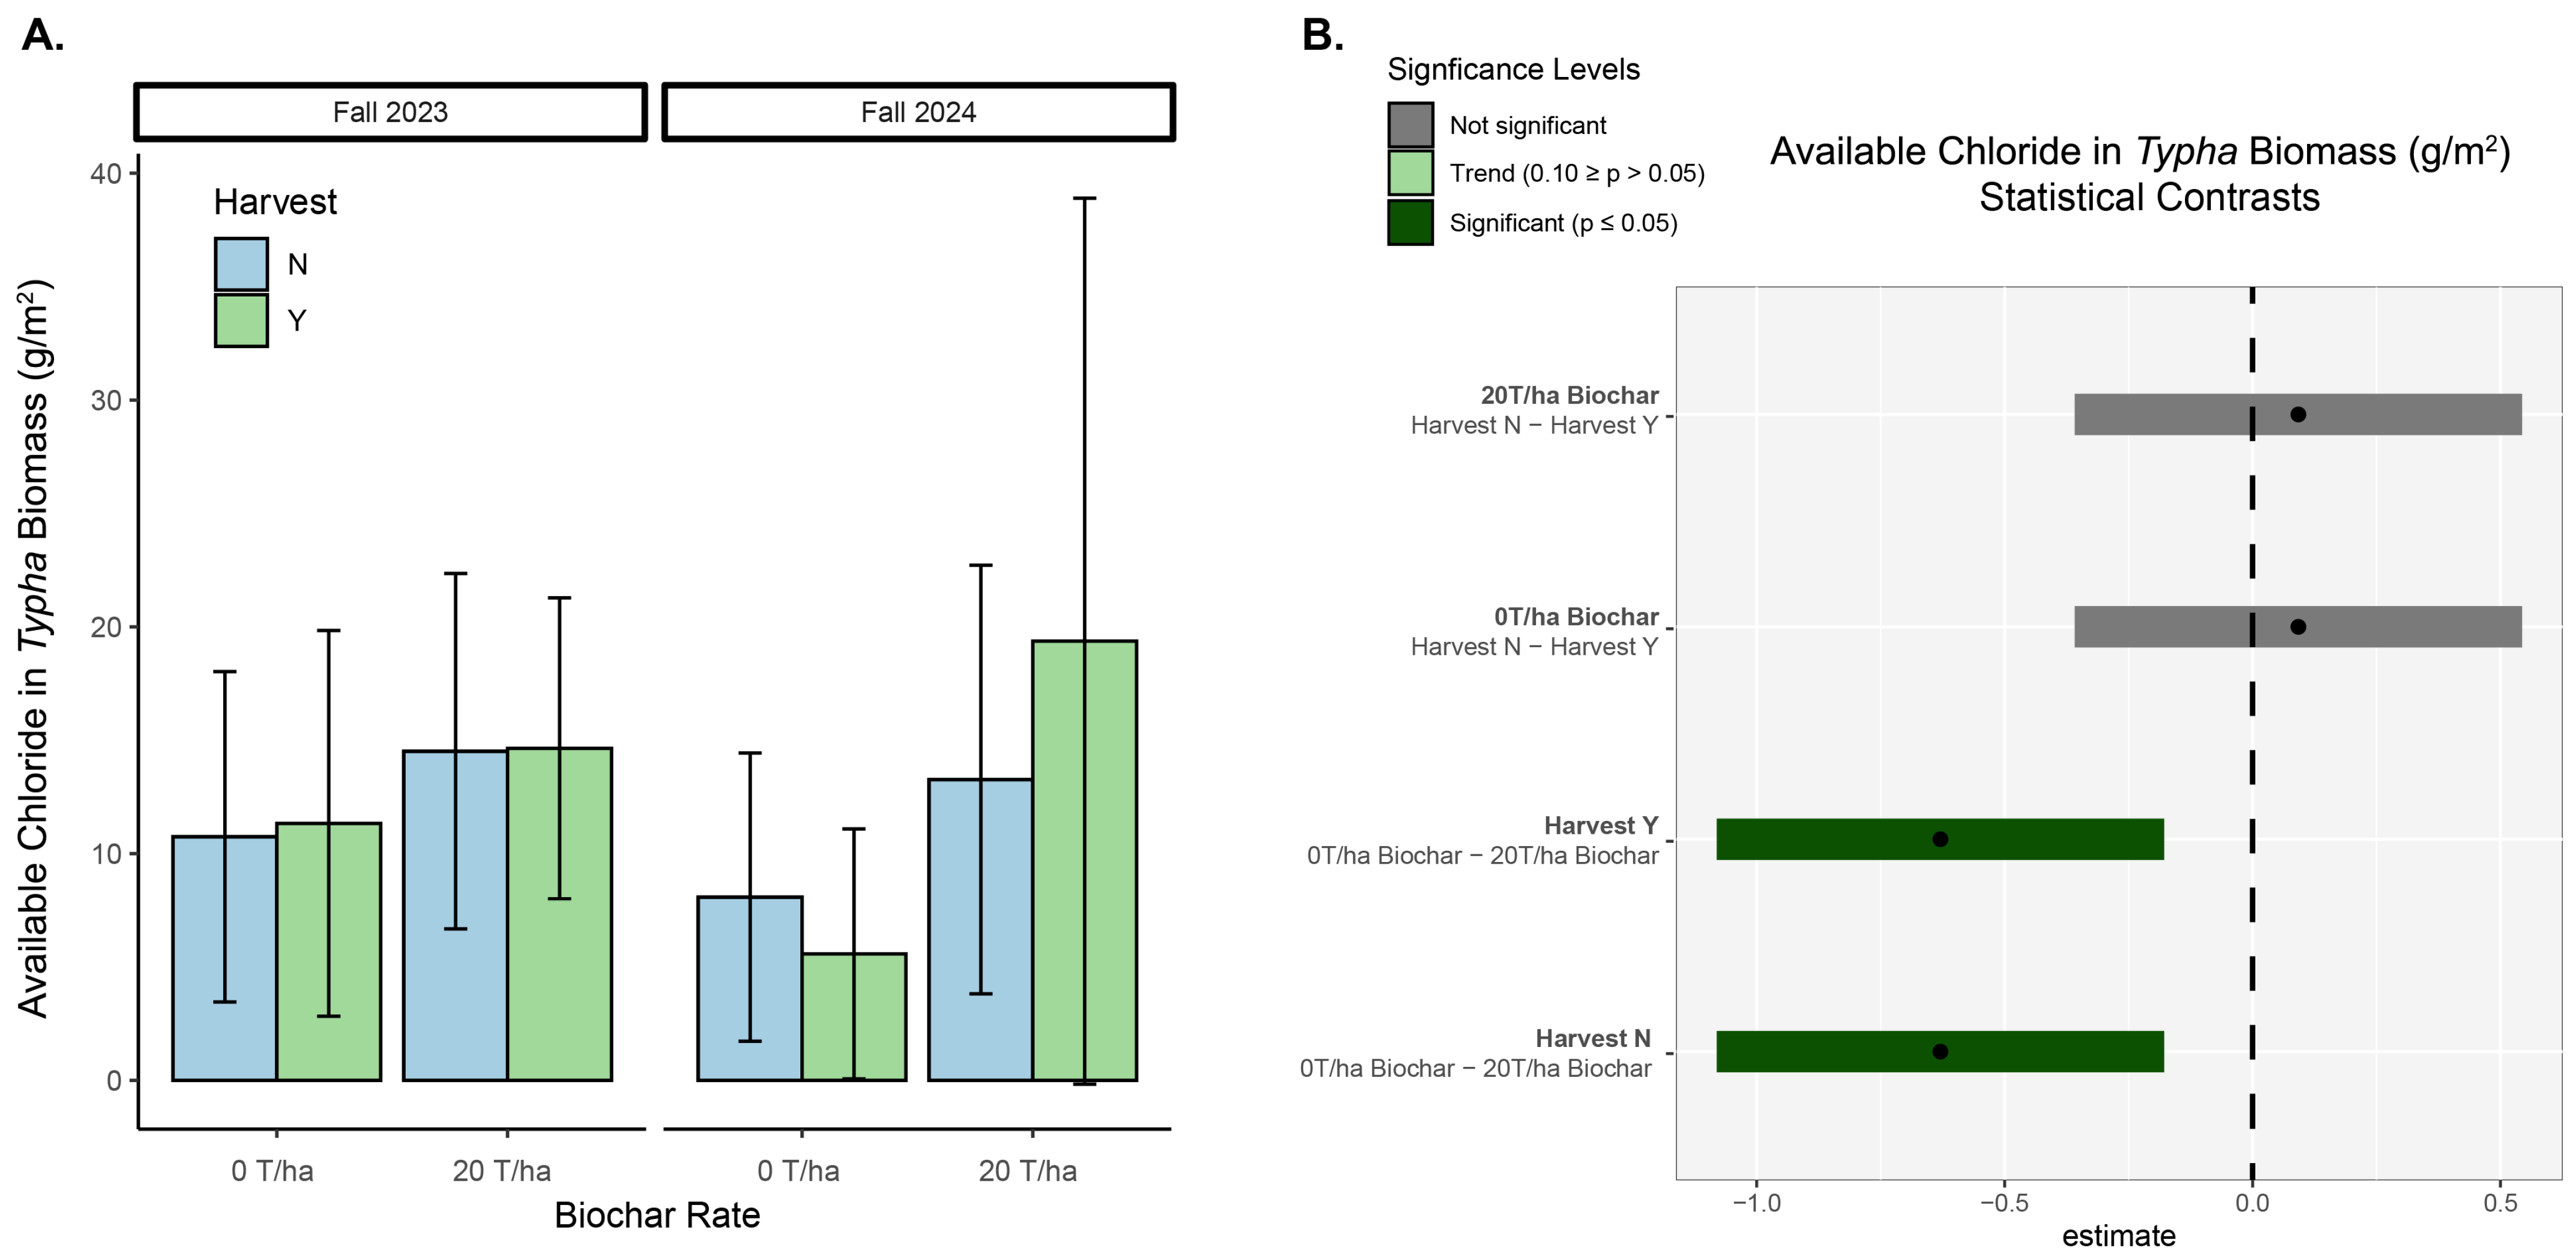
We scaled the bioswale’s harvestable chloride potential (grams of chloride/m2) for aboveground living-green Typha tissues based on estimated tissue chloride values (ppm). Harvestable tissue-associated chloride significantly increased with 20 T/ha biochar application rates compared to the control biochar rate (EM Means Contrasts: p ≤ 0.05, Figure 8). Aboveground plant harvest did not significantly influence harvestable chloride compared to no-harvest control plots (EM Means Contrasts: p > 0.05, Figure 8). Scaled aboveground living-green tissue chloride resulted in the following LME-selected model: log10(g/m2) ~ biochar treatments + harvest treatment + random effect (1|time/block).

4. Discussion

This two-year field study did not anticipate an increase in predicted Typha Dry Mass and Stem Density due to biochar application rate. Previous wetland mesocosm research indicates either significant reductions in Typha biomass with high-nutrient, saturated sediments (Ohsowski and Lishawa, in prep.) or neutral biomass responses in saturated, high-chloride Illinois Tollway sediments [21]. Biochar’s surface chemistry, large surface area, and high porosity are known to improve sediment conditions by retaining nitrogen and phosphorus availability, increasing cation exchange capacity (CEC), and acting as a liming agent to increase pH [37]. If biochar is improving sediment conditions in wet bioswale systems, this result would be consistent with increased Typha growth dynamics detected in this study. Typha’s capacity to outcompete other plant species is expected in eutrophic systems due to Typha’s high demand for essential macro- and micronutrients [58]. Furthermore, increased Typha biomass and stem density reduce available light resources and accumulate plant litter, thus exacerbating Typha’s invasive dominance [14]. Results from this Tollway field study highlight the need for future research to reconcile conflicting field and greenhouse responses of Typha biomass to biochar.
Interestingly, 20 T/ha of biochar interacting with highly saline wet bioswale sediments and hydrological variation may have alleviated salt stress in the Typha stand. Our results indicate significant increases in sediment chloride concentration with a single 20 T/ha biochar rate over the two-year study period. Established research indicates that biochar feedstock and pyrolysis temperature strongly influence ionic surface retention due to variability in surface charges and functional group composition [59]. Biochar research on improved CEC within terrestrial soils is well developed, but the understanding of biochar’s anion exchange capacity (AEC) within the soil system is under investigation [60,61,62]. The results of our sediment samples further highlight the need for investigating biochar’s anion exchange capacity for chloride and other sediment-available ions. Although mechanistically unclear, we show that the single 20 T/ha Biochar application can increase chloride ion retention, leading to a promising strategy for slowing chloride ion release from Tollway wet bioswales despite the variable hydrologic sediment saturation conditions.
Furthermore, on-site water level observations indicated variable water levels due to seasonal fluctuations in precipitation during the study period. Variability in saturated wetland conditions can result in variable growth of Typha. Fluctuating hydrologic sediment saturation alters redox chemistry, thus altering biochar’s surface retention capacity of available cations and anions (i.e., chloride) [63]. Previous research indicates that biochar can decrease plant salt stress in terrestrial soil systems [26,33,34,35]. In a recent meta-analysis, biochar application to salt-affected terrestrial soils improved crop productivity with an application rate ranging from 40 to 50 T/ha [64]. This meta-analysis did not include periodically saturated sediment systems, but the results of 173 studies further indicate plant growth benefits in salt-affected soils. Taken together, our results indicate that biochar application may increase Typha growth in salt-laden, eutrophic wet bioswales associated with roadways. Further research is needed in salt-affected wetlands, as the biological and chemical mechanisms to free plants from salt stress remain unclear.
Typha’s neutral response to the aboveground Typha harvest was an unexpected result. A body of previous research indicates harvesting aboveground Typha biomass consistently reduces Typha regrowth in greenhouse and field studies [23,24,65]. Typha’s neutral response to harvesting is most likely, in part, due to the prime growth conditions for invasive plants in wet bioswales [10]. Typha’s neutral response in this two-year bioswale restoration study conforms to the highly variable Typha biomass responses to harvesting within the first two years of management [65]. A hypothesized mechanism for Typha’s delayed biomass reduction in eutrophic systems is connected to harvesting and removing biomass prior to living-green tissue senescence. Prior to winter, macronutrients (N, P) are translocated to Typha rhizomes to build sufficient reserves for spring regrowth [66,67]. In these wet bioswale systems, continued annual aboveground harvesting of living-green Typha tissue may be required to deplete macronutrients available in the sediments, and detailed pre- and post-harvest monitoring of sediment macronutrients would be necessary to test this hypothesis.
Typha harvest did not significantly increase plant community richness over the two-year study period. Research shows that Typha eventually excludes other aquatic plants, thus reducing species richness and diversity [14,68,69]. During the plant harvest, living aboveground plant tissues and plant litter were cut with aquatic weedwhackers and removed from the wet bioswale surface. Typha is known to accumulate a dense detritus layer, which alters temperature and light availability for native plants [68,70]. Interestingly, aboveground plant harvest did not significantly influence plant species richness (p = 0.91) in our study compared to no-harvest controls. In natural wetlands, plants tend to emerge from a sediment seed bank following harvest. In contrast, it is likely that the seed bank in Tollway wet bioswales is depauperate of native species, and seeding following harvest is therefore necessary to stimulate a robust biodiversity response in the presence of frequent annual harvesting.

4.1. Restoration Implications for Chloride Management

The practice of harvesting salt-tolerant invasive plants for salt phytoremediation needs to be explored in greater depth to quantify species-specific salt removal potential in wetlands. Emergent wetland macrophytes have varying capacities to uptake and retain tissue chloride concentration in salt-affected, saturated soils. Halophytic-tolerant emergent macrophytes have developed several evolutionary adaptations to maximize plant growth potential in extreme environments. Consistent with previous Tollway sediment studies [20,21], our results confirm that Typha is a salt-accumulating macrophyte. Typha’s evolutionary mechanism to establish high salt tissue concentrations has been shown to offset Typha’s osmotic adjustment or evapotranspiration potential [71].
When tissue chloride ion concentrations are scaled to predict Typha biomass results, our study indicates that the 20 T/ha biochar application significantly increased grams of chloride removal potential in Tollway wet bioswales. While the biochar-driven increase in Typha density presents an invasive management challenge, the net effect is a larger aboveground standing stock available for chloride removal via harvest. The current field study confirms previous research that harvesting aboveground Typha biomass has the potential to remove significant quantities of de-icing salts from Tollway retention basins as recommended [20]. Although Typha removal via harvest would not necessarily result in an increased lifespan of bioswales, the mechanical removal of salts via harvesting would improve wet bioswale function as an engineered pollution control system.
This research demonstrates straightforward technological strategies to mitigate freshwater pollution with aboveground Typha and wood-waste biochar application to wet bioswales. Our research explored practical management solutions meant to retain biological stressors (i.e., chloride). Although effective engineered chloride management strategies [52], Tollway bioswales often exceed the Illinois Environmental Protection Agency standard for chloride of 500 mg/L. Likely increases in the frequency and intensity of winter storms may necessitate increased de-icing salt application and further chloride impairment of Illinois waterways. Furthermore, as bioswales age across the Tollway system, monitoring and maintenance are required to ensure their continued effectiveness in retaining pollutants. Decreased efficacy of bioswales with age could potentially increase chloride export into Illinois waterways. Our results indicate that biochar application and aboveground invasive plant harvesting, especially Typha, have the potential to increase chloride sediment retention and increase physical removal of chloride via harvesting.
Chloride concentration responses to a single 20 T/ha biochar application and two aboveground biomass harvest treatments have promising results for the management of chloride ions in the Tollway wet bioswale system. Analysis of sediment chemical and plant tissue samples within wet bioswales indicates a significant improvement in chloride concentrations for wet bioswale sediments amended with biochar and scalable removal via harvesting aboveground Typha biomass. Specifically, wet bioswale sediments with a single 20 T/ha biochar application resulted in consistently significant chloride retention signals compared to control sediments. Contrary to our prediction, biochar application significantly increased Typha biomass and stem density over the study period. Although an unexpected growth response, increased Typha biomass resulted in a significant increase in removable chloride ions via aboveground harvest due to Typha’s chloride accumulation properties.
To maximize the benefits of wet bioswale chloride retention and potential removal, our research team would recommend harvesting basins during peak growth of Typha (i.e., maximal green plant height and prior to fall dieback). Following each harvest, site access will be greatly improved, thus allowing for a seamless biochar application on-site. The largest logistical challenge is collecting, transporting, and disposing of harvested plant biomass. One potential disposal method is partnering with Waste Management and applying a tipping fee. While composting Tollway-harvested biomass is feasible, further chemical analysis of the compost prior to widespread implementation and spreading is warranted, as salts and metals accumulated in harvested plant tissues likely persist in the compost. Biochar production or green energy through anaerobic digestion are also viable options for biomass usage, but technological hurdles still remain.

4.2. Conclusions

Our research highlights innovative management approaches that leverage a single 20 T/ha biochar application and harvest of aboveground Typha tissues to retain and remove chloride ions in heavily impacted wet bioswale and retention basin systems. When scaling chloride concentration with predicted Typha biomass per plot, our research suggests that a 20 T/ha biochar application can significantly increase total grams of chloride removal potential within Tollway wet bioswales. In this study, we detected an unexpected significant increase in Typha Dry Mass and Stem Density due to biochar application in the wet bioswales, contradicting previous findings. Greater Typha biomass has the potential to increase harvestable chloride from roadway-associated systems, especially as we detected significantly greater chloride sediment concentrations with biochar application. A drawback of this result suggests potential increases in nuisance invasive species biomass due to biochar application in polluted sediments. To more fully understand biochar’s potential and the role of plant harvest in chloride mitigation, we suggest further practical-scale research investigating invasive plant harvesting in highly disturbed wetland systems.

Author Contributions

Conceptualization, B.M.O. and S.C.L.; Methodology, B.M.O., S.S. and S.C.L.; Validation, B.M.O.; Formal Analysis, B.M.O.; Data Curation, B.M.O.; Writing—Original Draft Preparation, B.M.O. and S.C.L.; Writing—Review and Editing, B.M.O., S.S. and S.C.L.; Visualization, B.M.O.; Supervision, B.M.O., S.S. and S.C.L.; Project Administration, B.M.O. and S.C.L.; Funding Acquisition, B.M.O. and S.C.L. All authors have read and agreed to the published version of the manuscript.

Funding

This research was funded by the Illinois Tollway; grant title: Enhancing Tollway bioswale capacity with biochar and cattail harvesting; Project: RR-22-9261. Schurkamp acknowledges support by the National Science Foundation-funded Global Center for Climate Change Impacts on Transboundary Waters (Award No. 2330317) during the writing stage of this publication.

Data Availability Statement

The original contributions presented in this study are included in the article. Further inquiries can be directed to the corresponding author.

Acknowledgments

Field and laboratory assistance was provided by Blessing Aleladia, Eva Bednard, Drew Monks, and the student members of Team Typha. Geoff Pociask and Keith Carr with the University of Illinois Urbana-Champaign and the Illinois State Geological Survey provided expertise and support in acquiring Tollway funding, site selection, and research implementation.

Conflicts of Interest

The authors declare that this study received funding from the Illinois Tollway. The funder was not involved in the study design, collection, analysis, interpretation of data, the writing of this article, or the decision to submit it for publication.

References

  1. Oberhelman, A.; Peterson, E.W. Seasonal and Stormflow Chloride Loads in an Urban–Agricultural Watershed in Central Illinois, USA. Environ. Earth Sci. 2021, 80, 445. [Google Scholar] [CrossRef]
  2. Hintz, W.D.; Fay, L.; Relyea, R.A. Road Salts, Human Safety, and the Rising Salinity of Our Fresh Waters. Front. Ecol. Environ. 2022, 20, 22–30. [Google Scholar] [CrossRef]
  3. Corsi, S.R.; Graczyk, D.J.; Geis, S.W.; Booth, N.L.; Richards, K.D. A Fresh Look at Road Salt: Aquatic Toxicity and Water-Quality Impacts on Local, Regional, and National Scales. Environ. Sci. Technol. 2010, 44, 7376–7382. [Google Scholar] [CrossRef]
  4. Kaushal, S.S.; Likens, G.E.; Pace, M.L. Freshwater Salinization Syndrome: From Emerging Global Problem to Managing Risks. Biogeochemistry 2021, 154, 255–292. [Google Scholar] [CrossRef]
  5. Zhao, Z.; Cheng, L.; He, C.; Wang, F.; Liu, J.; Li, Y.; Chen, X.; Liu, X.; Lv, G.; Wang, D. Spartina alterniflora Invaded Coastal Wetlands by Raising Soil Sulfur Contents: A Meta-Analysis. Water 2022, 14, 1633. [Google Scholar] [CrossRef]
  6. Cross, D.P.; Ramachandran, G.; Wattenberg, E.V. Mixtures of Nickel and Cobalt Chlorides Induce Synergistic Cytotoxic Effects: Implications for Inhalation Exposure Modeling. Ann. Occup. Hyg. 2001, 45, 409–418. [Google Scholar] [CrossRef]
  7. Kaushal, S.S.; Likens, G.E.; Pace, M.L.; Utz, R.M.; Haq, S.; Gorman, J.; Grese, M. Freshwater Salinization Syndrome on a Continental Scale. Proc. Natl. Acad. Sci. USA 2018, 115, E574–E583. [Google Scholar] [CrossRef]
  8. Burgis, C.R.; Hayes, G.M.; Henderson, D.A.; Zhang, W.; Smith, J.A. Green Stormwater Infrastructure Redirects Deicing Salt from Surface Water to Groundwater. Sci. Total Environ. 2020, 729, 138736. [Google Scholar] [CrossRef]
  9. Skultety, D.; Matthews, J.W. Urbanization and Roads Drive Non-Native Plant Invasion in the Chicago Metropolitan Region. Biol. Invasions 2017, 19, 2553–2566. [Google Scholar] [CrossRef]
  10. Brisson, J.; de Blois, S.; Lavoie, C. Roadside as Invasion Pathway for Common Reed (Phragmites australis). Invasive Plant Sci. Manag. 2010, 3, 506–514. [Google Scholar] [CrossRef]
  11. Lawrence, B.A.; Bourke, K.; Lishawa, S.C.; Tuchman, N.C. Typha Invasion Associated with Reduced Aquatic Macroinvertebrate Abundance in Northern Lake Huron Coastal Wetlands. J. Great Lakes Res. 2016, 42, 1412–1419. [Google Scholar] [CrossRef]
  12. Monfils, M.J.; Brown, P.W.; Hayes, D.B.; Soulliere, G.J.; Kafcas, E.N. Breeding Bird Use and Wetland Characteristics of Diked and Undiked Coastal Marshes in Michigan. J. Wildl. Manag. 2014, 78, 79–92. [Google Scholar] [CrossRef]
  13. Rowe, J.C.; Garcia, T.S. Impacts of Wetland Restoration Efforts on an Amphibian Assemblage in a Multi-Invader Community. Wetlands 2014, 34, 141–153. [Google Scholar] [CrossRef]
  14. Tuchman, N.C.; Larkin, D.J.; Geddes, P. Patterns of Environmental Change Associated with Typha × glauca Invasion in a Great Lakes Coastal Wetland. Wetlands 2009, 29, 964–975. [Google Scholar] [CrossRef]
  15. Farnsworth, E.J.; Meyerson, L.A. Comparative Ecophysiology of Four Wetland Plant Species along a Continuum of Invasiveness. Wetlands 2003, 23, 750–762. [Google Scholar] [CrossRef]
  16. Khan, M.A.; Weber, D.J. Ecophysiology of High Salinity Tolerant Plants; Springer Science & Business Media: Berlin/Heidelberg, Germany, 2006; ISBN 978-1-4020-4017-7. [Google Scholar]
  17. Carson, B.D.; Lishawa, S.C.; Tuchman, N.C.; Monks, A.M.; Lawrence, B.A.; Albert, D.A. Harvesting Invasive Plants to Reduce Nutrient Loads and Produce Bioenergy: An Assessment of Great Lakes Coastal Wetlands. Ecosphere 2018, 9, e02320. [Google Scholar] [CrossRef]
  18. Lawrence, B.A.; Lishawa, S.C.; Monks, A.M. Remediating Runoff and Creating Renewable Energy by Harvesting Invasive Plants from Illinois Tollway Detention Basins; Illinois Tollway: Downers Grove, IL, USA, 2022; p. 93.
  19. Rozema, E.R.; Gordon, R.J.; Zheng, Y. Plant Species for the Removal of Na+ and Cl from Greenhouse Nutrient Solution. HortScience 2014, 49, 1071–1075. [Google Scholar] [CrossRef]
  20. Monks, A.M.; Lishawa, S.C.; Ohsowski, B.M.; Schurkamp, S.J.; Lawrence, B.A. Complementarity of Road Salt and Heavy Metal Pollutant Removal through Invasive Typha and Phragmites Harvest in Urban Wetland Detention Basins. Ecol. Eng. 2023, 194, 107058. [Google Scholar] [CrossRef]
  21. Schurkamp, S.J.; Lishawa, S.C.; Ohsowski, B.M. Wetland Plant Species and Biochar Amendments Lead to Variable Salinity Reduction in Roadway-Associated Soils. Sci. Total Environ. 2024, 951, 175801. [Google Scholar] [CrossRef]
  22. Keyport, S.; Carson, B.D.; Johnson, O.; Lawrence, B.A.; Lishawa, S.C.; Tuchman, N.C.; Kelly, J.J. Effects of Experimental Harvesting of an Invasive Hybrid Cattail on Wetland Structure and Function. Restor. Ecol. 2019, 27, 389–398. [Google Scholar] [CrossRef]
  23. Lishawa, S.C.; Lawrence, B.A.; Albert, D.A.; Tuchman, N.C. Biomass Harvest of Invasive Typha Promotes Plant Diversity in a Great Lakes Coastal Wetland. Restor. Ecol. 2015, 23, 228–237. [Google Scholar] [CrossRef]
  24. Lishawa, S.C.; Carson, B.D.; Brandt, J.; Tallant, J.; Reo, N.J.; Albert, D.A.; Monks, A.; Lautenbach, J.; Clark, E. Mechanical Harvesting Effectively Controls Young Typha spp. Invasion and Unmanned Aerial Vehicle Data Enhances Post-Treatment Monitoring. Front. Plant Sci. 2017, 8, 619. [Google Scholar] [CrossRef] [PubMed]
  25. Delattre, E.; Techer, I.; Reneaud, B.; Verdoux, P.; Laffont-Schwob, I.; Prohin, P. Chloride Accumulation in Aboveground Biomass of Three Macrophytes (Phragmites australis, Juncus maritimus, and Typha latifolia) Depending on Their Growth Stages and Salinity Exposure: Application for Cl Removal and Phytodesalinization. Environ. Sci. Pollut. Res. 2022, 29, 35284–35299. [Google Scholar] [CrossRef]
  26. Dong, X.; Wang, J.; Liu, X.; Singh, B.P.; Sun, H. Characterization of Halophyte Biochar and Its Effects on Water and Salt Contents in Saline Soil. Environ. Sci. Pollut. Res. 2022, 29, 11831–11842. [Google Scholar] [CrossRef] [PubMed]
  27. Pandey, D.; Singh, S.V.; Savio, N.; Bhutto, J.K.; Srivastava, R.K.; Yadav, K.K.; Sharma, R.; Nandipamu, T.M.K.; Sarkar, B. Biochar Application in Constructed Wetlands for Wastewater Treatment: A Critical Review. J. Water Process Eng. 2025, 69, 106713. [Google Scholar] [CrossRef]
  28. Zhuang, L.-L.; Li, M.; Li, Y.; Zhang, L.; Xu, X.; Wu, H.; Liang, S.; Su, C.; Zhang, J. The Performance and Mechanism of Biochar-Enhanced Constructed Wetland for Wastewater Treatment. J. Water Process Eng. 2022, 45, 102522. [Google Scholar] [CrossRef]
  29. Gupta, P.; Ann, T.; Lee, S.-M. Use of Biochar to Enhance Constructed Wetland Performance in Wastewater Reclamation. Environ. Eng. Res. 2016, 21, 36–44. [Google Scholar] [CrossRef]
  30. Rubin, R.L.; Anderson, T.R.; Ballantine, K.A. Biochar Simultaneously Reduces Nutrient Leaching and Greenhouse Gas Emissions in Restored Wetland Soils. Wetlands 2020, 40, 1981–1991. [Google Scholar] [CrossRef]
  31. Jeffery, S.; Verheijen, F.G.A.; Kammann, C.; Abalos, D. Biochar Effects on Methane Emissions from Soils: A Meta-Analysis. Soil Biol. Biochem. 2016, 101, 251–258. [Google Scholar] [CrossRef]
  32. Kasak, K.; Truu, J.; Ostonen, I.; Sarjas, J.; Oopkaup, K.; Paiste, P.; Kõiv-Vainik, M.; Mander, Ü.; Truu, M. Biochar Enhances Plant Growth and Nutrient Removal in Horizontal Subsurface Flow Constructed Wetlands. Sci. Total Environ. 2018, 639, 67–74. [Google Scholar] [CrossRef]
  33. Lee, X.; Yang, F.; Xing, Y.; Huang, Y.; Xu, L.; Liu, Z.; Holtzman, R.; Kan, I.; Li, Y.; Zhang, L.; et al. Use of Biochar to Manage Soil Salts and Water: Effects and Mechanisms. CATENA 2022, 211, 106018. [Google Scholar] [CrossRef]
  34. Wu, Y.; Wang, X.; Zhang, L.; Zheng, Y.; Liu, X.; Zhang, Y. The Critical Role of Biochar to Mitigate the Adverse Impacts of Drought and Salinity Stress in Plants. Front. Plant Sci. 2023, 14, 1163451. [Google Scholar] [CrossRef]
  35. Ali, S.; Rizwan, M.; Qayyum, M.F.; Ok, Y.S.; Ibrahim, M.; Riaz, M.; Arif, M.S.; Hafeez, F.; Al-Wabel, M.I.; Shahzad, A.N. Biochar Soil Amendment on Alleviation of Drought and Salt Stress in Plants: A Critical Review. Environ. Sci. Pollut. Res. 2017, 24, 12700–12712. [Google Scholar] [CrossRef]
  36. Bansal, S.; Lishawa, S.C.; Newman, S. Typha (Cattail) Invasion in North American Wetlands: Biology, Regional Problems, Impacts, Ecosystem Services, and Management. Wetlands 2019, 39, 645–684. [Google Scholar] [CrossRef]
  37. Joseph, S.; Cowie, A.L.; Van Zwieten, L.; Bolan, N.; Budai, A.; Buss, W.; Cayuela, M.L.; Graber, E.R.; Ippolito, J.A.; Kuzyakov, Y.; et al. How Biochar Works, and When It Doesn’t: A Review of Mechanisms Controlling Soil and Plant Responses to Biochar. GCB Bioenergy 2021, 13, 1731–1764. [Google Scholar] [CrossRef]
  38. Beesley, L.; Moreno-Jiménez, E.; Gomez-Eyles, J.L. A Review of Biochars’ Potential Role in the Remediation, Revegetation and Restoration of Contaminated Soils. Environ. Pollut. 2011, 159, 3269–3282. [Google Scholar] [CrossRef]
  39. Biederman, L.A.; Harpole, W.S. Biochar and Its Effects on Plant Productivity and Nutrient Cycling: A Meta-Analysis. GCB Bioenergy 2013, 5, 202–214. [Google Scholar] [CrossRef]
  40. Amoah-Antwi, C.; Kwiatkowska-Malina, J.; Thornton, S.F. Restoration of Soil Quality Using Biochar and Brown Coal Waste: A Review. Sci. Total Environ. 2020, 722, 137852. [Google Scholar] [CrossRef]
  41. Thomas, S.C.; Gale, N. Biochar and Forest Restoration: A Review and Meta-Analysis of Tree Growth Responses. New For. 2015, 46, 931–946. [Google Scholar] [CrossRef]
  42. Chand, N.; Suthar, S.; Kumar, K. Wastewater Nutrients and Coliforms Removals in Tidal Flow Constructed Wetland: Effect of the Plant (Typha) Stand and Biochar Addition. J. Water Process Eng. 2021, 43, 102292. [Google Scholar] [CrossRef]
  43. Alsawy, T.; Rashad, E.; El-Qelish, M.; Mohammed, R.H. A Comprehensive Review on the Chemical Regeneration of Biochar Adsorbent for Sustainable Wastewater Treatment. npj Clean Water 2022, 5, 29. [Google Scholar] [CrossRef]
  44. Xiang, W.; Zhang, X.; Chen, J.; Zou, W.; He, F.; Hu, X.; Tsang, D.C.W.; Ok, Y.S.; Gao, B. Biochar Technology in Wastewater Treatment: A Critical Review. Chemosphere 2020, 252, 126539. [Google Scholar] [CrossRef]
  45. Liao, R.; Gao, B.; Fang, J. Invasive Plants as Feedstock for Biochar and Bioenergy Production. Bioresour. Technol. 2013, 140, 439–442. [Google Scholar] [CrossRef] [PubMed]
  46. Yin, S.; Wang, X.; Meng, Z.; Mo, X.; He, M.; Liu, J. Mitigating Invasive Species Using Biochar Derived from Invasive Plants in Saline-Alkaline Wetland Plant Communities Dominated by Amaranthus Palmeri. Appl. Veg. Sci. 2024, 27, e12801. [Google Scholar] [CrossRef]
  47. Wang, X.; Zheng, W.-L.; Yuan, H.-M.; van Kleunen, M.; Yu, F.-H.; Li, M.-H. Biochar Produced from Diverse Invasive Species Improves Remediation of Cadmium-Contaminated Soils. Biol. Invasions 2024, 26, 2595–2606. [Google Scholar] [CrossRef]
  48. Thengane, S.K.; Kung, K.; Hunt, J.; Gilani, H.R.; Lim, C.J.; Sokhansanj, S.; Sanchez, D.L. Market Prospects for Biochar Production and Application in California. Biofuels Bioprod. Biorefining 2021, 15, 1802–1819. [Google Scholar] [CrossRef]
  49. Garcia, B.; Alves, O.; Rijo, B.; Lourinho, G.; Nobre, C. Biochar: Production, Applications, and Market Prospects in Portugal. Environments 2022, 9, 95. [Google Scholar] [CrossRef]
  50. Bryant, K.E.; Noyes, A.M.; Carr, K.W. Evaluation of Long-Term Performance at Two Bioswale Installations Along I-294 in Northern Cook County, Illinois; Report: Illinois State Toll Highway Authority Submitted Under Grant ITHA 2015-01230 MINER; Illinois State Toll Highway Authority: Downers Grove, IL, USA, 2020.
  51. Illinois State Toll Highway Authority. Drainage Design Manual; Illinois State Toll Highway Authority: Downers Grove, IL, USA, 2025.
  52. Miner, J.; Bryant, K.E.; Ackerman, A.; Plankell, E.; Long, C. Using Bioswales to Improve the Quality of Roadway Runoff from I-294 in Northern Cook County, Illinois; Illinois State Geological Survey: Champaign, IL, USA, 2016. [Google Scholar]
  53. Ohsowski, B.M.; Redding, C.; Geddes, P.; Lishawa, S.C. Field-Based Measurement Tools to Distinguish Clonal Typha Taxa and Estimate Biomass: A Resource for Conservation and Restoration. Front. Plant Sci. 2024, 15, 1348144. [Google Scholar] [CrossRef]
  54. Cataldi, T.R.I.; Margiotta, G.; Del Fiore, A.; Bufo, S.A. Ionic Content in Plant Extracts Determined by Ion Chromatography with Conductivity Detection. Phytochem. Anal. 2003, 14, 176–183. [Google Scholar] [CrossRef] [PubMed]
  55. Bates, D.; Mächler, M.; Bolker, B.; Walker, S. Fitting Linear Mixed-Effects Models Using Lme4. J. Stat. Softw. 2015, 67, 1–48. [Google Scholar] [CrossRef]
  56. R Core Team. R: A Language and Environment for Statistical Computing; R Foundation for Statistical Computing: Vienna, Austria, 2025. [Google Scholar]
  57. Lenth, R.V.; Piaskowski, J. Emmeans: Estimated Marginal Means, Aka Least-Squares Means. 2025. Available online: https://cran.r-project.org/web/packages/emmeans/index.html (accessed on 15 March 2026).
  58. Larkin, D.J.; Freyman, M.J.; Lishawa, S.C. Mechanisms of Dominance by the Invasive Hybrid Cattail Typha × Glauca. Biol. Invasions 2012, 14, 65–77. [Google Scholar] [CrossRef]
  59. Banik, C.; Lawrinenko, M.; Bakshi, S.; Laird, D.A. Impact of Pyrolysis Temperature and Feedstock on Surface Charge and Functional Group Chemistry of Biochars. J. Environ. Qual. 2018, 47, 452–461. [Google Scholar] [CrossRef]
  60. Lawrinenko, M.; Laird, D.A. Anion Exchange Capacity of Biochar. Green Chem. 2015, 17, 4628–4636. [Google Scholar] [CrossRef]
  61. Lawrinenko, M.; Laird, D.A.; Johnson, R.L.; Jing, D. Accelerated Aging of Biochars: Impact on Anion Exchange Capacity. Carbon 2016, 103, 217–227. [Google Scholar] [CrossRef]
  62. Phosphorus Release from Calcium-Based Modified Sludge-Derived Biochar Under Low-Molecular-Weight Organic Acids: Dual Role of Inorganic Anions|ACS Sustainable Chemistry & Engineering. Available online: https://pubs.acs.org/doi/abs/10.1021/acssuschemeng.5c02669 (accessed on 28 July 2025).
  63. Yuan, Y.; Bolan, N.; Prévoteau, A. Applications of Biochar in Redox-Mediated Reactions. Bioresour. Technol. 2017, 246, 271–281. [Google Scholar] [CrossRef]
  64. Wu, B.; Yang, H.; Li, S.; Tao, J. The Effect of Biochar on Crop Productivity and Soil Salinity and Its Dependence on Experimental Conditions in Salt-Affected Soils: A Meta-Analysis. Carbon Res. 2024, 3, 56. [Google Scholar] [CrossRef]
  65. Lishawa, S.C.; Dunton, E.M.; Pearsall, D.R.; Monks, A.M.; Himmler, K.B.; Carson, B.D.; Loges, B.; Albert, D.A. Wetland Waterbird Food Resources Increased by Harvesting Invasive Cattails. J. Wildl. Manag. 2020, 84, 1326–1337. [Google Scholar] [CrossRef]
  66. Jeke, N.N.; Zvomuya, F.; Cicek, N.; Ross, L.; Badiou, P. Nitrogen and Phosphorus Phytoextraction by Cattail (Typha spp.) during Wetland-Based Phytoremediation of an End-of-Life Municipal Lagoon. J. Environ. Qual. 2019, 48, 24–31. [Google Scholar] [CrossRef] [PubMed]
  67. Sharma, P.; Asaeda, T.; Manatunge, J.; Fujino, T. Nutrient Cycling in a Natural Stand of Typha angustifolia. J. Freshw. Ecol. 2006, 21, 431–438. [Google Scholar] [CrossRef]
  68. Farrer, E.C.; Goldberg, D.E. Litter Drives Ecosystem and Plant Community Changes in Cattail Invasion. Ecol. Appl. 2009, 19, 398–412. [Google Scholar] [CrossRef]
  69. Vaccaro, L.E.; Bedford, B.L.; Johnston, C.A. Litter Accumulation Promotes Dominance of Invasive Species of Cattails (Typha spp.) in Lake Ontario Wetlands. Wetlands 2009, 29, 1036–1048. [Google Scholar] [CrossRef]
  70. Freyman, M.J. The Effect of Litter Accumulation of the Invasive Cattail Typha × glauca on a Great Lakes Coastal Marsh. Master’s Thesis, Loyola University Chicago, Chicago, IL, USA, 2008. [Google Scholar]
  71. Yensen, N.P.; Biel, K.Y. Soil Remediation Via Salt-Conduction and the Hypotheses of Halosynthesis and Photoprotection. In Proceedings of the Ecophysiology of High Salinity Tolerant Plants; Khan, M.A., Weber, D.J., Eds.; Springer: Dordrecht, The Netherlands, 2006; pp. 313–344. [Google Scholar]
Figure 1. Locations of the four bioswales included in the study within the Tollway. Four (4) blocked bioswales were selected along the Tri-State Tollway (I-294), Milepost 49.9 to 51.2 which are indicated by the red boxes. One (1) bioswale is located northbound, and three (3) bioswales are located southbound.
Water 18 00709 g001
Figure 2. Bioswale experimental block design illustrates the employed full-factorial treatments (0 T/ha biochar; no harvest; 20 T/ha biochar; harvest), water-level approximation, subplot locations, and water flow from an aerial view (above) and cross-section (below). Due to practical constraints in the field, biochar application was applied in downstream plots to prevent transport control (i.e., 0 T/ha biochar) plots. Note that the harvest treatment was randomly assigned within each biochar treatment unit.
Water 18 00709 g002
Figure 3. (A) Predicted fall 2023 and fall 2024 total Typha Dry Mass (grams/m2) in biochar treatments and harvest treatments for 4 Tollway blocks. Bar graphs given as raw data mean ± standard error. The X-axis shows the experimental biochar rate, with harvest treatment indicated within the legend. (B) The statistical significance graph indicates detected significance (p ≤ 0.05) and trend (0.10 ≥ p > 0.05) linear mixed effect model contrasts with a Sidak correction (Estimated Marginal Mean ± Standard Error) resulting from the best fitting selected model. Selected Model: log(Predicted Typha Dry Mass) ~ biochar treatment + harvest treatment + random effect (1|time/block).
Water 18 00709 g003
Figure 4. (A) Fall 2023 and fall 2024 total Typha stem density (count/m2) in biochar treatments and harvest treatments for 4 Tollway blocks. Bar graphs given as raw data mean ± standard error. The X-axis shows the experimental biochar rate, with harvest treatment indicated within the legend. (B) The statistical significance graph indicates detected significance (p ≤ 0.05) and trend (0.10 ≥ p > 0.05) linear mixed effect model contrasts with a Sidak correction (Estimated Marginal Mean ± Standard Error) resulting from the best fitting selected model. Selected Model: log10(Typha Stem Density) ~ biochar treatment + harvest treatment + random effect (1|time/block).
Water 18 00709 g004
Figure 5. (A) Fall 2023 and fall 2024 total plant richness (count/m2) in biochar treatments and harvest treatments for 4 Tollway blocks. Bar graphs given as raw data mean ± standard error. The X-axis shows the experimental biochar rate, with harvest treatment indicated within the legend. (B) The statistical significance graph indicates detected significance (p ≤ 0.05) and trend (0.10 ≥ p > 0.05) linear mixed effect model contrasts with a Sidak correction (Estimated Marginal Mean ± Standard Error) resulting from the best fitting selected model. Selected Model: log(Total Plant Richness) ~ biochar treatment + harvest treatment + random effect (1|time/block).
Water 18 00709 g005
Figure 6. (A) Sediment chloride concentration (ppm) in biochar treatments and harvest treatments for 4 IL Tollway bioswales at each sampling period. Bar graphs given as raw data mean ± standard error. The X-axis shows the experimental biochar rate, with harvest treatment indicated within the legend. (B) The statistical significance graph indicates detected significance (p ≤ 0.05) and trend (0.10 ≥ p > 0.05) linear mixed effect model contrasts with a Sidak correction (Estimated Marginal Mean ± Standard Error) resulting from the best fitting selected model. Selected Model: log(Sediment Chloride Concentration) ~ biochar treatment + harvest treatment + random effect (1|time/block).
Water 18 00709 g006
Figure 7. (A) Aboveground Typha tissue chloride concentration (ppm) in biochar treatments and harvest treatments for four IL Tollway bioswales. Bar graphs given as raw data mean ± standard error. The X-axis shows the experimental biochar rate, with harvest treatment indicated within the legend. (B) The statistical significance graph indicates detected significance (p ≤ 0.05) and trend (0.10 ≥ p > 0.05) linear mixed effect model contrasts with a Sidak correction (Estimated Marginal Mean ± Standard Error) resulting from the best fitting selected model. Selected Model: log10(Typha Tissue Chloride Concentration) ~ biochar treatment + harvest treatment + random effect (1|time/block).
Water 18 00709 g007
Figure 8. (A) Fall 2023 and fall 2024 scaled Typha tissue chloride grams/m2 in biochar treatments and harvest treatments for four IL Tollway bioswales. Bar graphs given as raw data mean ± standard error. The X-axis shows the experimental biochar rate, with harvest treatment indicated within the legend. (B) The statistical significance graph indicates detected significance (p ≤ 0.05) and trend (0.10 ≥ p > 0.05) linear mixed effect model contrasts with a Sidak correction (Estimated Marginal Mean ± Standard Error) resulting from the best fitting selected model. Selected Model: log10(harvestable Chloride in Typha Dry Mass) ~ biochar treatments + harvest treatment + random effect (1|time/block).
Water 18 00709 g008
Disclaimer/Publisher’s Note: The statements, opinions and data contained in all publications are solely those of the individual author(s) and contributor(s) and not of MDPI and/or the editor(s). MDPI and/or the editor(s) disclaim responsibility for any injury to people or property resulting from any ideas, methods, instructions or products referred to in the content.