


Abstract
Background: Husk number is a key agronomic trait in maize that affects grain dehydration rate and yield, yet its regulatory mechanisms remain largely unknown. This study aimed to identify gene modules and hub genes associated with husk number by integrating transcriptome profiling, hierarchical clustering, and weighted gene co-expression network analysis (WGCNA). Methods: RNA-seq was performed on ear tissues from two maize inbred lines with extreme husk numbers (LJ311, ~20 husks; PHG35, ~5 husks) at four developmental stages (V7–V10). A total of 12,605 putative husk-associated genes were identified. Differential expression analysis, hierarchical clustering, and WGCNA were combined to prioritize candidate genes. Results: Hierarchical clustering revealed a late-stage-specific gene cluster (Cluster 3, 44 genes) strongly up-regulated at V8–V10 in the high-husk line. WGCNA identified three modules significantly correlated with husk number: MEblue and MEbrown (positively) and MEturquoise (negatively). Cluster 3 was enriched in the tricarboxylic acid (TCA) cycle, DNA replication, and glycerophospholipid metabolism. Intersecting hub genes (|kME| > 0.9) with high-confidence differentially expressed genes (DEGs) (|log2FoldChange| > 2) yielded two prioritized candidate gene sets: up-regulated genes enriched in cell cycle, brassinosteroid (BR) signaling, and phospholipid metabolism; down-regulated genes enriched in mitogen-activated protein kinase (MAPK) signaling, glycolysis, and cell wall degradation. Conclusions: These results suggest that husk number may be regulated by a potential BR–MAPK–cell cycle regulatory axis, providing a regulatory network and candidate genes for future validation and molecular breeding.
1. Introduction
Maize (Zea mays L.) is one of the most important food crops in the world. Its global production reached 1.287 billion tons in 2025 (https://www.fao.org/ (accessed on 23 April 2026)). Over recent decades, mechanical harvesting of maize has greatly reduced labor intensity and saved labor costs. As a result, achieving full mechanization of maize production has become an urgent task [1,2]. Among the many technical challenges, mechanized grain harvesting remains the final bottleneck. Currently, the grain moisture content of most maize varieties in China reaches 30–40% at harvest. This value is far higher than the standard suitable for mechanized harvesting, which is 15–25% [3,4]. As a result, the mechanized grain harvesting area for maize in China is less than 5%. High grain moisture not only seriously limits harvesting efficiency but also increases drying and storage costs. In addition, it leads to a higher rate of kernel breakage during mechanical harvesting. Under warm and humid conditions, it can also cause problems such as kernel mold, fungal infection, and ear sprouting [5,6,7]. Therefore, increasing the kernel dehydration rate (KDR) during late developmental stages and reducing grain moisture content at harvest have become two of the most important objectives in modern maize breeding programs [8].
Grain dehydration rate is affected by many factors. Among them, husk morphology plays a key role. A husk is a modified leaf that encloses the maize ear. From the perspective of plant developmental biology, it is a protective structure produced by axillary meristems before floret formation [9,10]. The developmental pattern of husk leaves is very different from that of normal leaves. In terms of morphogenesis, the husk sheath originates from lateral meristems and is homologous to the leaf sheath that surrounds the stem. The husk blade, meanwhile, develops from the further extension of the top of the husk sheath [11]. Studies have shown that husk area is significantly and positively correlated with grain moisture content at harvest. Maize varieties with a smaller husk area tend to have a faster grain dehydration rate [5]. Too many husk leaves create a sealed micro-environment around the ear and restrict air movement. As a result, grain water loss is greatly slowed down. In contrast, several husk traits can help speed up grain dehydration. These traits include fewer husk layers, thinner husk leaves, loose husk coverage, and early husk senescence [12,13]. Many studies have confirmed that husk number, husk length, and husk coverage are all significantly and positively correlated with grain moisture content at harvest [14,15]. Therefore, improving husk traits through genetic approaches has become a key goal in maize breeding. The aim is to maintain sufficient protection while also promoting efficient grain dehydration, so that the new varieties will be more suitable for mechanized harvesting.
In recent years, quantitative trait locus (QTL) mapping and genome-wide association studies (GWAS) in different maize populations have identified several QTLs and candidate genes related to husk number [16,17,18,19]. However, because husk traits have complex quantitative genetic characteristics and single-gene approaches have limitations, the global gene regulatory network and core functional modules associated with husk number determination are still not fully understood. Transcriptome sequencing (RNA-seq) combined with computational biology methods has become an important strategy for dissecting the molecular basis of complex agronomic traits [20]. Differential expression analysis can identify genes that are significantly differentially expressed between different genotypes or developmental stages. This step provides an initial pool of candidate genes for downstream analyses [21]. Unsupervised hierarchical clustering, in turn, groups genes based on the similarity of their expression patterns. It can reveal naturally occurring gene sets with potential functional coherence [22]. Weighted gene co-expression network analysis (WGCNA) further organizes genes into co-expression modules. It then correlates these modules with external phenotypic traits. This allows the identification of key regulatory modules and highly connected hub genes [23,24]. The above methods and their integration strategies have been successfully applied to the study of various complex traits in maize. For example, the combined analysis of dynamic transcriptomes and GWAS has revealed the regulatory mechanism of Agrobacterium-mediated transformation in maize [25]. In another case, the integration of QTL mapping and WGCNA uncovered the molecular mechanism by which Zmccr3 regulates seed germination in maize [26]. In addition, the combined use of transcriptomics and WGCNA has provided strong support for the discovery and identification of elite genes. For example, this approach has been applied to the identification of genes responding to low temperature in maize seedlings [27]. It has also been used to study the plastic genetic regulation of root architecture in response to salt stress in maize [28]. Although these methods have been widely used in maize research, their combined application to the regulation of husk number has not been reported yet.
In our integrated approach, two maize inbred lines with extreme differences in husk number were used. They were LJ311, with about 20 husks, and PHG35, with about 5 husks. A comprehensive transcriptome analysis was performed at four key developmental stages: V7, V8, V9, and V10. We adopted an integrated strategy that combined differential expression analysis, unsupervised hierarchical clustering, and WGCNA. Using this approach, we systematically identified co-expression modules and hub genes associated with husk number variation. By comparing unsupervised clustering with co-expression network analysis and applying a strict candidate gene filtering process, we constructed a bi-directional regulatory model. This model covers both potential promotive and inhibitory mechanisms and illustrates a molecular regulatory network associated with differences between contrasting husk-number genotypes. This study provides new insights into the molecular basis of husk number variation. It also offers valuable gene resources for breeding maize varieties suitable for mechanized harvesting.
2. Results
2.1. Phenotypic Difference in Husk Number and Global Transcriptome Characteristics
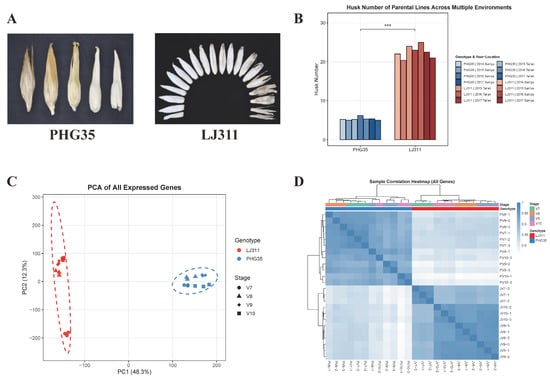
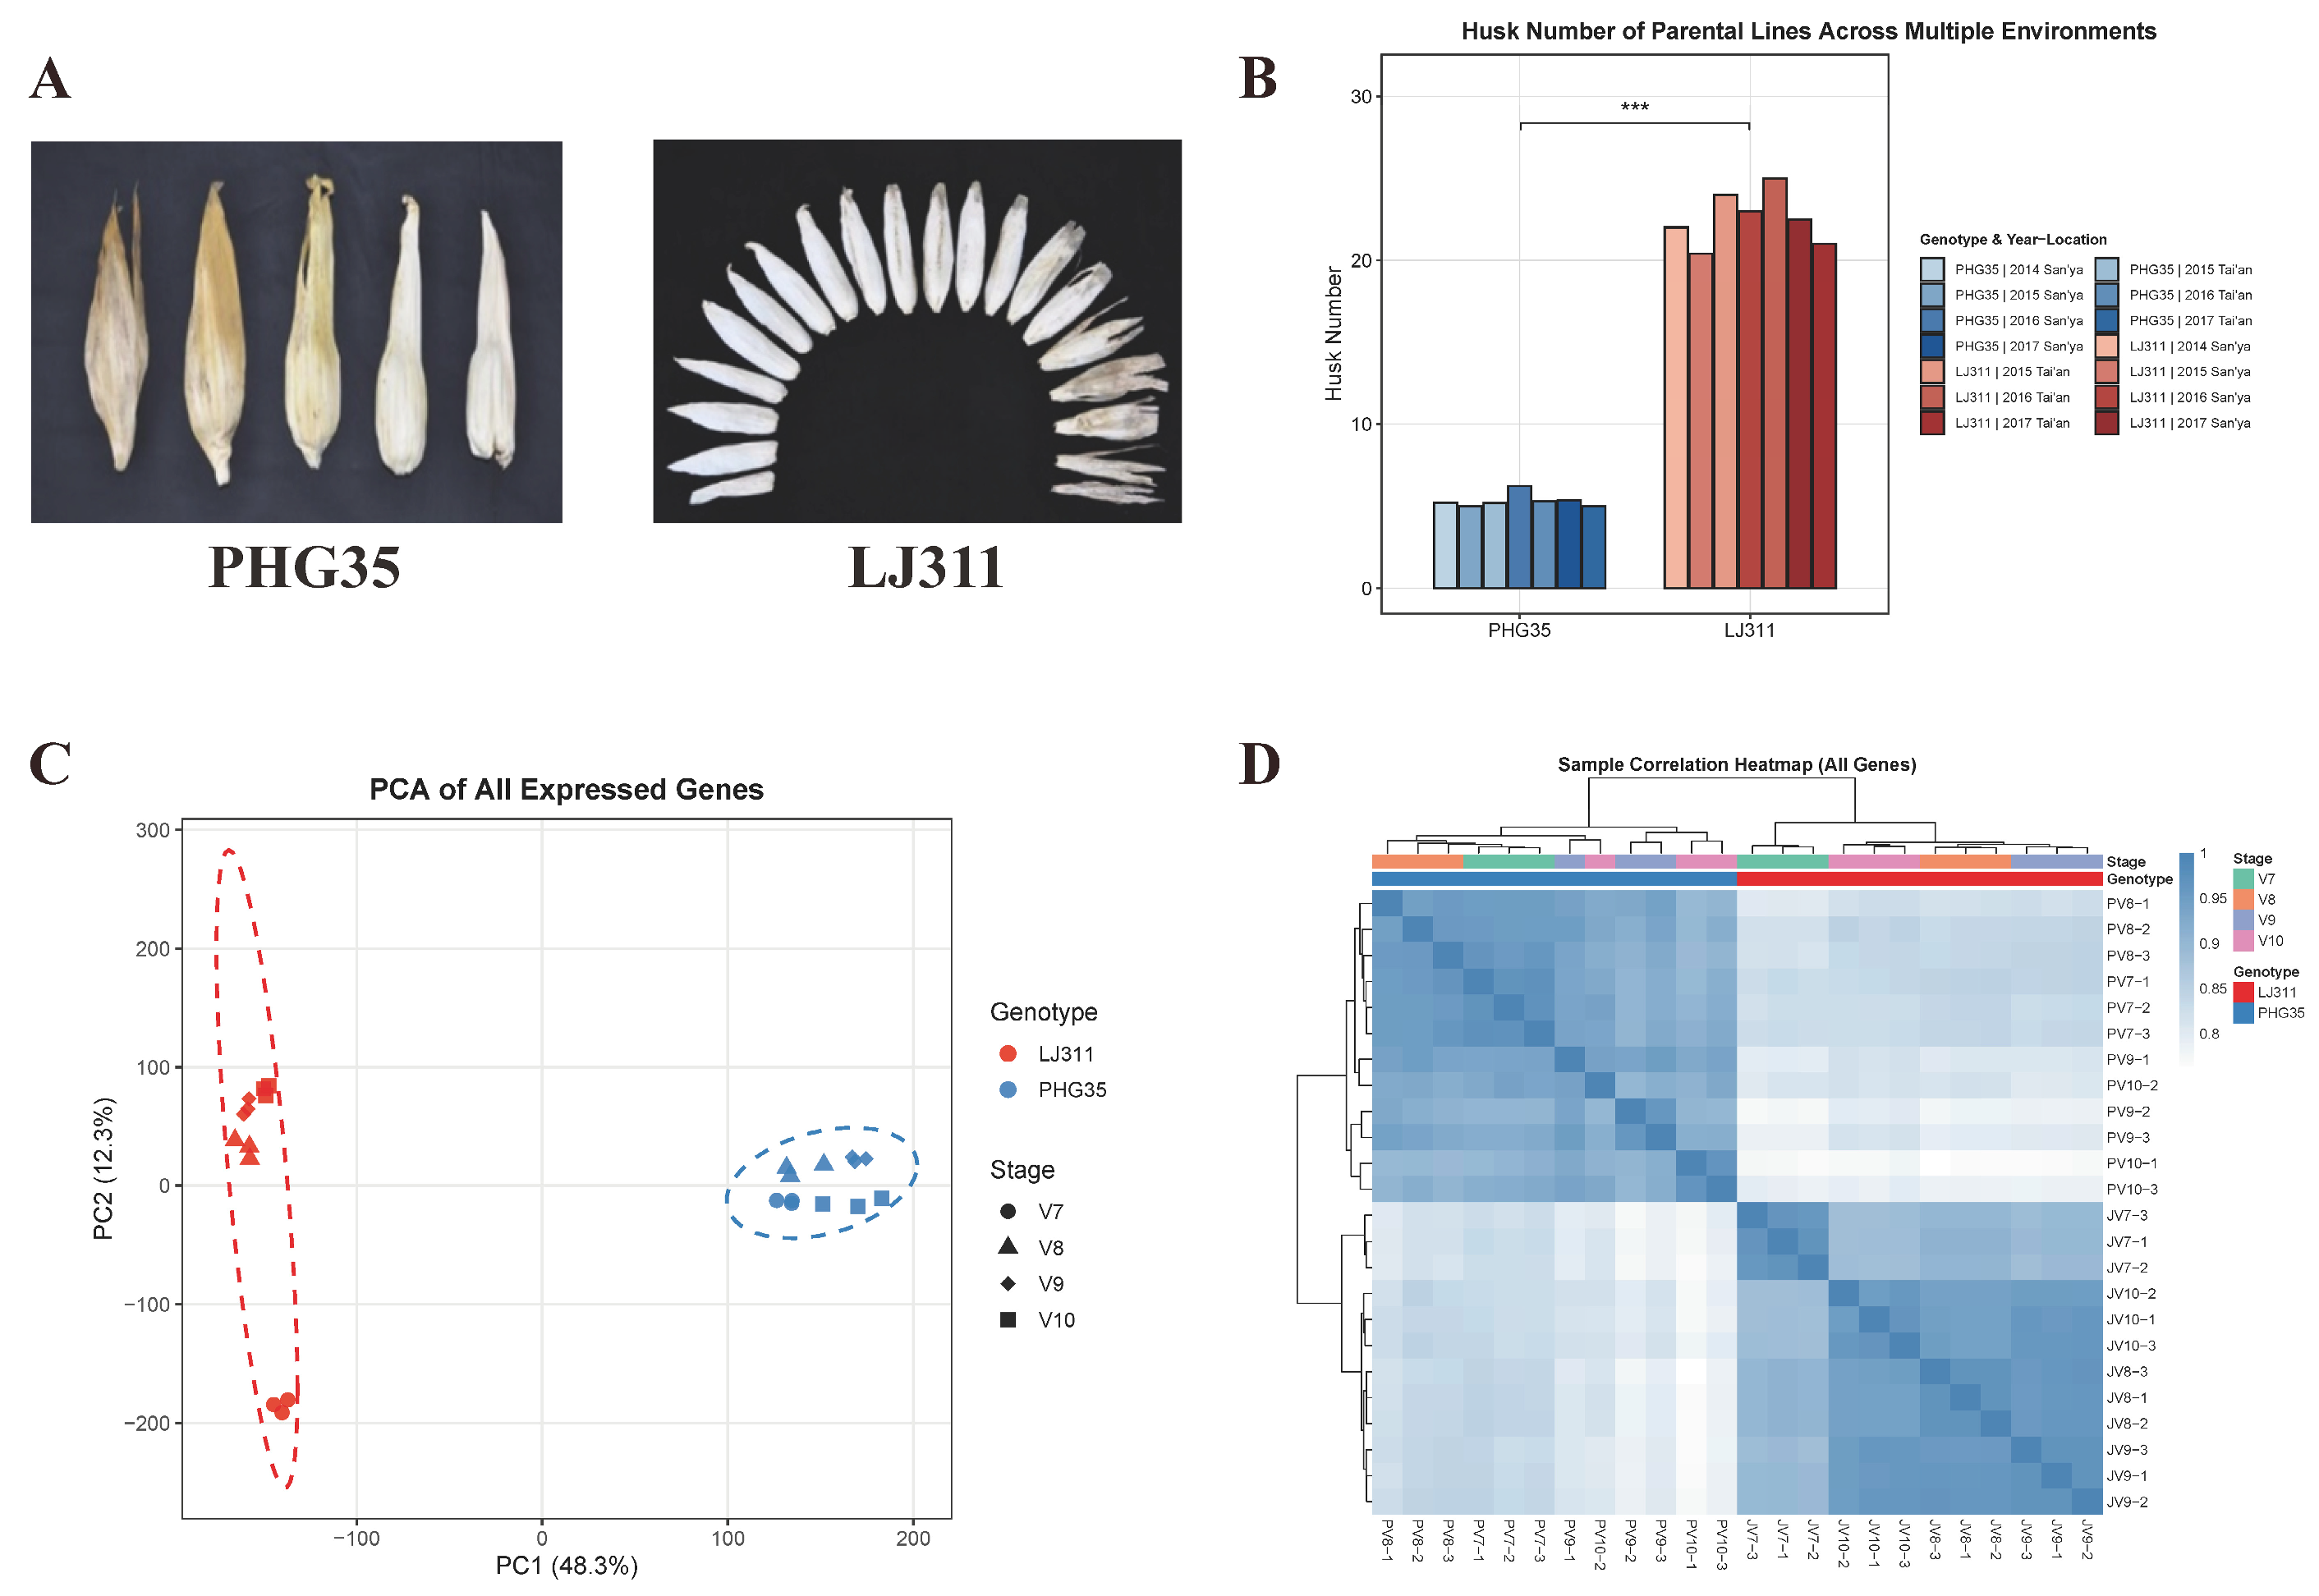
The two inbred lines showed a significant difference in mature husk number. Across seven combinations of year and location, LJ311 averaged 22.56 ± 1.61 husks, whereas PHG35 averaged 5.34 ± 0.43 husks (mean ± SD, n = 7) (Figure 1A,B). After data filtering, a total of 12,605 putative husk-associated genes were retained for subsequent differential expression and co-expression network analyses. To evaluate the overall relationships among the 24 samples, we performed principal component analysis (PCA) and Pearson correlation analysis. For these analyses, we used all genes that met the basic expression threshold. A gene was considered expressed if it had counts ≥10 in at least three samples.
Figure 1.
Phenotypic difference and global transcriptomic characterization of husk number. (A) Mature husk phenotypes of the two parental lines. (Left), PHG35; (right), LJ311. (B) Mean husk numbers of PHG35 and LJ311 across multiple years and locations (mean ± SD, n = 7). Differences between LJ311 and PHG35 were assessed by Student’s t-test. *** p < 0.001. (C) PCA of the 24 samples based on all genes passing the basic expression threshold. Colors indicate genotypes (LJ311, red; PHG35, blue), and shapes indicate developmental stages (V7, circle; V8, triangle; V9, diamond; V10, square). (D) Pearson correlation heatmap with hierarchical clustering of the 24 samples. Darker blue indicates higher correlation.
The PCA results showed a clear separation by genotype along the first principal component (PC1). PC1 explained 48.3% of the total variance. The second principal component (PC2) explained 12.3% of the variance and further reflected the effect of developmental stage (Figure 1C). The three biological replicates of the same genotype stage combination clustered tightly together on the PCA plot. Pearson correlation analysis further supported this pattern. Within each biological group, the correlation coefficients among replicates were all above 0.95. Meanwhile, the correlations between samples of different genotypes were obviously lower (Figure 1D). The library size of each sample ranged from 27 to 40 million reads. The number of detected genes was close to 30,000 in all samples. In addition, the expression density curves of the 24 samples were highly overlapping (Figure S1). Detailed information on RNA seq data quality is provided in Table S2. Together, these results indicate that the transcriptome data were of high quality and suitable for the following quantitative analyses.
2.2. Identification of Differentially Expressed Genes Between LJ311 and PHG35
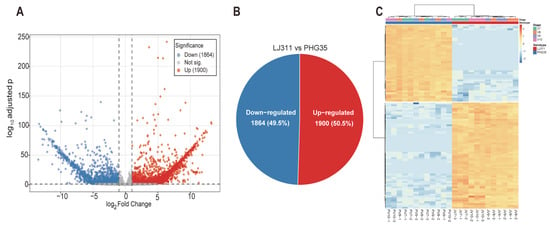
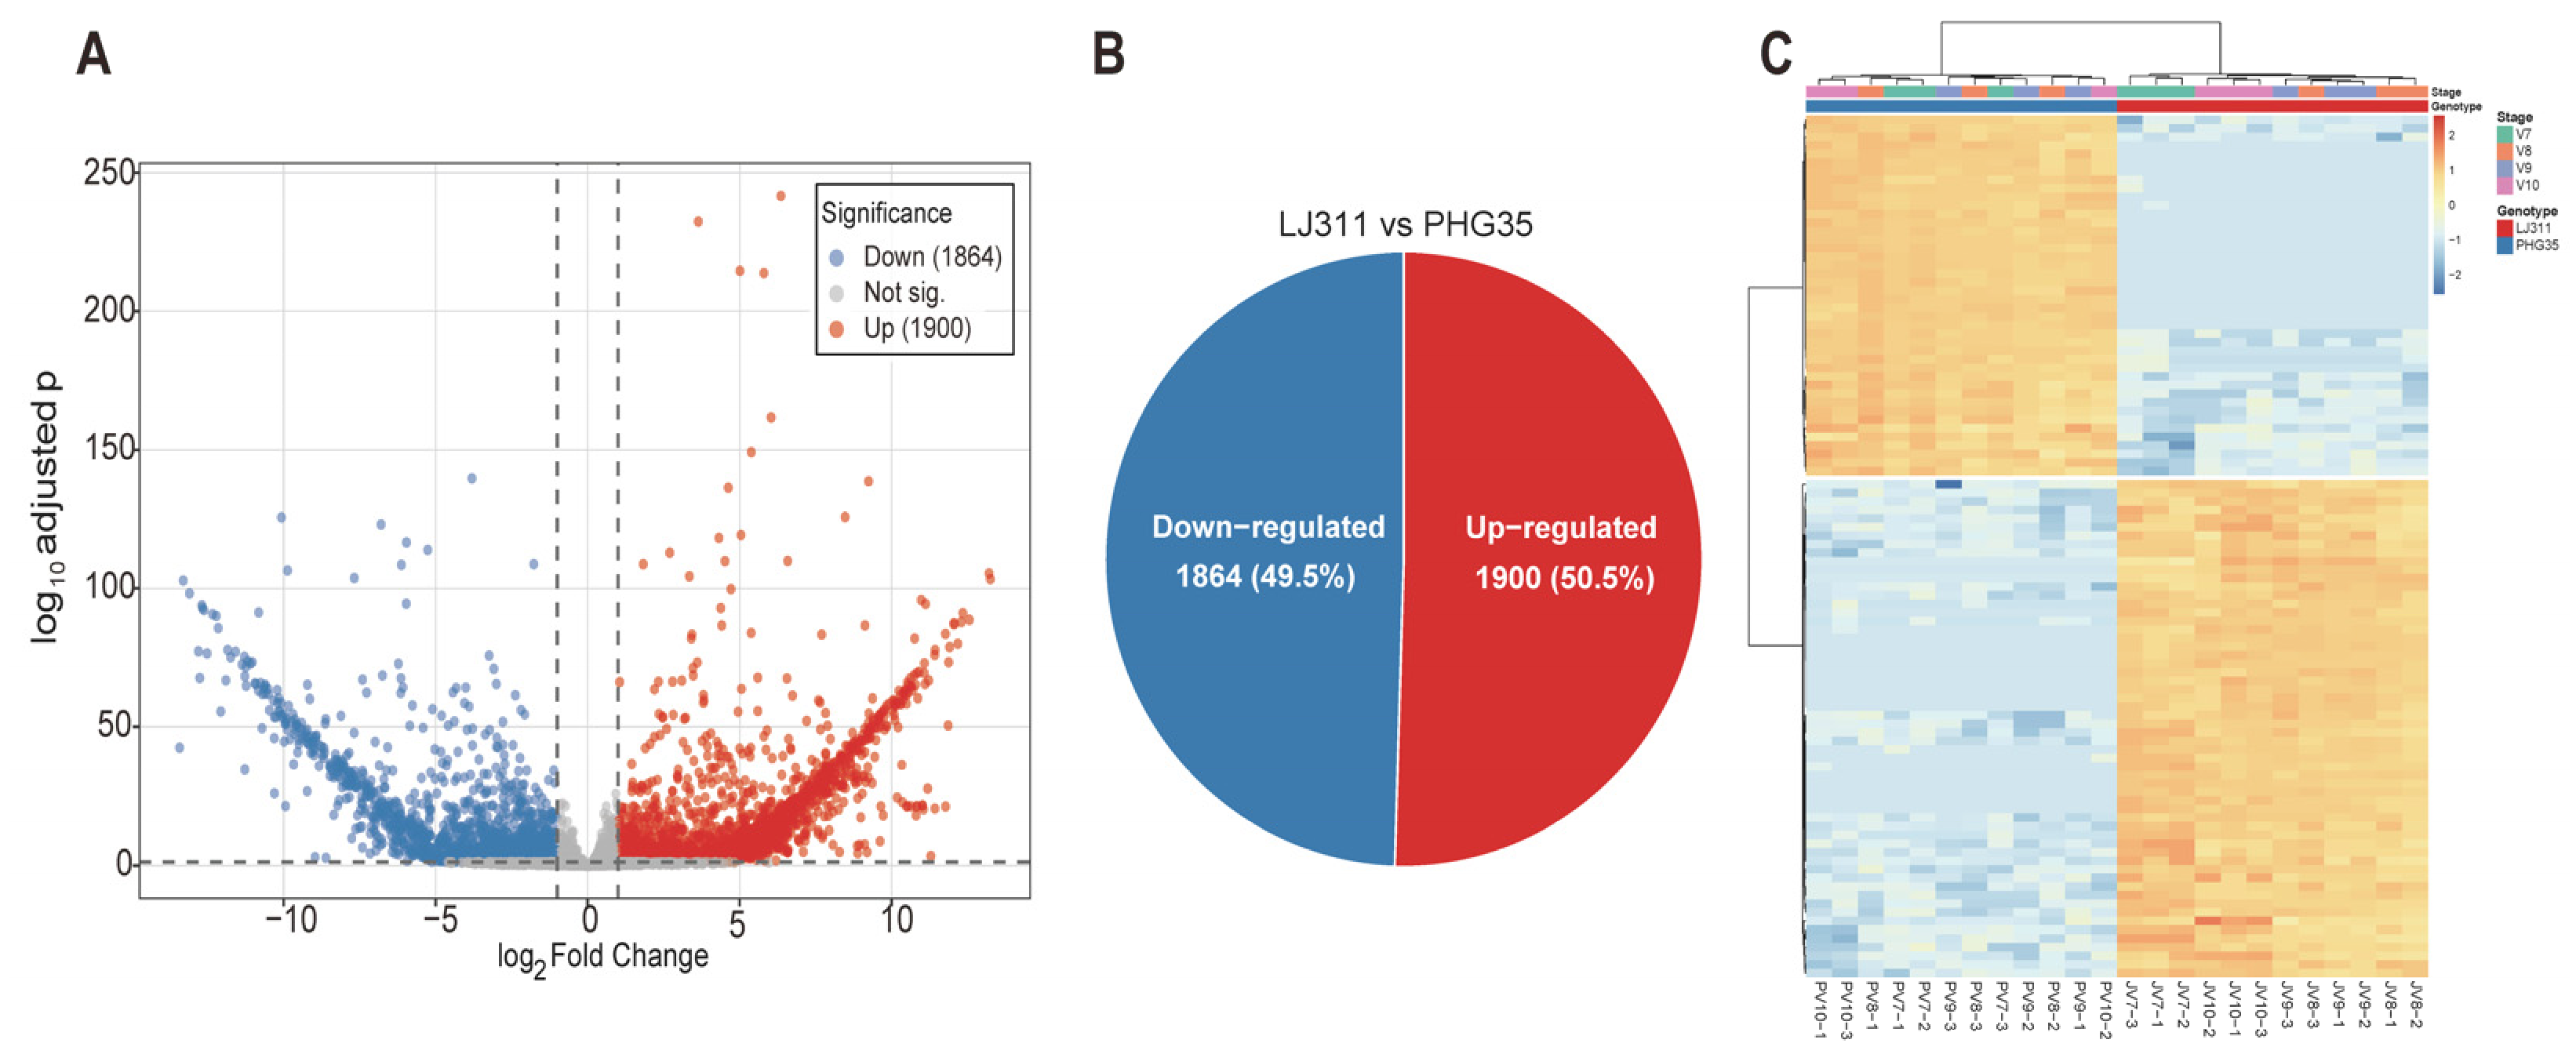
A stage-adjusted DESeq2 model was used to identify differentially expressed genes (DEGs) between LJ311 and PHG35. The design formula was set to ~ Stage + Genotype. Genes with |log2FoldChange| > 1 and padj < 0.05 were considered significantly differentially expressed. Using these criteria, a total of 3764 DEGs were identified. Among them, 1900 genes were up-regulated in LJ311, while 1864 genes were down-regulated (Figure 2A,B). The numbers of up- and down-regulated DEGs were nearly equal. For most DEGs, the |log2FoldChange| values fell within the range of 1 to 10. The proportions of up- and down-regulated genes were roughly balanced. Stage-specific comparisons further showed that there were both shared and unique DEGs across the four developmental stages (Figure S4). This observation supported the use of the stage-adjusted model to capture the robust genotype-driven differences. A heatmap of the top 100 most significant DEGs clearly separated the LJ311 and PHG35 samples. The upregulated and down-regulated genes each formed their own clusters (Figure 2C). These results indicate that extensive transcriptional reprogramming occurred between the two lines. The complete list of DEGs is provided in Table S3.
Figure 2.
Identification and expression profiling of differentially expressed genes (DEGs) between LJ311 and PHG35. (A) Volcano plot of DEGs. The screening thresholds were set at |log2FoldChange| > 1 and padj < 0.05. Red, up-regulated; blue, down-regulated; gray, not significant. (B) Pie chart showing the proportion of up-regulated and down-regulated DEGs. (C) Heatmap of the top 100 DEGs. Red indicates high expression, and blue indicates low expression.
Using the genotype × stage interaction model, 1947 genes showed significant interaction effects (padj < 0.05), indicating that their developmental expression patterns differed between LJ311 and PHG35. Notably, 39 of the 44 Cluster 3 genes (88.6%) exhibited significant genotype-by-stage interactions, representing a strong enrichment (hypergeometric test, p = 8.2 × 10⁻²⁷). This result supports the hypothesis that the late-stage-specific upregulation of Cluster 3 in LJ311 is genotype-by-stage-dependent rather than a simple genotype main effect. The complete list of genes showing significant genotype-by-stage interaction is provided in Table S7.
2.3. Unsupervised Hierarchical Clustering Identified a Late-Stage-Specific Gene Cluster
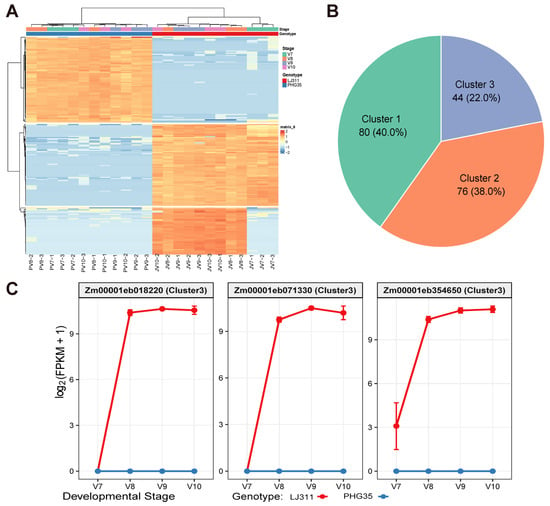
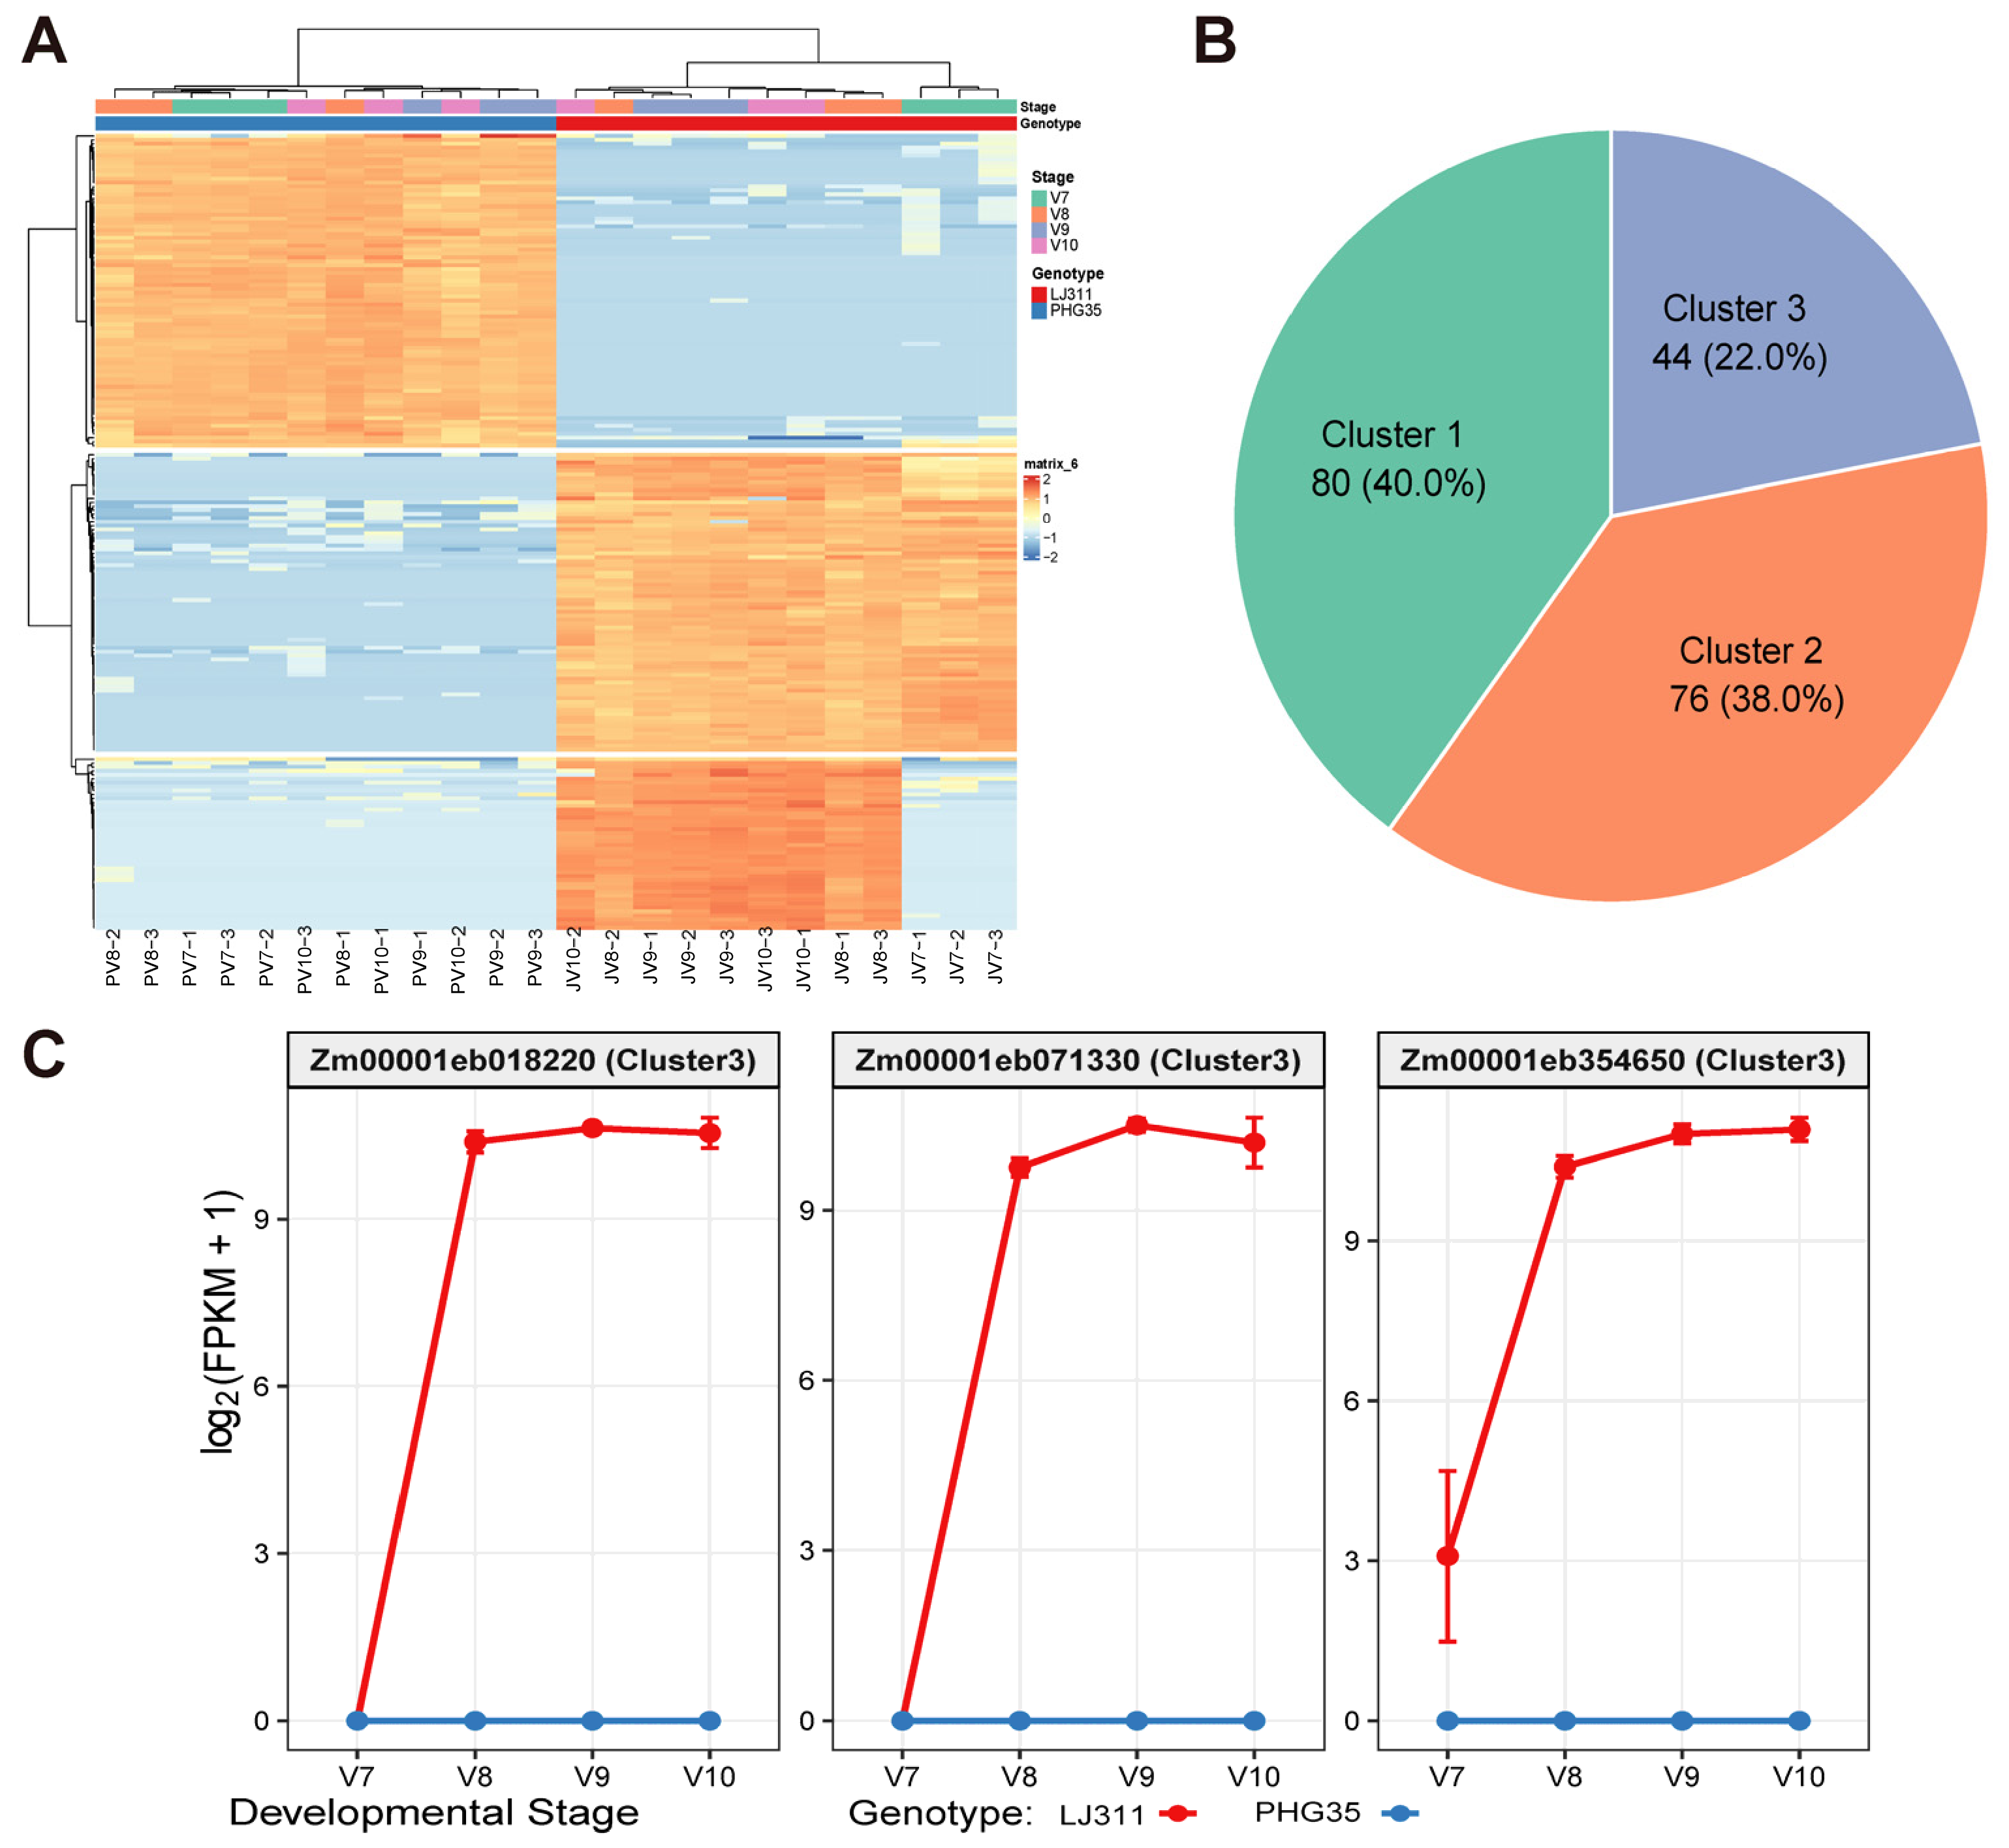
To explore the natural grouping of highly variable genes, we performed hierarchical clustering on the top 200 genes with the largest variance across all 24 samples. These genes were divided into three clusters (Cluster 1–3) (Figure 3A). Cluster 1 contained 80 genes and was mainly upregulated in PHG35. Cluster 2 contained 76 genes and showed relatively high expression across all stages in LJ311. By comparison, Cluster 3 (44 genes) showed a unique expression pattern. It was strongly and specifically upregulated at the late developmental stages (V8–V10) in LJ311. Meanwhile, its expression remained very low in PHG35 and also at the V7 stage in LJ311 (Figure 3A,B). The three genes with the largest |log2FoldChange| values in Cluster 3 all showed a clear increase in expression starting from V8 in LJ311. However, no such increase was found in PHG35 (Figure 3C). This late-stage-specific activation suggests that Cluster 3 may represent a functionally coordinated gene set. It is likely related to the determination of husk number.
Figure 3.
Unsupervised hierarchical clustering analysis of highly variable genes. (A) Heatmap of the top 200 most variable genes across all 24 samples. Genes were Z-score normalized and clustered into three major groups (Cluster 1–3) based on their expression patterns. (B) Pie chart showing the number of genes in each of the three clusters. (C) Expression dynamics of three representative genes from Cluster 3 across developmental stages and genotypes. These three genes had the largest |log2FoldChange| values within the cluster. Data are presented as mean ± SE.
2.4. WGCNA Identified Co-Expression Modules Significantly Correlated with Husk Number
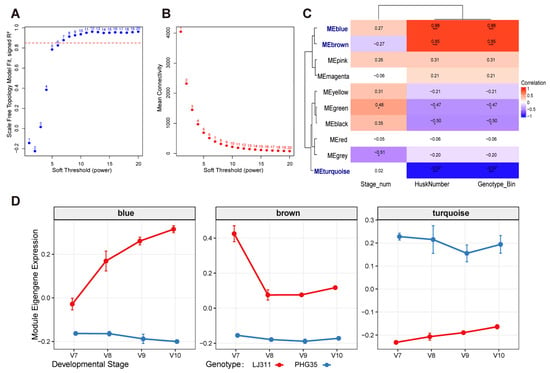
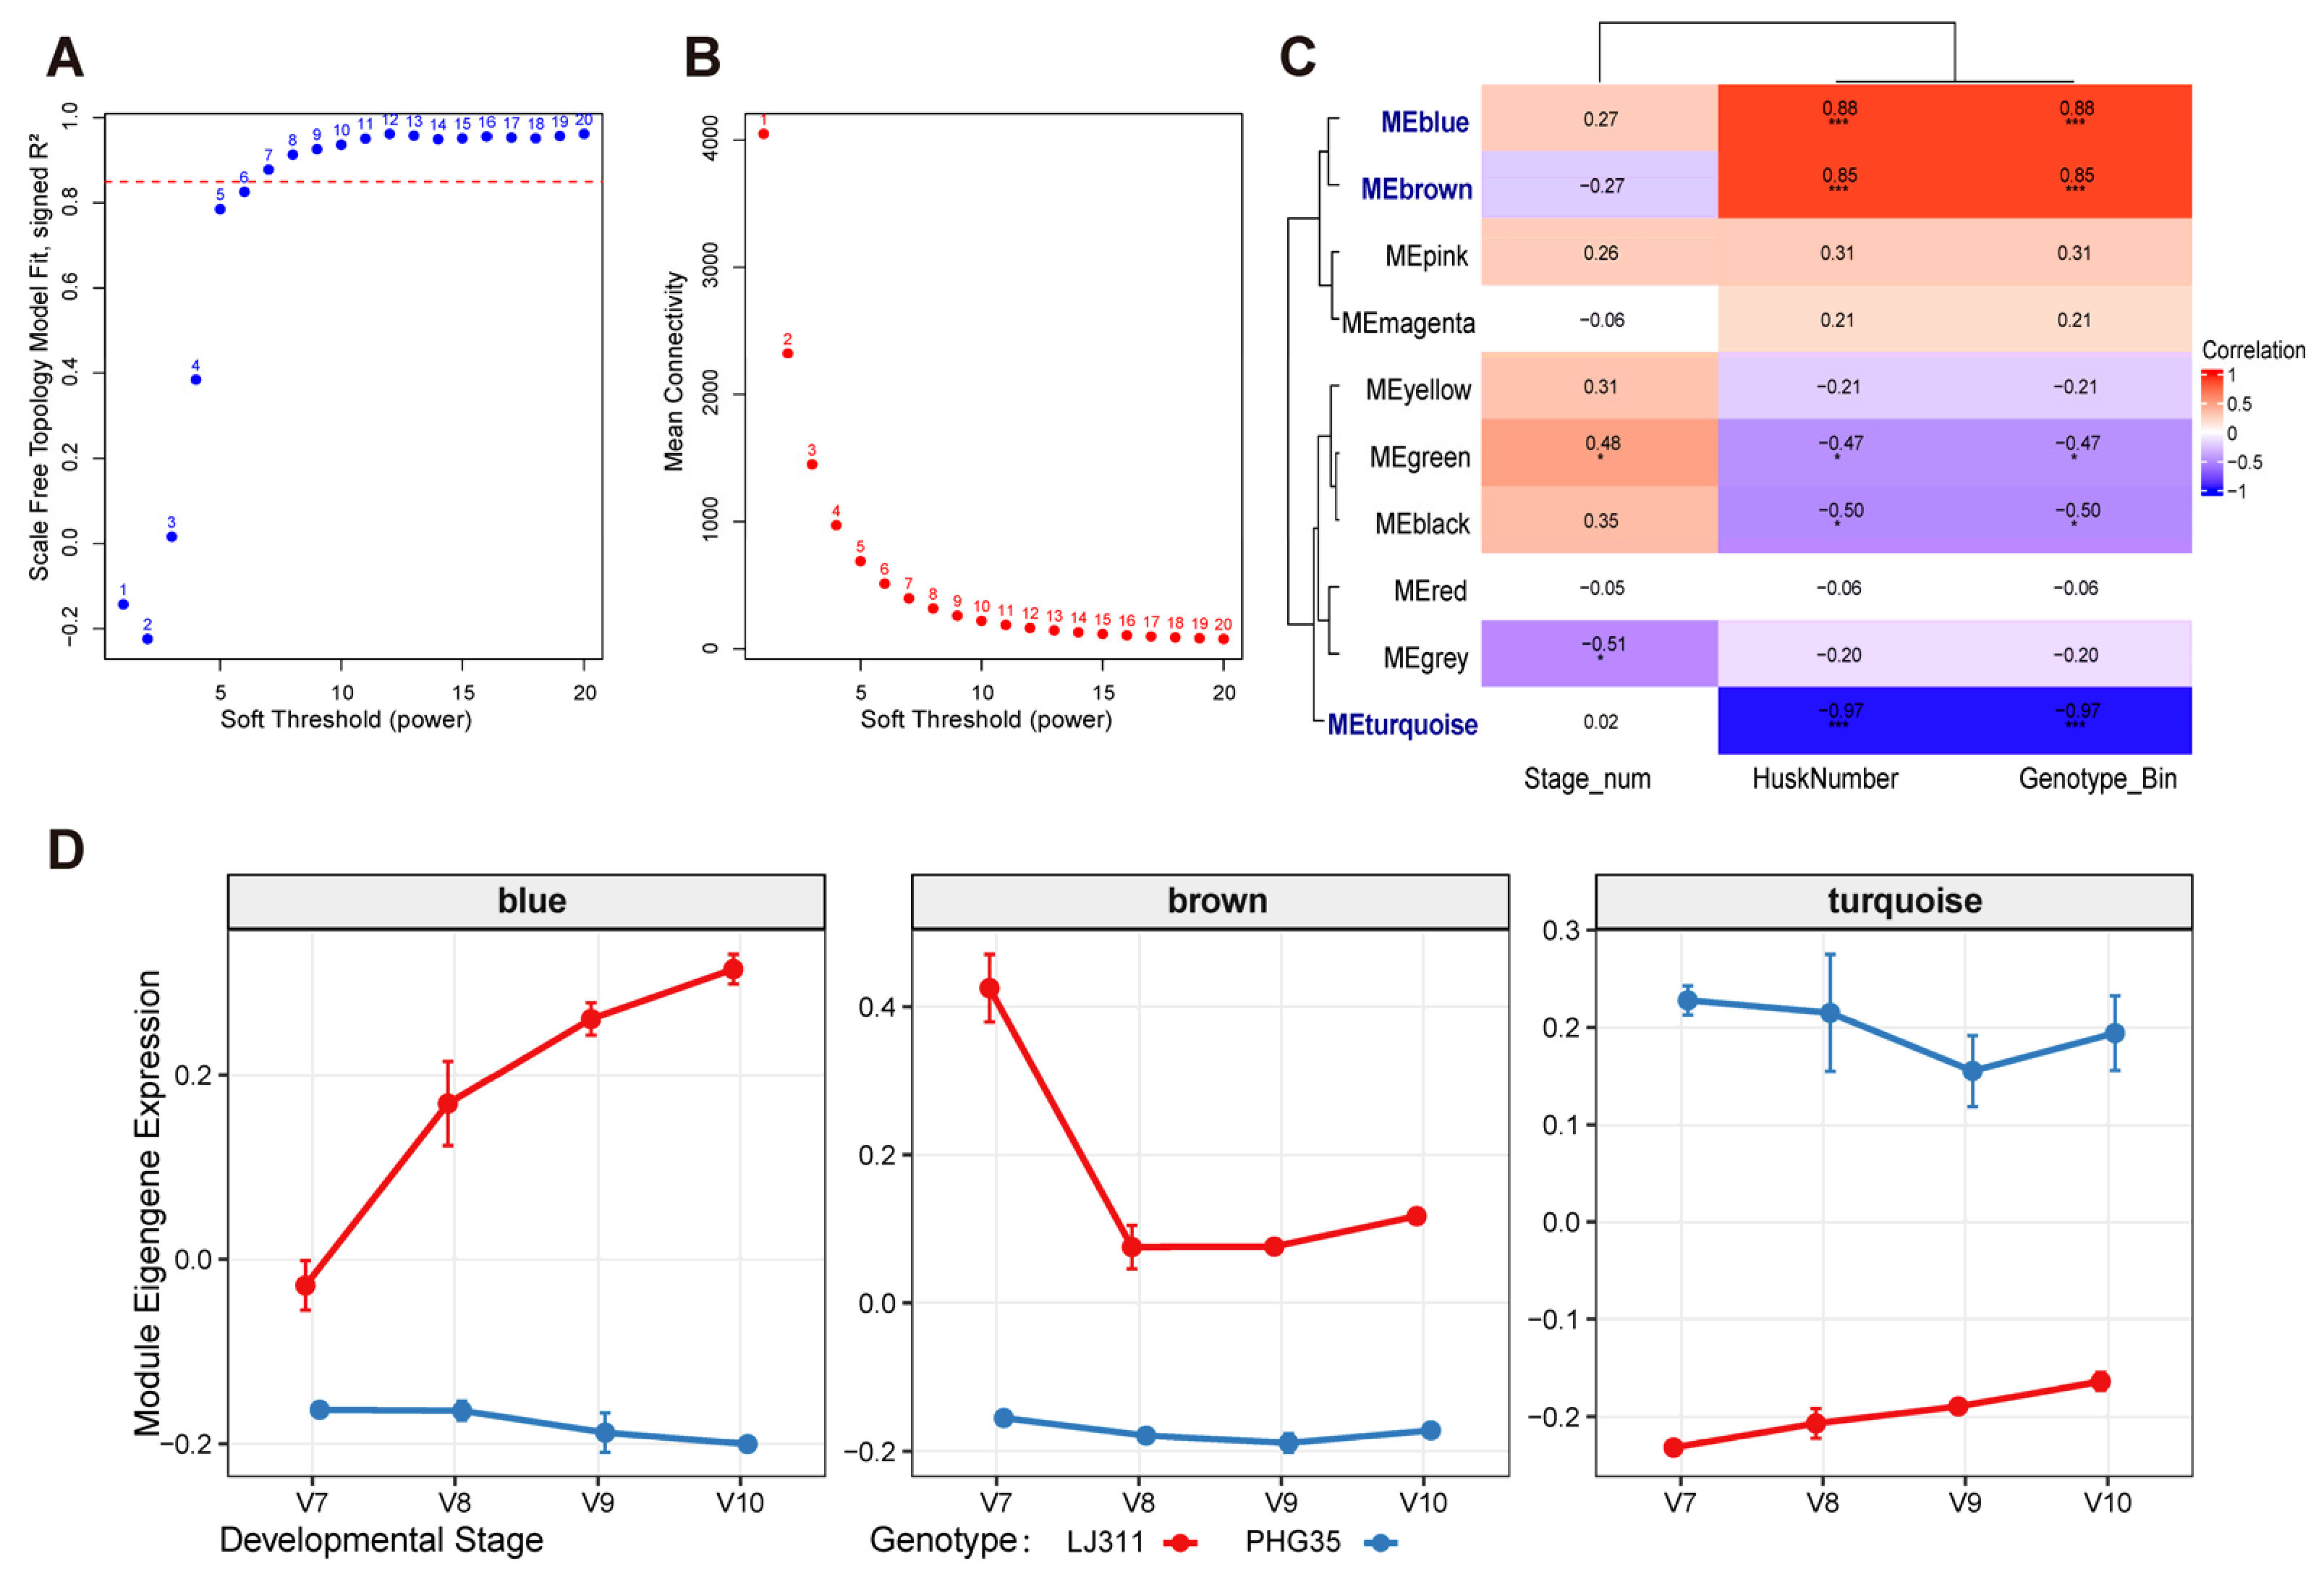
WGCNA was performed using the top 8000 highly variable genes. A soft thresholding power of 10 was chosen. At this power, the scale-free topology fit index (R2) exceeded 0.85, and the mean connectivity reached a plateau (Figure 4A,B). In total, ten co-expression modules were obtained. Pearson correlation analysis between module eigengenes (MEs) and traits identified three modules that were significantly correlated with husk number. The blue module (1371 genes, r = 0.88, and p < 0.001) and the brown module (1183 genes, r = 0.85, and p < 0.001) were positively correlated with both husk number and the LJ311 genotype. In contrast, the turquoise module (1963 genes, r = −0.97, p < 0.001) was strongly negatively correlated with this trait (Figure 4C). The ME expression trends of these three modules confirmed the correlation results. The blue and brown modules were consistently expressed at higher levels in LJ311, and the blue module showed a further increase at the V8–V10 stages. By comparison, the turquoise module was predominantly expressed in PHG35 (Figure 4D). The ME heatmap of all modules together with the gene dendrogram and module color assignment further illustrated the overall modular structure of the co-expression network (Figure S2).
Figure 4.
WGCNA of husk number-related modules. (A,B) Scale independence (A) and mean connectivity (B) across soft thresholding powers. The red line in (A) marks R2 = 0.85. (C) Module–trait correlation heatmap. Pearson correlation coefficients between module eigengenes and traits (husk number and genotype) are shown. p-values were calculated using Student’s t-distribution with n − 2 degrees of freedom (n = 24) via the corPvalueStudent function in WGCNA. * p < 0.05, *** p < 0.001. (D) Expression trends of module eigengenes for the three modules across developmental stages. Red, LJ311; blue, PHG35. Data are mean ± SE.
2.5. Comparison Between Hierarchical Clustering and WGCNA Results
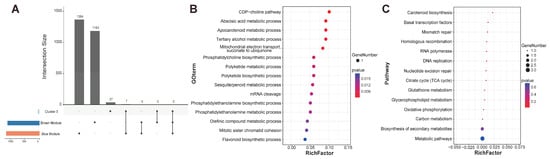
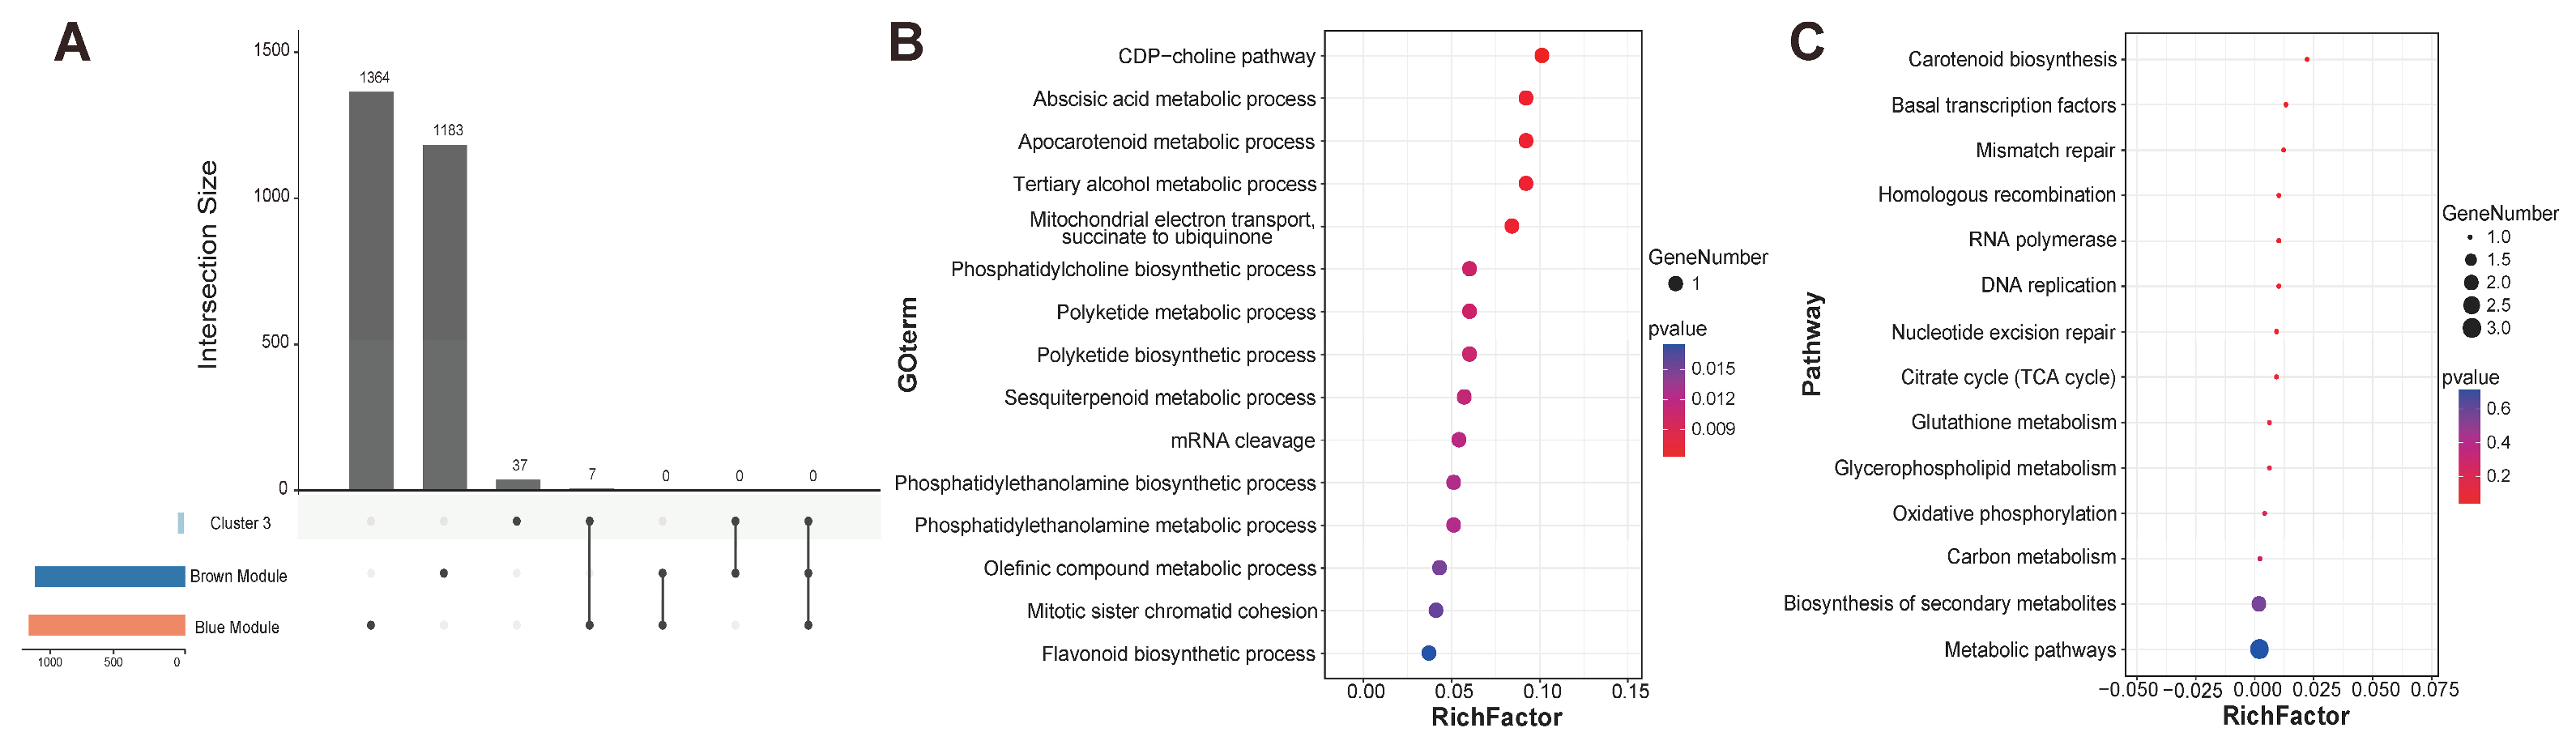
To evaluate the consistency between the unsupervised clustering and the co-expression network, we intersected the 44 genes of Cluster 3 with the gene lists of the blue and brown modules. Cluster 3 shared only seven genes with the blue module and had no overlap with the brown module (Figure 5A). Using the 8000 genes included in WGCNA as background, the expected overlap by chance was 7.54 genes; therefore, the observed overlap of seven genes was not significantly enriched (hypergeometric test, p = 0.648). In comparison, 79 of the 80 genes in Cluster 1 belonged to the turquoise module, and the genes in Cluster 2 were mainly found in the blue and brown modules (Figure S3). Thus, the agreement between hierarchical clustering and WGCNA is primarily at the functional pathway level rather than at the individual gene level. Although the overlap was limited, GO and KEGG enrichment analyses of all 44 genes in Cluster 3 showed that they were significantly enriched in several pathways. These pathways included the TCA cycle, oxidative phosphorylation, DNA replication and repair, glycerophospholipid metabolism, and carotenoid/ABA metabolism (Figure 5B). Together, these functional categories point to energy production, cell proliferation, and membrane biosynthesis. This suggests that Cluster 3 may act as a late-stage module with a potential role in promoting husk growth.
Figure 5.
Comparison between hierarchical clustering and WGCNA results: (A) UpSet plot showing the overlap of genes between Cluster 3 and the blue and brown modules. (B) GO enrichment bubble plot of all 44 genes in Cluster 3. Bubble size represents the number of enriched genes, and bubble color represents the adjusted p-value (padj). (C) KEGG enrichment bubble plot of all 44 genes in Cluster 3. Bubble size represents the number of enriched genes, and bubble color represents the adjusted p-value (padj).
2.6. Hub Gene Identification and Refinement of Prioritized Candidate Genes
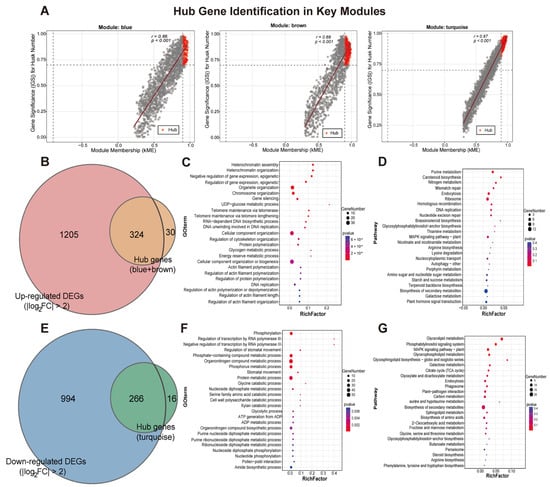
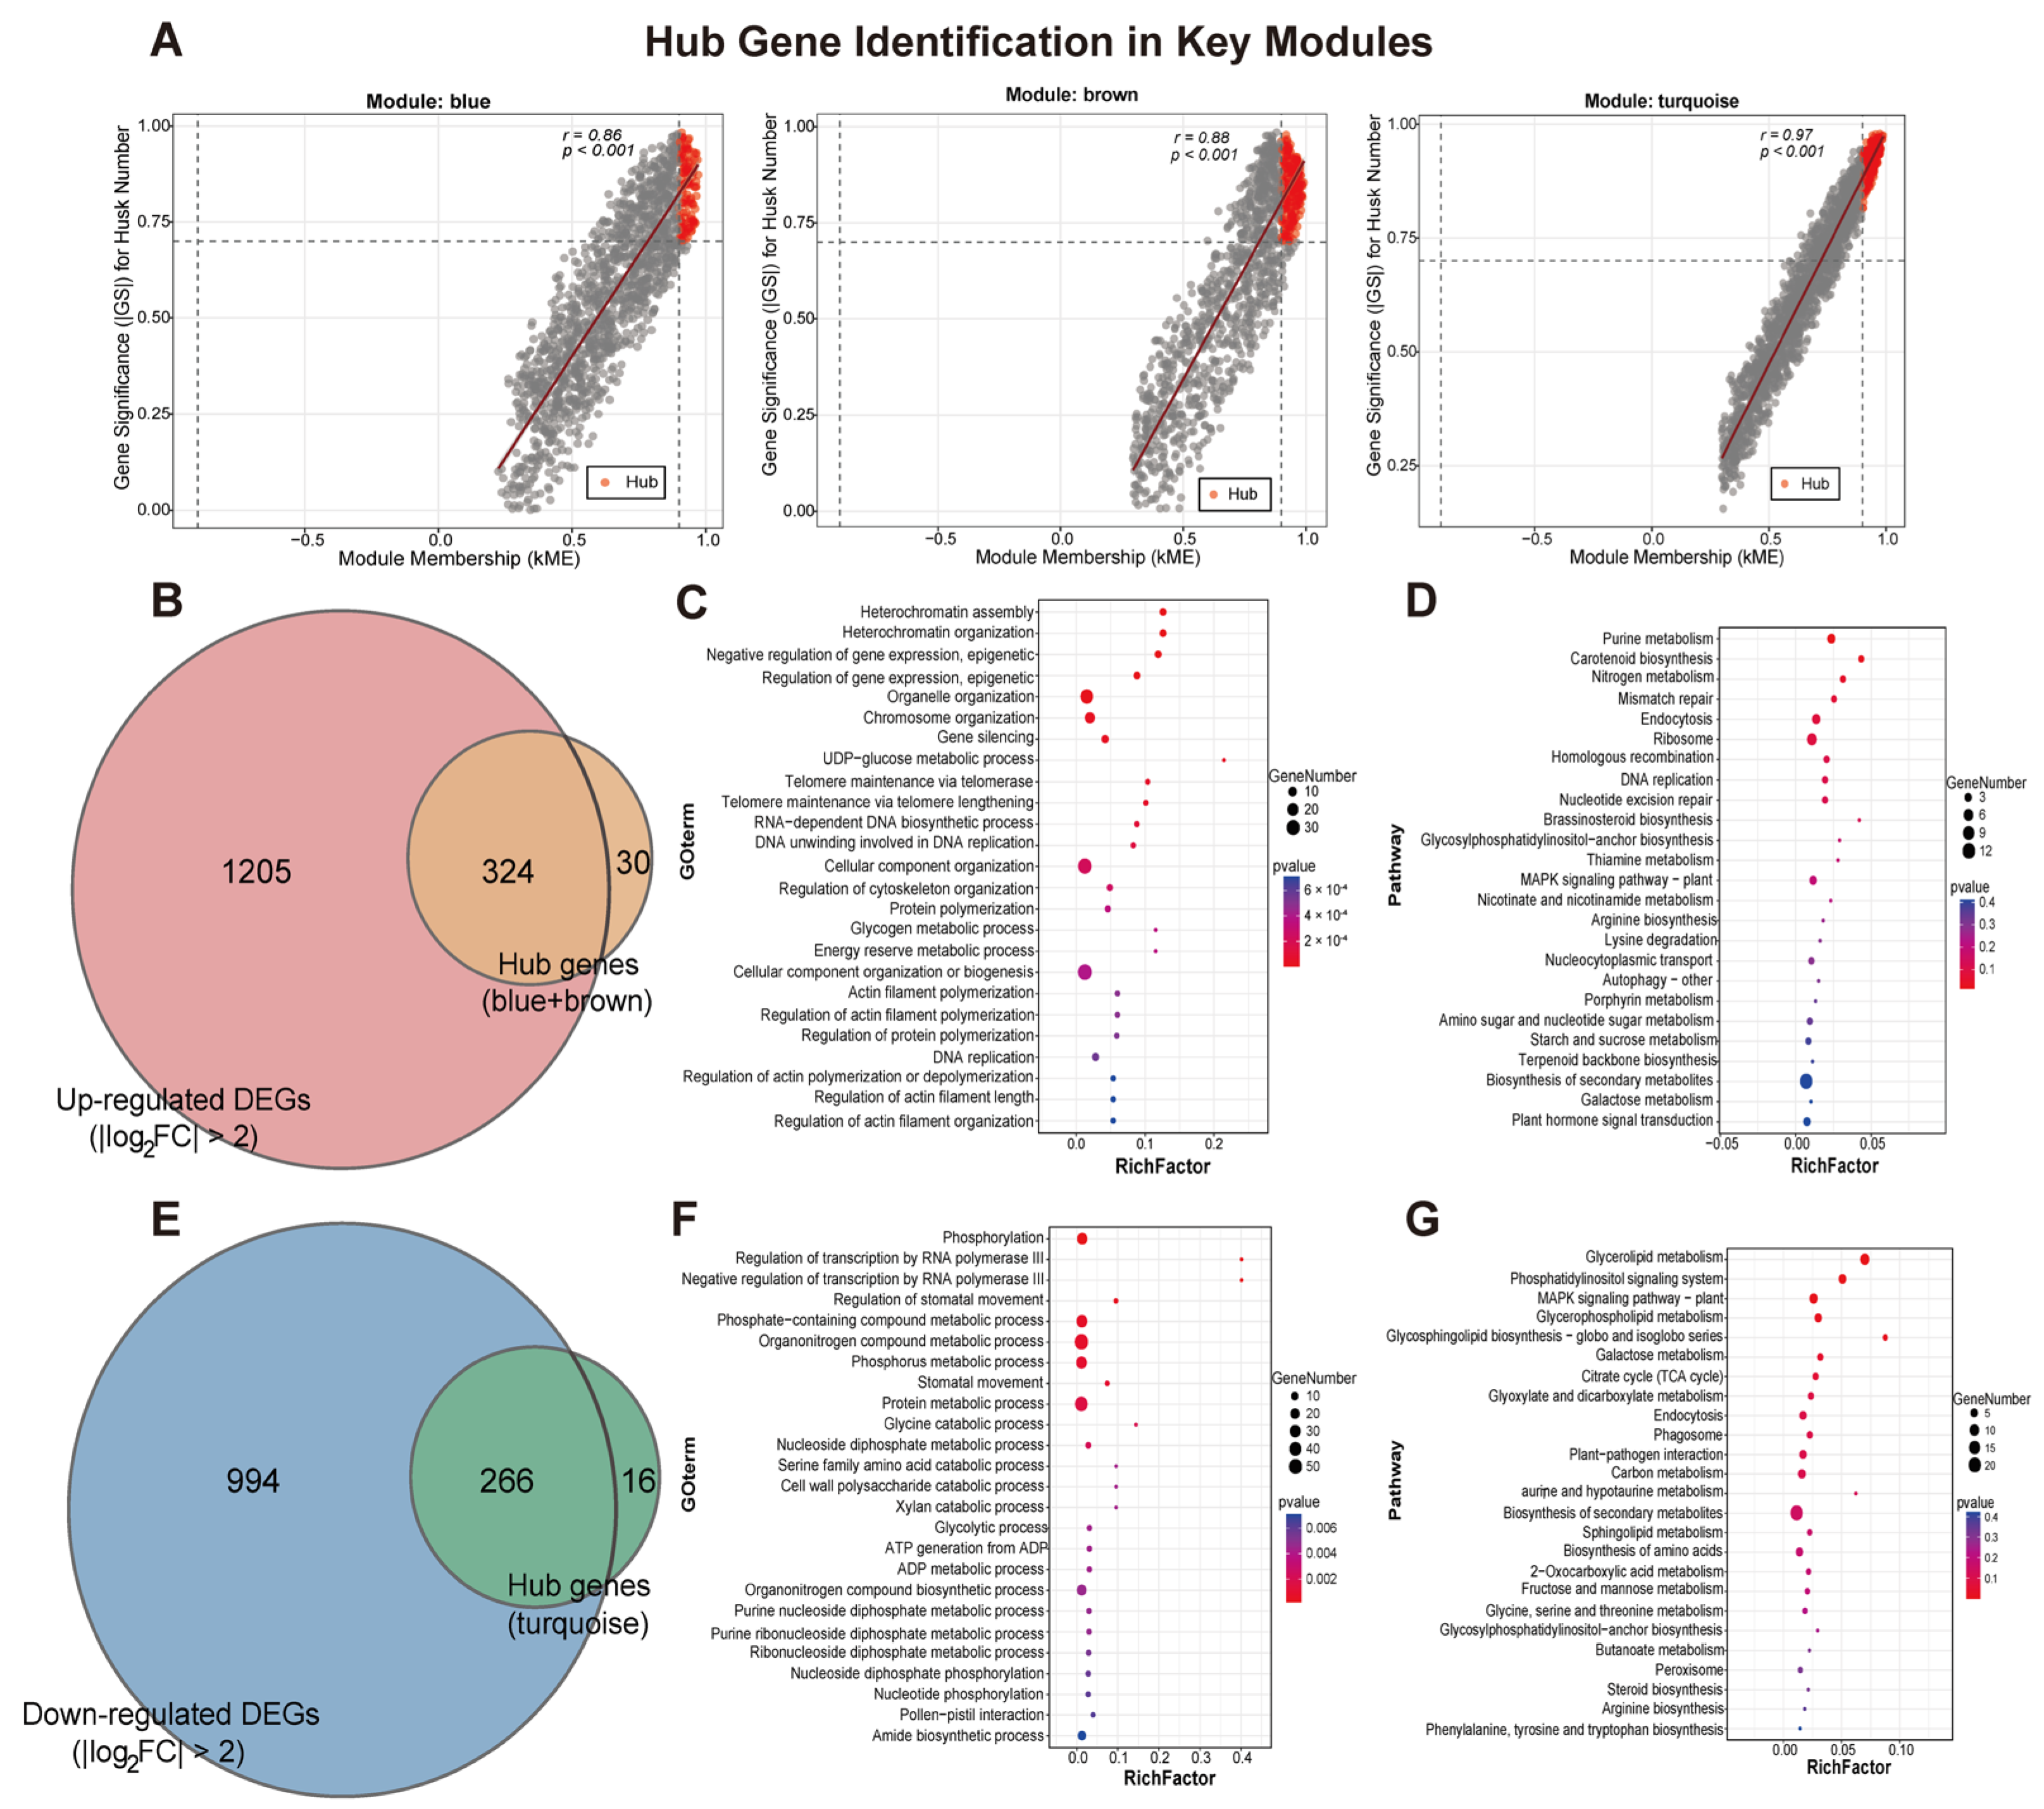
Genes satisfying both |kME| > 0.9 and |GS| > 0.7 were defined as strict hub genes. In the blue, brown, and turquoise modules, 123, 231, and 282 strict hub genes were identified, respectively (Figure 6A). These hub genes are the most highly connected core nodes within each module. They also have the strongest correlations with husk number. To further verify the central roles of these hub genes within their modules, we constructed co-expression subnetworks. Each subnetwork was built using the top 10 hub genes of a module and their first-order neighbors. The results further confirmed that these hub genes occupy core positions in their respective modules (Figure S5).
Figure 6.
Hub gene identification and functional enrichment of prioritized candidate genes. (A) kME–GS scatter plots for the blue, brown, and turquoise modules. Gray dots represent non-hub genes; red dots represent hub genes. Dashed lines mark the thresholds |kME| = 0.9 and |GS| = 0.7. The red solid line indicates the regression line showing the positive correlation between kME and GS. (B,E) Venn diagrams showing intersections between hub genes and DEGs (|log2FoldChange| > 2) for positively (B) and negatively (E) correlated modules. (C,D) GO (C) and KEGG (D) enrichment bubble plots of up-regulated candidates. (F,G) GO (F) and KEGG (G) enrichment bubble plots of down-regulated candidates. For all bubble plots, bubble size indicates gene count, and color indicates adjusted p-value (padj).
The hub genes from the positively correlated modules (blue and brown) were first merged into one set. This set was then intersected with the upregulated DEGs having |log2FoldChange| > 2. This gave 324 upregulated prioritized candidate genes (Figure 6B). Similarly, the hub genes from the turquoise module were intersected with the down-regulated DEGs having |log2FoldChange| > 2. This produced 266 down-regulated prioritized candidate genes (Figure 6E). The complete list of final candidate genes is provided in Table S4.
GO and KEGG enrichment analyses revealed clear functional differences between the two groups of candidate genes. The upregulated candidates were significantly enriched in several pathways. These pathways included DNA replication, mismatch repair, homologous recombination, brassinosteroid (BR) biosynthesis, MAPK signaling pathway plant, ribosome, and glycerophospholipid metabolism. These pathways are mainly related to cell cycle progression, hormone signaling, and membrane biosynthesis (Figure 6C,D). In contrast, the down-regulated candidates were enriched in pathways such as glycolysis, fructose and mannose metabolism, xylan degradation, MAPK signaling, and phosphatidylinositol signaling systems (Figure 6F,G). These results suggest that the higher husk number in LJ311 is associated with activation of cell proliferation and growth-promoting pathways, whereas PHG35 shows a shift in energy metabolism and enrichment of growth-inhibitory signals.
2.7. Expression Patterns and Preliminary Validation of Final Candidate Genes
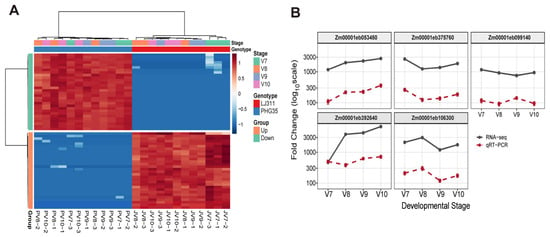
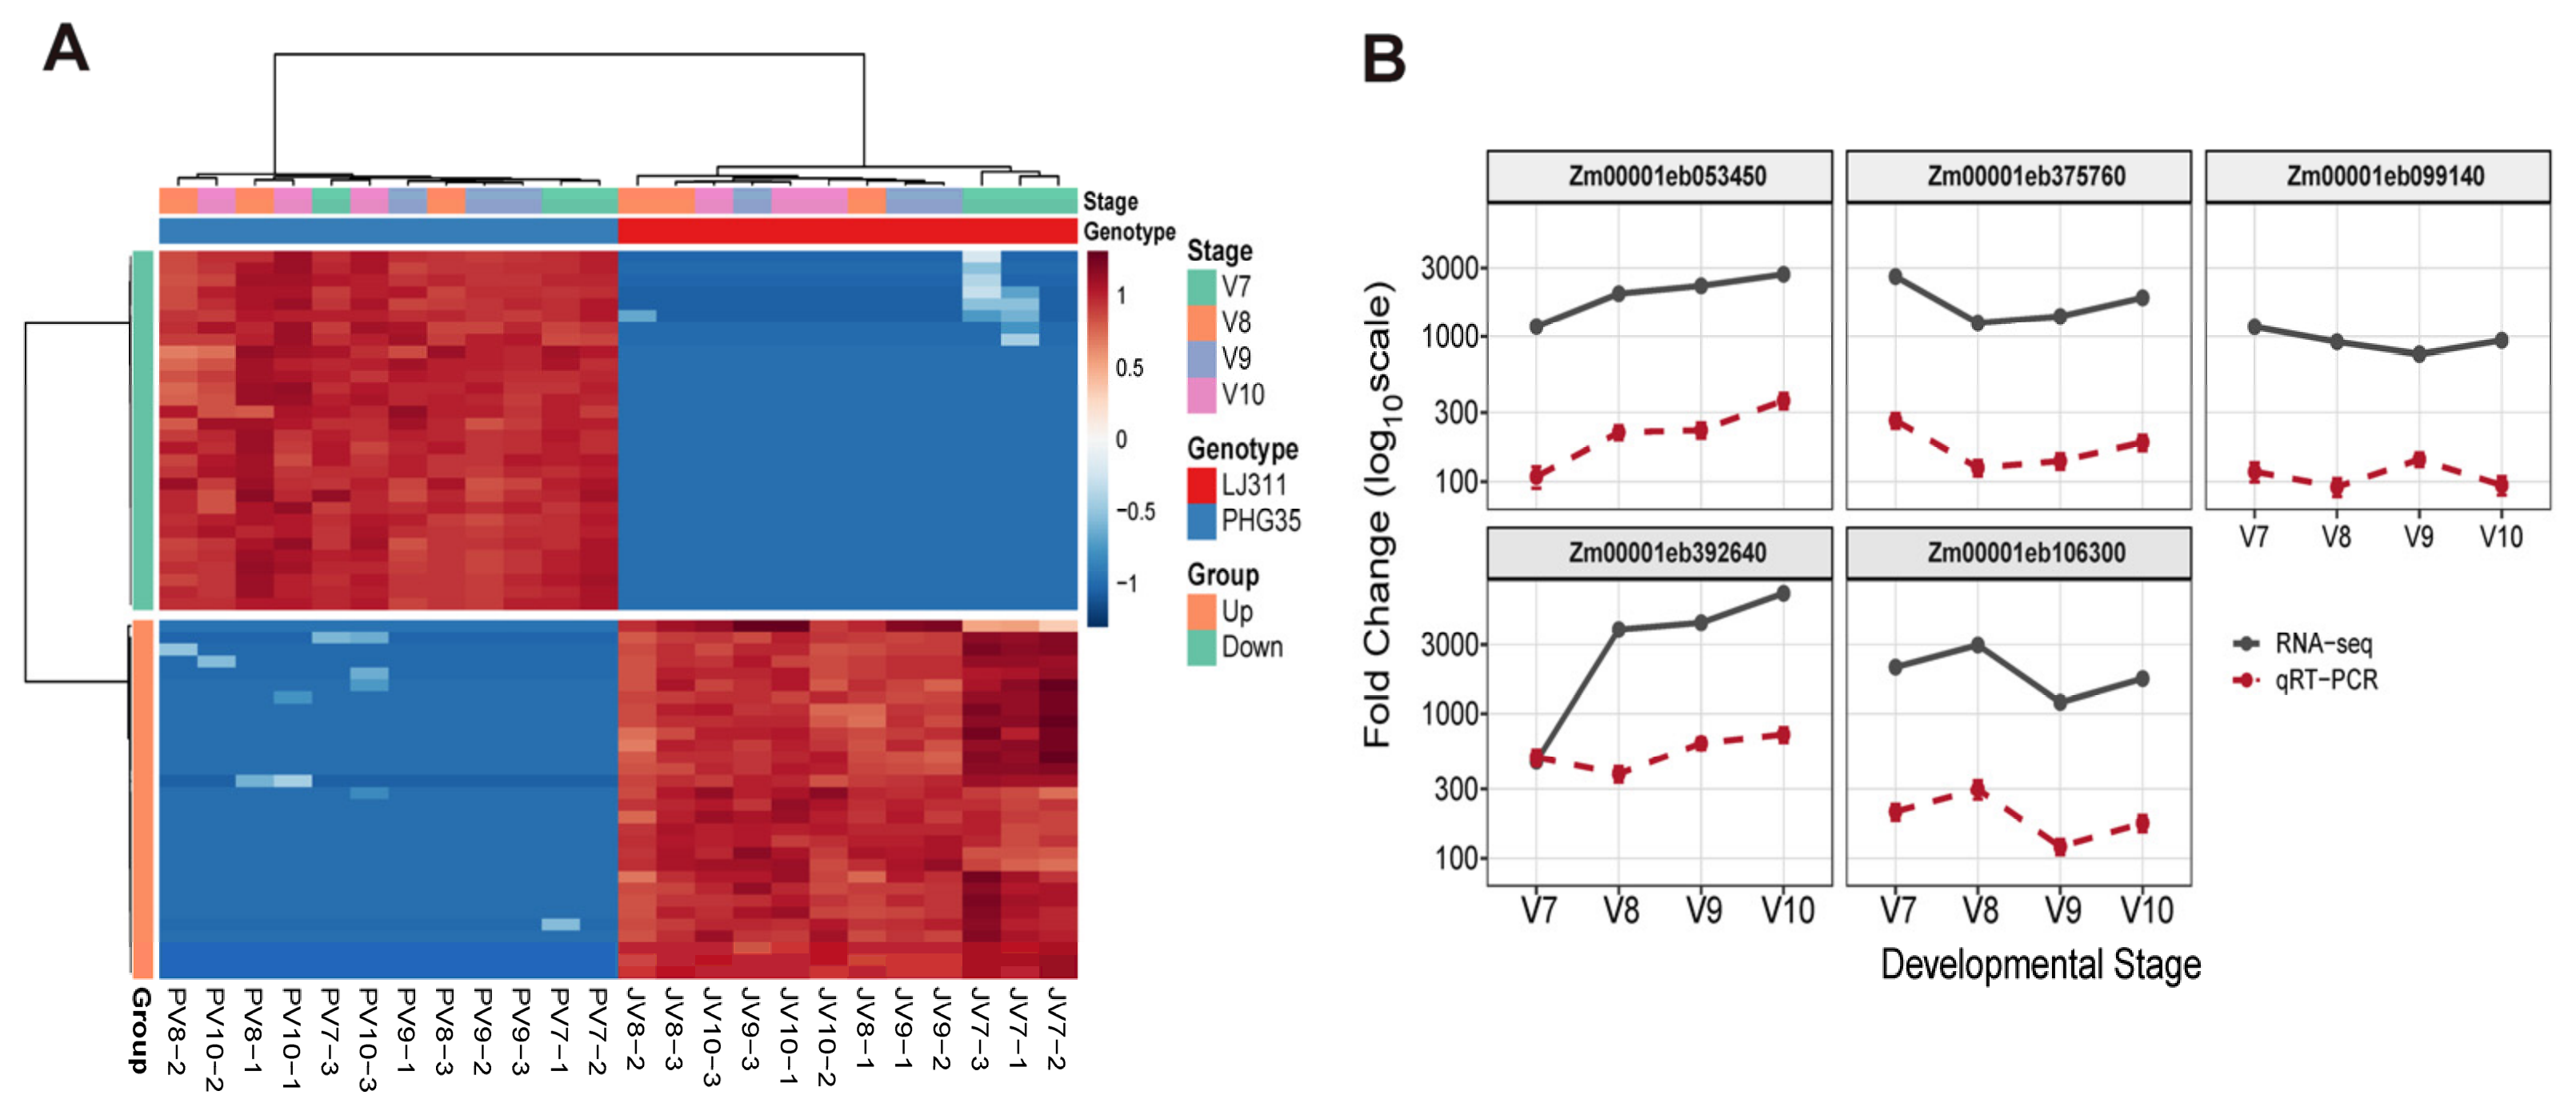
To visualize the overall expression landscape of the prioritized candidate genes, a heatmap was created. We selected the top 30 genes with the largest |log2FoldChange| values from each of the up- and down-regulated directions. The heatmap clearly divided the candidate genes into two major clusters. This separation perfectly matched their regulatory directions (Figure 7A). Within each cluster, the expression patterns were highly consistent with the sample groupings. The upregulated candidate genes showed relatively high expression across all developmental stages in LJ311. In contrast, the down-regulated candidates displayed the opposite trend and were mainly expressed at higher levels in PHG35. This sharp contrast further confirmed the reliability of the final candidate gene set and its strong association with the husk number phenotype.
Figure 7.
Expression patterns and experimental validation of final candidate genes. (A) Heatmap shows Z-scores of the top 30 up- and down-regulated candidate genes. Genes are clustered into two groups based on their regulatory directions. (B) Fold change comparison between RNA-seq and qRT-PCR for five representative hub genes across four developmental stages. Solid gray lines represent fold change values calculated from RNA-seq data, while dashed red lines represent fold change values measured by qRT-PCR. Error bars indicate the standard deviation (n = 3) of the qRT-PCR results.
Among the prioritized candidate genes, several particularly promising candidates involved in brassinosteroid biosynthesis, DNA replication, and MAPK signaling are summarized in Table S8. These genes were selected based on their high co-expression connectivity (hub gene status), large expression differences between LJ311 and PHG35, and enrichment in pathways potentially relevant to husk development. They represent primary targets for future functional characterization. To further verify the reliability of the RNA-seq results, we analyzed the fold changes in five representative prioritized candidate genes using both RNA-seq and qRT PCR. The results showed that the expression trends obtained by qRT PCR were highly consistent with those from RNA-seq. The fold change values from the two methods matched well across all four developmental stages (Figure 7B). This independent validation increased the confidence in the candidate genes identified in this study. It also supports the reproducibility of the expression patterns of these candidate genes, but does not demonstrate their biological function in husk development.
3. Discussion
3.1. The Advantage of Multi-Method Integration in Mining Genes for Complex Traits
Husk number in maize is a complex quantitative trait controlled by many genes and multiple pathways. A single method often fails to capture the complete regulatory network. In this study, we integrated three approaches—differential expression analysis, unsupervised hierarchical clustering, and WGCNA—to improve the efficiency of candidate gene discovery.
The order of integration has a significant impact on the results. Studies have shown that first building the co-expression network and then adding the differential expression information preserves the global topological structure of the network better. This helps reduce false positives and captures more biologically relevant modules and hub genes [29,30]. The results of this study also support this idea. Cluster 3, found by hierarchical clustering, shared only seven genes with the blue module. However, their functional enrichment was highly consistent. This indicates that the unsupervised method successfully detected a functionally consistent subset within a large co-expression module. Such multi-strategy integration has been verified in several plant systems. For example, it was used to screen key genes for salt stress response in rice [29], to identify modules for cold tolerance in maize seedlings [27], and to recognize functional modules under abiotic stress in poplar leaves [31]. These examples demonstrate the robustness of this approach across different research backgrounds.
3.2. Functional Significance of the Late-Stage-Specific Gene Cluster 3
Cluster 3 contained 44 genes and was specifically upregulated at the V8–V10 stages in LJ311. This is one of the core findings of this study. This period coincides exactly with the key stage of rapid differentiation and elongation of husk primordia. Functional enrichment analysis showed that Cluster 3 was significantly enriched in the TCA cycle, oxidative phosphorylation, DNA replication, glycerophospholipid metabolism, and carotenoid/ABA metabolism. In maize, TCA cycle genes show tissue-specific expression patterns. Their enzyme activities are essential for supplying energy and carbon skeletons during late development [32,33]. The TCA cycle is coupled with oxidative phosphorylation. Together, they provide ATP and reducing power for biosynthesis. Additionally, the TCA cycle is more than just an energy provider. Its disruption can trigger extensive metabolic reprogramming and activate stress responses. This has been shown in mammalian systems [34]. In plants, the TCA cycle also plays non-canonical roles in developmental transitions [35]. The enrichment of DNA replication genes suggests that active cell proliferation or endoreduplication still occurs in late-stage husk tissues. This is very important for organ morphogenesis [36]. Glycerophospholipid metabolism provides basic components for membrane structures. Its intermediate products, such as phosphatidic acid, can also act as signaling molecules. They take part in membrane biogenesis and signal transduction [37,38,39]. Together, these pathways form a coordinated molecular network. They support the late development of the husk in several ways, from energy supply and cell proliferation to membrane biosynthesis. However, because pathway enrichment in this cluster is based on only 44 genes, these results should be regarded as exploratory and will require independent functional validation.
3.3. Functional Divergence of Modules Positively and Negatively Associated with Husk Number
The three WGCNA modules that were significantly associated with husk number showed distinct functional enrichment patterns. The blue module was enriched in cell cycle, DNA replication, and protein homeostasis. The brown module was enriched in actin filament organization, Golgi organization, and brassinosteroid (BR) biosynthesis. Although both modules were positively correlated with husk number, their functional divergence suggests that they are involved in different biological processes. Positive regulation may require the coordination of the cell proliferation machinery and the cytoskeleton–hormone signaling system.
BR is an important hormone that regulates plant growth and development. There is crosstalk between BR and the MAPK pathway. For example, in stomatal development, BR signaling inhibits the MAPK pathway through GSK3 kinase [40]. In maize, the transcription factor ZmRAVL1 can directly activate the expression of BR biosynthesis genes. These genes include lac1, ZmD11, and brd1. At the same time, phytochrome phyA senses the ratio of red to far-red light. This light signal then regulates the protein stability of ZmRAVL1. In this way, environmental light signals are coupled with internal BR levels. This allows a dynamic regulation of canopy architecture [41,42]. In contrast, the turquoise module was mainly expressed in the low husk line PHG35. This module was enriched in endoplasmic reticulum (ER) stress and protein phosphorylation. The ER can activate BR signaling through the unfolded protein response (UPR). In this way, stress signals and developmental signals are integrated [43]. The enrichment of ER stress in the negative module suggests something important. Rapid husk growth may create a high demand for protein synthesis. This pressure could activate the ER quality control system. As a result, organ development may be limited to some degree. This antagonistic module architecture suggests a potential bidirectional regulatory network that may contribute to husk number variation. This network involves BR/MAPK crosstalk, the integration of ER stress, and epigenetic regulation.
3.4. Prioritized Candidate Genes Define the Molecular Boundary Between Promotion and Inhibition of Husk Number
By integrating module hub genes with high-magnitude differentially expressed genes, we obtained a compact set of prioritized candidate genes. The upregulated candidates were mainly enriched in DNA replication, BR biosynthesis, and glycerophospholipid metabolism. This is consistent with the overall functional features of the positively correlated modules described earlier. Among the upregulated candidates, several genes encode enzymes and transcription factors. These genes may act downstream of the maize BR signaling cascade. BR has been shown to regulate plant development by promoting cell cycle progression [44,45]. On the other hand, the down-regulated candidates were enriched in glycolysis, xylan degradation, and MAPK signaling. The enrichment of both an energy metabolism pathway and a cell wall remodeling process at the same time suggests something important. It suggests that a state of metabolic inhibition may exist in the low husk line. In this state, basic energy production is reduced. Cell wall loosening is also restricted. As a result, the initiation of husk primordia is suppressed. In maize, glycoside hydrolases such as MLGH1 take part in the degradation and remodeling of cell wall polysaccharides [46,47]. The specific enrichment of MAPK signaling among the down-regulated candidates further supports the bi-directional regulatory model. This is consistent with the dual functions of plant MAPK cascades. They can both promote and restrict growth [48]. This antagonistic molecular dialog was also reflected at the transcriptional level. It is likely that transcription factors may play important roles in the bi-directional regulation of husk number. Taken together, the prioritized candidate genes may define a molecular boundary between potential promotion and inhibition of husk number. These genes may act as downstream effectors integrating BR and MAPK signals with DNA replication, energy metabolism, and cell wall dynamics; however, functional validation is required to establish causal roles.
3.5. Comparison with Known Regulatory Mechanisms of Husk Development and the Incremental Contribution of This Study
In recent years, association-based studies have revealed the genetic basis of variation in husk traits. For example, the ZMET2 gene encodes a DNA methyltransferase. A 10 bp insertion/deletion polymorphism in its 3′UTR region can change the transcription level. This, in turn, regulates the number of husk leaves [49]. The RHW1-ZCN4 pathway regulates husk width through a MYB-like transcriptional repressor [50]. The ZmNRT2.5 gene encodes a nitrate transporter. Its variation is related to both husk width and the efficiency of nitrate transport to developing grains [51]. Some progress has been made in understanding the genetic regulation of husk development in maize. The gene tasselsheath4 (tsh4) encodes an SBP box transcription factor. It is a core regulator that inhibits husk growth and promotes inflorescence branching [52]. This gene forms a hierarchical regulatory network together with tsh1 and lg2. In this network, tsh4 directly binds to and activates the expression of downstream genes. Together, they control the inhibition of husk growth and the formation of branches [53]. These studies have begun to reveal the transcriptional, epigenetic, and metabolic regulatory networks involved in husk development.
Notably, the classical meristem identity genes, such as tsh4, were not directly detected in our final candidate gene set. This suggests that there may be another mechanism for husk number variation. This mechanism may be independent of the early meristem identity decisions. The candidate genes we identified focused more on late developmental events. These events include cell proliferation, energy metabolism, and the integration of hormone signals. These genes may act downstream of the early-acting genes like tsh4. For example, the BR signaling components enriched in the upregulated candidates may receive signals from the early meristem identity program. Then, they promote cell cycle progression. This drives the continuous proliferation of husk primordia. On the other hand, the MAPK signaling and cell wall degradation genes enriched in the down-regulated candidates may act as negative regulatory effectors. They may restrict the overgrowth of husk leaves. This model of “early decision—late execution” integrates the known regulatory factors of husk development with our findings and provides a more complete view for understanding the molecular mechanisms of husk number variation. However, the regulatory relationships proposed here are based on transcriptomic correlations rather than direct genetic evidence. Therefore, future studies should focus on functional validation of the top candidate hub genes through genetic approaches, such as CRISPR-based knockout or transgenic overexpression, to confirm their roles in husk development. Such validation will be essential to fully substantiate this model and to harness these genes for molecular breeding.
3.6. Limitations and Future Directions
Several limitations should be considered. First, only two inbred maize lines were used, so genotype and husk number are fully confounded; the observed module–trait correlations may reflect general genetic background differences rather than husk-number-specific regulation. Independent validation in segregating populations, near-isogenic lines, or GWAS panels is essential. Second, the sampled tissue comprised whole immature ears, so the gene set designated as being “putative husk-associated” may contain genes expressed in other ear compartments. Third, the sample size (24 samples) is modest for WGCNA, and the network should be viewed as exploratory. Fourth, the qRT-PCR experiments validated expression patterns only and did not provide functional evidence. Fifth, because detailed ear morphological measurements were not recorded, some expression differences might reflect slight developmental asynchrony rather than genotype-specific effects on husk number. In addition, the reported module–trait correlations are based on 24 transcriptome samples from only two genotypes and should not be interpreted as 24 independent phenotypic observations; biological replication applies to transcriptome measurements, not to independent replication of the genotype-level husk-number trait. Future work should include functional characterization of the top candidate genes (e.g., CRISPR knockout or overexpression) and validation in additional genetic materials.
4. Materials and Methods
4.1. Plant Materials and Phenotypic Evaluation
Two inbred maize lines, LJ311 and PHG35, were used in this study. LJ311 has about 20 husk leaves, while PHG35 has about 5 husk leaves. Plants were grown in the field in Tai’an, Shandong Province, China, during the summer of 2020. Ear tissues, including husks, were collected at four developmental stages: V7, V8, V9, and V10. For each genotype at each stage, three biological replicates were obtained. Briefly, for each replicate, an individual plant was randomly selected within the same field plot, and the entire immature ear (including husk leaves) was rapidly excised with a clean razor blade. The tissue was immediately placed into a labeled cryogenic vial and submerged in liquid nitrogen. The amount of tissue collected from each ear was sufficient for subsequent total RNA extraction and library construction. All samples were then stored at −80 °C until further processing. PHG35 and LJ311 reached each developmental stage at equivalent times under the same growing conditions, indicating similar developmental progression between the two genotypes. At each sampling time, we selected plants with uniform growth vigor and visually inspected ear developmental status to ensure comparable ear size and morphological stage between the two genotypes. We acknowledge that we cannot completely exclude subtle differences in developmental timing between the two genotypes.
4.2. RNA Extraction, Library Construction, and Sequencing
Total RNA extraction, quality control, and strand-specific cDNA library construction were performed by Novogene Bioinformatics Technology (Beijing, China). The libraries were sequenced on an Illumina HiSeq 4000 platform (Illumina, San Diego, CA, USA) using a paired-end 150 bp sequencing strategy. Raw reads were initially filtered and quality-controlled using fastp to generate clean reads. All samples were processed in a single batch for library construction and sequencing. The raw sequencing data have been deposited in the NCBI Sequence Read Archive (SRA) under BioProject accession number PRJNA1491550.
4.3. Data Preprocessing and Identification of Putative Husk-Associated Genes
Raw sequencing reads were first processed with fastp (v0.23.4) to remove low-quality reads and adapter sequences [54]. The cleaned reads were then aligned to the maize B73 reference genome (RefGen_v5) using HISAT2 (v2.2.1) [55]. Gene expression levels, including FPKM and count values, were quantified with StringTie (v2.1.7) [56].
Because the sampled tissues contained the entire ear, the initial expression matrix included transcripts from both husk and non-husk tissues. To enrich for transcripts likely contributed by husk tissues, we compared all detected genes with a published spatiotemporal expression dataset of the maize ear [57]. Genes predominantly expressed in inner ear structures (cob, spikelets, and kernels) were removed. The remaining genes were considered a candidate set of putative husk-associated genes (Table S1) because the sampled material contained the entire ear and therefore strict tissue specificity cannot be claimed. Further data cleaning was performed using the following criteria. First, the difference between the maximum and minimum FPKM values of a gene across all 24 samples had to be greater than 5 (min_max > 5). Second, within each biological group (genotype × stage combination, eight groups in total), the maximum coefficient of variation (CV = standard deviation/mean × 100%) was required to be less than 200% (max_cv < 200%). Third, each gene had to be reliably expressed in at least one biological group (reliable_groups > 0). After these filtering steps, a total of 12,605 putative husk-associated genes were retained. This final gene set was used for all subsequent analyses, including differential expression analysis and co-expression network construction.
4.4. Global Transcriptome Characterization and Differential Expression Analysis
To evaluate the overall relationships among the samples, we first defined a gene set that met a basic expression threshold. Genes with counts ≥10 in at least three samples were retained. These genes were used for principal component analysis (PCA) and Pearson correlation analysis. A PCA score plot and a clustered correlation heatmap were generated to visualize the sample groupings. In addition, library sizes and the numbers of detected genes were calculated for each sample. Bar plots for quality control and expression density curves were also drawn. The PCA, correlation analysis, and quality control plots described above were all based on the full gene set after basic filtering.
In contrast, the differential expression analysis and all subsequent functional analyses were performed using the filtered set of 12,605 putative husk-associated genes. The raw counts of these 12,605 genes were used as input for DESeq2 (v1.46.0). The design formula was set to ~ Stage + Genotype. Significantly differentially expressed genes (DEGs) were identified using the following criteria: |log2FoldChange| > 1 and padj < 0.05. The DEGs were then divided into upregulated and down-regulated groups based on the direction of their expression change. To verify the need for a stage-adjusted model, we also performed pairwise comparisons between LJ311 and PHG35 at each of the four developmental stages. To identify genes whose developmental expression trajectories differed between genotypes, we also fitted a DESeq2 model including the interaction term (design = ~ Genotype + Stage + Genotype:Stage) and performed a likelihood ratio test (LRT) against the reduced model (~ Genotype + Stage). Genes with an adjusted p-value < 0.05 for the interaction term were considered to show significant genotype-by-stage interaction effects. The unique and shared DEGs across stages were visualized using an UpSet plot. Furthermore, a volcano plot, a pie chart showing DEG counts, and a heatmap of the top 100 DEGs were generated.
4.5. Unsupervised Hierarchical Clustering
To explore the natural grouping of highly variable genes, we selected the top 200 genes with the largest variance across all 24 samples from the 12,605 putative husk-associated genes. Each gene was then Z-score-normalized. The distance between genes was calculated as 1 minus the Pearson correlation coefficient. Hierarchical clustering was performed using the complete linkage method. Finally, the gene tree was cut into three clusters (Cluster 1–3). A clustered heatmap was generated using the pheatmap package (v1.0.12). The number of genes in each cluster was counted and displayed in a pie chart. To validate the late-stage upregulation pattern of Cluster 3, we selected the three genes with the largest |log2FoldChange| values from this cluster. Their expression levels across different genotypes and developmental stages were shown in a line plot. Error bars were used to represent the variation among the three biological replicates. To assess the robustness of cluster assignment, hierarchical clustering was also performed using the top 100, 300, and 500 most-variable genes and with cluster numbers k = 2–5. In all tested parameter combinations, the 44 Cluster 3 genes remained predominantly co-clustered (proportion in the main cluster ≥ 97.7%; Table S6), indicating that Cluster 3 is robust to clustering parameters.
4.6. Weighted Gene Co-Expression Network Analysis (WGCNA) and Comparison Between Independent Clustering Approaches
Because husk number was measured as a line-level trait, each sample was assigned the mean husk number of its corresponding genotype (LJ311 = 20, PHG35 = 5). Thus, in this dataset, husk number is a binary group-level trait statistically equivalent to genotype. To balance noise reduction and retention of biological signals, we selected the 8000 most variable genes across all 24 samples from the 12,605 putative husk-associated genes for WGCNA, corresponding to approximately 63% of the expressed gene set. The analysis was performed using the WGCNA package (v1.72.1). Network topology was evaluated with the pickSoftThreshold function. Based on the scale-free topology fit index (R2 > 0.85) and the mean connectivity, we chose a soft thresholding power of 10. A signed network was then constructed using the blockwiseModules function with the following parameters: minModuleSize = 30 and mergeCutHeight = 0.25. Module eigengenes were calculated for each module. Pearson correlation analysis was then performed between the module eigengenes and two traits: husk number and genotype.
Based on the correlation results, we identified three modules that were most significantly associated with husk number. The blue and brown modules were positively correlated, whereas the turquoise module was negatively correlated with this trait. A module–trait correlation heatmap and line plots showing the expression trends of these module eigengenes across developmental stages were generated. GO and KEGG enrichment analyses were performed using the OmicShare online tool (https://www.omicshare.com/tools, accessed on 26 September 2026) with default parameters. The background gene set used for enrichment analysis was the full set of annotated genes in the maize B73 RefGen_v5 reference genome, unless otherwise stated. All analyses were run with the default parameters. In addition, the module membership (kME) and gene significance (GS) were calculated for each gene. Strict hub genes were defined as those satisfying both |kME| > 0.9 and |GS| > 0.7. Scatter plots of kME versus GS were then generated for each module, with the hub genes highlighted.
To compare the results of unsupervised clustering and WGCNA, we took the 44 genes from Cluster 3 and intersected them with the gene lists of the blue and brown modules, separately. The overlaps were visualized using an UpSet plot. In addition, all 44 genes of Cluster 3 were independently subjected to GO and KEGG enrichment analysis.
4.7. Screening, Expression Visualization, and Validation of Prioritized Candidate Genes
Strict hub genes were defined as those with |kME| > 0.9 and |GS| > 0.7. This yielded 123, 231, and 282 hub genes in the blue, brown, and turquoise modules, respectively. The hub genes from the positively correlated modules (blue and brown) were combined into a unique set of 354 genes and then intersected with upregulated DEGs (|log2FoldChange| > 2), resulting in 324 prioritized upregulated candidate genes. Similarly, the 282 turquoise hub genes were intersected with down-regulated DEGs (|log2FoldChange| > 2), yielding 266 prioritized down-regulated candidate genes. Both |kME| and |GS| filters were applied before the DEG intersection. We use the term “prioritized” because these genes were selected based on expression differences and co-expression connectivity, not on functional validation. A stricter fold change cutoff was used here to focus on the genes with the largest expression differences. The entire screening process was illustrated using a Venn diagram. GO and KEGG enrichment analyses were performed separately for the upregulated and down-regulated candidate gene sets, and the results were visualized using bubble plots to show the functional differences between the two groups.
From the final candidate gene sets, we selected the top 30 genes with the largest |log2FoldChange| values from each direction. A heatmap was generated to display their expression patterns. In addition, three of the most significant hub genes were chosen from each of the upregulated and down-regulated sets. Their expression levels across stages and genotypes were shown in line plots. Error bars in these plots represent the variation among the biological replicates. Using the igraph (v1.4.3) and ggraph (v2.1.0) packages, we extracted the top 10 hub genes with the highest |kME| values from the blue, brown, and turquoise modules. Their first-order neighbors (Pearson correlation coefficient > 0.5) were also included. Co-expression subnetworks were then constructed for each of the three modules.
To validate the reliability of the RNA-seq data, five key genes were selected from the final candidate gene list. Primers for these genes were designed using the qPrimerdb database (https://qprimerdb.biodb.org/, accessed on 26 September 2026) and are listed in Table S5. The maize Cullin gene was used as the internal reference. Quantitative real-time PCR was performed using the SYBR Green Master Mix (Vazyme, Nanjing, China) according to the manufacturer’s instructions. Relative expression levels were calculated using the 2−ΔΔCt method.
5. Conclusions
This study systematically explored the molecular basis of husk number variation in maize by integrating differential expression analysis, unsupervised hierarchical clustering, and WGCNA. Three co-expression modules (blue, brown, and turquoise) were identified that significantly correlated with husk number and represented growth-promoting and growth-inhibiting networks, respectively. Hierarchical clustering revealed a small, distinct gene cluster (Cluster 3) that was strongly activated at late developmental stages (V8–V10) in the high-husk line LJ311 and enriched in the TCA cycle, oxidative phosphorylation, DNA replication, and membrane lipid metabolism. By intersecting module hub genes with high-magnitude differentially expressed genes, we obtained a set of prioritized candidate genes. The upregulated candidates were enriched in cell cycle, brassinosteroid (BR) signaling, and phospholipid metabolism, whereas the down-regulated candidates were enriched in MAPK signaling, glycolysis, and cell wall polysaccharide degradation. Taken together, these results suggest that husk number may be associated with a potential bidirectional regulatory program that converges on a BR–MAPK–cell cycle axis. The candidate genes identified in this work provide valuable targets for future functional validation and molecular breeding. Further studies should focus on the functional characterization of these hub genes and their upstream regulators.
Supplementary Materials
The following supporting information can be downloaded at: https://www.mdpi.com/article/10.3390/genes17111358/s1; Figure S1. RNA-seq quality control metrics of all genes passing the basic expression threshold; Figure S2: Overview of all WGCNA modules; Figure S3: UpSet plots of overlaps between Cluster 1/Cluster 2 and WGCNA modules; Figure S4: Stage-specific differentially expressed genes (DEGs) identified by pairwise comparisons between LJ311 and PHG35 at each developmental stage; Figure S5: Co-expression subnetworks of the top 10 hub genes in the three key modules; Table S1: Filtered gene expression matrix of maize husk samples; Table S2: Summary of RNA-seq read statistics for all 24 samples; Table S3: Complete list of differentially expressed genes (DEGs) between LJ311 and PHG35; Table S4: Final candidate genes; Table S5: Sequence of primers used in qRT-PCR; Table S6: Robustness of Cluster 3 under alternative hierarchical clustering parameters; Table S7: Genes showing significant genotype-by-stage interaction effects in the DESeq2 likelihood ratio test (padj < 0.05); Table S8: Prioritized candidate genes for husk number in maize.
Author Contributions
X.X. and C.C. conceived and designed the experiments. X.X. performed the experiments, analyzed the data, and drafted the manuscript. D.L. and Y.W. performed phenotyping. H.S. and L.S. cultivated the plant materials. X.X. and Y.H. collected plant samples. All authors have read and agreed to the published version of the manuscript.
Funding
This research was funded by the National Natural Science Foundation of China, grant number 32370672, and the National Key R&D Program of China, grant number 2023YFD1200501.
Institutional Review Board Statement
Not applicable.
Informed Consent Statement
Not applicable.
Data Availability Statement
The datasets supporting the conclusions of this article are included within the article and its additional files. The raw RNA-seq data are available in the NCBI BioProject repository, accession number PRJNA1491550 (https://www.ncbi.nlm.nih.gov/bioproject/PRJNA1491550, accessed on 26 September 2026).
Conflicts of Interest
The authors declare no conflicts of interest.
References
- Li, S.; Wang, K.; Xie, R.; Ming, B. Mechanical grain harvesting promotes the transformation of maize production mode. Sci. Agric. Sin. 2018, 51, 1842–1844. (In Chinese) [Google Scholar] [CrossRef]
- Xie, R.; Ming, B.; Shang, G.; Wang, K.; Hou, P.; Li, S. Current state and suggestions for mechanical harvesting of corn in China. J. Integr. Agric. 2022, 21, 892–897. [Google Scholar] [CrossRef] [Scilit]
- Liu, F.; Wang, K.; Li, J.; Wang, X.; Sun, Y.; Chen, Y.; Wang, Y.; Han, D.; Li, S. Analysis of factors affecting the quality of mechanical grain harvesting in maize. Crops 2013, 29, 116–119. (In Chinese) [Google Scholar]
- Liu, J.; Yu, H.; Liu, Y.; Deng, S.; Liu, Q.; Liu, B.; Xu, M. Genetic dissection of grain water content and dehydration rate related to mechanical harvest in maize. BMC Plant Biol. 2020, 20, 118. [Google Scholar] [CrossRef] [Scilit] [PubMed]
- Dai, L.; Wu, L.; Dong, Q.; Zhang, Z.; Wu, N.; Song, Y.; Lu, S.; Wang, P. Genome-wide association study of field grain drying rate after physiological maturity based on a resequencing approach in elite maize germplasm. Euphytica 2017, 213, 182. [Google Scholar] [CrossRef] [Scilit]
- Magarini, A.; Colombo, F.; Cassani, E.; Ghidoli, M.; Landoni, M.; Sangiorgio, S.; Pilu, R. The role of husk traits in maize susceptibility to Fusarium verticillioides: A multi-location study in northern Italy. Food Energy Secur. 2024, 13, e537. [Google Scholar] [CrossRef] [Scilit]
- Sala, R.G.; Andrade, F.H.; Camadro, E.L.; Cerono, J.C. Quantitative trait loci for grain moisture at harvest and field grain drying rate in maize (Zea mays, L.). Theor. Appl. Genet. 2006, 112, 462–471. [Google Scholar] [CrossRef] [Scilit] [PubMed]
- Yu, Y.; Li, W.; Liu, Y.; Liu, Y.; Zhang, Q.; Ouyang, Y.; Ding, W.; Xue, Y.; Zou, Y.; Yan, J.; et al. A Zea genus-specific micropeptide controls kernel dehydration in maize. Cell 2025, 188, 44–59.e21. [Google Scholar] [CrossRef] [Scilit] [PubMed]
- Chuck, G.; Whipple, C.; Jackson, D.; Hake, S. The maize SBP-box transcription factor encoded by tasselsheath4 regulates bract development and the establishment of meristem boundaries. Development 2010, 137, 1243–1250. [Google Scholar] [CrossRef] [Scilit] [PubMed]
- Lejeune, P.; Bernier, G. Effect of environment on the early steps of ear initiation in maize (Zea mays L.). Plant Cell Environ. 1996, 19, 217–224. [Google Scholar] [CrossRef] [Scilit]
- Ji, H.C.; Brewbaker, J.L. Inheritance of long husk leaves in maize. Maydica 2007, 52, 101–108. [Google Scholar]
- Shi, W.-j.; Shao, H.; Sha, Y.; Shi, R.; Shi, D.-f.; Chen, Y.-c.; Ban, X.-b.; Mi, G.-h. Grain dehydration rate is related to post-silking thermal time and ear characters in different maize hybrids. J. Integr. Agric. 2022, 21, 964–976. [Google Scholar] [CrossRef] [Scilit]
- Troyer, A.F.; Ambrose, W.B. Plant Characteristics Affecting Field Drying Rate of Ear Corn. Crop Sci. 1971, 11, 529–531. [Google Scholar] [CrossRef] [Scilit]
- Li, L.; Ming, B.; Xie, R.; Wang, K.; Hou, P.; Li, S. Differences in ear traits of maize varieties and their effects on grain dehydration. Sci. Agric. Sin. 2018, 51, 1855–1867. (In Chinese) [Google Scholar] [CrossRef]
- Wang, K.; Li, S. Analysis of factors affecting grain dehydration rate in maize. Sci. Agric. Sin. 2017, 50, 2027–2035. (In Chinese) [Google Scholar] [CrossRef]
- Cui, Z.; Xia, A.; Zhang, A.; Luo, J.; Yang, X.; Zhang, L.; Ruan, Y.; He, Y. Linkage mapping combined with association analysis reveals QTL and candidate genes for three husk traits in maize. Theor. Appl. Genet. 2018, 131, 2131–2144. [Google Scholar] [CrossRef] [Scilit] [PubMed]
- Liang, Z.; Xi, N.; Liu, T.; Li, M.; Sang, M.; Zou, C.; Chen, Z.; Yuan, G.; Pan, G.; Ma, L.; et al. A combination of QTL mapping and genome-wide association study revealed the key gene for husk number in maize. Theor. Appl. Genet. 2024, 137, 112. [Google Scholar] [CrossRef] [Scilit] [PubMed]
- Zhang, X.; Lu, M.; Xia, A.; Xu, T.; Cui, Z.; Zhang, R.; Liu, W.; He, Y. Genetic analysis of three maize husk traits by QTL mapping in a maize-teosinte population. BMC Genom. 2021, 22, 386. [Google Scholar] [CrossRef] [Scilit] [PubMed]
- Zhou, G.; Mao, Y.; Xue, L.; Chen, G.; Lu, H.; Shi, M.; Zhang, Z.; Huang, X.; Song, X.; Hao, D. Genetic dissection of husk number and length across multiple environments and fine-mapping of a major-effect QTL for husk number in maize (Zea mays L.). Crop J. 2020, 8, 1071–1080. [Google Scholar] [CrossRef] [Scilit]
- Wang, Z.; Gerstein, M.; Snyder, M. RNA-Seq: A revolutionary tool for transcriptomics. Nat. Rev. Genet. 2009, 10, 57–63. [Google Scholar] [CrossRef] [Scilit] [PubMed]
- Love, M.I.; Huber, W.; Anders, S. Moderated estimation of fold change and dispersion for RNA-seq data with DESeq2. Genome Biol. 2014, 15, 550. [Google Scholar] [CrossRef] [Scilit] [PubMed]
- Eisen, M.B.; Spellman, P.T.; Brown, P.O.; Botstein, D. Cluster analysis and display of genome-wide expression patterns. Proc. Natl. Acad. Sci. USA 1998, 95, 14863–14868. [Google Scholar] [CrossRef] [Scilit] [PubMed]
- Langfelder, P.; Horvath, S. WGCNA: An R package for weighted correlation network analysis. BMC Bioinf. 2008, 9, 559. [Google Scholar] [CrossRef] [Scilit] [PubMed]
- Zhang, B.; Horvath, S. A General Framework For Weighted Gene Co-Expression Network Analysis. Stat. Appl. Genet. Mol. Biol. 2005, 4, 17. [Google Scholar] [CrossRef] [Scilit] [PubMed]
- Liu, M.; Yang, Y.; Liang, T.; Hou, F.; Zhang, M.; He, S.; Liu, P.; Zou, C.; Ma, L.; Pan, G.; et al. Dynamic transcriptome and GWAS uncover a hydroxyproline-rich glycoprotein that suppresses Agrobacterium-mediated transformation in maize. Mol. Plant 2025, 18, 747–764. [Google Scholar] [CrossRef] [Scilit] [PubMed]
- Feng, L.; Zhou, M.; Tao, A.; Ma, X.; Wang, N.; Zhang, H.; Duan, H.; Tao, Y. Map-based cloning of Zmccr3 and its network construction and validation for regulating maize seed germination. Theor. Appl. Genet. 2025, 138, 105. [Google Scholar] [CrossRef] [Scilit] [PubMed]
- Yu, T.; Zhang, J.; Cao, J.; Ma, X.; Li, W.; Yang, G. Hub Gene Mining and Co-Expression Network Construction of Low-Temperature Response in Maize of Seedling by WGCNA. Genes 2023, 14, 1598. [Google Scholar] [CrossRef] [Scilit] [PubMed]
- Li, P.; Yang, X.; Wang, H.; Pan, T.; Wang, Y.; Xu, Y.; Xu, C.; Yang, Z. Genetic control of root plasticity in response to salt stress in maize. Theor. Appl. Genet. 2021, 134, 1475–1492. [Google Scholar] [CrossRef] [Scilit] [PubMed]
- Riccio-Rengifo, C.; Finke, J.; Rocha, C. Identifying stress responsive genes using overlapping communities in co-expression networks. BMC Bioinf. 2021, 22, 541. [Google Scholar] [CrossRef] [Scilit] [PubMed]
- Sánchez-Baizán, N.; Ribas, L.; Piferrer, F. Improved biomarker discovery through a plot twist in transcriptomic data analysis. BMC Bioinf. 2022, 20, 208. [Google Scholar] [CrossRef] [Scilit] [PubMed]
- Zhang, H.; Yin, T. Identifying hub genes and key functional modules in leaf tissue of Populus species based on WGCNA. Genetica 2024, 153, 5. [Google Scholar] [CrossRef] [Scilit] [PubMed]
- Liu, Y.; Qu, J.; Zhang, L.; Xu, X.; Wei, G.; Zhao, Z.; Ren, M.; Cao, M. Identification and characterization of the TCA cycle genes in maize. BMC Plant Biol. 2019, 19, 592. [Google Scholar] [CrossRef] [Scilit] [PubMed]
- Zhang, T.; Noll, S.E.; Peng, J.T.; Klair, A.; Tripka, A.; Stutzman, N.; Cheng, C.; Zare, R.N.; Dickinson, A.J. Chemical imaging reveals diverse functions of tricarboxylic acid metabolites in root growth and development. Nat. Commun. 2023, 14, 2567. [Google Scholar] [CrossRef] [Scilit] [PubMed]
- Ryan, D.G.; Yang, M.; Prag, H.A.; Blanco, G.R.; Nikitopoulou, E.; Segarra-Mondejar, M.; Powell, C.A.; Young, T.; Burger, N.; Miljkovic, J.L.; et al. Disruption of the TCA cycle reveals an ATF4-dependent integration of redox and amino acid metabolism. eLife 2021, 10, e72593. [Google Scholar] [CrossRef] [Scilit] [PubMed]
- Zhang, T.; Peng, J.T.; Klair, A.; Dickinson, A.J. Non-canonical and developmental roles of the TCA cycle in plants. Curr. Opin. Plant Biol. 2023, 74, 102382. [Google Scholar] [CrossRef] [Scilit] [PubMed]
- De Veylder, L.; Larkin, J.C.; Schnittger, A. Molecular control and function of endoreplication in development and physiology. Trends Plant Sci. 2011, 16, 624–634. [Google Scholar] [CrossRef] [Scilit] [PubMed]
- Nakamura, Y. Plant Phospholipid Diversity: Emerging Functions in Metabolism and Protein–Lipid Interactions. Trends Plant Sci. 2017, 22, 1027–1040. [Google Scholar] [CrossRef] [Scilit] [PubMed]
- Xiao, Q.; Singer, S.D.; Nakamura, Y.; Chen, G. Phospholipids in plant systems: Metabolism, regulation and functional insights. Prog. Lipid Res. 2026, 101, 101377. [Google Scholar] [CrossRef] [Scilit] [PubMed]
- Zhang, W.; Qin, C.; Zhao, J.; Wang, X. Phospholipase D alpha 1-derived phosphatidic acid interacts with ABI1 phosphatase 2C and regulates abscisic acid signaling. Proc. Natl. Acad. Sci. USA 2004, 101, 9508–9513. [Google Scholar] [CrossRef] [Scilit] [PubMed]
- Kim, T.-W.; Michniewicz, M.; Bergmann, D.C.; Wang, Z.-Y. Brassinosteroid regulates stomatal development by GSK3-mediated inhibition of a MAPK pathway. Nature 2012, 482, 419–422. [Google Scholar] [CrossRef] [Scilit] [PubMed]
- Tian, J.; Wang, C.; Chen, F.; Qin, W.; Yang, H.; Zhao, S.; Xia, J.; Du, X.; Zhu, Y.; Wu, L.; et al. Maize smart-canopy architecture enhances yield at high densities. Nature 2024, 632, 576–584. [Google Scholar] [CrossRef] [Scilit] [PubMed]
- Tian, J.; Wang, C.; Xia, J.; Wu, L.; Xu, G.; Wu, W.; Li, D.; Qin, W.; Han, X.; Chen, Q.; et al. Teosinte ligule allele narrows plant architecture and enhances high-density maize yields. Science 2019, 365, 658–664. [Google Scholar] [CrossRef] [Scilit] [PubMed]
- Che, P.; Bussell, J.D.; Zhou, W.; Estavillo, G.M.; Pogson, B.J.; Smith, S.M. Signaling from the endoplasmic reticulum activates brassinosteroid signaling and promotes acclimation to stress in Arabidopsis. Sci. Signal. 2010, 3, ra69. [Google Scholar] [CrossRef] [Scilit] [PubMed]
- Nolan, T.M.; Vukašinović, N.; Liu, D.; Russinova, E.; Yin, Y. Brassinosteroids: Multidimensional Regulators of Plant Growth, Development, and Stress Responses. Plant Cell 2020, 32, 295–318. [Google Scholar] [CrossRef] [Scilit] [PubMed]
- Planas-Riverola, A.; Gupta, A.; Betegón-Putze, I.; Bosch, N.; Ibañes, M.; Caño-Delgado, A.I. Brassinosteroid signaling in plant development and adaptation to stress. Development 2019, 146, dev151894. [Google Scholar] [CrossRef] [Scilit] [PubMed]
- Kraemer, F.J.; Lunde, C.; Koch, M.; Kuhn, B.M.; Ruehl, C.; Brown, P.J.; Hoffmann, P.; Göhre, V.; Hake, S.; Pauly, M.; et al. A mixed-linkage (1,3;1,4)-β-D-glucan specific hydrolase mediates dark-triggered degradation of this plant cell wall polysaccharide. Plant Physiol. 2021, 185, 1559–1573. [Google Scholar] [CrossRef] [Scilit] [PubMed]
- Nazipova, A.; Gorshkov, O.; Eneyskaya, E.; Petrova, N.; Kulminskaya, A.; Gorshkova, T.; Kozlova, L. Forgotten Actors: Glycoside Hydrolases During Elongation Growth of Maize Primary Root. Front. Plant Sci. 2022, 12, 802424. [Google Scholar] [CrossRef] [Scilit] [PubMed]
- Komis, G.; Šamajová, O.; Ovečka, M.; Šamaj, J. Cell and Developmental Biology of Plant Mitogen-Activated Protein Kinases. Annu. Rev. Plant Biol. 2018, 69, 237–265. [Google Scholar] [CrossRef] [Scilit] [PubMed]
- Wang, Z.; Xia, A.; Wang, Q.; Cui, Z.; Lu, M.; Ye, Y.; Wang, Y.; He, Y. Natural polymorphisms in ZMET2 encoding a DNA methyltransferase modulate the number of husk layers in maize. Plant Physiol. 2024, 195, 2129–2142. [Google Scholar] [CrossRef] [Scilit] [PubMed]
- Xia, A.; Zheng, L.; Wang, Z.; Wang, Q.; Lu, M.; Cui, Z.; He, Y. The RHW1-ZCN4 regulatory pathway confers natural variation of husk leaf width in maize. New Phytol. 2023, 239, 2367–2381. [Google Scholar] [CrossRef] [Scilit] [PubMed]
- Wang, Q.; Wang, M.; Xia, A.; Wang, J.; Wang, Z.; Xu, T.; Jia, D.T.; Lu, M.; Tan, W.M.; Luo, J.H.; et al. Natural variation in ZmNRT2.5 modulates husk leaf width and promotes seed protein content in maize. Plant Biotechnol. J. 2025, 23, 1039–1052. [Google Scholar] [CrossRef] [Scilit] [PubMed]
- Xiao, Y.; Guo, J.; Dong, Z.; Richardson, A.; Patterson, E.; Mangrum, S.; Bybee, S.; Bertolini, E.; Bartlett, M.; Chuck, G.; et al. Boundary domain genes were recruited to suppress bract growth and promote branching in maize. Sci. Adv. 2022, 8, eabm6835. [Google Scholar] [CrossRef] [Scilit] [PubMed]
- Chuck, G.; Bortiri, E. The unique relationship between tsh4 and ra2 in patterning floral phytomers. Plant Signal. Behav. 2010, 5, 979–981. [Google Scholar] [CrossRef] [Scilit] [PubMed]
- Chen, S.; Zhou, Y.; Chen, Y.; Gu, J. fastp: An ultra-fast all-in-one FASTQ preprocessor. Bioinformatics 2018, 34, i884–i890. [Google Scholar] [CrossRef] [Scilit] [PubMed]
- Pertea, M.; Kim, D.; Pertea, G.M.; Leek, J.T.; Salzberg, S.L. Transcript-level expression analysis of RNA-seq experiments with HISAT, StringTie and Ballgown. Nat. Protoc. 2016, 11, 1650–1667. [Google Scholar] [CrossRef] [Scilit] [PubMed]
- Pertea, M.; Pertea, G.M.; Antonescu, C.M.; Chang, T.-C.; Mendell, J.T.; Salzberg, S.L. StringTie enables improved reconstruction of a transcriptome from RNA-seq reads. Nat. Biotechnol. 2015, 33, 290–295. [Google Scholar] [CrossRef] [Scilit] [PubMed]
- Shen, X.; Xiao, B.; Kaderbek, T.; Lin, Z.; Tan, K.; Wu, Q.; Yuan, L.; Lai, J.; Zhao, H.; Song, W. Dynamic transcriptome landscape of developing maize ear. Plant J. 2023, 116, 1856–1870. [Google Scholar] [CrossRef] [Scilit] [PubMed]
Disclaimer/Publisher’s Note: The statements, opinions and data contained in all publications are solely those of the individual author(s) and contributor(s) and not of MDPI and/or the editor(s). MDPI and/or the editor(s) disclaim responsibility for any injury to people or property resulting from any ideas, methods, instructions or products referred to in the content. |
© 2026 by the authors. Licensee MDPI, Basel, Switzerland. This article is an open access article distributed under the terms and conditions of the Creative Commons Attribution (CC BY) license.