


Abstract
Observation-window length can shape estimates of ecosystem temporal stability, yet its influence on belowground soil properties remains less explored. Using annual gridded soil datasets reconstructed from random forest models for alpine grasslands of the Qinghai–Xizang Plateau (2000–2022), we quantified the temporal stability of soil organic carbon, total nitrogen, total phosphorus, their stoichiometric ratios (C:N, C:P, and N:P), and pH across 3–23-year sliding windows. Analyses covered a climate-only scenario, a combined climate–NDVI scenario, and their ratio-based contrast. Estimated stability declined nonlinearly with increasing window length, with progressively smaller changes at longer windows. Exponential models described these relationships well (R2 ≥ 0.96), although decay rates and fitted asymptotic values differed among soil variables and scenario representations. Time-window length and climatic temporal stability together accounted for at least 87% of the variation in soil stability estimates within the common window-based statistical framework. The strong sensitivity of short-window estimates and gradual asymptotic behavior at longer windows highlight how the mean-to-standard-deviation metric captures temporal variation across scales. These results underline the importance of explicitly considering observation-window length when comparing soil stability estimates and provide a basis for examining the scale dependence of soil properties under changing environmental conditions.
1. Introduction
The investigation of ecosystem temporal stability holds considerable scientific and societal significance. It not only advances our understanding of ecological processes, such as biogeochemical cycling and community dynamics, but also provides important insights into ecosystem responses to climate change and biodiversity loss [1,2]. Previous studies have extensively investigated the temporal stability of ecosystem productivity, particularly aboveground net primary productivity (ANPP), and identified several factors associated with its spatiotemporal variation. For example, plant diversity can enhance the temporal stability of ANPP through complementary mechanisms, including species asynchrony and population-level stability associated with dominant species [3,4]. These findings have important implications for ecosystem management and restoration. For instance, plant communities composed of species with complementary functional traits may contribute to the restoration of degraded grasslands, as illustrated by legume–grass mixtures used in the rehabilitation of “Heitutan” (black soil beach) degraded grasslands on the Qinghai–Xizang Plateau [5].
Despite these advances, several uncertainties remain regarding the influence of temporal scale on ecosystem stability assessments. First, time window size represents an important methodological dimension in calculating temporal stability because the estimated mean and variability of ecological properties depend on the length of the observation period [6,7]. However, the time windows adopted in previous studies have often been determined by data availability and research objectives, resulting in differences in temporal scales that may limit the comparability of stability estimates across studies. Second, relatively few studies have explicitly examined how temporal stability changes with increasing time window size, and the reported relationships are not always consistent [8,9]. These differences suggest that the effects of time window size may depend on the ecological variables examined, temporal variability, and environmental conditions. Moreover, because temporal stability is commonly calculated as the ratio of the temporal mean to its standard deviation, changes in window size may influence stability estimates through both mathematical properties of the indicator and the temporal characteristics of ecological processes. Therefore, systematically evaluating the relationship between temporal stability and time window size is necessary to improve the interpretation and comparability of ecosystem stability assessments.
Soil carbon, nitrogen, phosphorus, and pH are important indicators of belowground ecosystem conditions and biogeochemical processes. Their temporal dynamics are associated with nutrient cycling, soil fertility, and ecosystem responses to environmental change. However, compared with the extensive research on aboveground ecosystem stability, relatively limited attention has been paid to how the estimated temporal stability of multiple soil properties varies across different time window sizes. Unlike aboveground productivity, soil properties may exhibit different temporal patterns because of differences in their biogeochemical characteristics, environmental sensitivity, and responses to external disturbances. Consequently, the relationship between temporal stability and time window size may differ among soil properties. Understanding these differences could provide additional insights into the temporal characteristics of belowground ecosystems and inform the interpretation of soil stability under changing environmental conditions [7].
The alpine grasslands of the Qinghai–Xizang Plateau provide a suitable region for investigating these relationships because they experience substantial climatic variability and heterogeneous human disturbances [10]. The region is characterized by high elevation, low temperatures, and pronounced environmental gradients, which may influence the temporal dynamics of soil properties [11,12]. Previous research has examined the spatiotemporal patterns of the temporal stability of soil carbon, nitrogen, phosphorus, and pH in this region and explored their associations with climate change and human activities [13]. That study primarily characterized spatial and temporal patterns under a specified observation period, whereas the present study explicitly treats time-window length as a research variable and evaluates how estimated stability changes across windows of 3–23 years. This distinction allows us to assess the dependence of stability estimates on observation length and compare the resulting patterns among soil properties and scenario representations.
Specifically, a ratio-based contrast was calculated for each year and grid cell by dividing the soil property prediction from the combined climate–NDVI scenario by the corresponding prediction from the climate-only scenario. Following the conceptual framework of Chen et al. [14] and the approach adopted in previous studies [15,16], this ratio was used as an indirect indicator of the potential influence of human activities on soil properties. The climate-only scenario served as a reference, whereas the combined climate–NDVI scenario incorporated additional vegetation information potentially associated with anthropogenic influences. Given that NDVImax also responds to climatic variability, the ratio-based contrast may contain climate-related vegetation responses and model-dependent differences. Accordingly, it provides an indirect approximation of potential human-related influences. Throughout the manuscript, C denotes the climate-only scenario, C + H denotes the combined climate–NDVI scenario, and H denotes the ratio-based contrast used to indirectly characterize potential human-related influences.
2. Materials and Methods
2.1. Data
Monthly temperature, precipitation, radiation, and normalized difference vegetation index (NDVI) data were compiled for grasslands on the Qinghai–Xizang Plateau for 2000–2022. Meteorological data sources are described in [17,18]. The datasets used in the analysis were represented on a common 1 km × 1 km grid. Four annual environmental variables were derived from the monthly data: annual mean temperature (AT), annual total precipitation (AP), annual total radiation (ARad), and annual maximum NDVI (NDVImax). Using previously developed random forest models [15,16], annual gridded estimates of seven soil variables were generated for 2000–2022: soil organic carbon (SOC), total nitrogen (TN), total phosphorus (TP), the carbon-to-nitrogen ratio (C:N), the carbon-to-phosphorus ratio (C:P), the nitrogen-to-phosphorus ratio (N:P), and pH. Two modeling scenarios were considered: a climate-only scenario and a combined climate–NDVI scenario. Both models included AT, AP, and ARad as predictors, while the combined climate–NDVI model additionally included NDVImax. The resulting annual soil datasets represent model-based reconstructions and provide a common basis for comparing temporal characteristics between the two scenarios.
The scenario comparison was conceptually informed by Chen et al. [14], who compared climate-driven potential net primary productivity with actual productivity affected by both climate and human activities and used their difference to approximate human-related influences on alpine grassland productivity. Their models were calibrated and validated using observations from fenced and open grasslands. The present study adopts the general idea of comparing a climate-related reference with a combined-influence scenario, but the indicators and calculation differ from those used by Chen et al. Here, the climate-only model uses AT, AP, and ARad, whereas the combined climate–NDVI model additionally includes NDVImax. For the ratio-based contrast, annual predictions from the combined scenario were divided by the corresponding climate-only predictions. This ratio is not equivalent to the additive difference used by Chen et al. and does not represent an independently predicted human-only soil state. Because NDVImax is influenced by both climate and human activities, the ratio cannot isolate the independent causal effect of human activities. It is therefore interpreted as a model-based relative scenario contrast that may indirectly indicate potential human-related influences. In the figures, C + H denotes the combined climate–NDVI scenario, C denotes the climate-only scenario, and H denotes the ratio-based contrast.
2.2. Statistical Analyses
Temporal stability was calculated as the ratio of the temporal mean to the temporal standard deviation (μ/σ) for each soil variable under the climate-only and combined climate–NDVI scenarios, for the annual ratio-based contrast, and for AT, AP, and ARad across time windows of 3–23 years. For a window length of n years, the number of available windows was 23 − n + 1; thus, the three-year window contained 21 sliding windows, whereas the 23-year window contained one full-period window. For the 23-year window, stability for each grassland pixel was calculated from the full 2000–2022 series. For window lengths of 3–22 years, a one-year-step sliding-window approach was used [19]. For each pixel and window length, the stability estimates from all available windows were averaged to obtain the final value. Because adjacent windows overlap, they are not statistically independent, and the number of available windows decreases as window length increases. The resulting estimates therefore have unequal temporal support across window lengths. The nlsLM function in the minpack.lm package in R 4.2.2 was used to fit relationships between spatially averaged stability estimates and window length. The varpart function in the vegan package was used to partition the variation associated with window length and the temporal stability of AT, AP, and ARad.
3. Results
3.1. Temporal Stability of Climatic Variables Across Time Windows
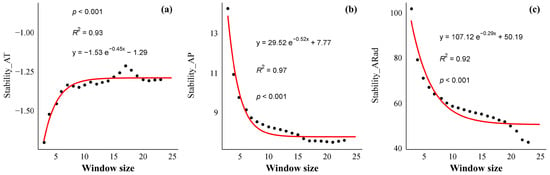
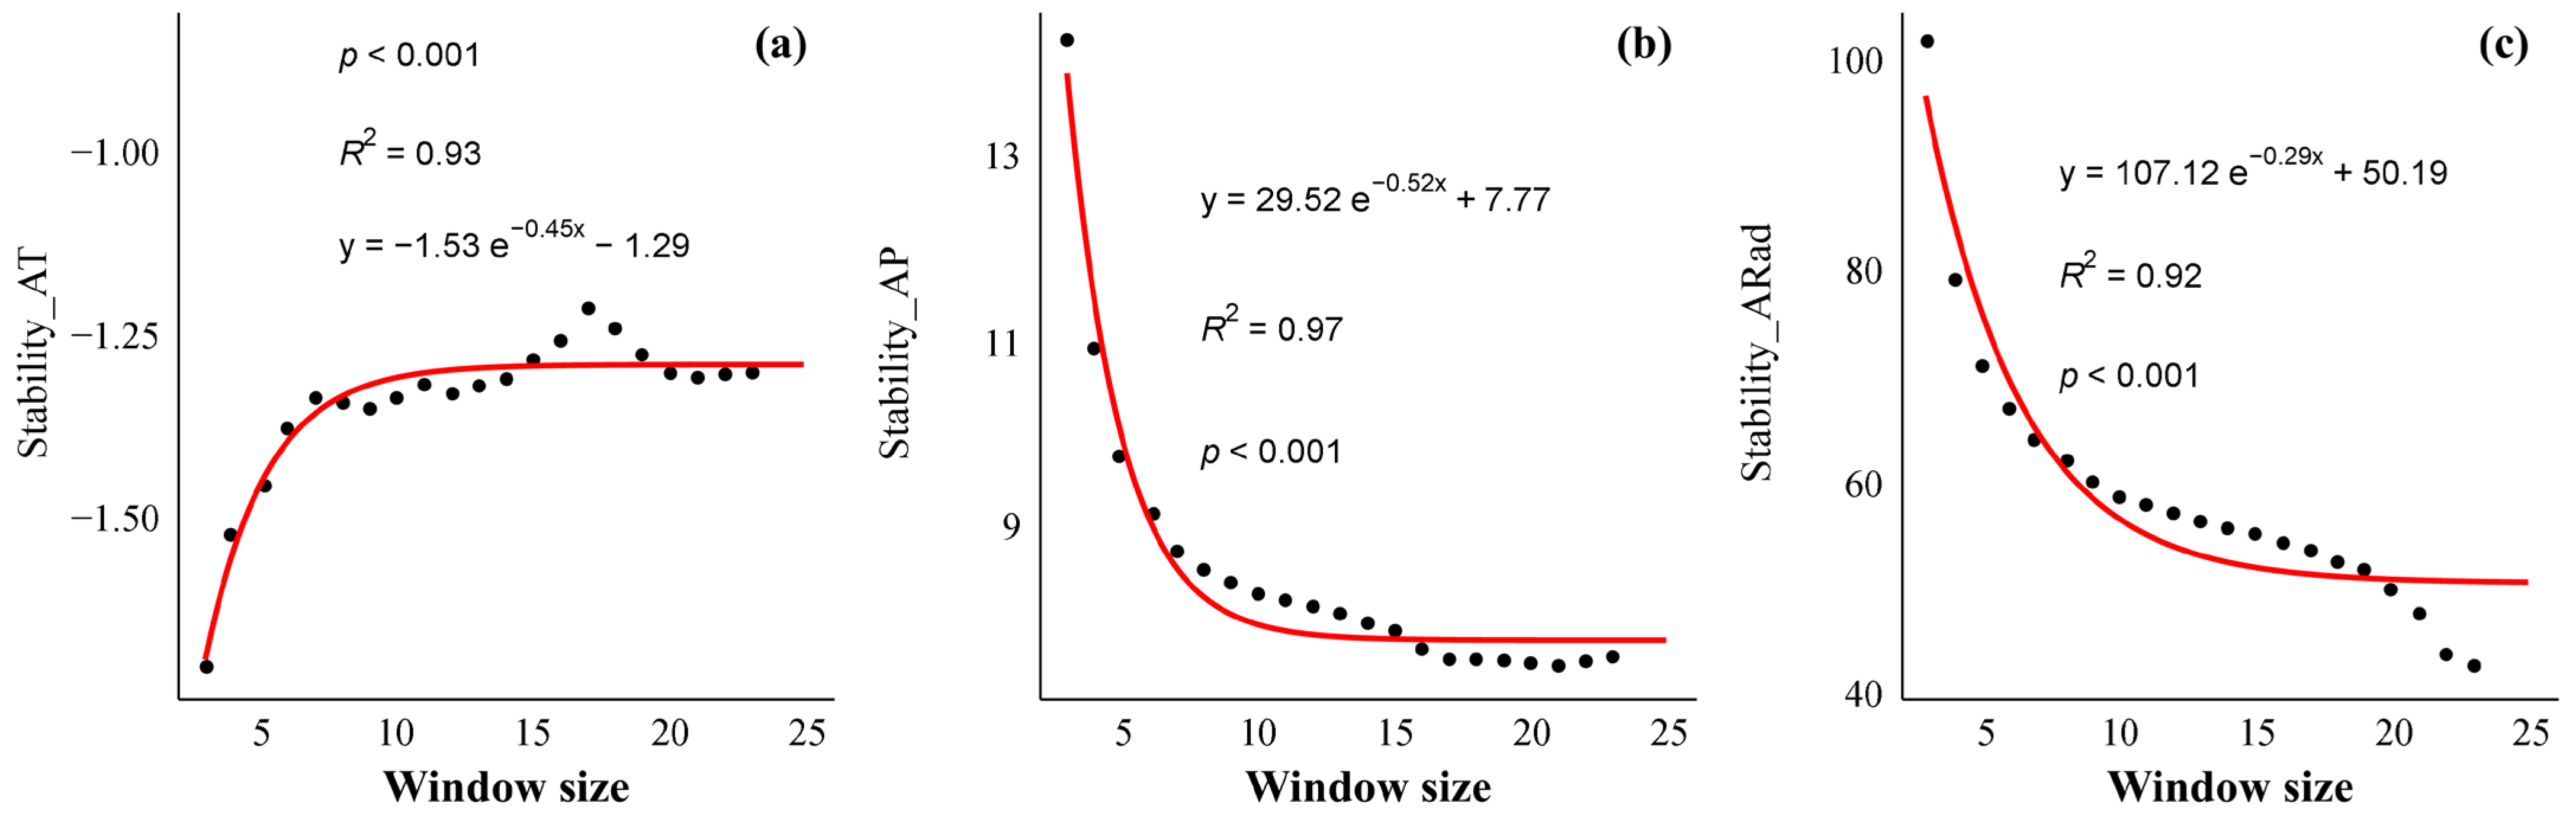
The temporal stability of AT increased with time-window size, with a fitted asymptotic value of −1.29. The temporal stability of AP and ARad decreased with increasing window length, with fitted asymptotic values of 7.77 and 50.19, respectively (Figure 1). These values summarize the fitted window-dependent patterns.
Figure 1.
The relationship between time-window size and (a) temporal stability of annual mean temperature (Stability_AT), (b) temporal stability of annual total precipitation (Stability_AP), and (c) temporal stability of annual total radiation (Stability_ARad). The red lines represent the fitted curves.
3.2. Scale-Dependent Temporal Stability of Soil Variables Under Different Scenarios
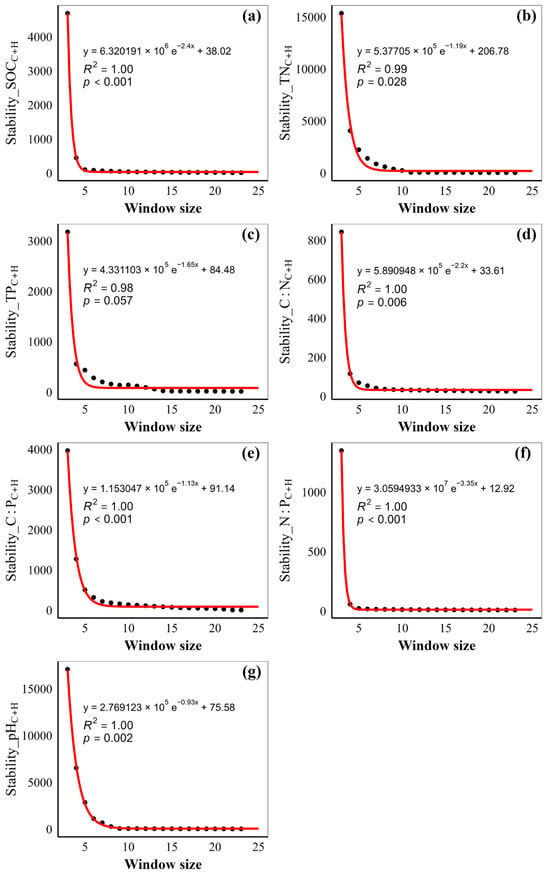
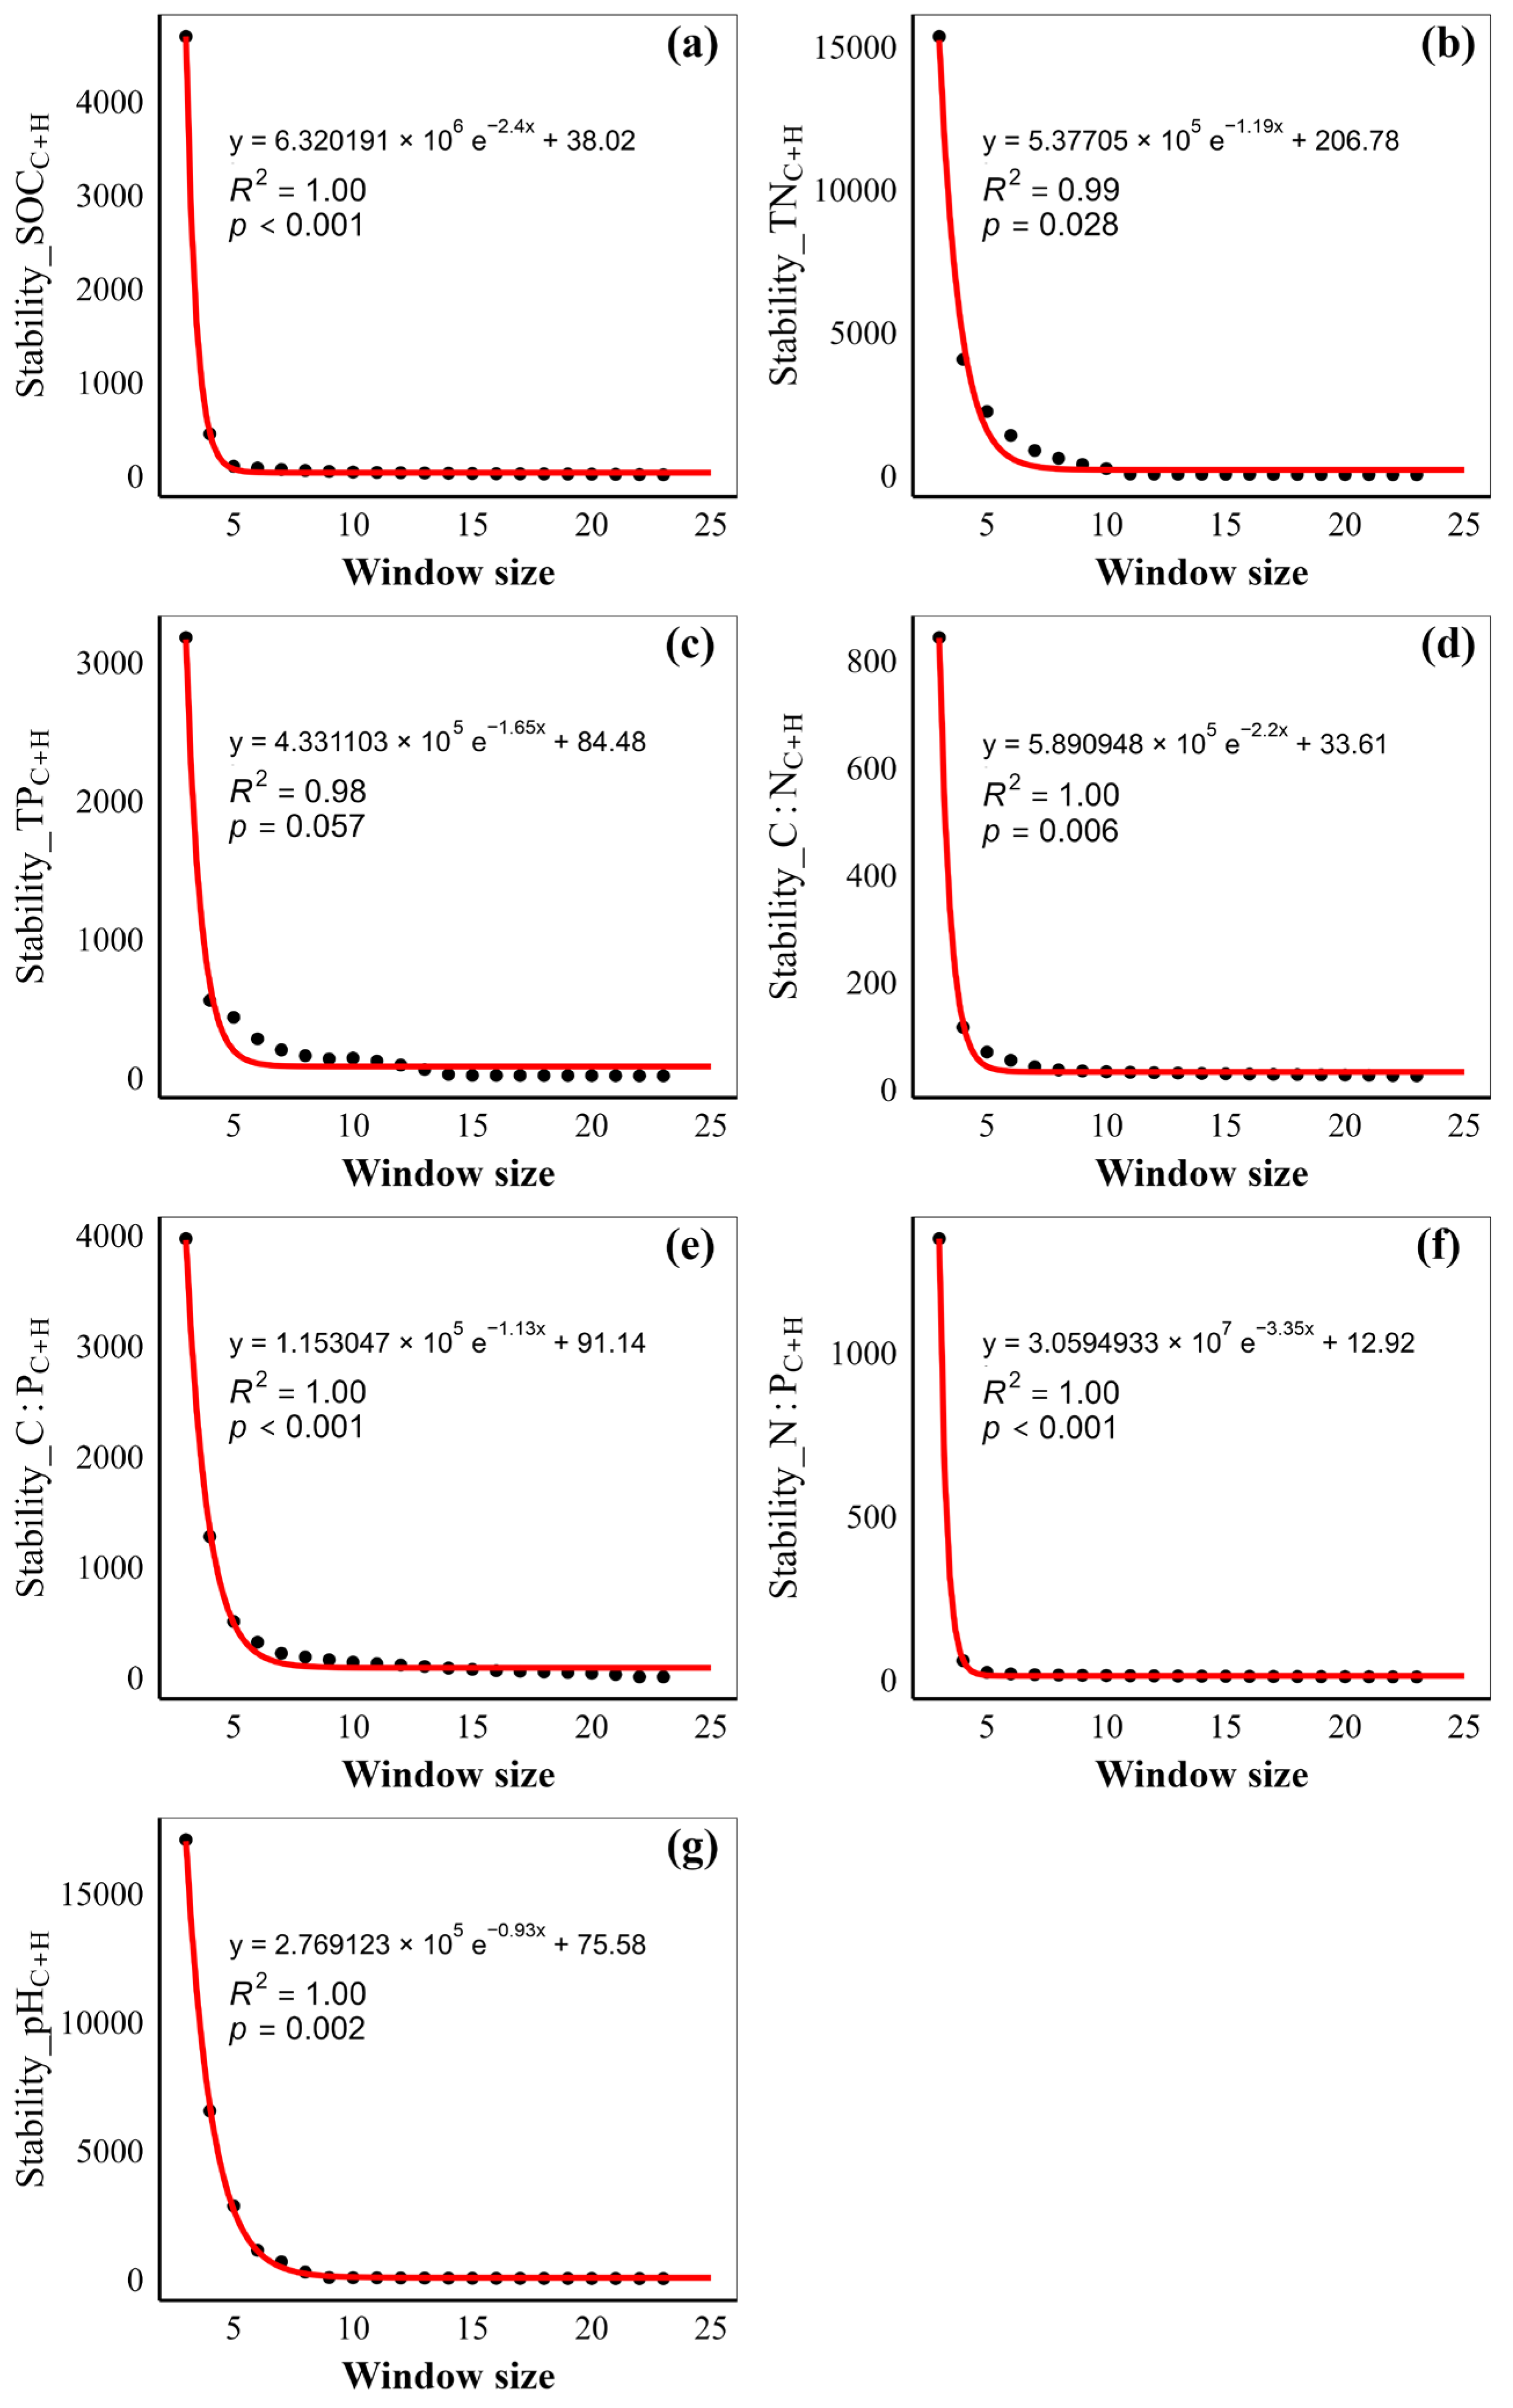
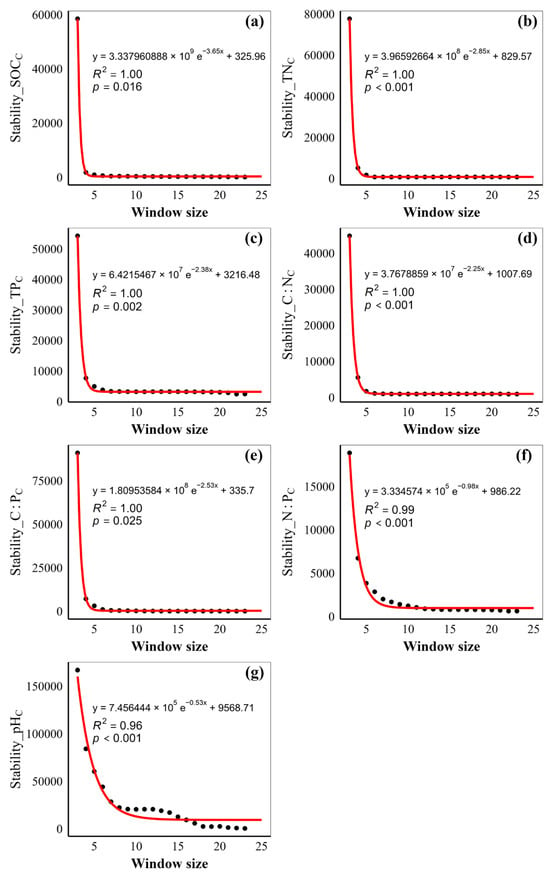
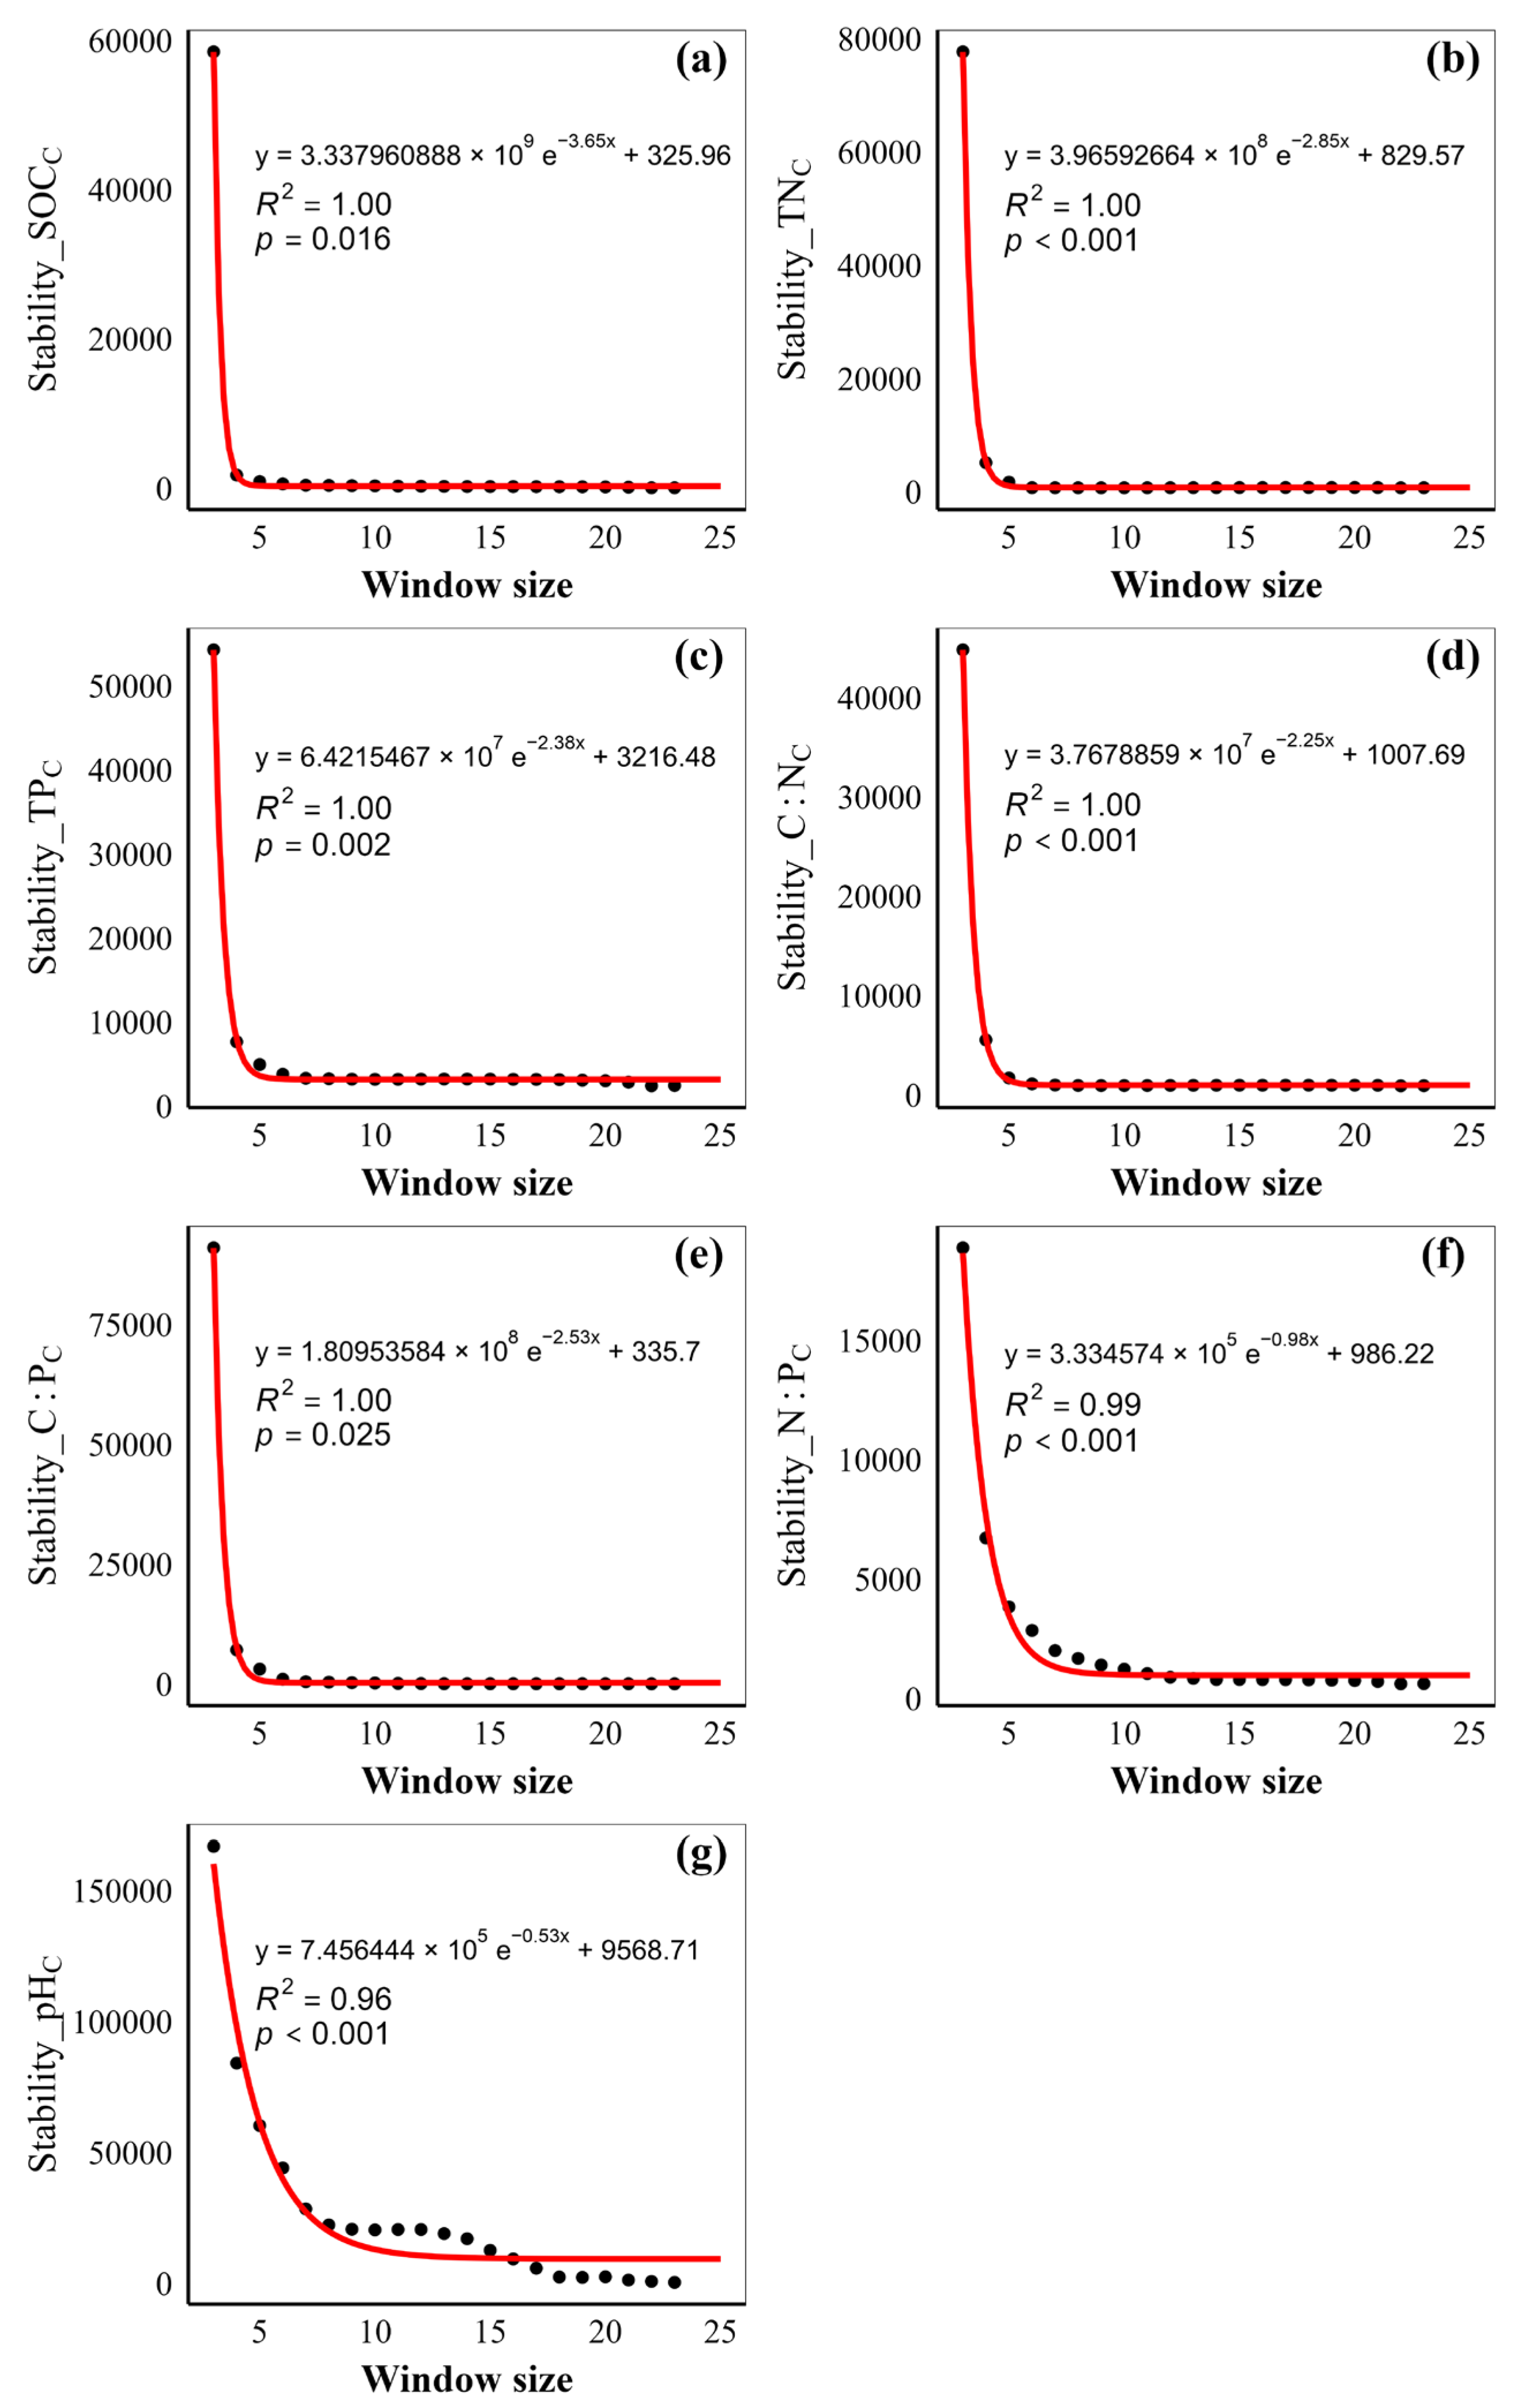
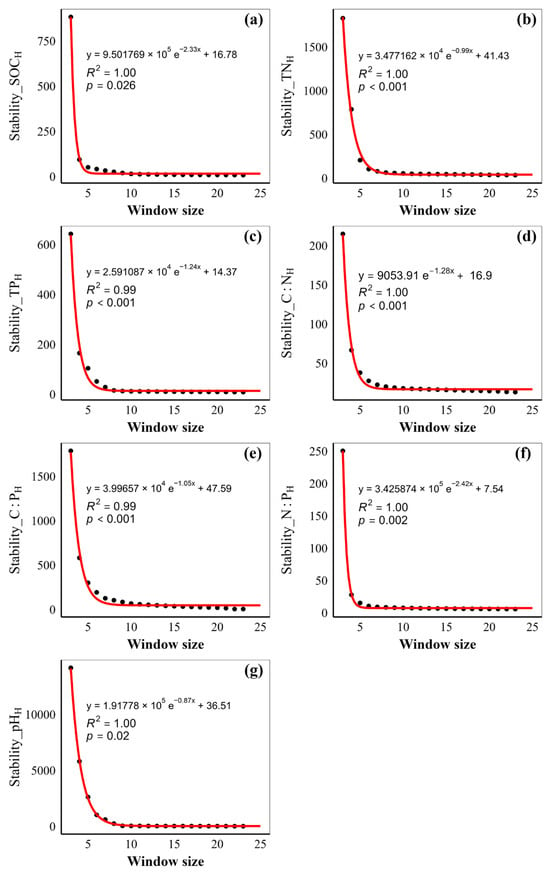
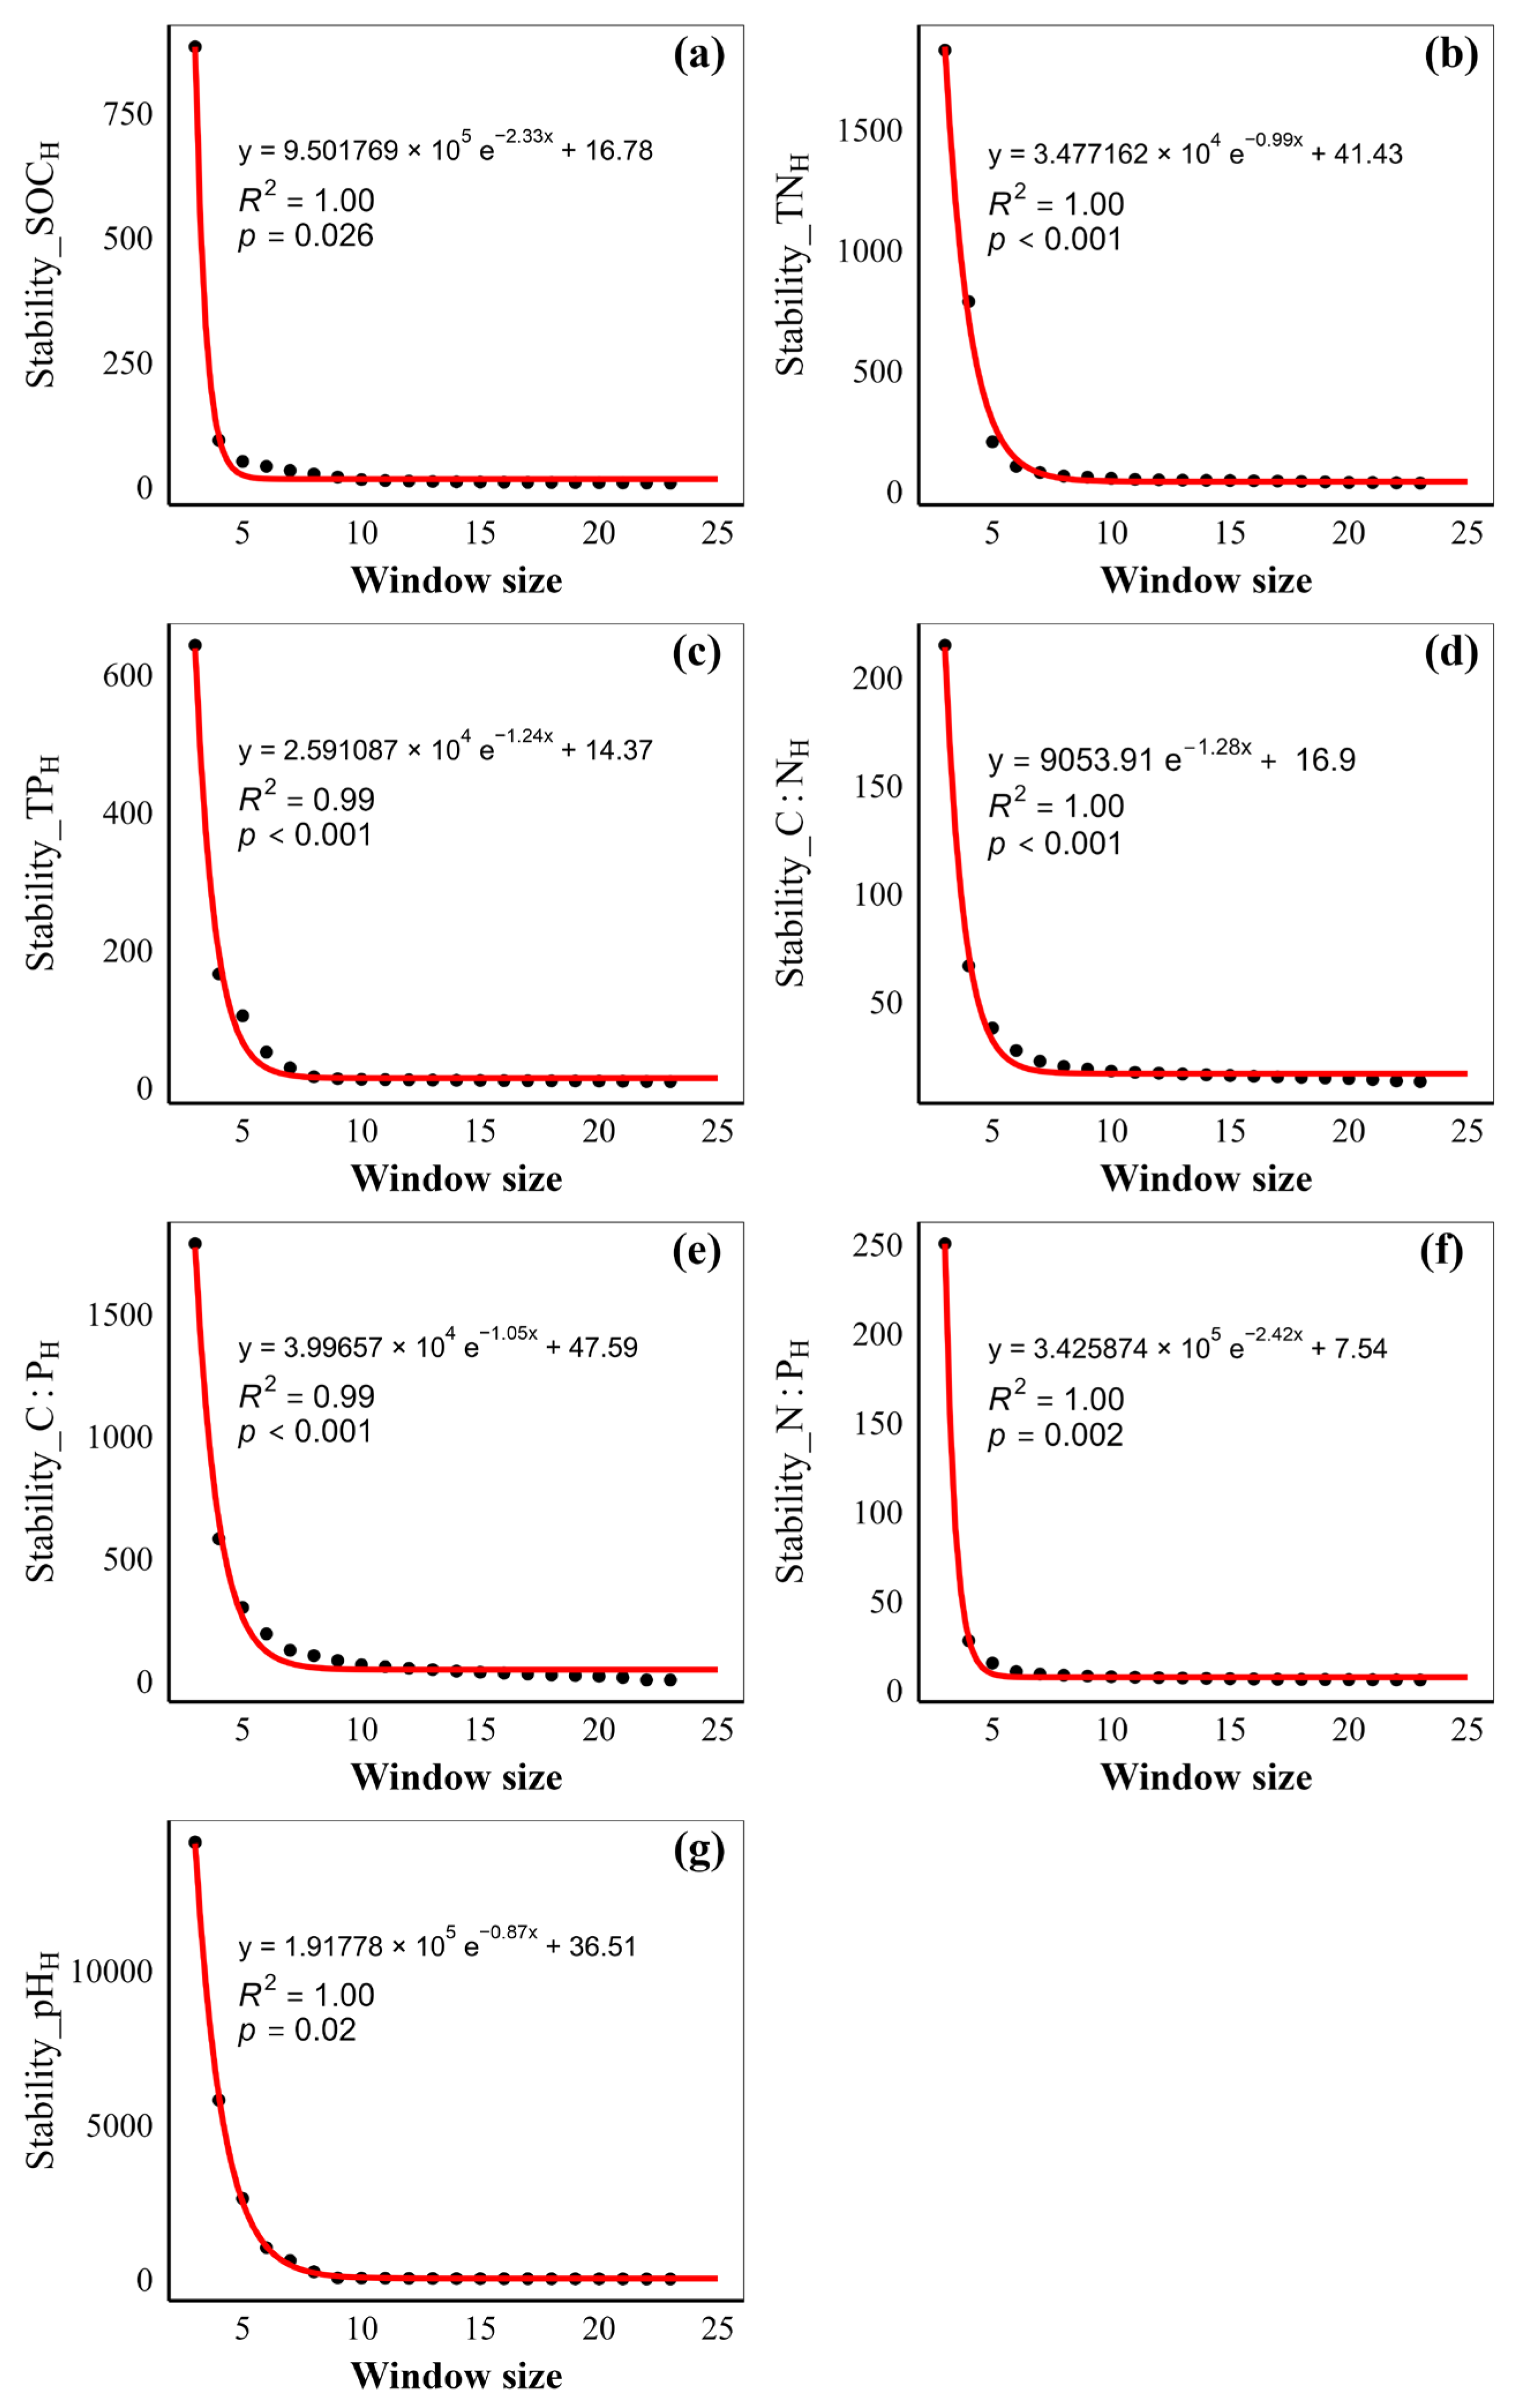
The estimated temporal stability of all seven soil variables showed nonlinear declines with increasing window length across the climate-only scenario, the combined climate–NDVI scenario, and the ratio-based contrast (Figure 2, Figure 3 and Figure 4). Exponential models described these relationships with R2 ≥ 0.96, and the fitted curves approached scenario-specific asymptotic values. For five of the seven variables (SOC, TN, TP, C:N, and C:P), the absolute decay-rate parameter was largest in the climate-only scenario, intermediate in the combined climate–NDVI scenario, and smallest in the ratio-based contrast. For the remaining two variables (N:P and pH), estimated stability was lowest in the climate-only scenario and highest in the combined climate–NDVI scenario. Across all seven variables, the fitted asymptotic values were largest in the climate-only scenario and smallest in the ratio-based contrast (Figure 2, Figure 3 and Figure 4).
Figure 2.
The relationship between time-window size and (a) temporal stability of soil organic carbon (Stability_SOCC+H), (b) total nitrogen (Stability_TNC+H), (c) total phosphorus (Stability_TPC+H), (d) the soil organic carbon-to-total nitrogen ratio (Stability_C:NC+H), (e) the soil organic carbon-to-total phosphorus ratio (Stability_C:PC+H), (f) the total nitrogen-to-total phosphorus ratio (Stability_N:PC+H), and (g) pH (Stability_pHC+H) under the combined climate–NDVI scenario (C + H). The fitted curves and asymptotic values describe the window dependence of μ/σ; ecological convergence is not inferred from goodness of fit alone. C + H denotes the combined climate–NDVI model, rather than an additive decomposition of climate and human effects. The red lines represent the fitted curves.
Figure 3.
The relationship between time-window size and (a) temporal stability of soil organic carbon (Stability_SOCC), (b) total nitrogen (Stability_TNC), (c) total phosphorus (Stability_TPC), (d) the soil organic carbon-to-total nitrogen ratio (Stability_C:NC), (e) the soil organic carbon-to-total phosphorus ratio (Stability_C:PC), (f) the total nitrogen-to-total phosphorus ratio (Stability_N:PC), and (g) pH (Stability_pHC) under the climate-only scenario (C). The fitted curves and asymptotic values describe the window dependence of μ/σ; ecological convergence is not inferred from goodness of fit alone. The red lines represent the fitted curves.
Figure 4.
The relationship between time-window size and (a) temporal stability of soil organic carbon (Stability_SOCH), (b) total nitrogen (Stability_TNH), (c) total phosphorus (Stability_TPH), (d) the soil organic carbon-to-total nitrogen ratio (Stability_C:NH), (e) the soil organic carbon-to-total phosphorus ratio (Stability_C:PH), (f) the total nitrogen-to-total phosphorus ratio (Stability_N:PH), and (g) pH (Stability_pHH) for the ratio-based contrast (H), calculated as combined-scenario predictions divided by climate-only predictions. The fitted curves and asymptotic values describe the window dependence of μ/σ; ecological convergence is not inferred from goodness of fit alone. H is used only as an abbreviation for the ratio-based contrast. The red lines represent the fitted curves.
3.3. Associations of Time Window Size and Climatic Stability with Soil Temporal Stability
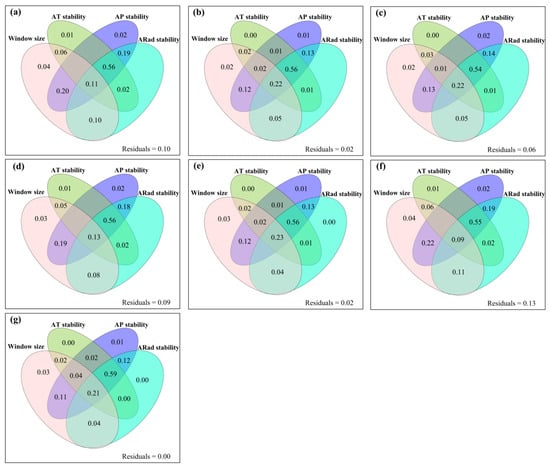
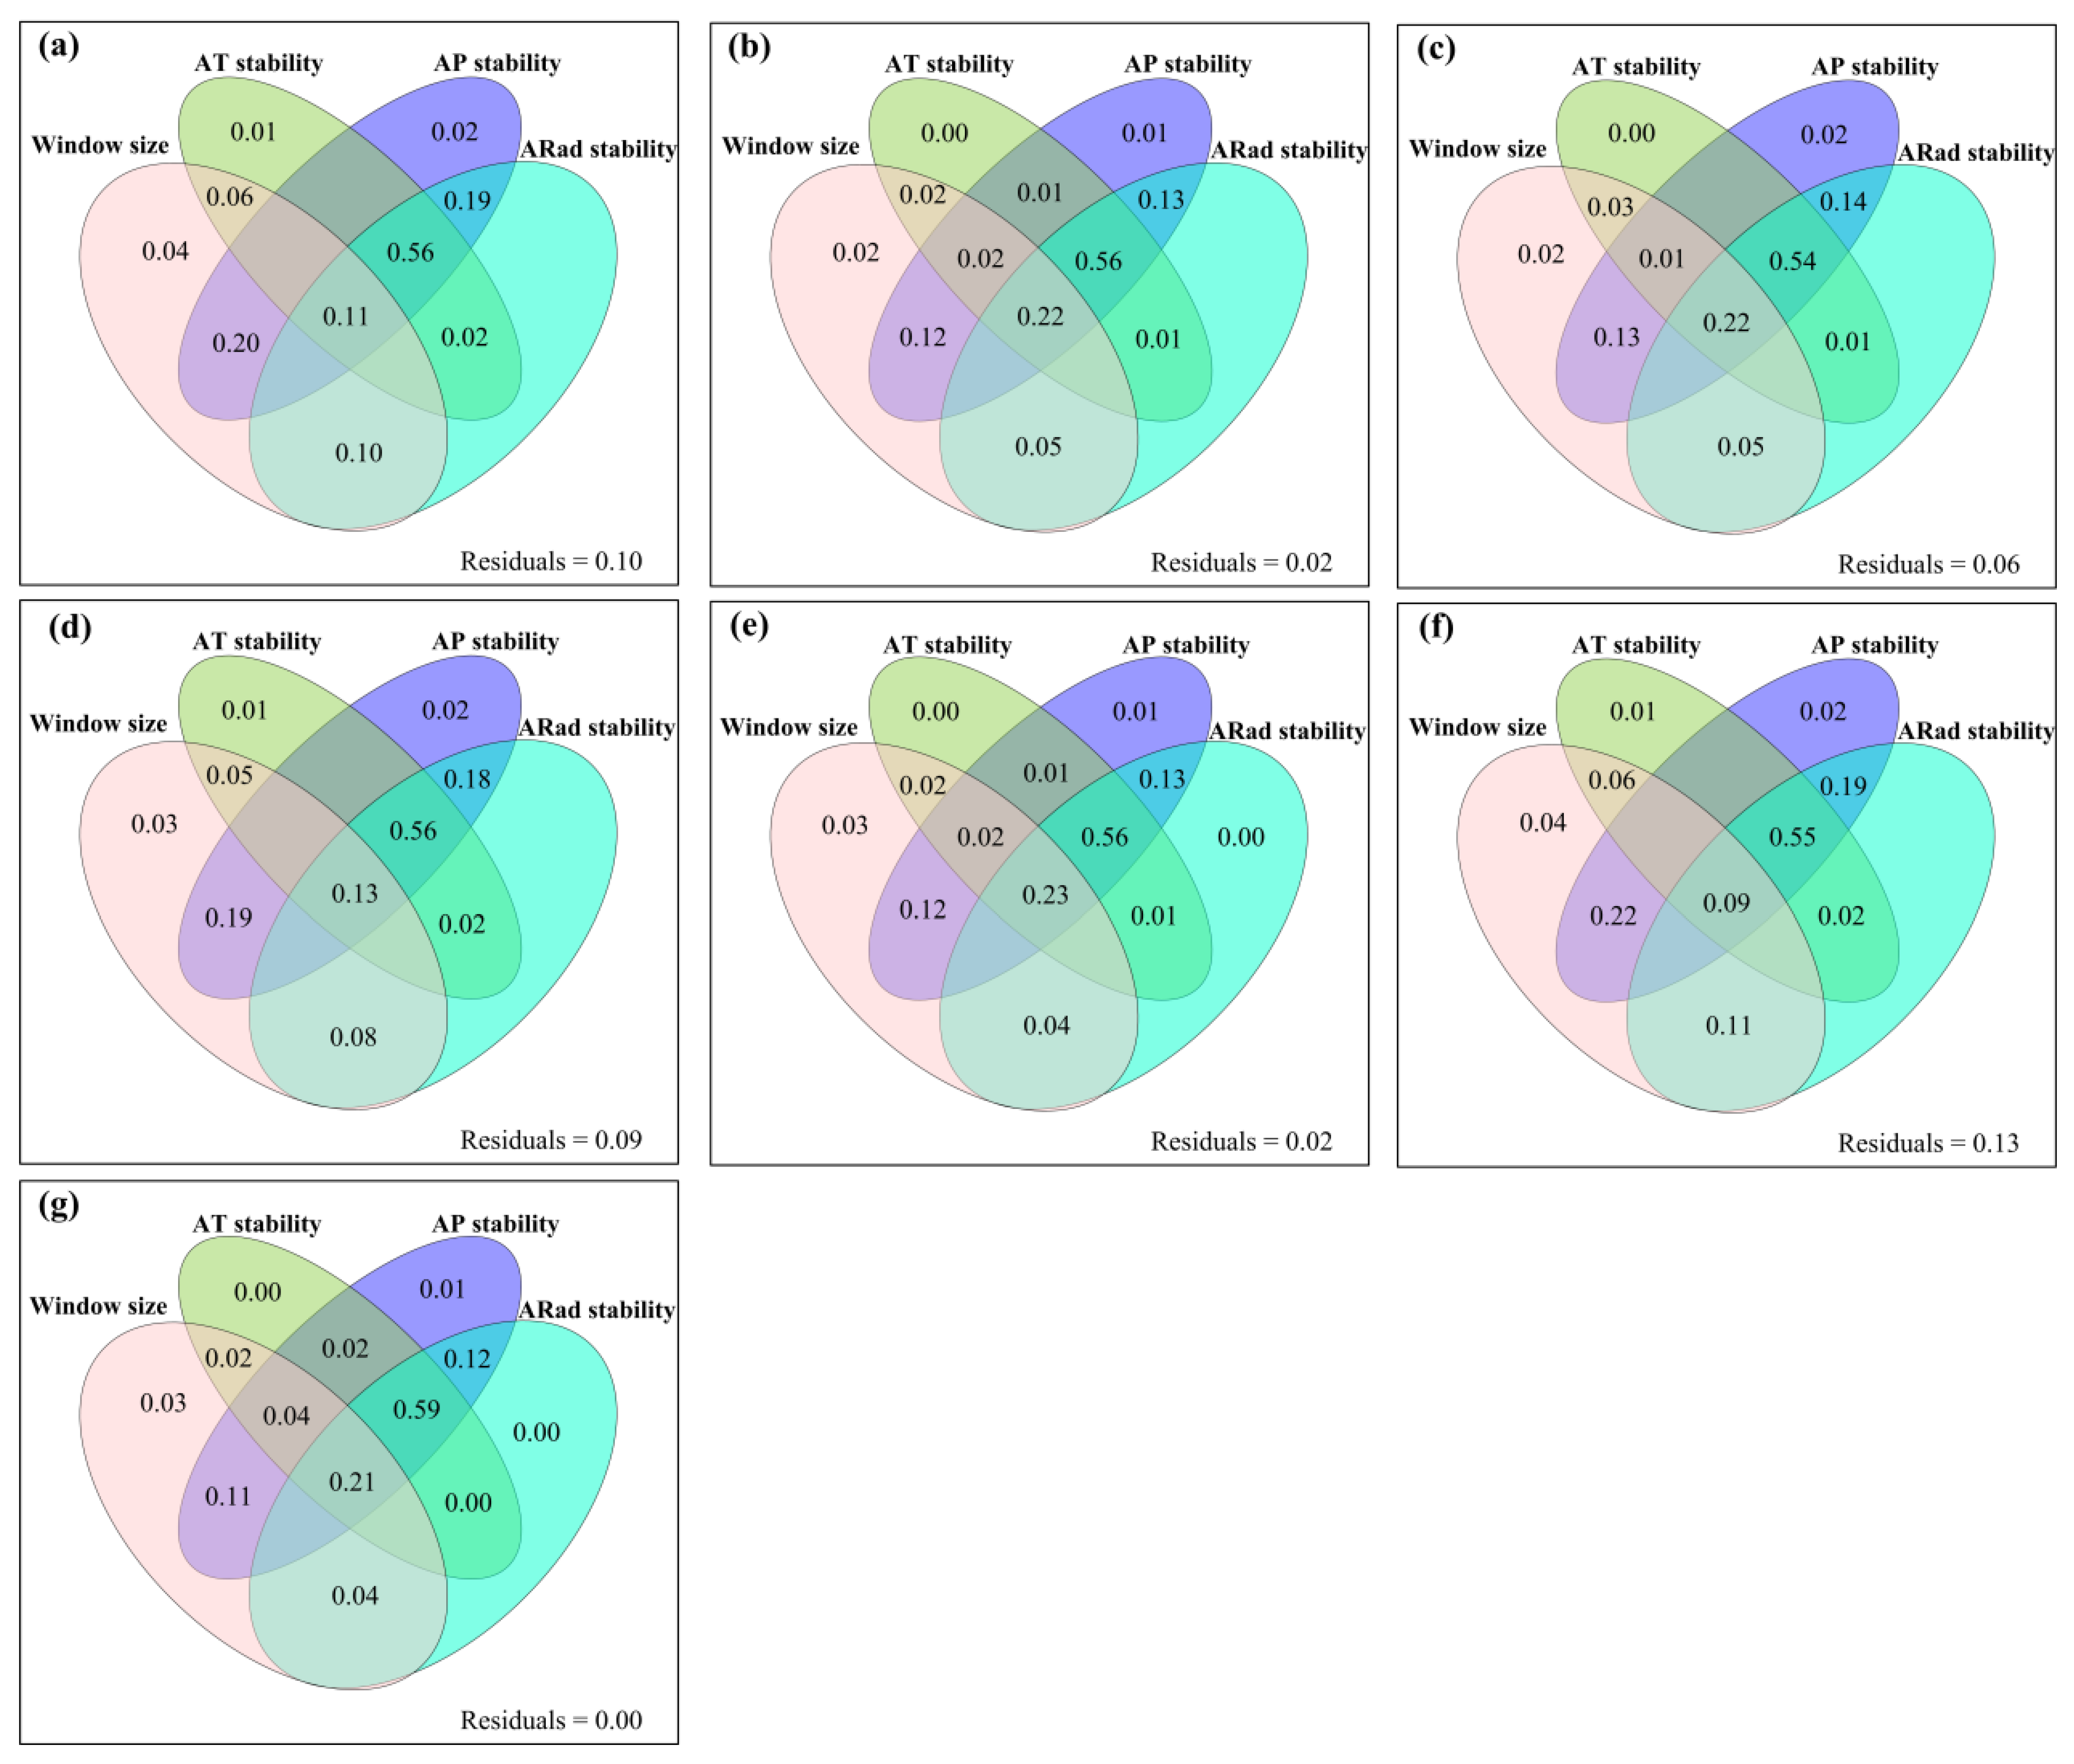
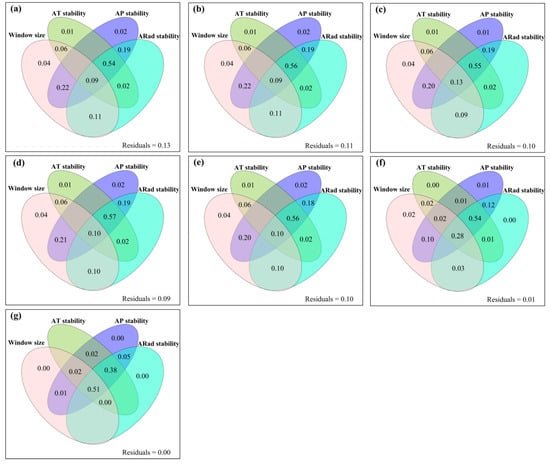
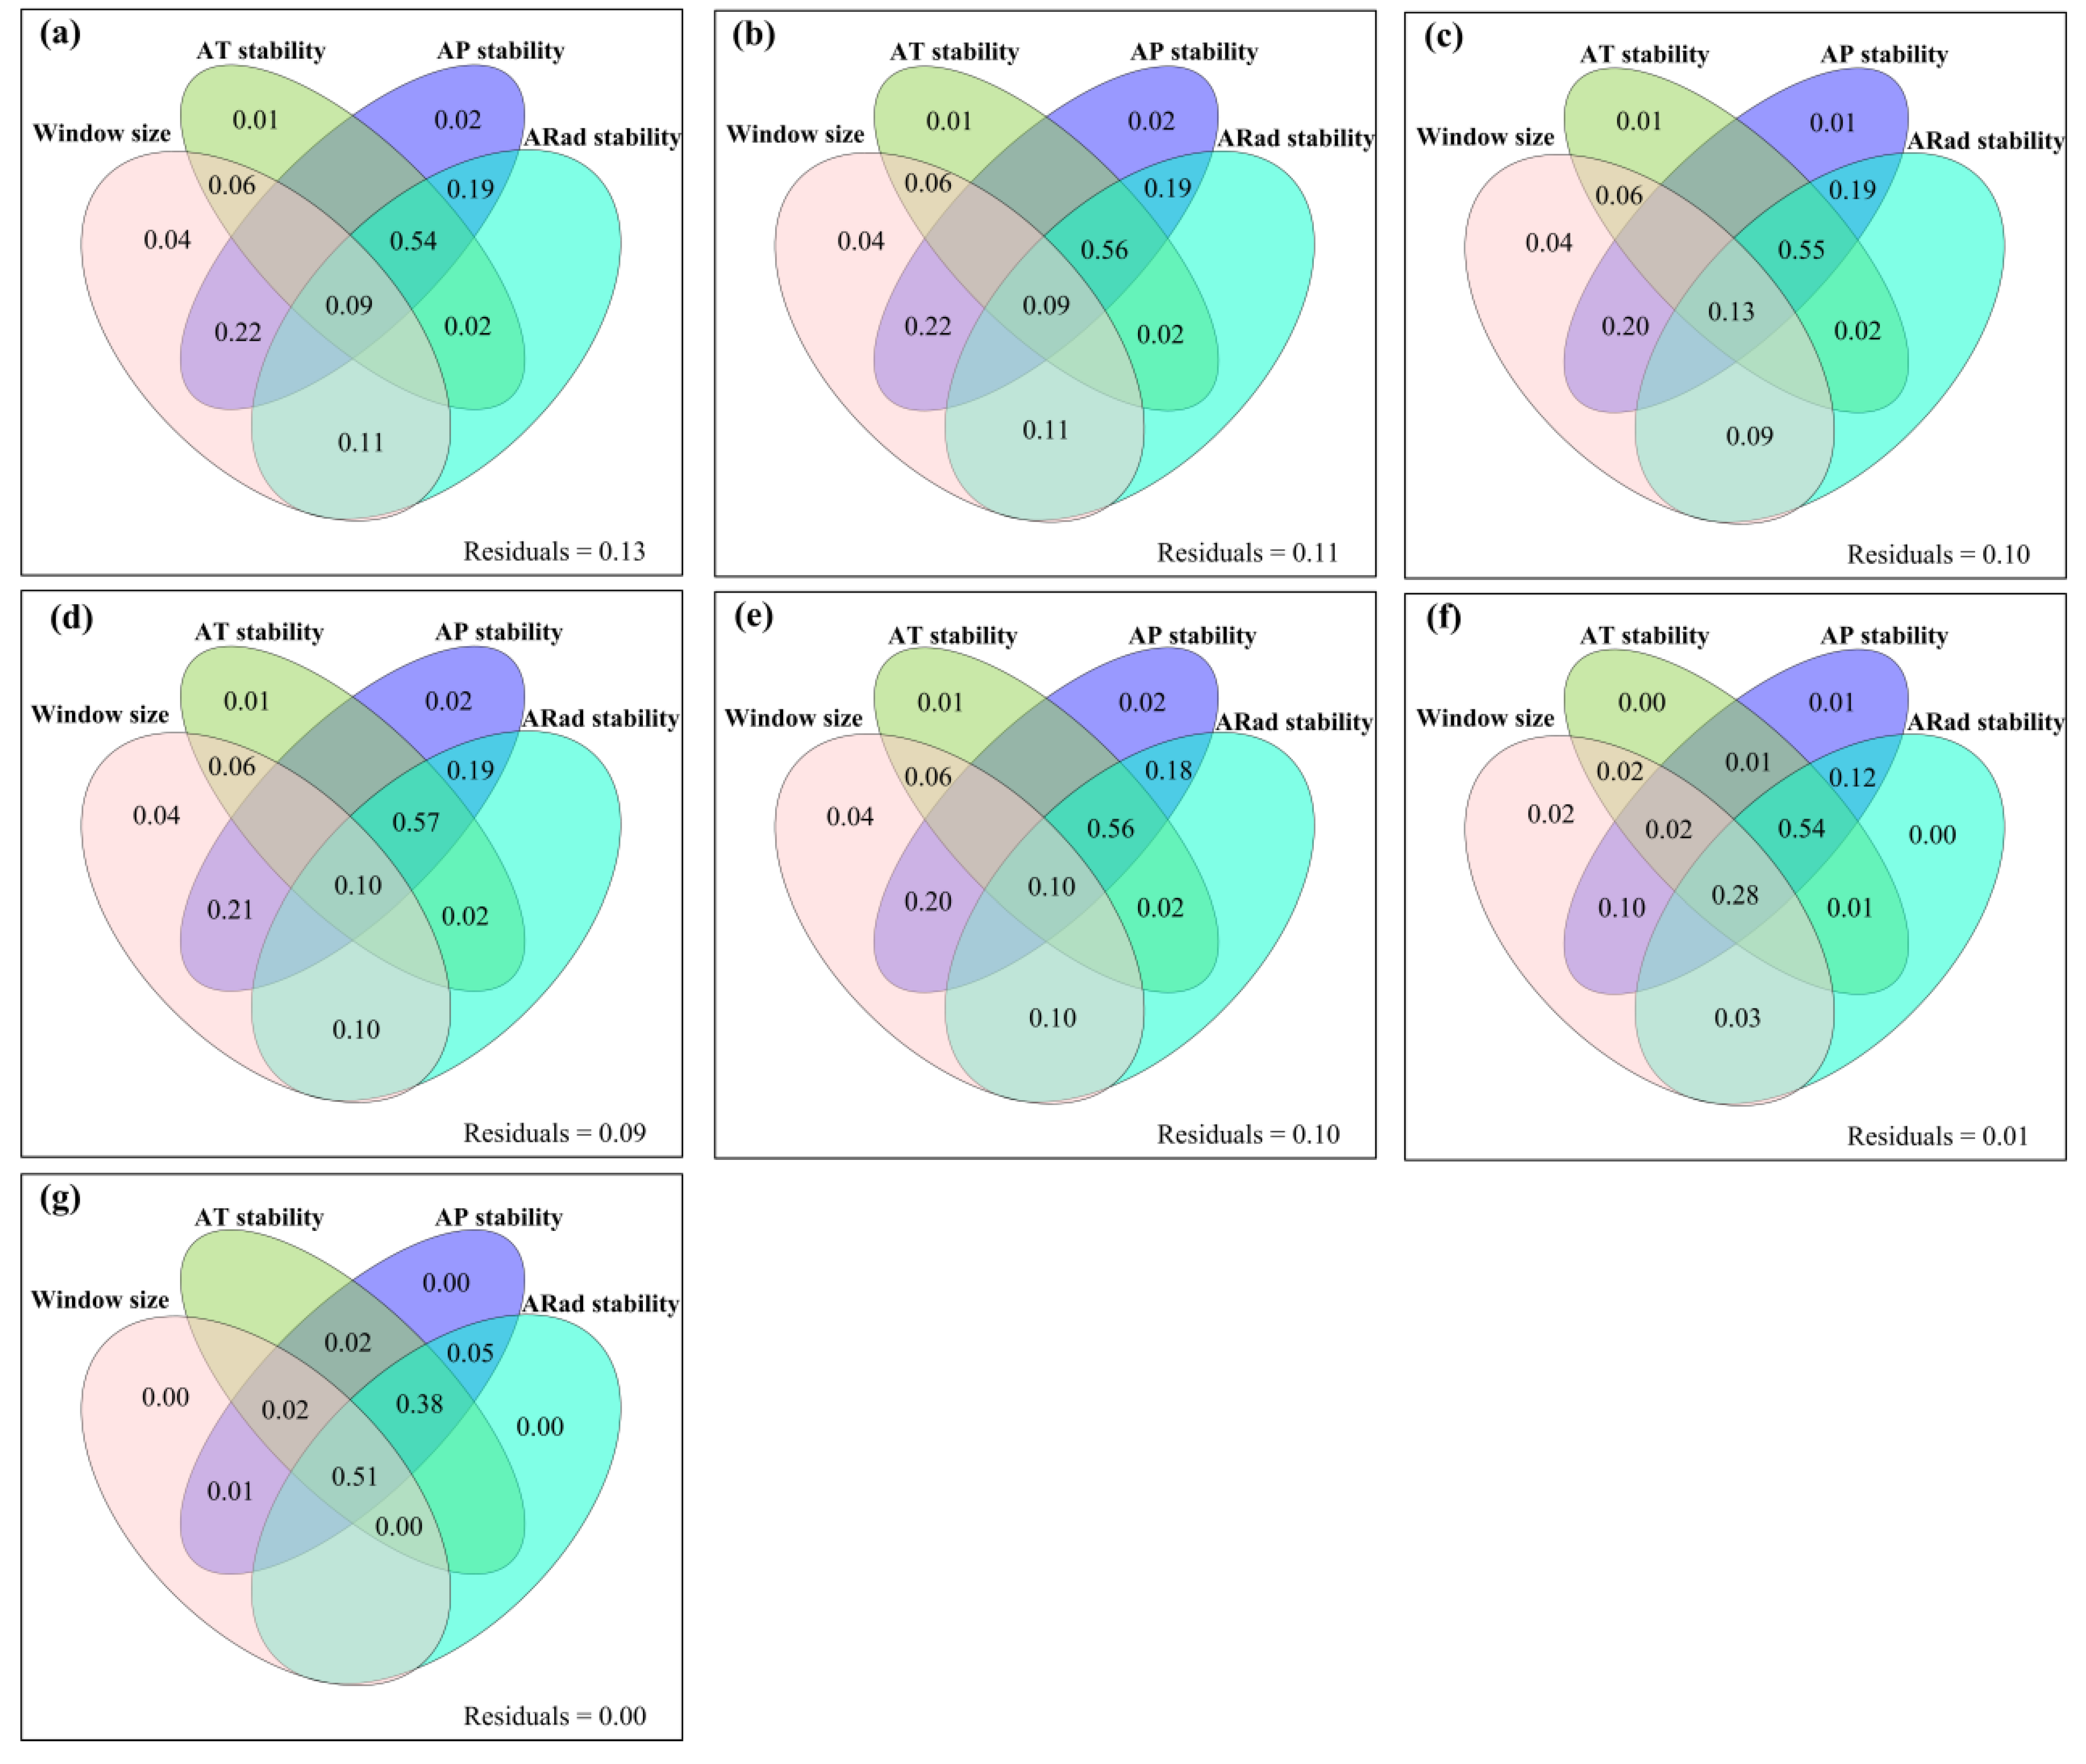
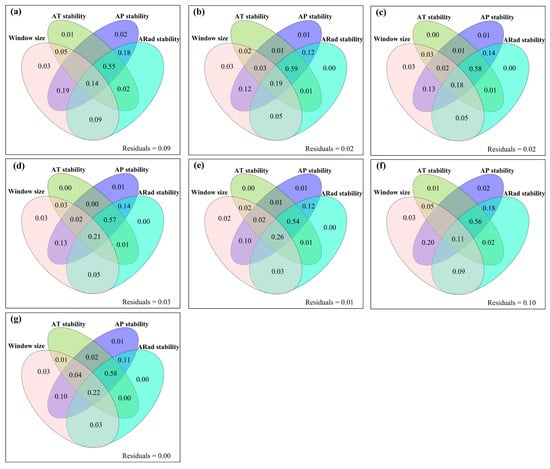
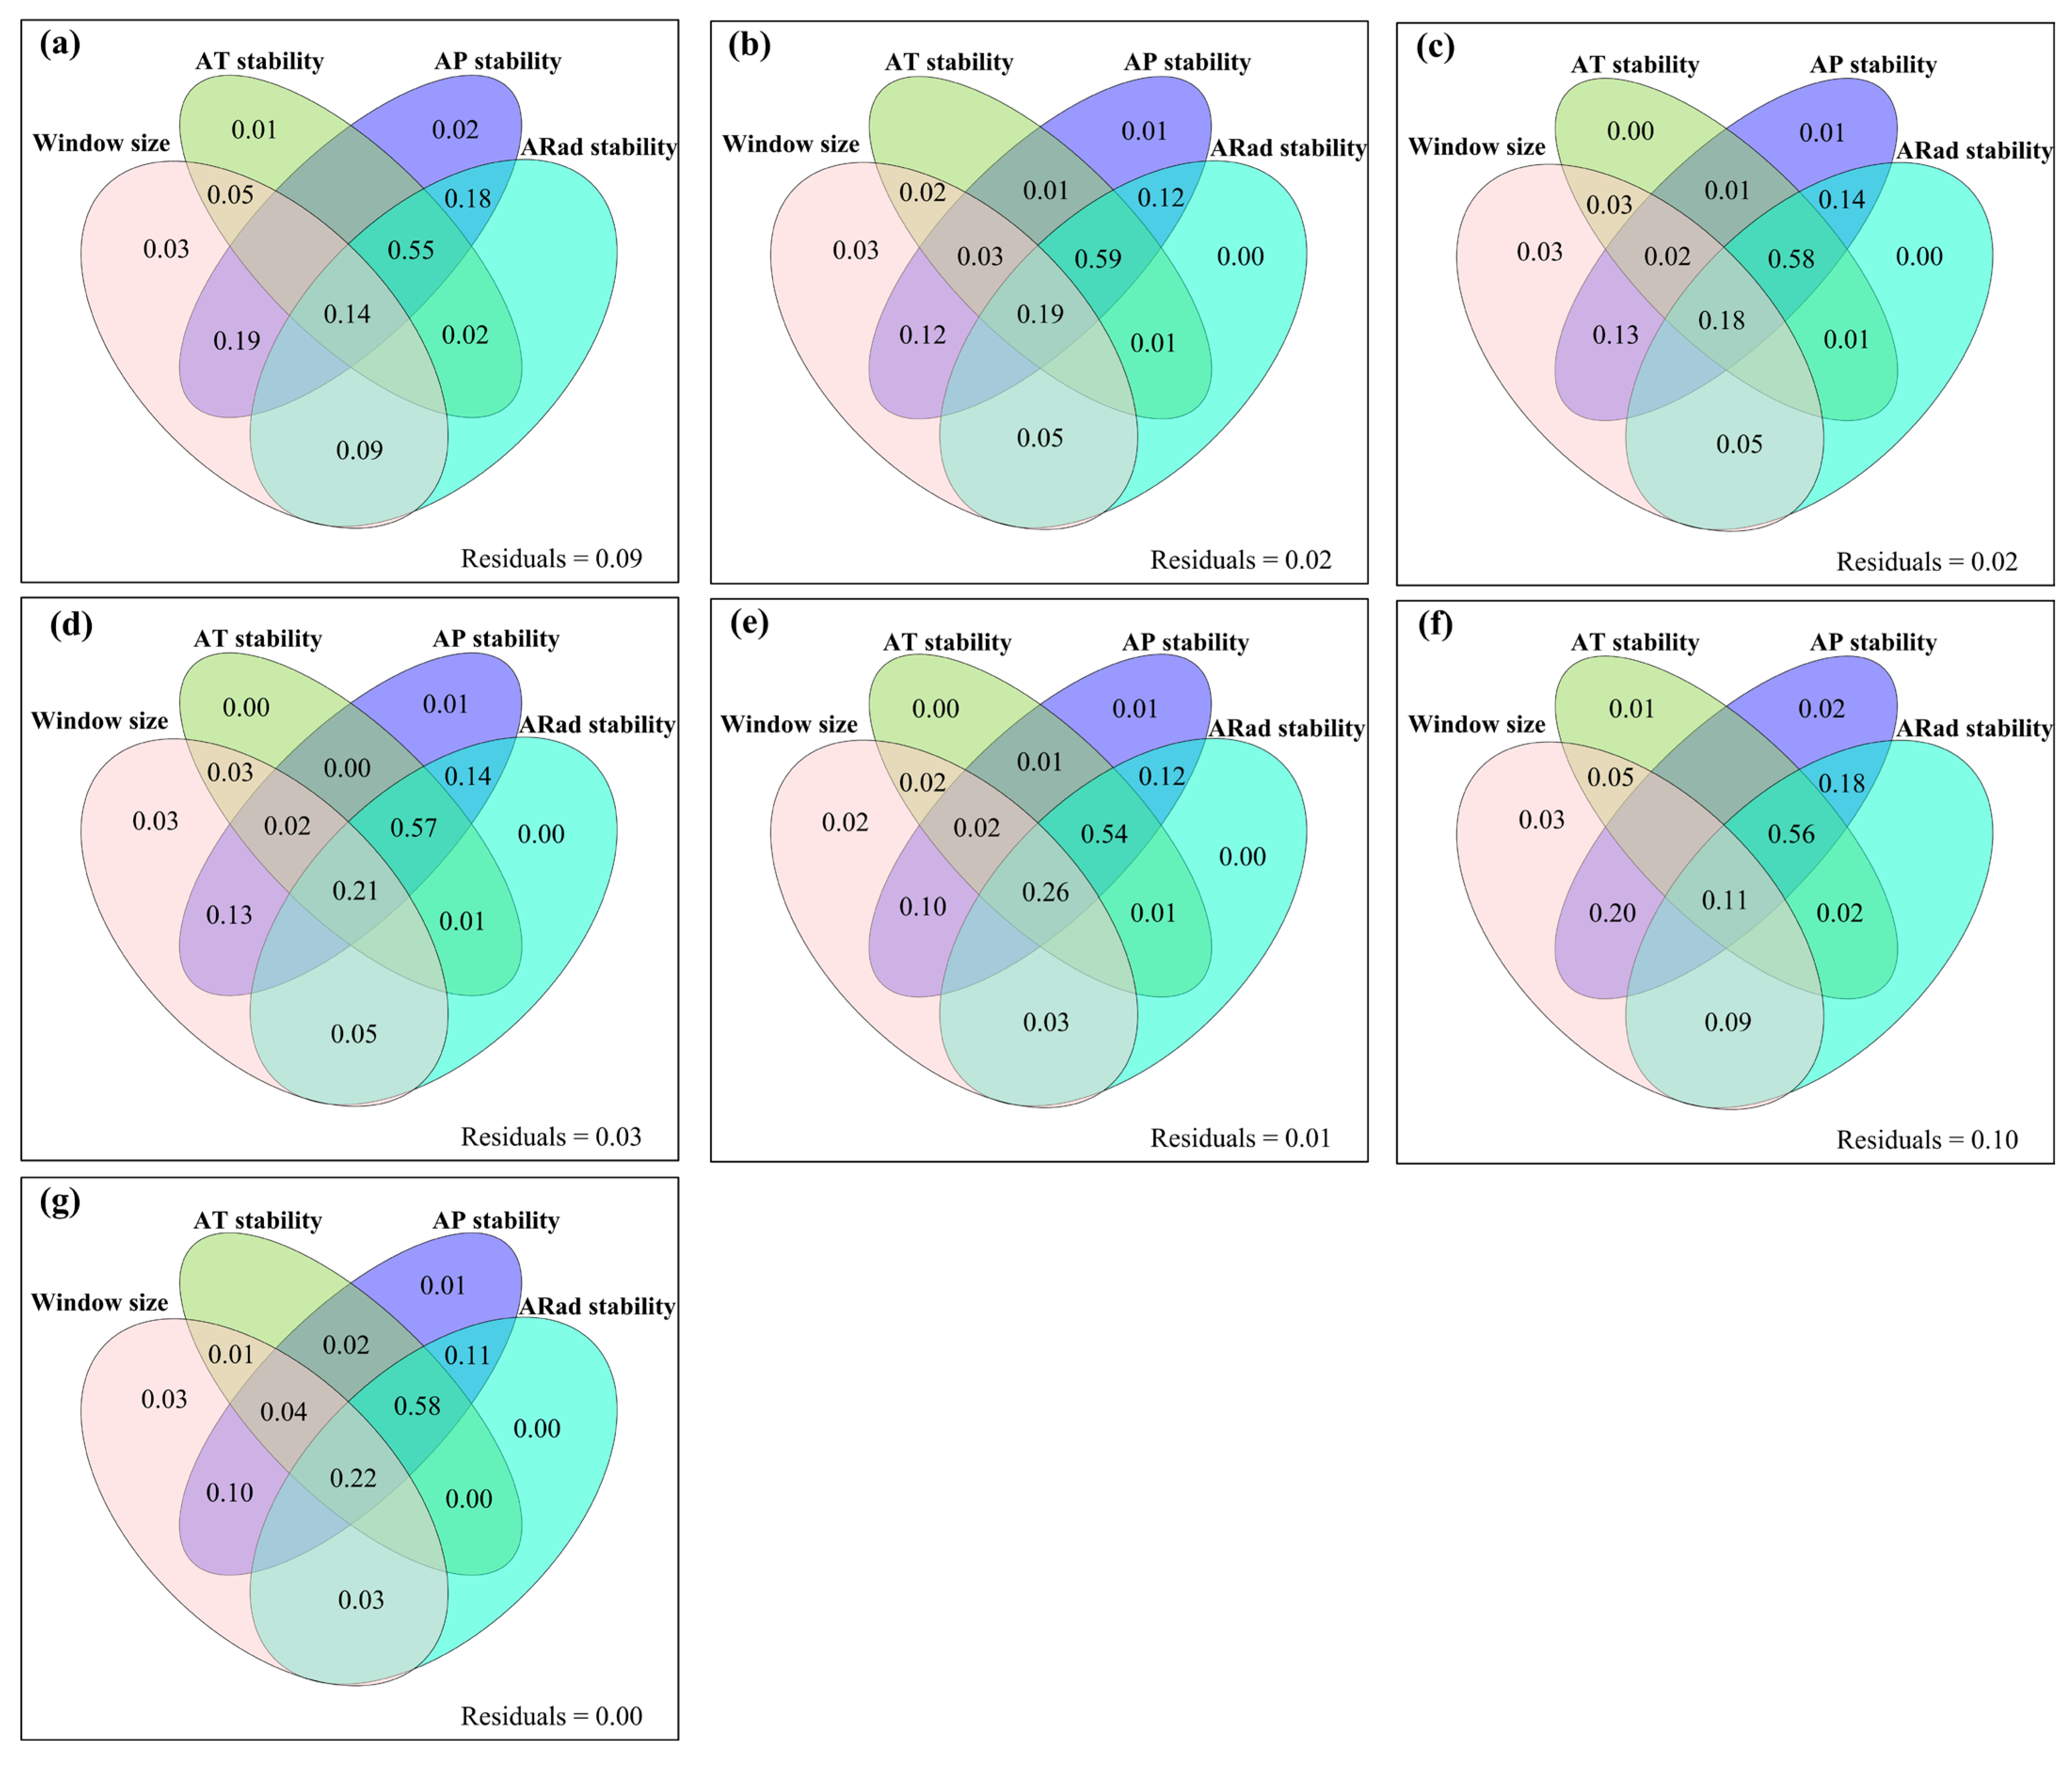
Across all seven soil variables, time-window size and the temporal stability of AT, AP, and ARad jointly accounted for at least 87% of the variation in estimated soil temporal stability. The unique fraction associated with time-window size, conditional on the other included variables, was largest in most cases (Figure 5, Figure 6 and Figure 7).
Figure 5.
Variance partitioning of the temporal stability of (a) soil organic carbon (SOC), (b) total nitrogen (TN), (c) total phosphorus (TP), (d) the SOC-to-TN ratio, (e) the SOC-to-TP ratio, (f) the TN-to-TP ratio, and (g) pH under the combined climate–NDVI scenario (C + H). Unique and shared fractions are associated with time-window size and the temporal stability of annual temperature, precipitation, and radiation (AT stability, AP stability, and ARad stability). These fractions summarize statistical associations among variables sharing the same window-length framework and are not interpreted as independent causal effects.
Figure 6.
Variance partitioning of the temporal stability of (a) soil organic carbon (SOC), (b) total nitrogen (TN), (c) total phosphorus (TP), (d) the SOC-to-TN ratio, (e) the SOC-to-TP ratio, (f) the TN-to-TP ratio, and (g) pH under the climate-only scenario (C). Unique and shared fractions are associated with time-window size and the temporal stability of annual temperature, precipitation, and radiation (AT stability, AP stability, and ARad stability). These fractions summarize statistical associations among variables sharing the same window-length framework and are not interpreted as independent causal effects.
Figure 7.
Variance partitioning of the temporal stability of (a) soil organic carbon (SOC), (b) total nitrogen (TN), (c) total phosphorus (TP), (d) the SOC-to-TN ratio, (e) the SOC-to-TP ratio, (f) the TN-to-TP ratio, and (g) pH for the ratio-based contrast (H). Unique and shared fractions are associated with time-window size and the temporal stability of annual temperature, precipitation, and radiation (AT stability, AP stability, and ARad stability). These fractions summarize statistical associations among variables sharing the same window-length framework and are not interpreted as independent causal effects. H denotes the ratio-based contrast between combined-scenario and climate-only predictions.
4. Discussion
The estimated temporal stability of the seven soil variables generally declined nonlinearly with increasing time-window length, with progressively smaller changes at longer windows (Figure 2, Figure 3 and Figure 4). This pattern highlights the importance of the observation period in interpreting soil stability estimates. Because temporal stability is expressed as the ratio of the temporal mean to its standard deviation (μ/σ), its window dependence reflects how both components are represented over different observation periods. In particular, very small standard deviations within short windows can yield disproportionately large stability values. The high estimates observed over 3–5-year windows and their subsequent rapid decline could therefore be driven to a considerable extent by the sensitivity of the denominator, even without a corresponding change in ecological stability. As the window expands, additional years may introduce fluctuations that were less apparent over shorter periods [20,21], while progressively smaller changes in the estimated mean and standard deviation may contribute to the flatter relationships at longer windows. The overlapping-window design also provides different temporal support across window lengths, with the number of contributing windows decreasing from 21 for a three-year window to one for the full 23-year period. Viewed in this context, a central contribution of the analysis is to characterize the observation-window sensitivity of the stability indicator, while distinguishing this statistical behavior from the ecological processes that may shape the underlying soil series.
The exponential functions provided close descriptions of the window-dependent stability estimates (R2 ≥ 0.96), with fitted parameters differing among soil properties and scenario representations. These high coefficients of determination primarily indicate agreement between the selected functions and the calculated indicator values. Such agreement is also consistent with an exponential function capturing the mathematical behavior of μ/σ as the observation window expands. Accordingly, the fitted relationships are most usefully interpreted as descriptive summaries of indicator behavior, with ecological interpretations considered separately from goodness of fit. The fitted asymptotes summarize the flattening of these relationships over the investigated window lengths and are best regarded as statistical parameters rather than ecological equilibrium states or convergence times. Comparisons with alternative functions and suitable null-model benchmarks could further clarify how the observed curve shapes relate to the properties of the indicator and the temporal structure of the underlying series.
The scale dependence of estimated soil stability may also be considered in relation to environmental variation. Short-term fluctuations and longer-term climatic changes are represented differently as observation windows expand [20,21]. In the present analysis, the temporal stability of annual temperature, precipitation, and radiation likewise varied nonlinearly with window length, although the directions and shapes of these relationships differed (Figure 1). Environmental persistence and the lasting influence of previous conditions, often discussed in terms of ecological memory, provide a possible ecological context for these temporal patterns [22,23]. Changes in moisture availability, decomposition, and nutrient cycling may also influence the variability of soil properties over different periods [24,25,26,27,28,29,30]. These mechanisms offer plausible interpretations of the underlying temporal variation, whereas the fitted stability curves describe how that variation is summarized by μ/σ across windows. Maintaining this distinction allows the statistical findings to inform ecological questions while leaving room for further examination through long-term soil observations and process-based analyses.
Differences among the scenario representations (Figure 2, Figure 3 and Figure 4) suggest that the window-dependent patterns vary with the environmental information included in the models. Temperature, precipitation, and radiation represent climatic conditions relevant to soil moisture and biogeochemical processes, whereas NDVImax additionally incorporates vegetation dynamics responsive to both climate and land use. The ratio-based contrast (H), calculated by dividing annual predictions from the combined climate–NDVI scenario by the corresponding climate-only predictions, provides a relative comparison between these two model representations [14,15,16]. Its interpretation therefore encompasses climate-linked vegetation responses, potential land-use influences, and differences in model behavior, rather than a separately estimated human effect. Grazing-related changes in vegetation cover, nutrient cycling, and legacy responses provide possible ecological context for variation among the reconstructed series [10,22,31]. Throughout this interpretation, H refers specifically to the ratio-based contrast, keeping its meaning aligned with the way it was calculated.
The use of annual soil series reconstructed with random forest models is also relevant to interpreting their temporal stability [15,16]. These series represent year-to-year variation through changing predictor conditions and the statistical behavior of the models. Uncertainty in annual predictions may consequently influence both the estimated mean and standard deviation, with potentially greater sensitivity in short windows. For example, smoothing of interannual fluctuations may reduce the estimated standard deviation and increase μ/σ, whereas additional year-to-year prediction variability may have the opposite effect. Differences in the predicted mean may further modify the ratio. Thus, the extent to which reconstructed series represent interannual variation is an important consideration when comparing stability estimates across windows and scenario representations. Propagating prediction uncertainty through the annual ratio-based contrast, sliding-window calculations, and fitted relationships would provide a useful extension of this framework and help place the observed patterns in a broader uncertainty context.
The variance-partitioning analysis showed that time-window length and climatic temporal stability jointly accounted for at least 87% of the variation in estimated soil temporal stability (Figure 5, Figure 6 and Figure 7), with the largest unique fraction associated with window length in most cases. This result is most appropriately understood within the shared statistical framework used to calculate the variables. Because climatic and soil stability were evaluated over the same window lengths, part of their association may be expected from this common window-length structure. The use of climatic predictors in reconstructing the soil series further links the two sets of estimates. The explained fraction therefore summarizes associations arising from shared statistical structure together with relationships represented in the underlying series, rather than establishing independent control over soil stability. Similarly, the unique fraction associated with a predictor set is conditional on the other variables included in the partitioning. From a practical perspective, the findings support explicitly reporting observation-window length, considering the mean and standard deviation alongside their ratio, and comparing stability estimates over compatible temporal scales. Their potential application to monitoring design and ecological management would be strengthened by complementary evidence from longer observational records and direct measurements of soil processes.
5. Conclusions
This study characterized the time-window dependence of estimated temporal stability for soil carbon, nitrogen, phosphorus, their stoichiometric ratios, and pH in alpine grasslands of the Qinghai–Xizang Plateau during 2000–2022. Across windows of 3–23 years, stability estimates generally declined nonlinearly, with progressively smaller changes at longer windows. Exponential functions described these relationships well (R2 ≥ 0.96), and their fitted parameters differed among soil properties and scenario representations. The main contribution lies in showing how observation-window length shapes a stability indicator calculated from model-reconstructed soil series. Very high short-window estimates and their rapid decline may reflect, to a substantial extent, small standard deviations and the resulting sensitivity of μ/σ. These statistical properties provide an essential context for considering the ecological variation represented in the underlying series. The fitted functions and asymptotes are therefore interpreted as descriptive features of the indicator, with ecological convergence remaining a separate question from goodness of fit.
Time-window length and climatic temporal stability jointly accounted for at least 87% of the variation within the common window-based framework. Because the variables share the same window-length structure, this explained fraction includes associations arising from their common statistical basis and is best interpreted as a framework-specific association rather than evidence of independent control over soil stability. The ratio-based contrast (H) likewise provides a relative comparison between two model predictions, rather than a separate estimate of human effects. Uncertainty in annual random forest predictions may also systematically influence the variability represented in the reconstructed series and, consequently, the resulting stability estimates, particularly over short windows. These findings provide a methodological basis for more consistent interpretation and comparison of soil stability estimates across explicitly defined observation periods. Considering window length, the behavior of the mean and standard deviation, and prediction uncertainty together may improve the use of stability indicators in soil assessments.
Author Contributions
Conceptualization, F.H., W.S., G.F. and H.Q.; methodology, F.H., W.S., G.F. and H.Q.; software, F.H. and H.Q.; validation, F.H., L.W., M.F. and H.Q.; formal analysis, F.H. and H.Q.; investigation, F.H., L.W., M.F., D.Y., D.Q., X.D. and H.W.; resources, W.S. and G.F.; data curation, F.H., L.W., M.F. and H.Q.; writing—original draft preparation, F.H. and H.Q.; writing—review and editing, F.H., W.S., G.F., H.Q., L.W., M.F., D.Y., D.Q., X.D. and H.W.; visualization, F.H. and H.Q.; supervision, W.S., G.F. and H.Q.; project administration, W.S. and G.F.; funding acquisition, W.S. and G.F. All authors have read and agreed to the published version of the manuscript.
Funding
This research was funded by the Xizang Autonomous Region Science and Technology Project, grant numbers XZ202401JD0029, XZ202601ZY0145, XZ202501ZY0086, and XZ202501ZY0056; the Lhasa Science and Technology Plan Project, grant number LSKJ202422; the National Natural Science Foundation of China, grant number 31600432; the Youth Innovation Promotion Association of the Chinese Academy of Sciences, grant number 2020054; the Scientific Research Project of the Department of Education of Hunan Province, grant number 25C0359; and the Teaching Reform Research Project of Hunan University of Technology, grant number 2026YB24.
Data Availability Statement
The data supporting the findings of this study are available from the corresponding author upon reasonable request.
Conflicts of Interest
The authors declare no conflicts of interest.
References
- Wagg, C.; Roscher, C.; Weigelt, A.; Vogel, A.; Ebeling, A.; de Luca, E.; Roeder, A.; Kleinspehn, C.; Temperton, V.M.; Meyer, S.T.; et al. Biodiversity–stability relationships strengthen over time in a long-term grassland experiment. Nat. Commun. 2022, 13, 7752. [Google Scholar] [CrossRef] [Scilit] [PubMed]
- Meng, Y.; Li, S.-P.; Wang, S.; Meiners, S.J.; Jiang, L. Scale-dependent changes in ecosystem temporal stability over six decades of succession. Sci. Adv. 2023, 9, eadi1279. [Google Scholar] [CrossRef] [Scilit] [PubMed]
- Loreau, M.; Naeem, S.; Inchausti, P.; Bengtsson, J.; Grime, J.P.; Hector, A.; Hooper, D.U.; Huston, M.A.; Raffaelli, D.; Schmid, B.; et al. Biodiversity and Ecosystem Functioning: Current Knowledge and Future Challenges. Science 2001, 294, 804–808. [Google Scholar] [CrossRef] [Scilit] [PubMed]
- Lisner, A.; Segrestin, J.; Konečná, M.; Blažek, P.; Janíková, E.; Applová, M.; Švancárová, T.; Lepš, J. Why are plant communities stable? Disentangling the role of dominance, asynchrony and averaging effect following realistic species loss scenario. J. Ecol. 2024, 112, 1832–1841. [Google Scholar] [CrossRef] [Scilit]
- Ma, X.; Ma, W.; Wang, C.; Xu, Y. Nitrogen and phosphorus supply controls stability of soil organic carbon in alpine meadow of the Qinghai-Tibetan Plateau. Agric. Ecosyst. Environ. 2025, 379, 109336. [Google Scholar] [CrossRef] [Scilit]
- Liang, M.; Yang, Q.; Chase, J.M.; Isbell, F.; Loreau, M.; Schmid, B.; Seabloom, E.W.; Tilman, D.; Wang, S. Unifying spatial scaling laws of biodiversity and ecosystem stability. Science 2025, 387, eadl2373. [Google Scholar] [CrossRef] [Scilit] [PubMed]
- Wang, G.; Hu, N.; Hautier, Y.; Middleton, B.A.; Wang, M.; Zhao, M.; Meng, J.; Ma, Z.; Liu, B.; Liu, Y.; et al. Biotic and Abiotic Drivers of Ecosystem Temporal Stability in Herbaceous Wetlands in China. Glob. Change Biol. 2025, 31, e70056. [Google Scholar] [CrossRef] [Scilit] [PubMed]
- Sheng, J.; Zhou, M.; Guo, Y.; Yuan, Y.; Li, X.; Zhang, W.-H.; Bai, W. Aboveground productivity and community stability tend to keep stable under long-term fencing and nitrogen fertilization on restoration of degraded grassland. Ecol. Indic. 2022, 140, 108971. [Google Scholar] [CrossRef] [Scilit]
- Wang, C.; Wang, J.; Zhang, F.; Yang, Y.; Luo, F.; Li, Y.; Li, J. Stability response of alpine meadow communities to temperature and precipitation changes on the Northern Tibetan Plateau. Ecol. Evol. 2022, 12, e8592. [Google Scholar] [CrossRef] [Scilit] [PubMed]
- Li, L.; He, X.Z.; Sun, Y.; Xiao, T.; Liu, Y.; Hou, F. Legacy effects of grazing and nitrogen fertilization on soil carbon, nitrogen and phosphorus in an alpine meadow on the Qinghai-Tibetan Plateau. Eur. J. Soil Biol. 2025, 124, 103704. [Google Scholar] [CrossRef] [Scilit]
- Lei, J.; Li, C.; Yang, W.; Yang, X.; Xing, X.; Feng, X. Assessment of ecological drought vulnerability of the Qinghai-Tibet Plateau from 2003 to 2022 based on multi-source data. CATENA 2024, 247, 108512. [Google Scholar] [CrossRef] [Scilit]
- Wu, K.; Hu, Z.; Wang, X.; Chen, J.; Yang, H.; Yuan, W. Widespread increase in sensitivity of vegetation growth to climate variability on the Tibetan Plateau. Agric. For. Meteorol. 2024, 358, 110260. [Google Scholar] [CrossRef] [Scilit]
- Ding, R.; Qin, Y.; Li, T.; Fu, G. Exploring spatiotemporal dynamics in temporal stability of soil carbon, nitrogen, phosphorus, and pH in Tibetan grasslands. Geoderma 2024, 451, 117062. [Google Scholar] [CrossRef] [Scilit]
- Chen, B.; Zhang, X.; Tao, J.; Wu, J.; Wang, J.; Shi, P.; Zhang, Y.; Yu, C. The impact of climate change and anthropogenic activities on alpine grassland over the Qinghai-Tibet Plateau. Agric. For. Meteorol. 2014, 189–190, 11–18. [Google Scholar] [CrossRef] [Scilit]
- Sun, W.; Li, S.; Zhang, G.; Fu, G.; Qi, H.; Li, T. Effects of climate change and anthropogenic activities on soil pH in grassland regions on the Tibetan Plateau. Glob. Ecol. Conserv. 2023, 45, e02532. [Google Scholar] [CrossRef] [Scilit]
- Zhang, G.; Fu, G. Changes in soil organic carbon, total nitrogen and total phosphorus in 2000–2020 and their driving mechanisms in Tibetan alpine grasslands. Glob. Planet. Change 2024, 239, 104484. [Google Scholar] [CrossRef] [Scilit]
- Jiang, Y.; Yang, K.; Qi, Y.; Zhou, X.; He, J.; Lu, H.; Li, X.; Chen, Y.; Li, X.; Zhou, B.; et al. TPHiPr: A long-term (1979–2020) high-accuracy precipitation dataset (1/30°, daily) for the Third Pole region based on high-resolution atmospheric modeling and dense observations. Earth Syst. Sci. Data 2023, 15, 621–638. [Google Scholar] [CrossRef] [Scilit]
- Yang, K.; Jiang, Y.; Tang, W.; He, J.; Shao, C.; Zhou, X.; Lu, H.; Chen, Y.; Li, X.; Shi, J. A High-Resolution Near-Surface Meteorological Forcing Dataset for the Third Pole Region (TPMFD, 1979–2023); Dataset; National Tibetan Plateau/Third Pole Environment Data Center: Beijing, China, 2023; Available online: https://cstr.cn/18406.11.Atmos.tpdc.300398 (accessed on 15 June 2025).
- Fu, G.; Sun, W. A multi-temporal window framework reveals the temporal-scale-dependent stability of soil microbiomes under warming. Commun. Earth Environ. 2026, 7, 476. [Google Scholar] [CrossRef] [Scilit]
- Reason, C.J.C. Low-frequency variability in the Botswana High and southern African regional climate. Theor. Appl. Climatol. 2019, 137, 1335. [Google Scholar] [CrossRef] [Scilit]
- Ibebuchi, C.C.; Obarein, O.A. High and low-frequency climate modes associated with sub-seasonal sea surface temperature variability in the Gulf of Guinea. Theor. Appl. Climatol. 2025, 156, 157. [Google Scholar] [CrossRef] [Scilit]
- Canarini, A.; Schmidt, H.; Fuchslueger, L.; Martin, V.; Herbold, C.W.; Zezula, D.; Gündler, P.; Hasibeder, R.; Jecmenica, M.; Bahn, M.; et al. Ecological memory of recurrent drought modifies soil processes via changes in soil microbial community. Nat. Commun. 2021, 12, 5308. [Google Scholar] [CrossRef] [Scilit] [PubMed]
- Schaefer, V.H. Remembering our roots: A possible connection between loss of ecological memory, alien invasions and ecological restoration. Urban Ecosyst. 2011, 14, 35–44. [Google Scholar] [CrossRef] [Scilit]
- Zheng, J.; Jin, X.; Li, Q.; Lang, J.; Yin, X. Soil moisture variation and affecting factors analysis in the Zhangjiakou–Chengde district based on modified temperature vegetation dryness index. Ecol. Indic. 2024, 168, 112775. [Google Scholar] [CrossRef] [Scilit]
- Wentz, F.J.; Ricciardulli, L.; Hilburn, K.; Mears, C. How Much More Rain Will Global Warming Bring? Science 2007, 317, 233–235. [Google Scholar] [CrossRef] [Scilit] [PubMed]
- Jia, Y.; Feng, Y.; Zhang, X.; Sun, X. Multifractal Analysis of Temporal Variation in Soil Pore Distribution. Agronomy 2025, 15, 37. [Google Scholar] [CrossRef] [Scilit]
- Zhang, S.; Shao, M. Temporal stability of soil moisture in an oasis of northwestern China. Hydrol. Process. 2017, 31, 2725–2736. [Google Scholar] [CrossRef] [Scilit]
- Chen, W.; Wang, S.; Qi, T.; Jiao, L.; Wang, C.; Maierdang, K.; Li, Z.; Fu, B. Spatiotemporal dynamics and temporal stability of soil moisture at black locust plantations with different restoration years on hilly region of the loess plateau, China. Acta Ecol. Sin. 2021, 41, 5643–5657. [Google Scholar] [CrossRef] [Scilit]
- Lin, P.F.; Zhu, X.; He, Z.B.; Du, J.; Chen, L.F. Research progress on soil moisture temporal stability. Acta Ecol. Sin. 2018, 38, 3403–3413. [Google Scholar] [CrossRef] [Scilit]
- Liu, Y.; Yang, Y. Detecting a Declining Trend of Multidepth Soil Moisture over the Mongolian Plateau from 1950 to 2020 Using ERA5-Land Reanalysis Datasets. IEEE Access 2022, 10, 95509–95526. [Google Scholar] [CrossRef] [Scilit]
- Tang, H.; Li, C.; Cheng, K.; Wen, L.; Shi, L.; Li, W.; Xiao, X. Impacts of short-term tillage and crop residue incorporation managements on soil microbial community in a double-cropping rice field. Sci. Rep. 2022, 12, 2093. [Google Scholar] [CrossRef] [Scilit] [PubMed]
Disclaimer/Publisher’s Note: The statements, opinions and data contained in all publications are solely those of the individual author(s) and contributor(s) and not of MDPI and/or the editor(s). MDPI and/or the editor(s) disclaim responsibility for any injury to people or property resulting from any ideas, methods, instructions or products referred to in the content. |
© 2026 by the authors. Licensee MDPI, Basel, Switzerland. This article is an open access article distributed under the terms and conditions of the Creative Commons Attribution (CC BY) license.