


Abstract
Fusarium wilt of banana, caused by Fusarium oxysporum f. sp. cubense (Foc), threatens global production, and although several fungicides inhibit Foc under controlled conditions, none provides reliable field control. We evaluated two complete chitosan oligosaccharide (COS)-based nanocarrier formulations, loaded with Rubia tinctorum or Uncaria tomentosa extracts, against Foc subtropical and tropical race 4 (STR4, TR4) in vitro, and against TR4 in a preliminary plant assay. Both formulations inhibited both races, with EC50 values of 320.0–571.7 µg·mL−1 and no difference in potency between them. In a descriptive time-kill assay with two tubes per condition, no colonies were recovered from 48 h onwards with the R. tinctorum formulation, whereas the U. tomentosa formulation still yielded 3–7 CFU·mL−1 at 72 h. Applied as a single root dip to TR4-challenged ‘Grand Nain’ plants, in one controlled-environment run of nine plants per treatment, with one tray and one application batch per treatment, the R. tinctorum formulation gave a standardized area under the disease progress curve 34.9% lower than the inoculated control, whereas the 7.8% difference for U. tomentosa was not distinguishable from that control; incidence remained 100% in every inoculated group. The plant comparison is an observation to be confirmed rather than a replicated estimate of efficacy, and cannot be attributed to any single formulation component; it identifies the R. tinctorum formulation as the candidate for independently replicated testing.
1. Introduction
Banana (Musa spp.) ranks among the most important fruit and cash crops globally in terms of production volume and international trade [1]. Cultivated in more than 130 countries across tropical and subtropical regions, hundreds of millions of people depend on bananas for food security and income generation [2]. Global banana production is 117 million tonnes across 5.5 million hectares, and it is projected to grow at 1.5% annually, reaching 135 million tonnes by 2028 [1]. In the Canary Islands, the main banana-producing area within the European Union, banana cultivation represents the predominant intensive agricultural system, with about 9100 ha [3] and more than 8000 producers [4].
Banana production in major growing regions faces diverse biotic and abiotic stresses [2]. Among the biotic constraints, Fusarium wilt of banana (FWB) stands as one of the most destructive diseases affecting this crop, with an estimated affected area of 100,000 hectares and economic losses approaching US $2 billion [5]. The causal agent, the soil-borne fungus Fusarium oxysporum f. sp. cubense (Foc), infects banana roots, progresses into the xylem of the rhizome, induces wilt symptoms, and may eventually kill susceptible cultivars [6]. Four recognized races of Foc are traditionally identified based on their reaction to different host cultivars [2]. Race 1 targets Gros Michel, Silk, Lady Finger, and related cultivars, having caused the decline of Gros Michel’s commercial dominance in the 1950s [6]. Race 2 affects cooking bananas, including Monthan and Bluggoe varieties, while Race 3 remains non-pathogenic in bananas, exclusively attacking Heliconia species [2]. Race 4 impacts Cavendish (AAA genome) and cultivars susceptible to Races 1 and 2 [7]. Race 4 is subdivided into subtropical (STR4) and tropical (TR4) races based on climatic adaptation and virulence [7]. Whereas STR4 requires predisposing factors such as cold stress to cause disease, TR4 triggers symptoms in Cavendish bananas under a broad range of environmental conditions, representing the most virulent form of the pathogen [7]. The TR4 clone emerged in the 1990s in Taiwan and rapidly spread throughout Southeast Asia, China, Australia, India, Pakistan, the Middle East, and Africa (Mozambique, Mayotte, and Comoros) [8]. More recently, TR4 has been recorded in the Americas, where the EPPO Global Database lists it as present with a restricted distribution in Colombia, Venezuela, and Ecuador, and as present with few occurrences in Peru, raising significant concern among producers and the global banana industry [9,10].
Control of FWB presents exceptional challenges for multiple reasons [5]. First, Foc persists extensively in soil even in the absence of host plants and can survive within asymptomatic alternate hosts [7]. Second, as a vascular pathogen, it becomes inaccessible to many control measures once established within the xylem [5]. Third, the pathogen spreads readily through vegetative propagation material, contaminated soil, workers, machinery, irrigation water, and other vectors [2]. Although breeding efforts have produced some commercially available banana varieties with meaningful TR4 resistance and acceptable agronomic and fruit-quality traits, no variety has yet become a universally adopted, export-grade replacement that combines consistently high TR4 resistance with all the desirable traits of Cavendish across growing regions [11].
In the Canary Islands, FWB incidence ranges from 2 to 12%, with occasional outbreaks affecting up to 30% of plants in certain areas [8]. Fortunately, the highly virulent TR4 variant has not yet been detected in the archipelago, although STR4 attacks have been documented [8]. Nevertheless, substantial concern exists among Canarian producers and authorities regarding the potential introduction of the highly virulent TR4 [12]. The banana industry in the Canary Islands predominantly relies on the Dwarf Cavendish AAA cultivar (‘Pequeña Enana’), which is susceptible to TR4. Current management practices against STR4 in the Canary Islands include soil amendments with calcium hydroxide, antifungal treatments employing zinc sulfate or silicon, maintenance of soil organic matter content above 3%, and application of plant defense elicitors [12]. Despite rigorous exclusion measures, including quarantine and material certification to prevent TR4 introduction, the Canarian banana industry must prepare for potential TR4 arrival [8].
Given environmental concerns and increasing regulatory restrictions on synthetic fungicides, bioactive natural products from plant sources have emerged as promising alternatives for crop protection [13]. Numerous plant extracts and essential oils have shown antifungal activity against Foc and other soil-borne pathogens, although field performance often remains inconsistent [14,15]. Within this framework, two plant sources showing particular promise are Rubia tinctorum L. (dyer’s madder) and Uncaria tomentosa (Willd. ex Schult.) DC. (cat’s claw). Rubia tinctorum roots are rich in anthraquinones such as alizarin and purpurin, which demonstrate significant antifungal activity [16]. Similarly, U. tomentosa bark contains bioactive compounds including alkaloids, quinovic acid glycosides, and polyphenols exhibiting antimicrobial properties [17]. However, direct application of plant extracts faces challenges, including rapid degradation of active compounds, limited bioavailability, and poor water solubility [18].
Nanotechnology offers solutions through nanocarriers (NCs) that enable efficient transport of biologically active molecules and allow controlled release over time [19]. Chitosan-based NCs have garnered significant attention due to chitosan’s biodegradability, biocompatibility, and intrinsic antimicrobial properties [19]. Advanced NC systems incorporating graphitic carbon nitride (g-C3N4) show particular promise due to unique properties including low toxicity, excellent biocompatibility, and efficient encapsulation capabilities [20]. Similarly, hydroxyapatite (HAp) has been successfully employed as a delivery agent for bioactive compounds due to its biodegradability and biocompatibility [21].
For plant extracts, encapsulation is expected to address the limitations of free application noted above in three ways [18]. The first is stability: embedding the extract in a polymer matrix shields labile phytochemicals from photodegradation, oxidation and microbial breakdown before and after application. The second is availability at the target: poorly water-soluble constituents are dispersed as nanoscale particles in an aqueous suspension, and the cationic chitosan surface favors adhesion to the negatively charged surfaces of roots and fungal cells, bringing the active compounds into contact with the pathogen. The third is release: the extract is released progressively as the matrix swells, dissolves or is degraded enzymatically, instead of being presented as a single pulse that is rapidly diluted, adsorbed or degraded in the substrate. Chitosan also contributes elicitor activity of its own, in addition to the antimicrobial properties noted above [19]. These properties are particularly relevant to TR4, a soil-borne pathogen that enters through the roots and, once established in the xylem, is beyond the reach of most control measures [5]: a formulation applied to the roots at transplanting places the active compounds where infection begins, at a stage at which planting material is handled in any case. High encapsulation efficiencies and enzyme-triggered release have been reported for the carrier systems used here (Section 3.1). Whether these expected advantages over free extracts are realized against Foc was not tested in the present study, which evaluated the complete formulations only (Section 2.4.4).
Given the critical threat posed by Foc TR4 to global banana production and the limitations of conventional control methods, this study aimed to evaluate the antifungal activity of two previously developed chitosan oligosaccharide (COS)-based nanocarrier formulations loaded with plant extracts (COS-g-C3N4 NCs loaded with R. tinctorum extract and COS-HAp-g-C3N4 NCs loaded with U. tomentosa extract) against Foc STR4 and TR4, and to conduct a preliminary assessment of their efficacy against TR4 in banana plants under controlled conditions. Time-kill profiles and plant physiological and growth variables were examined as secondary or exploratory outcomes.
We tested two hypotheses. First, that both complete extract-loaded formulations would inhibit Foc STR4 and TR4 in vitro; second, that both would reduce disease progression in inoculated banana plants under controlled conditions.
2. Materials and Methods
2.1. Reagents
High molecular weight chitosan (CAS No. 9012-76-4; MW: 310,000–375,000 Da) was supplied by Hangzhou Simit Chem. & Tech. Co. (Hangzhou, China). Melamine cyanurate (CAS No. 37640-57-6; >99.0%) was purchased from Nachmann S.r.l. (Milano, Italy). NeutraseTM 0.8 L enzyme was supplied by Novonesis (Bagsværd, Denmark). All other reagents were obtained from Sigma-Aldrich Química (Madrid, Spain).
2.2. Fungal Isolates
The fungal isolates used were Fusarium oxysporum f. sp. cubense (Foc) subtropical race 4 (STR4, indigenous Canarian strain 3GI-I, vegetative compatibility group (VCG) 0120, isolated from banana stem) and Foc tropical race 4 (TR4, isolate 54006II5, VCG 01213/16, supplied by Prof. Antonio Di Pietro, University of Córdoba, Spain).
2.3. Plant Material and Preparation of Extracts
Rubia tinctorum specimens were collected from the banks of the Carrión River in Palencia, Spain. Preparation and characterization of the hydromethanolic extract followed the methodology described by Langa-Lomba et al. [16]. Uncaria tomentosa bark specimens were collected in La Merced (Chanchamayo, Perú). Aqueous ammonia extracts were prepared according to Sánchez-Hernández et al. [17]. Phytochemical profiles of both extracts have been previously characterized and reported in detail elsewhere [16,17].
In vitro propagated banana plants of the ‘Grand Nain’ Cavendish (AAA genome) cultivar, provided by CULTESA (Cultivos y Tecnología Agraria de Tenerife S.A., Tenerife, Spain), were used to assess the performance of the COS-based NCs and to determine their potential to mitigate FWB. This Cavendish variety was selected for an in-plant experiment instead of the predominant cultivar in the Canary Islands (Dwarf Cavendish) because it is one of the most widely used in banana-growing regions worldwide. Dwarf Cavendish and ‘Grand Nain’ differ primarily in size and productivity.
2.4. Synthesis and Characterization of Nanocarriers
2.4.1. Preparation of Nanocarrier Constituents
Chitosan oligomers (COS, average MW < 2 kDa, polydispersity index 1.6) were prepared according to Santiago-Aliste et al. [22]. High molecular weight chitosan was dissolved in citric acid under constant stirring at 60 °C, and NeutraseTM enzyme (Bagsværd, Denmark) was used to degrade polymer chains. High-purity nanosheets of g-C3N4 were obtained from pyrolysis of melamine cyanurate in a capped crucible under an air atmosphere at 600 °C for 50 min [23]. Hydroxyapatite was prepared by wet chemical precipitation using H3PO4 solution with Ca(OH)2 according to Santiago-Aliste et al. [24].
2.4.2. Synthesis of COS-g-C3N4 Nanocarriers
Preparation of COS-g-C3N4 NCs was performed as described by Santiago-Aliste et al. [22] and in Spanish patent ES2958909 (international patent WO 2024/018098 A1). Methacrylated chitosan and g-C3N4 were prepared separately and combined to obtain a COS:g-C3N4 weight ratio of 1:0.5.
2.4.3. Synthesis of COS-HAp-g-C3N4 Nanocarriers
COS-HAp-g-C3N4 NCs were prepared following Santiago-Aliste et al. [24] and Spanish patent ES2991400 (WO 2024/246386 A1), resulting in a COS:HAp:g-C3N4 weight ratio of 2:1:0.5.
2.4.4. Encapsulation of Plant Extracts in Nanocarriers
For encapsulation of R. tinctorum extract in COS-g-C3N4 NCs, lyophilized extract was added to obtain a COS:g-C3N4:R. tinctorum weight ratio of 1:0.5:0.25 (14.3% extract w/w) [24]. For U. tomentosa extract in COS-HAp-g-C3N4 NCs, the weight ratio was 2:1:0.5:1 (22.2% extract w/w) [24]. Mixtures were sonicated for 1 h while maintaining the temperature below 60 °C and pH at 4–5. Only the two complete extract-loaded formulations were evaluated in this study. The design did not include the corresponding free plant extracts, unloaded nanocarriers, free COS, or a factorial comparison in which both extracts were loaded into the same carrier matrix. Consequently, the study evaluates the activity of the formulations as prepared and does not isolate the contribution of nanoencapsulation, the carrier matrix, COS, or the plant extract.
2.4.5. Characterization of Nanocarriers
These carrier systems had previously been characterized using transmission electron microscopy, energy-dispersive X-ray spectroscopy, Fourier-transform infrared spectroscopy, and X-ray powder diffraction [22,24]. Encapsulation efficiency and release efficiency were not measured on the material used here; the values quoted in Section 3.1 are those previously reported for these carrier systems, determined by the methodology described therein [22,24].
The particle size distribution of the two extract-loaded formulations used in the present experiments was additionally determined by dynamic light scattering on a Zetasizer Advance Pro Red Label (Malvern Panalytical, Malvern, Worcestershire, UK). Aqueous suspensions of each formulation were passed through a 0.45 µm hydrophilic nylon syringe filter and measured at 25 °C (dispersant, water; refractive index 1.330), with three measurement runs on a single preparation of each formulation; because the filtration step removes material coarser than 0.45 µm, the values describe the filterable fraction of each suspension. Zeta potential, colloidal stability over time, and behavior in substrate or in the presence of root exudates were not determined, and, as noted above, the encapsulation and release efficiencies are those previously reported for these carrier systems [22,24] rather than measurements on the present material.
2.5. In Vitro Antifungal Assays of Chitosan Nanocarriers
2.5.1. Effective Concentration Determination
Antifungal activity was evaluated against Foc STR4 and TR4 using the agar dilution method adapted from European Committee on Antimicrobial Susceptibility Testing procedures. Stock solutions of NCs loaded with plant extracts were sonicated for 4 min at 100 W and then incorporated into potato dextrose agar (PDA) medium, after autoclaving and cooling to approximately 50 °C, to achieve concentrations ranging from 62.5 to 1500 µg·mL−1. Fungal mycelium plugs (5 mm diameter) from the margins of 1-week-old cultures were transferred to plates. Three plates per treatment and concentration were prepared in each of two independent experiments, giving six independent plates per treatment × concentration combination; the plate was the experimental unit. Plates were incubated at 25 °C in darkness for 6 days.
Mycelial growth was evaluated by measuring the average colony diameter. Growth inhibition was calculated as: Inhibition (%) = ((d0 − dt)/d0) × 100, where d0 and dt represent the mean colony diameter of the untreated control and treated fungal colony, respectively. Effective concentrations (EC50 and EC90) were estimated by fitting a two-parameter log-logistic model to the plate-level inhibition data, as detailed in Section 2.7.
2.5.2. Time-Kill Kinetics Assay
Time-kill kinetics assays were performed at 3000 µg·mL−1 for both NC formulations against Foc STR4 and TR4 strains. Fungal inoculum was prepared by growing isolates in potato dextrose broth (PDB) for 4 days at 25 °C with shaking at 150 rpm, filtering the cultures, counting conidia, and storing aliquots in 33% glycerol at a concentration of 100 CFU·µL−1, which were maintained at −80 °C until use. For each assay tube, 5 µL of this stock (≈500 conidia in 3 mL PDB) was added, yielding an initial inoculum of approximately 1.7 × 10² CFU·mL−1.
Samples were collected at 0, 24, 48, and 72 h post-treatment. At each time point, aliquots were serially diluted, and 100 µL of each dilution was plated onto PDA. Plates were incubated at 25 °C for 3 days before colony enumeration. Two independent time-kill tubes were prepared per Treatment × Strain combination, the tube being the experimental unit, and three plates were seeded per dilution and tube. These plates are technical subsamples, so a single CFU·mL−1 estimate was obtained for each tube as the mean of its three plates, yielding n = 2 independent observations per Strain × Treatment × Time combination. Results were expressed as CFU·mL−1, and log10 reduction was calculated relative to positive controls.
Aliquots were plated undiluted at 0, 24 and 72 h and at a 10−1 dilution at 48 h; the dilution plated is recorded for every tube in the accompanying data, and all reported CFU·mL−1 values are derived from the recorded dilution. The limit of detection is therefore not constant across the time course: a single colony on an undiluted plate corresponds to 10 CFU·mL−1, or 3.3 CFU·mL−1 as the mean of the three technical plates, whereas on a 10−1 plate it corresponds to 100 and 33 CFU·mL−1, respectively. Log10 reductions obtained from combinations in which no colony was recovered were calculated with a count of zero and therefore exceed the reduction that the data can guarantee, which is set by the limit of detection at the dilution actually plated; neither value is a measurement of complete elimination. No neutralization or washing step was applied before plating. The plated aliquot nevertheless carries very little formulation onto the recovery plate: 100 µL of a suspension at 3000 µg·mL−1 delivers at most 300 µg to approximately 20 mL of PDA, that is ≤15 µg·mL−1 for undiluted aliquots and ≤1.5 µg·mL−1 at the 10−1 dilution, against a lowest assayed concentration of 62.5 µg·mL−1 in the agar dilution experiment, which inhibited growth by 2.0–8.4%, and EC50 values of 320.0–571.7 µg·mL−1.
2.5.3. Reference Fungicide Assay with Fosetyl-Al
To contextualize the potency of the extract-loaded NCs, the sensitivity of Foc STR4 and TR4 to fosetyl-Al, used as a reference fungicide, was assessed in a parallel mycelial growth inhibition assay. Fosbel® (PROBELTE S.A.U., Molina de Segura, Murcia, Spain; a commercial formulation containing 80% (w/w) fosetyl-Al) was supplied by the Servicio de Sanidad Vegetal y Certificación of the Gobierno de Aragón. Mature mycelial plugs (5 mm diameter, taken from cultures older than 7 days) were transferred to the center of PDA plates amended with fosetyl-Al at nine concentrations (62.5, 125, 250, 500, 750, 1000, 1500, 2000, and 3000 µg·mL−1) plus an untreated control (0 µg·mL−1). Fosetyl-Al concentrations are expressed as mg·L−1 of active ingredient in the final medium; the mass of Fosbel® weighed was corrected for its 80% (w/w) fosetyl-Al content. Two perpendicular radii were measured on each plate; for STR4, four plates per concentration were used in each of two independent experiments (n = 8 plates), and for TR4, three plates in each of two independent experiments (n = 6 plates). The two radii of a plate are technical measurements of the same colony and were averaged before analysis, so that the plate was the experimental unit. Plates were incubated at 25 °C in darkness, and radial growth was measured at 5 days post-inoculation (dpi) for STR4, to prevent the colonies from reaching the edge of the plate, and at 6 dpi for the slower-growing TR4, under otherwise identical conditions. Growth inhibition was calculated with respect to the untreated control using the same expression as in the agar dilution assay described above.
Fosetyl-Al was selected for three reasons: it is a systemic phosphonate in routine use in banana production in the major exporting regions of Latin America, Africa and Asia, mainly against root and pseudostem diseases; reductions in Fusarium wilt severity under controlled conditions have been reported for it [25]; and it was the reference compound used in the earlier characterization of these carrier systems, so that the present values are directly comparable with that work. It is not authorized on banana in Spain, which is part of the reason no synthetic fungicide is currently available to Canarian growers for this disease [26]. Because fosetyl-Al acts substantially through stimulation of host defenses and the release of phosphonate in planta, its in vitro activity underestimates its performance in the plant, and the comparison reported here is an assay benchmark and not a prediction of relative field efficacy. The read times of the two assays also differ: the nanocarrier plates were read at 6 days for both races, whereas fosetyl-Al was read at 5 dpi for STR4 and 6 dpi for TR4, so the TR4 comparison is read-time matched while the STR4 comparison is not.
2.6. Preliminary Growth-Chamber Assessment
2.6.1. Plant Material and Growth Conditions
In vitro propagated banana plants of the ‘Grand Nain’ Cavendish cultivar were transplanted into pots (11 × 11 × 12 cm, one plant per pot), each containing an ad hoc prepared substrate made of peat/sand/vermiculite (1:1:1, v/v/v). The growth-chamber assay consisted of a single experimental run with nine plants per treatment. The peat component included a slow-release fertilizer (Osmocote®; ICL Growing Solutions, Heerlen, The Netherlands) to ensure a uniform nutrient supply during the experiment. At the end of the acclimation period described below, plants were distributed among the trays so that the six groups were balanced for size, vigor, and leaf number, and each tray was then assigned to one treatment; allocation was balanced in this way rather than randomized. Inoculated and non-inoculated treatments were kept in separate trays, since sharing a tray between them carries a risk of cross-contamination through splash and drainage. Tray positions were changed each week, at every assessment, following a fixed rotation in which every tray passed through every position in the chamber, while pot position within a tray remained fixed for the duration of the trial. Treatment is consequently confounded with tray, although the rotation means that no treatment was associated with a particular position; the rotation does not, however, provide independent replication of the treatment, nor does it allow treatment and tray effects to be separated statistically. Each treatment was therefore represented by one tray and one freshly prepared application batch within a single run: the nine plants of a group are observational units within that tray and batch, and not independent replicates of the treatment application. The trays were held in a growth chamber programmed to provide a 14-h photoperiod of fluorescent light (360 µmol photons·m−2·s−1) and subtropical conditions (26/20 °C day/night, humidity 65%). Prior to NCs and/or NCs + Foc treatments, plants were acclimated for approximately 4 weeks (until plants developed 4 or 5 true leaves) in the same growth chamber, maintained under the light, temperature, and relative humidity settings detailed above and watered with approximately 75 mL every 48 h.
2.6.2. Inoculation and Treatment Protocol
Six treatment groups were established with 9 plants per group: (1) non-inoculated control (healthy), (2) COS-g-C3N4-R. tinctorum (Rubia), (3) COS-HAp-g-C3N4-U. tomentosa (Uncaria), (4) Foc-inoculated control (Foc), (5) Foc-inoculated + COS-g-C3N4-R. tinctorum NCs (Rubia + Foc), and (6) Foc-inoculated + COS-HAp-g-C3N4-U. tomentosa NCs (Uncaria + Foc). This experiment was performed under non-gnotobiotic conditions to mimic more realistic, naturally occurring microbial environments. The COS-NCs-plant extract concentration applied to banana plants was twice the dose that caused complete inhibition of fungal growth in the agar dilution assay to compensate for adsorption, dilution, microbial degradation, and reduced bioavailability of the NC–extract formulations within the substrate–root system; the dose retained on the roots and the resulting local concentration were not measured.
For NC treatments, root systems were carefully uprooted to remove residual substrate, their roots thoroughly washed in mains tap water (Córdoba municipal supply; chloride content typically 10–20 mg·L−1, an order of magnitude below the 250 mg·L−1 statutory limit; residual free chlorine was not measured) without intentional wounding, subsequently immersed for 2 min in 700 mL of NC suspension (3000 µg·mL−1 in distilled water). Each batch of nine plants was treated with a single 700 mL aliquot of freshly prepared NC suspension, which was gently agitated throughout the immersion to maintain particle dispersion; the suspension was not reused between batches, giving a nominal 2.1 g of formulation per batch, or 78 mL of suspension per plant. Plants were then individually transplanted into polypropylene pots containing the substrate. Roots of control plants were dipped in water. Two hours after NC applications, plants were challenged with the pathogen by adding 150 mL per pot of the Foc TR4 conidial suspension. This fungal inoculum was prepared by growing Foc TR4 in PDB for 4 days at 25 °C with shaking at 150 rpm, followed by filtration through sterile cheesecloth. Inoculum concentration was adjusted to 1 × 10⁶ conidia·mL−1 using a hemocytometer. Non-inoculated plants (treatments (1), (2), and (3)) were watered with 150 mL of water. Plants received a recovery period of 18 h at reduced light intensity before returning to standard growth conditions. The inoculum titer was set by hemocytometer count and was not additionally verified by plate count after adjustment. Irrigation was withheld for 48 h before inoculation, so that the substrate was dry at transplanting, without the plants showing symptoms of stress; the roots were wetted by the 2-min dip, and the inoculum or water drench was then applied to dry substrate.
Root preparation was carried out by three operators working simultaneously on the nine plants of a treatment, so that only a few minutes elapsed between rinsing and immersion. Control plants underwent the identical handling sequence, including a 2-min immersion in water, so that handling was matched across all six groups. At the nominally equal formulation concentration of 3000 µg·mL−1, the delivered extract concentrations were not equal: 429 µg·mL−1 for the R. tinctorum formulation (14.3% loading) and 666 µg·mL−1 for the U. tomentosa formulation (22.2% loading). The common concentration was set on total formulation mass, at twice the concentration that completely inhibited growth of both isolates in the agar dilution assay, so that the two finished preparations were applied at the same nominal rate, as they would be in use. Matching the extract dose instead would have required different masses of carrier material to be applied. Neither normalization can isolate the contribution of the extract while carrier composition and extract identity differ together, so the two plant groups are not a controlled comparison of extract identity alone. The figure of 78 mL per plant is the batch volume divided by nine and not a measured per-plant dose; the amount of formulation retained by the roots, its concentration in the rhizosphere, its persistence, and its release were not quantified. The nanocarrier suspensions were prepared in distilled water, and all water used to prepare treatment suspensions and conidial inocula was held under agitation for 24 h before use so that any residual chlorine would dissipate.
2.6.3. Disease Severity Assessment
Disease severity was evaluated at approximately 7-day intervals from 11 to 79 days post-inoculation (DPI) using a discrete ordinal scale from 0 to 4 in increments of 0.5 (a nine-point scale), according to the percentage of affected leaves and pseudostem (0, no symptoms; 1, 1–33%; 2, 34–66%; 3, 67–100%; 4, dead plant). Intermediate values (0.5, 1.5, 2.5 and 3.5) were recorded when symptoms fell between adjacent categories. Scores were carried forward: once a plant reached a given severity, it retained that value for the rest of the trial, even if it later produced new healthy growth (re-sprouting was first observed at 58 DPI).
The variable so defined is the maximum severity attained up to each assessment: a cumulative measure of irreversible damage rather than the visible condition of the plant on the day. The convention was adopted because Foc is a vascular pathogen whose colonization of the rhizome is not reversed, so that re-sprouting proceeds from a corm that remains infected. Re-sprouting was observed in all three inoculated groups; in every case the plant was at or close to collapse and what emerged was one or a few, generally deformed, leaves, with no plant recovering the appearance of a healthy plant or resuming normal development. Plant-level regrowth and an index of irreversible tissue damage were not recorded as separate variables. Severity was scored by two people: one, the same individual throughout the trial, assessed the symptoms, and the second recorded the scores. Plants carried numeric labels only, and only the recorder held the key linking numbers to treatments, so the assessor was unaware of treatment identity at every assessment date. Internal tissues were documented photographically at harvest in two plants per treatment; vascular discoloration of the corm and rhizome was not scored on a quantitative index such as the rhizome discoloration index of the INIBAP evaluation guidelines [27], and pathogen re-isolation, qPCR, and tissue quantification of the pathogen were not performed.
Additionally, the area under the disease progress curve (AUDPC) was calculated for each plant using the trapezoidal integration method:
where yi is disease severity at assessment i, ti is time in days at assessment i, and n is the total number of assessments. Standardized AUDPC (SAUDPC) was calculated by dividing AUDPC by the duration of the monitoring period (68 days, from 11 to 79 days post-inoculation). The relative reduction in SAUDPC was calculated as: SAUDPC reduction (%) = [1 − (SAUDPC treatment/SAUDPC Foc control)] × 100. AUDPC/SAUDPC over the complete monitoring period was treated as the primary disease outcome; comparisons at individual assessment dates and the additional disease descriptors were supportive or exploratory.
Parameters such as Mortality (M), Disease Incidence (DI), and a Disease Intensity Index (DII) were also calculated for the 6 treatments. Mortality was measured as the percentage of dead plants/treatment at 79 DPI. Disease Incidence was established as the percentage of affected plants at the end of the experiments. Finally, the latter parameter was defined as DII (%) = 100 × (ΣSi × Ni)/(4 × Nt), where Si is the severity of symptoms, Ni is the number of plants with Si symptom severity, and Nt is the total number of plants.
2.6.4. Physiological Parameter Measurements
Several physiological parameters were measured at final harvest (79 DPI) to screen for visible signs of phytotoxicity and for treatment-associated physiological responses in plants treated with the COS-NCs loaded with natural plant extracts. Measurements were conducted on the three most recently fully expanded leaves per plant, designated as leaf 1 (youngest), leaf 2, and leaf 3 (oldest of the three), respectively, to account for the known within-plant gradient in greenness and photosynthetic capacity. Measurements were performed on 9 plants per treatment, on three leaves per plant, with four readings per leaf to reduce microsite variability. The four readings are technical subsamples of the same leaf and were averaged to a single value per leaf and plant before any analysis, so that the plant was the unit of observation (n = 9 per treatment and leaf position). These assessments were performed only on non-inoculated plants (treatments (1), (2), and (3)), as a design decision taken at the outset, the physiological campaign having been planned as a single destructive assessment at final harvest to screen for phytotoxicity and for treatment-associated physiological change. Heterogeneous wilting across the leaves of fungus-inoculated plants would in any case have prevented the acquisition of comparable and standardized measurements, an obstacle that applies with most force to the gas-exchange variables; no leaf optical readings were taken at an earlier time point or in inoculated plants, so the design cannot connect these indices to disease. Measurements were taken between 10:00 and 12:00 h under ambient light on the abaxial leaf surface.
Chlorophyll fluorescence and gas-exchange variables were measured using a LI-600 Porometer/Fluorometer (LI-COR Biosciences, Lincoln, NE, USA). The parameters recorded included the effective quantum yield of photosystem II (ΦPSII), electron transport rate (ETR), stomatal conductance to water vapor (gsw), total leaf conductance (gtw), boundary layer conductance (gbw), apparent transpiration rate (Eapparent), and leaf–air vapor pressure deficit (VPDleaf).
Leaf chlorophyll, flavonoid, and anthocyanin contents, as well as the nitrogen balance index (NBI = Chl/Flav), were quantified using a DUALEX sensor (Force-A, Orsay, France). Measurements were taken on the adaxial surface of the same three leaves (the youngest fully expanded leaf designated as leaf 1), avoiding major veins. Chlorophyll index values are reported per leaf position, while flavonoid, anthocyanin, and NBI values are reported as whole-plant averages.
2.6.5. Growth Parameter Measurements
At the termination of the growth chamber trial (79 DPI), destructive measurements were performed on non-inoculated plants corresponding to (1) control, (2) COS-NCs loaded with R. tinctorum extract, and (3) COS-NCs loaded with U. tomentosa extract treatments. These measurements aimed to characterize treatment-related effects on plant growth, thereby recording whether the COS-NC formulations were associated with visible damage at final harvest and whether morphometric performance differed among treatments.
Parameters measured included Leaf Width (LW) and length for the three youngest fully expanded leaves, Plant Height (PH) from substrate surface to apical meristem, Pseudostem Perimeter (PP) at 5 cm above substrate level, and Pseudostem Diameter (PD). Perimeter was measured with a flexible measuring tape and diameter with a caliper, so the two were obtained independently and by different methods; they are nonetheless correlated measures of pseudostem girth, geometrically related to one another, and both were therefore recorded as complementary descriptors and are interpreted together rather than as independent evidence of a growth response. Plants were carefully uprooted, and all root tissues and adhering substrate were removed. The remaining plant organs (pseudostem, leaves, and corm) were pooled and weighed together to determine fresh weight (FW). Dry Weight (DW) was determined after oven-drying at 70 °C to constant weight (approximately 72 h). In addition to these growth parameters, the presence of visible symptoms commonly associated with phytotoxicity (such as chlorosis (yellowing of leaves) or necrosis (tissue death with darkening and drying)) was qualitatively inspected to rule out any treatment-induced damage. These observations were performed by comparing treated plants (2) and (3) with the untreated control (1).
2.7. Statistical Analysis
All statistical analyses were performed in Python 3.14.6 (NumPy 2.5.1, SciPy 1.18.0, pandas 3.0.5, statsmodels 0.14.6, scikit-posthocs 0.14.0, Matplotlib 3.11.1; the versions pinned in the requirements file of the accompanying data repository). The experimental unit was the plate for the in vitro dose–response assays, and the liquid-culture tube for the time-kill assay. In the growth-chamber trial, the individual plant was the unit of observation, but each treatment was applied once to one tray of nine plants from one freshly prepared suspension batch; the tray and the batch are the units of treatment application and were not replicated. Plant-level comparisons for that trial therefore describe the differences among the plants observed in this run and do not estimate variation between application batches, trays, or runs. Technical subsamples (the two perpendicular radii measured on a plate, the plates seeded from a single tube, and the repeated optical readings taken on a leaf) were averaged to one value per experimental unit before any test. Statistical significance was set at α = 0.05 throughout.
In the agar dilution and reference-fungicide assays, the effect of concentration on colony growth was assessed with the Kruskal–Wallis test, because complete inhibition produced groups with zero variance and precluded parametric testing. Pairwise post hoc comparisons among concentrations are not reported: with six to eight independent plates and ten to eleven concentrations, Bonferroni-corrected pairwise rank tests would have little power to attain α = 0.05 (for an exact Mann–Whitney test with n = 6 versus 6 the smallest attainable p-value is 2/C(12,6) = 2.2 × 10⁻³, that is 0.12 after correction for 55 comparisons), so group means are reported with their 95% confidence intervals instead. Effective concentrations were estimated by fitting a two-parameter log-logistic model, Inhibition = 100/[1 + (x/EC50)−b], where x is the concentration and b is the slope, to the plate-level inhibition data by nonlinear least-squares regression (scipy.optimize.curve_fit); EC90 was derived as EC50 × 91/b. Goodness of fit was assessed with the coefficient of determination (R2), and 95% confidence intervals were obtained from the asymptotic covariance matrix of the estimates, applying the delta method to EC90. Ratios of EC50 values between races and between formulations were compared directly by resampling plates with replacement within each concentration and experiment (2000 resamples), refitting the model on every resample and taking the 2.5th and 97.5th percentiles of the ratio. Because the time-kill assay comprised only two independent tubes per Strain × Treatment × Time combination, no formal between-treatment hypothesis test was applied to it; colony counts are summarized descriptively as the individual tube values, their mean, and the log10 reduction relative to the race- and time-matched control.
For the growth-chamber trial, normality was assessed within each group with the Shapiro–Wilk test and homogeneity of variance with Levene’s test. Where both assumptions held, treatments were compared by one-way analysis of variance followed by Tukey’s honestly significant difference test; otherwise the Kruskal–Wallis test followed by Dunn’s test with Bonferroni correction was used. Both sets of results, and the rule that selected the primary test, are reported for every response in the accompanying data repository. The area under the disease progress curve was the primary outcome; the physiological and growth variables were treated as secondary and exploratory, and no correction was applied across these families of outcomes or across the ten assessment dates; a Benjamini–Hochberg sensitivity analysis across the ten dates is reported separately in Section 3.3.1, so the corresponding p-values should be read accordingly. Each treatment group occupied one tray, and the trays were relocated weekly through every position in the chamber, so that treatment is confounded with tray and no position term could be fitted; plants were allocated to treatments so as to balance initial size and vigor rather than at random. The trial was therefore analyzed with treatment as the only factor and the individual plant as the unit of observation, and without a term for tray or chamber position; as noted above, tray and batch are not replicated, so these tests are conditional on the single run. For the dose–response assays, inhibition was referred to the mean of all untreated control plates of the same strain and formulation; referring it instead to the control plates of the matching experiment changed the fitted EC50 values by less than 0.1%, and the comparison is reported with the accompanying data.
Disease severity is an ordinal score with pronounced floor effects in the non-inoculated groups and ceiling effects in the inoculated control, and was therefore analyzed non-parametrically. Differences among the inoculated treatments at each assessment date, in the final severity and in the area under the disease progress curve were tested by Kruskal–Wallis followed by Dunn’s test with Bonferroni correction, and are expressed as median [interquartile range] alongside means; the temporal course within each treatment was assessed with the Friedman test. As a sensitivity analysis, AUDPC and final severity were also compared by one-way analysis of variance with Tukey’s HSD, which supported the same conclusions. Non-inoculated groups remained symptom-free throughout and had zero variance, so they were excluded from the formal comparisons. The statistical analysis was implemented in Python with the assistance of a generative AI tool (see Acknowledgments). The analysis plan, the definition of the experimental units, and the interpretation of the results were determined by the authors, who checked every reported value against the raw data; the complete data sets and code are provided as Supplementary Materials so that all analyses can be reproduced independently.
3. Results
3.1. Nanocarrier Characterization
Characterization of both NC systems has been previously reported in detail [22,24]. Transmission electron microscopy analysis revealed spherical particles with an average diameter of 85.5 ± 21.3 nm (dispersity index 0.25) for COS-g-C3N4 and 250 ± 84.4 nm (dispersity index 0.34) for COS-HAp-g-C3N4 NCs. Fourier-transform infrared spectroscopy confirmed successful cross-linking of components. Encapsulation efficiency of R. tinctorum extract in COS-g-C3N4 was 95–97%, while U. tomentosa extract showed 82% efficiency in COS-HAp-g-C3N4 NCs. Release efficiency upon enzymatic degradation with chitosanase was 74–81% for R. tinctorum and 84–89% for U. tomentosa extracts.
Dynamic light scattering on the extract-loaded formulations used in the present experiments gave a Z-average diameter of 53.65 ± 0.87 nm with a polydispersity index of 0.330 ± 0.044 for COS-g-C3N4-R. tinctorum, whose main intensity-weighted population was centered at 83.3 nm, and 429.0 ± 1.0 nm with a polydispersity index of 0.490 ± 0.071 for COS-HAp-g-C3N4-U. tomentosa, whose main intensity-weighted population was centered at 209.7 nm (three measurement runs on a single preparation of each formulation, filtered through 0.45 µm). The intensity-weighted modes agree closely with the diameters determined by transmission electron microscopy for these carrier systems, 85.5 ± 21.3 nm and 250 ± 84.4 nm, respectively [22,24]. The Z-average of the hydroxyapatite-containing formulation exceeds its intensity-weighted mode, and its polydispersity index is high, indicating a broad distribution with a coarse tail, whereas that of the g-C3N4 formulation lies below its mode, as expected for a cumulants estimate on a moderately polydisperse population from which material coarser than 0.45 µm has been removed by filtration. Within the filterable fraction of the single preparation measured for each formulation, the intensity-weighted modes differ by a factor of about 2.5; material retained by the filter and variation between preparations were not characterized, so these values describe the formulations only in part.
3.2. In Vitro Antifungal Activity
3.2.1. Effective Concentrations
In vitro antifungal activity of both NC formulations against Foc STR4 and TR4 was clearly concentration-dependent (Figure 1). Colony diameter decreased steadily over the tested range (62.5–1500 µg·mL−1), and the concentration effect was highly significant for every strain × formulation combination (Kruskal–Wallis on plate-level colony diameter, H(10) = 58.5–60.9, p < 0.001 in the four cases). Complete inhibition was reached at 1500 µg·mL−1 for both races with both NC treatments. Effective concentrations estimated from the plate-level dose–response fits are summarized in Table 1, together with the equivalent concentrations of encapsulated plant extract, calculated from the extract loading (14.3% for R. tinctorum, 22.2% for U. tomentosa). Pairwise comparisons among individual concentrations are not reported because the design cannot support them (see Section 2.7); the 95% confidence intervals of the group means are given instead.
Figure 1.
Concentration–response of Fusarium oxysporum f. sp. cubense (Foc) STR4 and TR4 to the two chitosan oligosaccharide (COS)-based nanocarriers and to the reference fungicide fosetyl-Al. (a) COS-g-C3N4-R. tinctorum NCs; (b) COS-HAp-g-C3N4-U. tomentosa NCs; (c) fosetyl-Al. Symbols are means ± SE of independent plates (n = 6 for the nanocarriers; n = 8 for fosetyl-Al against STR4 and n = 6 against TR4); curves are the fitted two-parameter log-logistic models, and the dotted vertical lines mark the corresponding EC50 values. The concentration axis is logarithmic.
Table 1.
Effective concentrations (EC50 and EC90) in µg·mL−1 of nanocarrier treatments against Fusarium oxysporum f. sp. cubense (Foc) STR4 and TR4, estimated from two-parameter log-logistic models fitted to plate-level growth inhibition (n = 6 independent plates per concentration). Values in square brackets are the equivalent concentrations of encapsulated plant extract, obtained from the extract loading of each formulation (14.3% w/w for R. tinctorum and 22.2% w/w for U. tomentosa).
Both formulations were markedly more active against TR4 than against STR4, with EC50 values 37% lower for COS-g-C3N4-R. tinctorum (347.2 vs. 552.7 µg·mL−1) and 44% lower for COS-HAp-g-C3N4-U. tomentosa (320.0 vs. 571.7 µg·mL−1). Resampling the plates confirmed that this race difference is supported by the data: the bootstrap ratio EC50(STR4)/EC50(TR4) was 1.60 (95% CI 1.42–1.80) for the R. tinctorum formulation and 1.79 (1.58–2.01) for the U. tomentosa formulation, both intervals excluding unity. Within each race, by contrast, the two formulations were indistinguishable, with the bootstrap ratio between them including unity in STR4 (0.97; 0.89–1.05) and in TR4 (1.08; 0.93–1.26) (Table 1). On an encapsulated-extract basis, however, the R. tinctorum formulation was the more potent of the two (EC50 of 49.7 and 79.0 µg·mL−1 of extract against TR4 and STR4, versus 71.0 and 126.9 µg·mL−1 for U. tomentosa), since it delivers less extract per unit mass of nanocarrier.
3.2.2. Time-Kill Kinetics
Because the time-kill assay comprised a single liquid-culture tube per treatment, race, and independent experiment, the three plates seeded from each tube were averaged into one CFU·mL−1 estimate, and the results are reported descriptively; each cell of the design therefore rests on two independent observations, which does not support formal hypothesis testing.
At T0, the three groups were indistinguishable in both races (2.00–2.06 log10(CFU·mL−1 + 1)), confirming a homogeneous starting inoculum, and control cultures grew exponentially thereafter, reaching 2.1 × 10⁷–2.5 × 10⁷ CFU·mL−1 (7.34–7.44 log10 units) at 72 h. COS-g-C3N4-R. tinctorum NCs suppressed Foc almost completely within 24 h (0.43 log10 units in both races, corresponding to a single colony recovered from one of the two tubes), and no viable colonies at all were recovered at 48 or 72 h in either race, giving log10 reductions of 6.53–6.80 and 7.34–7.44, respectively (Table 2). Under the assay conditions, this absence of recoverable colonies placed the viable count below the limit of detection of the plating used at each sampling time, which was 33 CFU·mL−1 at 48 h, where a 10−1 dilution was plated, and 3.3 CFU·mL−1 at 72 h, where the aliquots were plated undiluted; relative to these limits, the reductions were at least 5.0–5.3 log10 units at 48 h and 6.7–6.8 log10 units at 72 h, and none of these values is a measurement of complete elimination.
Table 2.
Time-kill kinetics of the nanocarrier treatments (3000 µg·mL−1) against Foc STR4 and TR4. Values are log10(CFU·mL−1 + 1) obtained from the mean of two independent liquid-culture tubes, with the individual tube values in parentheses; each tube value is itself the mean of three technical plates. Log10 reductions are expressed relative to the race- and time-matched control. No formal statistical comparison was performed (n = 2 independent tubes per cell).
COS-HAp-g-C3N4-U. tomentosa NCs lowered viable counts by more than two log10 units at 24 h (2.58–2.59). The subsequent course has to be read against the dilution plated, which was not constant: the 48 h aliquots were plated at a 10−1 dilution, for which a single colony corresponds to 100 CFU·mL−1 and the mean of three technical plates has a floor of 33 CFU·mL−1, whereas the 24 h and 72 h aliquots were plated undiluted, with corresponding values of 10 and 3.3 CFU·mL−1. Against TR4, no colonies were recovered at 48 h, and 3.3–6.7 CFU·mL−1 were counted at 72 h; because that density lies below the detection floor of the 48 h assessment, the two observations are not in conflict, and no regrowth needs to be inferred. Against STR4, the 48 h counts (66.7 CFU·mL−1 in both tubes) correspond to one to two colonies on 10−1 plates and so fall within the granularity of that plating, which accounts for their being nominally higher than the undiluted counts at 24 h (13.3–20 CFU·mL−1). At 72 h, both races yielded 3–7 CFU·mL−1, and the resulting log10 reductions (6.56–6.66) are smaller than those recorded for the R. tinctorum formulation, from which no colonies were recovered at 48 or 72 h. All of these are descriptive comparisons: with two independent tubes per Strain × Treatment × Time combination, no formal test, and every zero bounded by the detection limit of its plating, the assay characterizes the rate at which recoverable viability was lost and does not classify either formulation as fungicidal or fungistatic.
Negative controls (PDB alone and PDB amended with either NC formulation) remained sterile at all sampling times, confirming the absence of contamination, and the two races behaved similarly throughout, so no race-specific difference in the response to either formulation was apparent. These observations are, however, descriptive: with two independent tubes per Strain × Treatment × Time combination, the assay was designed to characterize the kinetics of kill, not to support between-treatment significance testing.
3.2.3. Sensitivity to the Reference Fungicide Fosetyl-Al
Fosetyl-Al caused a strong, concentration-dependent inhibition of mycelial growth in both Foc isolates, read at a different time for each race (Table 3). For STR4, read at 5 dpi, the concentration effect on colony radius was highly significant (Kruskal–Wallis, H(9) = 75.51, p < 0.001): no inhibition was detectable at 62.5–125 µg·mL−1, moderate inhibition appeared at 250 µg·mL−1 (19.0%), and the response then rose steeply to 74.0% at 500 µg·mL−1 and 86.3% at 750 µg·mL−1. Inhibition exceeded 90% at ≥1000 µg·mL−1 and was complete at 2000–3000 µg·mL−1. This steep response was reflected in a low EC50 (383.9 µg·mL−1, 95% CI 368.7–399.2; R2 = 0.986) and a high slope (b = 3.22), consistent with a steep response at the 5-dpi endpoint (Table 4). TR4, read at 6 dpi, showed a more gradual response (H(9) = 57.89, p < 0.001), with negligible inhibition at ≤125 µg·mL−1, intermediate values between 500 and 1000 µg·mL−1 (28.4–44.2%), and a maximum of 94.4% at 2000 µg·mL−1; complete suppression was never attained within the range tested. TR4 accordingly gave a higher EC50 (960.7 µg·mL−1, 95% CI 901.1–1020.2; R2 = 0.958). The ratio of the two estimates, about 2.5, should not be read as a difference in intrinsic sensitivity between the races. The two assays were read on different days, and by 6 dpi the untreated TR4 controls had reached the edge of the plate (23.40 ± 0.00 mm), which caps the reference growth against which inhibition is expressed and biases the TR4 estimate upward. The residual growth recorded at 2000–3000 µg·mL−1 in TR4 was minimal and often confined to one side of the inoculation plug, which suggests that it was partly sustained by nutrients carried over with the plug.
Table 3.
In vitro sensitivity of Fusarium oxysporum f. sp. cubense (Foc) STR4 and TR4 to the reference fungicide fosetyl-Al: mycelial growth inhibition (%) as a function of fungicide concentration. Values are means ± SD of independent plates (n = 8 for STR4 and n = 6 for TR4); the two perpendicular radii measured on each plate were averaged beforehand. Negative values denote growth marginally above that of the untreated control, i.e., absence of inhibition. Mean radial growth of the untreated controls was 19.15 ± 1.44 mm (STR4, 5 dpi) and 23.40 ± 0.00 mm (TR4, 6 dpi), the latter corresponding to colonies that had reached the edge of the plate.
Table 4.
Parameters of the log-logistic dose–response models fitted to the in vitro sensitivity of Foc STR4 and TR4 to fosetyl-Al (mycelial growth assay read at 5 and 6 dpi, respectively).
The two types of active substance ranked the races in opposite order: TR4 gave the higher EC50 with fosetyl-Al and the lower EC50 with both extract-loaded NCs. The nanocarrier assays were read at 6 days for both races and are matched in that respect, whereas the fosetyl-Al assays were not, so this contrast is reported as an observation and not as a demonstrated difference in race-associated sensitivity (Table 1).
3.3. Preliminary Controlled-Environment Assessment Against Foc TR4
3.3.1. Disease Severity and Area Under Disease Progress Curve
Disease progression was monitored from 11 to 79 days post-inoculation (DPI) using a 0–4 severity scale based on the percentage of affected plant tissue; the first external foliar symptoms appeared at 18 DPI. Because severity is an ordinal score bounded by a floor in the non-inoculated groups and a ceiling in the inoculated control, the three pathogen-challenged treatments were compared non-parametrically at each assessment date. The Friedman test confirmed a highly significant progression of symptoms over time within each of them (χ2 = 75.6–78.9, df = 10, p < 0.001), while the non-inoculated groups remained symptom-free throughout.
Disease severity scores at each assessment date are given in Table 5. In exploratory comparisons at each assessment date, treatment effects became detectable from 38 DPI onwards (Kruskal–Wallis, H(2) = 6.78–8.28, p = 0.016–0.034 between 38 and 79 DPI) and were absent earlier (p ≥ 0.051 at 18–31 DPI). At 79 DPI the inoculated control reached a median severity of 4.00 [IQR 3.00–4.00] (mean 3.61 ± 0.20, n = 9), whereas R. tinctorum-loaded NCs reduced it to 2.50 [2.00–3.00] (mean 2.61 ± 0.31) and U. tomentosa-loaded NCs to 3.50 [3.00–4.00] (mean 3.39 ± 0.18). Dunn’s test with Bonferroni correction showed that R. tinctorum-loaded NCs differed significantly from the inoculated control at every assessment from 38 DPI to the end of the trial (p = 0.016–0.034), whereas U. tomentosa-loaded NCs never differed significantly from it, despite consistently intermediate values.
Table 5.
Disease severity progression (0–4 scale) for banana cv. ‘Grand Nain’ Cavendish plants treated with COS-NCs and challenged with Foc TR4. The endpoint is the cumulative maximum severity attained up to each assessment, as defined in Section 2.6.3. Because the score is ordinal, values are median [interquartile range] with the mean ± standard error in parentheses; n = 9 plants at every date and in every treatment, the plant being the unit of observation. Dead plants retained the terminal score of 4 for the remainder of the trial, and no plant was excluded. Different letters within a row indicate significant differences among the inoculated treatments (Dunn’s test with Bonferroni correction, p < 0.05); letters are omitted at 11 DPI, where every plant scored zero, and no test could be computed. This baseline assessment is included in the AUDPC integration and in the Friedman test. Treatments sharing any letter are not distinguished by the reported test. The per-date comparisons are exploratory and were not corrected across the ten assessment dates.
The per-date comparisons are ten uncorrected omnibus tests, one for each assessment date. Applying a Benjamini–Hochberg correction across them leaves every date from 38 DPI onwards significant (q = 0.048), while 18–31 DPI remain non-significant (q = 0.064–0.499).
Area under the disease progress curve (AUDPC) values, integrated over the whole 11–79 DPI monitoring period, are presented in Table 6. The non-inoculated groups remained symptom-free (AUDPC = 0) and had zero variance, so they were excluded from the formal comparisons. Among the pathogen-challenged groups, the treatment effect was significant (Kruskal–Wallis, H(2) = 7.63, p = 0.022). Standardized AUDPC (SAUDPC), obtained by dividing AUDPC by the 68-day monitoring period, was 3.04 in the inoculated control, 1.98 with R. tinctorum-loaded NCs, and 2.80 with U. tomentosa-loaded NCs, which corresponds to reductions of 34.9% and 7.8%, respectively (Table 6). Dunn’s test with Bonferroni correction indicated that R. tinctorum-loaded NCs differed significantly from the Foc control (p = 0.021), whereas U. tomentosa-loaded NCs did not (p = 1.000); the two NC treatments did not differ from each other (p = 0.196). A parametric sensitivity analysis on the same data gave the same picture (one-way ANOVA, F(2,24) = 5.33, p = 0.012; Tukey HSD p = 0.013 for R. tinctorum-loaded NCs versus the inoculated control), while pairwise Mann–Whitney tests with Bonferroni correction, which rank each pair separately rather than jointly, left that contrast at the edge of significance (p = 0.051).
Table 6.
Disease outcomes for banana cv. ‘Grand Nain’ Cavendish plants treated with COS-NCs and challenged with Foc TR4. AUDPC was integrated by the trapezoidal rule over the 11–79 DPI monitoring period, from the cumulative maximum severity defined in Section 2.6.3, and standardized by the duration of the period (68 days), so that SAUDPC is a constant multiple of AUDPC and the two yield identical statistical comparisons; the significance letters are therefore given once, against AUDPC. Values are means ± standard error of nine plants. Cliff’s δ is a non-parametric effect size against the inoculated control, with a bootstrap 95% confidence interval (20,000 resamples); negative values indicate a lower AUDPC than the control. Each treatment occupied one tray and was applied from one suspension batch, so the letters, p-values and bootstrap interval describe the plants observed in this single run and do not account for variation between application batches, trays, or runs. M, mortality at 79 DPI, given as dead plants of nine and as a percentage; DI, final disease incidence (%); DII, disease intensity index (%, range 0–100) computed from the severity scores of all plants at 79 DPI. The standard deviations and the median [interquartile range] of AUDPC for each treatment are given in the accompanying data. Different letters denote significant differences among the inoculated treatments (Dunn’s test with Bonferroni correction, p < 0.05); treatments sharing any letter are not distinguished by that test, and the non-inoculated groups have zero variance and were excluded from the comparisons.
These comparisons are made among the plants observed in this run. Because each treatment occupied one tray and was applied from one suspension batch (Section 2.7), they do not estimate variation between application batches, trays or runs: the 34.9% difference is an observed within-run contrast, not a replicated estimate of treatment efficacy.
Because severity scores were carried forward, the contribution of that convention to the area under the curve was examined directly. Re-sprouting was first observed at 58 DPI, so no score recorded at or before 52 DPI can have been affected by it. Re-integrating over the 11–52 DPI window gives a difference of 40.7% for the R. tinctorum-loaded NCs (Kruskal–Wallis H(2) = 6.30, p = 0.043; Dunn p = 0.041 against the inoculated control), a larger estimate than the 34.9% obtained over the full period; over 11–45 DPI the point estimate is 42.5%, although the omnibus test does not reach significance at that date (p = 0.055). The convention is therefore conservative with respect to the treatment effect rather than inflating it. Expressed as a plant-level effect size against the inoculated control over the full monitoring period, Cliff’s δ is −0.68 (95% CI −1.00 to −0.21) for the R. tinctorum-loaded NCs and −0.31 (−0.81 to +0.28) for the U. tomentosa-loaded NCs.
Non-inoculated plants, including the two treated with nanocarriers, remained symptom-free at every assessment date (SAUDPC = 0); disease incidence reached 100% in all three inoculated groups and 0% in all three non-inoculated groups, and the first external symptoms appeared at 18 DPI. These observations show that symptoms tracked the inoculation. Because the pathogen was neither re-isolated nor quantified in plant tissue, they do not identify the isolate present in symptomatic tissue, and they do not distinguish reduced colonization from increased tolerance. Visual documentation of representative plants and root systems at final harvest, illustrating differential symptom development and root health across treatments, is presented in Figure 2.
Figure 2.
Representative plants and root systems, and internal tissues at 79 days post-inoculation. (a,d) Whole plants showing differential disease symptom development across treatments: healthy control (negative control), Rubia tinctorum-loaded NCs, Uncaria tomentosa-loaded NCs, Foc TR4 control, R. tinctorum-loaded NCs + Foc, and U. tomentosa-loaded NCs + Foc. (b,e) Corresponding root systems from each treatment illustrating effects on root health and pathogen-induced damage. (c,f) Longitudinal sections through the pseudostem and corm from each treatment revealing treatment-dependent differences in vascular discoloration and internal tissue integrity. * No pseudostem image is shown for the Foc TR4 control because advanced rot precluded sectioning and photography. The plant photographed for each treatment was the one whose final severity lay closest to the treatment mean, except for the inoculated control, whose final severities were strongly bimodal (six dead plants and three surviving) and for which a dead plant was photographed; the selection was not blinded. The figure illustrates the treatments and does not by itself demonstrate either the differences in disease or the absence of phytotoxicity, which was assessed by direct leaf-by-leaf inspection.
Both extract-loaded formulations had numerically lower mortality and disease intensity index values, while disease incidence remained 100% in every inoculated treatment (Table 6). Mortality at 79 DPI was 6 of 9 plants in the inoculated control (66.7%; Wilson 95% CI 35.4–87.9%), 3 of 9 with the U. tomentosa-loaded NCs (33.3%; 12.1–64.6%), and 2 of 9 with the R. tinctorum-loaded NCs (22.2%; 6.3–54.7%). Large as these proportional differences are, neither is statistically supported at this sample size (Fisher exact test, p = 0.347 and p = 0.153 against the inoculated control); it is the area under the disease progress curve, the pre-specified primary outcome, that provides the principal within-run evidence.
3.3.2. Physiological Responses to the COS-NC-Based Treatments
Chlorophyll fluorescence and gas-exchange variables were analyzed with the plant as the unit of observation, the four readings taken on each leaf having been averaged beforehand (n = 9 plants per treatment and leaf position; Table 7).
Table 7.
Chlorophyll fluorescence and gas-exchange parameters measured at final harvest (79 days post-inoculation) at three leaf positions. Values are means ± standard error of nine plants per treatment and leaf position; the four readings taken on each leaf were averaged beforehand, so that the plant is the unit of observation. Different letters within a column and parameter indicate significant differences (Tukey HSD, p < 0.05); letters are omitted where the omnibus test was not significant. NS = not significant. Negative values of gsw, gtw and Eapparent reflect instrumental noise around zero conductance and indicate readings below the range over which the porometer quantifies reliably under the conditions of the measurement. These three variables were therefore not compared statistically, and their p-value rows read “Not tested”. The remaining variables are secondary, exploratory outcomes: no correction was applied across parameters, leaf positions, or outcome families, and the p-values should be read accordingly.
Chlorophyll fluorescence. The effective quantum yield of photosystem II (ΦPSII) did not differ among treatments in the youngest (leaf 1, F(2,24) = 0.61, p = 0.553) or the oldest leaf position (leaf 3, F(2,24) = 0.37, p = 0.696). At the intermediate position (leaf 2) a significant treatment effect was detected (F(2,24) = 4.97, p = 0.016), driven by U. tomentosa-loaded NC plants (0.390 ± 0.034), which showed lower values than the control (0.500 ± 0.018; Tukey HSD p = 0.013); R. tinctorum-loaded NC plants (0.427 ± 0.019) did not differ significantly from either group.
Electron transport rate (ETR) mirrored this pattern, with no differences in leaf 1 (p = 0.647) or leaf 3 (p = 0.726) and a significant effect in leaf 2 (F(2,24) = 4.07, p = 0.030), where control plants (60.2 ± 2.0 µmol·m−2·s−1) exceeded U. tomentosa-loaded NC plants (48.0 ± 4.2; Tukey HSD p = 0.024). The R. tinctorum-loaded NC treatment again took intermediate values (52.9 ± 2.5) that were not distinguishable from either the control or the U. tomentosa treatment.
These fluorescence differences were confined to a single leaf position out of three, in two parameters that are close to collinear, within a family of uncorrected exploratory comparisons. They are weak evidence of a treatment effect on photochemistry and are not interpreted further.
Gas exchange. Stomatal conductance to water vapor (gsw), total conductance (gtw), and apparent transpiration rate (Eapparent) were close to zero in every group, and the treatment means of the R. tinctorum-loaded NC group were slightly negative, which is physically impossible. These readings lie below the range over which the porometer quantifies reliably under the conditions of the measurement. They are reported as recorded, but they were not compared statistically, and no p-values are given for them, because a test on values indistinguishable from instrument noise cannot be informative. Boundary layer conductance (gbw) is set by the instrument chamber and was essentially constant across all plants (2.908 mol·m−2·s−1), as expected.
Leaf-to-air vapor pressure deficit (VPDleaf) differed among treatments only at the oldest leaf position (leaf 3, F(2,24) = 5.55, p = 0.010), where U. tomentosa-loaded NC plants (1.291 ± 0.046 kPa) exceeded both the control (1.172 ± 0.011 kPa; Tukey HSD p = 0.019) and the R. tinctorum-loaded NC treatment (1.177 ± 0.014 kPa; p = 0.025). No significant differences were found in leaves 1 (p = 0.061) or 2 (p = 0.216).
Taken together, the gas-exchange data provide no evidence of a treatment-specific effect on stomatal behavior under the conditions of this trial, and the low absolute values argue for a dedicated measurement campaign before any conclusion on stomatal regulation is drawn.
DUALEX measurements. Assessment of leaf optical indices at final harvest revealed treatment-associated changes in the indices related to secondary metabolism, without any change in the chlorophyll index (Table 8). The leaf chlorophyll index did not differ among treatments at any leaf position (leaf 1, p = 0.537; leaf 2, p = 0.666; leaf 3, p = 0.845). Flavonoid content, in contrast, differed strongly (Kruskal–Wallis H(2) = 18.70, p < 0.001): both R. tinctorum-loaded NCs (0.628 ± 0.019) and U. tomentosa-loaded NCs (0.571 ± 0.028) roughly doubled the control value (0.318 ± 0.019), representing increases of 97% and 79%, respectively, while not differing from each other (Dunn p < 0.001 and 0.007 vs. control). Anthocyanin content was also affected (H(2) = 6.14, p = 0.046), with R. tinctorum-loaded NC plants (0.232 ± 0.013) exceeding the control (0.169 ± 0.018; Dunn p = 0.041), a 37% increase, and U. tomentosa-loaded NC plants taking intermediate values (0.212 ± 0.019) that differed from neither group.
Table 8.
DUALEX leaf optical indices at final harvest (79 days post-inoculation). Chlorophyll index (Chl) is reported per leaf position; flavonoid (Flav), anthocyanin (Anth) and nitrogen balance (NBI) indices are whole-plant averages across the three leaf positions. Values are means ± standard error of nine plants per treatment; the four readings taken on each leaf were averaged beforehand. Different letters within a row indicate significant differences (Tukey HSD for Chl, Dunn’s test with Bonferroni correction for Flav, Anth and NBI, following the assumption checks; p < 0.05). NS = not significant. These are secondary, exploratory outcomes: no correction was applied across parameters or outcome families, and the p-values should be read accordingly.
The nitrogen balance index (NBI), the ratio of chlorophyll to flavonoids, decreased sharply in both treated groups (H(2) = 17.91, p < 0.001), from 117.46 ± 11.97 in the control to 51.54 ± 2.74 with R. tinctorum-loaded NCs and 58.20 ± 4.36 with U. tomentosa-loaded NCs (Dunn p < 0.001 and p = 0.004 against the control). Because chlorophyll was unchanged, this drop is entirely attributable to the accumulation of flavonoids.
Anthocyanin was the one leaf optical index for which a nominal difference from the control was detected: R. tinctorum-loaded NC plants exceeded the control (p = 0.041), whereas U. tomentosa-loaded NC plants took intermediate values that differed from neither group; no difference between the two formulations was therefore demonstrated. It is, however, a single comparison at p = 0.041 within an uncorrected exploratory family, measured at final harvest in non-inoculated plants, and it would not survive correction across that family; it is reported as the one physiological observation worth following up in a design able to test it.
3.3.3. Visible Phytotoxicity Screening and Growth Parameters
No visible symptoms of phytotoxicity were detected at the tested concentration during the 79-day controlled-environment experiment; that is, no visible signs of chlorosis or necrosis were detected in leaves, pseudostems, roots, or corms compared to untreated plants (Figure 2). The assessment was made by direct inspection at final harvest of every leaf of every plant in the control and the two NC-treated groups; no leaf-level imagery was recorded, so Figure 2 illustrates the treatments rather than demonstrating the absence of phytotoxicity. This conclusion is supported by the morphometric and biomass data, none of which were reduced in either treated group relative to the control. This qualitative screening was limited to apparent tissue damage under the tested conditions and does not constitute a general safety assessment. Several morphometric measurements at final harvest were higher in both treated groups than in the control (Table 9).
Table 9.
Growth parameters measured at final harvest (79 days post-inoculation). Values are means ± standard error of nine plants per treatment. Different letters within a row indicate significant differences (Tukey HSD or Dunn’s test with Bonferroni correction, according to whether the assumptions of normality and homoscedasticity were met; p < 0.05). NS = not significant. These are secondary, exploratory outcomes: no correction was applied across the eleven variables or across outcome families, and the p-values should be read accordingly.
Leaf dimensions were larger in both treated groups than in the control. Leaf width differed significantly at the three positions (p = 0.010, 0.004 and 0.011 for leaves 1–3), with both formulations exceeding the control, and leaf length differed at positions 1 and 2 (p = 0.025 and <0.001) but not at position 3 (p = 0.100). Plant height did not differ among treatments, nor did pseudostem perimeter or diameter, which are correlated measures of pseudostem girth and are interpreted together (p = 0.065, 0.280 and 0.092).
Fresh weight differed significantly among treatments (F(2,24) = 5.76, p = 0.009): R. tinctorum-loaded NC plants reached 99.30 ± 3.93 g against 85.30 ± 1.94 g in the control, a 16.4% increase (Tukey HSD p = 0.007). Dry weight, by contrast, was unaffected (p = 0.213), so that the higher fresh weight is consistent with greater tissue water content rather than with accumulation of structural biomass.
4. Discussion
4.1. In Vitro Antifungal Activity and Effective Concentrations
The chitosan oligosaccharide-based NCs demonstrated substantial antifungal activity against both Foc STR4 and TR4 races in vitro, with EC50 values ranging from 320.0 to 571.7 µg·mL−1 (equivalent to 49.7–126.9 µg·mL−1 extract). To contextualize these results within the broader landscape of natural product-based antifungal strategies, we compiled comparative efficacy data from recent studies on chitosan formulations and plant extracts against Fusarium species (Table A1). On the one hand, chitosan-based systems show considerable variation in antifungal potency depending on molecular weight, degree of acetylation, and formulation strategy. Chitosan solutions typically exhibit Minimum Inhibitory Concentration for 90% (MIC90) values of 3 mg·mL−1 against Fusarium solani (Mart.) Sacc., while nanoparticulate formulations achieve substantially enhanced efficacy with MIC values of 0.5–1.2 mg·mL−1 [28]. Against Fusarium graminearum Schwabe, chitosan polymers (degree of acetylation, DA = 10%; degree of polymerization, DPn = 90) demonstrate half maximal inhibitory concentration (IC50) values below 50 µg·mL−1 and MIC values of approximately 100 µg·mL−1, whereas partially acetylated COS show weaker activity with IC50 values exceeding 100 µg·mL−1 [29]. Notably, synergistic combinations of chitosan polymers with oligosaccharides can achieve complete growth inhibition at concentrations where individual components show minimal activity, demonstrating the potential for dose reduction through strategic formulation design [29]. On the other hand, plant extract efficacy against Fusarium species spans several orders of magnitude (Table A1), from highly potent crude extracts (MIC = 10 µg·mL−1 for Millettia grandis (E.Mey.) Skeels [30]) to preparations requiring ≥1000 µg·mL−1 for meaningful inhibition [31,32,33,34,35,36,37,38,39]. Critically, very few studies in the plant extract literature have specifically targeted Foc STR4 or TR4, making direct comparisons with the present results challenging. The EC50 values of 49.7–126.9 µg·mL−1 (expressed as encapsulated extract) obtained here position the COS-based NC formulations in the upper efficacy range for crude or semi-purified natural product preparations.
No comparison with unformulated chitosan (MIC values typically 3000 µg·mL−1 in solution, as noted above) or with crude plant extracts is possible from these data, since neither was assayed here [24,40]. The present study evaluated only the two complete extract-loaded formulations; free extracts, unloaded carriers, free COS, and matched carrier matrices loaded with both extracts were not included, so the contribution of nanoencapsulation or of any individual formulation component cannot be estimated for Foc from these data. Earlier studies of these same carrier systems reported differences between the loaded formulations and the corresponding unformulated extracts against other phytopathogens, in the works in which the carriers were developed and characterized [22,24]; that evidence provided the rationale for taking the loaded formulations forward here. The same two formulations have since been compared with the corresponding free extracts and with commercial chitosan in a replicated field trial against Botrytis cinerea Pers. in grapevine, in which nanoencapsulation lowered the extract concentration required for complete in vitro inhibition by 1.8–6.7-fold and reduced gray mold severity from 80% in the untreated control to 18–25%, against 35–40% for the free extracts and for chitosan [41]. Both lines of evidence include free-extract comparisons, but they come from other pathosystems and do not transfer to Foc or to banana.
Mechanisms that would need to be tested with appropriate formulation controls include: (i) protection of bioactive compounds from rapid degradation, (ii) sustained release kinetics enabling prolonged exposure to target fungi, (iii) improved cellular uptake through NC-mediated delivery, and (iv) synergistic interactions between the chitosan carrier matrix and encapsulated phytochemicals, as documented by Attjioui et al. [29] for chitosan polymer-oligosaccharide combinations. Whether the incorporation of g-C3N4 and hydroxyapatite into the carrier matrix further contributes to efficacy through encapsulation efficiency or pH-responsive release likewise remains to be determined.
The observed activity may reflect contributions from both the COS-containing carrier and the encapsulated extracts, but synergy was not tested in the present study. Previous studies have demonstrated that COS conjugation with U. tomentosa extract produces synergy factors of 4.67–8.87, depending on the target pathogen, meaning the combination is 5–9 times more effective than predicted from additive effects alone [17,24]. This synergism operates through complementary mechanisms: chitosan polymers disrupt fungal cell walls and membranes extracellularly, facilitating uptake of oligomers and bioactive compounds, which then exert intracellular effects, potentially interacting with proteins or nucleic acids that disturb the metabolic balance [42]. For COS-R. tinctorum conjugates, synergy factors reached 5.17 against B. cinerea and 4.67 against Phytophthora cactorum (Lebert & Cohn) J. Schröt., attributed to enhanced membrane permeabilization by anthraquinones combined with chitosan’s direct antimicrobial effects [16].
Notably, COS-HAp-g-C3N4-U. tomentosa NCs showed nominally lower EC50 values against TR4 than COS-g-C3N4-R. tinctorum NCs (320.0 vs. 347.2 µg·mL−1, a difference that the bootstrap contrast did not support), yet did not show a comparable disease contrast in the single run of the in planta experiment (see Section 4.3). This illustrates that EC50 derived from static in vitro assays, which measure growth inhibition at a single endpoint, does not capture the kinetic dimension of antifungal activity (i.e., speed of kill); whether it is relevant to the outcome of a single application is a hypothesis that the present design cannot test [5].
The differential susceptibility between the two races observed in this study, with TR4 showing 37–44% lower EC50 values, contradicts expectations given TR4’s greater field virulence. This paradox has been noted in other in vitro studies and likely reflects the multifactorial nature of pathogenicity, where field virulence depends not only on intrinsic antifungal resistance but also on host colonization efficiency, production of virulence factors, and ability to evade plant immunity [5].
To place these values in a practical context, the sensitivity of Foc to fosetyl-Al, one of the few active substances still available for the management of vascular wilts, was determined in parallel, although in a separate assay read at 5 dpi for STR4 and 6 dpi for TR4 (Table 4). Under the specific in vitro assay conditions, both formulations showed lower EC50 values than fosetyl-Al against the TR4 isolate (320.0 and 347.2 vs. 960.7 µg·mL−1), whereas against STR4 the EC50 of fosetyl-Al was the lowest of the two (383.9 vs. 552.7–571.7 µg·mL−1). The two types of active substance ranked the races in opposite order: TR4, the race of greatest quarantine concern, gave the higher EC50 with the organophosphonate and the lower EC50 with the extract-loaded NCs. We report this as an observation rather than as evidence that the two types of treatment have different molecular targets, because the fosetyl-Al assays were read on different days for the two races and the TR4 controls had reached the edge of the plate, whereas the nanocarrier assays were read at 6 days for both races. Two caveats should nevertheless temper this comparison. First, the EC50 values of the NCs refer to the total mass of the formulation, of which only 14.3% (R. tinctorum) or 22.2% (U. tomentosa) corresponds to the encapsulated extract, so that on an extract basis the difference in potency is considerably larger. Second, fosetyl-Al is known to act largely indirectly, through the stimulation of host defense responses and the release of phosphonate in planta, so that its in vitro activity underestimates its performance in the plant; the comparison should therefore be read as an in vitro benchmark and not as a prediction of relative field efficacy. Including a chemical standard in the in planta trial would have strengthened this benchmarking and is recommended for future work.
4.2. Time-Kill Kinetics and Viable-Recovery Profiles
The two formulations differed in the rate at which recoverable viability was lost. With COS-g-C3N4-R. tinctorum NCs, viable counts fell to 0.43 log10 CFU·mL−1 within 24 h (a single colony recovered from one of the two tubes), and no colonies were recovered at 48 or 72 h at 3000 µg·mL−1 in either race. Because the assay used a single concentration, two independent tubes per combination, and no validated neutralization or washing step, and because every zero is bounded by the limit of detection of the plating used at that sampling time (Section 2.5.2), these observations describe the kinetics of the loss of recoverable viability and do not establish fungicidal action. Rates of decline of the same order have been reported for antimicrobial peptides against F. solani, which achieved an 85.87% reduction by 4 h and 99% by 24 h through membrane permeabilization and ROS generation [43].
R. tinctorum anthraquinones, chiefly alizarin and purpurin, have been reported to act through several simultaneous mechanisms in fungi: downregulation of hypha-specific genes, inhibition of the yeast-to-hypha transition and of biofilm formation, and mitochondrial membrane depolarization, with free ortho-hydroxyl groups at C-1 and C-2 required for activity [44,45,46]. None of these mechanisms was measured here, and the evidence comes from Candida albicans rather than from Foc; it is summarized in Appendix B.
COS-HAp-g-C3N4-U. tomentosa NCs reduced viable counts more slowly, and colonies were still recovered at 72 h in both races, at densities close to the limit of detection. Under the conditions tested, the loss of recoverable viability was therefore slower and less complete than with the R. tinctorum formulation, which is the whole of what the assay establishes. Reports that the antimicrobial activity of U. tomentosa involves oxindole alkaloids, quinovic acid glycosides and polyphenols acting together [47,48] are consistent with a slower decline, but the present data identify no mode of action.
A difference in the rate at which the recoverable population declines could matter for disease control, because a treatment that leaves survivors allows the population to re-establish once the compound is no longer present, and because a compound that only suppresses growth has to remain present to remain effective [49]. Whether it bears on the plant results discussed in Section 4.3, where the formulations were applied once, cannot be determined from an assay with two tubes per condition.
4.3. Divergent Plant Outcomes and Their Candidate Explanations
The two formulations produced sharply different outcomes in the plant despite indistinguishable EC50 values, and it is worth stating at the outset what the design can and cannot make of that. COS-g-C3N4-R. tinctorum and COS-HAp-g-C3N4-U. tomentosa differ simultaneously in at least five respects: extract identity; carrier composition, hydroxyapatite being present in one and absent from the other; particle size, by a factor of about 2.5 at the intensity-weighted mode (Section 3.1); extract loading, 14.3% against 22.2% w/w, so that a nominally equal dose of 3000 µg·mL−1 delivered 429 and 666 µg·mL−1 of extract; and encapsulation and release efficiency. The design included no free extract, no unloaded carrier, no free COS, and no matched-carrier comparison (Section 2.4.4). Any of these differences, or an interaction among them, could account for the divergent plant outcomes, and the present experiment separates none of them. What follows identifies candidate explanations; it does not test between them. One of the five, however, runs against the observed outcome rather than with it: the formulation that reduced disease delivered 36% less extract than the formulation that did not.
The bioassay against Foc TR4 showed that the COS-g-C3N4-R. tinctorum treatment had SAUDPC 34.9% lower than the inoculated control in this single run, over the 11–79 DPI monitoring period (Kruskal–Wallis H(2) = 7.63, p = 0.022; Dunn p = 0.021; Cliff’s δ = −0.68, 95% CI −1.00 to −0.21), whereas COS-HAp-g-C3N4-U. tomentosa did not (nominal 7.8% reduction; Dunn p = 1.000), so that comparable in vitro potency did not translate into comparable disease control [50]. The observed pattern was consistent with the second hypothesis for one formulation only. Placing that figure in context is harder than it may appear. Reported efficacies for alternatives to synthetic fungicides against this disease span the whole range from no effect [51] to more than 80% control [52,53], and the studies differ in pathogen race, isolate, inoculum pressure, host stage, application regime and assessment period. The most nearly comparable benchmark is the single-application Trichoderma pot trial, which has achieved 43–72% control at 45–90 DPI [54,55,56]; the 34.9% recorded here falls below that range, and even that comparison is limited by the differences just listed. The Bacillus treatments at the upper end of the broader published efficacy range and the bioorganic fertilizer regimes that require two to three years of continuous application before suppression emerges [57] are not comparable with a single root dip at all. Most importantly, no positive reference treatment was included in the present chamber trial, so the figure has no in-house benchmark; that omission, together with the single run and the single tray per treatment, and not the heterogeneity of the literature, is why the magnitude of the difference cannot yet be judged or regarded as experimentally validated.
The use of fungicides is also an integral component of integrated Foc management programs [58]. Azole fungicides (prochloraz, propiconazole, cyproconazole) and the organophosphonate fosetyl-Al can reduce disease severity by up to 80% under controlled conditions [25], while benzimidazole fungicides (benomyl, carbendazim, thiabendazole) have demonstrated complete in vitro mycelial inhibition at 500 ppm [59,60], although in planta efficacy has been inconsistent across regions and strains [5,6]. Importantly, the high in vitro-to-in planta efficacy gap observed with chemical fungicides parallels the pattern observed for U. tomentosa-loaded NCs in this study, reinforcing the principle that in vitro potency alone is insufficient to predict field performance against vascular wilt pathogens. Moreover, several of these active substances face increasing regulatory restrictions in Europe: carbendazim was banned in the EU in 2015, and propiconazole was not renewed in 2019 [61], progressively limiting the chemical toolbox available to producers. In the specific case of Spain, no synthetic fungicide is authorized for application to banana plants against FWB: in the current register of products authorized in banana, azoxystrobin and thiabendazole appear only as post-harvest treatments applied to harvested fruit in packing houses against storage diseases, and the only conventional fungicide authorized for field application is sulfur, registered against powdery mildew and mites [26], further constraining chemical options and underscoring the need for alternative management tools, even when their individual efficacy is lower than that of conventional fungicides. Integrated management approaches combining multiple strategies generally improve control, and disease reductions above 50% have been reported in some field and greenhouse studies [62].
The contrasting outcomes between R. tinctorum (34.9% SAUDPC reduction, p = 0.021) and U. tomentosa (no significant disease reduction) formulations in planta, despite both showing substantial in vitro activity, underscore the importance of validating candidate treatments across progressively more realistic controlled-environment systems, alongside greenhouse and field trials, and illustrate the well-known gap between in vitro antifungal potency and in vivo efficacy. Several factors may be associated with this discrepancy, none of which was isolated by the present design. First, the two formulations differed sharply in time-kill profile, with no colonies being recovered from 48 h onwards with the R. tinctorum-loaded formulation. Second, differences in NC composition, COS-g-C3N4 versus COS-HAp-g-C3N4, could influence uptake efficiency or release kinetics in planta. Third, no difference in stomatal conductance was detected between the control and U. tomentosa-treated plants (Table 7) or the R. tinctorum-treated group, so a phytotoxicity explanation is not supported. One candidate explanation for the absence of disease control by the U. tomentosa-loaded formulation is the slower and incomplete loss of recoverable viability recorded, in two tubes per condition, in the time-kill assay, since a single root-dip application would not maintain a continuous rhizosphere presence. The application schedule may also favor rapidly acting compounds. The formulations were applied as a 2-min root dip, and the plants were transplanted before the conidial suspension was drenched into the pots two hours later, so the R. tinctorum formulation and Foc first met on the root surface and in the surrounding substrate, with no further application to renew the formulation. Whatever activity it retained had therefore to be exerted while it persisted there, over a period that was not measured, whereas 24–48 h were needed in liquid culture before recoverable viability was lost with either formulation (Table 2). In contrast, a formulation that reduces viable counts more slowly would be expected to require sustained presence to prevent the pathogen from re-establishing, since growth typically resumes once a growth-suppressing agent is removed from the environment. A single root dip may therefore not maintain inhibitory concentrations over time. Moreover, fungicide efficacy in crops is well known to depend on dose, number, and timing of applications rather than intrinsic in vitro potency alone, so application regime and time-kill behavior may be relevant to the divergent outcomes, as one candidate explanation that this design cannot separate from the other differences between the formulations or from differences in intrinsic in vitro potency [63].
One result deserves to be stated separately, because it constrains how the approach should be positioned. Disease incidence remained 100% in every inoculated group, including the R. tinctorum group (Table 6). The R. tinctorum-loaded formulation slowed disease progression and was associated with lower mortality, but did not prevent visible disease in any challenged plant. A single root dip of this kind is therefore a candidate component of an integrated program, acting on the rate and severity of disease development, and not a protectant. It would have to be combined with measures that reduce inoculum or block infection, and its value would depend on whether a slower epidemic translates into retained yield under field inoculum pressure, which this experiment cannot address.
Taken together, these observations suggest a hypothesis rather than establishing a mechanism. We designate it the kill-rate hypothesis: that for single-application formulations of this class, for which rhizosphere persistence is likely to be limited although it was not measured here, the rate at which viable propagules cease to be recoverable, referred to here as the rate of kill, constrains performance in the plant more tightly than the single-endpoint potency measured by EC50. The present study cannot test it, and we present it solely as a hypothesis requiring independent experimental validation: the time-kill assay comprised two tubes per condition and the plant comparison a single run confounded with tray and batch, so these data establish no relationship between the rate of loss of viability and the plant outcome. Two formulations differing in extract identity, carrier composition, particle size, extract loading, and release behavior furnish one observation consistent with the hypothesis, not a test of it. A test requires a panel of formulations spanning a range of kill rates at matched EC50 (most directly, a single carrier matrix loaded with several extracts, or a single extract at several loadings), assayed in parallel in vitro and in planta, with formulation and vehicle controls and independent replication.
Several mechanisms could underlie the effects reported here for chitosan-based NCs against Fusarium wilt, operating at different spatial and temporal scales. None were measured in the present study; they are set out below to identify what would have to be tested.
Direct antifungal activity. The encapsulated bioactive compounds can exert direct fungitoxic effects. R. tinctorum anthraquinones generate ROS, disrupt mitochondrial function, inhibit ergosterol biosynthesis, and compromise cell wall integrity [16,44,45,46]. U. tomentosa alkaloids and polyphenols interfere with fungal metabolism through multiple targets [17,47,48]. Whether the carrier modifies these direct effects, by protecting the compounds from degradation, by releasing them over time, or by facilitating penetration into plant tissues or fungal cells, was not tested here, and cannot be tested without the formulation controls listed in Section 2.4.4.
Plant defense elicitation. Chitosan oligomers are recognized elicitors of induced resistance in plants, acting through pattern recognition receptors, and chitosan applied to banana roots has been reported to trigger salicylic acid biosynthesis locally and systemically [64,65,66,67,68,69,70]. No defense marker, transcript or hormone was measured in the present study, so this literature provides a rationale for the formulations and not an interpretation of the results reported here; the signaling pathways and the defense genes involved are summarized in Appendix B.
The elevated flavonoid and anthocyanin indices recorded in treated banana plants (Table 8) indicate treatment-associated changes in epidermal phenolic accumulation. Because DUALEX provides optical indices rather than direct biochemical measurements, and because the measurements were made at final harvest in non-inoculated plants only, these data do not demonstrate activation or priming of plant defenses. They also cannot be the mechanism of the disease effect: the flavonoid response was of similar magnitude in both formulations (97% and 79% above the control), including the U. tomentosa formulation that produced no disease control, so a response common to an effective and an ineffective treatment cannot explain the difference between them. The reduced NBI values in treated plants (51.5–58.2 versus 117.5 in controls) follow arithmetically from the increase in the flavonoid index at an unchanged chlorophyll index, since NBI is the ratio of the two. Whether any of this reflects a reallocation of resources toward defense metabolism would require targeted metabolite and gene-expression data.
Localization and release: open questions. The root dip may have favored adhesion of the NCs to root surfaces and uptake through natural openings or wounds created at transplanting. The evidence that chitosan nanoparticles can be absorbed by roots and translocated to vascular tissues, and that particle size and surface charge influence uptake kinetics, is summarized in Appendix B [71,72,73].
However, without tracer studies or tissue analysis confirming NC uptake and distribution in banana roots, the precise mechanism of action remains partially speculative. Three non-mutually exclusive scenarios are plausible: (i) NCs remain primarily in the rhizosphere, exerting antifungal effects against soil-borne inoculum; (ii) NCs are taken up by roots and translocated systemically, releasing bioactive compounds within vascular tissues where Foc colonizes; or (iii) NCs induce systemic defense responses from the root zone that confer whole-plant resistance. Distinguishing among these possibilities requires future experiments with fluorescently labeled NCs, tissue sectioning, and microscopic analysis of NC distribution in roots, rhizomes, and pseudostems.
The chitosan oligomer matrix is expected to provide two functions: (i) protection of encapsulated extracts from rapid degradation or leaching in the substrate, and (ii) controlled release of bioactive compounds over time. Its pH-responsive behavior is relevant: in the acidic environment (pH 4.5–5.5) created by Foc secretion of organic acids, protonation of chitosan promotes partial solubilization and structural loosening of the matrix, which could in principle facilitate preferential extract release. Matrix degradation, release kinetics, and nanocarrier localization were not measured in this study, so locally triggered release of the bioactives at infection sites remains a hypothesis rather than a demonstrated property of these carriers [24].
4.4. Physiological and Growth Responses
Several growth measurements were higher in both treated groups in the absence of the pathogen, R. tinctorum-loaded NC-treated plants showing a 16.4% increase in fresh weight relative to the control. Dry weight did not differ among treatments, so the gain in fresh weight indicates enhanced tissue water content rather than accumulation of structural biomass [74]. Because it was measured in non-inoculated plants at a single harvest, it has no bearing on the disease outcome.
The physiological measurements, analyzed with the plant as the unit of observation, point to limited and highly localized treatment effects. The only significant differences in chlorophyll fluorescence occurred at the intermediate leaf position, where U. tomentosa-loaded NC plants showed lower ΦPSII (0.390 ± 0.034 versus 0.500 ± 0.018) and lower ETR (48.0 ± 4.2 versus 60.2 ± 2.0 µmol·m−2·s−1) than the control, while R. tinctorum-loaded NC plants took intermediate values that differed from neither group. One significant position out of three, in two near-collinear parameters and within an uncorrected exploratory family, is weak evidence of a treatment effect on photochemistry, and we do not interpret it further.
No treatment effect on stomatal conductance, total conductance, or apparent transpiration was detected at any leaf position once the four readings taken on each leaf were averaged to the plant level (Table 7). Absolute values were very low in every group, and the treatment means of the R. tinctorum-loaded NC group were slightly negative, which is physically impossible and indicates that the porometer was working at or below its detection limit under the conditions of the measurement. Any interpretation of stomatal behavior in this trial would therefore be unwarranted; a dedicated gas-exchange experiment, run under conditions that keep conductance well within the working range of the instrument, would be needed to establish whether the formulations modify stomatal aperture. The only variable in this group that reached significance was the leaf-to-air vapor pressure deficit at the oldest leaf position, which was higher in U. tomentosa-loaded NC plants than in the control or in the R. tinctorum-loaded NC treatment.
The near doubling of leaf flavonoid content in both treated groups (97% and 79% increase for the R. tinctorum and U. tomentosa formulations) and the 37% rise in anthocyanins in R. tinctorum-loaded NC-treated plants represent a marked and consistent shift in leaf phenolic composition. Leaf chlorophyll was unchanged at the three leaf positions, so the sharp fall in the nitrogen balance index of treated plants (51.5–58.2 vs. 117.5 in controls) is a direct consequence of the flavonoid accumulation, since NBI is the chlorophyll-to-flavonoid ratio. This combination of responses (flavonoids and anthocyanins up, chlorophyll unchanged) is consistent with a shift toward secondary metabolism, but was recorded at final harvest in non-inoculated plants, in which there was no disease to suppress, and was of similar magnitude in the formulation that gave no disease control, so it cannot be related to the disease outcome of the R. tinctorum treatment. DUALEX indices are in any case optical proxies of leaf composition, and mechanistic confirmation would require targeted biochemical and transcriptional analyses.
The larger leaf dimensions recorded for U. tomentosa-loaded NCs (Table 9), combined with their failure to suppress disease (Table 6), indicate that under the tested protocol this formulation acted on plant growth rather than on disease. That is consistent with the slower loss of recoverable viability recorded in vitro, in the sense that a single root-dip exposure would not maintain inhibitory concentrations over time, although the design cannot establish the connection. The R. tinctorum-loaded formulation combined a marked accumulation of leaf flavonoids and anthocyanins with reduced disease progress, but the flavonoid response was shared with the ineffective formulation, and the anthocyanin difference is a single uncorrected comparison against the control, with no difference demonstrated between the two formulations. These are final-harvest optical indices from non-inoculated plants, and they cannot explain the disease contrast recorded in different, inoculated plants.
No visible phytotoxic symptoms were detected at the tested concentration during the 79-day controlled-environment experiment. Banana plants maintained normal coloration, tissue integrity, and structural development throughout the trial, and no reductions in biomass were detected; the leaf chlorophyll index was unaffected. This qualitative observation does not establish general plant, environmental, or food-chain safety, and would need to be confirmed over additional doses, exposure periods, developmental stages, and production conditions. The fresh-weight and leaf-dimension responses recorded here, namely leaf width and length in both NCs and fresh weight in R. tinctorum-loaded NC-treated plants, are consistent with the growth-promoting properties reported for chitosan oligomers [75,76]. In maize, chitosan combined with plant growth-promoting rhizobacteria increased seed vigor index by 36.44%, shoot weight by 65.67%, and aerial biomass by 84.66% [77]. Copper-chitosan NPs applied to banana increased plant height, leaf number, and bunch weight while simultaneously suppressing Fusarium wilt [78], while chitosan NPs significantly increased fresh and dry weights of banana plants under stress conditions [79].
4.5. Potential Role in Integrated Management
Within the framework of integrated Fusarium wilt management, COS-based NCs delivering natural antimicrobials represent a complementary approach to existing practices rather than standalone solutions. The 34.9% difference in disease progression observed in the single growth-chamber run with R. tinctorum-loaded NCs falls below the range reported for single-application Trichoderma treatments and is not directly comparable with most published biocontrol efficacies, for the reasons set out in Section 4.3 [5]. The approval of chitosan as a basic substance in the EU [80] does not extend to the formulations tested here, which are engineered nanocomposites containing g-C3N4 and hydroxyapatite. Materials of this kind fall outside the basic-substance route, and their use would require formulation-specific regulatory, environmental-fate and ecotoxicological assessment [81,82]. The progressive withdrawal of several active ingredients in the European Union has narrowed the range of chemical options available for banana disease management [61], which is a reason to look for alternatives and not evidence that these formulations are close to authorization.
The lower disease progression recorded over the 79-day observation period after a single root dip warrants investigation of formulation persistence, which was not measured here; a treatment that remained effective after a single application would reduce the repeated applications required for most BCAs. The controlled-release behavior expected of chitosan NCs would be particularly well suited to targeting Foc, as the pathogen’s secretome includes chitosanases, specifically GH75 chitosanase documented in TR4 and carbohydrate-active enzymes (CAZymes) characterized in races 1 and 4 secretomes [83]. The presence of these pathogen-produced chitinolytic enzymes provides a testable hypothesis that they could contribute to degradation of the chitosan matrix near infection sites. The present study measured neither matrix degradation nor cargo release, so no conclusion can be drawn about infection-site-specific release; quantifying formulation degradation in the presence and absence of Foc enzymes, and tracking nanocarrier localization in planta, are priorities for future work. The ecotoxicological profile of the complete formulations was not assessed here; chitosan itself is biodegraded by ubiquitous chitinolytic soil microorganisms [19].
The size of the disease contrast observed in this study suggests that NC treatments are unlikely to provide adequate disease control as standalone interventions in heavily infested soils or under high inoculum pressure. However, their integration with other management practices (resistant or tolerant varieties, BCAs, soil amendments such as organic matter, silicon, and calcium, and sanitation protocols) may achieve synergistic disease suppression exceeding that of individual components. Research on integrated approaches combining chitosan with Pochonia chlamydosporia (Goddard) Zare & W.Gams coacervates demonstrated enhanced efficacy compared to the BCA alone, supporting this hypothesis [84]. The compatibility of these NC systems with biological control organisms is particularly promising, as chitosan has been shown to enhance the establishment of beneficial microorganisms in some systems [85].
Economic feasibility will determine whether formulations of this kind can be adopted. Chitosan and g-C3N4 are inexpensive to produce at scale, whereas formulation, quality control and distribution require investment and technical capacity that may be a barrier in smallholder-dominated systems; indicative costs and the routes by which that barrier might be addressed are given in Appendix B. A cost–benefit assessment would in any case have to wait on an efficacy estimate that this study does not provide.
4.6. Study Limitations
The plant experiment was a single controlled-environment run. Each treatment occupied one tray and was applied from one freshly prepared suspension batch, so treatment, tray and batch cannot be separated and the plant-level comparisons describe the plants observed in this run rather than estimating variation between batches, trays or runs; the 34.9% difference is accordingly an observed within-run contrast and not a replicated estimate of efficacy. The plant evidence is preliminary and hypothesis-generating. The design also included no free plant extract, no unloaded nanocarrier, no free COS, and no matched carrier matrix, so the contribution of nanoencapsulation, of the carrier, and of the extract cannot be separated, and no in planta positive reference was included, so the observed contrast has no in-house efficacy benchmark. Pathogen colonization was not quantified, so reduced colonization cannot be distinguished from increased tolerance. The physiological and growth variables are secondary, exploratory outcomes measured at a single harvest in non-inoculated plants and were not corrected for multiplicity; the conductance and transpiration readings fell below the range over which the porometer quantifies reliably. In vitro, the time-kill assay comprised two independent tubes per condition, too few to estimate between-tube variability, so the difference in viability kinetics between the formulations is descriptive and requires confirmation with more independent replicates. The formulations were characterized only in part on the material used here: encapsulation and release efficiencies are those reported previously for these carrier systems, and particle size was measured by dynamic light scattering on a single preparation of each formulation after filtration through 0.45 µm, so it describes only the filterable fraction. Controlled-environment conditions do not reproduce the soil chemistry, moisture dynamics, microbial activity, and temperature fluctuations that would govern performance in the field.
4.7. Future Directions
The immediate priority is an independently replicated experiment: several independently prepared suspension batches per formulation, applied to independently allocated trays and repeated across runs, together with free-extract, unloaded-carrier and matched-carrier controls, an in planta positive reference, and quantification of pathogen colonization by re-isolation or qPCR. Beyond that, dose–response and application-timing studies, alternative delivery routes such as soil drench or fertigation, measurement of formulation persistence and of any effect on beneficial soil microbiota, and field validation across agroecological zones and cultivation systems would be needed to establish practical utility. Both formulations have already been applied under commercial field conditions in grapevine, without visible phytotoxicity or effects on yield components [41], which suggests that field trials with them are feasible. Toxicological assessment, environmental fate studies, and appropriate quality-control procedures are essential prerequisites for the commercial development of such formulations, consistent with both the scientific requirements identified for nano-enabled pesticides and the EU regulatory framework for plant protection products [81,86].
5. Conclusions
Both complete COS-based formulations inhibited Foc STR4 and TR4 in vitro, with EC50 values of 320.0–571.7 µg·mL−1 and no difference in potency between them within either race; the first hypothesis was therefore supported for both formulations and both races. In the plant, the observed pattern was consistent with the second hypothesis for one formulation only. In a single controlled-environment run, a single root dip with the R. tinctorum-loaded formulation gave a standardized area under the disease progress curve 34.9% lower than the inoculated control, with two of nine plants dead against six of nine, whereas the U. tomentosa-loaded formulation lowered the same measure by 7.8%, a difference not distinguishable from that control. Disease incidence remained 100% in every inoculated group, so disease progression was slowed, but visible disease was not prevented in any challenged plant.
These plant findings come from one run, with one tray and one application batch per treatment and without free-extract, unloaded-carrier or free-COS controls, so the 34.9% difference is an observed within-run contrast rather than a replicated estimate of efficacy, and no component of the formulation can be credited with it. The R. tinctorum-loaded formulation is the candidate to take forward to the independently replicated trial set out in Section 4.7.
6. Patents
The chitosan oligosaccharide-based nanocarriers used in this work are protected by Spanish patent ES2958909 (international application WO 2024/018098 A1), and by Spanish patent ES2991400 (international application WO 2024/246386 A1), both filed by and assigned to the Universidad de Valladolid.
Supplementary Materials
The following supporting information can be downloaded at https://www.mdpi.com/article/10.3390/agronomy16212179/s1: the complete data sets analyzed in this study, the analysis code that produces every reported statistic, table, and figure from them, and the resulting output files, organized as follows. In data/, seven analysis-ready data sets (agar dilution assay, reference fungicide assay, time-kill kinetics, disease severity, plant growth, DUALEX leaf optical indices and porometer/fluorometer readings), each with the experimental hierarchy given explicitly; code/: the analysis scripts, to be run in numerical order, together with a list of package versions; output/: all descriptive tables, assumption checks, test results and figures generated by those scripts; and a README file documenting the structure, every data column and the statistical approach. The code directory includes the script that generates the analyses added during revision: the medians and interquartile ranges of the ordinal severity score, the per-date omnibus tests with a Benjamini–Hochberg correction across the ten assessment dates, the area under the disease progress curve re-integrated over shorter monitoring windows, the effect sizes with confidence intervals, mortality as counts with Wilson intervals and Fisher exact tests, and the dilution plated, limit of detection and carryover concentration for every time-kill tube.
Author Contributions
Conceptualization, C.G.-L.C. and P.M.-R.; methodology, C.C.-M. and J.M.-G.; formal analysis, P.M.-R.; investigation, E.S.-H., C.G.-L.C., A.V.-C., C.C.-M., J.M.-G. and P.M.-R.; resources, C.G.-L.C., J.M.-G. and P.M.-R.; writing—original draft preparation, E.S.-H., C.G.-L.C., J.M.-G. and P.M.-R.; writing—review and editing, C.G.-L.C., J.M.-G. and P.M.-R.; visualization, C.G.-L.C.; project administration, J.M.-G. and P.M.-R.; funding acquisition, C.G.-L.C., J.M.-G. and P.M.-R. All authors have read and agreed to the published version of the manuscript.
Funding
This research was funded by the Junta de Castilla y León (Spain) and the European Regional Development Fund (ref. VA148P23), and by CSIC through extraordinary grants for the incorporation of tenured scientists, OEP 2020–2021 (ref. 2024ICT246).
Data Availability Statement
The data sets analyzed in this study, the analysis code, and every table, test result, and figure derived from them are provided as accompanying data with this article.
Acknowledgments
The authors thank Antonio Di Pietro (University of Córdoba, Spain) for providing the Foc TR4 isolate and technical advice on pathogen handling. During the preparation of this manuscript, the authors used Grammarly (Grammarly Inc.) and Claude (Anthropic; Opus 4.8 and Opus 5) for language editing, and Claude (Anthropic; Opus 4.8 and Opus 5) to help implement the statistical analysis in Python. All analyses were specified, checked, and validated by the authors against the raw data, and all outputs were verified and, where necessary, corrected by the authors. The authors have reviewed and edited the output and take full responsibility for the content of this publication.
Conflicts of Interest
The nanocarrier formulations evaluated in this study are the subject of Spanish patent ES2958909 (WO 2024/018098 A1) and Spanish patent ES2991400 (WO 2024/246386 A1). Both were filed by and are owned by the Universidad de Valladolid, and some of the authors are named as co-inventors. Any economic benefit arising from their exploitation would accrue to the Universidad de Valladolid; the authors receive no personal financial benefit from them and declare no further competing interests. The funders had no role in the design of the study; in the collection, analyses, or interpretation of data; in the writing of the manuscript; or in the decision to publish the results.
Abbreviations
The following abbreviations are used in this manuscript:
| AUDPC | Area under the disease progress curve |
| BCA | Biological control agent |
| CFU | Colony-forming unit |
| COS | Chitosan oligosaccharide |
| DI | Disease incidence |
| DII | Disease intensity index |
| DPI | Days post-inoculation |
| EC50 | Half-maximal effective concentration |
| EC90 | Effective concentration causing 90% inhibition |
| ETR | Electron transport rate |
| Foc | Fusarium oxysporum f. sp. cubense |
| FWB | Fusarium wilt of banana |
| g-C3N4 | Graphitic carbon nitride |
| gbw | Boundary layer conductance |
| gsw | Stomatal conductance to water vapor |
| gtw | Total leaf conductance |
| HAp | Hydroxyapatite |
| HSD | Honestly significant difference |
| IC50 | Half-maximal inhibitory concentration |
| M | Mortality |
| MIC | Minimum inhibitory concentration |
| MIC90 | Minimum inhibitory concentration for 90% |
| MW | Molecular weight |
| NBI | Nitrogen balance index |
| NC | Nanocarrier |
| NP | Nanoparticle |
| PDA | Potato dextrose agar |
| PDB | Potato dextrose broth |
| ROS | Reactive oxygen species |
| SAUDPC | Standardized area under the disease progress curve |
| STR4 | Subtropical race 4 |
| TR4 | Tropical race 4 |
| VGC | Vegetative compatibility group |
| VPDleaf | Leaf-to-air vapor pressure deficit |
| ΦPSII | Effective quantum yield of photosystem II |
Appendix A
Table A1.
Comparative antifungal efficacy of chitosan-based formulations and plant extracts against Fusarium species.
Appendix B
This appendix collects the mechanistic and economic material that informed the design of the formulations but was not measured in the present study, and which is therefore not part of the interpretation of the results.
Anthraquinone mechanisms. Studies in Candida albicans report that alizarin (1,2-dihydroxyanthraquinone) downregulates the hypha-specific genes ALS3, ECE1, ECE2 and RBT1 and inhibits the yeast-to-hypha transition and biofilm formation. Both alizarin and purpurin (1,2,4-trihydroxyanthraquinone) cause mitochondrial membrane depolarization, which triggers apoptosis and disrupts fungal energy metabolism. Free hydroxyl groups at the ortho positions C-1 and C-2 are required for activity; compounds bearing them show the strongest inhibition of fungal biofilms [44,45,46]. None of these endpoints was measured here, and none has been demonstrated for Foc.
Chitosan and induced resistance. Chitosan is recognized by plant pattern recognition receptors, in particular the LysM receptor-like kinase CERK1, triggering pattern-triggered immunity [64,65] and activating signaling through the salicylic acid, jasmonic acid, and ethylene pathways [66]. Chitosan applied to banana roots has been reported to trigger salicylic acid biosynthesis both locally and systemically, with resistant cultivars showing high and prolonged chitinase gene expression [67]. The response has been associated with the defense-related genes AOC3, PDF1.2 and ERF2 (jasmonate/ethylene markers) and PR-1, TGA5 and TGA6 (salicylate markers), together with MAP-kinase activation and increased H2O2 and Ca2+ influx [68,69,70]. No transcript, hormone, or enzyme activity was measured in the present study, so this literature provides a rationale for the approach and not an interpretation of the results.
Nanocarrier uptake and localization. Chitosan nanoparticles can be absorbed by roots and translocated to vascular tissues, penetrating cell walls and aggregating in the cytoplasm of cortical cells, with size and surface charge influencing uptake kinetics and positively charged particles internalizing faster [71,72,73]. Neither uptake nor localization was traced in the present experiment; distinguishing rhizosphere action from systemic translocation and from root-zone elicitation would require fluorescently labeled nanocarriers, tissue sectioning and microscopy, as set out in Section 4.3.
Economic considerations. Chitosan production from crustacean waste is established industrially, with prices in the range of $10–30 kg−1 depending on purity and molecular weight [19], and synthesis of g-C3N4 from urea or melamine by thermal polymerization is relatively inexpensive, with indicative costs of $5–15 kg−1 [92]. Formulation, quality control and distribution infrastructure require initial investment and technical expertise, which may be a barrier in smallholder-dominated production systems; those requirements are comparable to those of other advanced crop protection technologies and could be addressed progressively through cooperative schemes, public–private partnerships and extension programs. A cost–benefit analysis would have to account for input costs, labor, any yield effect of growth promotion, and marketability in organic or sustainably produced supply chains, and would in any case require an efficacy estimate that the present study does not provide.
References
- OECD/FAO. OECD-FAO Agricultural Outlook 2021–2030; OECD Publishing: Paris, France, 2021. [Google Scholar] [CrossRef] [Scilit]
- Dita, M.; Barquero, M.; Heck, D.; Mizubuti, E.S.G.; Staver, C.P. Fusarium wilt of banana: Current knowledge on epidemiology and research needs toward sustainable disease management. Front. Plant Sci. 2018, 9, 1468. [Google Scholar] [CrossRef] [Scilit] [PubMed]
- Díaz, S.; Ortega, Z. Banana crop by-products in the Canary Islands in a biorefinery’s context. Mater. Open Res. 2024, 3, 9. [Google Scholar] [CrossRef] [Scilit]
- ASPROCAN. Estadísticas de producción y comercialización de Plátano de Canarias, 2022; Asociación de Organizaciones de Productores de Plátanos de Canarias: Santa Cruz de Tenerife, Spain, 2022; p. 12. [Google Scholar]
- Bubici, G.; Kaushal, M.; Prigigallo, M.I.; Gómez-Lama Cabanás, C.; Mercado-Blanco, J. Biological control agents against Fusarium wilt of banana. Front. Microbiol. 2019, 10, 616, Correction in Front. Microbiol. 2019, 10, 1290. https://doi.org/10.3389/fmicb.2019.01290.. [Google Scholar] [CrossRef] [Scilit] [PubMed]
- Ploetz, R.C. Fusarium wilt of banana. Phytopathology 2015, 105, 1512–1521. [Google Scholar] [CrossRef] [Scilit] [PubMed]
- Ploetz, R.C. Management of Fusarium wilt of banana: A review with special reference to tropical race 4. Crop Prot. 2015, 73, 7–15. [Google Scholar] [CrossRef] [Scilit]
- Dita, M.; Teixeira, L.A.J.; O’Neill, W.; Pattison, A.B.; Weinert, M.P.; Li, C.Y.; Zheng, S.J.; Staver, C.; Thangavelu, R.; Viljoen, A. Current state of Fusarium wilt of banana in the subtropics. Acta Hortic. 2020, 1272, 45–56. [Google Scholar] [CrossRef] [Scilit]
- EPPO. Fusarium oxysporum f. sp. cubense Tropical Race 4 (FUSAC4). Available online: https://gd.eppo.int/taxon/FUSAC4/distribution (accessed on 28 July 2026).
- Olivares Campos, B.O. Banana Production in Venezuela: Novel Solutions to Productivity and Plant Health; Springer: Cham, Switzerland, 2023; p. 176. [Google Scholar] [CrossRef] [Scilit]
- Dale, J.; Paul, J.-Y.; Dugdale, B.; Harding, R. Modifying bananas: From transgenics to organics? Sustainability 2017, 9, 333. [Google Scholar] [CrossRef] [Scilit]
- Lopez-Cepero, J.; Puerta, M.; Piedra Buena, A. Guía para la Gestión Integrada de Plagas en Platanera (IPM Guide for Banana); Organización de Productores de Plátanos de Canarias: Santa Cruz de Tenerife, Spain, 2015; p. 44. [Google Scholar] [CrossRef] [Scilit]
- Toffolatti, S.L.; Davillerd, Y.; D’Isita, I.; Facchinelli, C.; Germinara, G.S.; Ippolito, A.; Khamis, Y.; Kowalska, J.; Maddalena, G.; Marchand, P.; et al. Are basic substances a key to sustainable pest and disease management in agriculture? An open field perspective. Plants 2023, 12, 3152. [Google Scholar] [CrossRef] [Scilit] [PubMed]
- Siamak, S.B.; Zheng, S. Banana Fusarium wilt (Fusarium oxysporum f. sp. cubense) control and resistance, in the context of developing wilt-resistant bananas within sustainable production systems. Hortic. Plant J. 2018, 4, 208–218. [Google Scholar] [CrossRef] [Scilit]
- Ismaila, A.A.; Ahmad, K.; Siddique, Y.; Wahab, M.A.A.; Kutawa, A.B.; Abdullahi, A.; Zobir, S.A.M.; Abdu, A.; Abdullah, S.N.A. Fusarium wilt of banana: Current update and sustainable disease control using classical and essential oils approaches. Hortic. Plant J. 2023, 9, 1–28. [Google Scholar] [CrossRef] [Scilit]
- Langa-Lomba, N.; Sánchez-Hernández, E.; Buzón-Durán, L.; González-García, V.; Casanova-Gascón, J.; Martín-Gil, J.; Martín-Ramos, P. Activity of anthracenediones and flavoring phenols in hydromethanolic extracts of Rubia tinctorum against grapevine phytopathogenic fungi. Plants 2021, 10, 1527. [Google Scholar] [CrossRef] [Scilit] [PubMed]
- Sánchez-Hernández, E.; Martín-Ramos, P.; Martín-Gil, J.; Santiago-Aliste, A.; Hernández-Navarro, S.; Oliveira, R.; González-García, V. Bark extract of Uncaria tomentosa L. for the control of strawberry phytopathogens. Horticulturae 2022, 8, 672. [Google Scholar] [CrossRef] [Scilit]
- Vega-Vásquez, P.; Mosier, N.S.; Irudayaraj, J. Nanoscale drug delivery systems: From Medicine to Agriculture. Front. Bioeng. Biotechnol. 2020, 8, 79. [Google Scholar] [CrossRef] [Scilit] [PubMed]
- Maluin, F.N.; Hussein, M.Z. Chitosan-based agronanochemicals as a sustainable alternative in crop protection. Molecules 2020, 25, 1611. [Google Scholar] [CrossRef] [Scilit] [PubMed]
- Deshmukh, S.; Pawar, K.; Koli, V.; Pachfule, P. Emerging graphitic carbon nitride-based nanobiomaterials for biological applications. ACS Appl. Bio Mater. 2023, 6, 1339–1367. [Google Scholar] [CrossRef] [Scilit] [PubMed]
- Lu, Y.; Dong, W.; Ding, J.; Wang, W.; Wang, A. Hydroxyapatite nanomaterials: Synthesis, properties, and functional applications. In Nanomaterials from Clay Minerals: A New Approach to Green Functional Materials; Wang, A., Wang, W., Eds.; Elsevier: Cambridge, MA, USA, 2019; pp. 485–536. [Google Scholar] [CrossRef] [Scilit]
- Santiago-Aliste, A.; Sánchez-Hernández, E.; Langa-Lomba, N.; González-García, V.; Casanova-Gascón, J.; Martín-Gil, J.; Martín-Ramos, P. Multifunctional nanocarriers based on chitosan oligomers and graphitic carbon nitride assembly. Materials 2022, 15, 8981. [Google Scholar] [CrossRef] [Scilit] [PubMed]
- Dante, R.C.; Martín-Ramos, P.; Correa-Guimaraes, A.; Martín-Gil, J. Synthesis of graphitic carbon nitride by reaction of melamine and uric acid. Mater. Chem. Phys. 2011, 130, 1094–1102. [Google Scholar] [CrossRef] [Scilit]
- Santiago-Aliste, A.; Sánchez-Hernández, E.; Buzón-Durán, L.; Marcos-Robles, J.L.; Martín-Gil, J.; Martín-Ramos, P. Uncaria tomentosa-loaded chitosan oligomers–hydroxyapatite–carbon nitride nanocarriers for postharvest fruit protection. Agronomy 2023, 13, 2189. [Google Scholar] [CrossRef] [Scilit]
- Nel, B. Management of Fusarium Wilt of Banana by Means of Biological and Chemical Control and Induced Resistance. Master’s Thesis, University of Pretoria, Pretoria, South Africa, 2004. [Google Scholar]
- Cabildo de Tenerife. Productos Fitosanitarios Autorizados en Platanera (Actualizado a 15 de Junio de 2026). Available online: https://coplaca.es/wp-content/uploads/2025/12/subt_48_Anexo-I-y-II_junio-2026.pdf (accessed on 16 September 2026).
- Carlier, J.; De Waele, D.; Escalant, J.-V. Global Evaluation of Musa Germplasm for Resistance to Fusarium Wilt, Mycosphaerella Leaf Spot Diseases and Nematodes: In-Depth Evaluation; International Network for the Improvement of Banana and Plantain: Montpellier, France, 2002; Volume 6, p. 68. [Google Scholar]
- Ing, L.Y.; Zin, N.M.; Sarwar, A.; Katas, H. Antifungal activity of chitosan nanoparticles and correlation with their physical properties. Int. J. Biomater. 2012, 2012, 632698. [Google Scholar] [CrossRef] [Scilit] [PubMed]
- Attjioui, M.; Gillet, D.; El Gueddari, N.E.; Moerschbacher, B.M. Synergistic antimicrobial effect of chitosan polymers and oligomers. Mol. Plant-Microbe Interact. 2021, 34, 770–778. [Google Scholar] [CrossRef] [Scilit] [PubMed]
- Seepe, H.A.; Nxumalo, W.; Amoo, S.O. Natural products from medicinal plants against phytopathogenic Fusarium species: Current research endeavours, challenges and prospects. Molecules 2021, 26, 6539. [Google Scholar] [CrossRef] [Scilit] [PubMed]
- Jasso de Rodríguez, D.; Hernández-Castillo, D.; Angulo-Sánchez, J.L.; Rodríguez-García, R.; Villarreal Quintanilla, J.A.; Lira-Saldivar, R.H. Antifungal activity in vitro of Flourensia spp. extracts on Alternaria sp., Rhizoctonia solani, and Fusarium oxysporum. Ind. Crops Prod. 2007, 25, 111–116. [Google Scholar] [CrossRef] [Scilit]
- Al-Araji, A.M.Y.; Hasan, A.M.; Fradi, A.J.; Majeed, S.M.A.; Majeed, W.W.A.; Naji, E.T. Study of alkaloids, phenols and terpenes of Mentha spicata as a fungicide against Rhizoctonia solani, Sclerotinia sclerotiorum and Fusarium oxysporum. Int. J. Adv. Biol. Res. 2017, 7, 345–354. [Google Scholar]
- Singh, U.P.; Pathak, K.K.; Khare, M.N.; Singh, R.B. Effect of leaf extract of garlic on Fusarium oxysporum f. sp. ciceri, Sclerotinia sclerotiorum and on gram seeds. Mycologia 1979, 71, 556–564. [Google Scholar] [CrossRef] [Scilit]
- Carmello, C.R.; Magri, M.M.R.; Cardoso, J.C. Cinnamon extract and sodium hypochlorite in the in vitro control of Fusarium oxysporum f. sp. lycopersici and Alternaria alternata from tomato. J. Phytopathol. 2022, 170, 802–810. [Google Scholar]
- Cherkupally, R.; Kota, S.R.; Amballa, H.; Reddy, B.N. In vitro antifungal potential of plant extracts against Fusarium oxysporum, Rhizoctonia solani and Macrophomina phaseolina. Ann. Plant Sci. 2017, 6, 1676. [Google Scholar] [CrossRef] [Scilit]
- Rongai, D.; Pulcini, P.; Pesce, B.; Milano, F. Antifungal activity of pomegranate peel extract against Fusarium wilt of tomato. Eur. J. Plant Pathol. 2016, 147, 229–238. [Google Scholar] [CrossRef] [Scilit]
- Bashar, M.; Chakma, M. In vitro control of Fusarium solani and F. oxysporum the causative agent of brinjal wilt. Dhaka Univ. J. Biol. Sci. 2014, 23, 53–60. [Google Scholar] [CrossRef] [Scilit]
- El-Mohamedy, R.S.; Abdalla, A.M. Evaluation of antifungal activity of Moringa oleifera extracts as natural fungicide against some plant pathogenic fungi in-vitro. J. Agric. Technol. 2014, 10, 963–982. [Google Scholar]
- Satish, S.; Raghavendra, M.P.; Raveesha, K.A. Antifungal potentiality of some plant extracts against Fusarium sp. Arch. Phytopathol. Pflanzenschutz 2009, 42, 618–625. [Google Scholar] [CrossRef] [Scilit]
- Sánchez-Hernández, E.; Langa-Lomba, N.; González-García, V.; Casanova-Gascón, J.; Martín-Gil, J.; Santiago-Aliste, A.; Torres-Sánchez, S.; Martín-Ramos, P. Lignin–chitosan nanocarriers for the delivery of bioactive natural products against wood-decay phytopathogens. Agronomy 2022, 12, 461. [Google Scholar] [CrossRef] [Scilit]
- Sánchez-Hernández, E.; García-Martín, J.; Luis-del Río, S.; Martín-Gil, J.; Casanova-Gascón, J.; Martín-Ramos, P. Nanoencapsulation of plant-derived antifungals in chitosan oligomer carriers reduces gray mold severity in ‘Tempranillo’ vineyards: Field efficacy and preliminary wine sensory assessment. Agronomy 2026, 16, 1847. [Google Scholar] [CrossRef] [Scilit]
- Lemke, P.; Jünemann, L.; Moerschbacher, B.M. Synergistic antimicrobial activities of chitosan mixtures and chitosan–copper combinations. Int. J. Mol. Sci. 2022, 23, 3345. [Google Scholar] [CrossRef] [Scilit] [PubMed]
- Roy, S.; Bhogapurapu, B.; Chandra, S.; Biswas, K.; Mishra, P.; Ghosh, A.; Bhunia, A. Host antimicrobial peptide S100A12 disrupts the fungal membrane by direct binding and inhibits growth and biofilm formation of Fusarium species. J. Biol. Chem. 2024, 300, 105701. [Google Scholar] [CrossRef] [Scilit] [PubMed]
- Kang, K.; Fong, W.-P.; Tsang, P.W.-K. Novel antifungal activity of purpurin against Candida species in vitro. Med. Mycol. 2010, 48, 904–911. [Google Scholar] [CrossRef] [Scilit] [PubMed]
- Manoharan, R.K.; Lee, J.-H.; Kim, Y.-G.; Lee, J. Alizarin and chrysazin inhibit biofilm and hyphal formation by Candida albicans. Front. Cell. Infect. Microbiol. 2017, 7, 447. [Google Scholar] [CrossRef] [Scilit] [PubMed]
- Tsang, P.W.-K.; Bandara, H.M.H.N.; Fong, W.-P. Purpurin suppresses Candida albicans biofilm formation and hyphal development. PLoS ONE 2012, 7, e50866. [Google Scholar] [CrossRef] [Scilit] [PubMed]
- Heitzman, M.E.; Neto, C.C.; Winiarz, E.; Vaisberg, A.J.; Hammond, G.B. Ethnobotany, phytochemistry and pharmacology of Uncaria (Rubiaceae). Phytochemistry 2005, 66, 5–29. [Google Scholar] [CrossRef] [Scilit] [PubMed]
- White, G.; Bourbonnais-Spear, N.; Garner, F. Antibacterial constituents from Uncaria tomentosa. Phytopharmacology 2011, 1, 16–19. [Google Scholar]
- Cantón, E.; Pemán, J.; Gobernado, M.; Viudes, A.; Espinel-Ingroff, A. Patterns of Amphotericin B killing kinetics against seven Candida species. Antimicrob. Agents Chemother. 2004, 48, 2477–2482. [Google Scholar] [CrossRef] [Scilit] [PubMed]
- Gómez-Lama Cabanás, C.; Fernández-González, A.J.; Cardoni, M.; Valverde-Corredor, A.; López-Cepero, J.; Fernández-López, M.; Mercado-Blanco, J. The banana root endophytome: Differences between mother plants and suckers and evaluation of selected bacteria to control Fusarium oxysporum f.sp. cubense. J. Fungi 2021, 7, 194. [Google Scholar] [CrossRef] [Scilit] [PubMed]
- Tian, L.; Zhang, W.; Zhou, G.-D.; Li, S.; Wang, Y.; Yang, B.; Bai, T.; Fan, H.; He, P.; Zheng, S.-J. A biological product of Bacillus amyloliquefaciens QST713 strain for promoting banana plant growth and modifying rhizosphere soil microbial diversity and community composition. Front. Microbiol. 2023, 14, 1216018. [Google Scholar] [CrossRef] [Scilit] [PubMed]
- Fan, H.; He, P.; Xu, S.; Li, S.; Wang, Y.; Zhang, W.; Li, X.; Shang, H.; Zeng, L.; Zheng, S.-J. Banana disease-suppressive soil drives Bacillus assembled to defense Fusarium wilt of banana. Front. Microbiol. 2023, 14, 1211301. [Google Scholar] [CrossRef] [Scilit] [PubMed]
- Shen, N.; Li, S.; Li, S.; Zhang, H.; Jiang, M. The siderophore-producing bacterium, Bacillus siamensis Gxun-6, has an antifungal activity against Fusarium oxysporum and promotes the growth of banana. Egypt. J. Biol. Pest Control 2022, 32, 34. [Google Scholar] [CrossRef] [Scilit]
- Damodaran, T.; Rajan, S.; Muthukumar, M.; Ram, G.; Yadav, K.; Kumar, S.; Ahmad, I.; Kumari, N.; Mishra, V.K.; Jha, S.K. Biological management of banana fusarium wilt caused by Fusarium oxysporum f. sp. cubense Tropical Race 4 using antagonistic fungal isolate CSR-T-3 (Trichoderma reesei). Front. Microbiol. 2020, 11, 595845. [Google Scholar] [CrossRef] [Scilit] [PubMed]
- Long, W.; Chen, Y.; Wei, Y.; Feng, J.; Zhou, D.; Cai, B.; Qi, D.; Zhang, M.; Zhao, Y.; Li, K.; et al. A newly isolated Trichoderma parareesei N4-3 exhibiting a biocontrol potential for banana Fusarium wilt by hyperparasitism. Front. Plant Sci. 2023, 14, 1289959. [Google Scholar] [CrossRef] [Scilit] [PubMed]
- Luo, M.; Chen, Y.; Huang, Q.; Huang, Z.; Song, H.; Dong, Z. Trichoderma koningiopsis Tk905: An efficient biocontrol, induced resistance agent against banana Fusarium wilt disease and a potential plant-growth-promoting fungus. Front. Microbiol. 2023, 14, 1301062. [Google Scholar] [CrossRef] [Scilit] [PubMed]
- Fu, L.; Ruan, Y.; Tao, C.; Li, R.; Shen, Q. Continuous application of bioorganic fertilizer induced resilient culturable bacteria community associated with banana Fusarium wilt suppression. Sci. Rep. 2016, 6, 27731. [Google Scholar] [CrossRef] [Scilit] [PubMed]
- Rizal, S.; Saha, P.; Das, S.; Bera, S.; Datta, J. Comprehensive review on pathogenesis, pathogenicity, detection, molecular profiling, epidemiology and management of Fusarium wilt of banana. Discov. Plants 2025, 2, 276. [Google Scholar] [CrossRef] [Scilit]
- Uesugi, Y. Fungicide classes: Chemistry, uses and mode of action. In Fungicidal Activity: Chemical and Biological Approaches to Plant Protection; Hutson, D.H., Miyamoto, J., Eds.; John Wiley & Sons: Chichester, UK, 1998; pp. 23–53. [Google Scholar]
- Niwas, R.; Chand, G.; Azad, C.S. In vitro evaluation of fungicides against growth of Fusarium oxysporum f. sp. cubense causing Panama wilt disease of banana. Int. J. Chem. Stud. 2020, 8, 191–194. [Google Scholar] [CrossRef] [Scilit]
- European Commission. Commission Implementing Regulation (EU) 2018/1865 of 28 November 2018 concerning the non-renewal of approval of the active substance propiconazole, in accordance with Regulation (EC) No 1107/2009 of the European Parliament and of the Council concerning the placing of plant protection products on the market, and amending Commission Implementing Regulation (EU) No 540/2011. Off. J. Eur. Union 2018, L 304, 6–9. [Google Scholar]
- Pattison, A.B.; Limbaga, C.; Gervacio, T.; Notarte, A.; Juruena, M.; Dennis, P.G.; Lindsay, S.J.; Molina, A. Integrated Management of Fusarium Wilt of Bananas in the Philippines and Australia; Australian Government—Australian Centre for International Agricultural Research: Canberra, Australia, 2019. [Google Scholar]
- van den Berg, F.; Paveley, N.D.; van den Bosch, F. Dose and number of applications that maximize fungicide effective life exemplified by Zymoseptoria tritici on wheat—A model analysis. Plant Pathol. 2016, 65, 1380–1389. [Google Scholar] [CrossRef] [Scilit] [PubMed]
- Jung, J.; Ahn, S.; Kim, D.-H.; Riu, M. Triple interactions for induced systemic resistance in plants. Front. Plant Sci. 2024, 15, 1464710. [Google Scholar] [CrossRef] [Scilit] [PubMed]
- Miya, A.; Albert, P.; Shinya, T.; Desaki, Y.; Ichimura, K.; Shirasu, K.; Narusaka, Y.; Kawakami, N.; Kaku, H.; Shibuya, N. CERK1, a LysM receptor kinase, is essential for chitin elicitor signaling in Arabidopsis. Proc. Natl. Acad. Sci. USA 2007, 104, 19613–19618. [Google Scholar] [CrossRef] [Scilit] [PubMed]
- Mukarram, M.; Ali, J.; Dadkhah-Aghdash, H.; Kurjak, D.; Kačík, F.; Ďurkovič, J. Chitosan-induced biotic stress tolerance and crosstalk with phytohormones, antioxidants, and other signalling molecules. Front. Plant Sci. 2023, 14, 1217822. [Google Scholar] [CrossRef] [Scilit] [PubMed]
- Lopez-Moya, F.; Zorrilla-Fontanesi, J.; Lozano-Soria, A.; de Larrinoa Ganado, N.F.; Moreno González, C.M.; Hernández, A.; Torres, A.; Gonzalez-Silvera, D.; Gunsé, B.; Lopez Jimenez, J.A.; et al. Chitosan induces salicylic acid and methyl salicylate in banana plants and reduces colonisation by Fusarium oxysporum f. sp. cubense TR4. Curr. Plant Biol. 2025, 42, 100457. [Google Scholar] [CrossRef] [Scilit]
- De Vega, D.; Holden, N.; Hedley, P.E.; Morris, J.; Luna, E.; Newton, A. Chitosan primes plant defence mechanisms against Botrytis cinerea, including expression of Avr9/Cf-9 rapidly elicited genes. Plant Cell Environ. 2021, 44, 290–303. [Google Scholar] [CrossRef] [Scilit] [PubMed]
- Iula, G.; Miras-Moreno, B.; Rouphael, Y.; Lucini, L.; Trevisan, M. The complex metabolomics crosstalk triggered by four molecular elicitors in tomato. Plants 2022, 11, 678. [Google Scholar] [CrossRef] [Scilit] [PubMed]
- Iriti, M.; Faoro, F. Chitosan as a MAMP, searching for a PRR. Plant Signal. Behav. 2009, 4, 66–68. [Google Scholar] [CrossRef] [Scilit] [PubMed]
- Wang, X.; Xie, H.; Wang, P.; Yin, H. Nanoparticles in plants: Uptake, transport and physiological activity in leaf and root. Materials 2023, 16, 3097. [Google Scholar] [CrossRef] [Scilit] [PubMed]
- Aibani, N.; Rai, R.; Patel, P.; Cuddihy, G.; Wasan, E.K. Chitosan nanoparticles at the biological interface: Implications for drug delivery. Pharmaceutics 2021, 13, 1686. [Google Scholar] [CrossRef] [Scilit] [PubMed]
- Sharma, S.; Muddassir, M.; Muthusamy, S.; Vaishnav, P.K.; Singh, M.; Sharma, D.; Kanagarajan, S.; Shanmugam, V. A non-classical route of efficient plant uptake verified with fluorescent nanoparticles and root adhesion forces investigated using AFM. Sci. Rep. 2020, 10, 19233. [Google Scholar] [CrossRef] [Scilit] [PubMed]
- Ievinsh, G. Water content of plant tissues: So simple that almost forgotten? Plants 2023, 12, 1238. [Google Scholar] [CrossRef] [Scilit] [PubMed]
- Rojas-Pirela, M.; Carillo, P.; Lárez-Velásquez, C.; Romanazzi, G. Effects of chitosan on plant growth under stress conditions: Similarities with plant growth promoting bacteria. Front. Plant Sci. 2024, 15, 1423949. [Google Scholar] [CrossRef] [Scilit] [PubMed]
- Stasińska-Jakubas, M.; Hawrylak-Nowak, B. Protective, biostimulating, and eliciting effects of chitosan and its derivatives on crop plants. Molecules 2022, 27, 2801. [Google Scholar] [CrossRef] [Scilit] [PubMed]
- Agbodjato, N.A.; Noumavo, P.A.; Adjanohoun, A.; Agbessi, L.; Baba-Moussa, L. Synergistic effects of plant growth promoting rhizobacteria and chitosan on in vitro seeds germination, greenhouse growth, and nutrient uptake of maize (Zea mays L.). Biotechnol. Res. Int. 2016, 2016, 7830182. [Google Scholar] [CrossRef] [Scilit] [PubMed]
- Vasantha Kumar, N.; Raghavendra, V.B.; Murthy, A.N.; Lokesh, S. Copper-chitosan nanoparticles boost plant growth stimulation and induced resistance against Fusarium wilt of banana (Musa sp.). Agric. Res. Technol. Open Access J. 2023, 27, 556373. [Google Scholar] [CrossRef] [Scilit]
- Wang, A.; Li, J.; Al-Huqail, A.A.; Al-Harbi, M.S.; Ali, E.F.; Wang, J.; Ding, Z.; Rekaby, S.A.; Ghoneim, A.M.; Eissa, M.A. Mechanisms of chitosan nanoparticles in the regulation of cold stress resistance in banana plants. Nanomaterials 2021, 11, 2670. [Google Scholar] [CrossRef] [Scilit] [PubMed]
- European Commission. Commission Implementing Regulation (EU) 2022/456 of 21 March 2022 approving the basic substance chitosan in accordance with Regulation (EC) No 1107/2009 of the European Parliament and of the Council concerning the placing of plant protection products on the market, and amending the Annex to Implementing Regulation (EU) No 540/2011. Off. J. Eur. Union 2022, L 93, 138–141. [Google Scholar]
- European Parliament; Council of the European Union. Regulation (EC) No 1107/2009 of the European Parliament and of the Council of 21 October 2009 concerning the placing of plant protection products on the market and repealing Council Directives 79/117/EEC and 91/414/EEC. Off. J. Eur. Union 2009, L 309, 1–50. [Google Scholar]
- European Parliament; Council of the European Union. Regulation (EU) 2019/1009 of 5 June 2019 laying down rules on the making available on the market of EU fertilising products and amending Regulations (EC) No 1069/2009 and (EC) No 1107/2009 and repealing Regulation (EC) No 2003/2003. Off. J. Eur. Union 2019, L 170, 1–114. [Google Scholar]
- He, Y.; Zhou, X.; Li, J.; Li, H.; Li, Y.; Nie, Y. In vitro secretome analysis suggests differential pathogenic mechanisms between Fusarium oxysporum f. sp. cubense Race 1 and Race 4. Biomolecules 2021, 11, 1353. [Google Scholar] [CrossRef] [Scilit] [PubMed]
- Lopez-Nuñez, R.; Lopez-Moya, F.; Marhuenda-Egea, F.C.; Lopez-Llorca, L.V. Chitosan coacervates with the biocontrol fungus Pochonia chlamydosporia stimulate Musa acuminata growth and inhibit banana Fusarium wilt fungus. Carbohydr. Polym. Technol. Appl. 2025, 11, 100990. [Google Scholar] [CrossRef] [Scilit]
- Malerba, M.; Cerana, R. Chitosan effects on plant systems. Int. J. Mol. Sci. 2016, 17, 996. [Google Scholar] [CrossRef] [Scilit] [PubMed]
- Grillo, R.; Abhilash, P.C.; Fraceto, L.F. Nanotechnology applied to bio-encapsulation of pesticides. J. Nanosci. Nanotechnol. 2016, 16, 1231–1234. [Google Scholar] [CrossRef] [Scilit] [PubMed]
- Sánchez-Hernández, E.; González-García, V.; Correa-Guimarães, A.; Casanova-Gascón, J.; Martín-Gil, J.; Martín-Ramos, P. Phytochemical profile and activity against Fusarium species of Tamarix gallica bark aqueous ammonia extract. Agronomy 2023, 13, 496. [Google Scholar] [CrossRef] [Scilit]
- Sánchez-Hernández, E.; Álvarez-Martínez, J.; González-García, V.; Casanova-Gascón, J.; Martín-Gil, J.; Martín-Ramos, P. Helichrysum stoechas (L.) Moench inflorescence extract for tomato disease management. Molecules 2023, 28, 5861. [Google Scholar] [CrossRef] [Scilit] [PubMed]
- Sánchez-Hernández, E.; Martín-Ramos, P.; Navas Gracia, L.M.; Martín-Gil, J.; Garcés-Claver, A.; Flores-León, A.; González-García, V. Armeria maritima (Mill.) Willd. flower hydromethanolic extract for Cucurbitaceae fungal diseases control. Molecules 2023, 28, 3730. [Google Scholar] [CrossRef] [Scilit] [PubMed]
- Al-Reza, S.M.; Rahman, A.; Ahmed, Y.; Kang, S.C. Inhibition of plant pathogens in vitro and in vivo with essential oil and organic extracts of Cestrum nocturnum L. Pestic. Biochem. Physiol. 2010, 96, 86–92. [Google Scholar] [CrossRef] [Scilit]
- Nelson, D.; Beattie, K.; McCollum, G.; Martin, T.; Sharma, S.; Rao, J.R. Performance of natural antagonists and commercial microbiocides towards in vitro suppression of flower bed soil-borne Fusarium oxysporum. Adv. Microbiol. 2014, 4, 151–159. [Google Scholar] [CrossRef]
- Patnaik, S.; Martha, S.; Acharya, S.; Parida, K.M. An overview of the modification of g-C3N4 with high carbon containing materials for photocatalytic applications. Inorg. Chem. Front. 2016, 3, 336–347. [Google Scholar] [CrossRef] [Scilit]
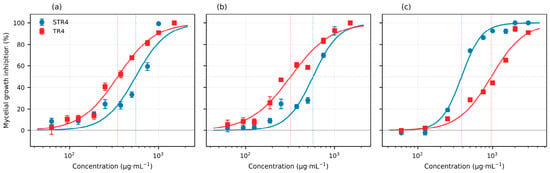
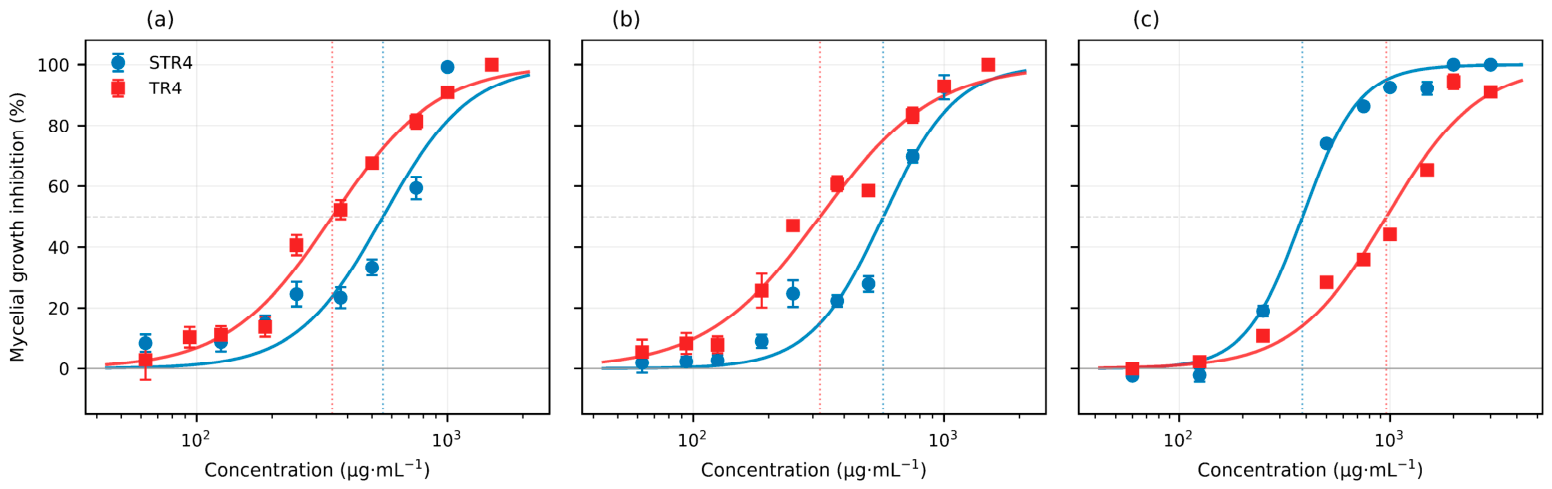
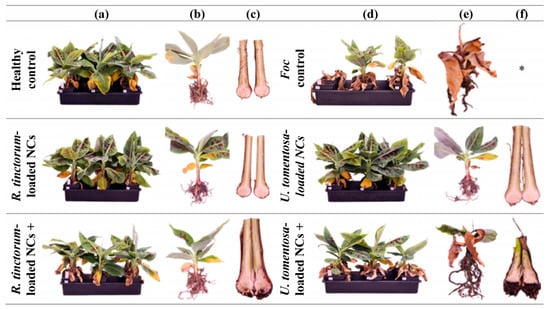
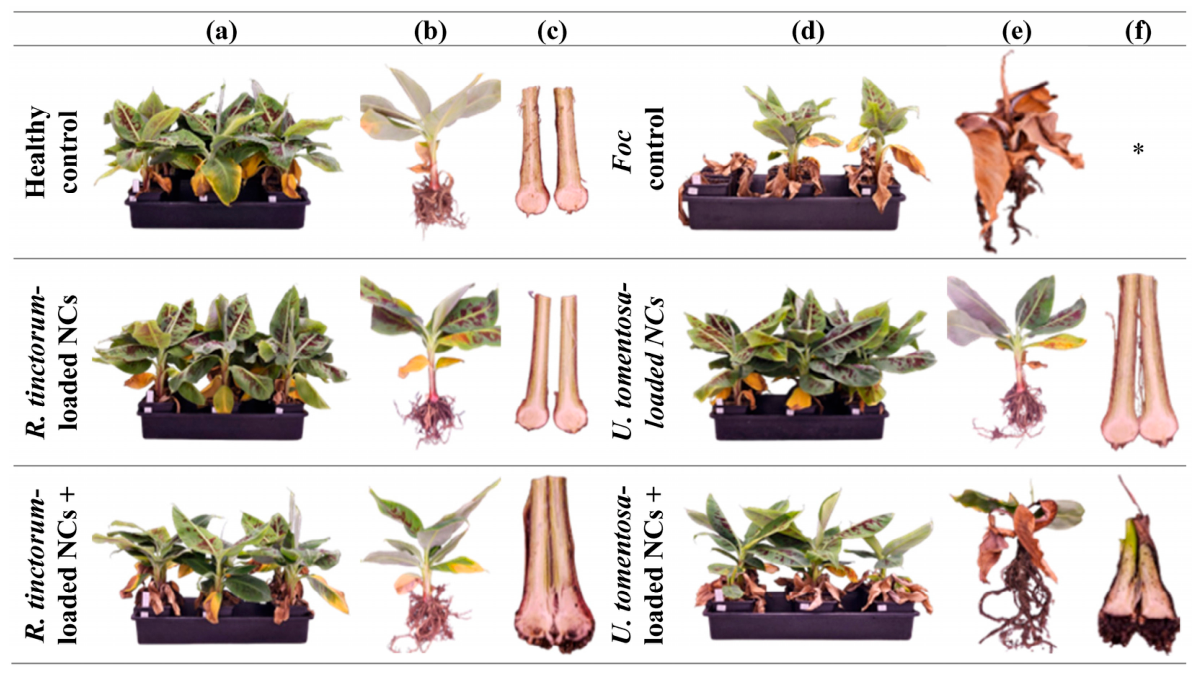

Disclaimer/Publisher’s Note: The statements, opinions and data contained in all publications are solely those of the individual author(s) and contributor(s) and not of MDPI and/or the editor(s). MDPI and/or the editor(s) disclaim responsibility for any injury to people or property resulting from any ideas, methods, instructions or products referred to in the content. |
© 2026 by the authors. Licensee MDPI, Basel, Switzerland. This article is an open access article distributed under the terms and conditions of the Creative Commons Attribution (CC BY) license.