


Abstract
To reveal the varieties and color genesis of emerald-green tourmaline crystals from Tanzania, a systematic study was conducted using conventional gemological tests, X-ray diffraction, Fourier-transform infrared spectroscopy, polarized ultraviolet–visible spectroscopy (UV–vis), X-ray photoelectron spectroscopy (XPS), low-temperature photoluminescence (PL) spectroscopy, and electron probe microanalysis (EPMA). The results indicate that the tourmaline is dravite. Its UV–vis absorption spectrum shows strong broad absorption bands at approximately 436 and 600 nm, with a pronounced transmission at 520 nm, which directly accounts for its emerald green color. Obvious polarized absorption was observed along and perpendicular to the c-axis. XPS and PL results confirm that chromium is present in the samples in the form of Cr3+. EPMA compositional analysis indicated a low Cr2O3 content of 0.804 wt.%; combined with crystal structural properties and spectral responses, these results suggest that Cr3+ preferentially occupies the Y site in the crystal structure and that d–d electronic transitions represent the underlying mechanism of its color formation. This study comprehensively illustrated the mineralogical and spectral properties of Cr-bearing dravite, providing fundamental data for further research on its genesis and gemological application.
1. Introduction
Tourmaline is a borosilicate mineral with highly complex chemical compositions and crystal structures. Their general crystal chemical formula is XY3Z6[Si6O18][BO3]3V3W, where X = Na and Ca; Y = Li, Mg, Fe2+, Mn2+, Al, Cr3+, V3+, and Fe3+; Z = Mg, Al, Fe3+, V3+, and Cr3+; V = OH and O; and W = OH, F, and O. Extensive isomorphous substitution occurs at the X, Y, Z, V, and W sites in the crystal chemical formula [1,2,3,4,5,6]. Accordingly, tourmaline crystals comprise a wide variety of species, including common elbaite, schorl, and dravite [7,8,9,10]. They exhibit abundant colors, such as red, yellow, green, blue, and other hues with diverse tones [11].
The color of tourmaline is mainly induced by trace transition-metal ions [11,12], and substantial research progress has been made regarding its color genesis. For example, pink color is often associated with d-d electronic transitions of Mn3+ in an octahedron [13]; red color may originate from the combined effects of Mn2+ and Fe3+ [14]; and blue color is usually attributed to Cu2+ and Mn3+ [15,16,17,18,19]. However, some studies have shown [20,21] that tourmaline may display distinctly different colors even with similar types of transition-metal ions, owing to differences in ionic occupancy and coordination environment.
Emerald-green tourmaline has attracted considerable attention due to its appealing color and high commercial value. However, studies on its mineral classification and coloration mechanism remain relatively limited [22,23,24], which constrains its accurate identification and color enhancement. In this context, this study focuses on emerald-green tourmaline from Tanzania and establishes an integrated analytical framework combining ultraviolet–visible spectroscopy (UV–vis), X-ray diffraction (XRD), Fourier-transform infrared (FTIR) spectroscopy, X-ray photoelectron spectroscopy (XPS), and electron probe microanalysis (EPMA). This approach aims to correlate and couple the mineral species, color characteristics, crystal structures of the samples and the chemical states (valence and site occupancy) of chromophoric ions, thereby forming a closed-loop line of evidence across the elemental, structural, and optical levels. The method is expected not only to provide a solid theoretical basis for color enhancement and geographical origin identification of tourmaline, but also to establish a reliable analytical paradigm for unraveling the color genesis of similar complex mineral systems.
2. Materials and Methods
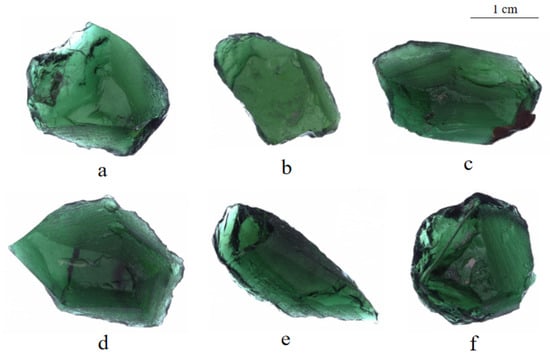
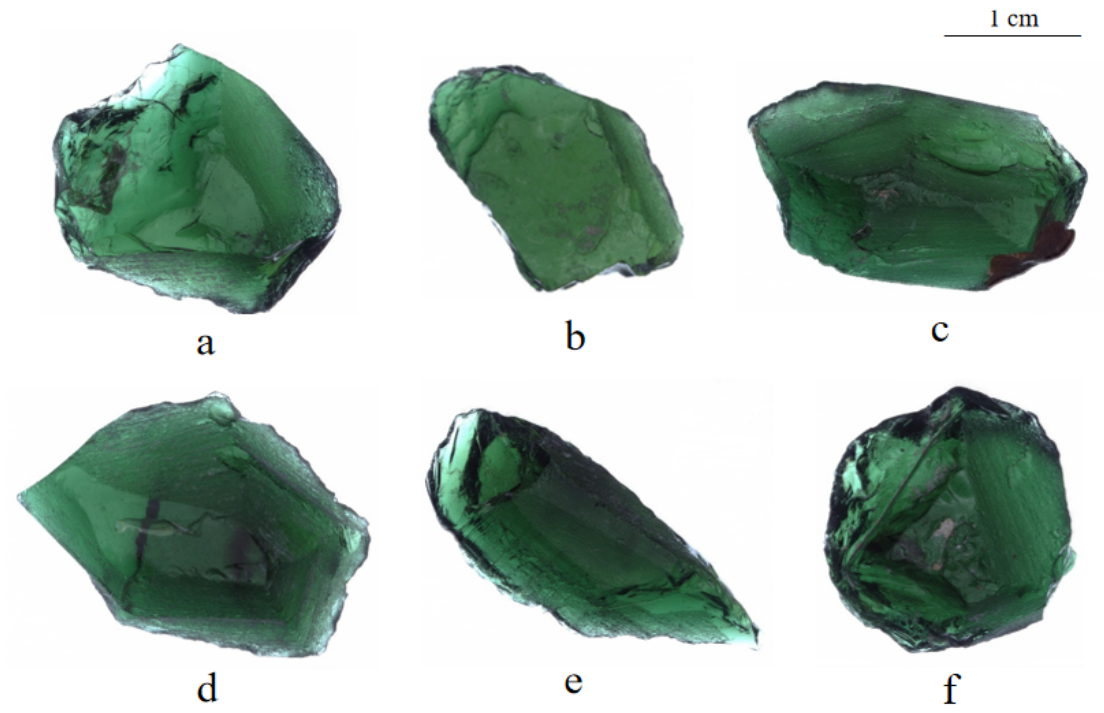
The experimental materials were natural single tourmaline fragments from Tanzania, which exhibit typical emerald green color, massive morphology, and particle sizes ranging from 1 to 2 cm (Figure 1).
Figure 1.
(a–f) Samples of tourmaline fragments.
To comprehensively characterize the properties of the tourmaline samples, this study integrates conventional gemological testing with multiple spectroscopic techniques.
First, the specific gravity, refractive index, extinction characteristics, and internal inclusion morphologies of the samples were determined using the hydrostatic weighing method, refractometer, polarizing microscope, and gemological microscope, respectively.
Subsequently, a series of spectroscopic instrumental analyses was carried out. XRD and photoluminescence (PL) measurements were both performed at the Jewelry and Advanced Materials Research Center, Guangzhou Polytechnic University. A Bruker D8 ADVANCE diffractometer (Bruker, Karlsruhe, Germany) was adopted for phase analysis of powdered samples ground to approximately 10 μm. The test conditions were as follows: Cu target, 40 kV/40 mA, scanning range of 5–70° (2θ), scanning rate of 2.5°/min, and step size of 0.05°.
PL spectra were collected on well-polished flat crystal planes of tourmaline via a Renishaw Qontor confocal Raman microscope (Renishaw, Wotton-under-Edge, UK) equipped with a 50× objective lens. A 532 nm laser was used as the excitation source with a maximum power of 50 mW, and the actual applied power was 1% of the full power. The exposure time was set as 1 s with five scanning accumulations. All measurements were performed at 300 K (room temperature) and 77 K (liquid nitrogen temperature).
Polarized UV-Vis-NIR absorption spectra of tourmaline were measured using a JASCO MSV-5200 microspectrophotometer (JASCO, Tokyo, Japan) equipped at the Gemstone Testing Center, School of Jewelry, China University of Geosciences (Wuhan). Prior to measurement, the tourmaline crystal was cut parallel to the c-axis into a 2.5 mm thick thin section, which was double-sided polished to ensure uniform optical path length. The spectra were collected in transmission mode over the range of 300–800 nm with a data interval of 1 nm and a scan speed of 2000 nm/min. The instrument is equipped with an auto-rotating Glan-Taylor polarizer (JASCO, Tokyo, Japan), and the polarization angle was set to 90° (electric field vector perpendicular to the crystal c-axis, E⊥c). The spot size was set to 200 μm. Baseline correction was performed prior to data acquisition to ensure signal stability and accuracy.
Infrared spectroscopy (IR), XPS, and electron probe microanalysis (EPMA) were all conducted at the Center for Materials Research and Analysis, Wuhan University of Technology.
Among these, IR analysis was performed using a Nicolet 6700 spectrometer (Thermo Fisher Scientific, Waltham, MA, USA). Data were collected in the range of 4000–400 cm−1 using the KBr pellet transmission method. XPS analysis of surface elements and chemical states was conducted using an ESCALAB 250Xi spectrometer (Thermo Fisher Scientific, Waltham, MA, USA). Prior to testing, samples were prepared by creating fresh fracture surfaces. Measurements were conducted using an Al Ka radiation source (1253.6 eV) under conditions of 14.2 kV and 11.3 mA, in a vacuum better than 10−7 Pa. The survey scan range was 0–1200 eV. High-resolution scans were repeatedly performed on characteristic spectral lines of trace elements to improve the signal-to-noise ratio. All binding energies were calibrated with reference to the C1s standard peak at 284.6 eV.
Electron probe microanalysis (EPMA) was performed using a JEOL JXA-8230 electron probe microanalyzer (JEOL, Tokyo, Japan). During the experiment, the voltage was set to 15 kV, the current to 20 nA, and the beam spot diameter to 10 μm. Quantitative analysis was conducted using a wavelength-dispersive spectrometer, and data were corrected for matrix effects using the ZAF method. All measurements were carried out under high vacuum conditions.
3. Results
3.1. Gemological Characteristics
The emerald-green tourmaline from Tanzania exhibits bright and uniform coloration. The rough fragments are massive in morphology, mostly 1–2 cm in particle size, with vitreous luster, high internal purity and excellent transparency. Under magnification with a gemological microscope, the samples are essentially inclusion-free, with only occasional gas–liquid inclusions observed. Under a polarizing microscope, they exhibit the typical four-light and four-dark extinction pattern. The measured relative density is 3.05, and the refractive indices are Ne = 1.624 and No = 1.646.
3.2. XRD Analysis
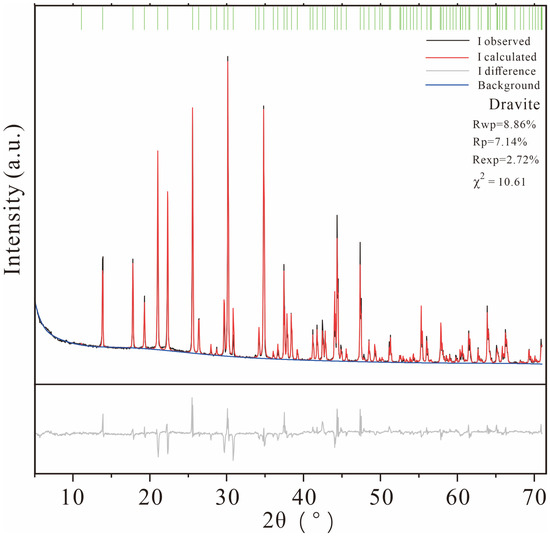
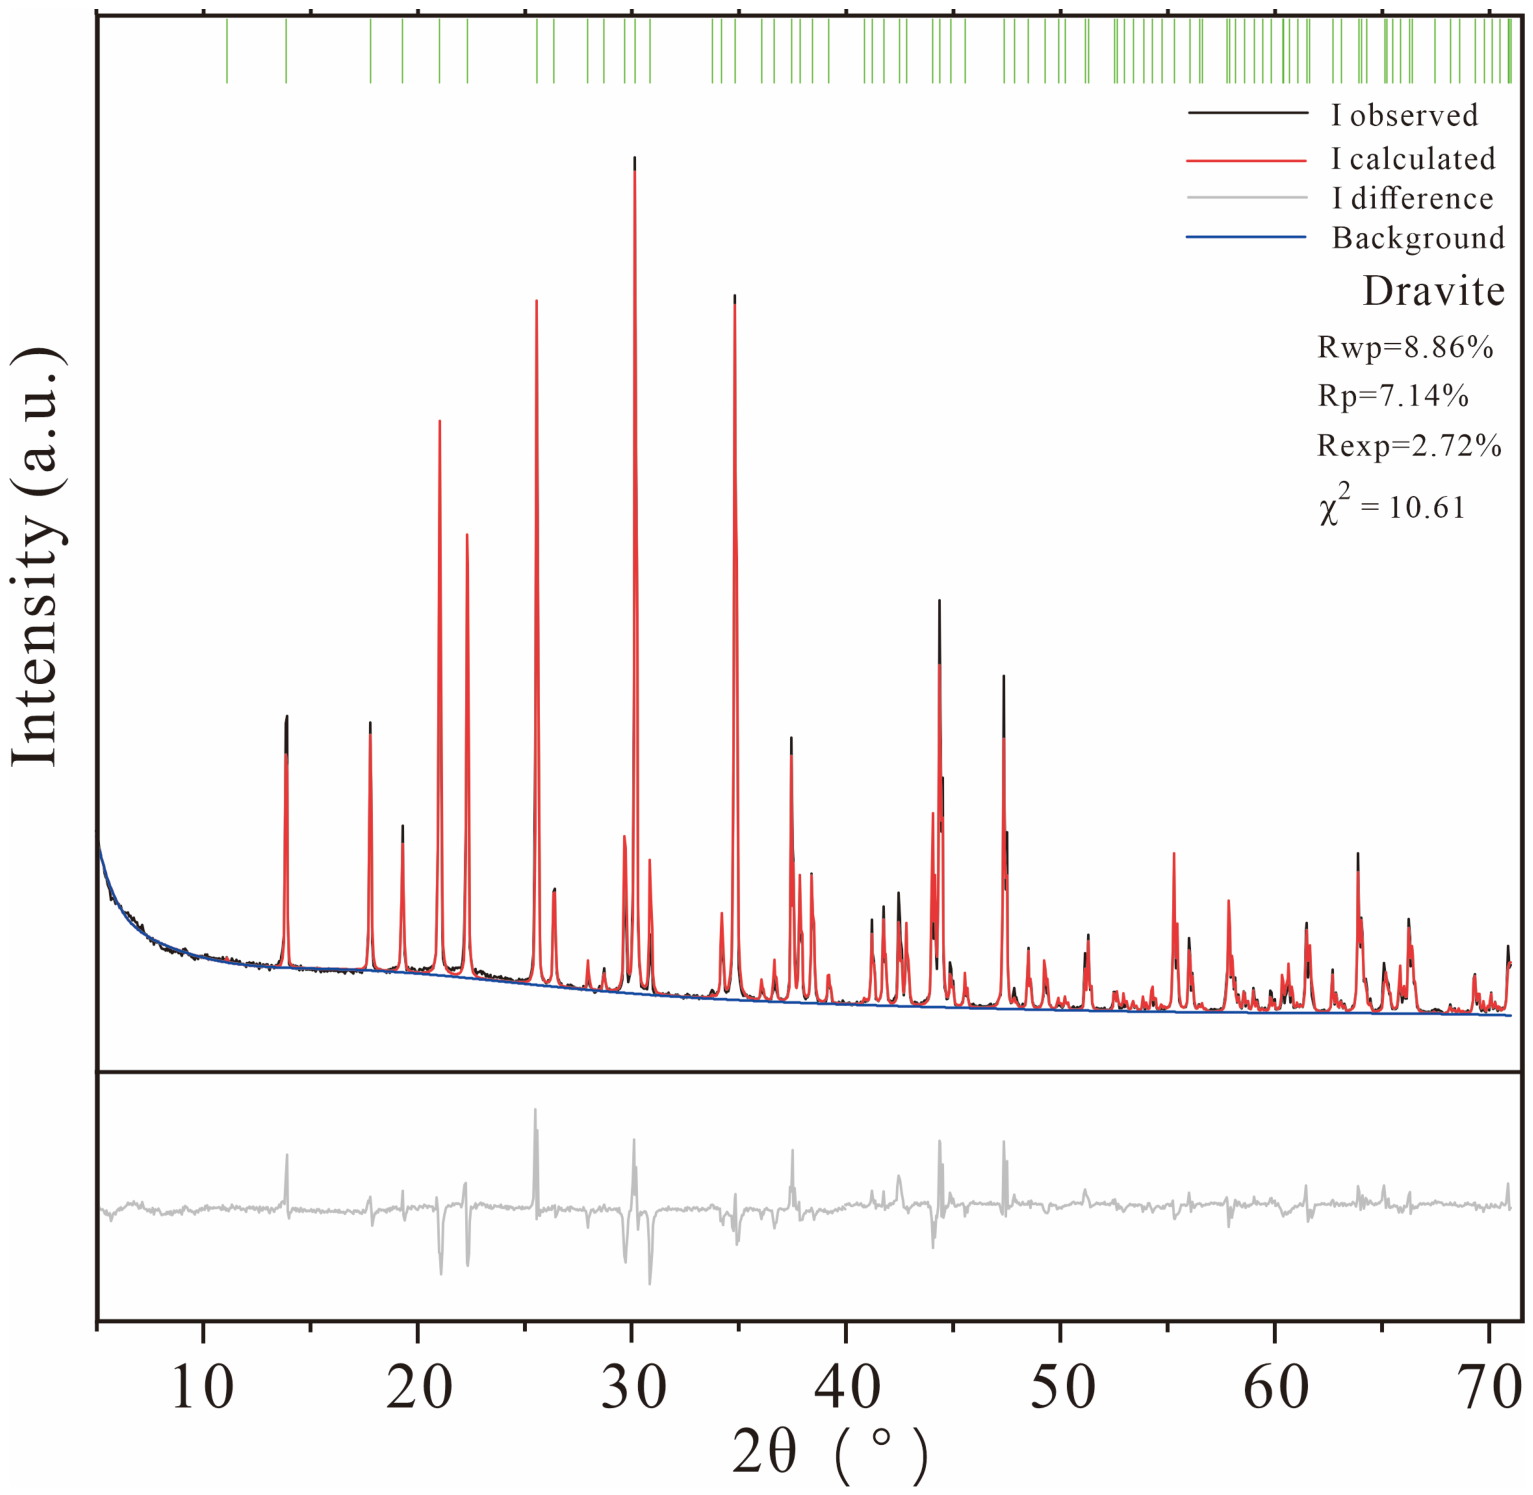
The powder X-ray diffraction (XRD) pattern and its Rietveld full-profile refinement results of the investigated tourmaline sample are presented in Figure 2. The black curve denotes the experimentally measured diffraction intensity, while the red curve represents the theoretical diffraction profile calculated based on the crystal structure model. The gray curve at the bottom shows the difference between experimental and calculated patterns, and the green vertical lines above the pattern correspond to standard Bragg diffraction positions of the target phase.
Figure 2.
Rietveld refinement of the powder X-ray diffraction pattern of the investigated tourmaline sample.
Rietveld full-profile refinement was carried out using BGMN 4.2.22 software. The initial crystal structure model was adopted from the Crystallography Open Database (COD) with ID 9016720 for dravite. The experimental background was fitted by a Chebyshev polynomial, and stable convergence was achieved after 177 iterations.
The refined agreement factors are listed as follows: profile factor Rp = 7.14%, weighted profile factor Rwp = 8.86%, expected profile factor Rexp = 2.72%, and goodness-of-fit χ2 = 10.61. All residual parameters fall within the reasonable range for mineral Rietveld refinement. The difference curve is smooth without obvious systematic deviation, demonstrating good consistency between experimental diffraction data and the adopted structural model, and validating the reliability of refinement results. No obvious impurity diffraction peaks are detected, confirming the sample is pure dravite.
The refined unit cell parameters of dravite are a0 = 15.92457(34) Å and c0 = 7.19861(18) Å.
3.3. FTIR Spectroscopy Analysis
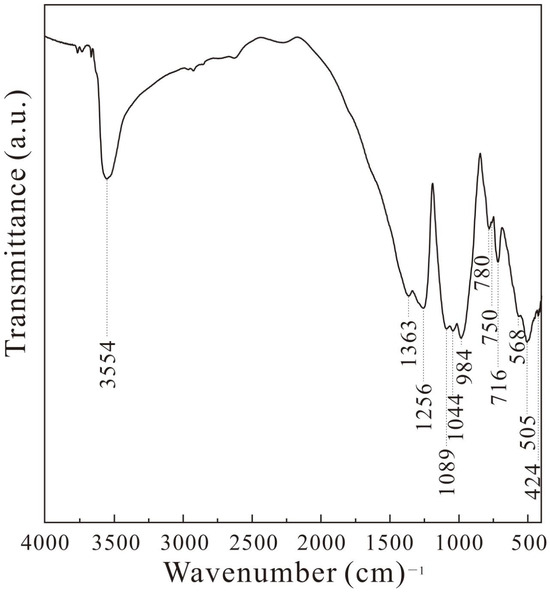
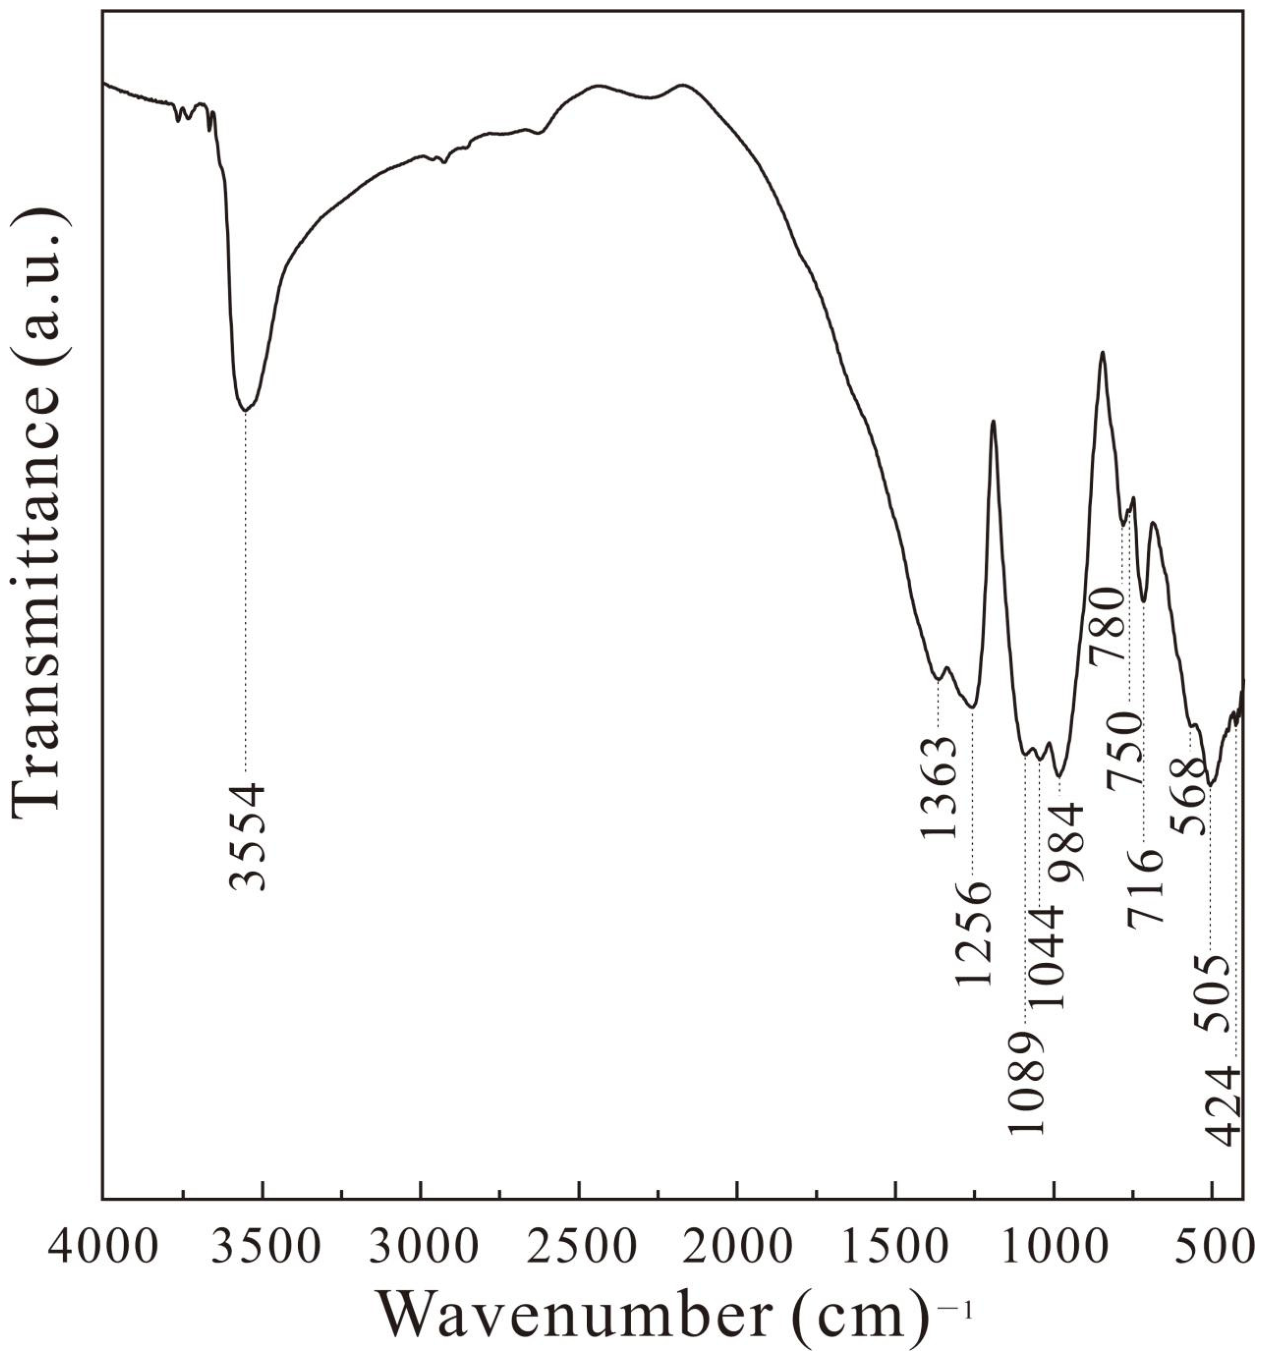
The FTIR spectrum of the emerald-green tourmaline from Tanzania is shown in Figure 3. Its general characteristics are consistent with the standard infrared spectrum of tourmaline [25] while exhibiting its own spectral features. The assignments of vibrational groups corresponding to the absorption peaks [25,26,27,28,29,30] are listed in Table 1.
Figure 3.
Fourier-transform infrared spectrum of the investigated tourmaline sample.
Table 1.
The main infrared vibration peaks of tourmaline (unit: cm−1).
3.3.1. M–O Octahedral Cation Vibrations
An absorption peak at 424 cm−1 appears in the 400–500 cm−1 range. The absorption peaks in this range originate from the vibration of the chemical bond [MO6] between metal cations (such as Fe, Mg, and Al) and oxygen [26]. According to previous studies, the 424 cm−1 absorption peak is absent in elbaite and substantially stronger in dravite than in schorl. Therefore, it can be attributed to Mg–O vibrations in the [MgO6] coordination polyhedron.
3.3.2. [SiO4] Ionic Group Vibrations
A series of absorption peaks at 505, 568, 716, 750, 780, 984, 1044, and 1089 cm−1 are observed in the range of 500–1110 cm−1. These peaks exhibit good symmetry, reflecting the vibrational characteristics of the [Si6O18] group. Among them, the strong peak at 505 cm−1 and the weaker peak at 568 cm−1 coexist and are attributed to δSi–O bending vibrations. The peaks at 716, 750, and 780 cm−1 are caused by νsSi–O–Si symmetric stretching vibrations, while the peak at 1089 cm−1 corresponds to νasSi–O–Si asymmetric stretching vibrations. The peaks at 984 and 1044 cm−1 are assigned to νsO–Si–O and νasO–Si–O, respectively [25,27].
3.3.3. [BO3] Atomic Group Vibration
The absorption peak at 1256 cm−1 is caused by intense νB–O stretching vibrations [26,27,28,29].
3.3.4. OH Vibration
The absorption peaks at 1363 and 3554 cm−1 are assigned to δOH bending and νOH stretching vibrations, respectively [30].
3.3.5. Characteristics and Special Spectral Features of Dravite
The above FTIR spectral features indicate that the sample is dravite: the νOH stretching vibration appears as a single peak (3554 cm−1) [27,30], distinguishing it from the double-peak feature of elbaite, and its wavenumber is higher than that of schorl. The νB–O stretching vibration (1256 cm−1) and the νMg–O absorption peak (424 cm−1) are both consistent with the structural characteristics of dravite. In addition, the δSi–O bending vibration exhibits a distinctive paired feature, with one strong peak (505 cm−1) and one weak peak (568 cm−1). Notably, the 568 cm−1 absorption peak has rarely been reported in previous studies [25,26,27,28,29,30].
3.4. Polarized UV-Vis Absorption Spectroscopy Analysis
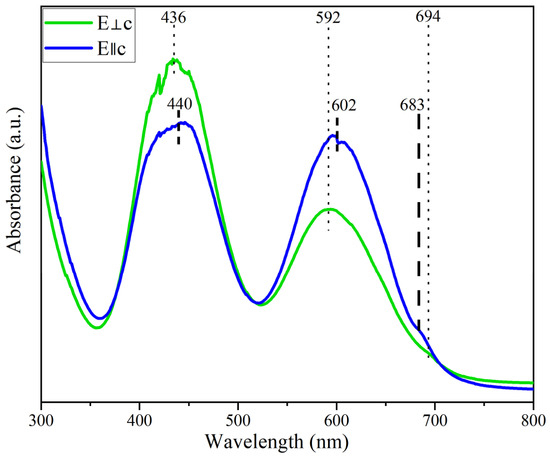
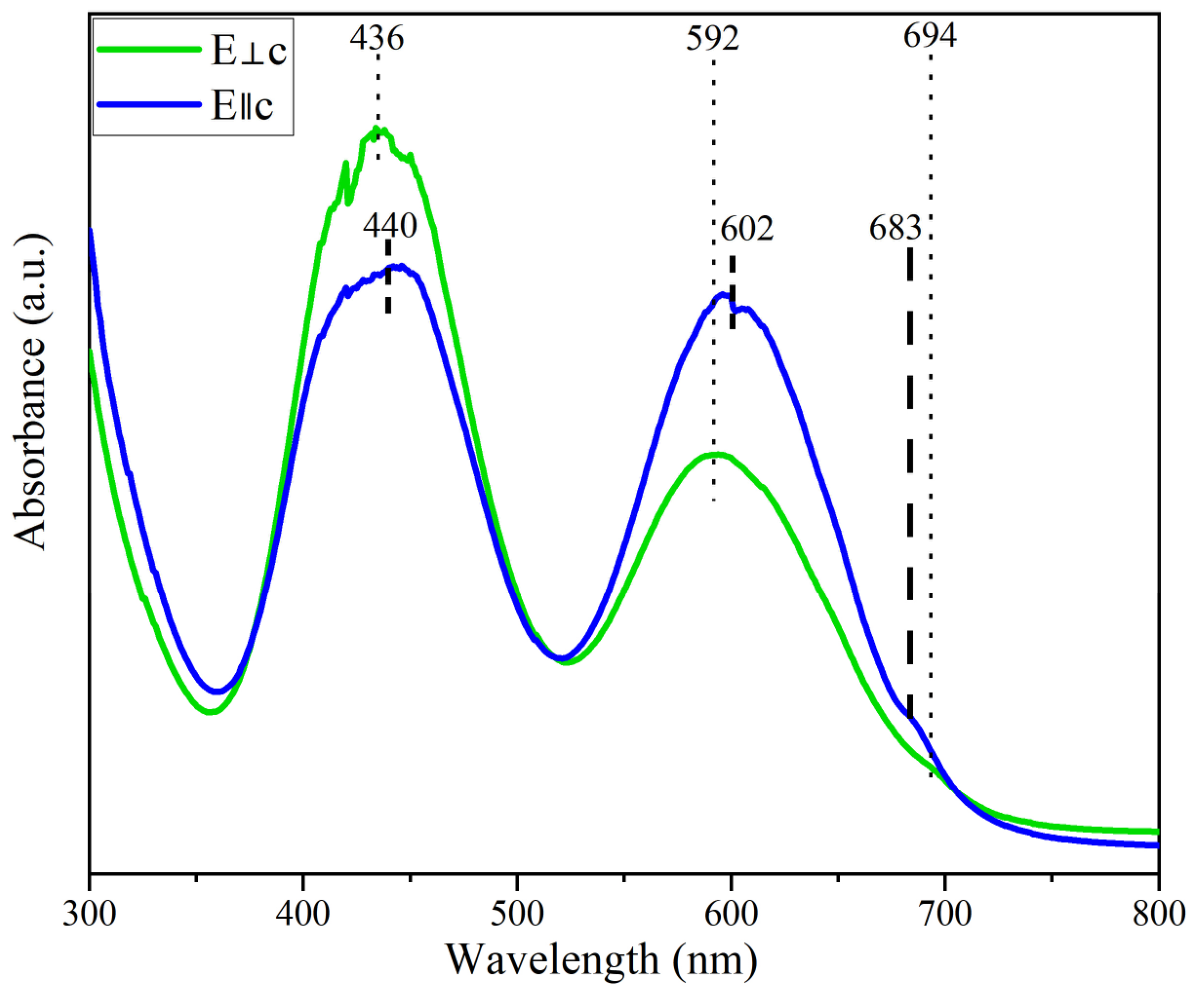
Emerald green is the typical appearance of the Tanzanian tourmaline sample studied here. Its color genesis and spectral response characteristics were characterized by polarized UV–vis absorption spectroscopy (Figure 4).
Figure 4.
Polarized ultraviolet–visible spectrum of a tourmaline crystal sample.
In the UV-Vis range of 300–800 nm, distinct spectral dichroism can be observed in the samples. When the electric field is perpendicular to the crystal c-axis (E⊥c), two strong broad absorption bands appear at approximately 436 nm and 592 nm, together with a weak absorption peak at 694 nm. When the electric field is parallel to the crystal c-axis (E‖c), all absorption bands undergo an overall redshift. The relative intensities of the absorption bands at 440 nm and 602 nm are obviously lower than those under the E⊥c condition, and a weak absorption peak is detected at 683 nm. The spectral difference caused by polarization is more obvious in the long-wavelength region.
A prominent transmission window is formed near 520 nm, which corresponds to the green band in visible light and serves as direct spectral evidence for the emerald green color of the samples. These absorption characteristics are highly consistent with the typical d-d transition modes of Cr3+ ions. The differences in absorption spectra under different polarization directions further reflect the anisotropic coordination environment of Cr3+ in the crystal. To further clarify the specific occurrence state and coordination environment of Cr3+ in the samples, additional crystallochemical data are required, especially the fine characterization of transition metal ions by means of XPS and PL spectroscopy.
3.5. XPS
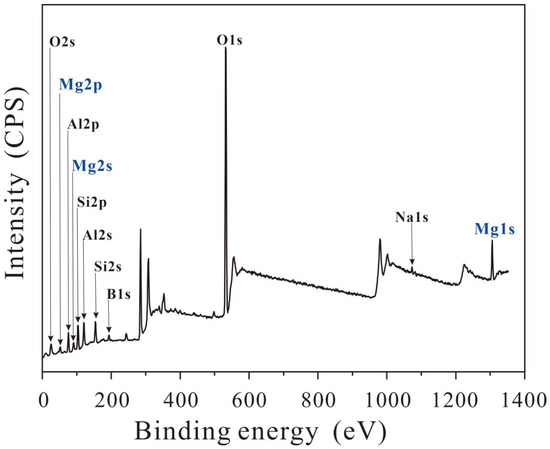
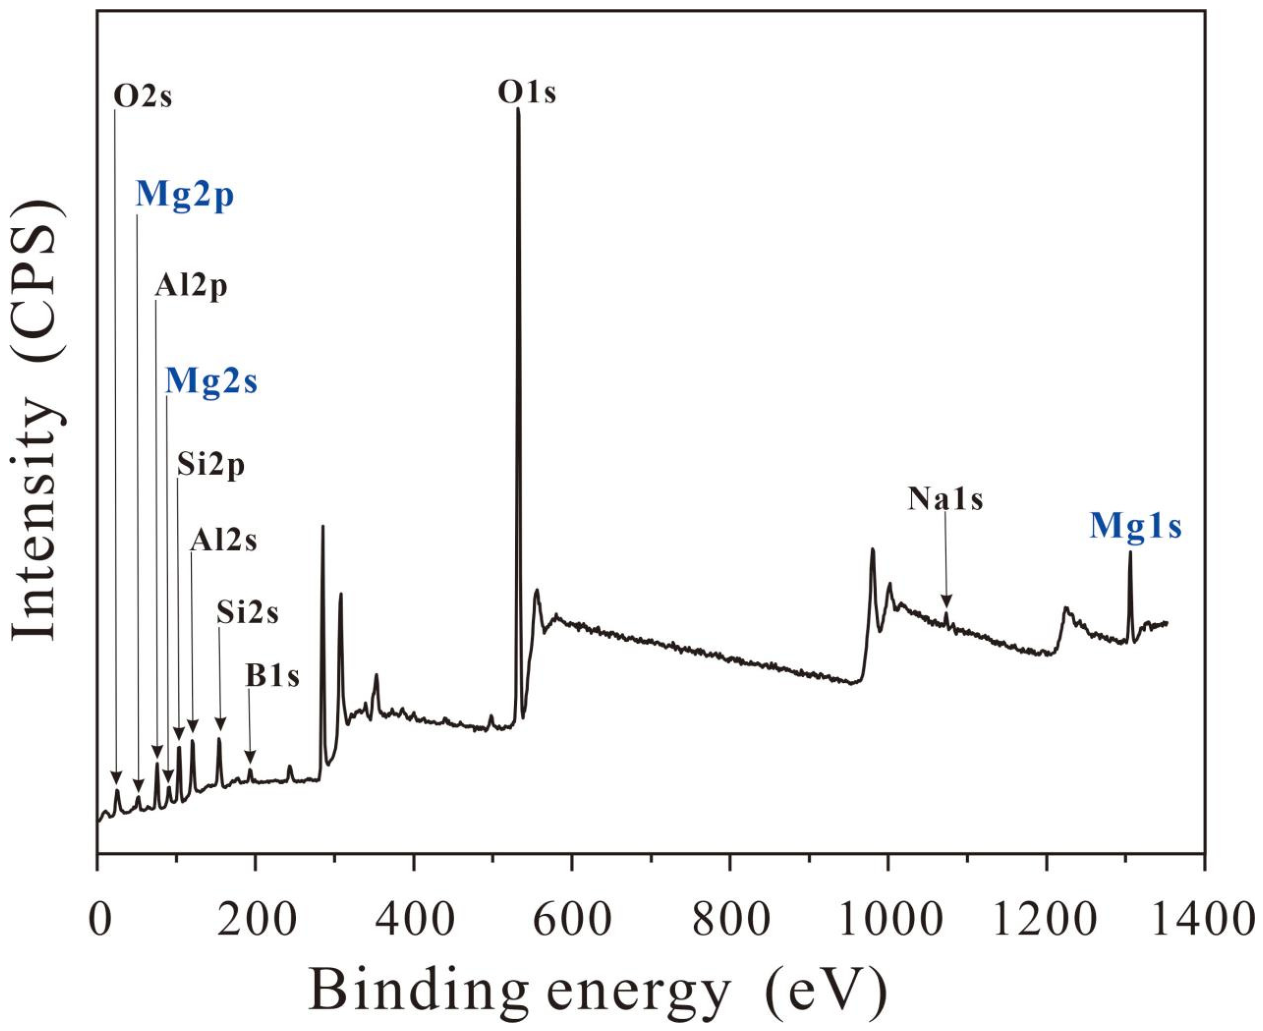
XPS survey scans were performed on the samples to determine their elemental composition, and the results are shown in Figure 5. Characteristic peaks of Na, Al, Mg, Si, O, B and other elements are clearly observed in the survey spectrum of this emerald-green tourmaline, all of which are characteristic constituent elements of tourmaline. Among them, the Mg signal exhibits remarkable intensity, which is consistent with the sample identification results obtained from previous XRD and FTIR analyses, further verifying the mineral properties of the sample.
Figure 5.
X-ray photoelectron spectra of a tourmaline crystal sample.
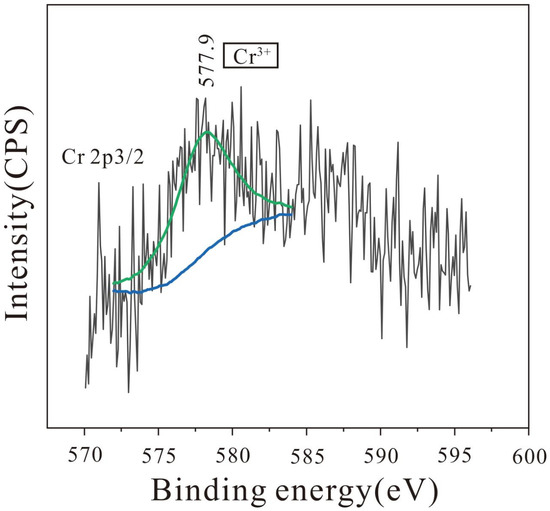
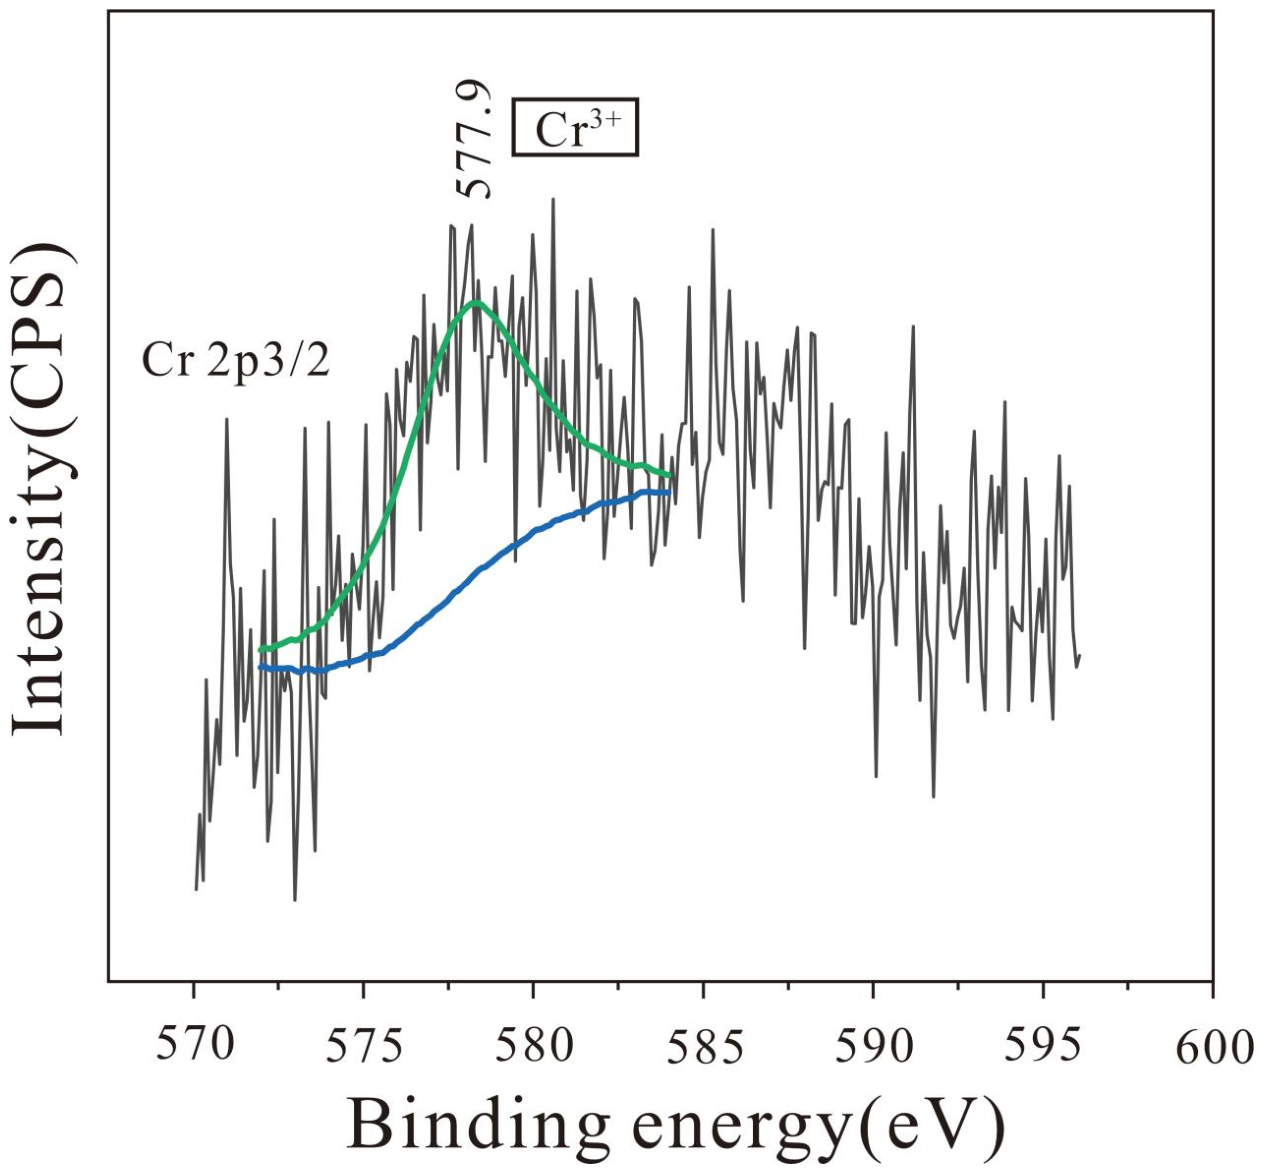
To clarify the chemical states of transition-metal elements, XPS high-resolution scans were conducted. A distinct characteristic signal of Cr was observed, and its high-resolution spectrum is displayed in Figure 6. The characteristic signals of Mn, Fe, V, and Ti were below the detection limit of the method under these survey conditions.
Figure 6.
X-ray photoelectron spectra for Cr 2p.
As shown in Figure 6, the Cr 2p peak exhibits a highly symmetrical shape. The binding energy of the Cr 2p3/2 peak is located at 577.9 eV, which is basically consistent with the characteristic Cr 2p3/2 peak in CrBO3 (577.95 eV) [31], indicating that chromium exists in the trivalent state (Cr3+) in the sample and is mainly coordinated and bonded with oxygen, accompanied by boron atoms in its coordination environment.
3.6. PL
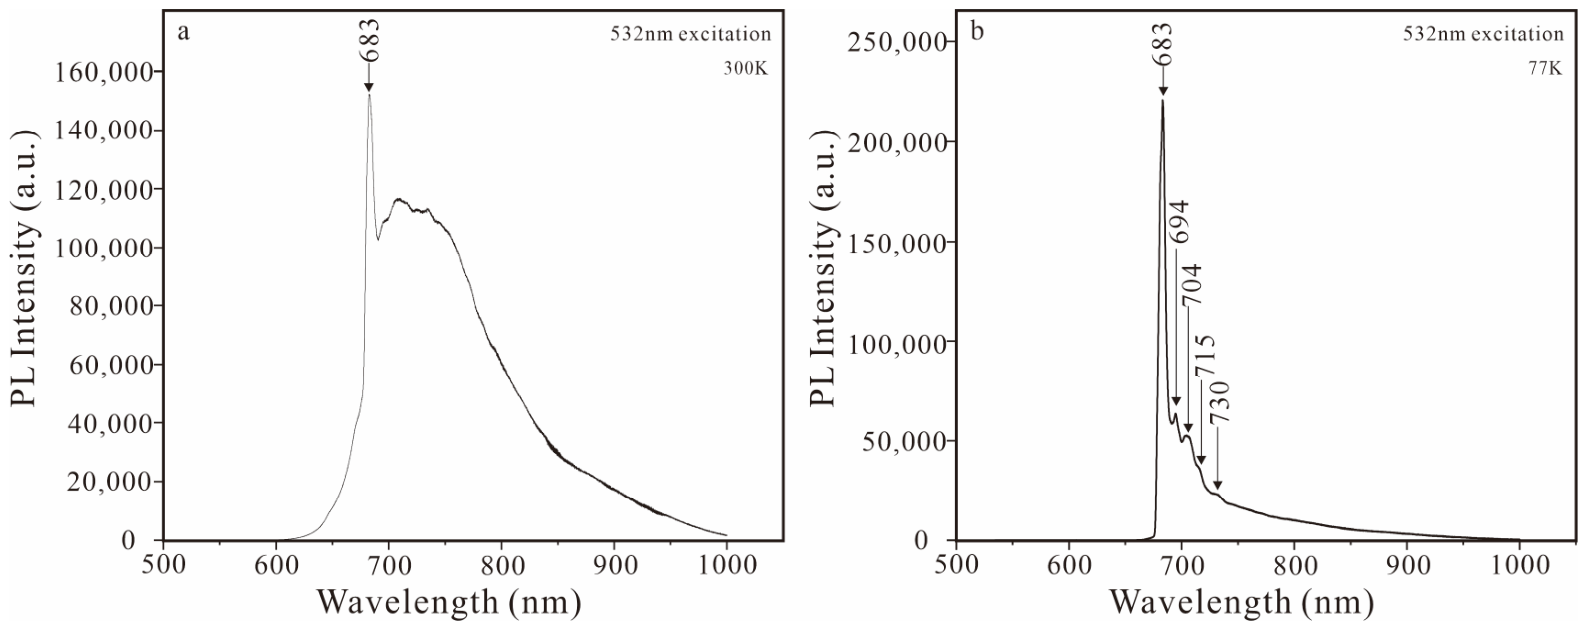
To further explore the crystal chemical behavior of Cr3+ in the sample, photoluminescence spectra at room temperature and liquid nitrogen temperature were collected to characterize its electronic transition and local coordination environment (Figure 7). Under 532 nm excitation, the obtained PL spectra exhibit obvious temperature-dependent spectral characteristics. At 300 K, a distinct sharp emission line is observed at 683 nm, which belongs to the zero-phonon line derived from the 2E → 4A2 electronic transition of Cr3+, together with a broad emission band centered at approximately 720 nm. This broad band originates from the spin-allowed 4T2 → 4A2 transition coupled with lattice phonon vibration, which intuitively reflects the interaction between Cr3+ and its surrounding oxygen ligands. At 77 K, the zero-phonon line at 683 nm is significantly intensified and narrowed, and a set of weak phonon sidebands at 694 nm, 704 nm, 715 nm, and 730 nm can be clearly distinguished. These fine spectral peaks are derived from diverse lattice phonon modes during electronic transitions, which provide reliable spectral evidence for the low-symmetry crystal field of Cr3+.
Figure 7.
Photoluminescence (PL) spectra of the tourmaline crystal sample. (a) 300K; (b) 77K.
The enhanced zero-phonon line and resolved phonon sidebands under low-temperature conditions unambiguously confirm the existence of Cr3+ within the tourmaline lattice. These temperature-dependent luminescence characteristics further reveal the low-symmetry coordination environment of Cr3+.
3.7. EPMA
EPMA was conducted on seven characteristic sites of the tourmaline sample. The analytical results are shown in Table 2. It should be noted that EPMA can only quantitatively determine conventional heavy metal oxide components, but cannot detect light elements such as H, Li and B. These light elements account for a considerable proportion in tourmaline, resulting in an average total measured oxide content of only 83.224 wt%, which is lower than 100 wt%. In this study, the contents of and structural water were indirectly calculated based on the crystal chemical stoichiometry of tourmaline rather than directly measured by instruments. All calculations of crystal chemical formulas were performed in strict accordance with the classic crystal chemical principles of tourmaline. Combined with structural constraint conditions and data normalization processing, the deviations originating from the indirect calculation of light elements can be effectively reduced, thus guaranteeing the scientific validity and reliability of the final derived crystal chemical formulas.
Table 2.
Electron probe microanalysis results of tourmaline chemical composition (wt%).
The ideal crystal chemical formula of tourmaline is XY3Z6[Si6O18][BO3]3V3W (where Si = 6 apfu and B = 3 apfu). In this study, the crystal chemical formula was calculated according to the cation normalization method constrained by crystal structure sites [32], combined with the chemical composition characteristics of the sample. The specific constraints are as follows:
- The sample contains a relatively high content of Al3+, and the Z site is fully occupied; therefore, transition-metal element cations such as Cr3+, V3+, and Ti4+, together with Mg2+, co-occupy the Y site.
- The contents of variable-valence elements such as Fe and Mn are extremely low and their valence states cannot be analyzed under current test conditions. Thus, they are uniformly treated as divalent cations (consistent with Mg2+), and their valence states are not discussed additionally.
- According to previous studies [33,34], F− in tourmaline exclusively occupies the W sites and does not undergo isomorphous substitution with ions at the V sites.
- The coefficients of OH− and O2− at the V site follow the relation OH− + O2− = 3, while maintaining the overall charge balance of the crystal.
In summary, the calculated crystal chemical formula of the tourmaline sample is as follows:
X(Na0.497Ca0.480K0.023)Σ1.000Y(Mg2.355Al0.518Cr0.073Ti0.047V0.003Fe0.003Mn0.001)Σ3.000ZAl6.000[Si6O18][BO3]3
V(OH1.832O1.168)Σ3.000W(OH0.994F0.006)Σ1.000.
V(OH1.832O1.168)Σ3.000W(OH0.994F0.006)Σ1.000.
4. Discussion
4.1. Determination of Varieties of Emerald-Green Tourmaline
Tourmaline group minerals exhibit complex chemical compositions and widespread isomorphic substitution, resulting in a wide variety of species. The International Mineralogical Association (IMA) has formally recognized 43 tourmaline species [35,36,37,38,39,40,41,42], which poses considerable challenges for the precise identification and classification of tourmaline minerals. Previous studies have demonstrated that gem-quality tourmalines with vivid colors are predominantly elbaite [43,44]. However, the identification and classification of high-quality emerald-green gem tourmalines remain unsystematic and require further systematic investigation.
In this study, the results of conventional gemological tests (refractive index RI: 1.624–1.626; specific gravity SG: 3.05) confirm that the sample is tourmaline. FTIR tests revealed that the νOH vibration of the sample appears as a single peak (3554 cm−1), distinguishing it from the double-peak feature of elbaite. Meanwhile, the νMg–O absorption peak (424 cm−1) indicated the presence of magnesium coordination vibration responses in the crystal structure. XPS further detected prominent magnesium signals, confirming the magnesium-rich chemical characteristics of the sample. More importantly, XRD Rietveld’s full-profile refinement clarified the fine crystal structural parameters of the sample, verifying its identity as dravite. EPMA accurately determined the elemental composition of the sample, and the derived crystal chemical formula was as follows:
X(Na0.497Ca0.480K0.023)Σ1.000Y(Mg2.355Al0.518Cr0.073Ti0.047V0.003Fe0.003Mn0.001)Σ3.000ZAl6.000[Si6O18][BO3]3
V(OH1.832O1.168)Σ3.000W(OH0.994F0.006)Σ1.000.
V(OH1.832O1.168)Σ3.000W(OH0.994F0.006)Σ1.000.
In summary, analyses of the sample’s physical properties, spectral characteristics, chemical composition, and crystal structure confirmed that the emerald-green tourmaline is dravite.
4.2. Color Genesis of Emerald-Green Tourmaline
The color genesis of emerald-green tourmaline remains controversial, and no unified consensus has been reached on the types of chromogenic ions and their occurrence states. On the one hand, the emerald-green color has been attributed to individual coloration by Cr3+ or V3+, as well as the synergistic coloration of the two ions [24,45,46,47]. On the other hand, the key crystal chemical characteristics of chromogenic ions, including their coordination environment and lattice occupancy, lack systematic and definite interpretation. In this study, polarized UV–Vis absorption spectra revealed that the selective absorption of visible light formed a characteristic green transmission window at 520 nm, which directly corresponded to the emerald-green appearance of the sample, and the spectral absorption features were highly consistent with the d-d electron transition response of Cr3+. XPS tests confirmed that chromium existed in the form of Cr3+ and was mainly coordinated with oxygen atoms. The characteristic Cr3+ zero-phonon lines and fine phonon sideband signals observed in variable-temperature PL spectra further verified the presence of effective Cr3+ in the crystal lattice. Combined with the results of absorption spectroscopy, emission spectroscopy and XPS tests, it could be confirmed that Cr3+, rather than V3+ or other transition metal ions, serves as the core chromogenic ion of the emerald-green dravite.
On this basis, the lattice occupancy of Cr3+ could be prudently inferred by integrating crystal chemical theories and experimental data. The Y-site octahedron in the tourmaline structure has a larger lattice size [48] and higher structural distortion, which facilitates the isomorphic substitution of transition metal ions and acts as the preferred occupancy site for impurity ions [49]. Previous studies [50,51] have demonstrated that the occupancy behavior of Cr3+ in tourmaline exhibited a prominent concentration dependence. Specifically, Cr3+ tended to preferentially and orderly occupy the Y-site octahedron at low concentrations (Cr3+ < 1.03 apfu) [50,51]. The sample in this study had an extremely low Cr2O3 content of 0.804 wt.% (Cr3+ = 0.073 apfu), which was far lower than the critical occupancy threshold reported in the literature and satisfied the crystal chemical adaptability for preferential Y-site occupation. Meanwhile, the strong polarization characteristics of UV–Vis spectra and the low-symmetry distorted coordination environment revealed by PL spectra were highly consistent with the structural distortion characteristics of the tourmaline Y-site. Therefore, based on the comprehensive analysis of crystal structure characteristics, spectral response rules and component content features, it was speculated that the chromogenic Cr3+ in the sample was most likely hosted in the Y-site lattice. In summary, multi-technique coupling analysis indicated that the emerald-green color of the studied dravite primarily originates from the d-d electron transition of Cr3+ in the lattice, and the chromogenic Cr3+ most likely occupies the Y-site lattice.
5. Conclusions
The main conclusions of this study are as follows:
- The emerald-green tourmaline from Tanzania is identified as dravite, with the crystal chemical formula: X(Na0.497Ca0.480K0.023)Σ1.000Y(Mg2.355Al0.518Cr0.073Ti0.047V0.003Fe0.003Mn0.001)Σ3.000ZAl6.000[Si6O18][BO3]3V(OH1.832O1.168)Σ3.000W(OH0.994F0.006)Σ1.000. and unit cell parameters a0 = 15.92457(34) Å and c0 = 7.19861(18) Å.
- The dravite has a relative density of 3.05, with refractive indices of No = 1.646 and Ne = 1.624. In the infrared absorption spectrum, the δSi–O bending vibration exhibits a distinctive paired feature, consisting of a strong peak at 505 cm−1 and a weak peak at 568 cm−1.
- The UV–vis absorption spectrum of the sample exhibits strong, broad absorption bands at approximately 436 and 600 nm, along with a weak absorption line at 683 nm, and a strong transmission at 520 nm. This serves as the direct optical origin of the emerald green color.
- Cr2O3 possesses the highest content (0.804%) in the sample, which is at a relatively low concentration level. Cr3+ preferentially occupies the Y site, and its d–d electron transition constitutes the fundamental coloration mechanism of the emerald green color.
Author Contributions
Conceptualization, M.L. and K.L.; methodology, M.L. and Y.T.; data curation, M.L.; writing—original draft preparation, M.L., Y.T. and K.L.; writing—review and editing, all authors; visualization, Y.T. and M.L.; supervision, K.L.; funding acquisition, K.L. and M.L. All authors have read and agreed to the published version of the manuscript.
Funding
This research was funded by the Guangdong Province Education Sciences Planning Project of China, grant number 2024GXJK024; the Scientific Research Foundation of the Higher Education Institutions of Guangzhou, China, grant number 2024312302; and the Major Program of the Guangzhou Polytechnic University Foundation, grant number 2021KJ03.
Data Availability Statement
The original contributions presented in this study are included in the article. Further inquiries can be directed to the first author.
Acknowledgments
We would like to thank De Fang from the Center for Materials Research and Analysis, Wuhan University of Technology, for the help with the XPS test.
Conflicts of Interest
The authors declare no conflicts of interest. The funders had no role in the design of the study; in the collection, analyses, or interpretation of data; in the writing of the manuscript; or in the decision to publish the results.
Abbreviations
The following abbreviations are used in this manuscript:
| EPMA | Electron probe microanalysis |
| FTIR | Fourier-transform infrared |
| PL | Photoluminescence |
| UV–vis | Ultraviolet–visible |
| XPS | X-ray photoelectron spectroscopy |
| XRD | X-ray diffraction |
References
- Hawthorne, F.C.; Henry, D.J. Classification of the minerals of the tourmaline group. Eur. J. Mineral. 1999, 11, 201–216. [Google Scholar] [CrossRef] [Scilit]
- Foit, F.F.; Rosenberg, P.E. Coupled substitutions in the tourmaline group. Contrib. Mineral. Petrol. 1977, 62, 109–127. [Google Scholar] [CrossRef] [Scilit]
- Grice, J.D.; Ercit, T.S. Ordering of Fe and Mg in the tourmaline crystal structure: The correct formula. Neues Jahrb. Mineral. Abh. 1993, 165, 245–266. [Google Scholar]
- Macdonald, D.J.; Hawthorne, F.C. The crystal chemistry of Si—Al substitution in tourmaline. Can. Mineral. 1995, 33, 849–858. [Google Scholar]
- Henry, D.J.; Dutrow, B.L. Ca substitution in Li-poor aluminous tourmaline. Can. Mineral. 1990, 28, 111–124. [Google Scholar]
- Bosi, F. Bond-valence constraints around the O1 site of tourmaline. Mineral. Mag. 2013, 77, 343–351. [Google Scholar] [CrossRef] [Scilit]
- Gatta, G.D.; Danisi, R.M.; Adamo, I.; Meven, M.; Diella, V. A single-crystal neutron and X-ray diffraction study of elbaite. Phys. Chem. Miner. 2012, 39, 577–588. [Google Scholar] [CrossRef] [Scilit]
- Bosi, F.; Lucchesi, S. Crystal chemistry of the schorl-dravite series. Eur. J. Mineral. 2004, 16, 335–344. [Google Scholar] [CrossRef] [Scilit]
- Povondra, P. The crystal chemistry of tourmalines of the schorl-dravite series. Geologica 1981, 3, 223–264. [Google Scholar]
- Bosi, F.; Skogby, H.; Balić-Žunić, T. Thermal stability of extended clusters in dravite: A combined EMP, SREF and FTIR study. Phys. Chem. Miner. 2016, 43, 395–407. [Google Scholar] [CrossRef] [Scilit]
- Pezzotta, F.; Laurs, B.M. Tourmaline: The kaleidoscopic gemstone. Elements 2011, 7, 333–338. [Google Scholar] [CrossRef] [Scilit]
- Nassau, K. The origins of color in minerals. Am. Mineral. 1978, 63, 219–229. [Google Scholar]
- Jagannadha Reddy, B.; Frost Ray, L.; Martens Wayde, N.; Wain Daria, L.; Theo Kloprogge, J. Spectroscopic characterization of Mn-rich tourmalines. Vib. Spectrosc. 2007, 44, 42–49. [Google Scholar] [CrossRef] [Scilit]
- Wilkins, R.W.T.; Farrell, E.F.; Naiman, C.S. The crystal field spectra and dichroism of tourmaline. J. Phys. Chem. Solids. 1969, 30, 43–56. [Google Scholar] [CrossRef] [Scilit]
- Macdonald, D.J.; Hawthorne, F.C. Cu-bearing tourmaline from Paraiba, Brazil. Acta Crystallogr. Sect. C Struct. Chem. 1995, 51, 555–557. [Google Scholar] [CrossRef] [Scilit]
- Shabaga, B.M.; Fayek, M.; Hawthorne, F.C. Boron and lithium isotopic compositions as provenance indicators of Cu-bearing tourmalines. Mineral. Mag. 2010, 74, 241–255. [Google Scholar] [CrossRef] [Scilit]
- Mashkovtsev, R.I.; Smirnov, S.Z.; Shigley, J.E. The features of the Cu2+-entry into the structure of tourmaline. J. Struct. Chem. 2006, 47, 252–257. [Google Scholar] [CrossRef] [Scilit]
- Vereshchagin, O.S.; Rozhdestvenskaya, I.V.; Frank-Kamenetskaya, O.V.; Zolotarev, A.A.; Mashkovtsev, R.I. Crystal chemistry of Cu-bearing tourmalines. Am. Mineral. 2013, 98, 1610–1616. [Google Scholar] [CrossRef] [Scilit]
- Ertl, A.; Giester, G.; Schüssler, U.; Brätz, H.; Okrusch, M.; Tillmanns, E.; Bank, H. Cu- and Mn-bearing tourmalines from Brazil and Mozambique: Crystal structures, chemistry and correlations. Mineral. Petrol. 2013, 107, 265–279. [Google Scholar] [CrossRef] [Scilit] [PubMed]
- Hong, H.-L.; Li, J.; Du, D.-W.; Zhong, Z.-Q.; Yin, K.; Wang, C.-W. Chemical states of color-induced cations in colorful tourmaline. J. Gems Gemmol. 2011, 13, 6–12. [Google Scholar]
- Li, M.; Hong, H.-L.; Yin, K.; Wang, C.-W.; Cheng, F.; Fang, Q. The chemical states of color-induced cations in tourmaline characterized by X-ray photoelectron spectroscopy. J. Spectrosc. 2018, 2018, 3964071. [Google Scholar] [CrossRef] [Scilit]
- Rumyantseva, Y.V. Chromdravite–A new mineral from Karelia. Int. Geol. Rev. 1983, 25, 989–992. [Google Scholar] [CrossRef] [Scilit]
- Bosi, F.; Lucchesi, S.; Reznitskii, L. Crystal chemistry of the dravite-chromdravite series. Eur. J. Mineral. 2004, 16, 345–352. [Google Scholar] [CrossRef] [Scilit]
- Tao, L.-F.; Jin, C.-L.; Zhang, Q.-S.; Han, X.-L. Mineralogy characteristics and coloration mechanism of green tourmaline in Tanzania. J. Rock Miner. Anal. 2022, 41, 324–331. [Google Scholar]
- Peng, W.-S.; Liu, G.-K. Mineral Infrared Spectrum Atlas; Science Press: Beijing, China, 1982. [Google Scholar]
- Ertl, A.; Rossman, G.R.; Hughes, J.M.; Prowatke, S.; Ludwig, T. Mn-bearing “oxy-rossmanite” with tetrahedrally coordinated Al and B from Austria: Structure, chemistry, and infrared and optical spectroscopic study. Am. Mineral. 2005, 90, 481–487. [Google Scholar] [CrossRef] [Scilit]
- Li, W.-W.; Wu, R.-H.; Dong, Y. Study on infrared spectra and infrared radiation characteristics of tourmaline. Geol. J. China Univ. 2008, 14, 426–432. [Google Scholar]
- Gonzalez-Carreño, T.; Fernández, M.; Sanz, J. Infrared and electron microprobe analysis of tourmalines. Phys. Chem. Miner. 1988, 15, 452–460. [Google Scholar] [CrossRef] [Scilit]
- Ertl, A.; Hughes, J.M.; Prowatke, S.; Ludwig, T.; Prasad, P.S.R.; Brandstätter, F.; Körner, W.; Schuster, R.; Pertlik, F.; Marschall, H. Tetrahedrally coordinated boron in tourmalines from the liddicoatite-elbaite series from Madagascar: Structure, chemistry, and infrared spectroscopic studies. Am. Mineral. 2006, 91, 1847–1856. [Google Scholar] [CrossRef] [Scilit]
- Castañeda, C.; Oliveira, E.F.; Gomes, N.; Pedrosa Soares, A.C. Infrared study of OH sites in tourmaline from the elbaite-schorl series. Am. Mineral. 2000, 85, 1503–1507. [Google Scholar] [CrossRef] [Scilit]
- Moffat, T.P.; Latanision, R.M.; Ruf, R.R. An X-ray photoelectron spectroscopy study of chromium-metalloid alloys-III. Electrochim. Acta 1995, 40, 1723–1734. [Google Scholar] [CrossRef] [Scilit]
- Xu, D.-K. Mineral Chemical Formula Calculation Method; Geological Publishing House: Beijing, China, 1977. [Google Scholar]
- Bosi, F.; Andreozzi, G.; Skogby, H.; Lussier, A.; Abdu, Y.; Hawthorne, F. Fluor-elbaite, Na(Li1.5Al1.5)Al6(Si6O18)(BO3)3(OH)3F, a new mineral species of the tourmaline supergroup. Am. Mineral. 2013, 98, 297–303. [Google Scholar] [CrossRef] [Scilit]
- Ertl, A.; Kolitsch, U.; Darby Dyar, M.; Meyer, H.P.; Rossman, G.R.; Henry, D.J.; Prem, M.; Ludwig, T.; Nasdala, L.; Lengauer, C.L.; et al. Fluor-schorl, a new member of the tourmaline supergroup, and new data on schorl from the cotype localities. Eur. J. Mineral. 2016, 28, 163–177. [Google Scholar] [CrossRef] [Scilit]
- Donnay, G.; Ingamells, C.O.; Mason, B. Buergerite, a new species of tourmaline. Am. Mineral. 1966, 51, 198–199. [Google Scholar]
- Dunn, P.J.; Appleman, D.E.; Nelen, J.E. Liddicoatite, a new calcium end-member of the tourmaline group. Am. Mineral. 1977, 62, 1121–1124. [Google Scholar]
- Dunn, P.J.; Appleman, D.E.; Nelen, J.A.; Norberg, J. Uvite, a new (old) common member of the tourmaline group and its implications for collectors. Mineral. Rec. 1977, 8, 100–108. [Google Scholar] [CrossRef] [Scilit]
- MacDonald, D.J.; Hawthorne, F.C.; Grice, J.D. Foitite, □[Fe22+(Al,Fe3+)]Al6Si6O18(BO3)3(OH)4, a new alkali-deficient tourmaline: Description and crystal structure. Am. Mineral. 1993, 78, 1299–1303. [Google Scholar]
- Selway, J.B.; Hawthorne, F.C.; Cerny, P.; Ottolini, L.; Kurtis Kyser, T. Rossmanite, □[LiAl2]Al6Si6O18(BO3)3(OH)4, a new alkali-deficient tourmaline: Description and crystal structure. Am. Mineral. 1998, 83, 896–900. [Google Scholar] [CrossRef] [Scilit]
- Shigley, J.E.; Kane, R.E.; Manson, D.V. A notable Mn-rich gem elbaite tourmaline and its relationship to “tsilaisite”. Am. Mineral. 1986, 71, 1214–1216. [Google Scholar]
- London, D.; Guttery, B.M. Hydrothermal synthesis of lithium-bearing tourmaline, and the elusive stability field of elbaite. Can. J. Mineral. Petrol. 2025, 63, 907–927. [Google Scholar] [CrossRef] [Scilit] [PubMed]
- Walenta, K.; Dunn, P.J. Ferridravite, a new mineral of the tourmaline group from Bolivia. Am. Mineral. 1979, 64, 945–948. [Google Scholar]
- Li, M.; Hong, H.-L. Gemological and spectrographic characteristics of light-green tourmaline of Afghanistan. Spectrosc. Spectr. Anal. 2023, 43, 2195–2201. [Google Scholar]
- Chen, L.-X.; Li, M.; Wang, Y.-J.; Gong, N.-N. In-depth analysis of coloring mechanism of turquoise tourmaline by comprehensive spectral technology. Chin. J. Inorg. Anal. Chem. 2026, 16, 228–235. [Google Scholar]
- Bosi, F.; Reznitskii, L.Z.; Sklyarov, E.V. Oxy-vanadium-dravite, NaV3(V4Mg2)(Si6O18)(BO3)3(OH)3O: Crystal structure and redefinition of the “vanadium-dravite” tourmaline. Am. Mineral. 2013, 98, 501–505. [Google Scholar] [CrossRef] [Scilit]
- Bosi, F.; Reznitskii, L.; Skogby, H. Oxy-chromium-dravite, NaCr3(Cr4Mg2)(Si6O18)(BO3)3(OH)3O, a new mineral species of the tourmaline supergroup. Am. Mineral. 2012, 97, 2024–2030. [Google Scholar] [CrossRef] [Scilit]
- Sun, L.; Yang, M.X.; Wu, G. Gemmological and spectroscopic characteristics of chrome tourmaline appeared on the market recently. J. Gems Gemmol. 2015, 17, 31–37. [Google Scholar] [CrossRef]
- Ertl, A. Are the [6]-coordinated sites in tourmaline in certain cases partially vacant? Mineral. Petrol. 2023, 117, 201–207. [Google Scholar] [CrossRef] [Scilit] [PubMed]
- Ertl, A.; Hughes, J.M.; Pertlik, F.; Foit, F.F., Jr.; Wright, S.E.; Brandstätter, F.; Marler, B. Polyhedron distortions in tourmaline. Can. Mineral. 2002, 40, 153–162. [Google Scholar] [CrossRef] [Scilit]
- Vereshchagin, O.S.; Rozhdestvenskaya, I.V.; Frank-Kamenetskaya, O.V.; Zolotarev, A.A. Ion substitutions and structural adjustment in Cr-bearing tourmalines. Eur. J. Mineral. 2014, 26, 309–321. [Google Scholar] [CrossRef] [Scilit]
- Dannenberg, S.G.; Di Paolo, D.; Ehlers, A.M.; McCarthy, K.P.; Mancini, M.T.; Reuter, M.B.; Seth, D.M., Jr.; Song, Z.; Valladares, M.I.; Zhu, X.; et al. The atomic arrangement of Cr-rich tourmaline from the #1 Mine, Balmat, St. Lawrence County, New York, USA. Minerals 2019, 9, 398. [Google Scholar] [CrossRef] [Scilit]

Disclaimer/Publisher’s Note: The statements, opinions and data contained in all publications are solely those of the individual author(s) and contributor(s) and not of MDPI and/or the editor(s). MDPI and/or the editor(s) disclaim responsibility for any injury to people or property resulting from any ideas, methods, instructions or products referred to in the content. |
© 2026 by the authors. Licensee MDPI, Basel, Switzerland. This article is an open access article distributed under the terms and conditions of the Creative Commons Attribution (CC BY) license.