


Abstract
Background. Food noise is a persistent, intrusive, and often distressing thought about food that has emerged as a clinically meaningful dimension of appetite dysregulation in the disease of obesity. Yet no validated Arabic-language instrument exists to measure food noise. We aimed to translate, culturally adapt, and evaluate the psychometric properties of an Arabic version of the five-item Food Noise Questionnaire (FNQ) in a community sample of Saudi adults. Methods. In this cross-sectional online validation study, the FNQ underwent forward–backward translation, in accordance with international cross-cultural adaptation guidelines. Adults (≥18 years) who were not currently using obesity medications, had not undergone bariatric surgery, were not pregnant, and had no diagnosed eating disorder completed the Arabic FNQ together with sociodemographic, anthropometric, and behavioural items. The sample was randomly split into two subsamples for exploratory factor analysis (EFA; common factor analysis of polychoric correlations with parallel analysis) and confirmatory factor analysis (CFA; robust weighted least squares, WLSMV). Reliability was estimated using Cronbach’s alpha (α) and McDonald’s omega (ω), and measurement invariance across sex and obesity status was tested with multi-group CFA. Associations with other variables were examined using Spearman correlations and group comparisons with effect sizes. Results. Of 445 respondents, the mean age was 39.4 ± 11.4 years, 70.3% were women, and the mean BMI was 29.4 ± 6.5 kg/m2. Parallel analysis and the minimum average partial test supported one factor (loadings 0.69–0.90). In CFA, a strictly unidimensional model fitted poorly (CFI = 0.952; RMSEA = 0.294); allowing a residual correlation between the two functional-interference items (FNQ4 and FNQ5) produced good fit on CFI, TLI and SRMR (scaled χ2 = 12.55, p = 0.014; CFI = 0.996; TLI = 0.989; SRMR = 0.024), with an elevated RMSEA (0.098) in this low-df model. Standardized loadings ranged from 0.56 to 0.92, and the general factor explained 81% of the common variance. Internal consistency was good (α = 0.867, 95% CI 0.847–0.886; ωh = 0.825; ωt = 0.866). Scalar invariance held across sex, and partial scalar invariance across obesity status. FNQ scores correlated weakly with BMI (ρ = 0.19, p < 0.001); adults with obesity scored higher than those without (8.94 vs. 7.50; Hedges’ g = 0.32, p = 0.001), and scores increased with restaurant-meal frequency (ρ = 0.21, p < 0.001). Scores were weakly and inversely related to age (ρ = −0.12, p = 0.014) and did not differ by sex. Conclusions. In Saudi adults, the Arabic FNQ showed an essentially unidimensional structure, good internal consistency, and invariance across sex and, partially, obesity status. Its associations with BMI and eating-out behaviour provide preliminary support for its validity; convergent and discriminant validity against established eating-behaviour measures, test–retest reliability, responsiveness, and transferability to other Arabic-speaking countries remain to be established.
1. Introduction
Obesity has become one of the defining public health challenges of the present era [1]. In the Middle East, Saudi Arabia in particular suffers disproportionately from this epidemic [2]. The most recent national figures published by the General Authority for Statistics indicate that 23.1% of Saudis aged 15 years and older live with obesity, and a further 45.1% are overweight [3]. Regional surveys corroborate this picture [4,5,6].
Currently, obesity is understood not as a simple failure of willpower but as a chronic, neuroendocrine disease in which excess adiposity coexists with dysregulated appetite signalling and altered reward processing [7,8]. The neurobiology of appetite is generally governed by two interacting systems: the hypothalamus and brainstem that tracks the body’s energy needs, and the reward-based mesolimbic system in which dopamine signalling makes food feel pleasurable and worth pursuing [9,10,11]. In obesity, the regulation of adipocyte mass is disturbed, and the subcortical areas of the brain tries to restore homeostasis by increasing adipocyte mass, thus increasing appetitive behavior until the new higher adipocyte mass is achieved [9,10,11,12,13]. One direct and noticeable result of this state is intrusive thinking about food: experimental work has shown that hunger and restraint increase the cognitive accessibility of food-related thoughts, which intrude on awareness much as other unwanted thoughts do [14]. It is precisely this experience that the lay term “food noise” has come to describe.
Dhurandhar et al. described it as “persistent thoughts about food that are perceived by the individual as being unwanted and/or dysphoric and may cause harm to the individual, including social, mental, or physical problems,” distinguishing it from ordinary food-related thinking by its intensity and intrusiveness. This resembles rumination [15]. A parallel definition by Diktas et al. frames it as persistent, intrusive thoughts about food that disrupt daily life and make healthy behaviours difficult [16]. Conceptually, food noise has been situated within models of food-cue reactivity and, more recently, characterized as a form of maladaptive obsessive thinking in which the mind repeatedly simulates short-term food reward at the expense of longer-term goals [17].
As understanding of food noise evolves, interest is growing in its potential clinical utility as a marker of obesity disease activity, treatment effectiveness, and the recurrence of disease following initial therapeutic success [18]. More than half of people with the disease of obesity report experiencing it, and higher levels track with a greater tendency to overeat and with difficulty sustaining weight loss [15,16]. Food noise has gained particular importance in the glucagon-like peptide-1 (GLP-1) era: incretin-based therapies modulate appetitive behaviour, and patient reports and early studies suggest that they may quieten intrusive food thoughts [19,20]. If food noise can be measured reliably, it could therefore complement weight as an outcome that is meaningful to patients and responsive to therapy [18].
The Food Noise Questionnaire (FNQ), developed and validated by Diktas et al., is a brief five-item, single-factor scale with excellent internal consistency and high test–retest reliability, designed specifically to quantify the frequency and intrusiveness of food-related thoughts [16]. Its brevity makes it attractive for both clinical and epidemiological use. To date, no validated Arabic version of the FNQ exists, leaving a conspicuous gap for a region where obesity is highly prevalent and where Arabic is the first language of more than 400 million people [21]. The present study was designed to translate and culturally adapt the FNQ into Arabic and to evaluate its psychometric properties in a community sample of Saudi adults.
2. Materials and Methods
2.1. Study Design, Setting, and Duration
We conducted an observational, cross-sectional psychometric validation study using an anonymous, self-administered online questionnaire. Data were collected from adult residents of the Kingdom of Saudi Arabia over 3 months (April 2026–June 2026).
2.2. Translation and Cultural Adaptation
Cross-cultural adaptation followed the guidelines of Beaton et al. [22]. Permission to translate, adapt, and validate the FNQ was obtained from the developers of the original instrument (H. E. Diktas and colleagues) in May 2026. Two independent bilingual translators whose first language was Arabic, one a physician familiar with the concepts being measured and the other a professional translator without a medical background, produced forward translations of the five items and response anchors in accordance with Beaton et al.’s recommendations [22]. The research team reconciled both translations into a single synthesized version. A third bilingual translator, blinded to the original instrument, back-translated the synthesized version into English. Discrepancies between the back-translation and the original instrument were discussed and resolved. Modern Standard Arabic was used because it is understood across Arabic-speaking countries, with the aim of facilitating future use in other Arabic-speaking countries; in the present study, however, the instrument was tested only in Saudi Arabia.
2.3. Content Validity and Pilot Testing
An expert panel comprising five specialists in internal medicine, obesity medicine, and endocrinology evaluated the adapted FNQ for relevance, clarity, and cultural appropriateness. Each item was rated on a four-point relevance scale (1 = not relevant; 4 = highly relevant). Content validity was assessed using the item-level content validity index (I-CVI) and the average scale-level content validity index (S-CVI/Ave), with thresholds of ≥0.78 and ≥0.90, respectively, indicating excellent content validity [23]. All five items achieved an I-CVI of 1.00, resulting in an S-CVI/Ave of 1.00. No revisions were required following expert review.
The adapted questionnaire was subsequently piloted with 30 community-dwelling adults to assess clarity, comprehensibility, and completion time. All items were reported as clear and understandable, with no difficulties identified or wording modifications required. Completion took approximately 3 min. Pilot participants were excluded from the final analytic sample. The final Arabic FNQ is provided in Supplementary File S1, while the expert relevance ratings and content-validity indices are presented in Table S1 of Supplementary File S2.
2.4. Sample Size
Sample-size planning followed established recommendations for scale validation [24,25]. For a five-item instrument, a ratio of at least 10–20 respondents per item indicated a minimum of 50–100 participants for exploratory factor analysis (EFA), while best-practice guidance for confirmatory factor analysis (CFA) recommends 150–200 or more participants for precise fit estimation. To satisfy both requirements and to allow a split-sample cross-validation design, we targeted approximately 300 complete responses. The achieved analytic sample (n = 445) exceeded this threshold.
2.5. Sampling and Eligibility
Participants were recruited through convenience sampling via widely used social-media and messaging platforms. Eligible respondents were adults aged 18 years or older who were fluent in Arabic. To avoid confounding from acute pharmacological or surgical modulation of appetite, we excluded individuals who had used obesity medications (including GLP-1 or dual-incretin receptor agonists) within the preceding two months, those with any history of bariatric surgery, those with a clinician assigned diagnosis of an eating disorder, and pregnant women. Incomplete questionnaires were excluded, and the survey settings were configured to allow a single response per device to prevent duplication. Despite this setting, nine records formed four sets that were identical on all recorded variables (i.e., five redundant copies). Because identical responses from different people cannot be ruled out, these records were retained in the primary analyses, and all key analyses were repeated after removal of the five redundant copies.
2.6. Data Collection and Instrument
The questionnaire comprised three sections. The first captured sociodemographic information (age, sex, marital status, employment, and educational level) and a smoking item. The second recorded self-reported weight and height, from which body mass index (BMI, kg/m2) was computed and classified using World Health Organization cut-offs (underweight < 18.5; normal weight 18.5–24.9; overweight 25.0–29.9; obesity ≥ 30.0) [26], with two behavioural items on the frequency of eating meals from restaurants or cafés and on weekly physical-activity level. The third section contained the Arabic FNQ. The FNQ consists of five statements rated on a five-point scale anchored from 0 (strongly disagree) to 4 (strongly agree); the total score is the simple sum of the items (range 0–20), with higher scores indicating more pronounced food noise [16]. Participation was anonymous, and no personally identifying data were collected. BMI values outside the physiologically plausible range of 13–70 kg/m2 were treated as missing for the BMI analyses.
2.7. Statistical Analysis
Analyses were performed in R Foundation for Statistical Computing, Vienna, Austria (version 4.3.3) with the lavaan (0.6–17), semTools (0.5–6) and psych (2.4.1) packages; two-sided p < 0.05 was considered significant. All analyses were performed using a single scripted R workflow to ensure consistency and reproducibility. Categorical variables are summarized as numbers and percentages, and continuous variables as mean ± standard deviation. For each scale’s item, we examined the floor and ceiling effects, defined as the proportion of respondents endorsing the lowest or highest response option, with more than 15% indicating a floor or ceiling effect [27], corrected item–total correlations, and the change in Cronbach’s alpha on item deletion; floor and ceiling effects were also evaluated for the total score (proportion of respondents scoring 0 or 20) [28]. The study’s sample was randomly divided into two halves: a subsample for EFA and an independent subsample for CFA. Because the items are five-point ordinal ratings, the EFA was a common factor analysis (minimum residual extraction) of the polychoric correlation matrix. Suitability for EFA was assessed using the Kaiser–Meyer–Olkin (KMO) measure and Bartlett’s test of sphericity computed on this matrix [29]. Data is considered suitable for factor analysis when the KMO index is close to 1 (scores below 0.60 indicate inadequate sampling) and the Bartlett test yields a significant p-value < 0.05. The number of factors to retain was determined by parallel analysis, in which the eigenvalues of the observed polychoric correlation matrix were compared with the 95th percentile of the eigenvalues from 1000 resampled data sets [30], and by Velicer’s minimum average partial (MAP) test [31], with the scree plot used as a visual aid; the Kaiser criterion (eigenvalue > 1) was not used as a retention rule. A factor loading of ≥ 0.40 is generally considered meaningful. Regarding the communality values, representing the percentage of variance in a specific observed variable accounted for by the retained factors, values above 0.50 were considered adequate [32].
CFA treated the items as ordinal and used diagonally weighted least squares estimation of the polychoric correlations with robust standard errors and a mean- and variance-adjusted test statistic (WLSMV) [33]; the corresponding scaled fit indices are reported. Two models were compared. Model A was a strictly unidimensional model (df = 5). Model B additionally freed the residual covariance between FNQ4 (“recurrent food thoughts negatively affect me or my daily schedule”) and FNQ5 (“my food thoughts distract me from completing other tasks”) (df = 4). This parameter was considered because, unlike FNQ1–FNQ3, which describe the frequency and controllability of food thoughts, both items describe their functional consequences in closely related wording, a recognised source of local item dependence; it was also the largest modification index of Model A. Models were compared with the scaled χ2 difference test. Because Model B is statistically equivalent to a bifactor model with a general factor and a specific factor for FNQ4 and FNQ5, the strength of the general factor was quantified using the explained common variance (ECV) and the percentage of uncontaminated correlations (PUC) [34]. Model fit was judged against conventional thresholds: comparative fit index (CFI) and Tucker–Lewis index (TLI) ≥ 0.95, root-mean-square error of approximation (RMSEA) ≤ 0.08, and standardized root-mean-square residual (SRMR) ≤ 0.08 [35,36]. Because these thresholds were derived for maximum likelihood estimation, behave differently with WLSMV [37], and RMSEA is inflated and imprecise in models with few degrees of freedom [36], local fit was also examined through residual correlations. Sensitivity analyses repeated the CFA with robust maximum likelihood (MLR) estimation, in the EFA subsample and in the full sample. Convergent validity at the construct level was summarised using the average variance extracted (AVE ≥ 0.50) and composite reliability (CR ≥ 0.70) computed from the standardized loadings of Model B, together with Pearson inter-item correlations [38]. Reliability was estimated in the full sample using Cronbach’s alpha (with Feldt 95% confidence interval) and McDonald’s omega computed from Model B, with bootstrap 95% confidence intervals (2000 resamples) [39]. Because Model B contains a residual covariance, two omega coefficients are reported: omega-hierarchical (ωh), which treats the variance shared only by FNQ4 and FNQ5 as error and therefore reflects the general food-noise factor, and omega-total (ωt), which treats this variance as reliable. Values above 0.80 were considered good [38]. Measurement invariance across sex and obesity status (BMI ≥ 30 vs. <30 kg/m2) was examined in the full sample by multi-group CFA of Model B with WLSMV estimation, theta parameterization, and the identification conditions proposed by Wu and Estabrook for ordered categorical indicators [40]. Increasingly constrained models were compared: configural, equal thresholds, equal thresholds and loadings (metric), and additionally equal intercepts (scalar). A constraint was considered tenable when ΔCFI ≥ −0.010 and ΔRMSEA ≤ 0.015 [41]; scaled χ2 difference tests are also reported. When a constraint was not supported, the parameter responsible was identified and released (partial invariance), and latent mean differences were estimated under the most constrained tenable model. Evidence for construct validity, in the sense of hypotheses testing relations with other variables [42], was examined by relating the FNQ total score to BMI, age, restaurant/café meal frequency and physical activity using Spearman correlations with 95% confidence intervals, including a partial Spearman correlation between the FNQ score and BMI adjusted for age and sex. Two-group comparisons (sex; obesity status) used Welch’s t-test with Hedges’ g and its 95% confidence interval. Comparisons across more than two groups used one-way analysis of variance with η2 and ω2 as effect sizes, Games–Howell post hoc tests [43] and, for ordered categories, a linear trend contrast. Mann–Whitney U and Kruskal–Wallis tests were run as non-parametric checks. Because only 10 participants were underweight, the BMI-category analysis was repeated with the underweight and normal-weight categories combined (<25 kg/m2).
3. Results
A total of 622 survey submissions were recorded. Of these, 174 respondents indicated at least one prespecified exclusion criterion during initial screening and were excluded. Among the remaining 448 respondents, three were excluded for being younger than 18 years, leaving 445 adults in the final analytic sample. All five FNQ items were completed by the eligible respondents. BMI could not be calculated for 12 participants because of missing or implausible anthropometric data. Their characteristics are presented in Table 1. The mean age was 39.4 ± 11.4 years (range 18–75), and females comprised 70.3% of respondents. Most participants were married (67.9%) and held a bachelor’s degree (59.6%). The mean BMI was 29.4 ± 6.5 kg/m2; of the 433 participants with valid BMI, 29.1% had overweight and 45.3% had obesity. Eating out was common, with 52.8% reporting restaurant or café meals at least twice weekly, and two-thirds reported little or no regular physical activity.
Table 1.
Sociodemographic and behavioural characteristics of the study sample (n = 445).
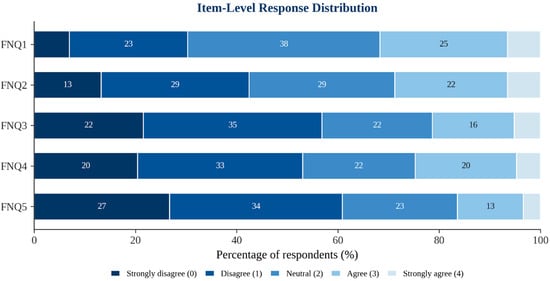
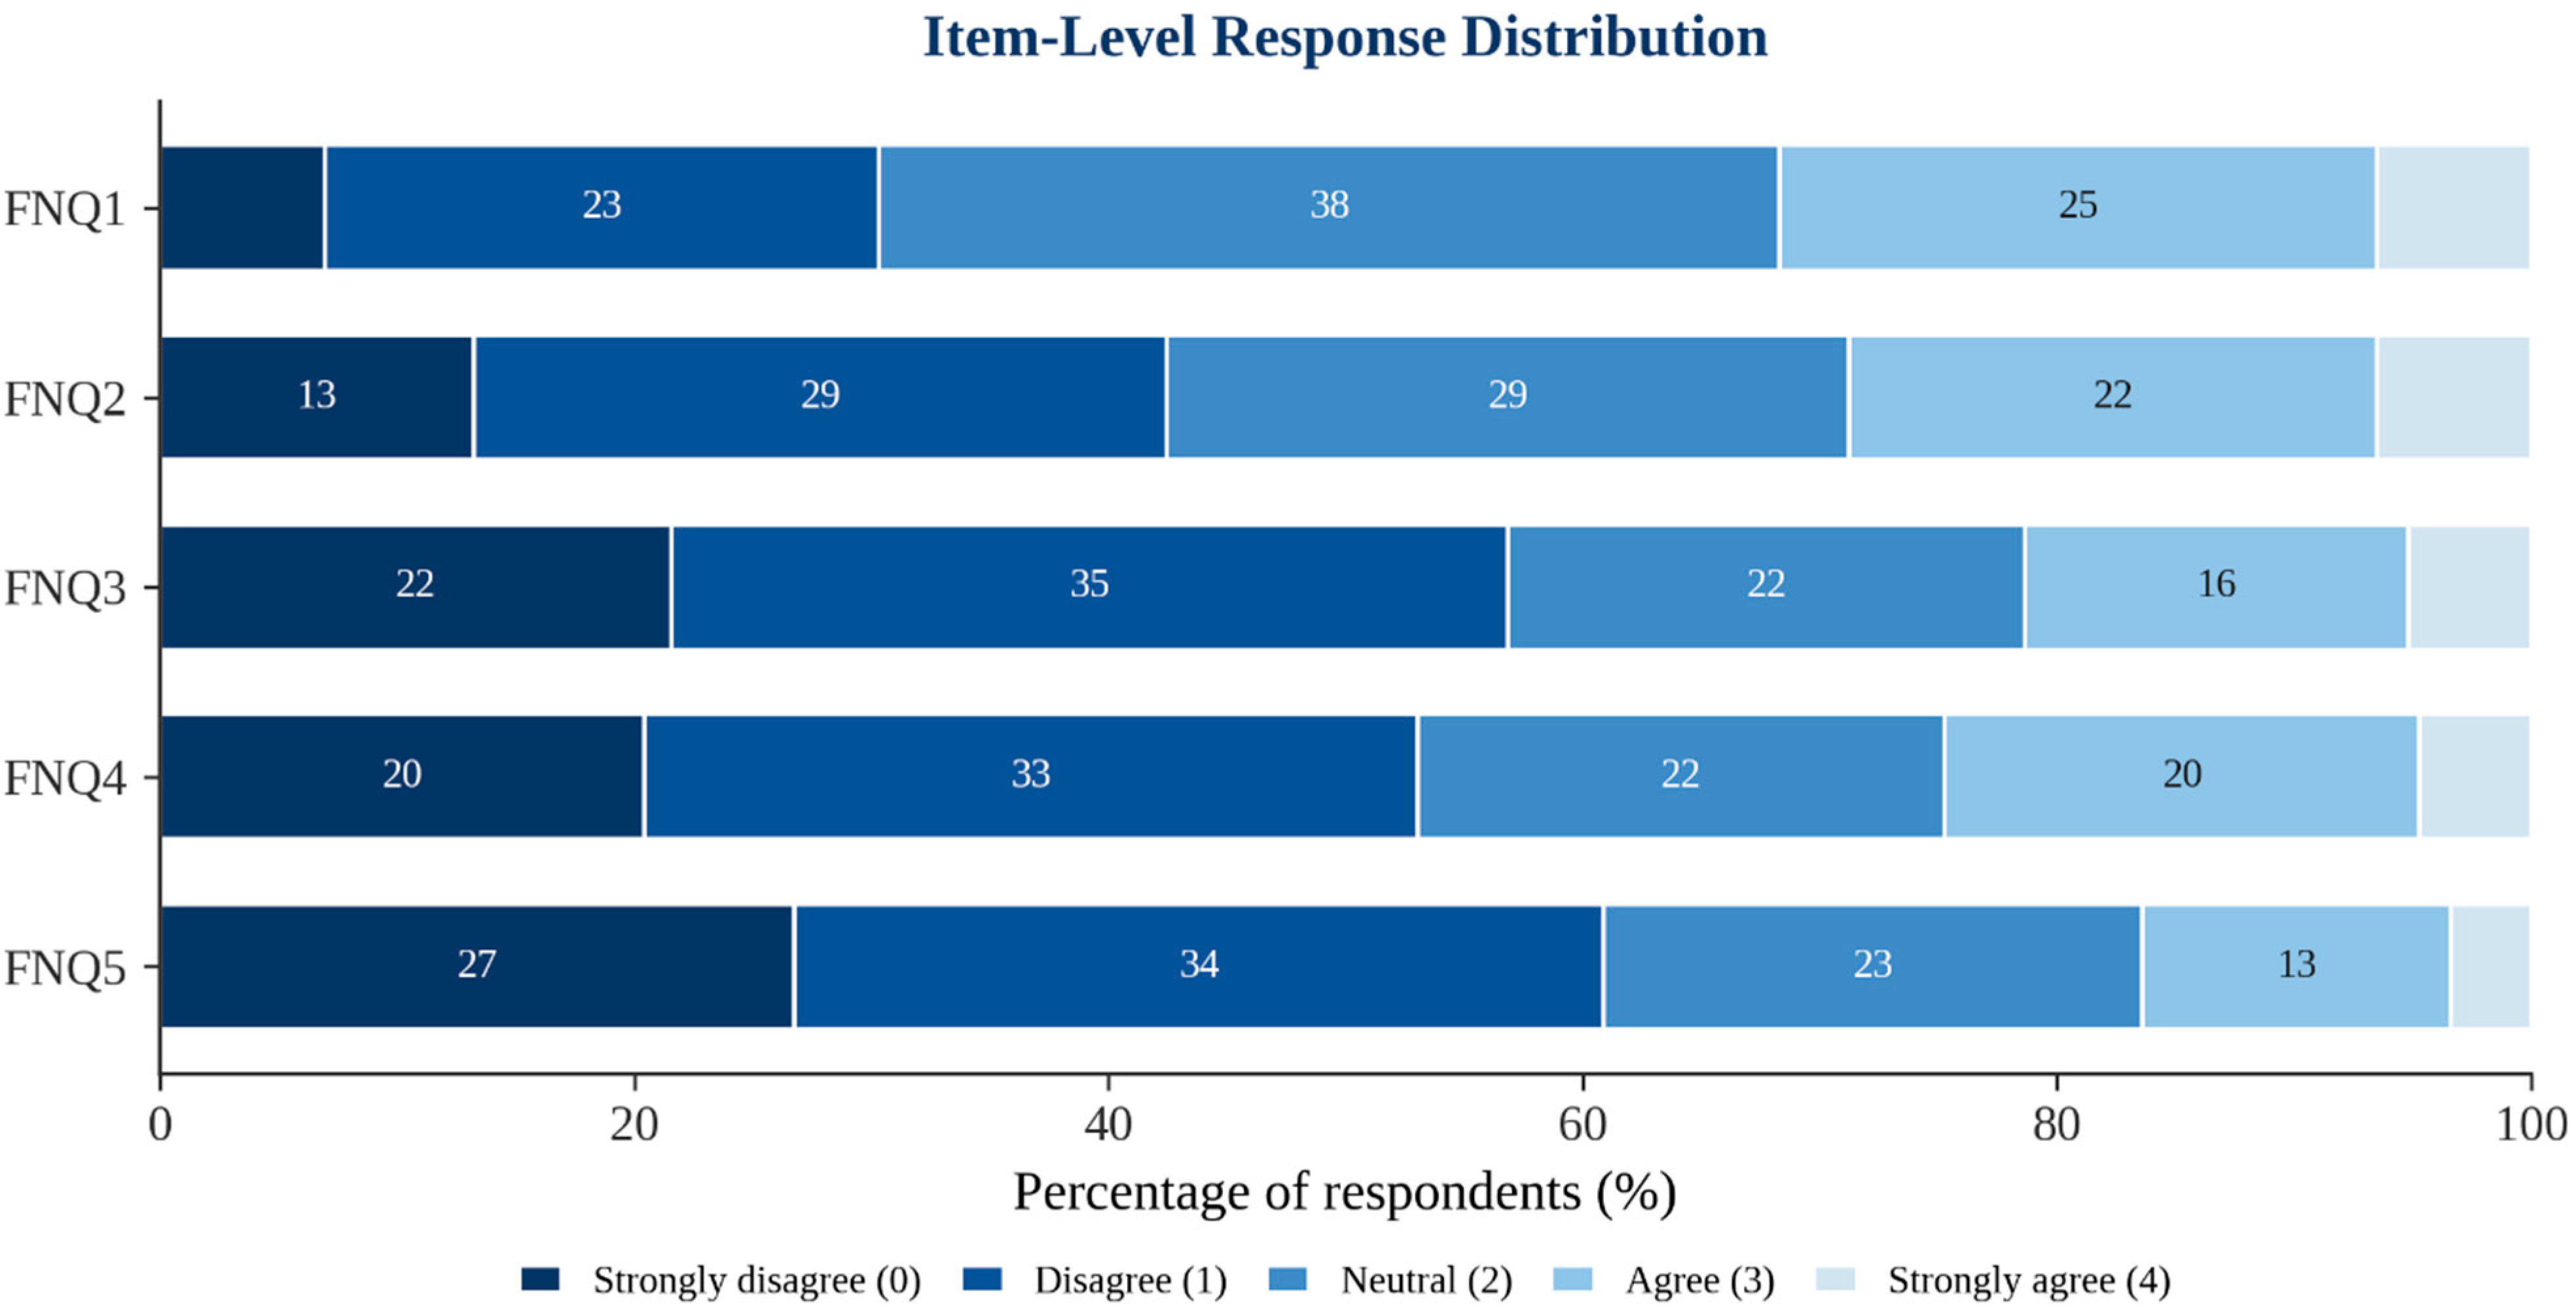
Item-level statistics are shown in Table 2. The mean FNQ total score was 8.2 ± 4.5 on the 0–20 scale. Item means ranged from 1.32 ± 1.10 (FNQ5, “my food thoughts distract me from completing other tasks”) to 2.01 ± 1.01 (FNQ1, “I constantly think about food throughout the day”). Floor effects exceeded the 15% criterion for FNQ3 (21.6%), FNQ4 (20.4%) and FNQ5 (26.7%), but not for FNQ1 (7.0%) or FNQ2 (13.3%), whereas ceiling effects were small for all items (3.4–6.5%) (Figure 1). At the scale level, only 2.9% of respondents obtained the minimum total score of 0 and 1.8% the maximum of 20, so the total score showed no floor or ceiling effect. Corrected item–total correlations were uniformly strong (0.593–0.774), and the deletion of no single item would have raised the overall alpha above its observed value of 0.867. Omega-hierarchical was 0.825 (bootstrap 95% CI 0.791–0.855) and omega-total 0.866 (95% CI 0.842–0.887); additional reliability coefficients are given in Supplementary Table S2.
Table 2.
Item-level descriptive statistics and item analysis of the Arabic FNQ (n = 445).
Figure 1.
Item-level response distribution of the Arabic FNQ.
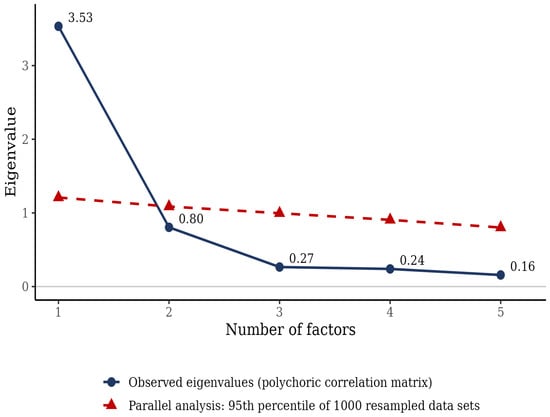
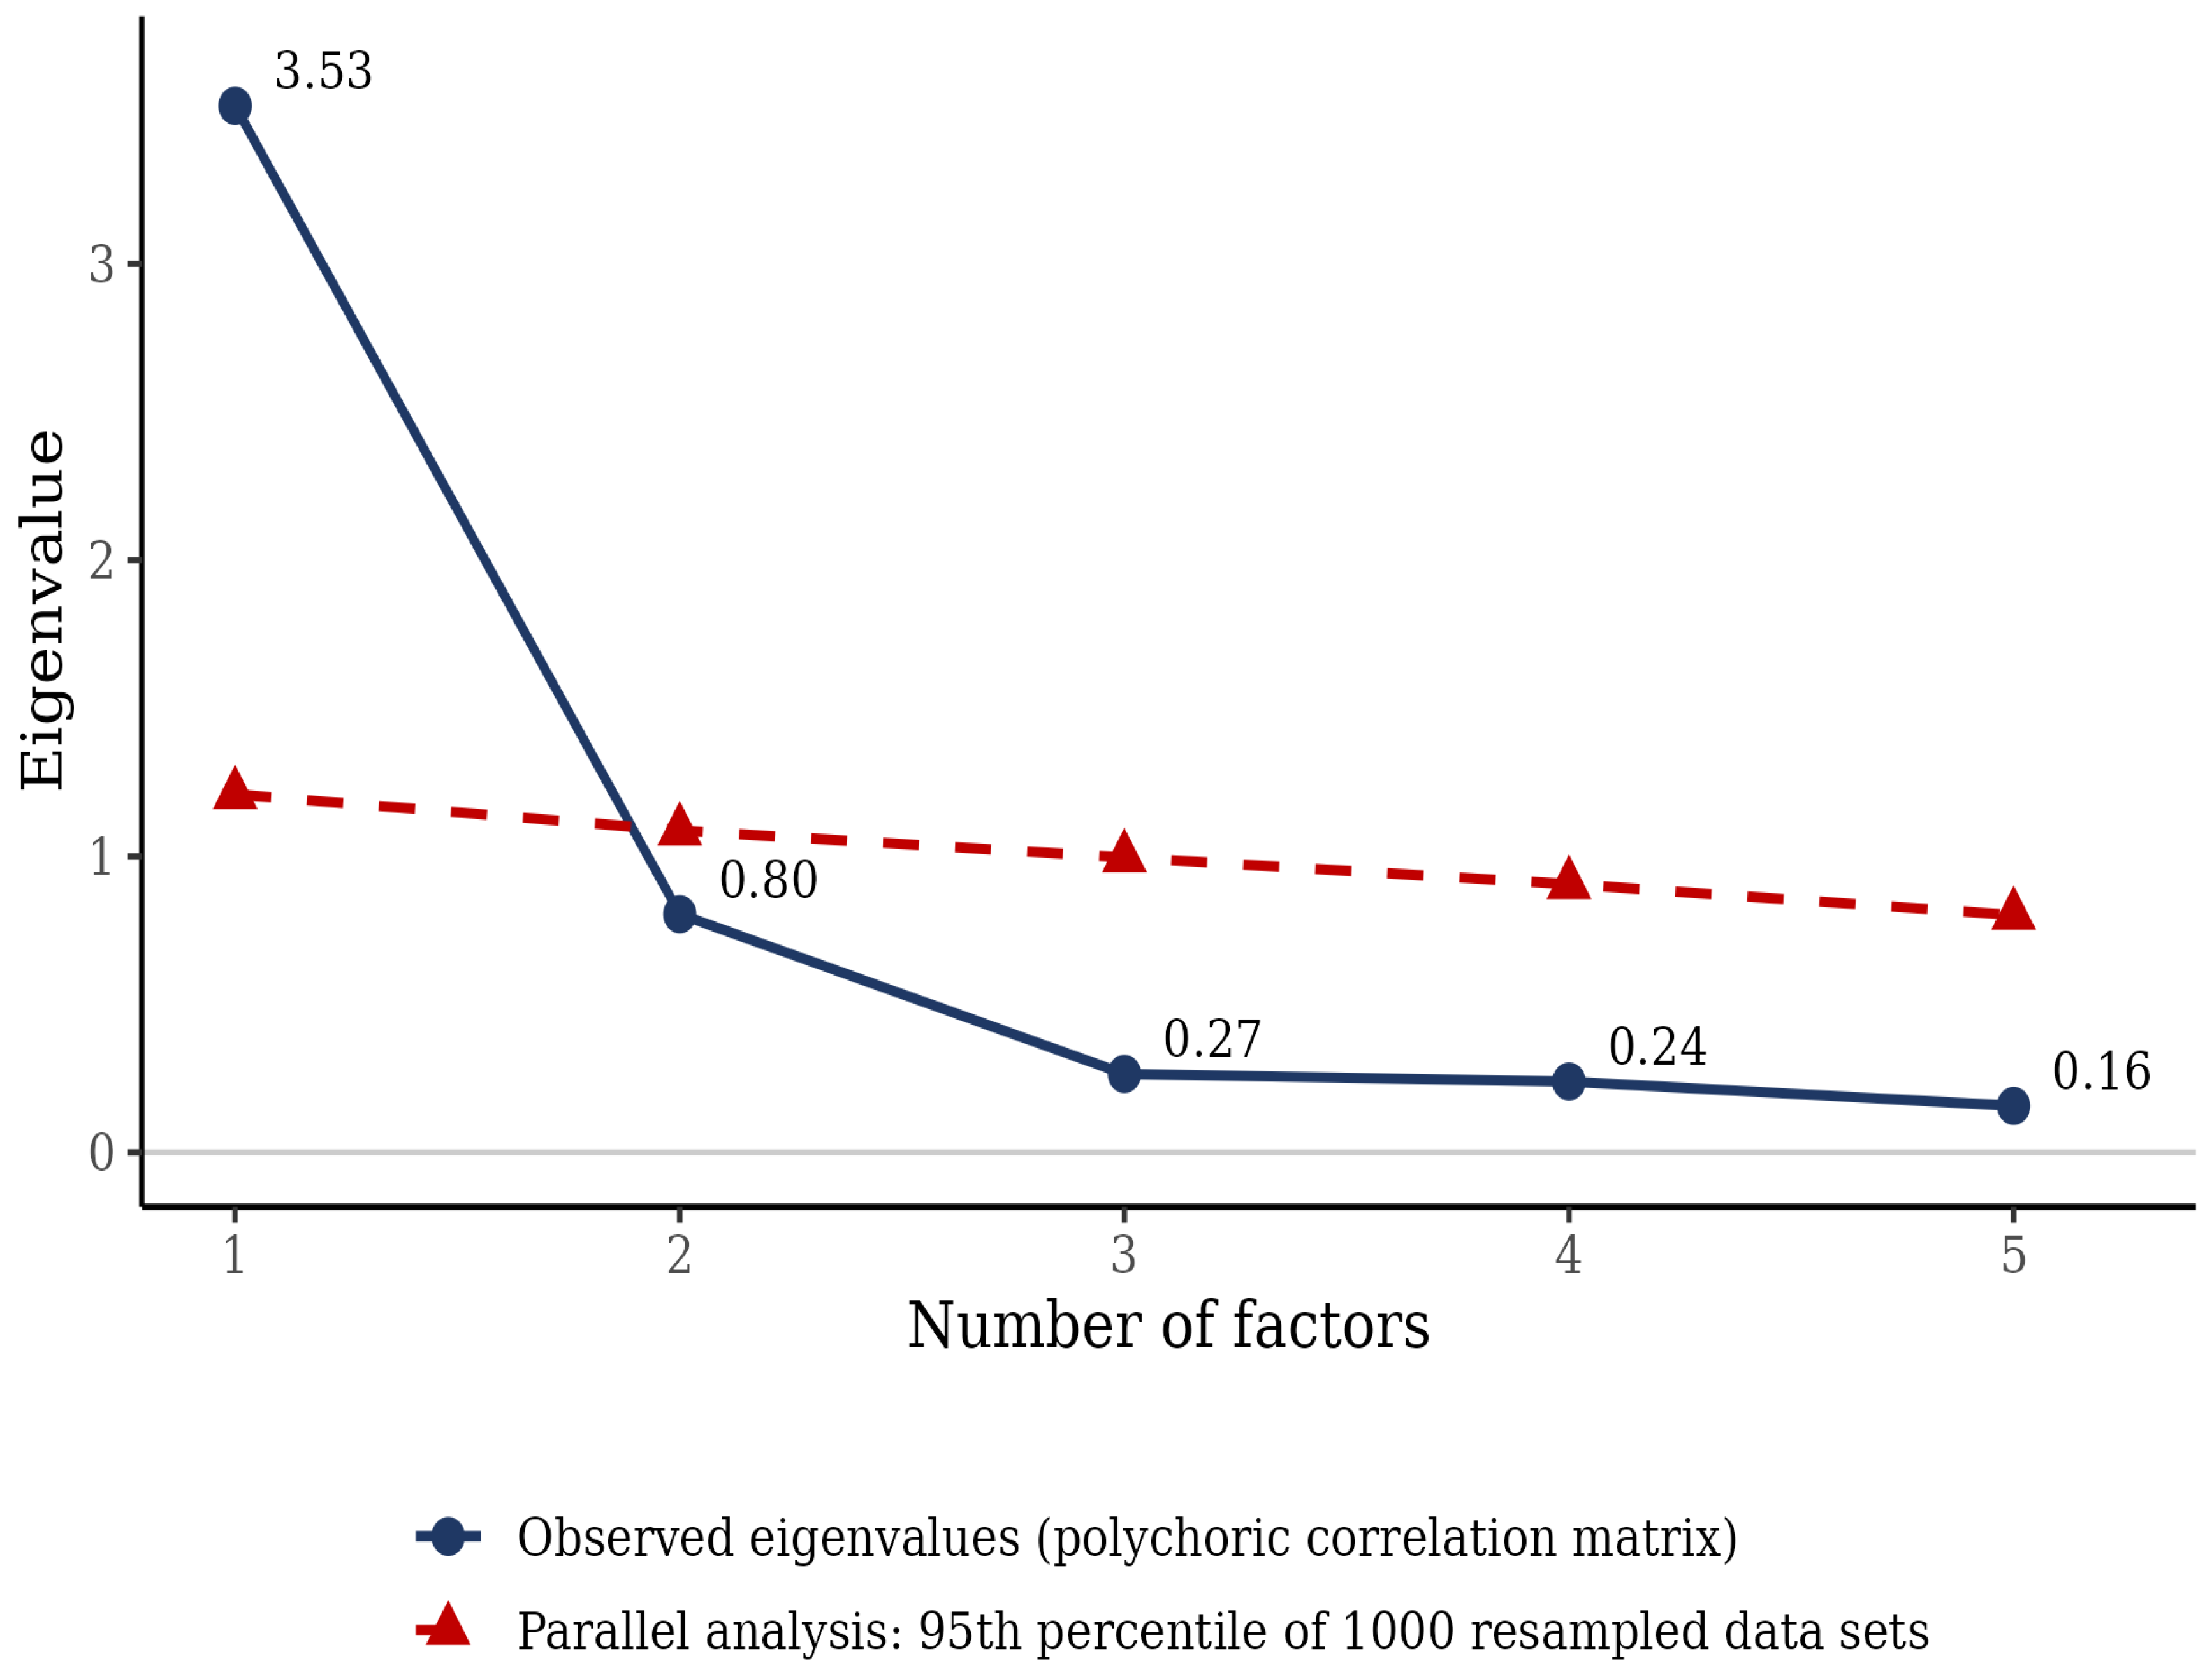
In the EFA subsample (n = 222), the polychoric correlation matrix was suitable for factor analysis (KMO = 0.810; Bartlett’s test χ2[10] = 777.9, p < 0.001). Only the first observed eigenvalue (3.53) exceeded the corresponding 95th-percentile eigenvalue from parallel analysis (1.21; second eigenvalue 0.80 vs. 1.09), and the MAP test reached its minimum at one factor (Figure 2); both criteria therefore supported a single factor. The one-factor solution accounted for 64.0% of the item variance, with loadings of 0.687–0.903 and communalities of 0.472–0.816 (Table 3). For transparency, parallel analysis based on reduced (common-factor) eigenvalues suggested a possible minor second factor (0.36 vs. 0.11); in a two-factor oblimin solution, this factor was defined only by FNQ4 and FNQ5 and correlated 0.65 with the first factor (Supplementary Table S3), a pattern consistent with the local dependence between these two items that was examined in the CFA. The principal component analysis of Pearson correlations reported in the original submission is provided in Supplementary Table S4 for comparison.
Figure 2.
Scree plot with parallel analysis for the Arabic FNQ (EFA subsample, n = 222). Observed eigenvalues of the polychoric correlation matrix are compared with the 95th percentile of eigenvalues from 1000 resampled data sets; only the first observed eigenvalue exceeds its random counterpart.
Table 3.
Exploratory factor analysis of the Arabic FNQ (EFA subsample, n = 222): one-factor minimum-residual solution of the polychoric correlation matrix.
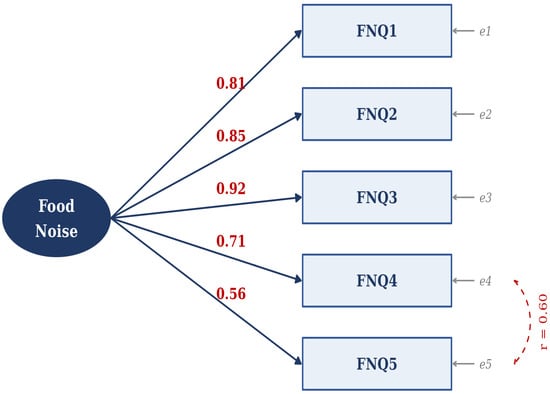
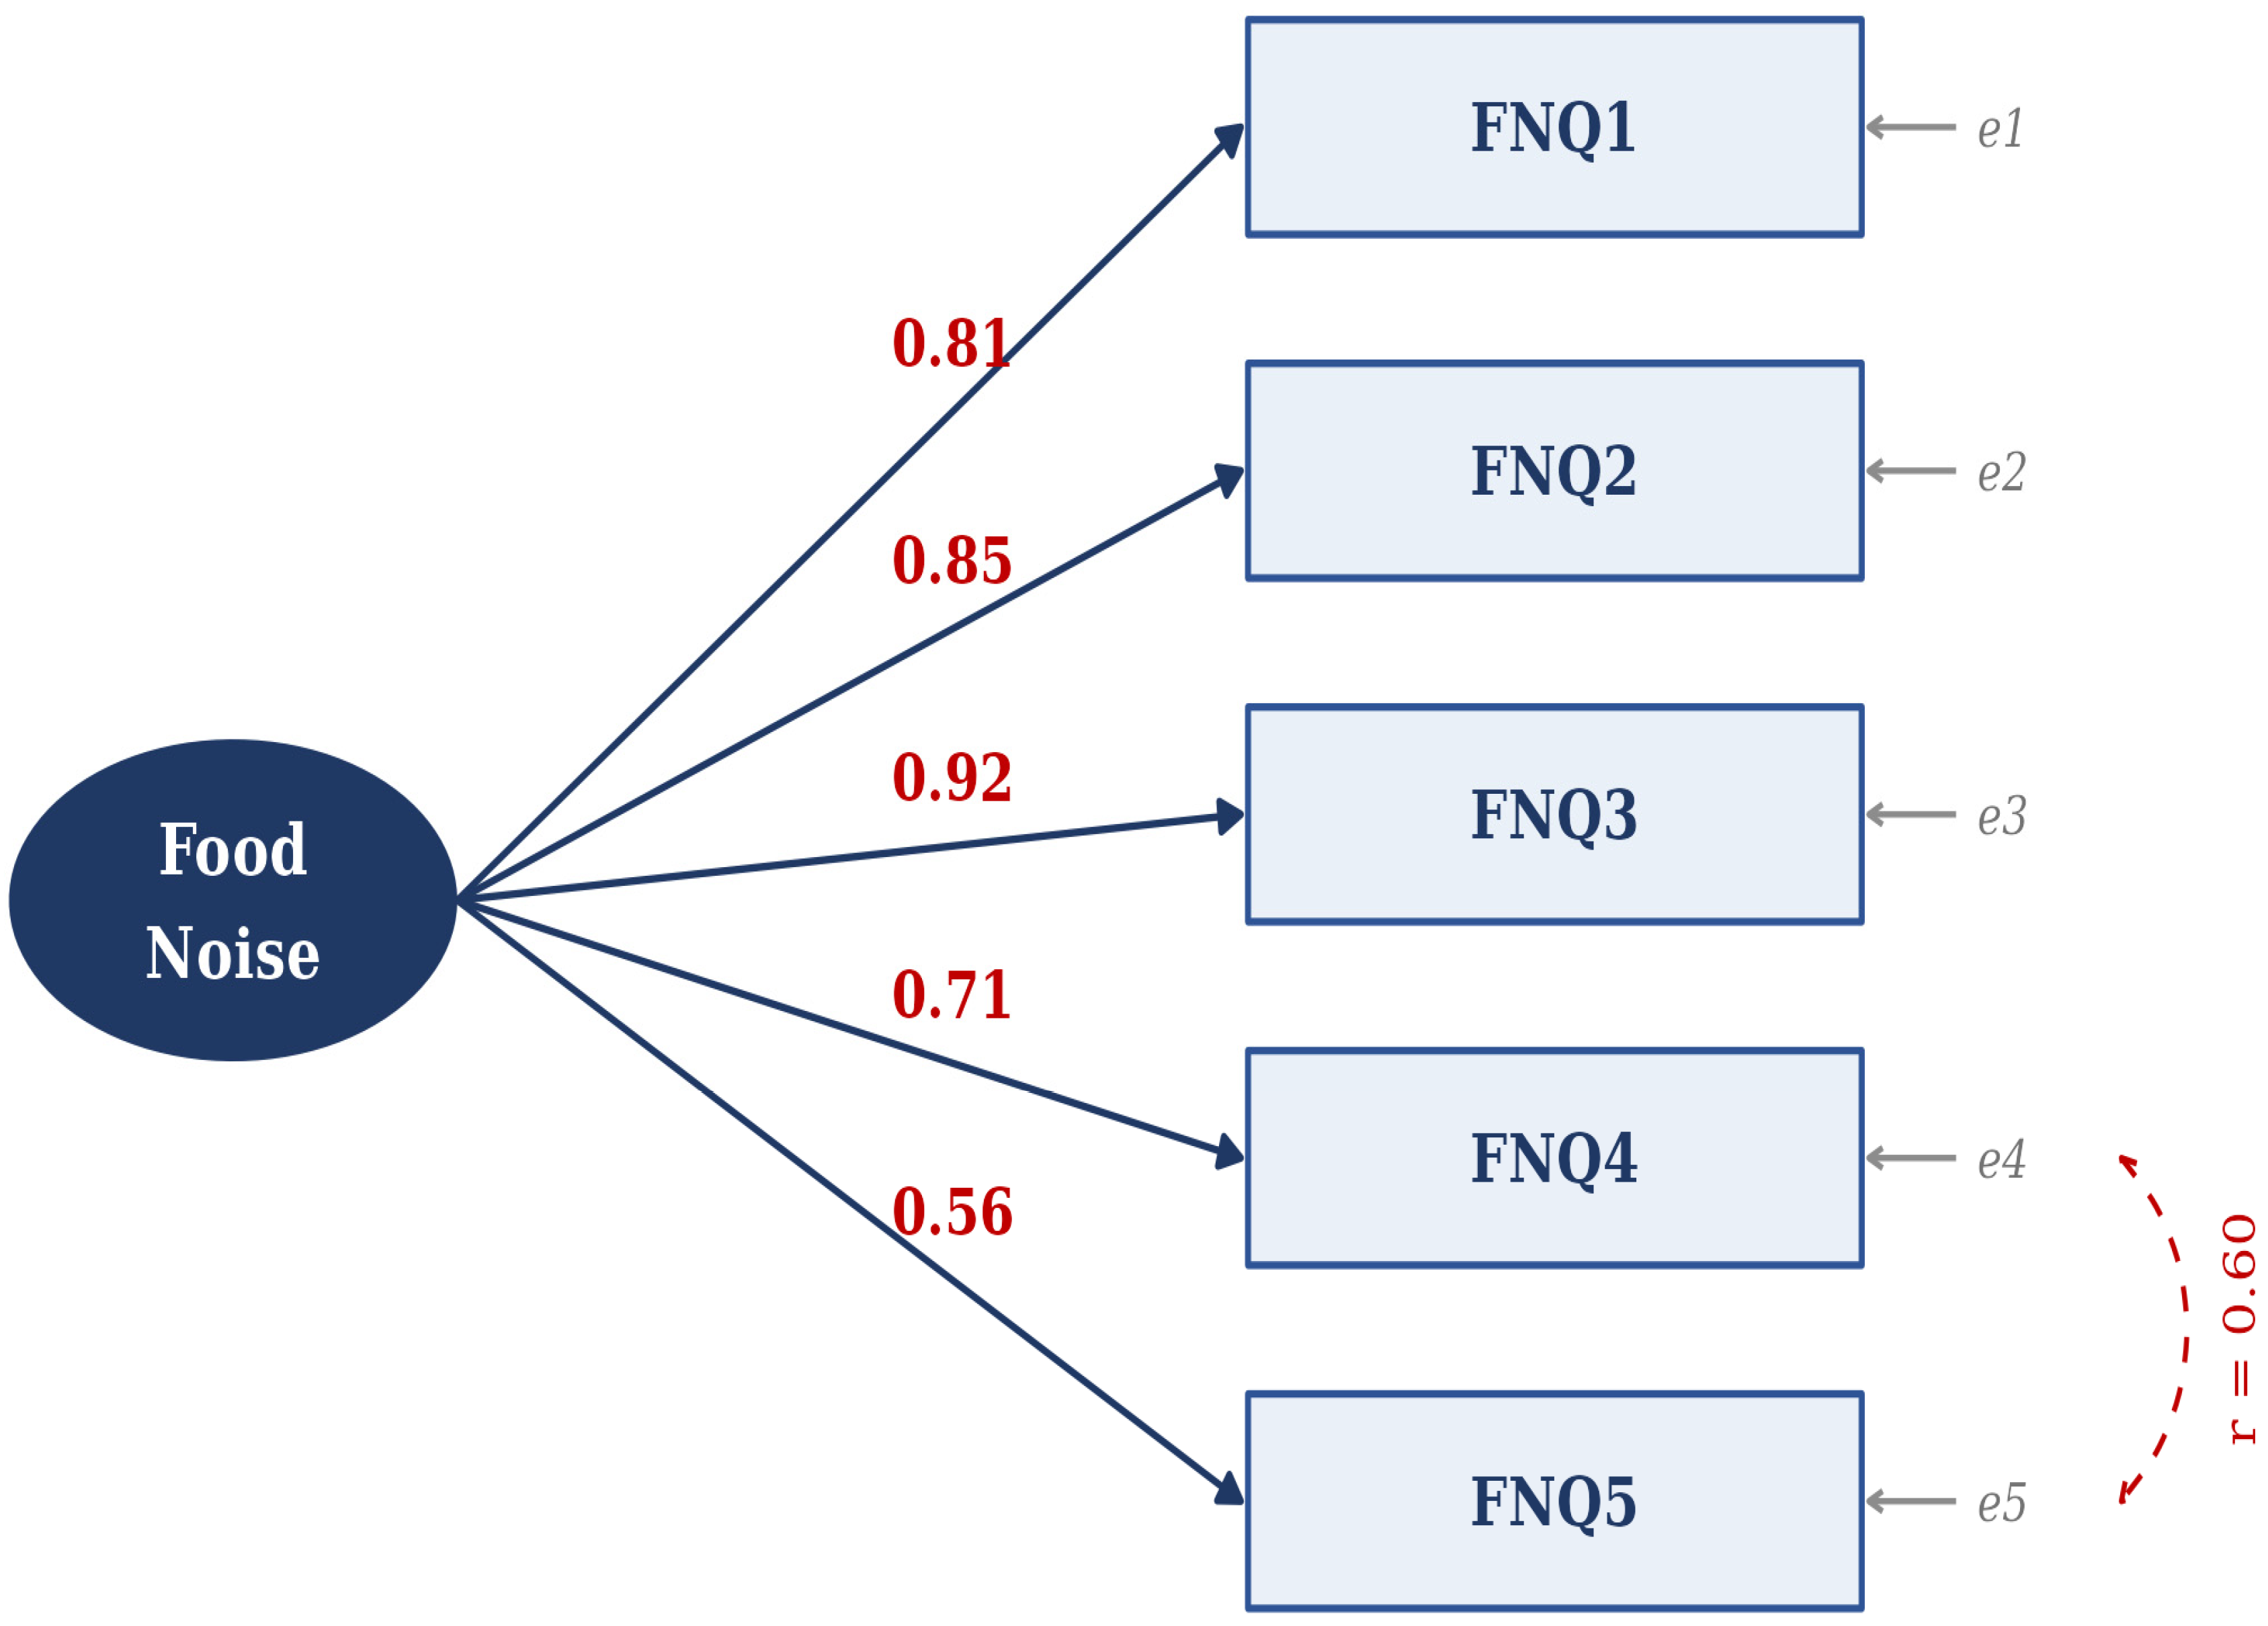
The one-factor structure was tested in the independent CFA subsample (n = 223) (Table 4). The strictly unidimensional Model A fitted poorly (scaled χ2[5] = 100.77, p < 0.001; CFI = 0.952; TLI = 0.904; RMSEA = 0.294, 90% CI 0.245–0.345; SRMR = 0.085), and its largest modification index concerned the residual covariance between FNQ4 and FNQ5 (MI = 58.7). Freeing this parameter (Model B) significantly improved fit (scaled Δχ2[1] = 50.10, p < 0.001) and gave good fit on CFI, TLI and SRMR (scaled χ2[4] = 12.55, p = 0.014; CFI = 0.996; TLI = 0.989; SRMR = 0.024), whereas RMSEA remained above 0.08 (0.098, 90% CI 0.040–0.162). Because RMSEA is inflated and imprecise in a model with only four degrees of freedom [36], local fit was inspected: all residual correlations of Model B were ≤ |0.06|. In Model B, standardized loadings ranged from 0.558 to 0.918 (all p < 0.001), and the FNQ4–FNQ5 residual correlation was 0.60 (95% CI 0.50–0.69) (Table 4; Figure 3). The AVE was 0.607 and the CR was 0.883. In the equivalent bifactor representation of Model B, the general factor explained 81.3% of the common variance (ECV = 0.813; PUC = 0.90), values indicating that the common variance is essentially unidimensional and that a single total score is appropriate [34]. The same pattern, poor fit of Model A and good CFI, TLI and SRMR but elevated RMSEA for Model B, was observed in the EFA subsample and in the full sample, whereas with MLR estimation Model B showed good fit on all indices (Supplementary Table S5).
Table 4.
Confirmatory factor analysis of the Arabic FNQ (CFA subsample, n = 223; WLSMV estimation).
Figure 3.
Path diagram of the final one-factor CFA model (Model B) of the Arabic FNQ (CFA subsample, n = 223; WLSMV estimation; standardized estimates). The dashed curve denotes the residual correlation between FNQ4 and FNQ5.
The full inter-item correlation matrix (Table 5) showed uniformly positive, significant correlations ranging from 0.338 to 0.735 (all p < 0.001); the corresponding polychoric correlations ranged from 0.377 to 0.799. Associations between the FNQ total score and other study variables are reported in Table 6. Food noise was weakly positively correlated with BMI (ρ = 0.186, 95% CI 0.093–0.276, p < 0.001), and this association was slightly stronger after adjustment for age and sex (partial ρ = 0.209, p < 0.001). It was also weakly correlated with restaurant/café meal frequency (ρ = 0.208, p < 0.001) and weakly negatively correlated with age (ρ = −0.116, p = 0.014), whereas it was unrelated to physical activity (ρ = −0.008, p = 0.864).
Table 5.
Inter-item correlation matrix of the Arabic FNQ (n = 445).
Table 6.
Spearman correlations of the Arabic FNQ total score with other study variables.
Measurement invariance results are summarised in Table 7. Across sex, the threshold, metric and scalar constraints were all tenable (ΔCFI ≥ 0.001, ΔRMSEA ≤ −0.012 and scaled Δχ2 p ≥ 0.38 at every step), indicating full scalar invariance. Across obesity status, threshold invariance was supported. Constraining all loadings did not meaningfully change CFI or RMSEA (ΔCFI = −0.002; ΔRMSEA = 0.002), but the scaled Δχ2 test was significant (Δχ2[4] = 13.38, p = 0.010). Releasing the FNQ5 loading alone removed this difference (Δχ2[3] = 1.90, p = 0.594), and the intercept constraints were then tenable (Δχ2[3] = 2.28, p = 0.516; ΔCFI = 0.001), indicating partial scalar invariance: FNQ5 loaded more strongly on the factor in participants with obesity (standardized λ = 0.73) than in those without (λ = 0.45). The relatively high RMSEA of the configural models reflects the elevated RMSEA of the low-df baseline model and decreased as constraints were added. Under the (partial) scalar models, the latent food-noise mean was 0.18 SD higher in women than in men (95% CI −0.03 to 0.40, p = 0.094) and 0.35 SD higher in participants with obesity than in those without (95% CI 0.14 to 0.56, p = 0.001).
Table 7.
Measurement invariance of the Arabic FNQ across sex (n = 445; 313 women, 132 men) and obesity status (n = 433; 196 with obesity, 237 without): multi-group CFA (WLSMV, theta parameterization).
Group comparisons are shown in Table 8. Adults with obesity scored higher than those without (8.94 ± 4.69 vs. 7.50 ± 4.29; Welch t = 3.31, p = 0.001; Hedges’ g = 0.32, 95% CI 0.13–0.51), a small effect; the difference persisted when FNQ5 was excluded from the total score (7.50 ± 3.80 vs. 6.29 ± 3.67, p < 0.001). FNQ scores also differed across BMI categories (F[3, 429] = 4.15, p = 0.006; η2 = 0.028); Games–Howell tests showed higher scores in the obesity than in the normal-weight group (mean difference 1.83, p = 0.006) and no other significant pairwise differences. With the underweight and normal-weight categories combined, scores increased linearly across <25, 25–29.9 and ≥30 kg/m2 (p for trend <0.001; Supplementary Table S7). Scores increased with restaurant/café meal frequency (F[4, 440] = 6.79, p < 0.001; η2 = 0.058; p for linear trend < 0.001): participants eating out 2–4 times per week or once daily scored higher than those eating out once a month, and those eating out once daily scored higher than those doing so 2–4 times per month (Games–Howell p ≤ 0.042). Scores did not differ by sex (g = 0.16, 95% CI −0.05 to 0.36, p = 0.136) or physical activity level (p = 0.941). Non-parametric tests led to the same conclusions. All results were materially unchanged after removal of the five redundant duplicate records (Supplementary Table S8).
Table 8.
Arabic FNQ total scores across participant groups, with effect sizes (n = 445).
4. Discussion
This study provides the first psychometric evaluation of an Arabic-language FNQ and shows that the construct of food noise can be measured in Saudi adults with a brief instrument that shows supportive evidence of structural validity and good internal consistency. The Arabic FNQ was essentially unidimensional and internally consistent, and it was related to adiposity and eating behaviour in the expected directions, although these associations were small and provide only preliminary evidence of construct validity. In doing so, it extends its measurement concept, which originated in North America and was recently confirmed in Italy, into a region with one of the world’s heaviest obesity burdens [16,44].
The clearest result concerns the instrument’s dimensionality. Parallel analysis and the MAP test in the exploratory subsample supported one factor, and the confirmatory analysis in an independent subsample supported a single general factor once the residual covariance between FNQ4 and FNQ5 was modelled. This local dependence is substantively plausible: unlike FNQ1–FNQ3, which describe the frequency and controllability of food thoughts, FNQ4 and FNQ5 both describe their functional consequences (interference with one’s daily schedule and with completing tasks) in closely related wording. The bifactor indices (ECV = 0.81; PUC = 0.90; ωh/ωt = 0.95) indicate that this shared specific variance is small relative to the general factor, so the instrument can be treated as essentially unidimensional and scored as a single total [34]. Nevertheless, the strictly unidimensional model fitted poorly and the RMSEA of the final model exceeded the conventional cut-off, so the structure, and in particular the FNQ4–FNQ5 dependence, should be re-examined in independent samples and in the other language versions. The single-factor solution is consistent with the original and Italian validations [16,44] and suggests that food noise is a coherent construct across languages and food environments, although three samples cannot establish this. Our subsamples were analysed separately to avoid the fit inflation that follows from testing and confirming a model on the same data [45].
Internal consistency was good. Cronbach’s alpha (0.867) and omega-total (0.866) were almost identical, whereas omega-hierarchical was lower (0.825). The difference is explained by the FNQ4–FNQ5 residual covariance: alpha and ωt count the variance shared only by these two items as reliable, whereas ωh counts it as error and therefore indexes how precisely the total score reflects the general food-noise factor. All coefficients, and the composite reliability of 0.883, exceeded 0.80. They are lower than the alpha of 0.93 reported for the English original and the categorical omega of 0.92 reported for the Italian version [16,44], a difference that may reflect our community sampling frame, convenience sampling, and the use of Modern Standard Arabic across a linguistically diverse readership. They remain well above the 0.70 threshold for group-level use.
The associations with other variables were consistent in direction but small in magnitude. FNQ scores were higher in adults with obesity (g = 0.32) and increased with the frequency of eating out (η2 = 0.058), which fits the conceptualization of food noise as cue-driven cognition in an obesogenic environment [17]. The correlation with BMI, while significant, was modest in magnitude (ρ = 0.186). A weak association is expected given the distinct nature of the two measures, but it also means that BMI cannot serve as a strong anchor for construct validity. BMI is a downstream anthropometric marker that integrates the long-term effects of genetics, metabolism, lifestyle, and energy balance, whereas food noise captures an upstream cognitive process underlying eating behaviour. Because food noise is influenced by multiple neurobiological, behavioural, and environmental determinants rather than body weight alone, stronger associations with eating-related cognitions and behaviours than with BMI are both expected and consistently reported in the literature [15,16,44]. These findings therefore offer preliminary, rather than conclusive, support for construct validity. Stronger evidence requires convergent correlations with established measures of related eating cognitions and behaviours, such as food cravings, uncontrolled or emotional eating, and food responsiveness, and discriminant correlations with measures of psychological distress, none of which were administered here. The absence of an association with physical activity is consistent with food noise being distinct from energy-expenditure behaviour, but it constitutes only weak discriminant evidence.
The invariance analyses qualify these group comparisons. Across obesity status, scalar invariance was partial: FNQ5 (“my food thoughts distract me from completing other tasks”) was more strongly related to the latent factor in participants with obesity than in those without. All other loadings, all thresholds and the intercepts of the remaining items were invariant, which permits a valid comparison of latent means [46]. The latent difference (0.35 SD) was similar in size to the observed-score difference (g = 0.32), and the observed difference remained significant when FNQ5 was excluded, so the higher food-noise scores of participants with obesity do not appear to be an artefact of differential item functioning. FNQ5 may capture a form of functional interference that becomes more closely tied to food noise at higher BMI, a possibility that should be examined in clinical samples.
Another finding was that food noise was inversely associated with age, although the association was weak (ρ = −0.12): younger adults reported more intrusive food cognition. This is biologically and culturally plausible, as reward sensitivity and impulsivity decline across adulthood, and younger people are more exposed to food marketing, delivery applications, and social media food content. Several studies have demonstrated the effects of unhealthy food marketing, especially in the era of digital transformation, on food consumption and obesity. Young people are disproportionately vulnerable due to psychological development, making them highly susceptible to peer influence, colorful branding, and emotional appeals, suggesting that screening and intervention efforts might be most impactful in younger cohorts [47,48,49,50,51,52].
Moreover, another interesting finding was that food noise did not differ by sex. Because the Arabic FNQ showed full scalar invariance across sex, this result can be interpreted as the absence of a meaningful difference in the latent construct rather than as an artefact of differential item functioning; it agrees with the sex invariance reported for the Italian version and supports a single scoring scheme for women and men [44]. Additionally, physical activity level was unrelated to food noise. This independence aligns with contemporary appetite regulation frameworks, which conceptualize food noise as a more appetitive–cognitive phenomenon rather than a simple reflection of physiological energy expenditure or metabolic demand [53,54].
These results carry particular weight in the Saudi and the broader Gulf context. With roughly two-thirds of Saudi adults having a BMI > 25 kg/m2 and a national policy commitment to curbing non-communicable disease, instruments that capture the lived, cognitive experience of disordered appetite, not just the number on the scale, are valuable for both surveillance and individualized care [3,4].
The relevance is sharpened by the rise in GLP-1 and dual-incretin receptor agonists (such as semaglutide and tirzepatide). Patients taking these medications often report that their food noise becomes quieter [19,20], and an early single-case neuroimaging study [20] and a narrative review [18] have proposed that these agents modulate activity in reward-related circuits and the default mode network. These mechanistic proposals remain preliminary and require confirmation in controlled studies. Once its responsiveness to change has been established, the Arabic FNQ could help quantify such effects in Arabic-speaking patients, using food noise as a patient-centered outcome that complements weight change, and testing the proposal that food noise serves as a marker of obesity disease activity that responds to treatment [55,56]. Because the instrument is only five items long, it is feasible to administer repeatedly in clinic or in large epidemiological samples.
5. Strengths, Limitations, and Recommendations
Some limitations temper these conclusions. First, participants were recruited online through convenience sampling, all were residents of Saudi Arabia, and 70% were women; the sample is therefore not representative of the Saudi population, and transferability to other Arabic-speaking countries, dialect communities and clinical populations has not been tested. Second, the cross-sectional design precluded the assessment of test–retest reliability and responsiveness to change. Third, weight and height were self-reported, which can bias BMI, and only implausible values were set to missing. Fourth, evidence on relations with other variables was limited to BMI, age and two single-item behavioural measures; no established measures of eating cognition (e.g., food cravings, disinhibited, emotional or binge eating) or of psychological distress were administered, so convergent and discriminant validity could not be properly evaluated. Fifth, floor effects above 15% for FNQ3–FNQ5 indicate that these items discriminate poorly among people with little food noise; although the total score showed no floor effect, the scale may be less able to register further reductions in people who start with low scores, which matters for its use as a treatment-response measure. Sixth, the strictly unidimensional model did not fit, the final model included a residual covariance that was also suggested by the data, its RMSEA exceeded the conventional cut-off, and scalar invariance across obesity status was only partial. Finally, five records were exact duplicates despite the one-response-per-device setting; their removal did not change any conclusion.
Future studies should establish test–retest reliability, examine the scale’s measurement properties, including measurement invariance, in other Arabic-speaking countries, and evaluate convergent and discriminant validity against validated measures of eating cognition and psychological distress. Longitudinal and interventional designs, especially among patients initiating incretin-based therapy, are needed to determine whether the Arabic FNQ is sensitive to change and whether food noise functions as a marker of obesity disease activity. Probability-based sampling across multiple Arab countries would strengthen generalizability and support pooled, cross-cultural analyses.
6. Conclusions
In a community sample of Saudi adults, the Arabic Food Noise Questionnaire showed an essentially unidimensional structure, good internal consistency, and invariance across sex and, partially, across obesity status. Its small associations with BMI, obesity status and eating-out behaviour provide preliminary support for its construct validity. The Arabic FNQ is a brief, culturally adapted instrument suitable for research on intrusive food-related thoughts in Saudi adults. Before it is used for clinical monitoring or in other Arabic-speaking countries, its convergent and discriminant validity, test–retest reliability, responsiveness to treatment and cross-national measurement invariance should be established.
Supplementary Materials
The following supporting information can be downloaded at: https://www.mdpi.com/article/10.3390/nu18223847/s1, Supplementary File S1: Arabic version of the Food Noise Questionnaire; Supplementary File S2: Supplementary methods and results (translation and content validity, additional and sensitivity analyses, Tables S1–S8) [57].
Author Contributions
All authors contributed to the conception and design of the study, the translation and validation procedures, the interpretation of results, and the critical revision of the manuscript. All authors have read and agreed to the published version of the manuscript.
Funding
This research received no external funding.
Institutional Review Board Statement
This study was reviewed and approved by the Research Ethics Committee of the University of Hail, Kingdom of Saudi Arabia (approval no. H-2026-080; registered with the National Committee of Bio-Ethics, HAP-08-L-158, Date 3 February 2026). All participants provided electronic informed consent before completing the anonymous survey. The study was conducted in accordance with the principles of the Declaration of Helsinki [58].
Informed Consent Statement
Informed consent was obtained from all participants involved in the study.
Data Availability Statement
The de-identified dataset is available from the corresponding author on reasonable request.
Acknowledgments
The authors thank the expert panel and all participants who contributed their time to this study. In addition, during the preparation of this manuscript, the authors used generative artificial intelligence tools to assist with language refinement, editing, and the organization of selected statistical analyses. All outputs were critically reviewed and verified by the authors, who take full responsibility for the accuracy, integrity, and final content of the manuscript.
Conflicts of Interest
Carel le Roux reports research grants from the EU Innovative Medicines Initiative, the Irish Research Council, Science Foundation Ireland, Anabio, and the Health Research Board; has served on advisory boards and speakers’ bureaus for AbbVie, Altimmune, Amgen, Arrowhead Pharmaceuticals, AstraZeneca, Boehringer Ingelheim, Eli Lilly, Gila Pharmaceuticals, Herbalife, Irish Life Health, Johnson & Johnson, Keyron, Medscape, Metsera, Morphic Medical, Novo Nordisk, Nymble, Olympus, Pfizer, Rhythm Pharmaceuticals, Roche, Wave Life Sciences, and Zealand Pharma; is Chair of the Irish Society for Nutrition and Metabolism; has received stock options from Nymble for scientific advisory board activities; and provides obesity clinical care at, and is a co-owner of, the My Best Weight and Beyond BMI clinics. Assim Alfadda reports receiving financial support from Novo Nordisk and Eli Lilly to attend scientific conferences and consulting fees from both companies outside the submitted work. Abdullah Badawi has received speaker honoraria for educational activities from Novo Nordisk and Eli Lilly and Company. Ali Alshehri has received speaker honoraria from Novo Nordisk, Eli Lilly, Sanofi, Boehringer Ingelheim, AstraZeneca, Currax Pharmaceuticals, Amgen, and EVA Pharma; advisory board honoraria from Novo Nordisk, Eli Lilly, Boehringer Ingelheim, AstraZeneca, and Currax Pharmaceuticals; and institutional research funding from Novo Nordisk, Eli Lilly, Boehringer Ingelheim, AstraZeneca, and Amgen. The remaining authors declare no conflicts of interest. No research funding or financial support was received for the present study.
Abbreviations
The following abbreviations are used in this manuscript:
| Abbreviation | Full Term |
| AVE | Average variance extracted |
| BMI | Body mass index |
| CFA | Confirmatory factor analysis |
| CFI | Comparative fit index |
| CI | Confidence interval |
| CR | Composite reliability |
| ECV | Explained common variance |
| EFA | Exploratory factor analysis |
| FNQ | Food Noise Questionnaire |
| GLP-1 | Glucagon-like peptide-1 |
| KMO | Kaiser–Meyer–Olkin |
| MAP | Minimum average partial |
| MLR | Robust maximum likelihood |
| PUC | Percentage of uncontaminated correlations |
| RMSEA | Root-mean-square error of approximation |
| SRMR | Standardized root-mean-square residual |
| TLI | Tucker–Lewis index |
| WHO | World Health Organization |
| WLSMV | Weighted least squares, mean- and variance-adjusted |
References
- Phelps, N.H.; Singleton, R.K.; Zhou, B.; Heap, R.A.; Mishra, A.; Bennett, J.E.; Barbagallo, C.M. Worldwide trends in underweight and obesity from 1990 to 2022: A pooled analysis of 3663 population-representative studies with 222 million children, adolescents, and adults. Lancet 2024, 403, 1027–1050. [Google Scholar] [CrossRef] [Scilit]
- Obesity Awareness. Ministry of Health, Kingdom of Saudi Arabia. Available online: https://www.moh.gov.sa/en/awarenessplateform/chronicdisease/pages/obesity.aspx (accessed on 29 June 2026).
- General Authority for Statistics. Health Determinants Statistics Publication 2024; General Authority for Statistics: Riyadh, Saudi Arabia, 2024.
- Alsulami, S.; Baig, M.; Ahmad, T.; Althagafi, N.; Hazzazi, E.; Alsayed, R. Obesity prevalence, physical activity, and dietary practices among adults in Saudi Arabia. Front. Public Health 2023, 11, 1124051. [Google Scholar] [CrossRef] [Scilit]
- Althumiri, N.A.; Basyouni, M.H.; AlMousa, N.; AlJuwaysim, M.F.; Almubark, R.A.; BinDhim, N.F. Obesity in Saudi Arabia in 2020: Prevalence, distribution, and its current association with various health conditions. Healthcare 2021, 9, 311. [Google Scholar] [CrossRef] [Scilit]
- Al-Omar, H.A.; Alshehri, A.; Alqahtani, S.A.; Alabdulkarim, H.; Alrumaih, A.; Eldin, M.S. A systematic review of obesity burden in Saudi Arabia: Prevalence and associated co-morbidities. Saudi Pharm. J. 2024, 32, 102192. [Google Scholar] [CrossRef] [Scilit]
- Heymsfield, S.B.; Wadden, T.A. Mechanisms, pathophysiology, and management of obesity. N. Engl. J. Med. 2017, 376, 254–266. [Google Scholar] [CrossRef] [Scilit]
- Blüher, M. Obesity: Global epidemiology and pathogenesis. Nat. Rev. Endocrinol. 2019, 15, 288–298. [Google Scholar] [CrossRef] [Scilit]
- Berthoud, H.R.; Lenard, N.R.; Shin, A.C. Food reward, hyperphagia, and obesity. Am. J. Physiol. Regul. Integr. Comp. Physiol. 2011, 300, R1266–R1277. [Google Scholar] [CrossRef] [Scilit]
- Volkow, N.D.; Wang, G.J.; Baler, R.D. Reward, dopamine and the control of food intake: Implications for obesity. Trends Cogn. Sci. 2011, 15, 37–46. [Google Scholar] [CrossRef] [Scilit]
- Berthoud, H.R.; Münzberg, H.; Morrison, C.D. Blaming the brain for obesity: Integration of hedonic and homeostatic mechanisms. Gastroenterology 2017, 152, 1728–1738. [Google Scholar] [CrossRef] [Scilit]
- Purnell, J.Q.; Le Roux, C.W. Metabolic and appetitive regulation of adipocyte mass during treatment of obesity. J. Intern. Med. 2026, 299, 66–78. [Google Scholar] [CrossRef] [Scilit]
- Purnell, J.Q.; Le Roux, C.W. Hypothalamic control of body fat mass by food intake: The key to understanding why obesity should be treated as a disease. Diabetes Obes. Metab. 2024, 26, 3–12. [Google Scholar] [CrossRef] [Scilit]
- Berry, L.M.; Andrade, J.; May, J. Hunger-related intrusive thoughts reflect increased accessibility of food items. Cogn. Emot. 2007, 21, 865–878. [Google Scholar] [CrossRef] [Scilit]
- Dhurandhar, E.J.; Maki, K.C.; Dhurandhar, N.V.; Kyle, T.K.; Yurkow, S.; Hawkins, M.A.W. Food noise: Definition, measurement, and future research directions. Nutr. Diabetes 2025, 15, 30. [Google Scholar] [CrossRef] [Scilit]
- Diktas, H.E.; Cardel, M.I.; Foster, G.D.; LeBlanc, M.M.; Dickinson, S.L.; Ables, E.M. Development and validation of the Food Noise Questionnaire. Obesity 2025, 33, 289–297. [Google Scholar] [CrossRef] [Scilit]
- Hayashi, D.; Edwards, C.; Emond, J.A.; Gilbert-Diamond, D.; Butt, M.; Rigby, A. What is food noise? A conceptual model of food cue reactivity. Nutrients 2023, 15, 4809. [Google Scholar] [CrossRef] [Scilit]
- Cook, G. Quieting food noise: How GLP-1s and mindfulness rewire the default mode network and reward circuits. Cureus 2026, 18, e100818. [Google Scholar] [CrossRef] [Scilit]
- Aaseth, J.; Ellefsen, S.; Alehagen, U.; Sundfør, T.M.; Alexander, J. Diets and drugs for weight loss and health in obesity—an update. Biomed. Pharmacother. 2021, 140, 111789. [Google Scholar] [CrossRef] [Scilit]
- Choi, W.; Nho, Y.H.; Qiu, L.; Chang, A.; Campos, G.; Seilheimer, R.L.; Wilent, W.B.; Bakalov, D.; Firdous, N.; Kerr, M.; et al. Brain activity associated with breakthrough food preoccupation in an individual on tirzepatide. Nat. Med. 2025, 31, 4038–4043. [Google Scholar] [CrossRef] [Scilit]
- Arabic Language and Culture. British Council. Available online: https://www.britishcouncil.org/school-resources/languages/arabic-language-culture (accessed on 5 July 2026).
- Beaton, D.E.; Bombardier, C.; Guillemin, F.; Ferraz, M.B. Guidelines for the process of cross-cultural adaptation of self-report measures. Spine 2000, 25, 3186–3191. [Google Scholar] [CrossRef] [Scilit]
- Polit, D.F.; Beck, C.T. The content validity index: Are you sure you know what’s being reported? Critique and recommendations. Res. Nurs. Health 2006, 29, 489–497. [Google Scholar] [CrossRef] [Scilit]
- Costello, A.B.; Osborne, J.W. Best practices in exploratory factor analysis: Four recommendations for getting the most from your analysis. Pract. Assess. Res. Eval. 2005, 10, 7. [Google Scholar] [CrossRef]
- Boateng, G.O.; Neilands, T.B.; Frongillo, E.A.; Melgar-Quiñonez, H.R.; Young, S.L. Best practices for developing and validating scales for health, social, and behavioral research: A primer. Front. Public Health 2018, 6, 149. [Google Scholar] [CrossRef] [Scilit]
- Cut-Off for BMI According to WHO Standards. WHO Regional Office for Europe, European Health Information Gateway. Available online: https://gateway.euro.who.int/en/indicators/mn_survey_19-cut-off-for-bmi-according-to-who-standards/ (accessed on 29 June 2026).
- Allen, M. Errors of measurement: Ceiling and floor effects. In The SAGE Encyclopedia of Communication Research Methods; Allen, M., Ed.; SAGE Publications: Thousand Oaks, CA, USA, 2017; pp. 434–435. [Google Scholar] [CrossRef] [Scilit]
- Terwee, C.B.; Bot, S.D.M.; de Boer, M.R.; van der Windt, D.A.W.M.; Knol, D.L.; Dekker, J.; Bouter, L.M.; de Vet, H.C.W. Quality criteria were proposed for measurement properties of health status questionnaires. J. Clin. Epidemiol. 2007, 60, 34–42. [Google Scholar] [CrossRef] [Scilit]
- Kaiser, H.F. An index of factorial simplicity. Psychometrika 1974, 39, 31–36. [Google Scholar] [CrossRef] [Scilit]
- Garrido, L.E.; Abad, F.J.; Ponsoda, V. A new look at Horn’s parallel analysis with ordinal variables. Psychol. Methods 2013, 18, 454–474. [Google Scholar] [CrossRef] [Scilit]
- Velicer, W.F. Determining the number of components from the matrix of partial correlations. Psychometrika 1976, 41, 321–327. [Google Scholar] [CrossRef] [Scilit]
- Woods, C.M.; Edwards, M.C. Factor analysis and related methods. In Essential Statistical Methods for Medical Statistics; Rao, C.R., Miller, J.P., Rao, D.C., Eds.; Elsevier: Amsterdam, The Netherlands, 2011; pp. 174–201. [Google Scholar] [CrossRef] [Scilit]
- Li, C.H. Confirmatory factor analysis with ordinal data: Comparing robust maximum likelihood and diagonally weighted least squares. Behav. Res. Methods 2016, 48, 936–949. [Google Scholar] [CrossRef] [Scilit]
- Rodriguez, A.; Reise, S.P.; Haviland, M.G. Evaluating bifactor models: Calculating and interpreting statistical indices. Psychol. Methods 2016, 21, 137–150. [Google Scholar] [CrossRef] [Scilit]
- Hu, L.; Bentler, P.M. Cutoff criteria for fit indexes in covariance structure analysis: Conventional criteria versus new alternatives. Struct. Equ. Model. 1999, 6, 1–55. [Google Scholar] [CrossRef] [Scilit]
- Kenny, D.A.; Kaniskan, B.; McCoach, D.B. The performance of RMSEA in models with small degrees of freedom. Sociol. Methods Res. 2015, 44, 486–507. [Google Scholar] [CrossRef] [Scilit]
- Xia, Y.; Yang, Y. RMSEA, CFI, and TLI in structural equation modeling with ordered categorical data: The story they tell depends on the estimation methods. Behav. Res. Methods 2019, 51, 409–428. [Google Scholar] [CrossRef] [Scilit]
- Fornell, C.; Larcker, D.F. Evaluating structural equation models with unobservable variables and measurement error. J. Mark. Res. 1981, 18, 39–50. [Google Scholar] [CrossRef] [Scilit]
- Dunn, T.J.; Baguley, T.; Brunsden, V. From alpha to omega: A practical solution to the pervasive problem of internal consistency estimation. Br. J. Psychol. 2014, 105, 399–412. [Google Scholar] [CrossRef] [Scilit]
- Wu, H.; Estabrook, R. Identification of confirmatory factor analysis models of different levels of invariance for ordered categorical outcomes. Psychometrika 2016, 81, 1014–1045. [Google Scholar] [CrossRef] [Scilit]
- Chen, F.F. Sensitivity of goodness of fit indexes to lack of measurement invariance. Struct. Equ. Model. 2007, 14, 464–504. [Google Scholar] [CrossRef] [Scilit]
- Mokkink, L.B.; Terwee, C.B.; Patrick, D.L.; Alonso, J.; Stratford, P.W.; Knol, D.L.; Bouter, L.M.; de Vet, H.C. The COSMIN study reached international consensus on taxonomy, terminology, and definitions of measurement properties for health-related patient-reported outcomes. J. Clin. Epidemiol. 2010, 63, 737–745. [Google Scholar] [CrossRef] [Scilit]
- Games, P.A.; Howell, J.F. Pairwise multiple comparison procedures with unequal n’s and/or variances: A Monte Carlo study. J. Educ. Stat. 1976, 1, 113–125. [Google Scholar] [CrossRef] [Scilit]
- Mocini, E.; Di Vincenzo, O.; D’Angelo, C.; Baldari, C.; Migliaccio, S.; Zagaria, A. Psychometric properties of the Italian Food Noise Questionnaire (FNQ) for the assessment of intrusive food-related thoughts. Behav. Sci. 2026, 16, 609. [Google Scholar] [CrossRef] [Scilit]
- Kyriazos, T.A. Applied psychometrics: The 3-faced construct validation method, a routine for evaluating a factor structure. Psychology 2018, 9, 2044–2072. [Google Scholar] [CrossRef]
- Byrne, B.M.; Shavelson, R.J.; Muthén, B. Testing for the equivalence of factor covariance and mean structures: The issue of partial measurement invariance. Psychol. Bull. 1989, 105, 456–466. [Google Scholar] [CrossRef]
- Nieto, C.; Espinosa, F.; Valero-Morales, I.; Boyland, E.; Kent, M.P.; Tatlow-Golden, M.; Ortiz-Panozo, E.; Barquera, S. Digital food and beverage marketing appealing to children and adolescents: An emerging challenge in Mexico. Pediatr. Obes. 2023, 18, e13036. [Google Scholar] [CrossRef] [Scilit]
- Potvin Kent, M.; Bagnato, M.; Remedios, L.; Guimarães, J.S.; Gillis, G.; Soto, C.; Hatoum, F.; Pritchard, M. Child and adolescent exposure to unhealthy food marketing across digital platforms in Canada. BMC Public Health 2024, 24, 1740. [Google Scholar] [CrossRef] [Scilit]
- Jenkin, G.; Madhvani, N.; Signal, L.; Bowers, S. A systematic review of persuasive marketing techniques to promote food to children on television. Obes. Rev. 2014, 15, 281–293. [Google Scholar] [CrossRef] [Scilit]
- Sadeghirad, B.; Duhaney, T.; Motaghipisheh, S.; Campbell, N.R.C.; Johnston, B.C. Influence of unhealthy food and beverage marketing on children’s dietary intake and preference: A systematic review and meta-analysis of randomized trials. Obes. Rev. 2016, 17, 945–959. [Google Scholar] [CrossRef] [Scilit]
- Norman, J.; Kelly, B.; Boyland, E.; McMahon, A.T. The impact of marketing and advertising on food behaviours: Evaluating the evidence for a causal relationship. Curr. Nutr. Rep. 2016, 5, 139–149. [Google Scholar] [CrossRef] [Scilit]
- Vergeer, L.; Gillis, G.; Rynard, V.L.; Vanderlee, L.; White, C.M.; Nieto, C.; Hammond, D.; Kent, M.P. The association between exposure to food marketing and dietary intake among youth in six countries. Int. J. Behav. Nutr. Phys. Act. 2025, 22, 130. [Google Scholar] [CrossRef] [Scilit]
- Martins, C.; Morgan, L.; Truby, H. A review of the effects of exercise on appetite regulation: An obesity perspective. Int. J. Obes. 2008, 32, 1337–1347. [Google Scholar] [CrossRef] [Scilit]
- Lowe, M.R.; Butryn, M.L.; Didie, E.R.; Annunziato, R.A.; Thomas, J.G.; Crerand, C.E.; Ochner, C.N.; Coletta, M.C.; Bellace, D.; Wallaert, M.; et al. The Power of Food Scale: A new measure of the psychological influence of the food environment. Appetite 2009, 53, 114–118. [Google Scholar] [CrossRef] [Scilit]
- Alhazmi, A.; Le Roux, C.W. The voice of a disease: Why food noise can no longer be ignored. Obesity 2026, 34, 11–13. [Google Scholar] [CrossRef] [Scilit]
- Chong, M.C.; Ko, T.Y.L.; Le Roux, P.L.; Le Roux, C.W. Changes in eating behaviour during treatment with obesity medications. Clin. Obes. 2026, 16, e70065. [Google Scholar] [CrossRef] [Scilit]
- Green, S.B.; Yang, Y. Reliability of summed item scores using structural equation modeling: An alternative to coefficient alpha. Psychometrika 2009, 74, 155–167. [Google Scholar] [CrossRef] [Scilit]
- World Medical Association. World Medical Association Declaration of Helsinki: Ethical principles for medical research involving human subjects. JAMA 2013, 310, 2191–2194. [Google Scholar] [CrossRef] [Scilit]

Disclaimer/Publisher’s Note: The statements, opinions and data contained in all publications are solely those of the individual author(s) and contributor(s) and not of MDPI and/or the editor(s). MDPI and/or the editor(s) disclaim responsibility for any injury to people or property resulting from any ideas, methods, instructions or products referred to in the content. |
© 2026 by the authors. Licensee MDPI, Basel, Switzerland. This article is an open access article distributed under the terms and conditions of the Creative Commons Attribution (CC BY) license.