


Highlights
What are the main findings?
- A novel dual-branch collaborative Transformer network (PST-Net) is proposed, which effectively addresses the challenge of difficult collaborative modeling between global dependencies and local details in hyperspectral image classification through the collaboration between an adaptive spectral–spatial Token module and a parallel attentionenhanced CNN branch.
- PST Net achieved excellent classification performance on four challenging datasets (Salinas, Whuhh, Qingyun, Houston) with only 2% labeled samples, outperforming multiple comparison methods.
What is the implication of the main finding?
- This method demonstrates strong robustness and generalization ability even with minimal training samples, providing an effective solution for hyperspectral image classification tasks where labeled data is scarce in practical applications.
- The proposed adaptive Token construction and cross-level interaction fusion mechanism provides a general and efficient framework for designing hybrid models that synergistically leverage the advantages of Transformer and CNN.
Abstract
Hyperspectral image classification holds significant applications across multiple domains due to its rich spectral and spatial information. However, it faces challenges such as spectral variation within the same object, spectral variation across different objects, and noise interference. Existing methods like convolutional neural networks perform well in local feature extraction but inadequately model long-range dependencies. While Transformers can capture global relationships, they struggle to effectively coordinate spectral and spatial information modeling. To address these limitations, this paper proposes a dual-branch collaborative Transformer network (PST-Net). This architecture integrates an adaptive spectral–spatial token (ASST) module, a Parallel Attention-Augmented lightweight CNN branch (PA-SSCNN), and a collaborative fusion layer. The ASST constructs joint representation tokens through local spectral smoothing and learnable spatial embedding. PA-SSCNN employs 3D-2D cascaded convolutions and channel–spatial attention mechanisms to enhance local texture and spatial feature extraction; CHIB enables deep interaction and synergistic fusion of dual-branch features across different levels and scales. Experimental results demonstrate that with only 2% labeled samples, PST-Net achieves overall classification accuracies of 96.31%, 96.59%, 95.27%, and 89.06% on the Salinas and Whuhh, and the two complex urban scene datasets Qingyun and Houston. Especially in fine-grained categories and complex scenes, it exhibits strong robustness. The ablation experiment further validated the effectiveness and complementarity of each module. This study provides an efficient collaborative modeling framework for hyperspectral image classification that balances global dependencies and local details.
1. Introduction
Hyperspectral imaging technology [1] is based on narrow-band imaging data techniques, enabling the collection of continuous, detailed spectral reflectance information at each pixel location. Consequently, hyperspectral images are rich in spectral and spatial information, finding extensive applications in land fine-grained classification [2,3], geological exploration [4,5], environmental monitoring [6], and military reconnaissance [7,8]. However, hyperspectral image classification faces numerous challenges. Hyperspectral images typically contain hundreds of spectral bands, presenting issues of high spectral dimension, spectral spatial aliasing, and band redundancy [9]. For instance, spectral reflectance may vary within the same object category, while objects of different categories may exhibit similar spectral signatures. This phenomenon, commonly referred to as “same object, different spectrum” and “same spectrum, different object,” poses significant challenges for hyperspectral image classification. Second, hyperspectral images often suffer from noise and illumination variations, and complex spatial structures further complicate classification.
To address these issues, researchers have successively proposed numerous methods. Early approaches relied on machine learning techniques such as Random Forest [10], K-Nearest Neighbors [11], and Support Vector Machines [12]. These methods classify objects based on statistical features of spectral reflectance, achieving robust performance under small sample sizes and limited scenarios. However, they perform poorly in complex scenarios and large datasets, and traditional machine learning methods neglect spatial structural information, making it difficult to effectively model spectral–spatial information. With the advancement of deep learning, Convolutional Neural Networks (CNNs) and their variants [13] have gradually become mainstream methods for hyperspectral image classification. Typical approaches include 1DCNN and 2DCNN [14,15] for extracting spatial information, and 3DCNN [16] for simultaneously capturing spectral–spatial information. Although CNNs possess the ability to extract local features through convolution operations, they still perform poorly in modeling long-range spectral features and in complex scenes. The Transformer architecture, based on self-attention mechanisms, has been introduced into hyperspectral image classification [17,18], effectively alleviating the shortcomings of CNNs in long-range modeling and enabling models to learn global features more comprehensively. To more effectively model non-Euclidean spatial structures between pixels, graph neural networks have been widely applied in hyperspectral classification, such as GCN [19], GAT [20], and SSGNN [21]. These methods excel in classification under spatially irregular distributions and small-sample scenarios by constructing graph structures and graph data. In recent years, the emerging Mamba network [22], based on state-space models, has gained attention for its ability to process long sequences with linear complexity while exhibiting stronger long-term dependency modeling capabilities. Consequently, it has been increasingly explored for hyperspectral spectral sequence modeling or spatial sequence modeling.
This study proposes a dual-branch collaborative Transformer network (PST-Net) for hyperspectral image classification, based on the Transformer architecture. It addresses the issues of spectral–spatial loss and the difficulty in jointly modeling short- and long-range features caused by overly coarse tokenization scales in existing Transformer-based hyperspectral image classification methods. First, we construct an adaptive spectral–spatial token module that generates token sequences with strong representational capabilities from both spectral and spatial perspectives. This token simultaneously encodes local spectral responses and global spatial context, providing the subsequent Transformer with information-rich input representations. Second, to address the challenge of modeling short-range and long-range features synergistically, we design a dual-branch collaborative network. One branch employs 3D-2D cascaded convolutions while introducing a parallel channel–spatial attention mechanism to enhance texture and spatial feature extraction. Finally, we design a multi-scale and multi-feature residual fusion module. By integrating features from both branches, it promotes the consolidation of spectral–spatial features, significantly improving classification accuracy.
The contributions of this study are primarily threefold:
- 1.
- We propose a dual-branch collaborative Transformer network (PST-Net) for hyperspectral image classification. By parallel modeling with Transformer and CNN, it achieves effective collaboration between spectral and spatial features, demonstrating excellent classification performance on two agricultural scene datasets and two complex urban scene datasets;
- 2.
- An adaptive spectral–spatial token construction mechanism is designed, enabling the Transformer’s input tokens to simultaneously encode local spectral information and spatial structural features. This mitigates the spectral–spatial information loss inherent in traditional Transformer approaches;
- 3.
- This paper introduces a CNN branch based on 3D-2D cascaded convolutions and parallel channel–spatial attention to enhance local spectral–spatial feature extraction. We further propose the Cross-Hierarchical Interaction Blending (CHIB) module, which achieves deep fusion of dual-branch features through global–local bidirectional guidance, nonlinear multi-scale mapping, and residual alignment mechanisms.
The remainder of this paper is structured as follows. Section 2 briefly reviews prior work on HSI classification and Transformers. Section 3 details our proposed algorithmic framework. Section 4 introduces the four datasets and experimental settings employed. Section 5 presents experimental results. Section 6 discusses ablation studies, parameter experiments, and the impact of training samples and patch size on classification performance, etc. Section 7 concludes with a summary.
2. Related Work
Transformer models have garnered significant attention in hyperspectral image classification due to their robust global dependency modeling capabilities and self-attention mechanism. Compared to traditional CNNs, Transformers effectively capture long-range spatio-spectral dependencies, overcoming the inherent limitations of CNNs’ finite receptive fields. This makes Transformers a key technological pathway for enhancing HSI classification accuracy.
Early studies primarily introduced Transformers as standalone feature extractors for HSI classification tasks. For instance, Yang et al. [23] proposed the Multi-level Spectral–Spatial Transformer Network (MSTNet), which utilizes a Transformer encoder to learn more discriminative feature representations. Roy et al. [24] further designed the spectral–spatial morphological attention Transformer (morphFormer), combining morphological convolution with attention mechanisms to enhance the interactive modeling of spectral and spatial structures. Zhao et al. [25] proposed the Multi-Attention Transformer (MAT), utilizing self-attention modules to model long-range contextual dependencies while enhancing local feature correlations through Outlook-attention. Yang et al. [26] proposed a Center Focused Transformer (CFT) framework that emphasizes the importance of central pixels through Gaussian position embedding and cross layer aggregation strategies, and designed a spectral spatial fusion mechanism and a multi granularity feature enhancement module to enhance spectral spatial interaction capabilities. Qiao et al. [27] designed a Multi-Scale Neighborhood Attention Transformer (MSNAT), which extracts multi-scale spatial information through different local window sizes and combines spatial transformation modules to generate optimized spatial patterns, effectively compensating for the shortcomings of traditional Transformers in modeling multi-scale local details. In addition, Qiao proposed a dual frequency Transformer network from a frequency domain perspective [28], which captures high-frequency details through multi head neighborhood attention and low-frequency global information through global filters, achieving efficient fusion of frequency domain features.
To overcome Transformers’ limitations in local feature extraction, numerous studies have shifted toward hybrid CNN–Transformer architectures to achieve collaborative modeling of local details and global context. Yu et al. [29] combined CNNs and Transformers to jointly extract spatio-spectral features for classification. Ouyang et al. [30] introduced a hybrid Transformer integrating multi-granularity semantic labels with spatiospectral attention, enhancing classification performance through a multi-granularity label generator and attention fusion mechanism. Xu et al. [31] designed the Dual-Branch Convolutional–Transformer Network (DBCTNet), achieving efficient fusion of spatial and local–global spectral features via 3D convolutions and an improved Transformer encoder module. Similarly, Zhou et al. [32] introduced the Dual-Branch Convolutional Transformer Network (DCTN), where an efficient interactive self-attention module achieves deep integration across spatial and spectral dimensions. In other remote sensing fields with a hybrid CNN Transformer architecture, Qiao et al. [33] proposed a hybrid CNN Transformer network (CTN) for GNSS-R sea surface wind speed inversion, which significantly improves wind speed estimation accuracy by combining CNN’s local feature extraction with Transformer’s global modeling capability. Sun et al. [34] designed a geometric guided dense registration framework GDROS, which uses a CNN Transformer hybrid feature extraction module to construct multi-scale correlated volumes and achieve robust registration under large geometric transformations.
Regarding attention mechanism optimization, researchers have proposed various enhancements to improve the discriminative power and efficiency of feature representations. Roy et al. [35] introduced the Multi-modal Fusion Transformer (MFT), incorporating multi-head cross-patch attention (mCrossPA) to leverage multi-source information for improved generalization. Yuan et al. [36] designed the Parallel Spectral–Spatial Transformer (S2Former), extracting discriminative features from spatial and spectral dimensions via spatial self-attention and covariance spectral attention, respectively. Liu et al. [37] introduced the Multi-Scale Spatial Transformer with Transposed Convolution (MSSTT), combining multi-scale convolutions with a cosine attention mechanism to enhance semantic feature extraction. Zhao et al. [38] proposed the Group Separable Convolution Visual Transformer (GSC-ViT), employing group separable convolutions and self-attention modules to reduce parameter complexity while preserving feature extraction capabilities. In addition, Liu et al. innovatively proposed attention mechanisms for hyperspectral image classification, such as Central Attention Network (CAN) [39], Multi-Region Object Attention (MATA) [40], and Semantic Segmentation Model SegHSI [40], which enhance the discriminative power of spectral spatial features from different perspectives.
Addressing the practical challenge of sparse labeled data, Transformers also demonstrate potential in cross-domain and few-shot learning scenarios. Zhang et al. [41] proposed the Graph Information Aggregation Cross-Domain Few-Shot Learning (Gia-CFSL) framework, integrating graph neural networks with domain alignment strategies. Li et al. [42] designed the Spectral Coordinate Transformer (SCFormer), enhancing cross-domain generalization through spectral coordinate embedding and masked pre-training strategies. Xi et al. [43] proposed the CNN–Transformer-assisted Contrastive Learning Framework (CTF-SSCL), integrating local and global features while leveraging contrastive learning to boost few-shot classification performance.
Furthermore, Transformers have been applied to other HSI processing tasks. For instance, Li et al. [44] introduced the Spectral-Enhanced Rectangular Transformer (SERT) for HSI denoising, which leverages rectangular self-attention and spectral enhancement modules to extract non-local similarities and global low-rank features. Ibañez et al. [45] proposed the Masked Autoencoder Spectral–Spatial Transformer (MAEST), enhancing robustness against noise through the synergy of reconstruction and classification paths.
Overall, current Transformer research in HSI classification exhibits the following trends: evolution from pure Transformer architectures toward CNN–Transformer hybrid models; continuous refinement and diversification of attention mechanisms; increasing focus on lightweight approaches, cross-domain adaptation, and few-shot learning; and gradual expansion of Transformers into related tasks such as HSI denoising and feature reconstruction.
3. Research Methodology
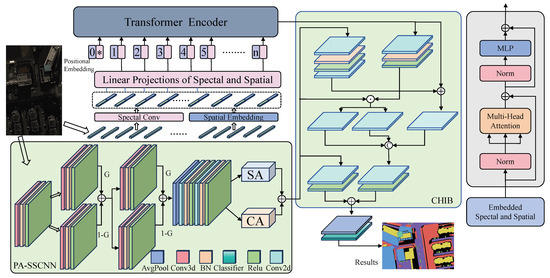
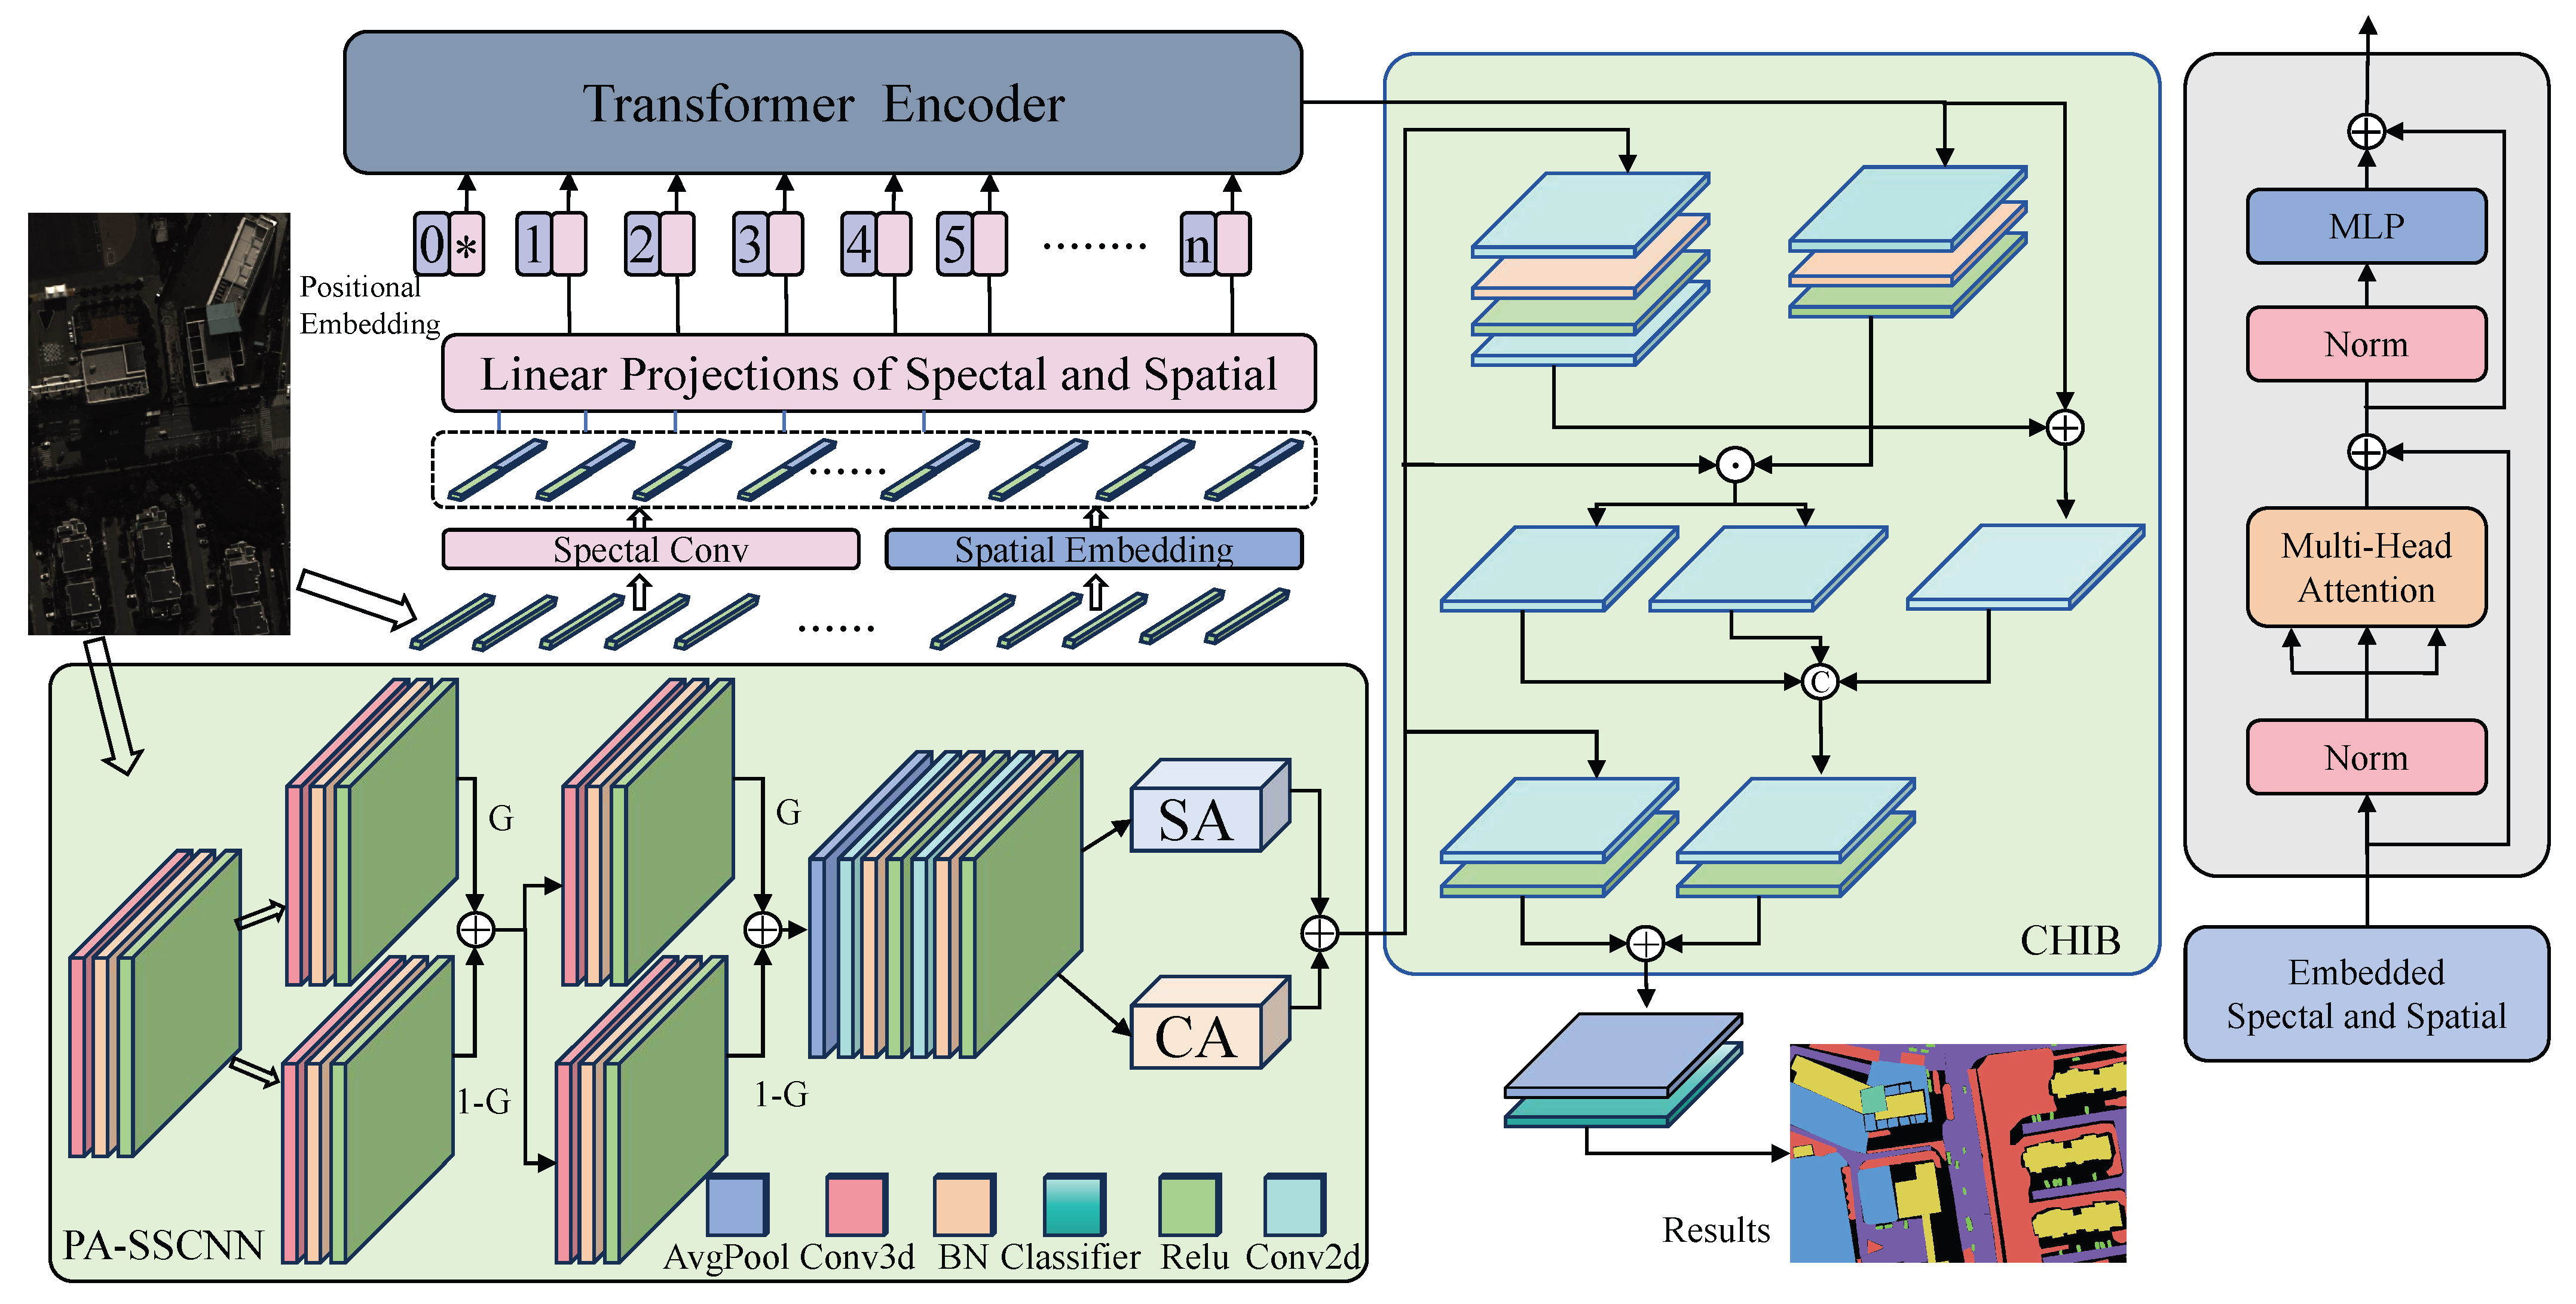
This study proposes a dual-branch spectral–spatial collaborative network (PST-Net) for hyperspectral image classification, with its overall architecture shown in Figure 1. The model comprises three components: The adaptive spectral–spatial token Transformer (ASST) utilizes learnable spatial coordinate embeddings and adaptive spectral neighborhood modeling to transform the 3D hyperspectral cube into a set of joint spectral–spatial feature tokens. It employs a Transformer to capture long-range dependencies and global discriminative information. Parallel Attention-enhanced Spectral–Spatial CNN (PA-SSCNN) employs 3D-2D cascaded convolutions to extract local textures and spatial structures, while introducing parallel channel/spatial attention mechanisms to enhance responses in key regions; Finally, the Cross-Hierarchical Interaction Blending (CHIB) module performs multi-scale, multi-path residual fusion between global Transformer representations and local CNN features from both branches, yielding more discriminative joint feature representations for final classification predictions. This design fully leverages Transformers’ strengths in modeling long-range dependencies and CNNs’ local spatial sensitivity, achieving efficient collaborative mining of hyperspectral spectral–spatial information.
Figure 1.
PST Network Diagram (* Represents Extra Learnable [Class] Embedding).
3.1. Adaptive Spectral–Spatial Token Transformer (ASST)
3.1.1. Adaptive Spectral–Spatial Token Construction
Most existing Transformer methods use fixed position encoding, such as sine encoding or simple pixel flattening, as token inputs, which fail to fully exploit the continuity and spatial structure of spectra. The ASST module proposed in this article utilizes learnable spectral convolution and spatial MLP. Although the spectral convolution weights are initialized to uniform values, they are updated during the training process through backpropagation to adaptively learn the importance of different band neighborhoods. At the same time, the spatial coordinate MLP also generates position embeddings through data-driven methods. This design allows the generated tokens to be dynamically adjusted based on the spectral–spatial statistical characteristics of the dataset; hence, it is called an adaptive spectral spatial token.
Input hyperspectral tiles are mapped into tokens, where each token simultaneously incorporates local spectral statistics (obtained via local 1D mean convolutions) and learnable spatial embeddings (pos-MLP). These components are concatenated and linearly projected to yield Transformer-compatible token vectors.
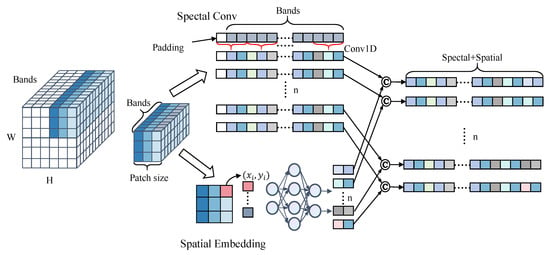
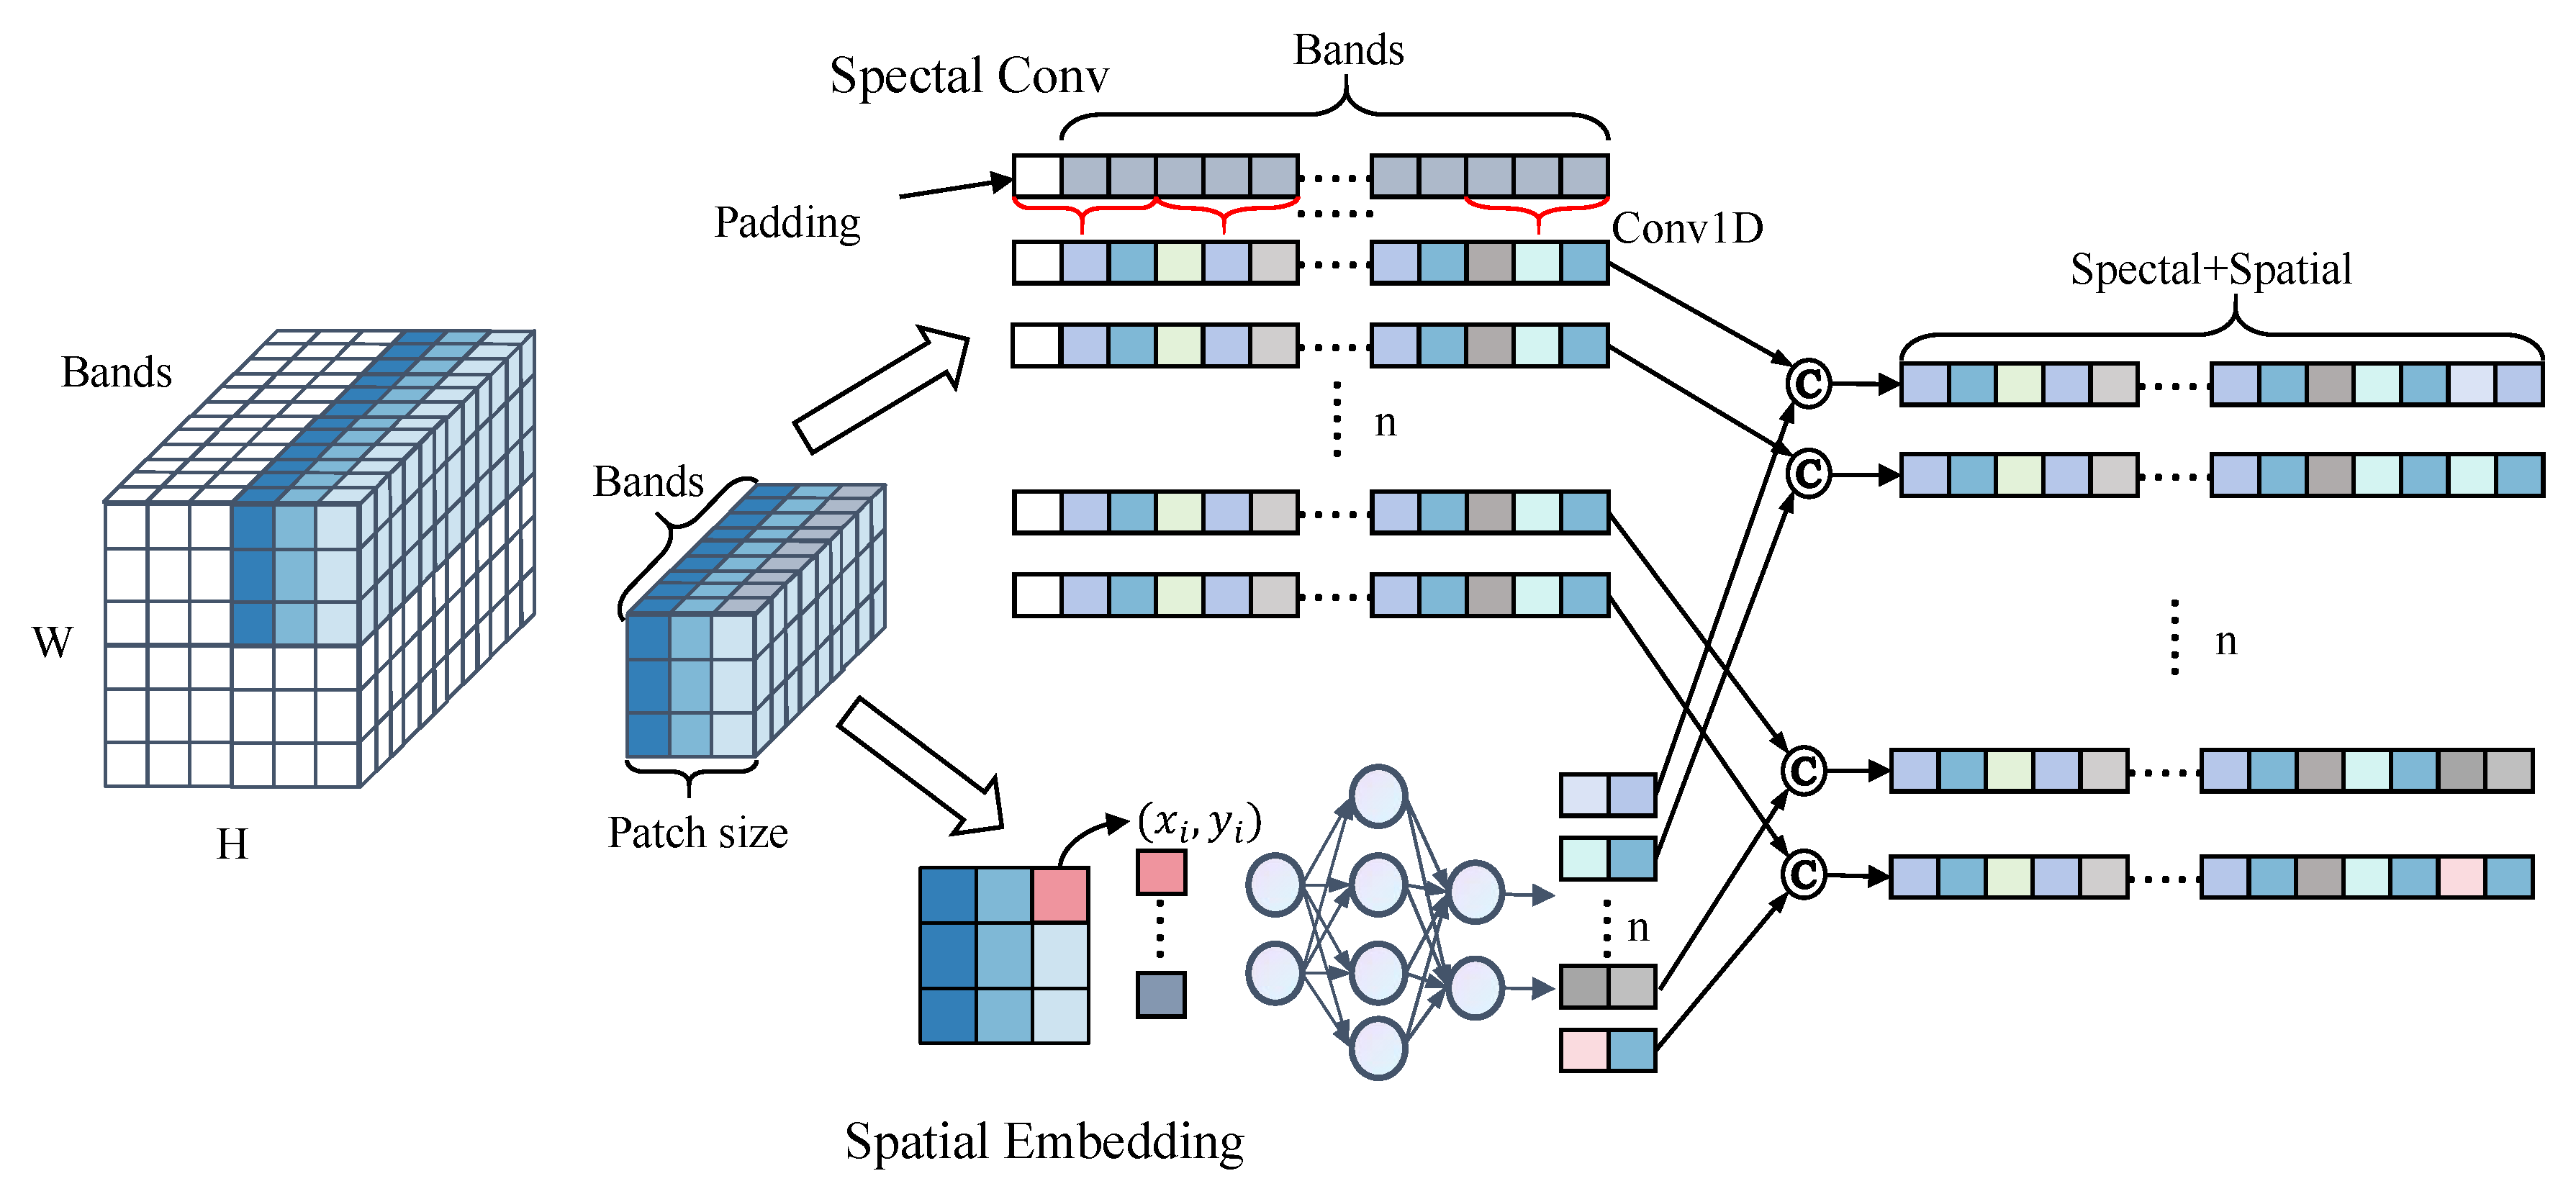
As shown in Figure 2, local average convolution is applied along the spectral dimension—effectively performing local low-pass smoothing—to aggregate neighboring spectral band information and suppress noise. Hyperspectral data , where C is the number of spectral channels and B is the batch size. Each spatial pixel is flattened into a token position set, yielding tokens denoted as . The raw spectral vector for the i-th token is .
Figure 2.
Adaptive Spectral–Spatial Token.
Reshape the spectral vector to . The selection of kernel width K is crucial for performing local average convolution (Conv1D) in the spectral dimension. If K is too large, the spectral average convolution will be overly smooth and lose high-frequency details. If K is too small, it is difficult to effectively suppress noise. Considering the strong local correlation between adjacent bands in hyperspectral images, and the fact that noise often manifests as abrupt changes in isolated bands, the 1D convolution kernel g adopts a local average convolution with a kernel width of to smooth out noise while preserving the local structural information of the spectrum. Apply equal-weight initialization with constant and to align output length with input. The convolved feature is:
Construct spatial coordinates and learn spatial embedding using pos-MLP. Given an spatial patch, we first construct normalized 2D coordinates for each pixel:
where and Thus, the 2D coordinate vector for each pixel is:
To extract spatial geometric relationships, we feed the coordinate vectors into a lightweight two-layer MLP:
where denotes the GELU activation function, , and d represents the expression ability of spatial embedding dimension control position encoding. A smaller d may not be sufficient to fully model spatial geometric relationships, while a larger d can improve representation ability but increase the number of parameters and overfitting risk, can achieve the best balance between classification accuracy and model complexity. The final adaptive spectral spatial token is:
3.1.2. Transformer Feature Extraction Module
In this study, deep representations of feature sequences are achieved through a stacked Transformer encoder. The input sequence is denoted as , where B is the batch size, N is the number of tokens, and D represents the feature dimension per token. Each layer in the encoder follows the basic structure of ‘LayerNorm—functional module—residual connection’ to ensure stable gradient propagation and enhance the trainability of the network. First, the input sequence undergoes normalization along the feature dimension to yield , which is then fed into a multi-head self-attention module. This module transforms X simultaneously into three sets of representations Q, K, and through a set of linear mappings, where H denotes the number of attention heads and f represents the channel dimension of a single head. Subsequently, the three sets are decomposed along the head dimension into . Scalar attention is computed independently for each attention head:
The attention matrix is multiplied by the corresponding value feature to obtain the output for each head. These outputs are concatenated along the head dimension to form , then projected back to the original feature dimension D via a linear transformation. The final output of the self-attention module is element-wise added to the input X, forming the first residual path:
Subsequently, undergoes layer-wise normalization and is fed into a Feed-Forward Network. The FFN consists of two linear layers. The input is first mapped to a higher-dimensional intermediate space . After passing through a GELU activation, it is projected back to the original dimension D, yielding . This output undergoes a second residual sum with to form the final output of the current Transformer layer:
By stacking multiple layers of this identical structure, sequence features can fully capture long-range dependencies across tokens while maintaining a constant feature dimension D. This enables the model to construct multi-scale, global, and fine-grained semantic representations within high-dimensional space. All outputs maintain the same three-dimensional tensor structure (B, N, D) as the input, facilitating seamless connection with classification tokens.
3.2. Parallel Attention-Enhanced Spectral–Spatial CNN (PA-SSCNN)
To enhance the method’s versatility and scalability, we design PA-SSCNN as an independently reusable spectral–spatial local modeling module. This module is independent of specific backbone architectures, serving either as the parallel branch in a Transformer–CNN dual-branch framework or flexibly embedded into pure CNN hybrid networks or multi-stage feature pyramid structures to enhance local discriminative features in hyperspectral images.
3.2.1. Spectral–Spatial Decoupled Convolutional Encoding Module
This architecture physically decouples spectral and spatial information modeling. Specifically, the input hyperspectral cube undergoes channel alignment and linear embedding via a convolution:
where . Subsequently, an explicitly decoupled dual-branch architecture is introduced, comprising spectral encoding, spatial encoding, and global gated weights:
where . The spectral encoding branch models local correlations between adjacent bands, the spatial encoding branch learns spatial neighborhood relationships within each band, and the global gated weights achieve adaptive balancing of spectral and spatial information. The final fusion form is:
where . This residual-gated fusion structure ensures stable feature representation while allowing the module to adaptively adjust spectral and spatial modeling strengths based on different remote sensing data.
3.2.2. Spectral Compression and 2D Channel–Spatial Attention Re-Calibration Module
After joint modeling, PA-SSCNN performs adaptive average pooling along the spectral dimension, followed by spatial modeling via a 2D convolutional subnetwork:
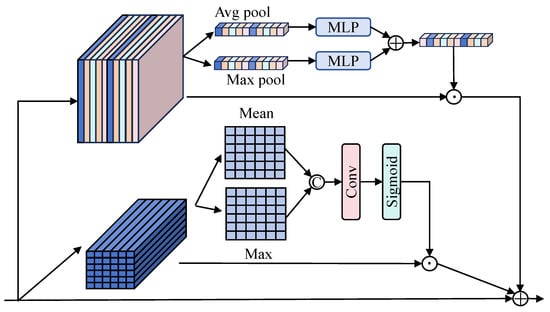
where . To enhance feature expressiveness, we introduce a Parallel Channel–Spatial Attention module after the 2D CNN backend, as illustrated in Figure 3.
Figure 3.
Parallel CA + SA Attention Enhancement Module.
The parallel attention enhancement module consists of spatial attention, channel attention, and residual modules. For channel–spatial attention:
where , the average pooling and max pooling in the channel attention branch share an MLP layer, and denote weight parameters, is the activation function. The final output is obtained by combining the two attentions through a residual connection, followed by an average pooling layer and a fully connected layer:
where . PA-SSCNN achieves lightweight, efficient, and expressive spectral–spatial representation through 3D–2D joint modeling, spectral compression, spatial detail enhancement, and parallel attention mechanisms.
3.3. Cross-Hierarchical Interaction Blending Module (CHIB)
The dual-branch architecture of Transformers and CNNs focuses on global modeling and local perception, respectively. However, significant differences exist in their modeling mechanisms and feature distributions. Simply concatenating or weighting the outputs at the branch ends fails to fully leverage their complementary strengths. Therefore, this paper proposes a Cross-Hierarchical Interaction Blending (CHIB) module that establishes bidirectional information exchange and residual alignment mechanisms between the global semantic features of the Transformer and the local structural features of the CNN, as detailed below:
3.3.1. Global-to-Local Guidance (GLG) and Local-to-Global Constraint (LGC)
The Transformer branch feature Tout possesses rich contextual information but exhibits limited capability for extracting local features. To integrate global information into the CNN branch, the CHIB module first employs a Global-to-Local Guidance mechanism. This involves applying a convolution to perform channel compression and linear mapping on the branch feature, generating spatially-aware gated weights to modulate CNN features element-wise:
where . Through this global-to-local guidance process, the CNN branch maintains high sensitivity to local structures while more effectively suppressing background regions and redundant texture responses. Similarly, to feed back the fine-grained spatial structural information from the CNN branch to the Transformer branch, local structural patterns are first extracted via convolutions. These patterns are then aligned through convolutions, and the resulting local structural constraints are injected into Transformer features as residuals:
where This design introduces explicit spatial structural priors without compromising the Transformer’s global modeling capability, enhancing feature boundary consistency and local discriminative power.
3.3.2. Hierarchical Fusion and Residual Alignment
CHIB designs a bridging path to smooth and align local features before fusion. It applies a convolution to the CNN branch features modulated by LGC, then concatenates the three feature streams in the channel dimension. The joint features are obtained through a fusion mapping:
To further mitigate potential channel mismatches and gradient instability during cross-branch fusion, CHIB introduces a residual alignment mapping at the output stage:
where . The final fused features undergo global average pooling and pass through a fully connected classifier for ground object category prediction.
4. Experimental Data and Environment
4.1. Experimental Data Description
Whuhh Dataset: Acquired by the RSIDEA research group at Wuhan University using the Headwall Nano Hyperspec airborne hyperspectral imaging instrument (Made by Headwall Photonics in the Bolton, MA, USA), the dataset is located in the agricultural area of Honghu City, Hubei Province, China. This dataset features a spatial resolution of 0.043 m, image dimensions of 940 × 475 pixels, and encompasses 270 effective spectral bands (400–1000 nm). Data acquisition conditions: ambient temperature 8 °C, humidity 55%. The dataset primarily covers 12 crop types, including various cultivars of Chinese cabbage, cabbage, mustard, and turnip, with detailed classification of different cultivars within the same crop.
Salina Dataset: Acquired by the AVIRIS airborne visible-near infrared imaging spectrometer (Made by NASA in the Washington, DC, USA) over California’s Salina Valley. This dataset features a spatial resolution of 3.7 m with image dimensions of 512 × 217 pixels. After removing 20 water-absorbing bands, it comprises 204 spectral bands. The dataset covers 16 land cover categories, including Broccoli green weeds and Fallow rough plow.
Qingyun Dataset: Obtained by the DJI M600 Pro drone (Made by DJI Innovation Technology Co., Ltd. in Shenzhen, China) equipped with Gaiasky mini2-VN hyperspectral sensor (Made by Jiangsu Shuangli Hepu Technology Co., Ltd. in Wuxi, China), the collection area is located in Qingyun Road Primary School and its surrounding residential areas in Qingdao, China. The spatial resolution of the image is about 0.15 m, with a size of 880 × 1360 pixels, covering a total of 270 spectral bands from 400 to 1000 nm. In this experiment, 176 bands were actually used. This dataset contains six typical urban features, including trees, concrete buildings, cars, etc. Due to the shadows caused by buildings in the area, some ground objects are obstructed, resulting in significant spectral disturbances. This can be used to evaluate the robustness of classification methods under shadow interference.
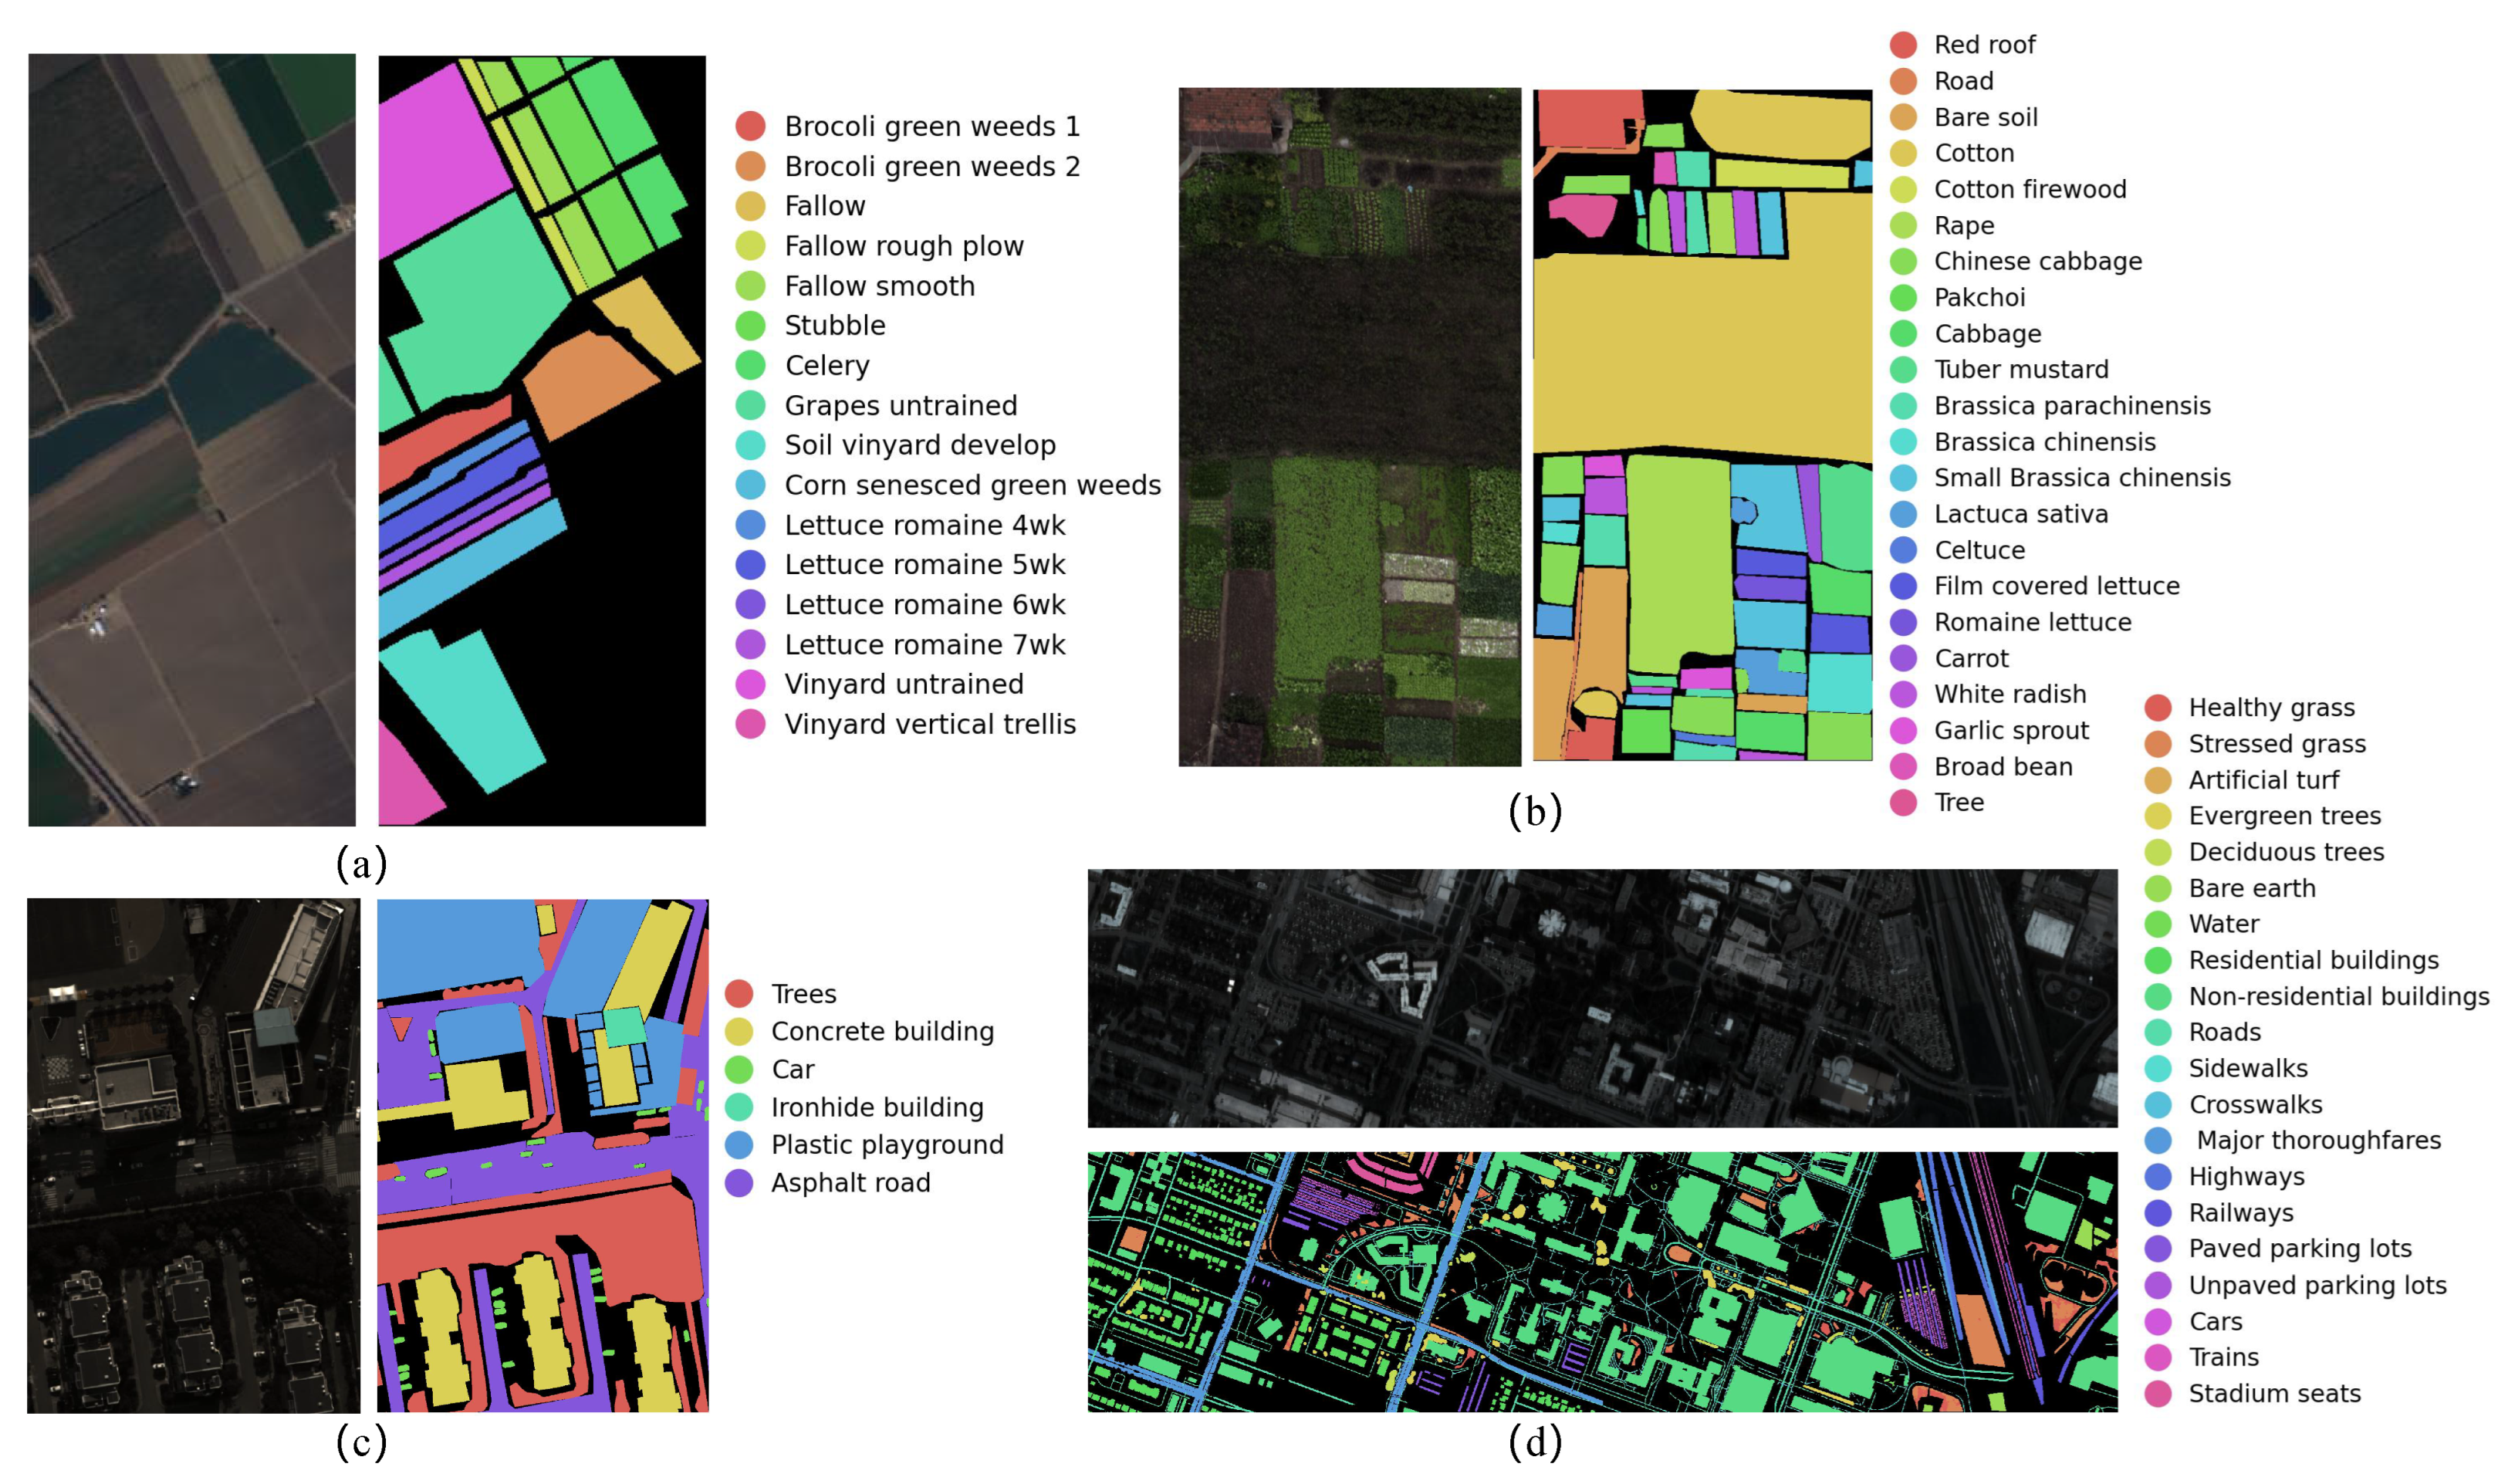
Houston 2018 Dataset: Jointly acquired by the University of Houston Hyperspectral Image Analysis Team and the National Center for Airborne Laser Mapping (NCALM), funded by the National Science Foundation (NSF). The coverage includes the University of Houston campus and its surrounding areas. The dataset features a spatial resolution of 601 × 2384 pixels, with 504,856 pixels precisely annotated for training and testing hyperspectral image classification tasks. The imaging spectral range spans 0.38–1.05 μm across 50 contiguous spectral bands, enabling comprehensive characterization of spectral differences among land cover types. It includes 20 land cover categories, such as Healthy grass, Stressed grass, and Artificial turf. The pseudocolor images and labels used for classification are shown in Figure 4, while the specific training and testing samples are listed in Table 1.
Figure 4.
Pseudocolor Images and Labels of Datasets Used for Classification. (a) Sa; (b) Whuhh; (c) Qingyun; (d) Houston 2018.
Table 1.
Datasets Used for Classification Training and Testing.
4.2. Experimental Environment
The experiment of this study was conducted based on the Pytorch deep learning architecture, and the hardware environment for the experiment was GPU; NVID: IA GeForce RTX 5070, CPU: Intel(R) Core(TM) i5-12600KF, Operating System: Windows 11; The software environment for the experiment is: Python 3.9, Pytorch 2.8, CUDA 12.8. All experiments used a uniform hyperparameter setting with Batch Size of 128, Epoch of 300, and a learning rate of 0.0005 (Adam). To ensure fair comparison, all baseline methods used the same training sample ratio as the PST Net proposed in this paper. Specifically, for each dataset, we randomly select 2% of labeled pixels as the labeled sample set and divide it into a training set and a validation set in a 1:1 ratio (i.e., 1% of the total labeled pixels), with the remaining 98% of labeled pixels as the test set. All methods use the same random seed (seed = 42) for sample partitioning to ensure that the training sample set is completely consistent. When extracting image blocks, each labeled pixel is considered as the center of the block, and the patch size is set to 8, with a size of 8 × 8. Although the block size is even, we still use the fixed position of the pixel within the block (offset by 4 pixels from the top left) as the label basis, and train and test using the same extraction strategy.
To validate the performance of our proposed algorithm, we conducted comparative analysis against six benchmark methods: ABLSTM [46], CNN3D [47], M3DDCNN [48], RSSAN [49], Speformer [50], SSFTT [51], S3ANet [52] and MSFICNet [53]. These approaches represent diverse research directions, including recurrent neural networks, 3D convolutional networks, multi-scale deep networks, residual attention networks, Transformers, and robust adversarial models, offering strong representativeness and coverage. Among these, ABLSTM proposes a bidirectional long short-term memory network architecture combined with a spatial–spectral attention mechanism to simultaneously model forward and backward spectral correlations; CNN3D achieves joint spectral–spatial information mining through 3D convolutions, being an early pioneer in applying 3D deep convolutions to HSI classification; M3DDCNN introduces a multi-scale 3D convolutional architecture to extract multi-scale spatial features and 1D spectral features end-to-end; RSSAN embeds spectral and spatial attention into a residual structure to effectively suppress irrelevant bands while highlighting crucial spatial neighborhood information; SpeFormer reinterprets hyperspectral data from a sequence modeling perspective, utilizing spectral sequence Transformers to capture local and global spectral dependencies while reducing feature loss through cross-layer memory connections; SSFTT constructs a spectral–spatial feature extraction and modeling framework, employing 3D and 2D convolutions, Gaussian-weighted feature tokenizers, and transformer encoding modules for high-level representation learning. S3ANet designs a spatial–spectral self-attention mechanism and a pyramidal spatial attention module, demonstrating higher robustness against adversarial perturbations. MSFICNet proposed a dual branch Transformer network that combines sparsity and high–low frequency interaction. Through multi-scale local global feature extraction and spectral response difference modeling, it improves the ability to maintain inter class heterogeneity and boundary details in hyperspectral image classification while reducing computational costs.
5. Experimental Results
5.1. Visual Classification Results
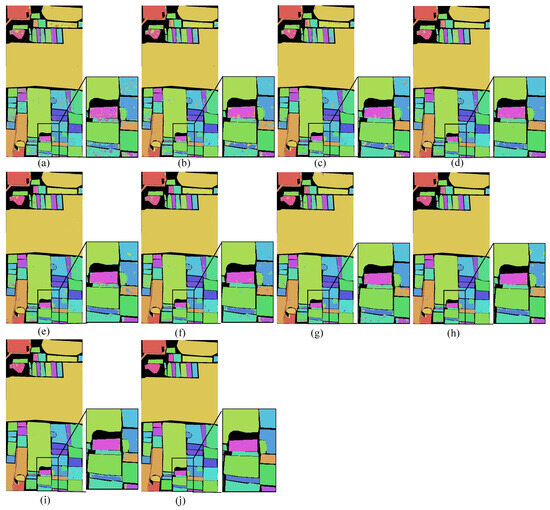
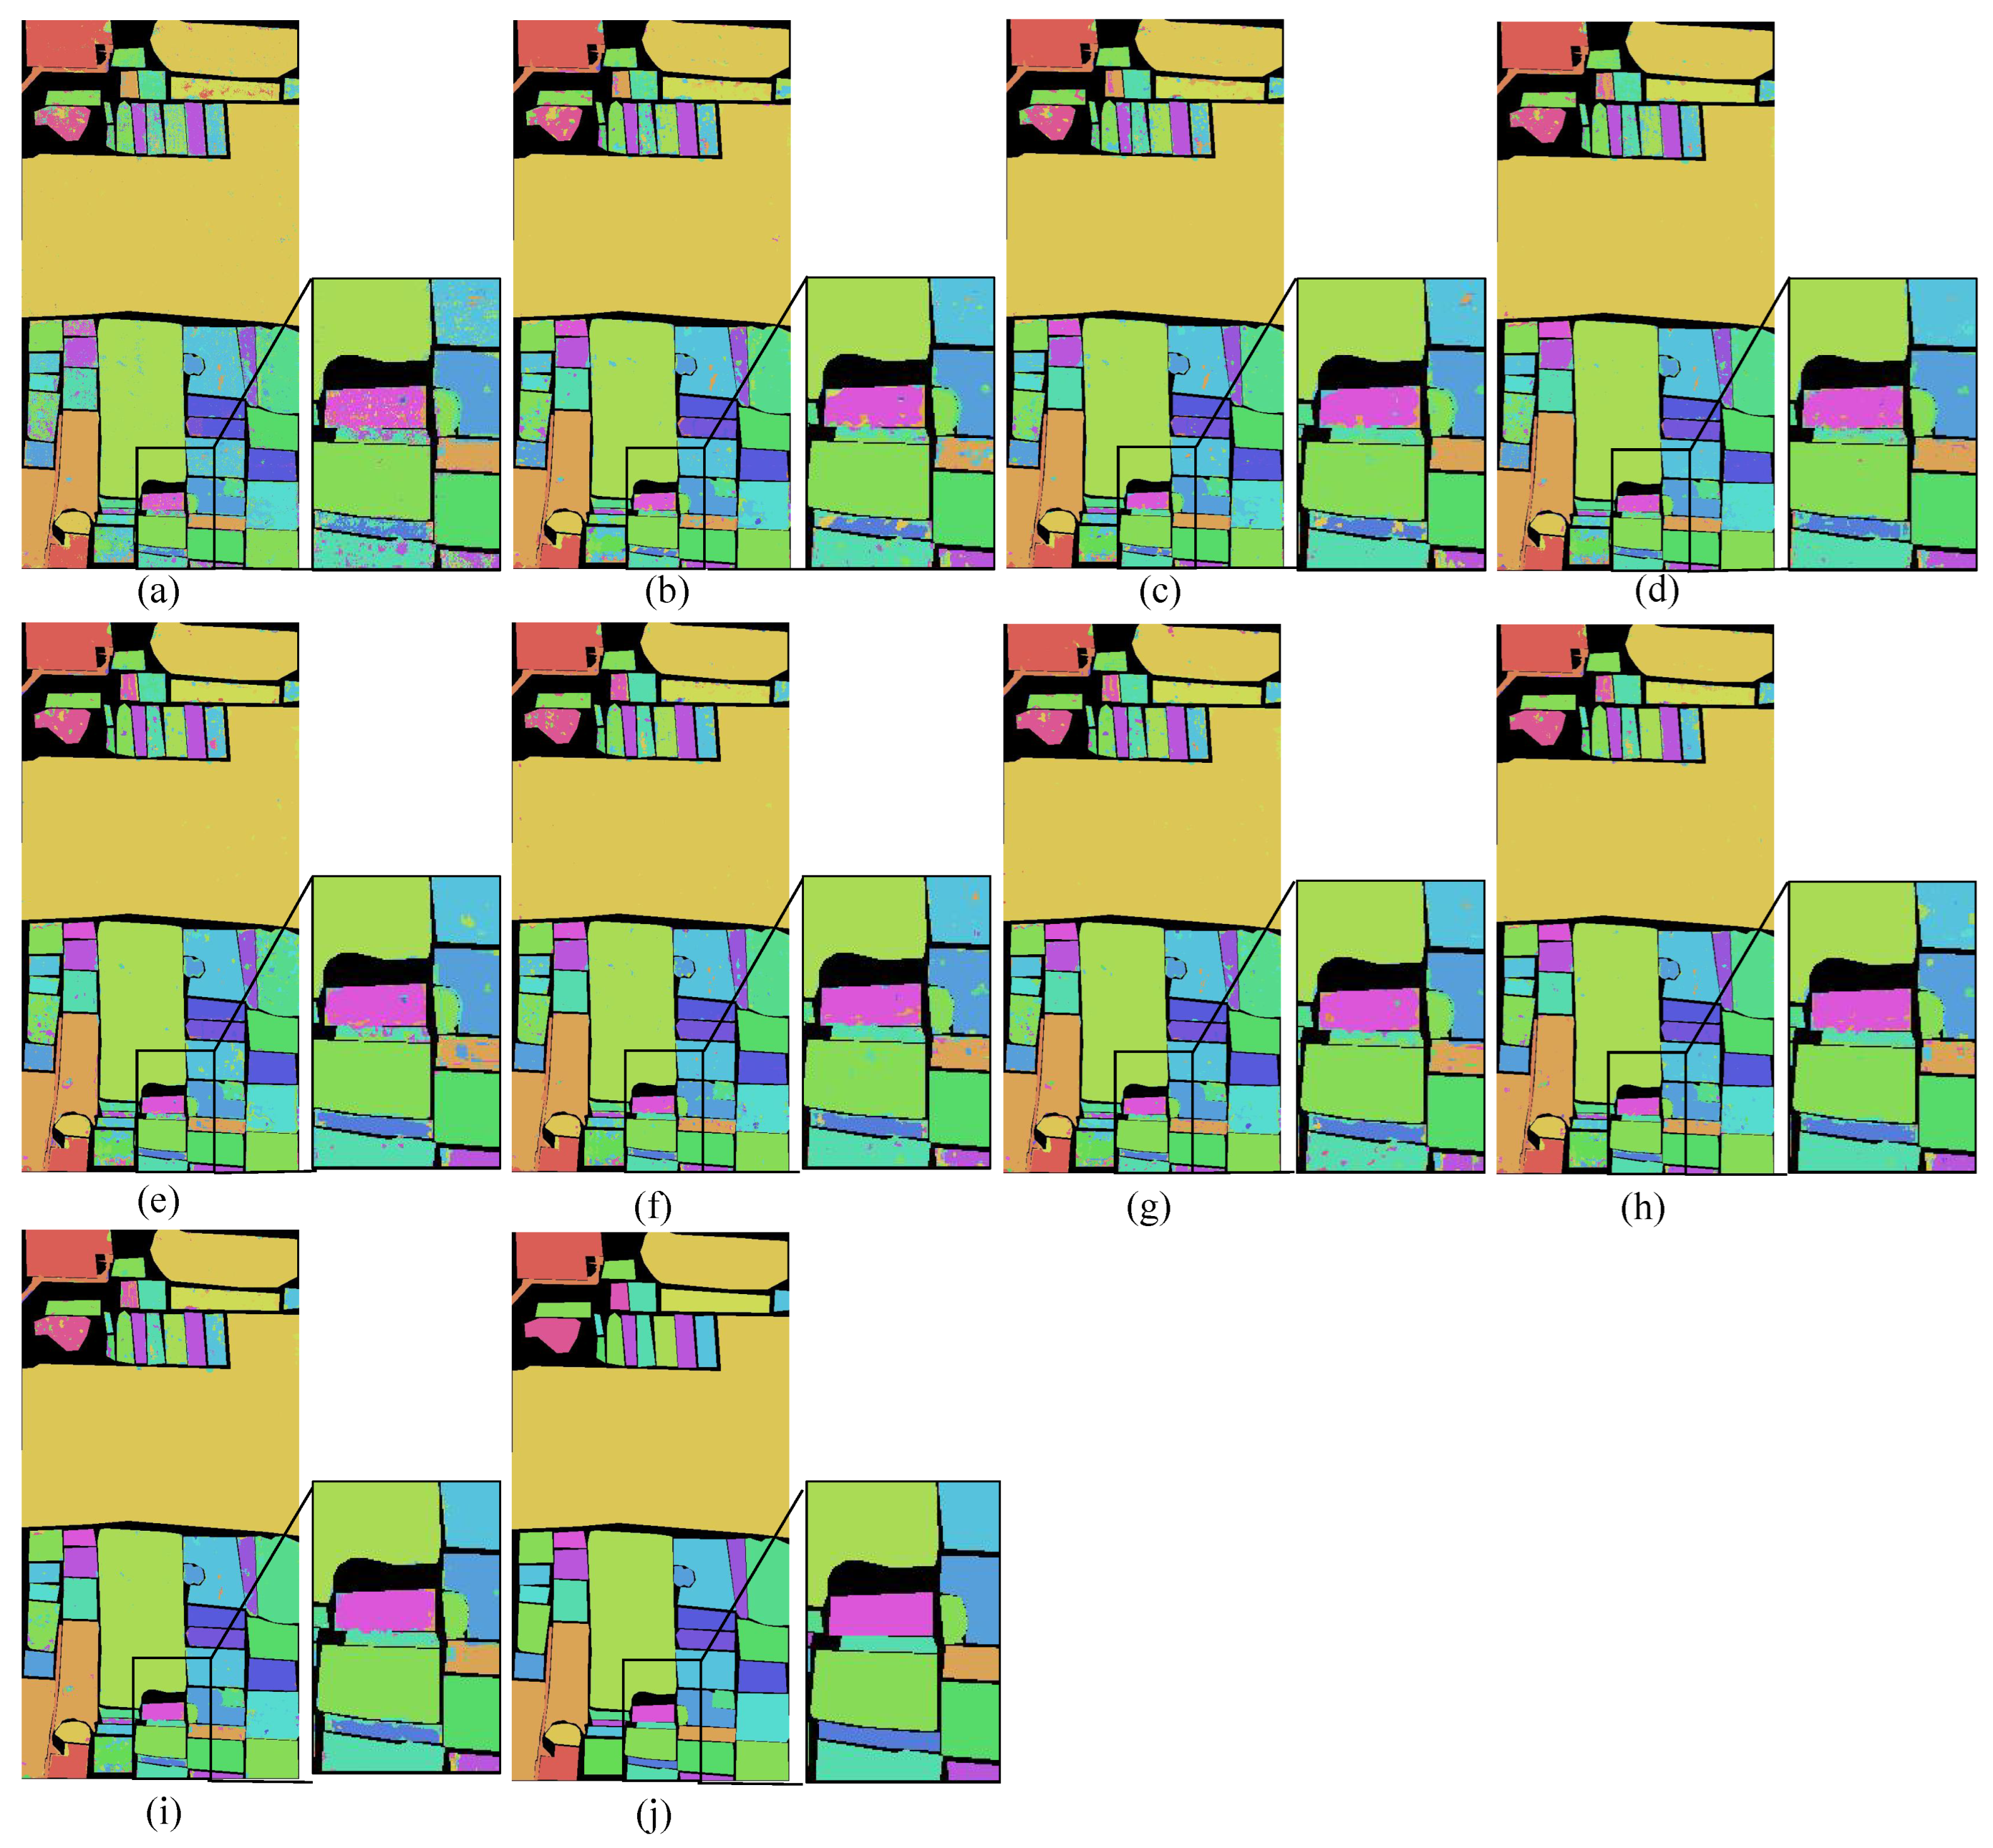
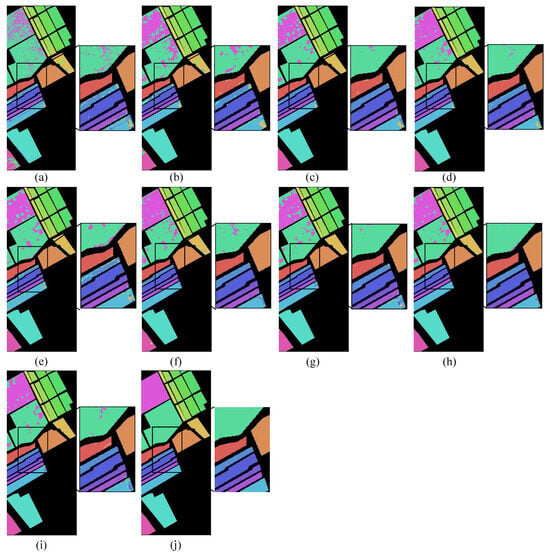
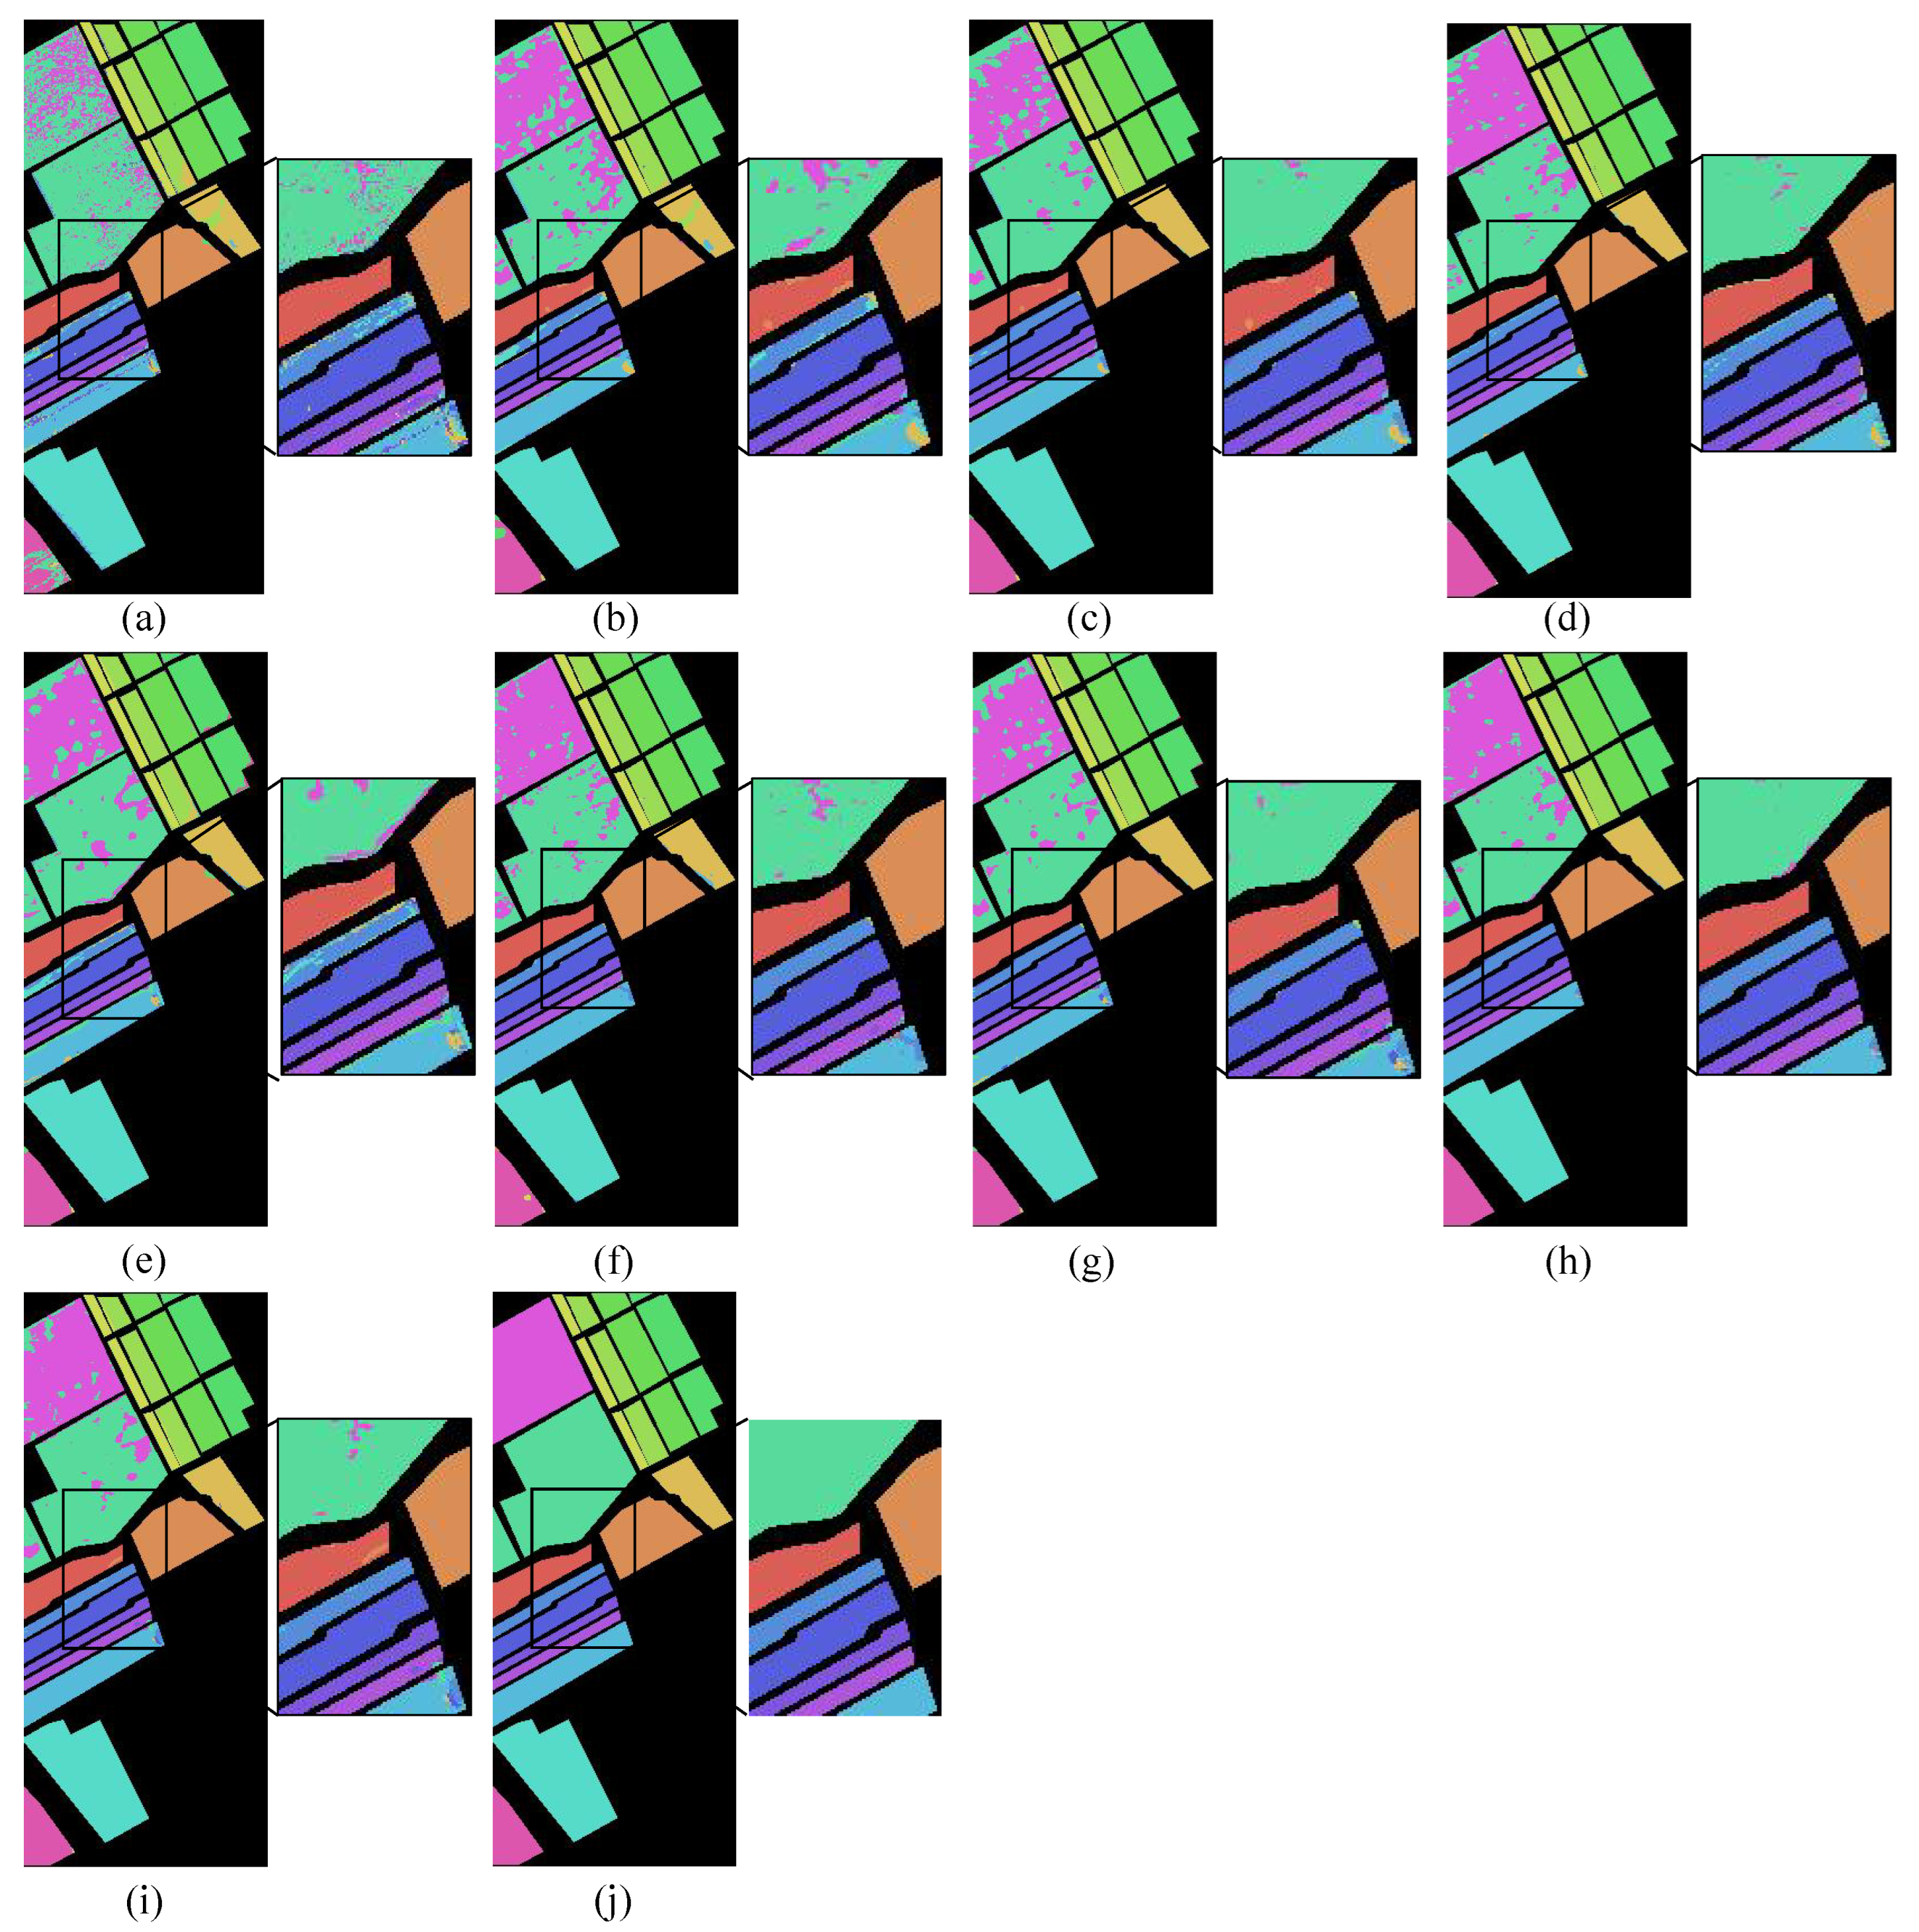
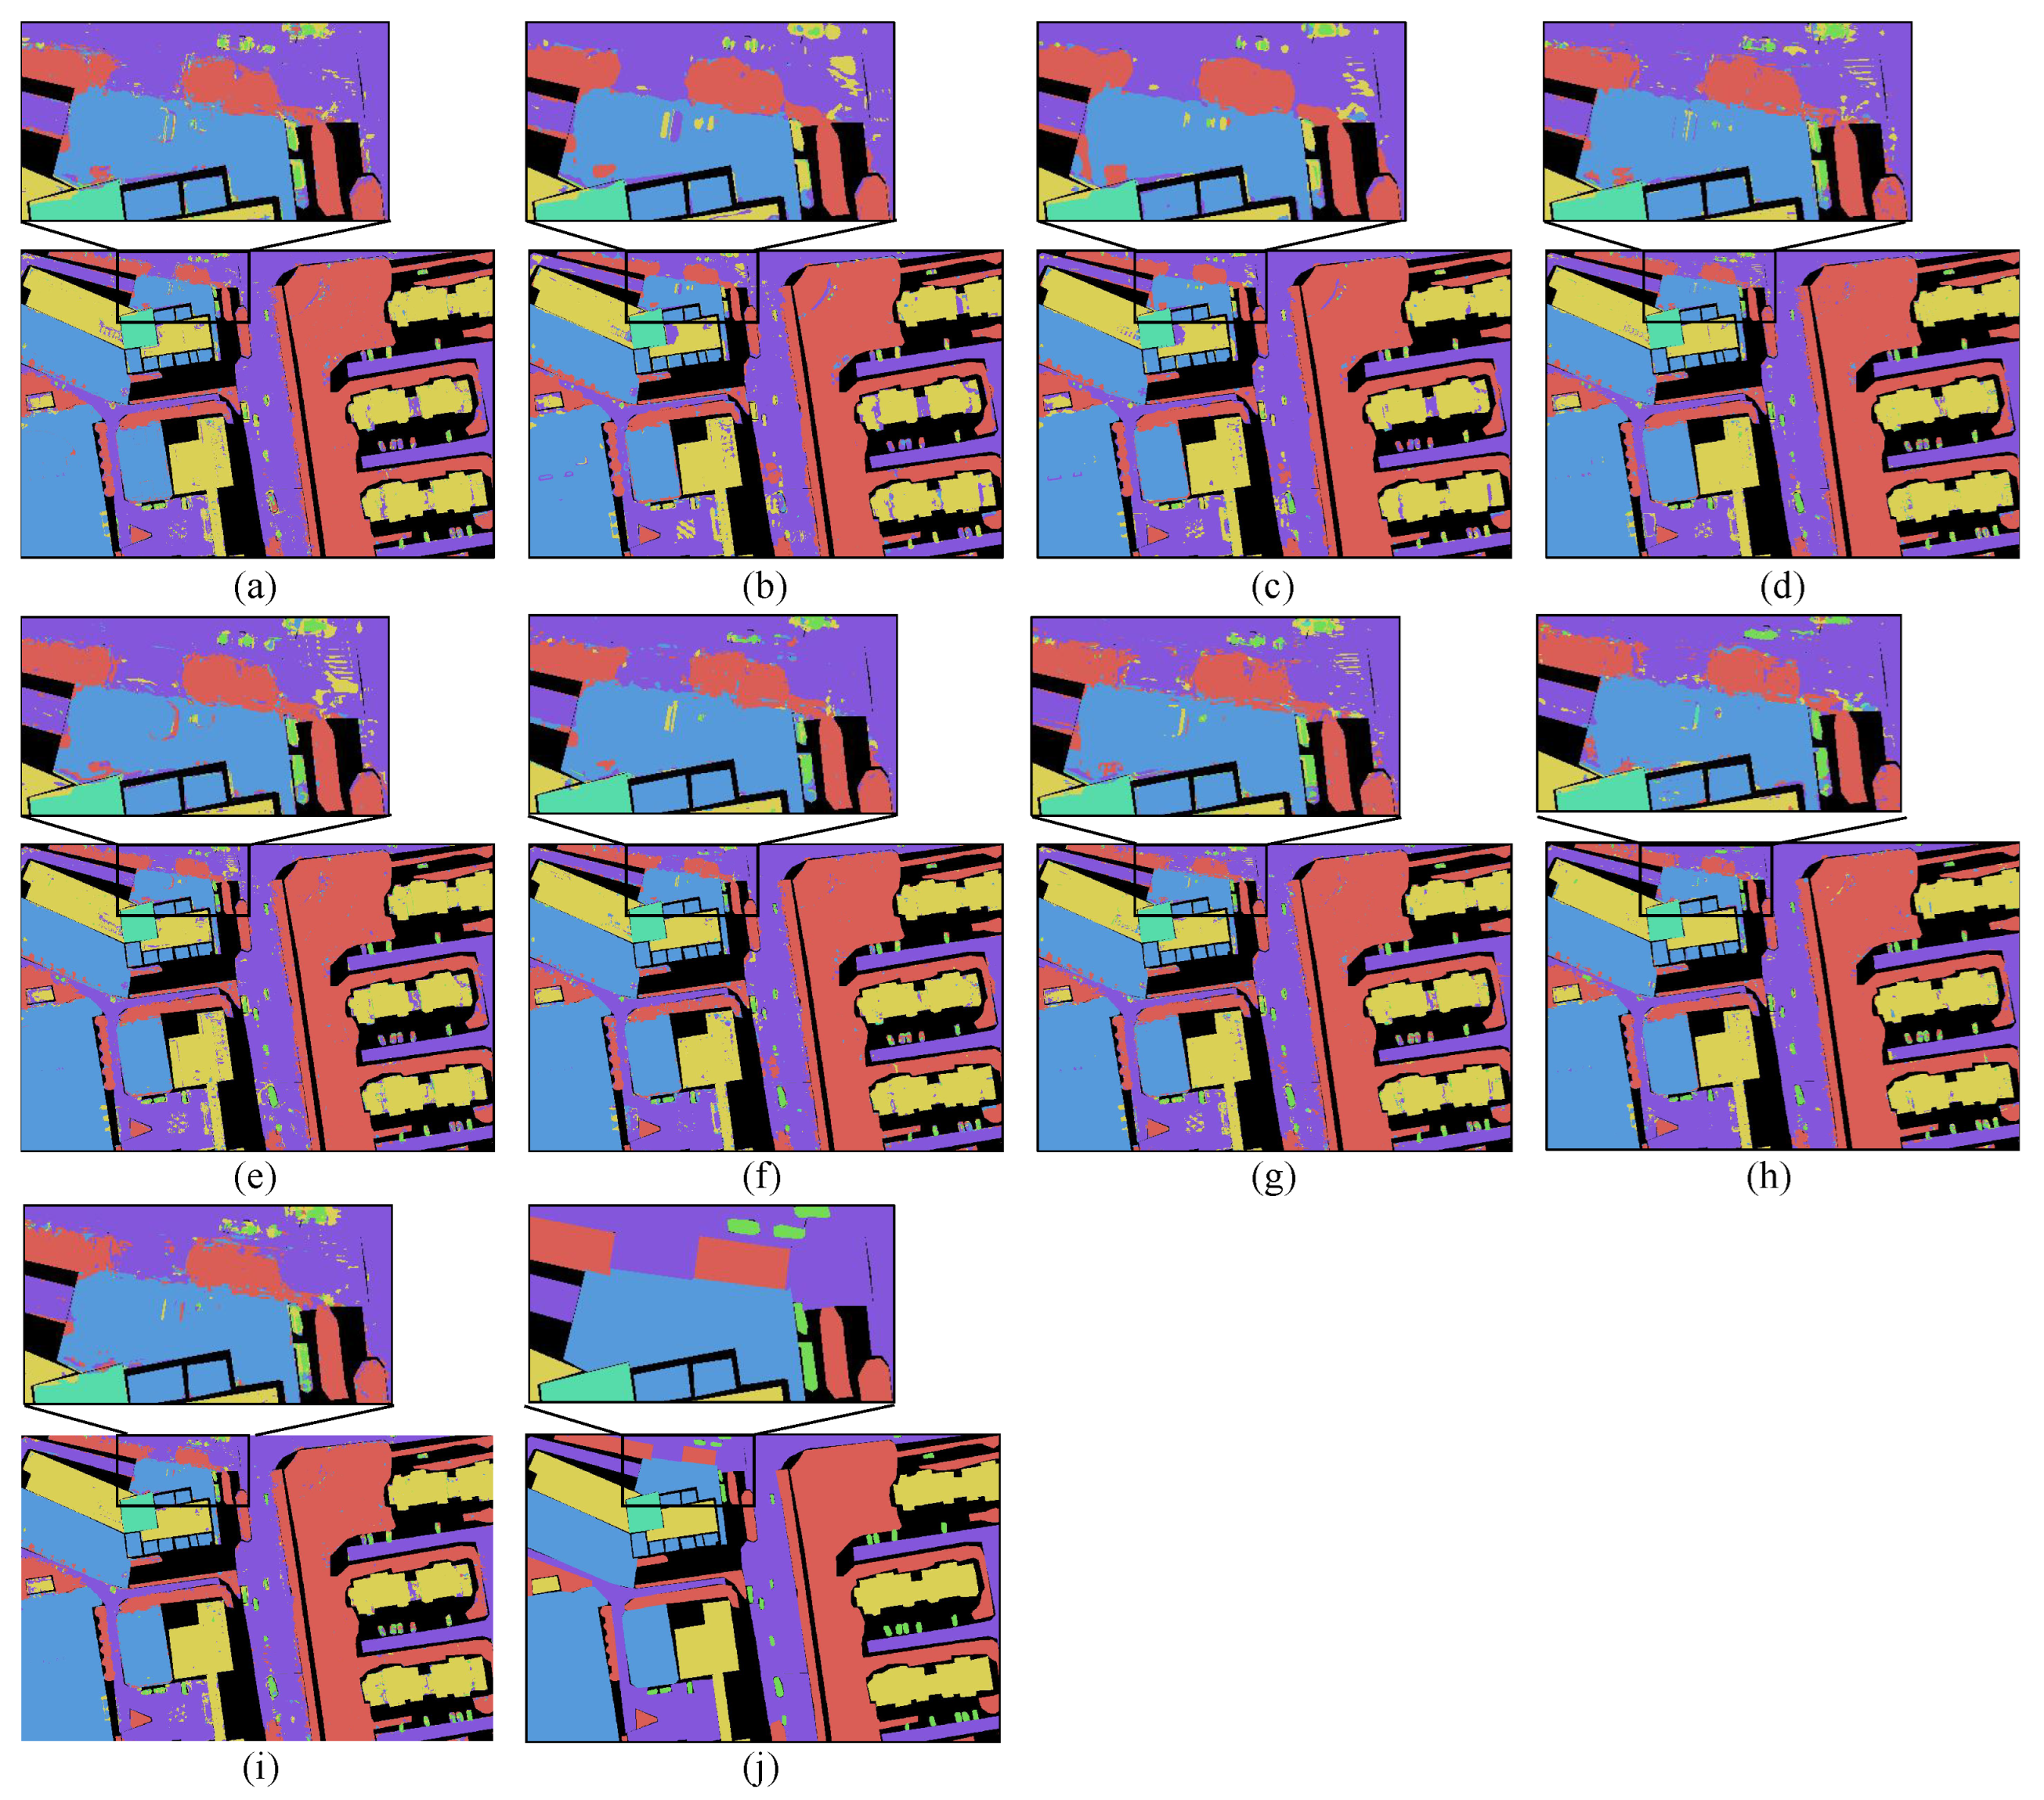
As shown in the visual analysis results from Figure 5, Figure 6, Figure 7 and Figure 8, for the Whuhh dataset, our proposed algorithm exhibits virtually no noise interference compared to ABLSTM and CNN3D algorithms. This is attributed to our implementation of local average convolution in the spectral dimension, which aggregates information from neighboring bands to suppress noise interference. For the Garlic sprout category, in the enlarged section, algorithms (a)–(g) exhibit confusion with categories such as Bare soil and Cotton. Our proposed algorithm demonstrates high classification accuracy with distinct boundaries, making it less prone to confusion with other categories. For the Sa dataset, all comparison algorithms exhibit significant misclassification for the untrained Vinyard category, with ABLSTM performing worst. While the Speformer algorithm effectively mitigates noise signals, it suffers from boundary overlap and unclear segmentation for the untrained Grapes and Lettuce romaine 5 wk categories.
Figure 5.
Classification Results of Different Contrast Algorithms on the Whuhh Dataset. (a) ABLSTM; (b) CNN3D; (c) M3DDCNN; (d) RSSAN; (e) Speformer; (f) SSFTT; (g) S3ANet; (h) MSFICNet; (i) Proposed; (j) Ground Truth.
Figure 6.
Classification Results of Different Contrast Algorithms on the SA Dataset. (a) ABLSTM; (b) CNN3D; (c) M3DDCNN; (d) RSSAN; (e) Speformer; (f) SSFTT; (g) S3ANet; (h) MSFICNet; (i) Proposed; (j) Ground Truth.
Figure 7.
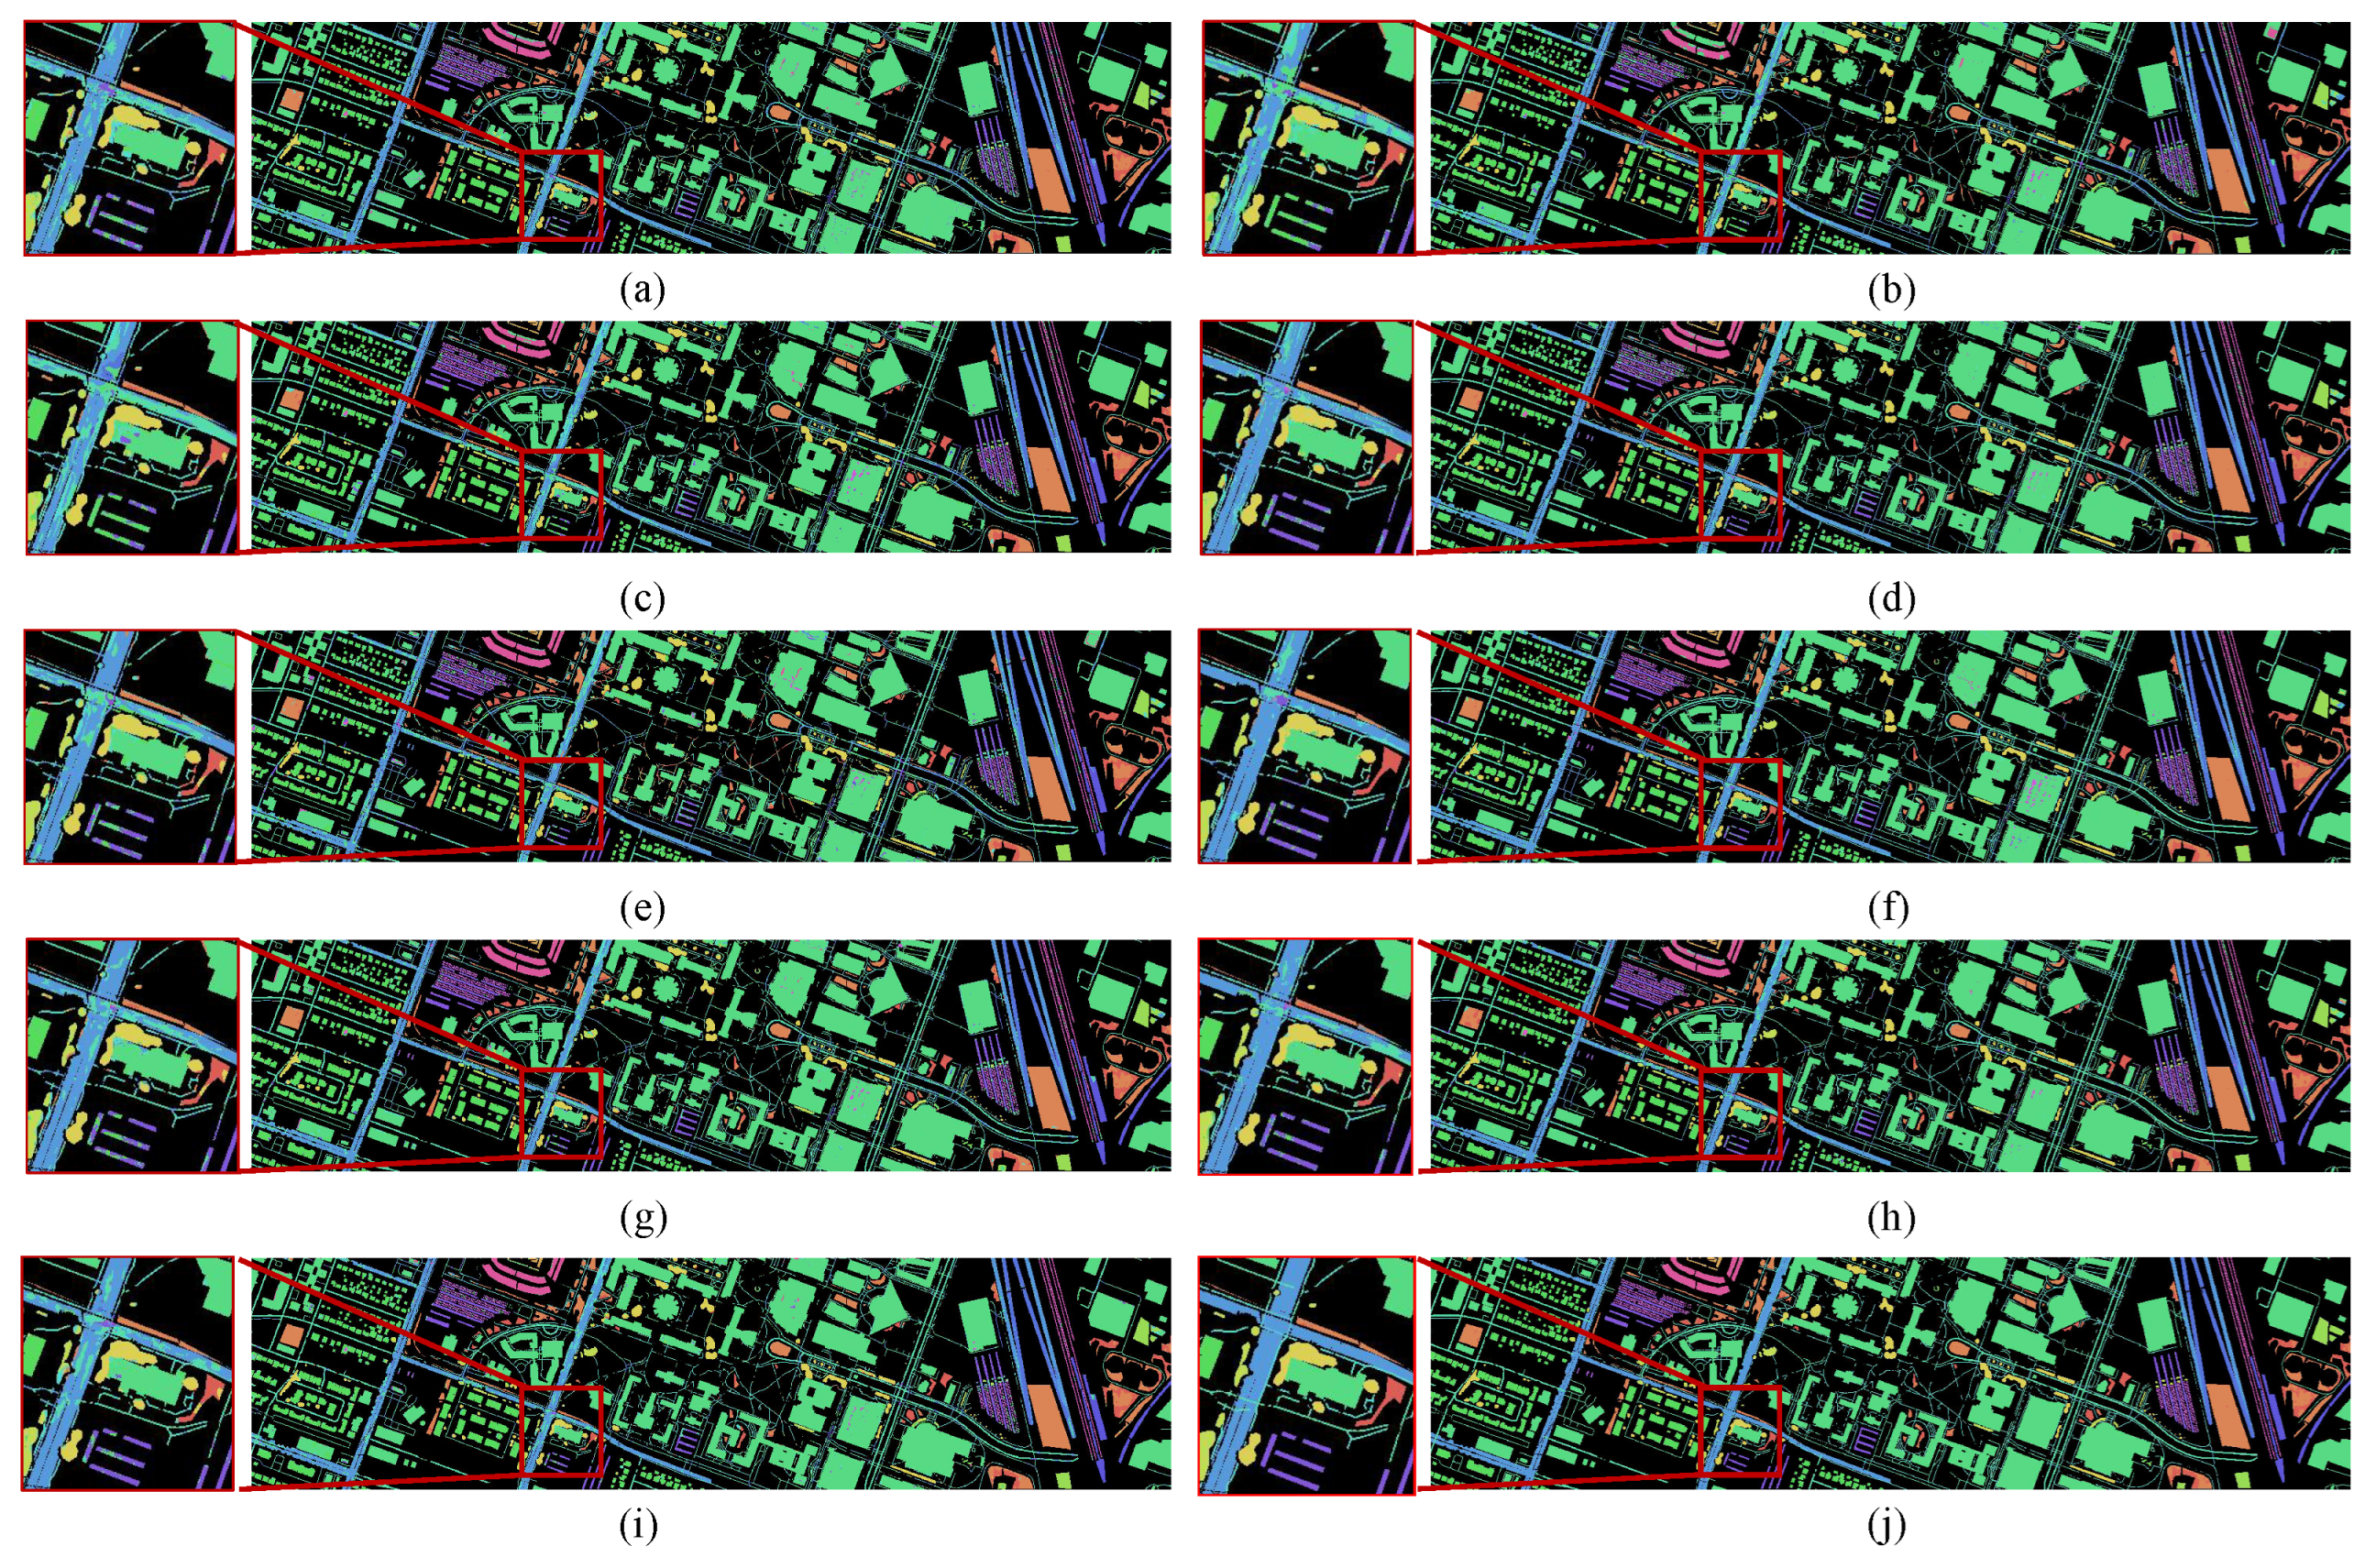
Classification Results of Different Contrast Algorithms on the Qingyun Dataset. (a) ABLSTM; (b) CNN3D; (c) M3DDCNN; (d) RSSAN; (e) Speformer; (f) SSFTT; (g) S3ANet; (h) MSFICNet; (i) Proposed; (j) Ground Truth.
Figure 8.
Classification Results of Different Contrast Algorithms on the Houston Dataset. (a) ABLSTM; (b) CNN3D; (c) M3DDCNN; (d) RSSAN; (e) Speformer; (f) SSFTT; (g) S3ANet; (h) MSFICNet; (i) Proposed; (j) Ground Truth.
For the Qingyun dataset, the proposed method should exhibit the overall effect of minimal noise, most coherent regions, and clearest boundaries in the visualization results. Due to partial spectral overlap between Concrete building and Asphalt road classifications, other methods produced overlapping results for these two categories. In contrast, the proposed algorithm performed well in classifying Car and Trees, significantly reducing large misclassifications and fragmentation, resulting in cleaner and more natural pseudo-color classification maps. On the Houston dataset, compared to seven other benchmark algorithms, the proposed method significantly improves recognition performance for challenging categories like Buildings and Roads, achieving favorable results.
5.2. Experimental Data Analysis
Whuhh is a dataset with the largest number of categories and complex spectral differences. As shown in Table 2, the experimental results indicate that traditional ablastm, cnn3d, m3ddcnn, and rssan methods perform poorly in classifying difficult Pakchoi categories, even achieving ultra-low accuracy below 50%. The proposed model achieved the best comprehensive classification performance on the Whuhh dataset, with OA, AA, and Kappa coefficients reaching 96.59%, 90.69%, and 95.69%, respectively. In particular, our method outperforms most models in MF1 (92.03%) and MIoU (85.91%) metrics, which better reflect the model’s balanced classification ability. This is mainly due to the model’s ability to learn complex spectral features more effectively, especially in difficult to classify categories, such as Brassica parachinensis and Broad beans.
Table 2.
Experimental Results of Different Contrastive Algorithms on the Whuhh Dataset.
The Salinas dataset has fine categories and high spectral similarity, as shown in Table 3. The method proposed in this paper achieved optimal or suboptimal results in all key indicators such as OA, AA, Kappa, Mf1, and MIoU on the Salinas dataset, especially in small sample and hyperspectral similar categories. It achieved 100% classification accuracy in categories such as Stubble, Celery, Soil Vineyard Development, and Letter Romaine 5 week, indicating the efficient modeling ability of the model for spectral spatial discriminative features in complex crop scenes. Despite the introduction of more complex modeling structures leading to increased training time, it still maintains higher computational efficiency compared to pure Transformer methods, demonstrating a good balance between performance and complexity.
Table 3.
Experimental Results of Different Contrastive Algorithms on the SA Dataset.
The Qingyun dataset is rich in a large number of buildings and scattered road shadow interference, as shown in Table 4. The most challenging small item category is Car, while traditional methods such as CNN3D and M3DCNN generally have lower accuracy, at 10.41% and 25.43%, respectively. The proposed method achieved an overall classification accuracy of 56.26% in the Car category, significantly improving the recognition performance of fine-grained and highly confused categories. In other categories, the proposed method is also close to optimal, and the overall performance is very stable. In terms of overall indicators, the OA, AA, and Kappa of the proposed algorithm reached 95.27%, 89.39%, and 93.74%, respectively, indicating that the model can effectively handle hyperspectral complexity in urban scenes.
Table 4.
Experimental Results of Different Contrastive Algorithms on the Qingyun Dataset.
For the Houston dataset, as shown in Table 5, the proposed PST Net achieved an OA of 89.06% and a Kappa coefficient of 85.72% on the Houston dataset, outperforming most comparison methods. Compared to the closest performing S3ANet, PST Net improved OA and Kappa by 0.08% and 0.11%, respectively. And PST Net achieves high classification accuracy while significantly reducing training time to about one tenth of it. Analyzing the reasons, although S3ANet integrates a pyramid spatial attention learning module and effectively captures multi-scale spatial dependencies through the use of spatial spectral fusion defense methods, it has not established an explicit bidirectional cross scale guidance mechanism. Therefore, its discriminative power is insufficient in some categories with complex spatial structures and subtle inter class differences, Crosswalks. Although SpeFormer achieves long-range modeling through a pure Transformer structure, it treats each pixel independently as a Token and does not introduce local smoothing and spatial embedding in the spectral dimension, resulting in a less compact modeling of the spectral spatial joint relationship unique to hyperspectral images. Compared to the algorithm proposed in this paper, the OA is about 7% lower. The PST Net proposed in this article constructs tightly coupled spectral statistics and spatial position information through adaptive spectral spatial tokens, and achieves bidirectional modulation and residual alignment of Transformer global features and CNN local features through cross level interactive fusion modules, thereby improving the model’s discriminative power while maintaining high computational efficiency. Therefore, PST Net achieves stable classification on most land cover categories, especially in categories that rely heavily on spatial context such as Stadium seats, achieving a recognition accuracy of 98.67%. It also achieves relatively optimal results when facing Crosswalks with extremely imbalanced samples, demonstrating the robustness and generalization ability of the model in complex remote sensing scenes.
Table 5.
Experimental Results of Different Contrastive Algorithms on the Houston Dataset.
5.3. Deep Visualization and Mechanism of Misclassified Cases
In order to further explore the discriminative mechanism of the model in complex remote sensing scenes, this section combines the visual classification results of experiments with quantitative data to conduct in-depth analysis of typical error areas and low-precision categories in the classification map.
In the Whuhh and SA agricultural scene datasets, the high spectral similarity between categories is the main cause of misclassification. Traditional algorithms such as ABLSTM and CNN3D exhibit significant salt and pepper noise in their classification graphs, especially in the Pakchoi category, where the accuracy of traditional methods is generally below 50%. Analyzing the reasons, Pakchoi has a high degree of overlap with other leafy vegetables on the spectral curve. The PSTNet proposed in this article aggregates neighboring band information through local average convolution in the spectral dimension, exhibiting more coherent regionalism in the visualization results and effectively suppressing the interference caused by spectral fluctuations. Boundary aliasing in the SA dataset: In the Vinyard untained category, all comparison algorithms showed significant misjudgments. Although Speformer can use Transformer to model long-range dependencies to eliminate noise, there is severe boundary blurring at the junction of Grapes untained and Lettese romaine. This indicates that the pure Transformer structure lacks capture of local spatial gradient information when dealing with detail transitions at high spatial resolution. In contrast, PSTNet introduces local features of CNN through the CHIB module, making the classification boundaries clearer and more natural.
In the Qingyun dataset in urban environments, Car belongs to a typical small-sized, sparse sample category. Due to the lack of effective global context correlation, the accuracy of CNN3D and M3DCNN is only 10.41% and 25.43%, respectively. PSTNet significantly reduced the fragmentation of Car categories in the classification graph, with an accuracy improvement of 56.26%. This proves that adaptive spectral spatial tokens can better capture the salient features of sparse samples. In the Houston experiment with extremely imbalanced samples, Crosswalks samples were extremely scarce and had narrow spatial shapes. Although S3ANet has multi-scale features, it is difficult to accurately locate in complex backgrounds due to the lack of cross scale guidance mechanisms. PSTNet achieved relatively optimal results in this class, with more robust extraction of elongated features in visual classification maps, demonstrating its generalization advantage in handling extremely imbalanced samples.
6. Discussion
To comprehensively evaluate the performance and effectiveness of the proposed method, this section conducts systematic analysis and discussion from multiple dimensions, including verifying the contributions and synergistic effects of each module through ablation experiments, analyzing the number of model parameters and computational complexity and exploring their efficiency and compactness, studying the impact of different patch sizes on classification performance, discussing the impact of different training sample ratios on model classification metrics.
6.1. Ablation Studies
To verify the effectiveness of each module we proposed, we conducted ablation experiments on four datasets, where Case 1 represents our proposed adaptive spectral–spatial token Transformer (ASST); Case 2 represents Parallel Attention enhanced Spectral–Spatial CNN (PA-SSCNN); Case 3 involves simply concatenating ASST and PA-SSCNN without adding a feature fusion module; Case 4 represents the complete network we proposed. From the ablation experiment results in Table 6, it can be seen that ASST and PA-SSCNN have significant complementarity in spectral spatial feature modeling. When only a single module is used, the model performance is significantly different on different datasets. ASST performs better on the whohh and Qingyun datasets with complex structure and strong correlation between categories. PA-SSCNN is more suitable for capturing local and edge features. The combination of the two (Case 3) can significantly improve the classification accuracy, superior to Case 1 and Case 2. This indicates that ASST and PA-SSCNN have complementarity in the feature modeling process, and spectral relationship modeling and spatial texture enhancement can synergistically improve classification ability.
Table 6.
Ablation Experiment Results of the Proposed Algorithm on Four Datasets.
Comparing the results of Case 3 and Case 4, it can be found that after adding the final fusion module, the performance of the four datasets is further improved to the highest level. Among them, the OA of Sa, Whuhh, Houston, and Qingyun reach 94.37%, 96.38%, 96.31%, and 94.85%, respectively, which are 0.78%, 0.43%, 0.38%, and 0.51% higher than Case 3, fully demonstrating the effectiveness of cross level interactive fusion and the synergistic effect of each module design. CHIB achieves bidirectional feature modulation through global to local guidance (GLG) and local to global constraints (LGC): GLG utilizes the global context of Transformer to generate spatially gated weights, and weights CNN features element by element to suppress background noise and highlight key regions; LGC injects the fine local structures extracted by CNN into Transformer features in residual form to enhance the boundary localization capability. It is worth noting that LGC uses residual connections () to ensure that the global semantic information in the original Transformer features is fully preserved, and there will be no “feature cleaning” or global context loss due to the injection of local details. Meanwhile, GLG adapts through a learnable gating mechanism to avoid excessive suppression of local textures. Therefore, CHIB effectively enhances local discriminability while maintaining global dependency modeling capabilities, enabling deep complementarity of dual branch features. This is the fundamental reason why Case 4 performs better than Case 3.
6.2. Analysis of Model Parameters and Computational Complexity
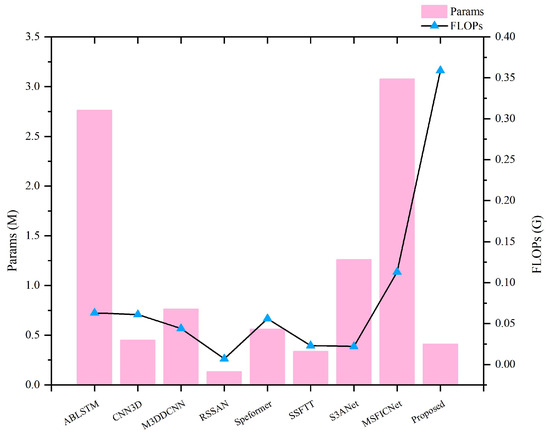
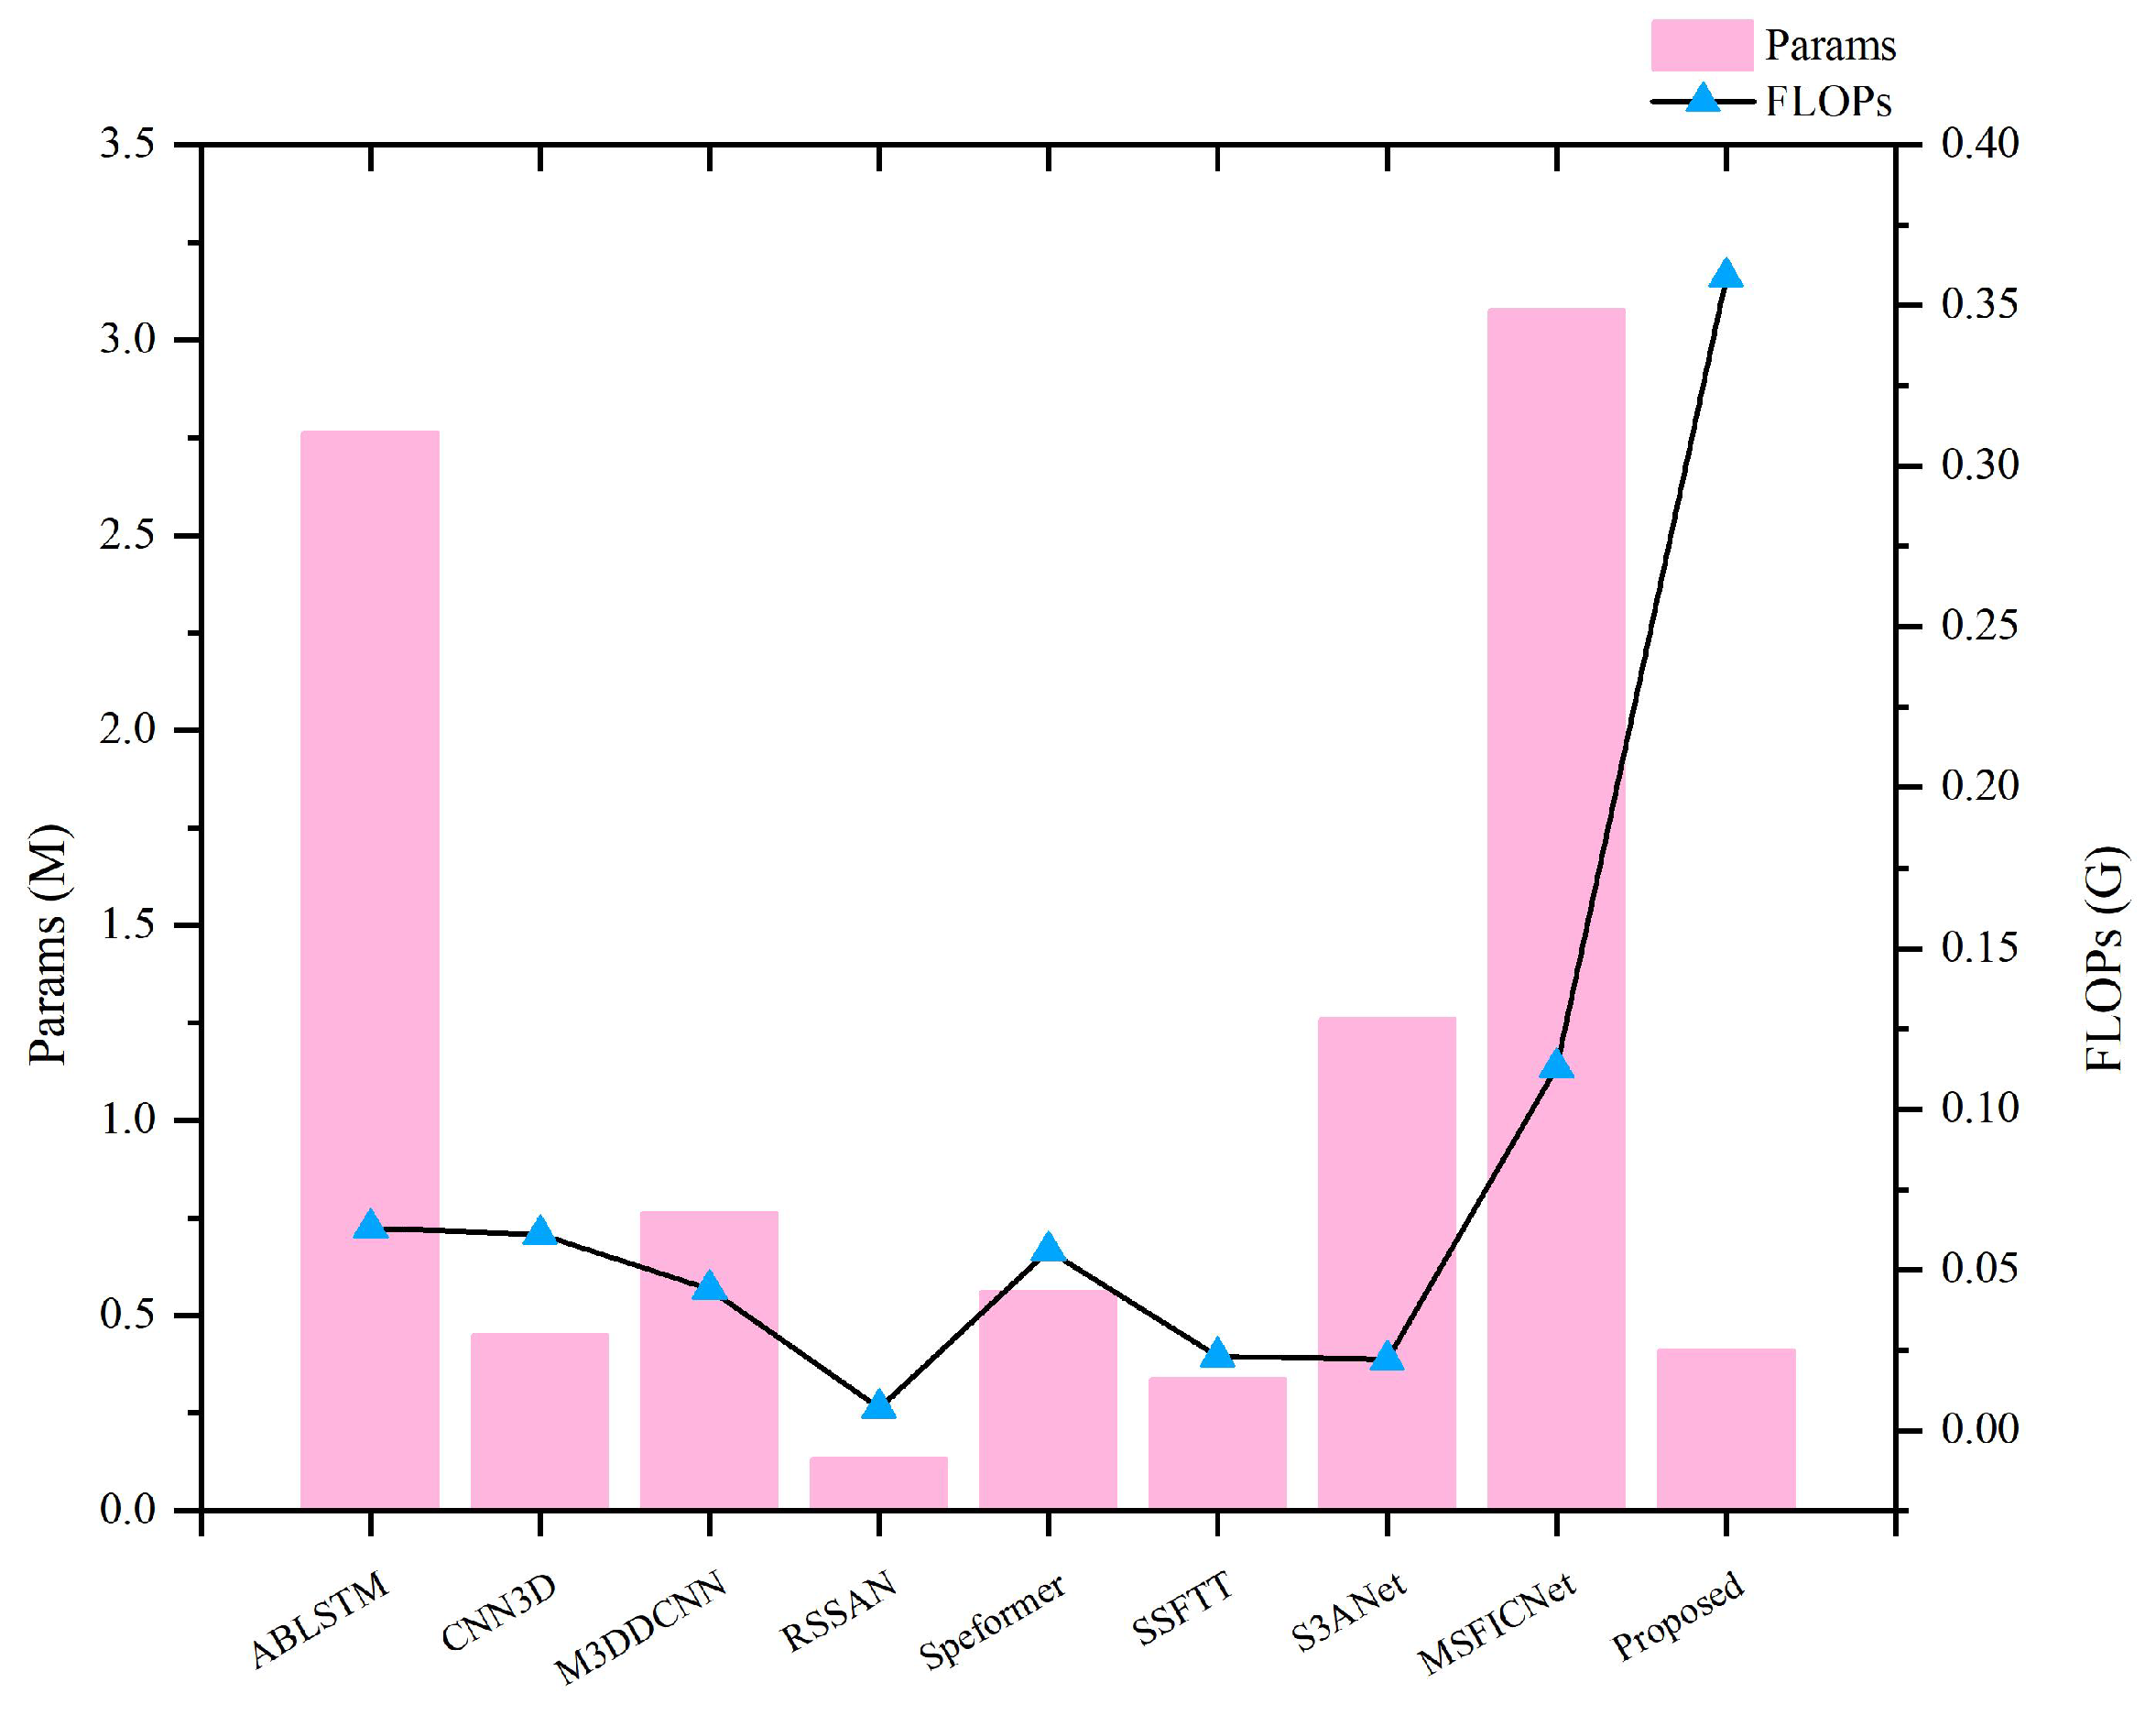
To comprehensively evaluate the complexity of the model, we compared the parameter count (Params) and computational complexity (FLOPs) of each method on the Whuhh dataset, and the results are shown in Figure 9. From the perspective of parameter quantity, the proposed method is only 0.412 M, significantly lower than ABLSTM (2.763 M), S3ANet (1.26 M), etc., and comparable to lightweight models such as RSSAN (0.135 M), reflecting the compactness of the model at the parameter level. However, its FLOPs reached 0.359 G, which is higher than most comparison methods (such as S3ANet with only 0.022 G). This phenomenon stems from two key trade-offs in model design: Firstly, to maintain a low number of parameters, the model extensively employs grouped convolution, depthwise separable convolution, and self attention layers that share weights. These operations reduce parameters without lowering computational density. Secondly, the dual branch interaction module (CHIB) and parallel attention module introduce additional feature transformation calculations, which significantly increase the number of floating-point operations in forward propagation despite limited parameter increase.
Figure 9.
Image of Model Parameter Quantity and Computational Complexity.
Although FLOPs are high, the number of model parameters has not increased synchronously, indicating that computing resources are mainly used for effective feature interaction rather than parameter redundancy. It is worth noting that FLOPs are not strictly linearly correlated with actual training time. On the Qingyun dataset, the proposed method achieved a training time of 7254.37 s, which is higher than models such as S3ANet. This is mainly attributed to three aspects: (1) The Qingyun dataset has a large spatial size and generates a large number of training samples through sliding window sampling, resulting in a high number of iterations per epoch. (2) The model computation graph includes multiple tensor rearrangements, attention softmax, and other operations, which can be parallelized on GPU but still incur additional overhead. (3) The current implementation does not adopt optimization such as mixed precision training, while comparative methods may benefit from simpler structures or more mature implementations. Although the training time is longer, this method significantly outperforms the comparison methods in classification accuracy, demonstrating the effectiveness of computational cost investment. In practical applications, a balance between accuracy and efficiency can be achieved by adjusting patch size, simplifying interaction modules, and other methods.
6.3. Impact of Different Patch Sizes on Classification Performance
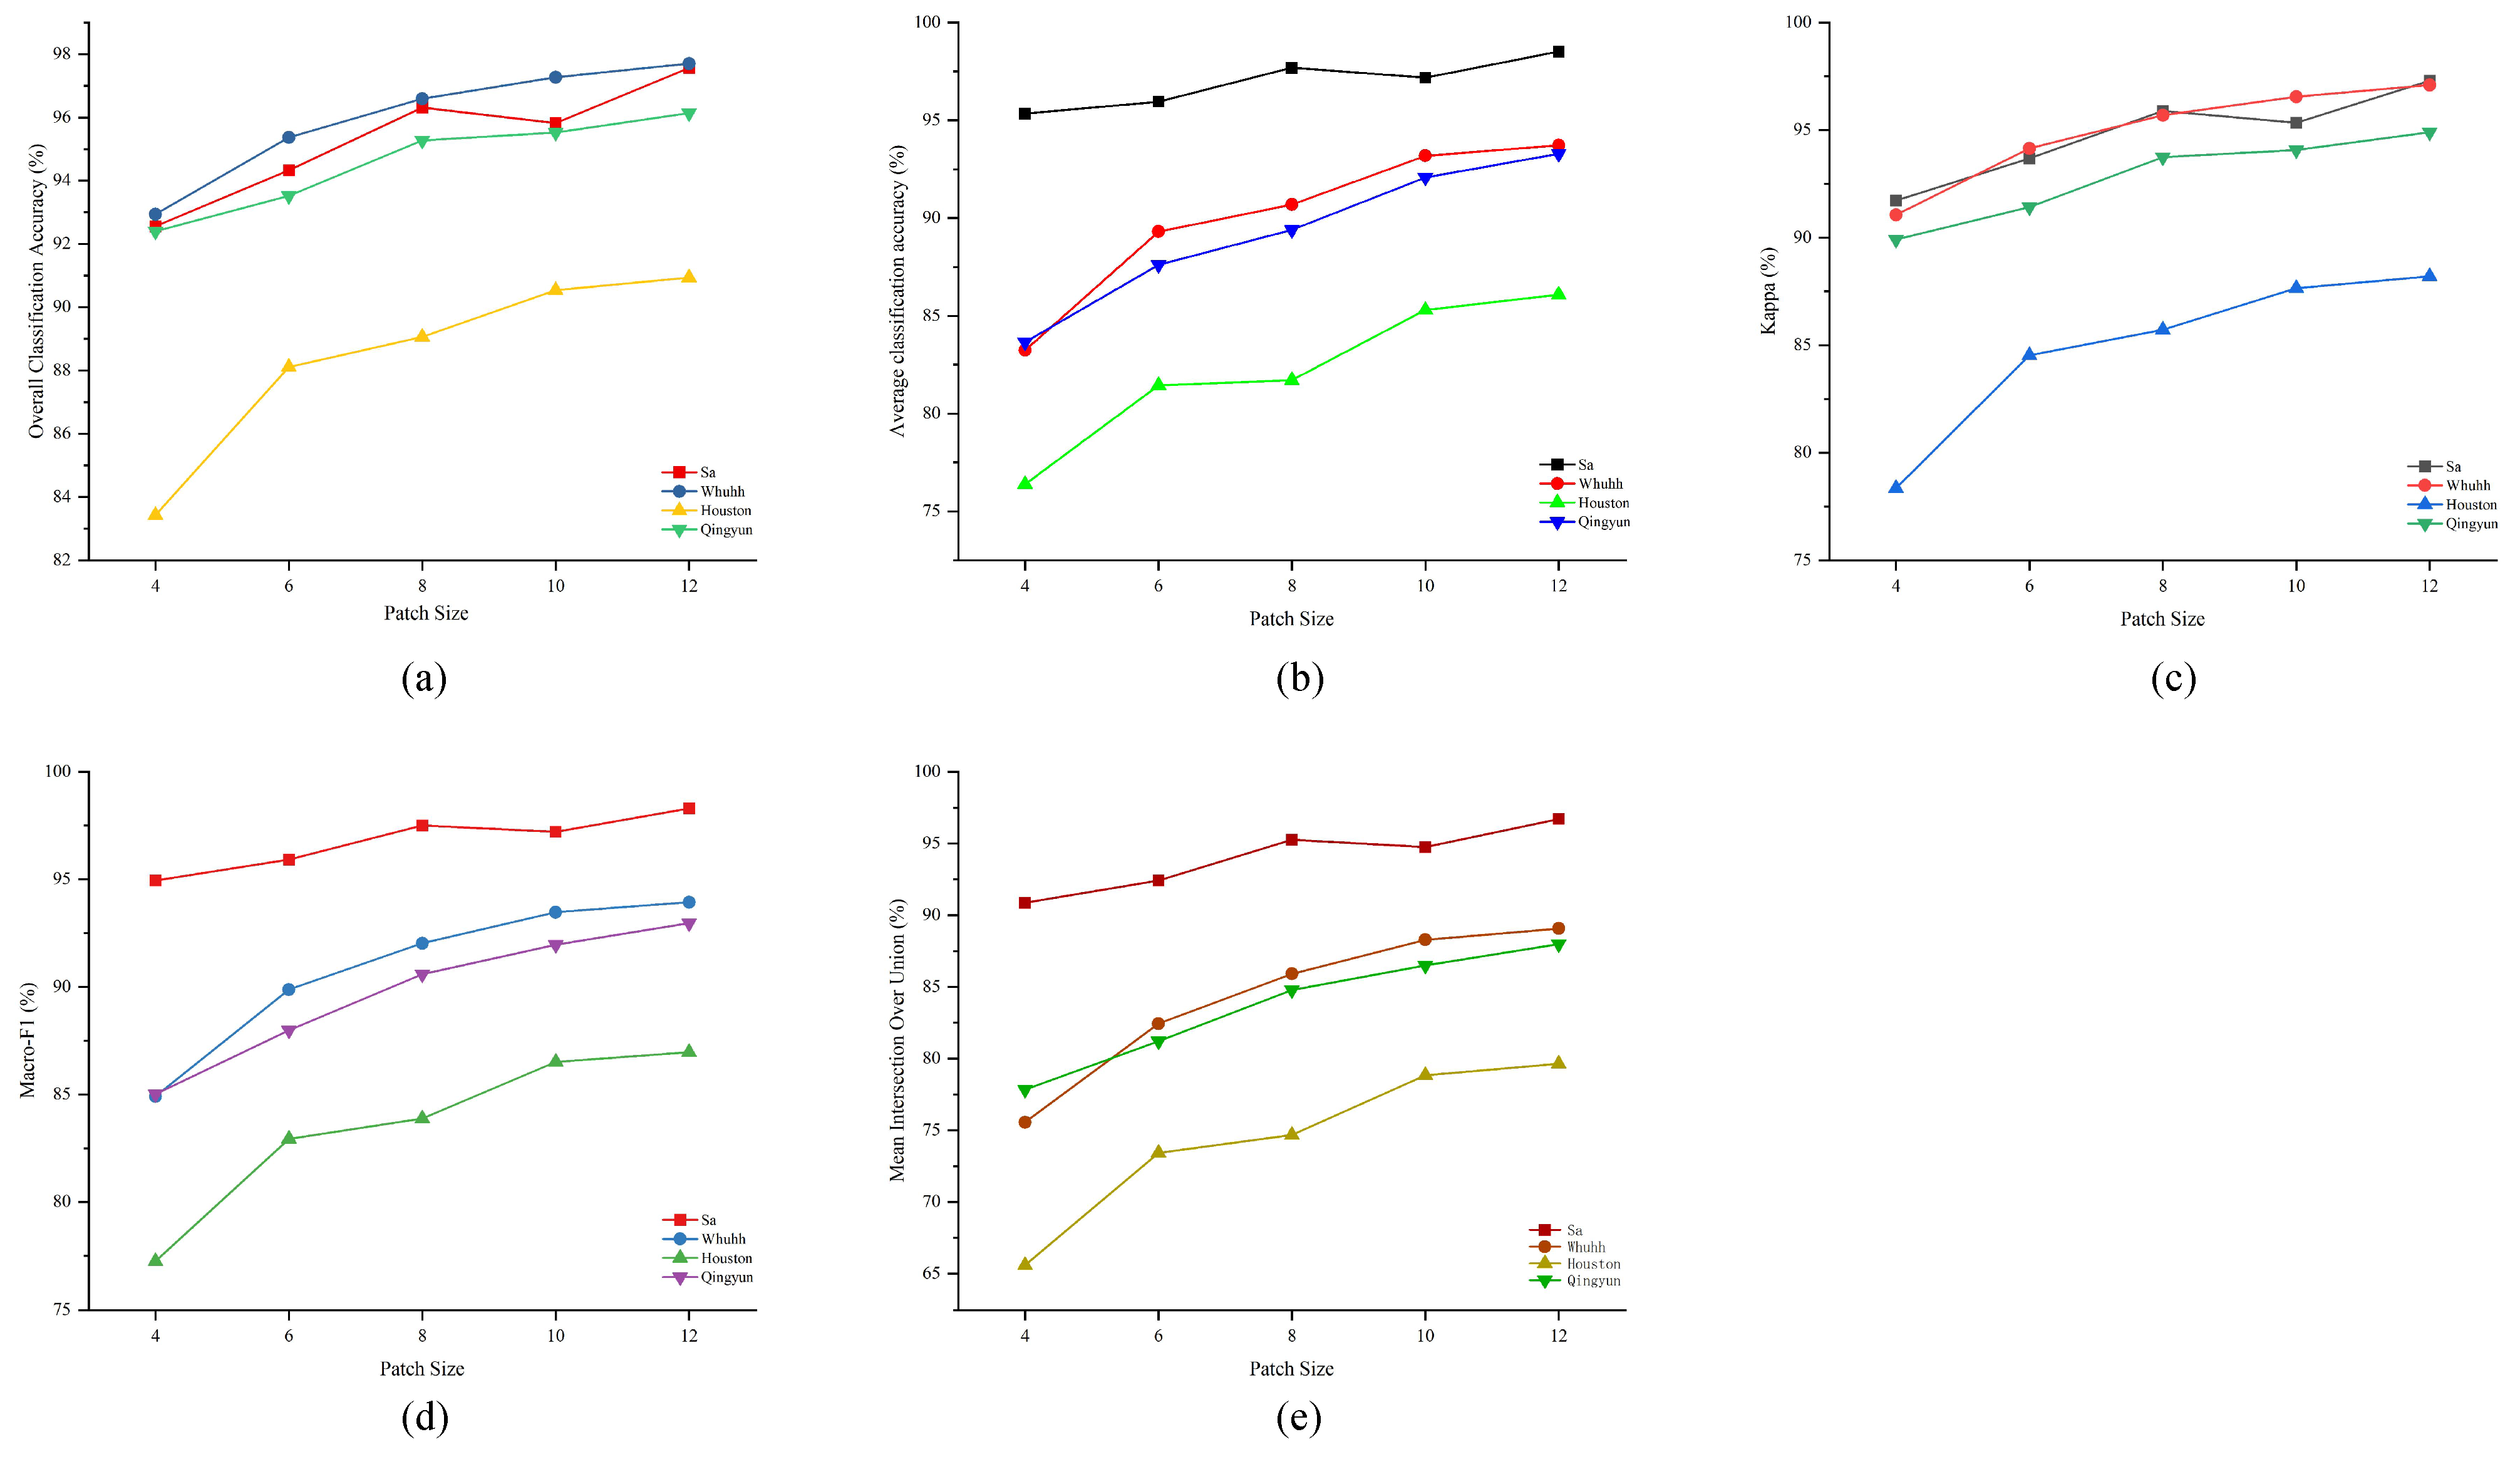
To analyze the effect of varying patch sizes on classification metrics, we designed experiments with patch sizes of , , , , and across four datasets: Sa, Whuhh, Houston, and Qingyun. Comparative analysis was conducted using metrics including OA, AA, Kappa, MF-1, and MIoU.
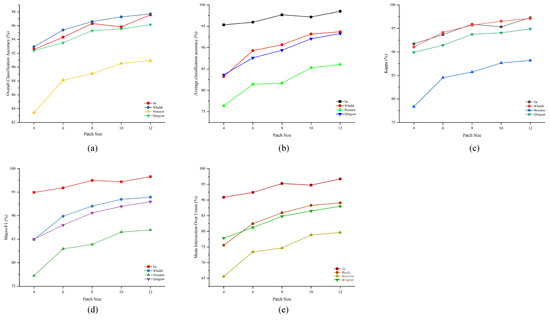
The experimental results in the Figure 10 demonstrate that smaller patch sizes lead to insufficient information, particularly evident on the Houston and Qingyun datasets. As the patch size increases from to , metrics such as AA, MF-1, and MIoU show significant improvement. This indicates that larger patch sizes facilitate the incorporation of more complete spatial contextual information, mitigate class imbalance, and enhance regional prediction consistency. Compared to the Houston dataset, which features complex urban scenes sensitive to object categories, the Sa dataset exhibits more regular distribution patterns. Here, smaller Patch Sizes already achieve satisfactory results on AA, MF-1, and MIoU, though larger Patch Sizes further enhance stability. Overall, higher scene complexity demonstrates a more pronounced reliance on larger Patch Sizes. Thus, our proposed model demonstrates that modeling spatial context is both effective and essential.
Figure 10.
Impact of Different Patch Sizes on Model Classification Metrics. (a) OA; (b) AA; (c) Kappa; (d) MF-1; (e) MIoU.
6.4. Impact of Training Sample Ratio on Classification Metrics
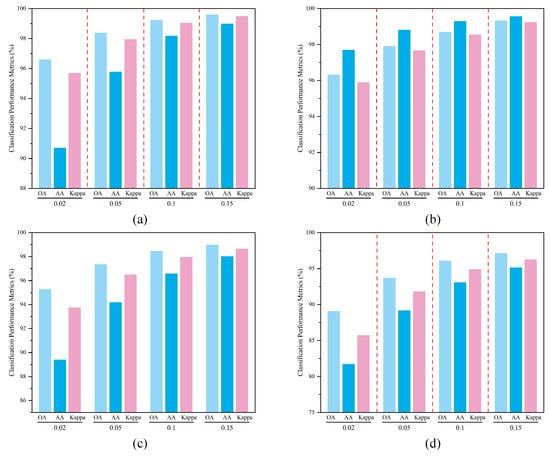
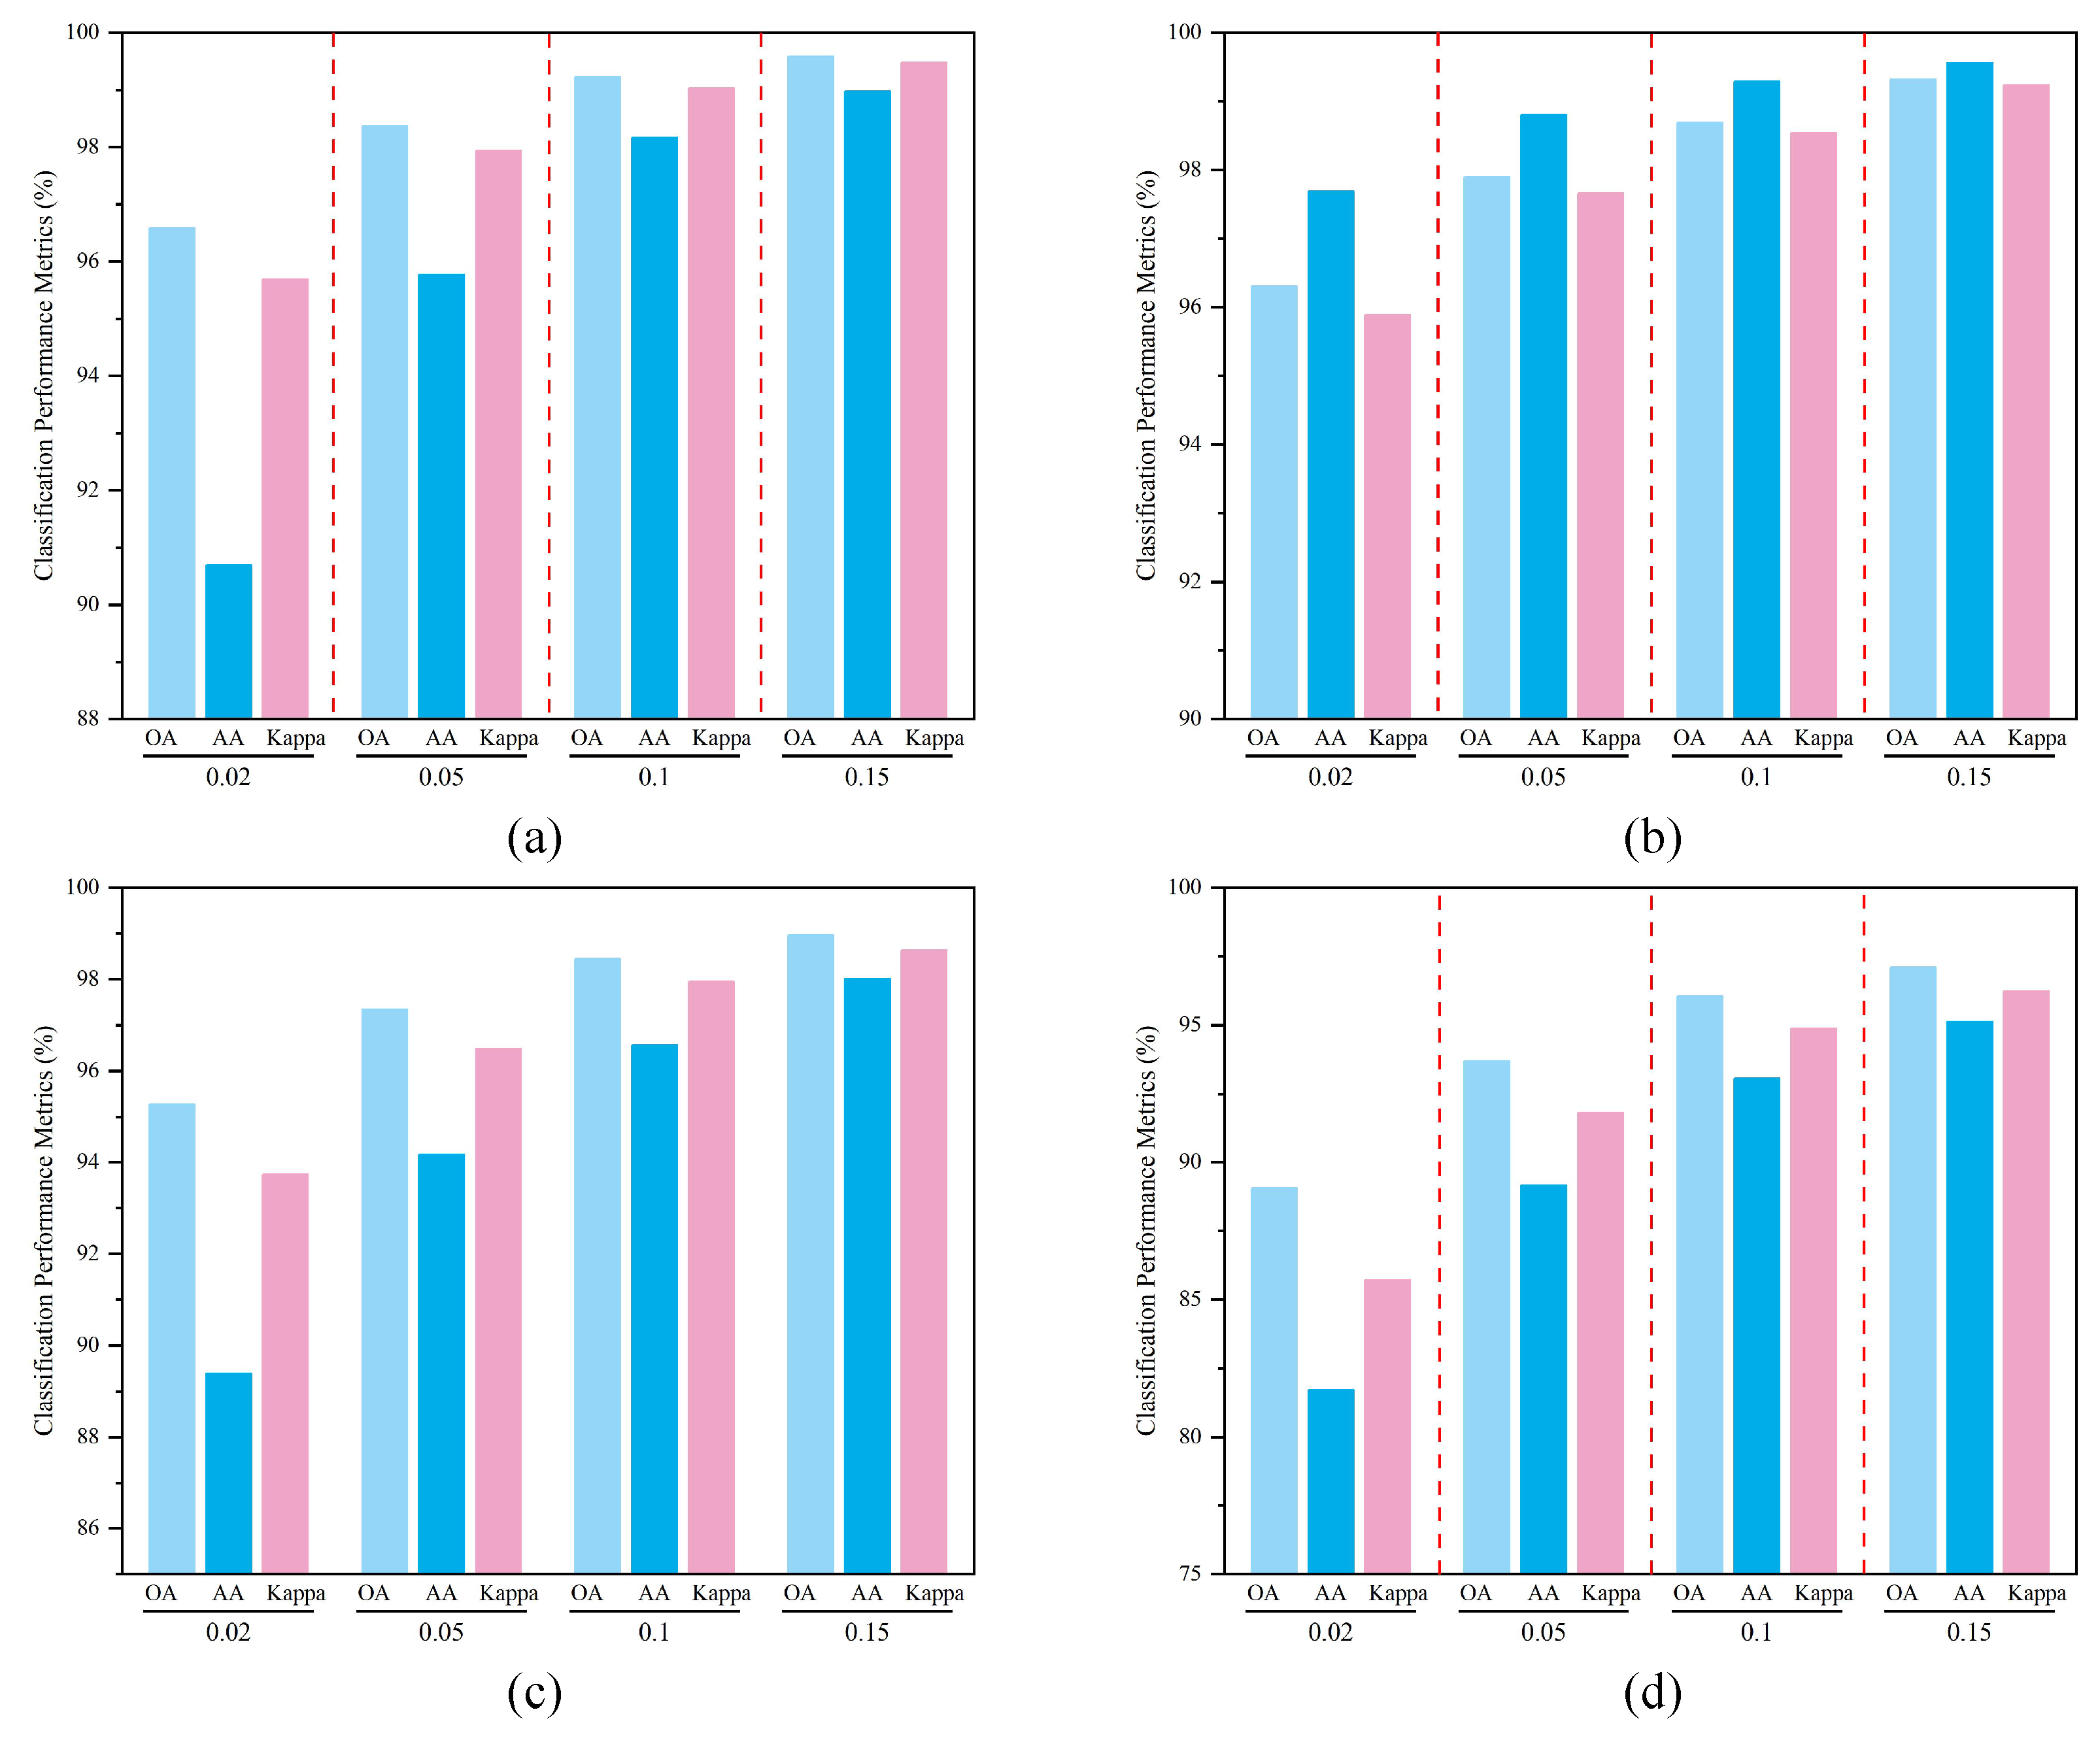
To evaluate the impact of training sample ratio (Ratio) on classification performance, we systematically analyzed OA, AA, and Kappa metrics across four datasets using training sample ratios of 2%, 5%, 10%, and 15%.
As shown in Figure 11, as the training sample ratio increases from 2% to 15%, the model demonstrates a consistent performance improvement trend across datasets of varying complexity. All metrics—OA, AA, and Kappa—exhibit stable, monotonically increasing trends. The most pronounced performance leap occurs between 2% and 5%, while gains gradually flatten after 10%, indicating the model has acquired robust feature learning capabilities. Simultaneously, the proposed model maintains high classification performance even with extremely small samples, demonstrating insensitivity to training sample size and fully validating its robustness in small-sample scenarios.
Figure 11.
The Impact of Different Training Ratios on Model Classification Metrics. (a) Whuhh; (b) Sa; (c) Qingyun; (d) Houston.
Further analysis across datasets reveals that on the Sa dataset, the overall accuracy (OA) reaches 96.31% with just 2% labeled samples. As the ratio increases, the rate of improvement gradually diminishes, reflecting the model’s rapid convergence and stability on this dataset. In contrast, on the complex Whuhh and Houston datasets, increasing the ratio significantly boosted the accuracy (AA) by approximately 8% and 13%, respectively. This demonstrates that the proposed model effectively mitigates class imbalance in complex scenarios and exhibits strong generalization capabilities under small-sample conditions.
In addition, we also conducted detailed comparative experiments between PSTNet and various mainstream benchmark models on the Sa dataset under different training sample ratios. The relevant results are shown in Table 7. Experimental data shows that under the extreme limitation of only 2% training samples, PSTNet still has strong key feature extraction ability compared to other models, effectively addressing the overfitting challenge brought by small samples. Within the sample variation range of 2–15%, PSTNet exhibits a more stable performance growth. Especially compared to ABLSTM, SpeFormer and other models that exhibit significant performance fluctuations in small samples, PSTNet demonstrates superior generalization ability and robustness. Although all models reached a high level in some high sample ratios, PSTNet remained stable in the top two leading echelon at all ratios, which fully confirms the high reliability of the proposed model in different scale data scenarios.
Table 7.
Comparison of Classification Performance of Various Models under Different Training Sample Ratios on the Sa Dataset.
6.5. Analysis of Gate Control Mechanism and Study on Model Adaptability
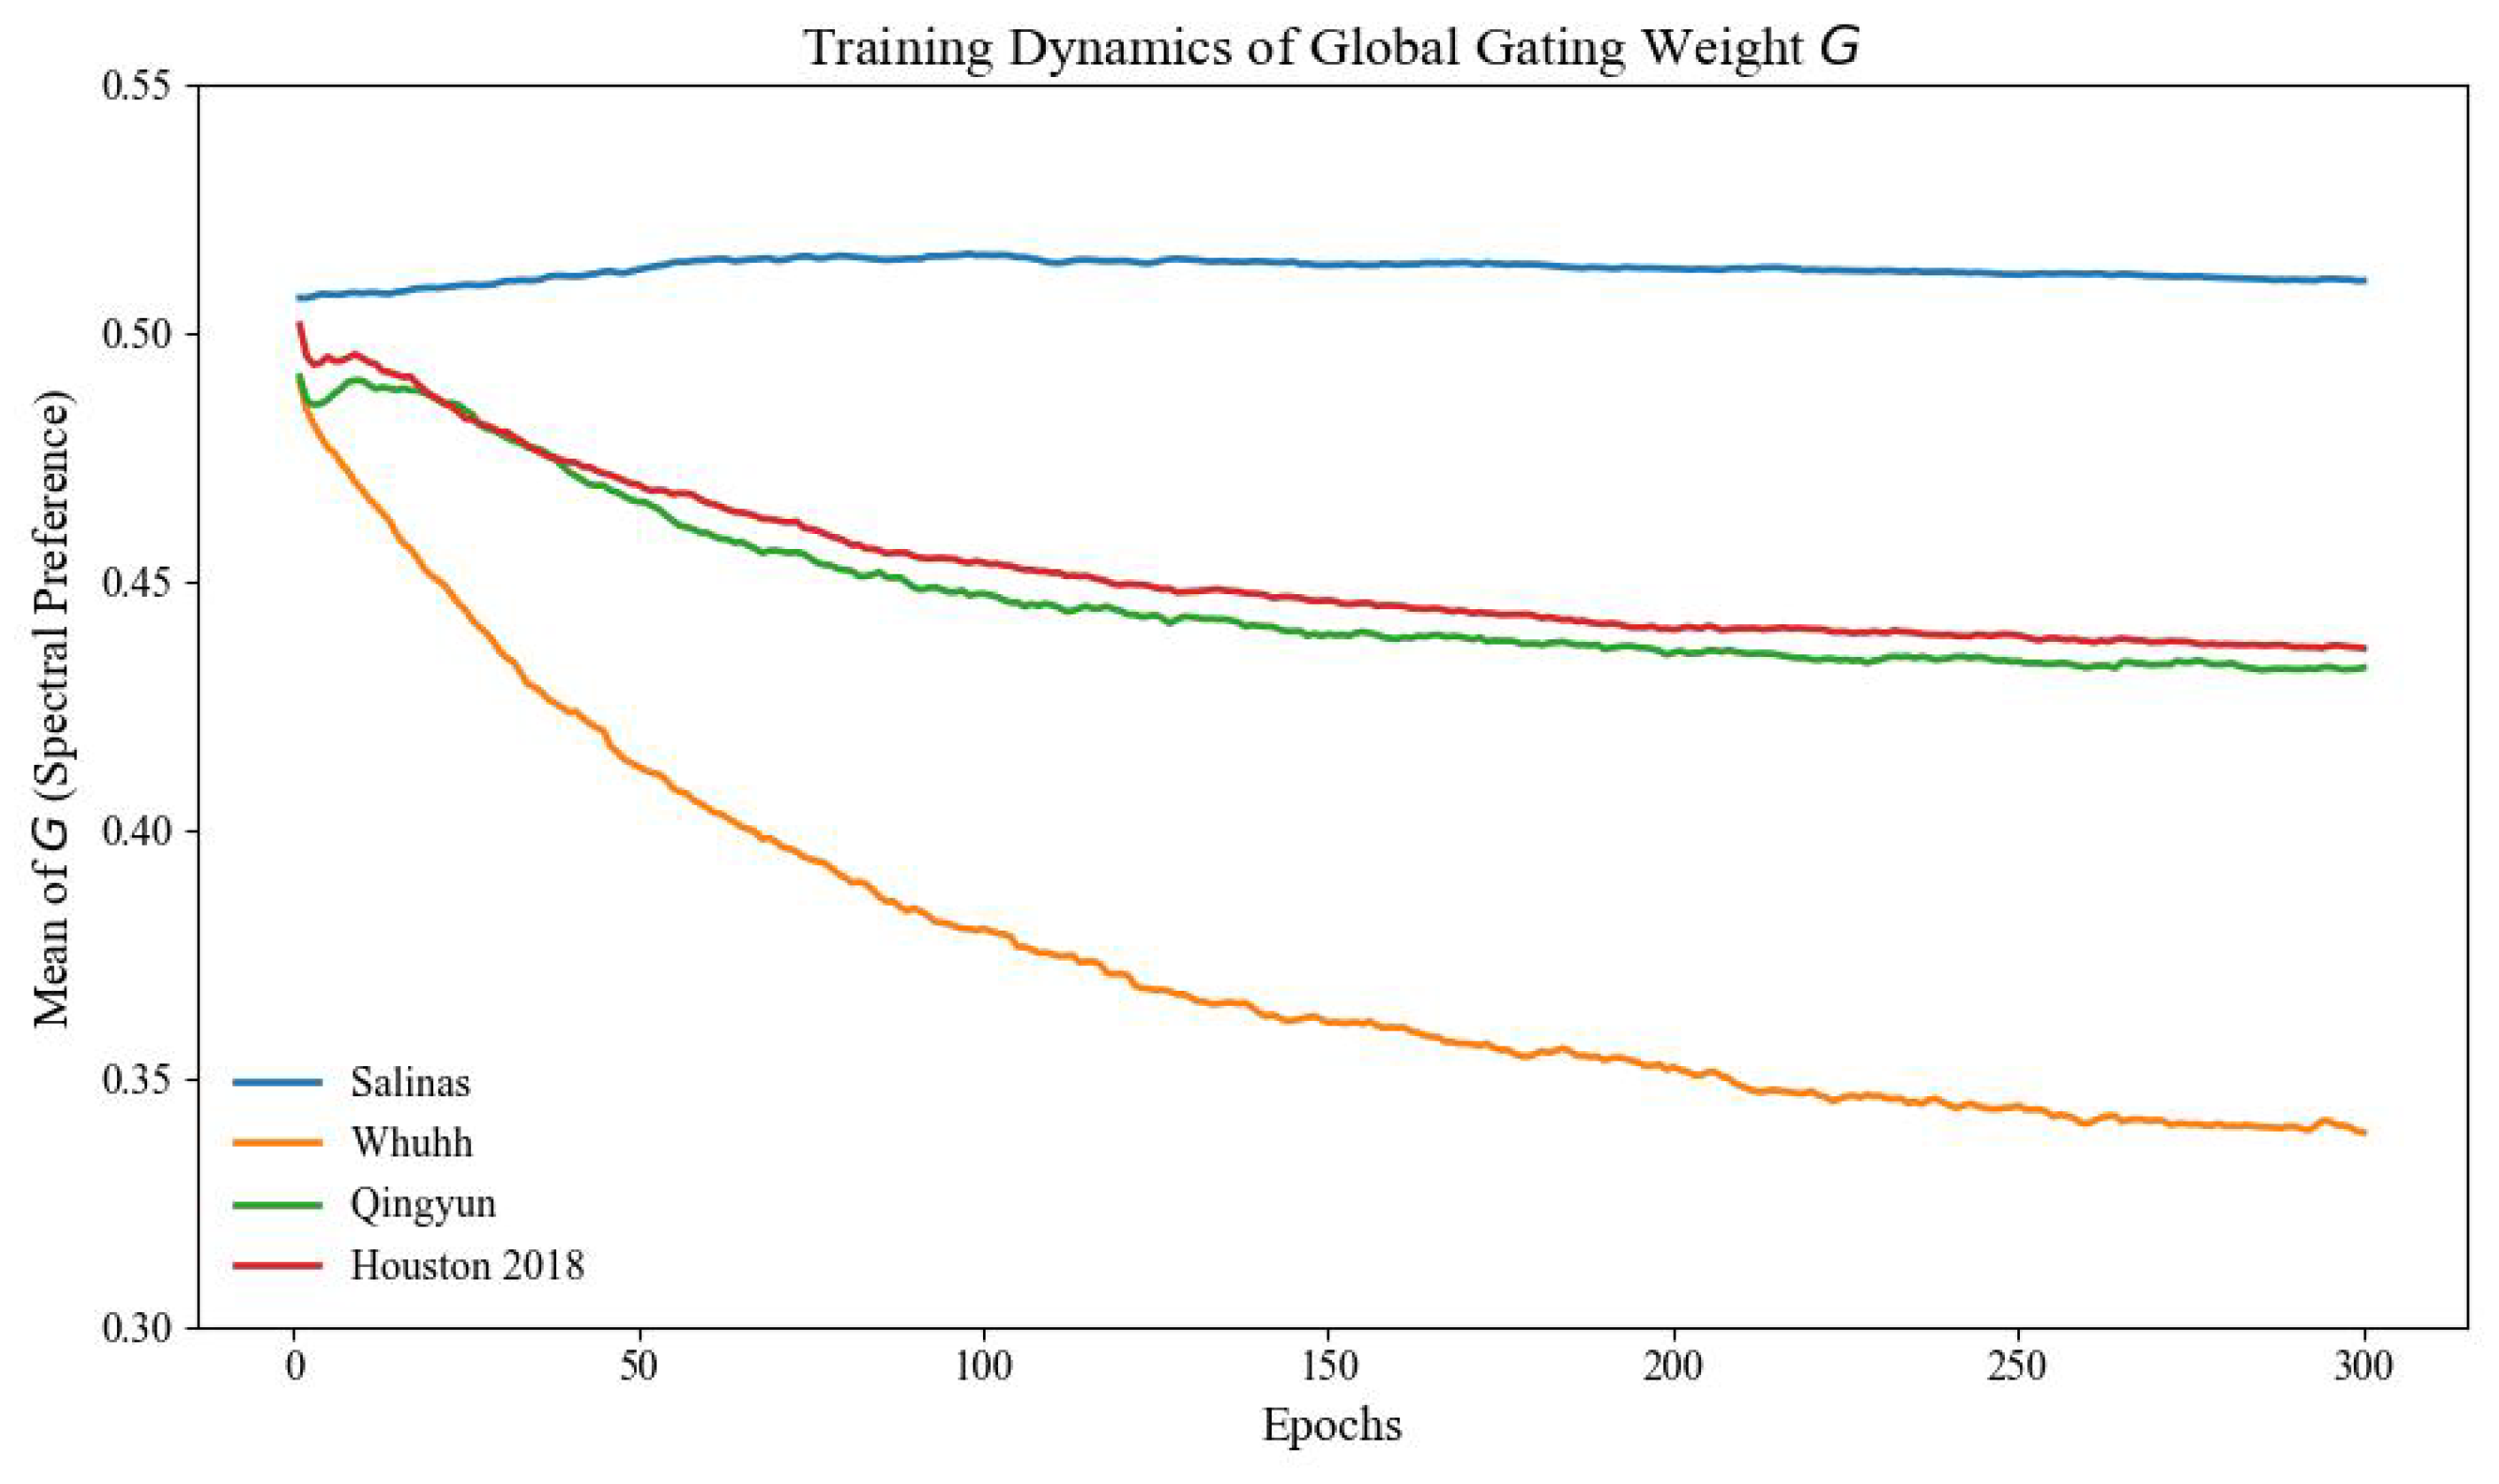
In the PA-SSCNN module, the gate weight we introduce is learned through a lightweight Sigmoid activated fully connected layer, which dynamically adjusts the fusion ratio of spectral and spatial branch features. During the training process, the weight is adaptively optimized using backpropagation algorithm based on the loss function of the final classification task. When G > 0.5, the model tends to emphasize spectral information. On the contrary, higher weights are assigned to spatial features. This dynamic gating mechanism enables PST Net to flexibly adjust the focus of feature extraction when facing datasets with different land distribution characteristics.
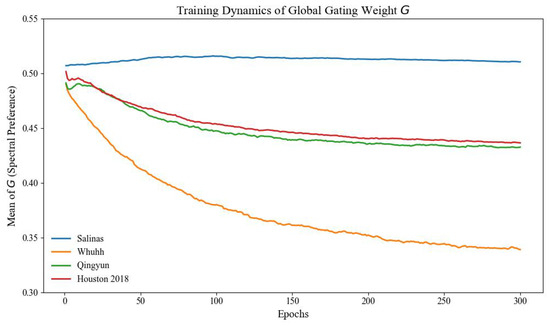
To verify the adaptive balancing ability of PA-SSCNN for different domain information, we recorded and analyzed the mean evolution of G values during training on four datasets. As shown in Figure 12, in the Qingyun and Houston datasets, the G value of the model fluctuates greatly in the early stages of training, but gradually converges to a stable value in the later stages. It is worth noting that although Whuhh belongs to the agricultural dataset, due to its complex spatial texture and land distribution characteristics, the model adaptively reduces the G value, thereby enhancing the utilization of spatial structural information to improve classification robustness. In the Salinas dataset with significant spectral differences but fragmented spatial textures, G > 0.5. The experimental results strongly demonstrate that PST Net can actively prioritize spectral or spatial information based on the feature distribution of specific scenes, thereby achieving robust classification performance.
Figure 12.
Evolution Curves of Average Gating Weight G During Training on Four Hyperspectral Datasets.
6.6. Sensitivity Analysis of Spatial Embedding Dimension d
In order to evaluate the effectiveness of the position encoding mechanism in dealing with complex spatial distributions, we analyzed the impact of spatial embedding dimension d on model accuracy under different values in the Qingyun dataset. The experimental results are shown in Table 8. As the dimension increases from 4 to 16, the model performance shows a trend of first increasing and then decreasing, with being the equilibrium point for achieving optimal classification performance. When processing the Qingyun dataset, shadow areas and complex urban geometric structures pose higher requirements for spatial feature extraction. When , due to the lower embedding dimension, the model is difficult to fully represent complex spatial relationships, resulting in limited classification accuracy. As d increases to 8, the model is able to more accurately capture local spatial correlations between pixels through learnable spatial coordinate embeddings, thereby improving representation robustness in the face of irregular geometric layouts. However, excessively high dimensions may introduce spatial features with low relevance to the current task, increasing the risk of redundant associations in the model when dealing with local irregularities. Therefore, can effectively balance the representation ability of spatial information with the generalization performance of the model, ensuring stable feature extraction in complex urban layouts.
Table 8.
The Impact of Spatial Position Embedding Dimension d on the Feature Extraction Capability of Qingyun Dataset.
7. Conclusions
This article proposes a network structure called PST Net based on the dual branch collaboration of Transformer and CNN to address the challenge of co modeling spectral and spatial information in hyperspectral image classification. Through the construction of adaptive spectral spatial tokens, parallel attention enhanced CNN branches, and cross level interactive fusion modules, efficient fusion of global dependencies and local details has been achieved. On four datasets, including two agricultural datasets and two urban datasets, PST Net achieved significant classification performance improvement with only 2% annotated samples, outperforming most comparison methods in overall accuracy, category average accuracy, and Kappa coefficient. The visualization results further demonstrate that the proposed method has significant advantages in suppressing noise, maintaining regional coherence, and boundary clarity. The ablation experiment confirms the effectiveness and complementarity of ASST, PA-SSCNN, and CHIB modules.
Although the proposed model demonstrates advantages in various classification metrics, its high computational complexity and inference time limit its direct application in real-time and low computing scenarios. Future work will focus on simplifying model structures, reducing computational redundancy, and introducing efficient inference strategies to enhance the practicality and deployment flexibility of models while ensuring accuracy.
Author Contributions
Conceptualization, S.Y. and Y.M.; methodology, J.F.; software, Y.M.; validation, X.F., S.G. and J.F.; formal analysis, W.X.; investigation, X.F.; resources, S.Y.; data curation, J.F.; writing—original draft preparation, Y.M.; writing—review and editing, S.Y. and J.F. All authors have read and agreed to the published version of the manuscript.
Funding
This work was supported in part by Field Scientific Observation and Research Station for Ecological Protection Red line in Poyang Lake Basin of the Ministry of Natural Resources Open Project Fund (Project Number: JXZSZ2025002).
Data Availability Statement
Data are contained within the article. If necessary, the author can provide.
Conflicts of Interest
The authors declare no conflicts of interest.
References
- Lu, B.; Dao, P.D.; Liu, J.; He, Y.; Shang, J. Recent Advances of Hyperspectral Imaging Technology and Applications in Agriculture. Remote Sens. 2020, 12, 2659. [Google Scholar] [CrossRef] [Scilit]
- Adão, T.; Hruška, J.; Pádua, L.; Bessa, J.; Peres, E.; Morais, R.; Sousa, J.J. Hyperspectral Imaging: A Review on UAV-Based Sensors, Data Processing and Applications for Agriculture and Forestry. Remote Sens. 2017, 9, 1110. [Google Scholar] [CrossRef] [Scilit]
- Signoroni, A.; Savardi, M.; Baronio, A.; Benini, S. Deep Learning Meets Hyperspectral Image Analysis: A Multidisciplinary Review. J. Imaging 2019, 5, 52. [Google Scholar] [CrossRef] [Scilit] [PubMed]
- Guha, A. 15—Mineral exploration using hyperspectral data. In Hyperspectral Remote Sensing; Pandey, P.C., Srivastava, P.K., Balzter, H., Bhattacharya, B., Petropoulos, G.P., Eds.; Earth Observation; Elsevier: Amsterdam, The Netherlands, 2020; pp. 293–318. [Google Scholar] [CrossRef] [Scilit]
- Ghrefat, H.; Awawdeh, M.; Howari, F.; Al-Rawabdeh, A. Chapter 12—Mineral exploration using multispectral and hyperspectral remote sensing data. In Geoinformatics for Geosciences; Stathopoulos, N., Tsatsaris, A., Kalogeropoulos, K., Eds.; Earth Observation; Elsevier: Amsterdam, The Netherlands, 2023; pp. 197–222. [Google Scholar] [CrossRef] [Scilit]
- Stuart, M.B.; McGonigle, A.J.S.; Willmott, J.R. Hyperspectral Imaging in Environmental Monitoring: A Review of Recent Developments and Technological Advances in Compact Field Deployable Systems. Sensors 2019, 19, 3071. [Google Scholar] [CrossRef] [Scilit]
- Shimoni, M.; Haelterman, R.; Perneel, C. Hyperspectral Imaging for Military and Security Applications: Combining Myriad Processing and Sensing Techniques. IEEE Geosci. Remote Sens. Mag. 2019, 7, 101–117. [Google Scholar] [CrossRef] [Scilit]
- Gross, W.; Queck, F.; Vögtli, M.; Schreiner, S.; Kuester, J.; Böhler, J.; Mispelhorn, J.; Kneubuehler, M.; Middelmann, W. A multi-temporal hyperspectral target detection experiment: Evaluation of military setups. In Target and Background Signatures VII; SPIE: Bellingham, WA, USA, 2021; p. 3. [Google Scholar] [CrossRef] [Scilit]
- Pandey, P.C.; Balzter, H.; Srivastava, P.K.; Petropoulos, G.P.; Bhattacharya, B. 21—Future perspectives and challenges in hyperspectral remote sensing. In Hyperspectral Remote Sensing; Pandey, P.C., Srivastava, P.K., Balzter, H., Bhattacharya, B., Petropoulos, G.P., Eds.; Earth Observation; Elsevier: Amsterdam, The Netherlands, 2020; pp. 429–439. [Google Scholar] [CrossRef] [Scilit]
- Zhang, Y.; Cao, G.; Li, X.; Wang, B.; Fu, P. Active Semi-Supervised Random Forest for Hyperspectral Image Classification. Remote Sens. 2019, 11, 2974. [Google Scholar] [CrossRef] [Scilit]
- Rajarajeswari, P. Hyperspectral Image Classification by Using K-Nearest Neighbor Algorithm. Int. J. Psychosoc. Rehabil. 2020, 24, 5068–5074. [Google Scholar] [CrossRef] [Scilit]
- Okwuashi, O.; Ndehedehe, C.E. Deep support vector machine for hyperspectral image classification. Pattern Recognit. 2020, 103, 107298. [Google Scholar] [CrossRef] [Scilit]
- Yu, S.; Jia, S.; Xu, C. Convolutional neural networks for hyperspectral image classification. Neurocomputing 2017, 219, 88–98. [Google Scholar] [CrossRef] [Scilit]
- Li, J.; Zhao, X.; Li, Y.; Du, Q.; Xi, B.; Hu, J. Classification of Hyperspectral Imagery Using a New Fully Convolutional Neural Network. IEEE Geosci. Remote Sens. Lett. 2018, 15, 292–296. [Google Scholar] [CrossRef] [Scilit]
- Roy, S.K.; Krishna, G.; Dubey, S.R.; Chaudhuri, B.B. HybridSN: Exploring 3-D–2-D CNN Feature Hierarchy for Hyperspectral Image Classification. IEEE Geosci. Remote Sens. Lett. 2020, 17, 277–281. [Google Scholar] [CrossRef] [Scilit]
- Ge, Z.; Cao, G.; Li, X.; Fu, P. Hyperspectral Image Classification Method Based on 2D–3D CNN and Multibranch Feature Fusion. IEEE J. Sel. Top. Appl. Earth Obs. Remote Sens. 2020, 13, 5776–5788. [Google Scholar] [CrossRef] [Scilit]
- He, X.; Chen, Y.; Lin, Z. Spatial-Spectral Transformer for Hyperspectral Image Classification. Remote Sens. 2021, 13, 498. [Google Scholar] [CrossRef] [Scilit]
- He, J.; Zhao, L.; Yang, H.; Zhang, M.; Li, W. HSI-BERT: Hyperspectral Image Classification Using the Bidirectional Encoder Representation From Transformers. IEEE Trans. Geosci. Remote Sens. 2020, 58, 165–178. [Google Scholar] [CrossRef] [Scilit]
- Hong, D.; Gao, L.; Yao, J.; Zhang, B.; Plaza, A.; Chanussot, J. Graph Convolutional Networks for Hyperspectral Image Classification. IEEE Trans. Geosci. Remote Sens. 2021, 59, 5966–5978. [Google Scholar] [CrossRef] [Scilit]
- Sha, A.; Wang, B.; Wu, X.; Zhang, L. Semisupervised Classification for Hyperspectral Images Using Graph Attention Networks. IEEE Geosci. Remote Sens. Lett. 2021, 18, 157–161. [Google Scholar] [CrossRef] [Scilit]
- Kothari, N.S.; Meher, S.K.; Panda, G. Improved Spatial Information Based Semisupervised Classification of Remote Sensing Images. IEEE J. Sel. Top. Appl. Earth Obs. Remote Sens. 2020, 13, 329–340. [Google Scholar] [CrossRef] [Scilit]
- Duan, Y.; Hu, H.; Tang, M.; Chen, J.; Zeng, Z.; Li, J. CSMamba: A Multi-Scale Framework Integrating CNN with Superpixel-Level Mamba for Hyperspectral Image Classification. In Proceedings of the IGARSS 2025—2025 IEEE International Geoscience and Remote Sensing Symposiuml; IEEE: Piscataway, NJ, USA, 2025; pp. 7279–7283. [Google Scholar] [CrossRef] [Scilit]
- Yang, H.; Yu, H.; Hong, D.; Xu, Z.; Wang, Y.; Song, M. Hyperspectral Image Classification Based on Multi-Level Spectral-Spatial Transformer Network. In Proceedings of the 2022 12th Workshop on Hyperspectral Imaging and Signal Processing: Evolution in Remote Sensing (WHISPERS); IEEE: Piscataway, NJ, USA, 2022; pp. 1–4. [Google Scholar] [CrossRef] [Scilit]
- Roy, S.K.; Deria, A.; Shah, C.; Haut, J.M.; Du, Q.; Plaza, A. Spectral–Spatial Morphological Attention Transformer for Hyperspectral Image Classification. IEEE Trans. Geosci. Remote Sens. 2023, 61, 5503615. [Google Scholar] [CrossRef] [Scilit]
- Zhao, C.; Qin, B.; Feng, S.; Zhu, W.; Sun, W.; Li, W.; Jia, X. Hyperspectral Image Classification with Multi-Attention Transformer and Adaptive Superpixel Segmentation-Based Active Learning. IEEE Trans. Image Process. 2023, 32, 3606–3621. [Google Scholar] [CrossRef] [Scilit]
- Yang, C.; Duan, J.; Liu, X.; Zhang, L.; Sun, J.; Zhang, Y.; Ren, W. A Center-Focused Transformer for hyperspectral image classification. Eng. Appl. Artif. Intell. 2026, 167, 113813. [Google Scholar] [CrossRef] [Scilit]
- Qiao, X.; Roy, S.K.; Huang, W. Multiscale Neighborhood Attention Transformer with Optimized Spatial Pattern for Hyperspectral Image Classification. IEEE Trans. Geosci. Remote Sens. 2023, 61, 5523815. [Google Scholar] [CrossRef] [Scilit]
- Qiao, X.; Huang, W. A Dual Frequency Transformer Network for Hyperspectral Image Classification. IEEE J. Sel. Top. Appl. Earth Obs. Remote Sens. 2023, 16, 10344–10358. [Google Scholar] [CrossRef] [Scilit]
- Yu, X.; Zhang, T. Hyperspectral Image Classification Utilizing Convolutional Neural Network and Transformer. In Proceedings of the 2025 6th International Conference on Geology, Mapping and Remote Sensing (ICGMRS); IEEE: Piscataway, NJ, USA, 2025; pp. 127–130. [Google Scholar] [CrossRef] [Scilit]
- Ouyang, E.; Li, B.; Hu, W.; Zhang, G.; Zhao, L.; Wu, J. When Multigranularity Meets Spatial–Spectral Attention: A Hybrid Transformer for Hyperspectral Image Classification. IEEE Trans. Geosci. Remote Sens. 2023, 61, 4401118. [Google Scholar] [CrossRef] [Scilit]
- Xu, R.; Dong, X.M.; Li, W.; Peng, J.; Sun, W.; Xu, Y. DBCTNet: Double Branch Convolution-Transformer Network for Hyperspectral Image Classification. IEEE Trans. Geosci. Remote Sens. 2024, 62, 5509915. [Google Scholar] [CrossRef] [Scilit]
- Zhou, Y.; Huang, X.; Yang, X.; Peng, J.; Ban, Y. DCTN: Dual-Branch Convolutional Transformer Network with Efficient Interactive Self-Attention for Hyperspectral Image Classification. IEEE Trans. Geosci. Remote Sens. 2024, 62, 5508616. [Google Scholar] [CrossRef] [Scilit]
- Qiao, X.; Yan, Q.; Huang, W. Hybrid CNN-Transformer Network with a Weighted MSE Loss for Global Sea Surface Wind Speed Retrieval From GNSS-R Data. IEEE Trans. Geosci. Remote Sens. 2025, 63, 4207013. [Google Scholar] [CrossRef] [Scilit]
- Sun, Z.; Zhi, S.; Li, R.; Xia, J.; Liu, Y.; Jiang, W. GDROS: A Geometry-Guided Dense Registration Framework for Optical–SAR Images Under Large Geometric Transformations. IEEE Trans. Geosci. Remote Sens. 2025, 63, 5650315. [Google Scholar] [CrossRef] [Scilit]
- Roy, S.K.; Deria, A.; Hong, D.; Rasti, B.; Plaza, A.; Chanussot, J. Multimodal Fusion Transformer for Remote Sensing Image Classification. IEEE Trans. Geosci. Remote Sens. 2023, 61, 5515620. [Google Scholar] [CrossRef] [Scilit]
- Yuan, D.; Yu, D.; Qian, Y.; Xu, Y.; Liu, Y. S2Former: Parallel Spectral–Spatial Transformer for Hyperspectral Image Classification. Electronics 2023, 12, 3937. [Google Scholar] [CrossRef] [Scilit]
- Liu, B.; Jia, Z.; Guo, P.; Kong, W. Hyperspectral Image Classification Based on Transposed Convolutional Neural Network Transformer. Electronics 2023, 12, 3879. [Google Scholar] [CrossRef] [Scilit]
- Zhao, Z.; Xu, X.; Li, S.; Plaza, A. Hyperspectral Image Classification Using Groupwise Separable Convolutional Vision Transformer Network. IEEE Trans. Geosci. Remote Sens. 2024, 62, 5511817. [Google Scholar] [CrossRef] [Scilit]
- Liu, H.; Li, W.; Xia, X.G.; Zhang, M.; Gao, C.Z.; Tao, R. Central Attention Network for Hyperspectral Imagery Classification. IEEE Trans. Neural Netw. Learn. Syst. 2023, 34, 8989–9003. [Google Scholar] [CrossRef] [Scilit]
- Liu, H.; Li, W.; Xia, X.G.; Zhang, M.; Tao, R. Multiarea Target Attention for Hyperspectral Image Classification. IEEE Trans. Geosci. Remote Sens. 2023, 61, 5524916. [Google Scholar] [CrossRef] [Scilit]
- Zhang, Y.; Li, W.; Zhang, M.; Wang, S.; Tao, R.; Du, Q. Graph Information Aggregation Cross-Domain Few-Shot Learning for Hyperspectral Image Classification. IEEE Trans. Neural Netw. Learn. Syst. 2024, 35, 1912–1925. [Google Scholar] [CrossRef] [Scilit]
- Li, J.; Zhang, Z.; Song, R.; Li, Y.; Du, Q. SCFormer: Spectral Coordinate Transformer for Cross-Domain Few-Shot Hyperspectral Image Classification. IEEE Trans. Image Process. 2024, 33, 840–855. [Google Scholar] [CrossRef] [Scilit]
- Xi, B.; Zhang, Y.; Li, J.; Li, Y.; Li, Z.; Chanussot, J. CTF-SSCL: CNN-Transformer for Few-Shot Hyperspectral Image Classification Assisted by Semisupervised Contrastive Learning. IEEE Trans. Geosci. Remote Sens. 2024, 62, 5532617. [Google Scholar] [CrossRef] [Scilit]
- Li, M.; Liu, J.; Fu, Y.; Zhang, Y.; Dou, D. Spectral Enhanced Rectangle Transformer for Hyperspectral Image Denoising. In Proceedings of the 2023 IEEE/CVF Conference on Computer Vision and Pattern Recognition (CVPR); IEEE: Piscataway, NJ, USA, 2023; pp. 5805–5814. [Google Scholar] [CrossRef] [Scilit]
- Ibañez, D.; Fernandez-Beltran, R.; Pla, F.; Yokoya, N. Masked Auto-Encoding Spectral–Spatial Transformer for Hyperspectral Image Classification. IEEE Trans. Geosci. Remote Sens. 2022, 60, 5542614. [Google Scholar] [CrossRef] [Scilit]
- Mei, S.; Li, X.; Liu, X.; Cai, H.; Du, Q. Hyperspectral Image Classification Using Attention-Based Bidirectional Long Short-Term Memory Network. IEEE Trans. Geosci. Remote Sens. 2022, 60, 5509612. [Google Scholar] [CrossRef] [Scilit]
- Ben Hamida, A.; Benoit, A.; Lambert, P.; Ben Amar, C. 3-D Deep Learning Approach for Remote Sensing Image Classification. IEEE Trans. Geosci. Remote Sens. 2018, 56, 4420–4434. [Google Scholar] [CrossRef] [Scilit]
- He, M.; Li, B.; Chen, H. Multi-scale 3D deep convolutional neural network for hyperspectral image classification. In Proceedings of the 2017 IEEE International Conference on Image Processing (ICIP); IEEE: Piscataway, NJ, USA, 2017; pp. 3904–3908. [Google Scholar] [CrossRef] [Scilit]
- Zhu, M.; Jiao, L.; Liu, F.; Yang, S.; Wang, J. Residual Spectral–Spatial Attention Network for Hyperspectral Image Classification. IEEE Trans. Geosci. Remote Sens. 2021, 59, 449–462. [Google Scholar] [CrossRef] [Scilit]
- Hong, D.; Han, Z.; Yao, J.; Gao, L.; Zhang, B.; Plaza, A.; Chanussot, J. SpectralFormer: Rethinking Hyperspectral Image Classification with Transformers. IEEE Trans. Geosci. Remote Sens. 2022, 60, 5518615. [Google Scholar] [CrossRef] [Scilit]
- Sun, L.; Zhao, G.; Zheng, Y.; Wu, Z. Spectral–Spatial Feature Tokenization Transformer for Hyperspectral Image Classification. IEEE Trans. Geosci. Remote Sens. 2022, 60, 5522214. [Google Scholar] [CrossRef] [Scilit]
- Xu, Y.; Xu, Y.; Jiao, H.; Gao, Z.; Zhang, L. S3ANet: Spatial–Spectral Self-Attention Learning Network for Defending Against Adversarial Attacks in Hyperspectral Image Classification. IEEE Trans. Geosci. Remote Sens. 2024, 62, 5512913. [Google Scholar] [CrossRef] [Scilit]
- Liu, Q.; Fan, S.; Li, W.; Wei, S.; Jiang, Y. A collaborative network via multi-head sparse and high-low frequency interaction for hyperspectral image classification. Neurocomputing 2025, 625, 129541. [Google Scholar] [CrossRef] [Scilit]

Disclaimer/Publisher’s Note: The statements, opinions and data contained in all publications are solely those of the individual author(s) and contributor(s) and not of MDPI and/or the editor(s). MDPI and/or the editor(s) disclaim responsibility for any injury to people or property resulting from any ideas, methods, instructions or products referred to in the content. |
© 2026 by the authors. Licensee MDPI, Basel, Switzerland. This article is an open access article distributed under the terms and conditions of the Creative Commons Attribution (CC BY) license.