


Highlights
What are the main findings?
- Nine deep learning models were compared, with four demonstrating excellent performance in sparse Populus euphratica forests identification: U-Net, U-Net++, MA-Net, and DeepLabV3+ all achieved IoU values exceeding 75%, making them suitable for sparse target extraction.
- A Sparse Populus euphratica forests Segmentation Network (SPS-Net) is proposed, which integrates multi-scale feature extraction and residual connections, achieving an IoU of 80%.
What is the implication of the main finding?
- This study provides a fine identification solution for sparse Populus euphratica forests by integrating GF-2 satellite imagery and deep learning models.
Abstract
Populus euphratica is a critical constructive species in arid desert regions, serving as a “natural barrier” for oasis protection. The sustainable management of Populus euphratica forests is directly related to regional ecological security, and the fine identification of sparse Populus euphratica forests is essential for the conservation of natural Populus euphratica forests. Currently, most mapping studies on Populus euphratica distribution focus on the extraction of dense, contiguous Populus euphratica forests, with insufficient attention paid to the identification of sparse Populus euphratica forests. This study utilizes Gaofen-2 (GF-2) satellite imagery as the data source and takes a typical sparse Populus euphratica forests distribution area in the Tarim River Basin as the study site. It systematically evaluates the performance of nine mainstream deep learning models, including U-Net, DeepLabV3+, and SegFormer, in the task of sparse Populus euphratica forests identification. The results indicate that: (1) The false-color sample set, synthesized from near-infrared, red, and green bands, contributes to improved model accuracy. Compared to the true-color (red, green, blue bands) dataset, the average Intersection over Union (IoU) of the nine models shows a relative improvement of approximately 20%. (2) For the sparse Populus euphratica forests identification task based on the false-color dataset, four models—U-Net, U-Net++, MA-Net, and DeepLabV3+—exhibited excellent performance, with IoU exceeding 75%. (3) Using U-Net as the baseline model, this study integrated the max-pooling indices mechanism, atrous spatial pyramid pooling, and residual connection modules to construct a semantic segmentation network tailored for sparse Populus euphratica forests, named Sparse Populus euphratica Segmentation Network (SPS-Net). This model achieved an IoU of 80%, a relative improvement of approximately 6.3% over the baseline model, and demonstrated good stability in large-scale classification tests. The identification scheme for sparse Populus euphratica forests constructed using GF-2 imagery and deep learning models proposed in this study can provide effective technical support for the refined monitoring and protection of natural Populus euphratica forests.
1. Introduction
Populus euphratica is the only tree species capable of forming natural forests in arid desert regions and serves as a crucial constructive species for constructing desert ecosystems [1,2,3]. Populus euphratica exhibits strong stress resistance and provides multiple ecological services, including water conservation, windbreak and sand fixation, soil and water retention, and microclimate regulation [4,5,6,7]. It acts as a “natural barrier” protecting oases and is vital for maintaining the stability of oasis ecosystems [8,9,10]. It plays an irreplaceable role in maintaining desert material and energy balance, inhibiting soil salinization, preserving biodiversity, and curbing desertification [1,11,12,13,14]. The sustainable management of Populus euphratica forests is directly related to regional ecological security [1,2,3,15]. Accurate spatial distribution information of Populus euphratica is a crucial data foundation for its monitoring and protection [5]. Tending young forests and protecting degraded forests are core tasks in natural Populus euphratica forests conservation [13]. However, these stands requiring urgent protection typically appear on remote sensing images as sparse, fragmented forests with low coverage. Therefore, achieving fine-scale mapping of sparse Populus euphratica forests is a fundamental prerequisite for accurately locating protection targets and assessing stand regeneration potential [4,16]. Conducting research on identifying sparse Populus euphratica forests is of significant value for strengthening the protection of natural Populus euphratica and curbing its degradation trend.
Remote sensing technology has become a core method for large-scale vegetation distribution mapping due to its advantages of macroscopic coverage, speed, and repeatable observations [17,18,19,20]. Numerous studies have been conducted by scholars globally on the mapping of Populus euphratica distribution, achieving significant progress. From a spatial scale perspective, advancements have been realized, evolving from small-scale oasis mapping to large-scale, rapid mapping across entire river basins. Early research primarily focused on mapping at small-area scales, such as oases [5]; currently, the Google Earth Engine (GEE) platform enables the rapid extraction of dense Populus euphratica forests at the scale of entire river basins or even the whole Tarim Basin [21,22]. Methodologically, traditional machine learning algorithms, represented by Random Forest, have shown excellent performance in identifying large, contiguous areas of dense Populus euphratica forests and have become relatively mature technical solutions for dense forest mapping [23,24,25]. In recent years, the introduction of deep learning has provided new approaches for fine Populus euphratica mapping. Wang et al. [26] used WorldView-2 multispectral imagery and built an individual tree segmentation model for sparse Populus euphratica forests based on deep learning semantic segmentation models, achieving an overall accuracy of 88.5–90.2%. Li et al. [16] based on Sentinel-1/2 data, constructed the STP-Net model integrating spatiotemporal information, effectively extracting the spatial distribution of Populus euphratica in the mainstream area of the Tarim River with an identification accuracy of 88%.
Regarding thematic mapping research on Populus euphratica in desert areas, existing studies have proposed a series of solutions with broad application value, providing solid data support for the sustainable management of natural Populus euphratica forests. However, their focus has primarily been on large, contiguous areas of dense Populus euphratica forests with significant features [5,16,21,22,23,24]. For sparse Populus euphratica forests that are scattered, have small crown widths, and are easily confused with the background in images, existing research still generally pays insufficient attention. Conducting fine identification of sparse Populus euphratica forests is a weak link urgently needing breakthrough in the current field of Populus euphratica distribution mapping. Overall, accurately identifying sparse Populus euphratica forests on a large scale faces the following core challenges: (1) Insufficient image spatial resolution and scarcity of effective target features. Sparse Populus euphratica trees mainly appear as small targets in images, characterized by a low proportion of target pixels and strong background interference [27,28]. The feature information they contain (e.g., spectral and textural information) is relatively scarce [29], and the effective features extracted by models are weak [30]. It is difficult to learn robust and discriminative Populus euphratica-specific features from limited pixels [16], making them prone to confusion with image noise, background textures, and similar small objects [31,32]. (2) Scattered and discontinuous distribution of sparse Populus euphratica forests [14,33], with targets separated by large areas of irrelevant background. This sparse distribution characteristic leads to a typical class imbalance problem in remote sensing image interpretation—sparse targets are surrounded by large background areas [34,35]. During training, models are prone to bias, where features of the majority class (background) dominate the learning process, while features of the minority class (sparse trees) are suppressed [36]. This results in models achieving good pixel accuracy even when classifying some areas as background. Concurrently, some model frameworks have limited receptive fields, hindering their ability to effectively capture global contextual information [35,37]. Models struggle to utilize surrounding pixel information for auxiliary judgment, ultimately leading to missed detection of sparse Populus euphratica trees. (3) “Physical disappearance” of small targets. To obtain high-level semantic features and expand the receptive field, mainstream Convolutional Neural Networks typically employ multiple downsampling operations like pooling or strided convolutions [38]. While compressing feature map size, this also leads to irreversible loss of spatial information [39,40]. For large targets, key features can still be retained after multiple downsampling layers; however, for small targets like sparse Populus euphratica trees, their representational information is easily overwhelmed by background noise or even disappears completely after multiple downsampling steps [41,42]. In other words, in the deep feature maps crucial for target classification and localization, small targets undergo “physical disappearance” [43,44]. Subsequent classification and regression branches thus cannot receive effective target features, ultimately resulting in missed and false detections of sparse Populus euphratica trees [45,46].
Deep learning models excel at utilizing high spatial resolution images. Through powerful spatial feature learning and multi-scale fusion mechanisms [47,48], they can “delineate” isolated targets with weak spectral signals and scattered distributions from complex desert backgrounds [47], thereby achieving fine-scale identification of small targets over large areas—a task difficult for traditional methods. GF-2 data offers favorable spatial resolution (up to 0.8 m) and a relatively large swath width of 45 km, providing advantages for identifying large-scale sparse Populus euphratica forests [49]. In sparse Populus euphratica forests extraction tasks, the resolution of GF-2 imagery matches the distribution characteristics and crown sizes of sparse Populus euphratica, resulting in relatively fewer mixed pixels and clearer outlines and boundaries of sparse stands. However, GF-2 imagery has relatively limited spectral information, equipped with only one near-infrared band centered around 845 nm. Leveraging deep learning models to deeply mine spatial information and compensate for the lack of spectral information will be an effective solution for sparse forests extraction. Given this, this paper uses GF-2 satellite imagery, focuses on identifying sparse Populus euphratica forests, selects typical sparse Populus euphratica distribution areas in the Tarim River Basin as study sites, and evaluates the applicability of various mainstream deep learning models. The core objectives of this research are as follows: (1) Select nine mainstream deep learning models, compare their performance in the sparse Populus euphratica identification task, and evaluate their suitability for extracting sparse Populus euphratica based on GF-2 data. (2) Using the optimal deep learning model as a baseline, construct a Sparse Populus euphratica Segmentation Network (SPS-Net) tailored to the spatial distribution characteristics of desert Populus euphratica, and further test the model’s performance in different scenarios. This aims to provide a reference for the accurate identification of sparse Populus euphratica forests and offer data support for the protection of natural Populus euphratica stands.
2. Study Area and Data
2.1. Study Area
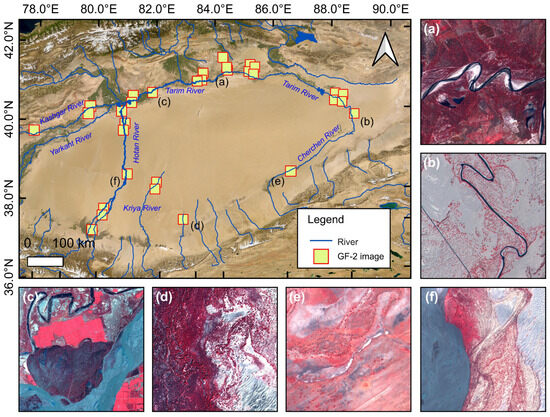
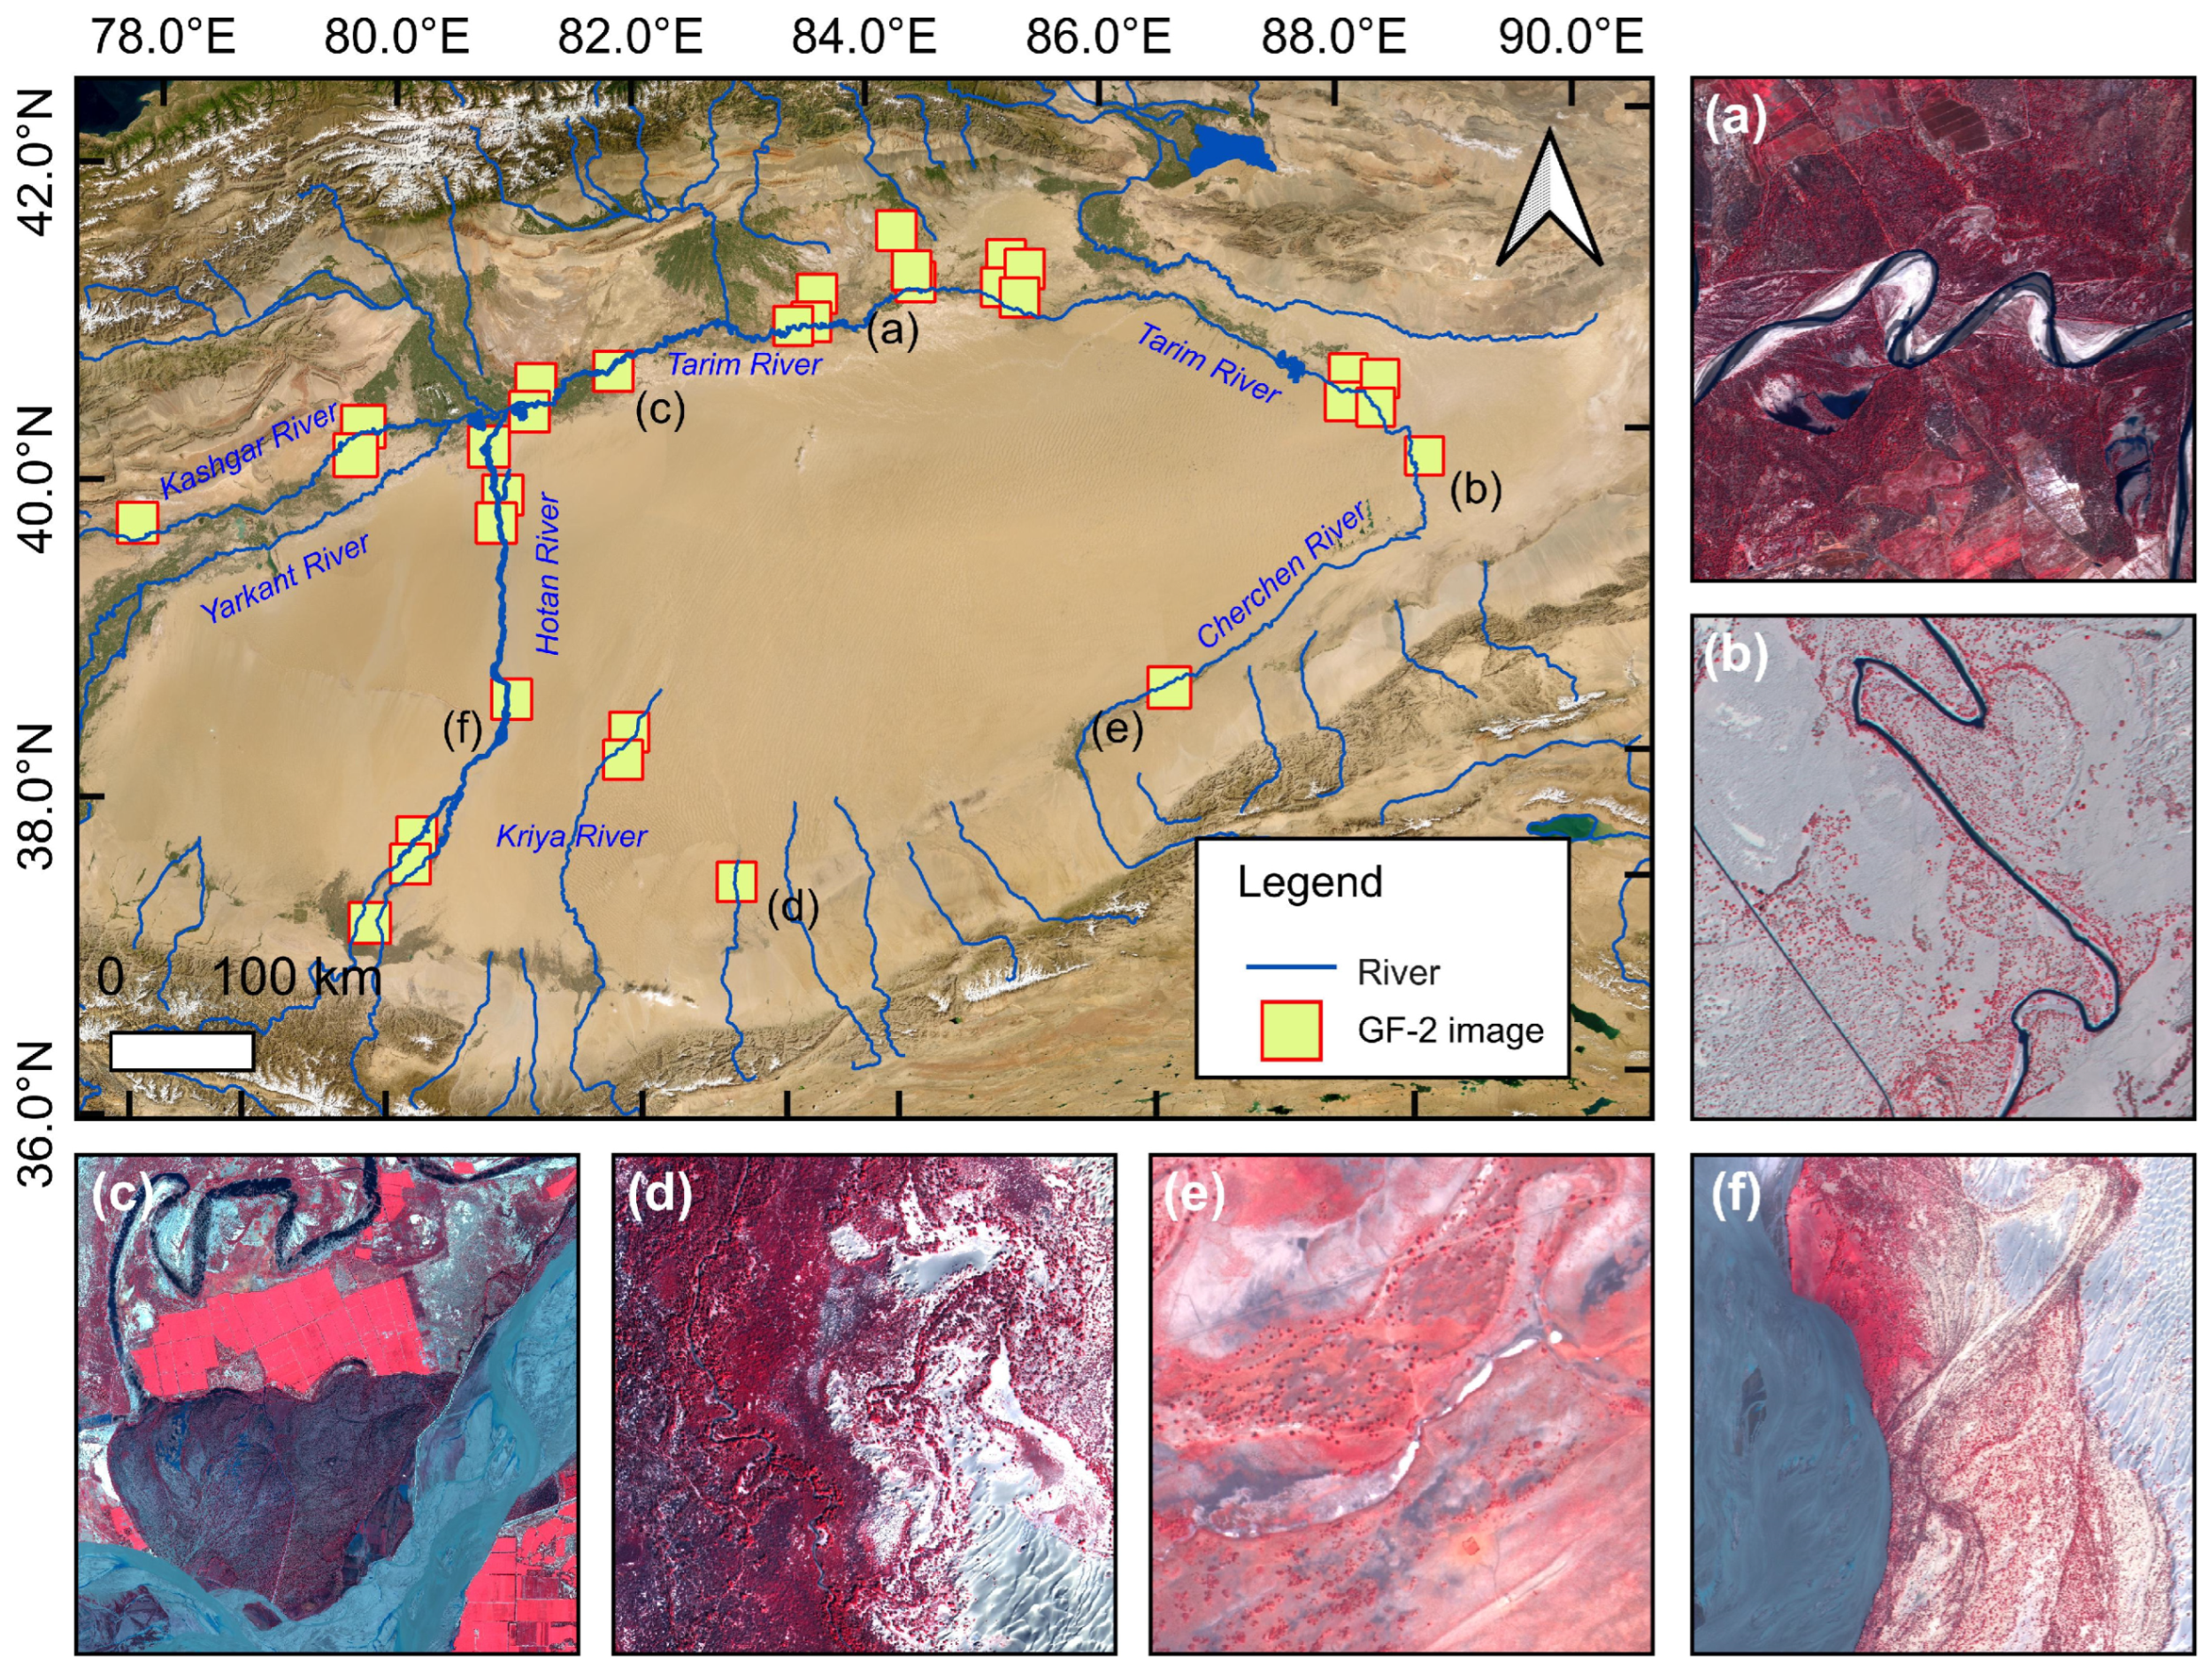
Typical sparse Populus euphratica forests distribution areas within the Tarim River Basin were selected as the study area (Figure 1). The Tarim River Basin is the region with the most concentrated global distribution of Populus euphratica, hosting approximately 60% of the world’s Populus euphratica [6,11,21]. The Tarim River mainstream is formed by the confluence of the Aksu, Yarkant, and Hotan Rivers. The 33 scenes of GF-2 imagery used in the study are primarily distributed in oasis zones along the Tarim River mainstream, Hotan River, Keriya River, and Qarqan River basins. The selected imagery contains rich land cover categories, encompassing desert, shrubland, farmland, rivers, and other landscapes, ensuring the study area’s broad representativeness in the sparse Populus euphratica forests identification task.
Figure 1.
Location of GF-2 imagery used in this study. (a,c,d) show Populus euphratica forests near rivers. (b,e,f) show Populus euphratica forests in desert areas. (a–f) are displayed using false-color composites.
2.2. Gaofen-2 Satellite Data
Thirty-three scenes of GF-2 imagery with minimal cloud cover (cloud coverage < 5%) from typical areas within the Tarim River Basin were collected and compiled, with imaging dates ranging from July 2022 to October 2023. Each GF-2 scene includes one panchromatic image and one multispectral image. The panchromatic image has a nadir spatial resolution of approximately 0.8 m, offering detailed spatial texture. The multispectral image includes Red, Green, Blue, and Near-infrared bands, with a nadir spatial resolution of about 3.2 m and an image swath of approximately 45 km. The specific band information for GF-2 imagery is shown below (Table 1).
Table 1.
GF-2 Image Band Information.
3. Methodology
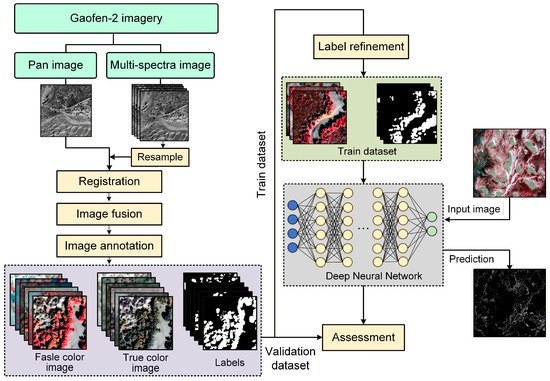
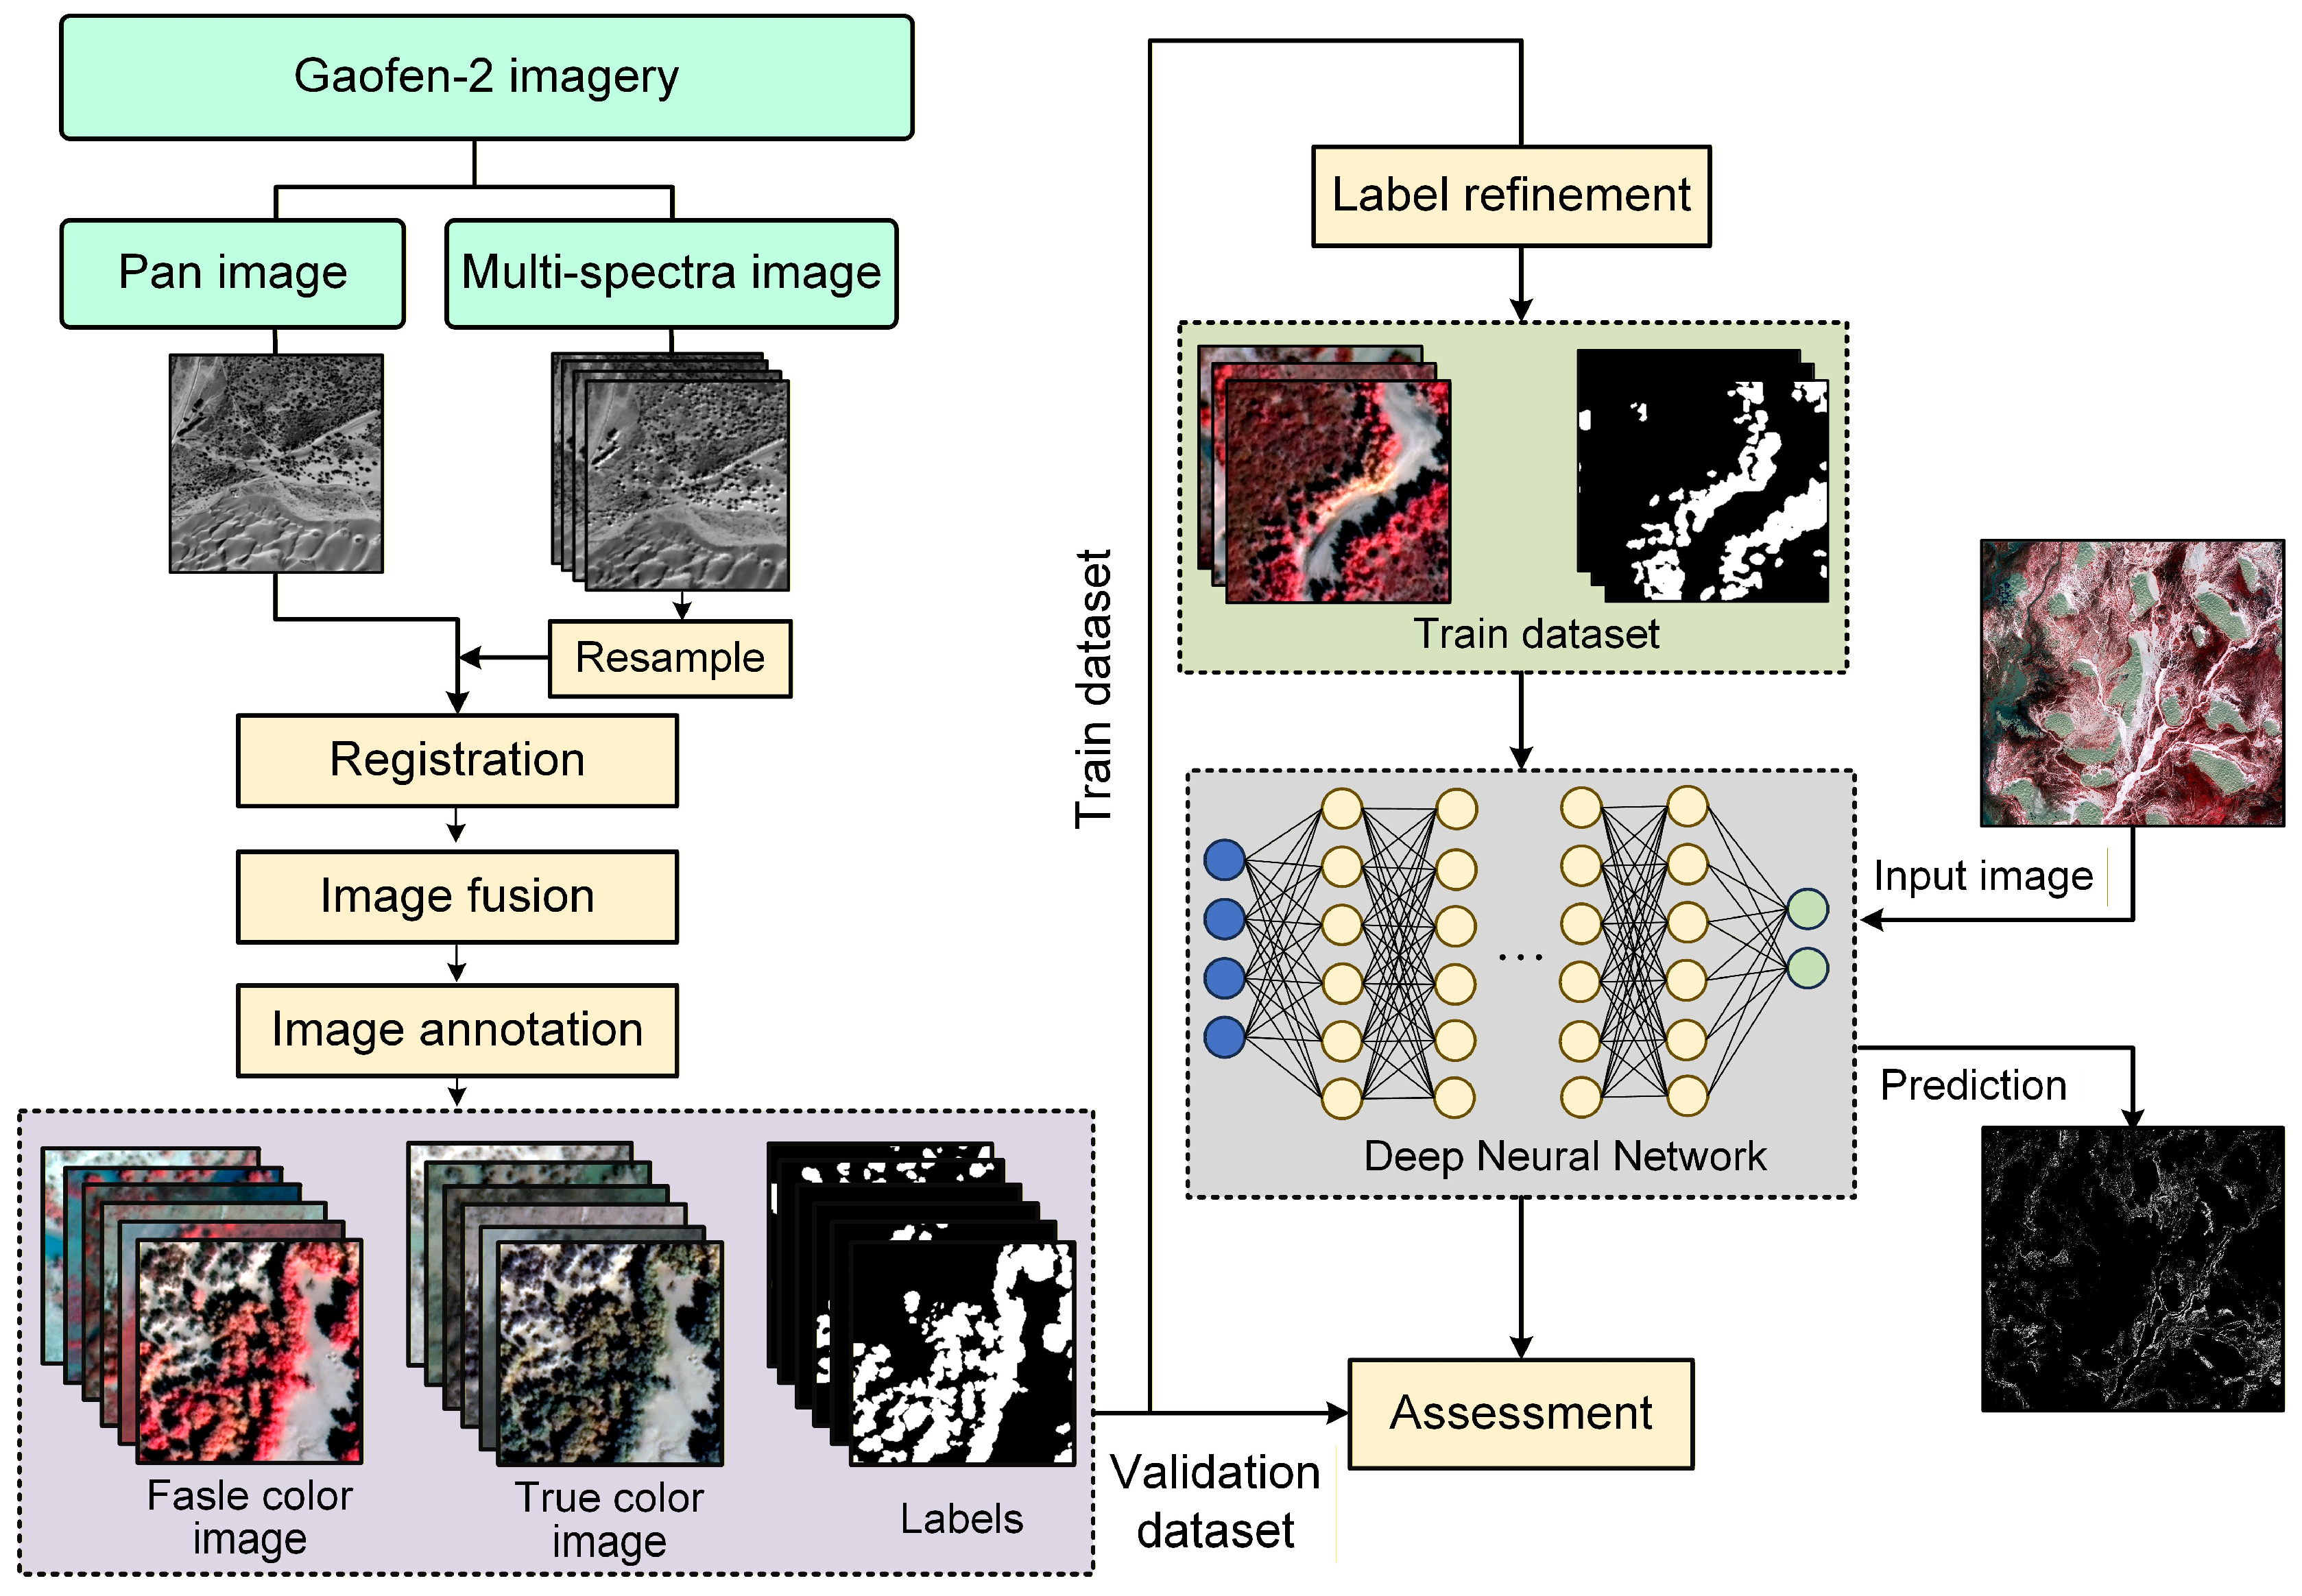
This study utilized GF-2 satellite imagery as the data source (Figure 2). First, Gram-Schmidt fusion was applied to the panchromatic and multispectral images to obtain multispectral data with a 0.8-m resolution. A high-resolution Populus euphratica dataset comprising 3299 samples was constructed, and deep learning models were employed to assist in optimizing the manually annotated labels. The study systematically evaluated the accuracy performance of nine mainstream semantic segmentation models, including DeepLabV3+, MA-Net, SegFormer, U-Net++, and U-Net, on two datasets: true-color and false-color composites. Considering the structural characteristics and improvement potential of each model, U-Net was ultimately selected as the baseline model (the rationale for selecting the baseline model is detailed in Section 4.2). Through targeted improvements incorporating multi-scale feature extraction, max-pooling indices, and residual connections, a network for identifying sparse Populus euphratica forests—SPS-Net—was developed. Multiple metrics, including IoU, Dice coefficient, precision, and recall, were employed to comprehensively evaluate the model’s identification performance.
Figure 2.
Technical flowchart of the study.
3.1. Image Fusion of GF-2 Data
Panchromatic and multispectral image fusion was performed on the original GF-2 imagery to obtain 0.8 m resolution multispectral images. This study employed the Gram-Schmidt Pan Sharpening algorithm for image fusion. The specific steps are as follows:
(1) Image Resampling and Geometric Registration
Resampling and georeferencing were performed on 33 scenes of GF-2 L1-A level imagery. First, the cubic convolution interpolation method, which is more effective in preserving texture, was selected for grayscale resampling to resample the multispectral images to a 0.8-m resolution, consistent with the panchromatic images. Subsequently, using the panchromatic image as a reference, precise registration of the resampled multispectral images was conducted in ENVI software (version 5.6). After registration, the geolocation error between the panchromatic and multispectral images was controlled to within 1 pixel.
(2) Image Fusion
The Gram-Schmidt (GS) pan-sharpening method was used to fuse the registered multispectral and panchromatic images. The GS transform is an image fusion method based on multi-dimensional linear orthogonalization. It simulates the panchromatic band as the first component, performs an orthogonal transformation on the multispectral imagery, replaces the first component, and then applies the inverse transformation [50,51]. This process enhances spatial resolution while preserving the original spectral information to the greatest extent possible [51]. This study utilized the GS Pan-sharpening tool in ENVI software to complete the fusion process, ultimately generating 0.8-m resolution multispectral images. The fused images possess both rich spectral information and detailed spatial texture, facilitating the fine extraction of sparse Populus euphratica forests. For the fused image, we further used a linear stretching technique with two standard deviations to stretch the original image’s DN value to 0–255, thereby enhancing the image’s contrast.
3.2. Construction of the Training Sample Set
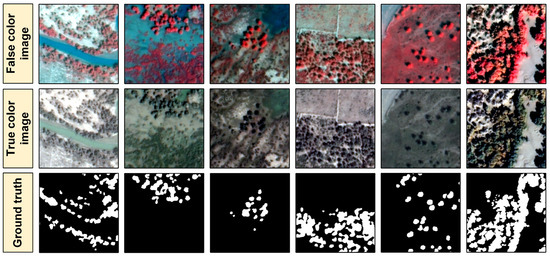
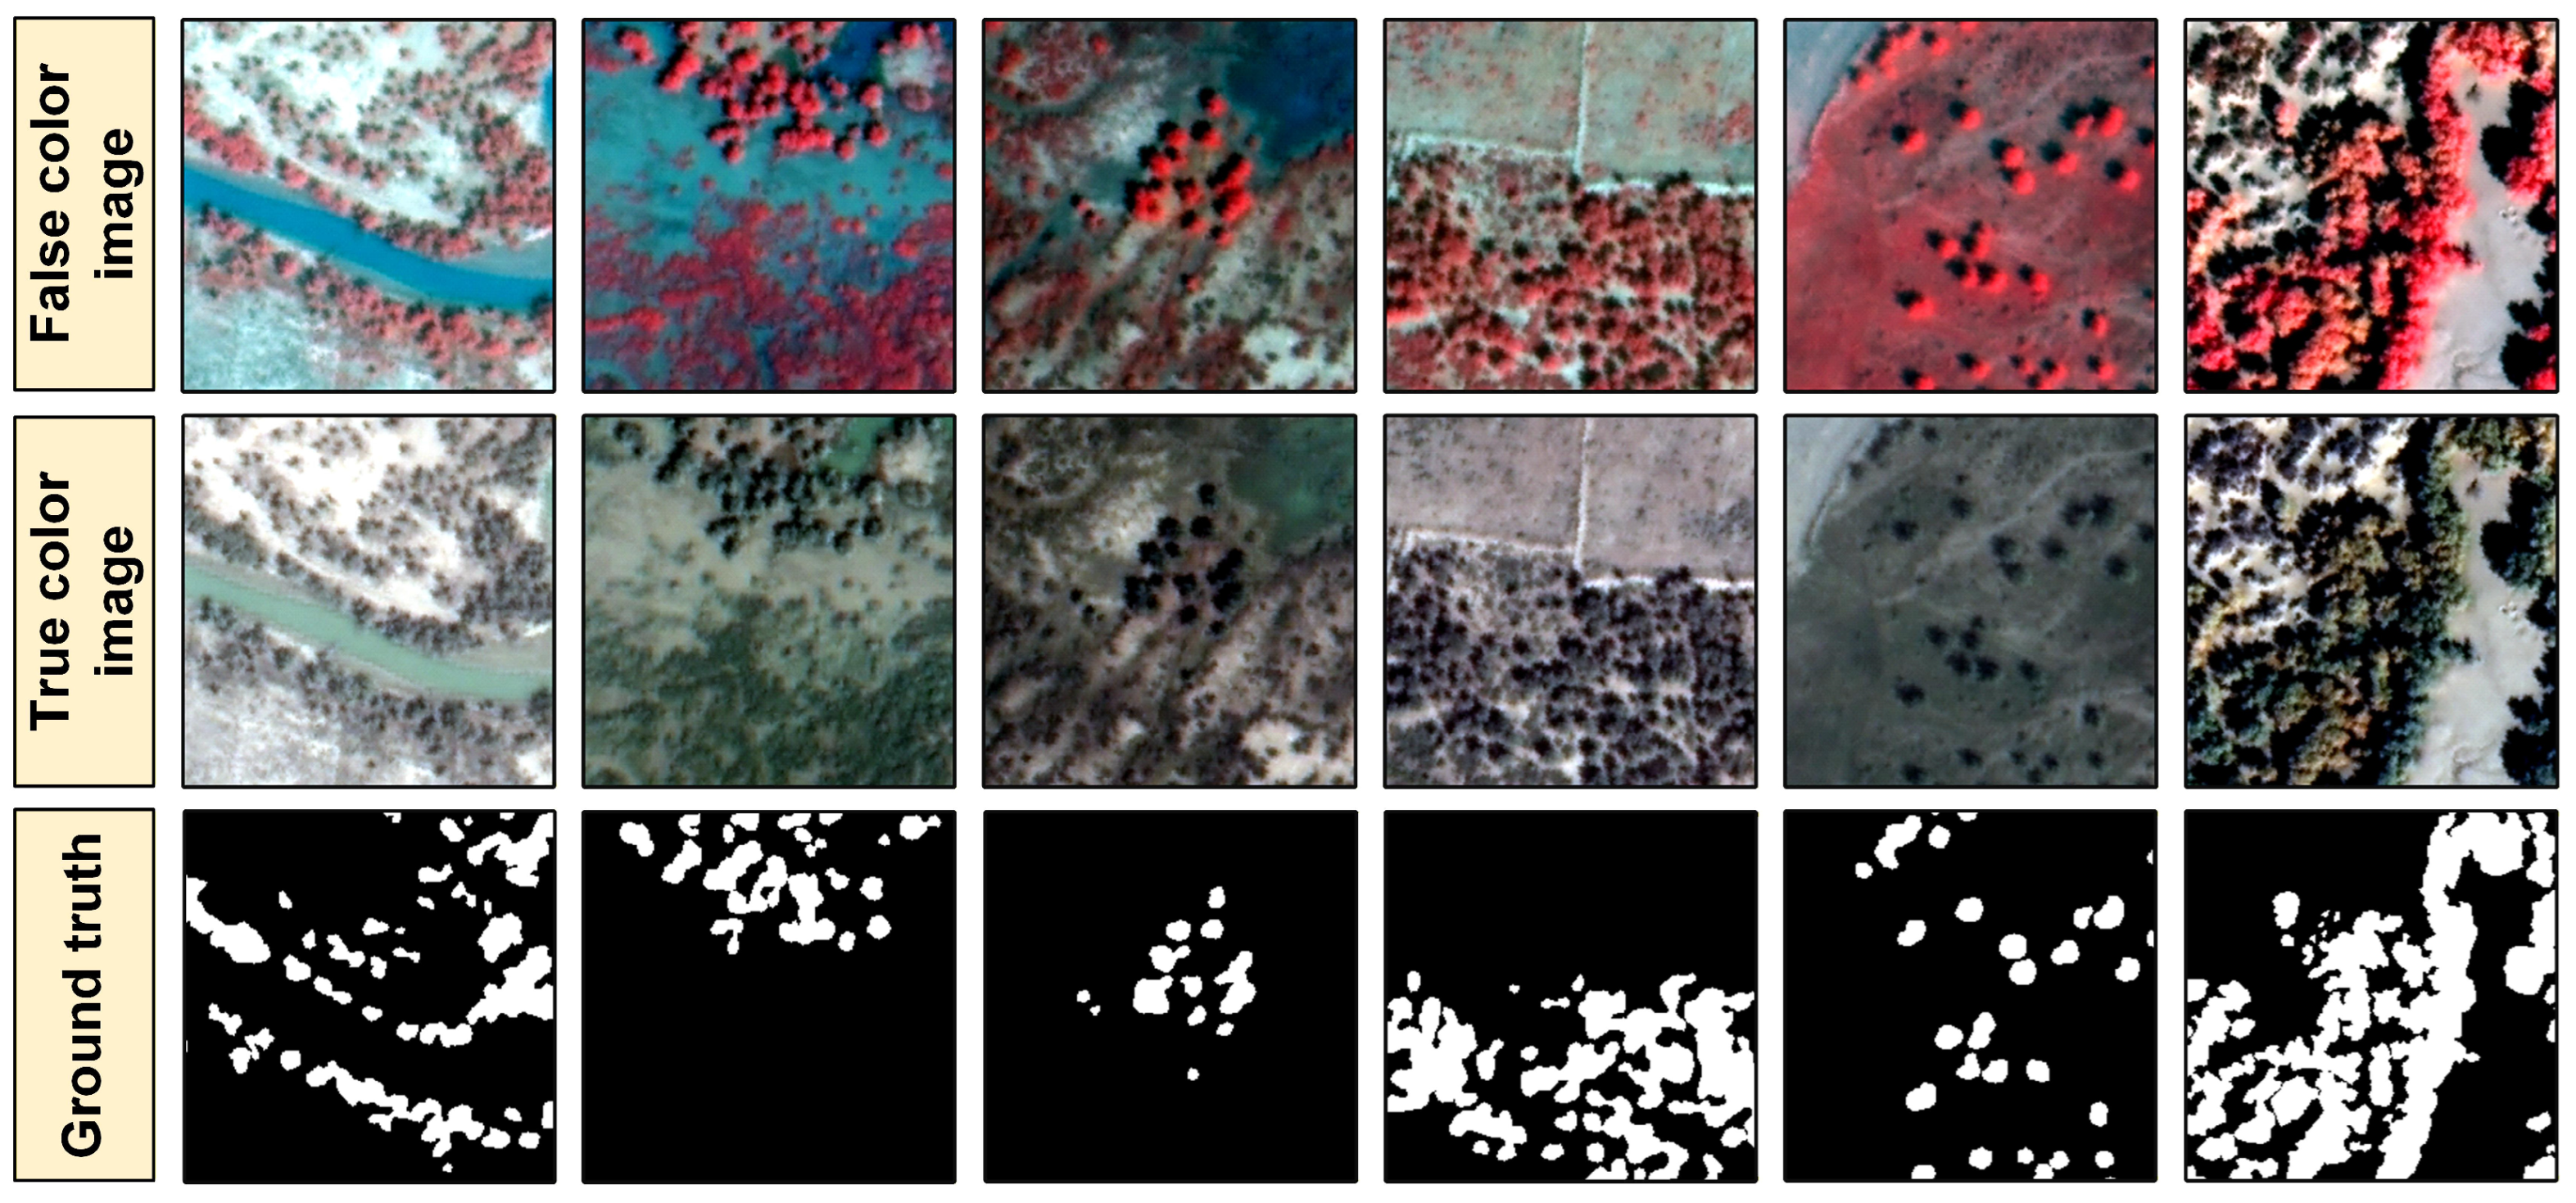
Standard false-color (band 4/3/2) and true-color (band 3/2/1) composites were generated from the preprocessed multispectral images. In standard false-color images, Populus euphratica appears bright red, while in true-color images, it appears dark green (Figure 3). In both false-color and true-color images, the canopy contours of sparse Populus euphratica forests are clearly visible, allowing for manual visual delineation of their canopy extent. The Labelme software (version 5.2.0.post4) was used to annotate samples, constructing a High-resolution Populus euphratica Dataset (HPD) containing 3299 sample groups. Each sample group includes a false-color image, a true-color image, and its corresponding manually annotated image. Approximately 80% (2699 groups) of the samples in the dataset were used for model training, and the remaining 20% (600 groups) were used for model accuracy evaluation.
Figure 3.
Sparse Populus euphratica forests training sample set. White pixels represent Populus euphratica, black pixels represent background.
3.3. Label Optimization
During the sample annotation process, ensuring label consistency is challenging. Manual annotation often contains certain biases; in a small number of images with indistinct features, omissions, errors, or boundary shifts may occur [52,53]. Therefore, optimization of the initial sample set is necessary.
The following label optimization strategy was adopted: (1) first, an efficient deep learning model was trained based on the original manual labels; (2) then, the trained model was used to predict the corresponding images; (3) finally, by weighted fusion of the original manual labels and the deep learning model’s predictions, boundary regions were specifically optimized to enhance the overall accuracy of the labels. The following method was used for sample fusion.
Here, represents the output probability (value range [0, 1]) after weighted fusion of the manual label and the prediction result. is the final fused label (Populus euphratica marked as 1, non- Populus euphratica marked as 0). α is the trust weight assigned to the model prediction result p is the output probability of the model prediction (value range [0, 1]). l is the original manual annotation result (Populus euphratica as 1, non- Populus euphratica as 0). We set the weight α to 0.6, giving higher confidence to the model prediction result than to the manual label, thereby achieving effective correction of the manual labels. If α is set below 0.5, the correction effect is weak; if set above 0.6, it may excessively alter the original label information.
3.4. Deep Learning Model Selection
Considering a balance of accuracy, efficiency, data volume, and task complexity, nine deep learning models were selected for the sparse Populus euphratica forests identification task: U-Net [54], PSPNet [55], SegNet [56], U-Net++ [57], DeepLabv3+ [58], PAN [59], UPerNet [60], MA-Net [61], and SegFormer [62]. The selected nine models have respective advantages in different classification tasks, corresponding to three application strategies.
(1) Strategy 1: Efficient Baseline Models. This includes three models: U-Net, SegNet, PSPNet. These models strike a balance among structural simplicity, training efficiency, and reliable accuracy. Their architecture is intuitive, with a clear encoder-decoder structure, relatively fewer parameters, faster training and inference speeds, and lower computational resource requirements. They are also robust and reliable, having been extensively validated in practice and performing stably on small-to-medium-sized datasets.
(2) Strategy 2: High-Performance Enhanced Fusion Models. This includes four models: U-Net++, DeepLabv3+, PAN, MA-Net. These models enhance feature fusion capabilities through more complex structural designs (e.g., dense connections, multi-path/pyramid pooling, attention mechanisms), helping to achieve higher segmentation accuracy. The drawback is higher model complexity, larger parameter counts, and greater computational overhead.
(3) Strategy 3: Advanced General Perception Models. This includes two models: SegFormer, UPerNet. They fundamentally change the feature extraction approach by adopting transformative foundational architectures (e.g., Transformer), focusing on modeling global context and long-range dependencies, and aiming to learn general visual representations from large amounts of data. These models heavily rely on large-scale pre-training. When data is sufficient, their accuracy ceiling is high, but they may perform poorly or be difficult to train on small datasets.
3.5. Constructing the Sparse Populus euphratica Forests Identification Network
Comprehensively comparing the training accuracy of various deep neural network models in the sparse Populus euphratica forests identification task, and drawing on the strengths of each model, we constructed a simple and effective lightweight Populus euphratica segmentation network named SPS-Net based on the basic U-Net framework.
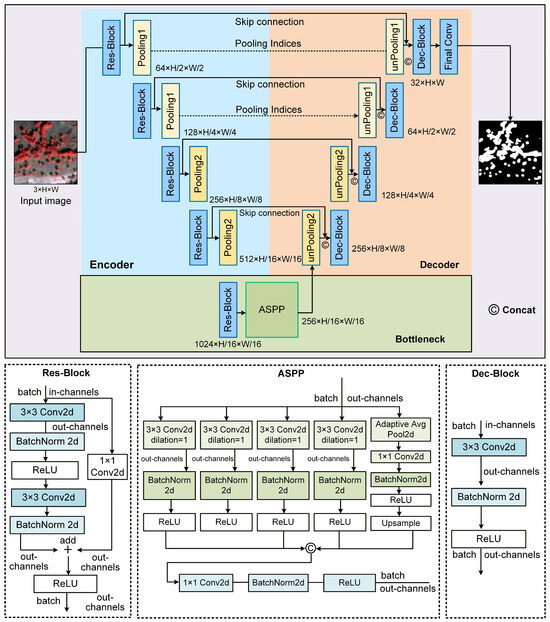
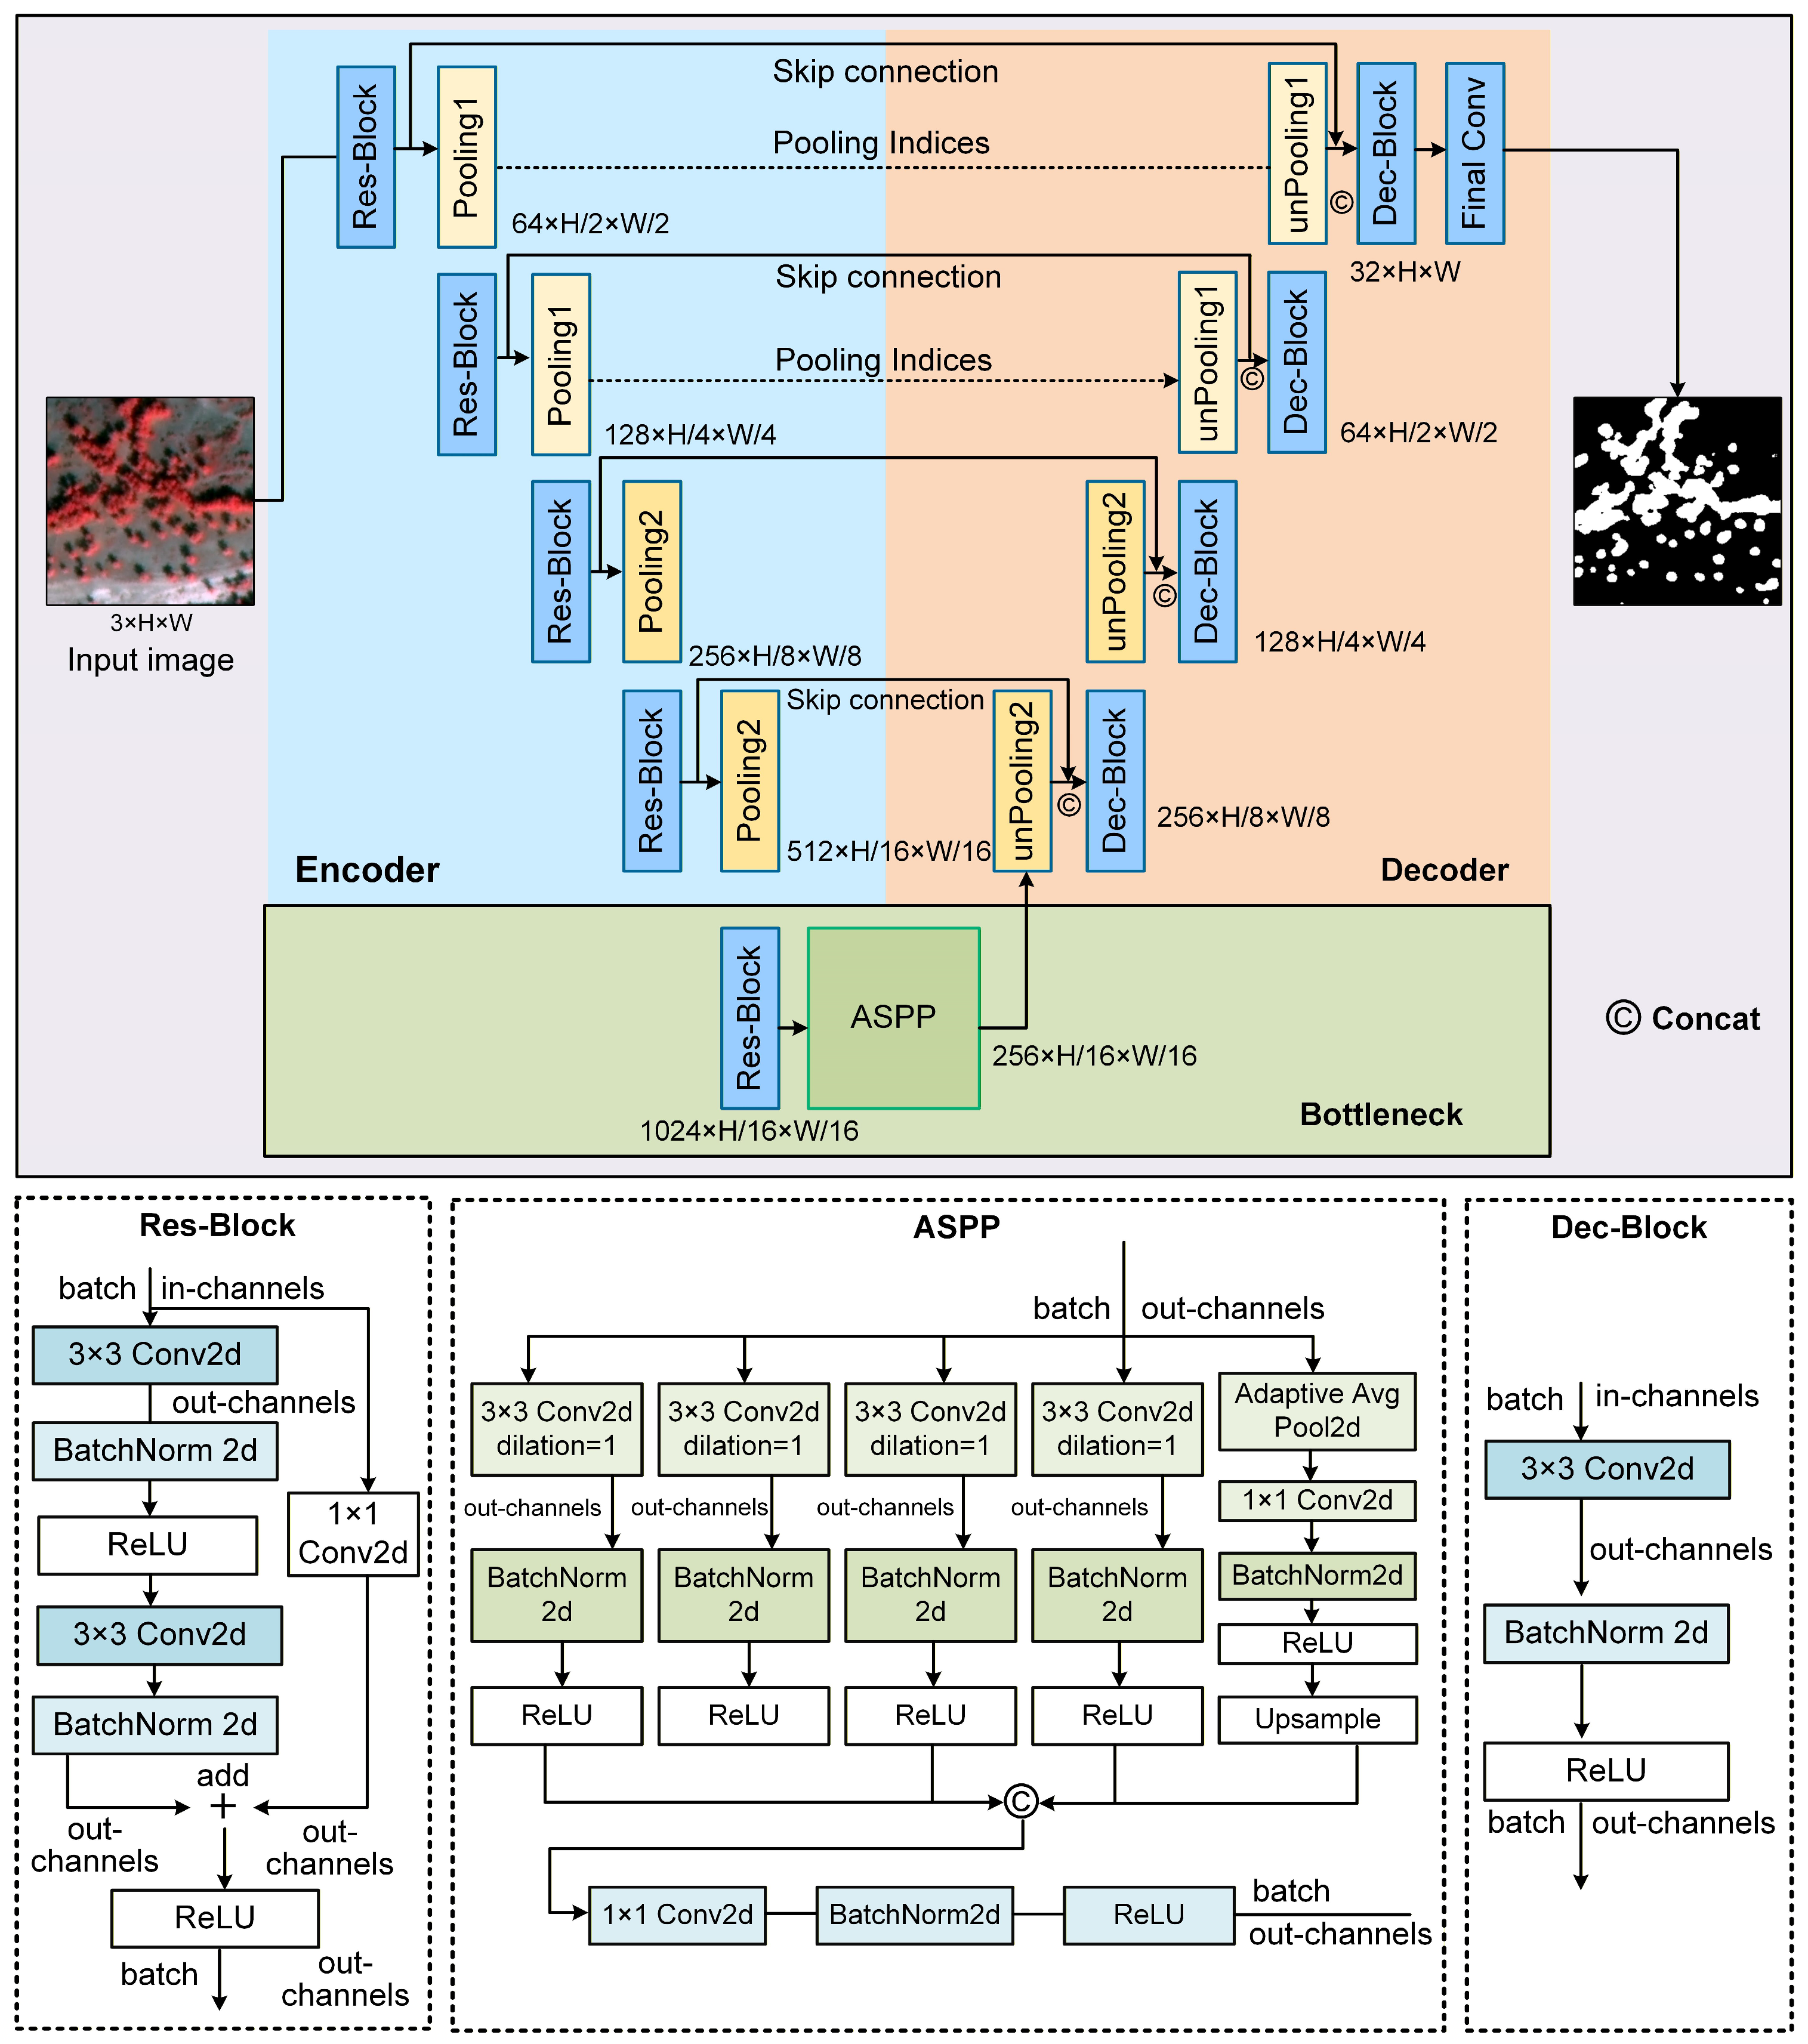
This network consists of three parts: an encoder, a bottleneck layer, and a decoder (Figure 4). The encoder comprises 4 Res-Blocks and 4 pooling layers: the upper two pooling layers use max-pooling with index recording, while the lower two use ordinary max-pooling for downsampling. The bottleneck layer includes 1 Res-Block and an Atrous Spatial Pyramid Pooling (ASPP) module. The decoder consists of 4 upsampling layers, 4 Dec-Blocks, and 1 final convolutional layer: the lower two upsampling layers use transposed convolution, while the upper two combine the max-pooling indices recorded in the encoder to more precisely restore spatial details. Each layer in the decoder is connected via skip connections to the corresponding Res-Block, allowing the decoder to fully utilize spatial detail information from low-level features during image reconstruction via upsampling.
Figure 4.
Sparse Populus euphratica forests segmentation network framework.
Each Res-Block mainly consists of 2 layers of 3 × 3 convolution, 1 layer of ReLU activation function, and 2 layers of batch normalization. At the main output end, a residual addition is performed with the input adjusted for dimensions via 1 × 1 convolution, followed by ReLU activation on the result. Res-Blocks alleviate gradient vanishing during training through residual connections, thereby enhancing model performance. The ASPP module uses dilated convolutions with dilation rates of 1, 6, 12, and 18 to capture multi-scale contextual information. It also introduces a global average pooling branch to extract global context. Finally, features from the five branches are fused, effectively expanding the model’s receptive field. The Dec-Block structure is relatively simple, containing 1 layer of 3 × 3 convolution, 1 layer of batch normalization, and 1 layer of ReLU, used to fuse the upsampling results with information passed via skip connections.
This segmentation network establishes connections between high-level and low-level features through skip connections and a mixed sampling strategy, effectively restoring image spatial details. Simultaneously, by leveraging ASPP to expand the receptive field, it acquires multi-scale information without increasing the parameter count, thereby achieving precise localization of Populus euphratica.
To address the class imbalance problem in Populus euphratica segmentation, this network employs a linearly weighted loss combining Logistic Loss and Dice Loss [63], making the model more sensitive to small targets like Populus euphratica and enabling faster convergence during the initial training stages. The loss function is as follows (3)–(5):
Here, the weighting coefficient is set to 0.6; is the ground truth label for pixel i (value 0 or 1); is the predicted probability for pixel (value in the range [0, 1]); represents the total number of pixels in the image; is a very small quantity used to prevent the denominator in from being zero.
3.6. Accuracy Evaluation
Intersection over Union (IoU), Dice coefficient, Pixel Accuracy (PA), Precision, and Recall were adopted as accuracy evaluation metrics. IoU measures the overlap between prediction results and ground truth labels, providing a more accurate reflection of identification accuracy in class-imbalanced tasks. The Dice coefficient is twice the overlapping area between the predicted region and the ground truth region divided by the sum of their areas. It is monotonically related to IoU and is particularly sensitive to small target segmentation. PA reflects the overall classification accuracy at the pixel level, serving as an intuitive global accuracy measure. Precision reflects the reliability of the model’s positive predictions; high precision means the model’s positive class predictions are highly credible but may come at the cost of missed detections. Recall measures the model’s ability to correctly identify positive class samples; high recall indicates the model captures most positive targets but may introduce false positives. Precision and Recall can be balanced via the Dice coefficient. These metrics are widely used in the deep learning field to evaluate semantic segmentation model performance. Their comprehensive use allows for a multi-faceted assessment of Populus euphratica segmentation effectiveness.
The calculation formulas for each metric are as follows (6)–(10):
where: TP represents the number of pixels predicted as Populus euphratica and whose ground truth label is also Populus euphratica. FP represents the number of pixels predicted as Populus euphratica but whose ground truth label is background. FN represents the number of pixels predicted as background but whose ground truth label is Populus euphratica. TN represents the number of pixels predicted as background and whose ground truth label is also background.
The identification accuracy of the nine models was tested and evaluated separately on the true-color and false-color datasets. During the training phase, each model was trained for 100 epochs, with the input image batch size set to 16 and the initial learning rate set to 0.0001. After each training epoch, accuracy evaluation was performed on the validation set, outputting metrics such as IoU, Dice, PA, Precision, and Recall. The model parameters and corresponding results with the highest accuracy were recorded and saved.
4. Results
4.1. Identification Performance and Comparative Analysis of Various Models
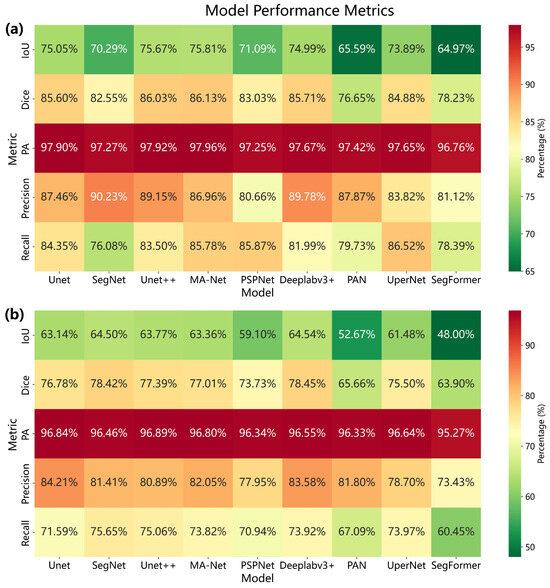
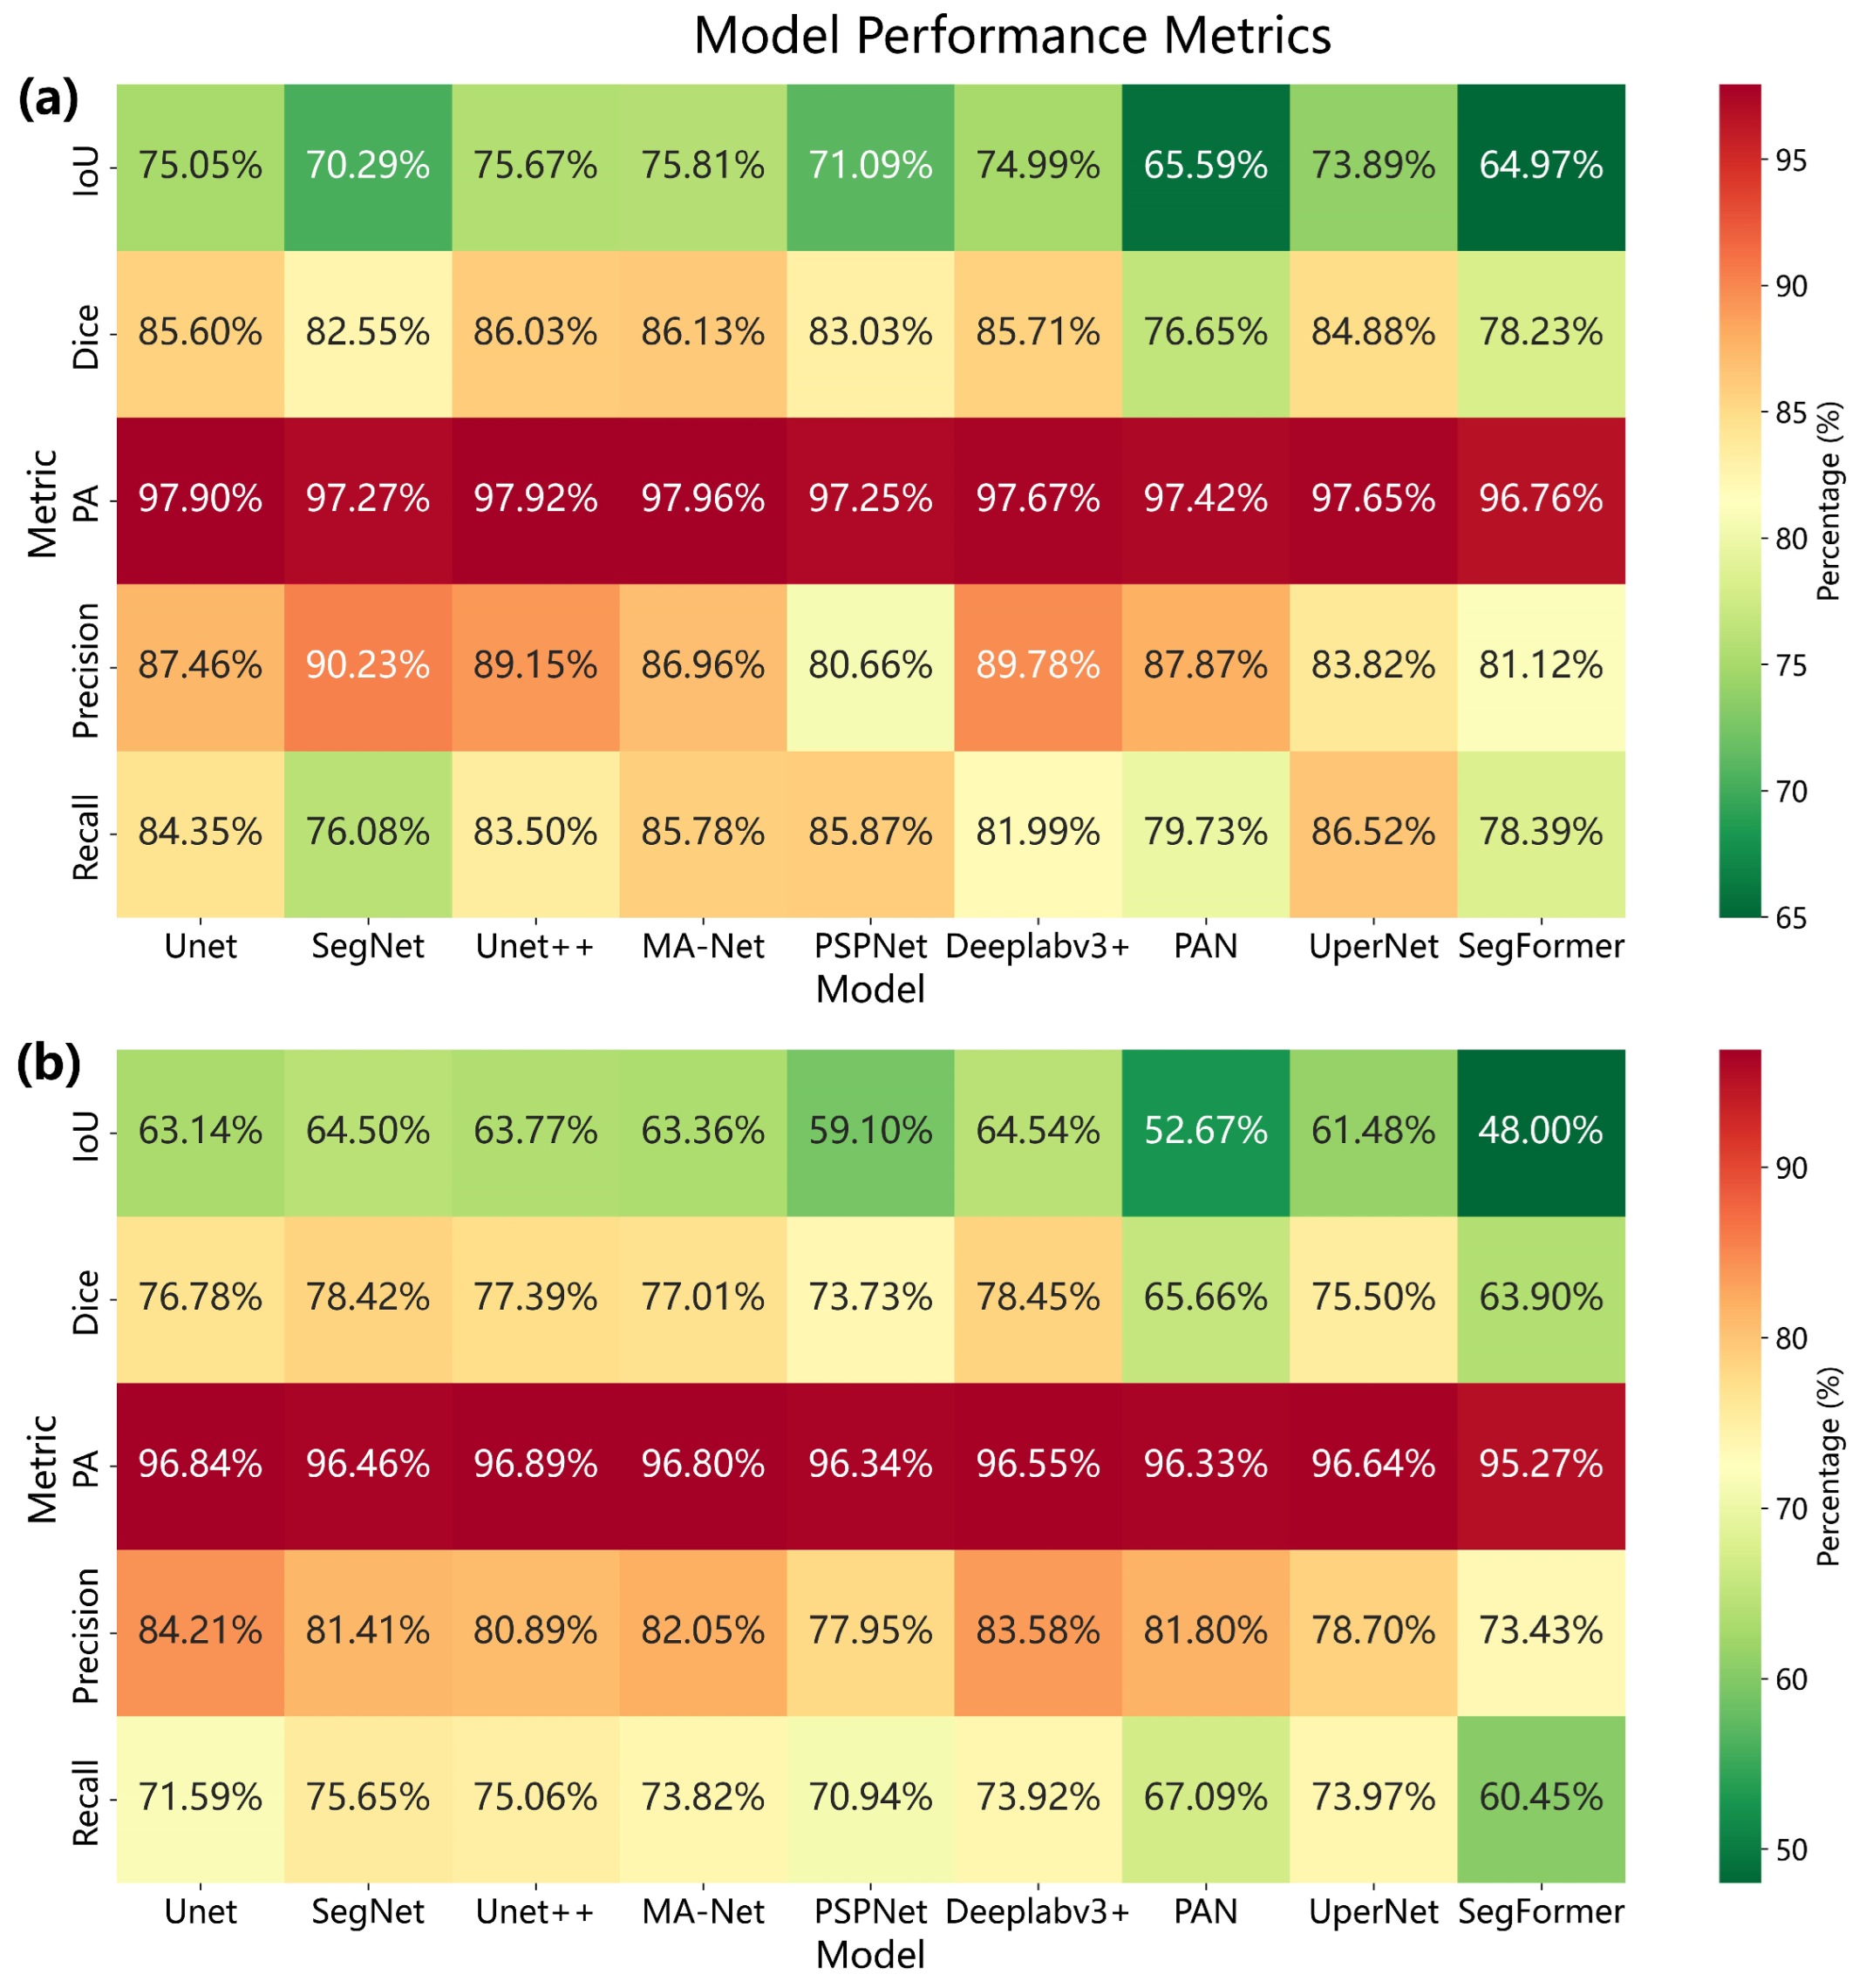
This study constructed sample sets based on two types of GF-2 satellite data—true-color and false-color—and comparatively analyzed the accuracy performance of nine deep learning models in identifying sparse Populus euphratica forests. The identification results based on the true-color dataset (Figure 5a) showed that in terms of IoU, DeepLabv3+ and SegNet performed relatively well, with values of 65.54% and 65.50%, respectively; in terms of Precision, U-Net and DeepLabv3+ exhibited better performance, reaching 84.21% and 83.58%, respectively; in terms of Recall, SegNet and U-Net++ achieved relatively high values of 75.65% and 75.06%, respectively; the differences among models in PA were minimal. Considering these indicators comprehensively, among the true-color dataset, five models—DeepLabv3+, SegNet, U-Net++, MA-Net, and U-Net—demonstrated better identification accuracy for sparse Populus euphratica forests, while UPerNet and PSPNet showed moderate performance, and SegFormer and PAN performed relatively poorly. Results based on the false-color dataset (Figure 5b) indicated that in terms of IoU, four models—MA-Net, Unet++, Unet, and DeepLabv3+—performed relatively well, while UPerNet showed moderate IoU performance, and Segformer, PAN, and PSPNet were relatively inferior; in terms of Precision, SegNet and DeepLabv3+ performed better, reaching 90.23% and 89.78%, respectively; in terms of Recall, the UPerNet model achieved the best performance. Overall, in the false-color dataset, four models—MA-Net, Unet++, DeepLabv3+, and U-Net—exhibited relatively favorable identification results for sparse Populus euphratica forests.
Figure 5.
Model identification accuracy charts. (a) Accuracy of each model based on the true-color dataset. (b) Accuracy of each model based on the false-color dataset.
A comparison of the identification performance of the nine deep learning models on false-color and true-color datasets revealed that using false-color datasets containing near-infrared bands more readily yielded higher identification accuracy. Based on the false-color dataset, all models outperformed those based on the true-color dataset across all five indicators (IoU, Dice, PA, Precision, and Recall). Taking IoU as an example, it is generally considered that IoU > 0.5 represents an acceptable prediction result, while in more stringent evaluations, IoU > 0.75 is a criterion for excellent identification accuracy. In the true-color dataset, the IoU values of all models were generally below 0.7%, with the highest at only 0.65 and the lowest at 0.48. In the false-color identification results, the lowest IoU was 0.65 and the highest was 0.76, with four models (U-Net, U-Net++, MA-Net, DeepLabv3+) achieving results above 0.75.
The recognition accuracy of each model based on false-color images is more stable, and the accuracy differences among models are smaller. Taking IoU as an example, the coefficient of variation (CV) of the IoU metric among models is approximately 9.8% in the true-color dataset and about 5.9% in the false-color dataset. That is, based on false-color images, the CV of IoU decreased by about 4 percentage points, and the CV of Recall dropped from 6.8% to 4.47%, a reduction of about 2.38 percentage points. In terms of improving recognition accuracy, the false-color dataset yields the most significant improvement in IoU. Based on the false-color dataset, the average IoU of the nine models increased from 60% to 72%, achieving an absolute gain of 12 percentage points, with an average relative performance improvement of 20% and a maximum of 35%. Furthermore, the average Recall of the models showed a relative improvement of 16%, with a maximum of 30%; the average Dice coefficient improved by 12.5%; and the average Precision improved by 7.3%. In contrast, PA remained almost unchanged.
4.2. Baseline Model Selection for the Sparse Populus euphratica Recognition Network (SPS-Net)
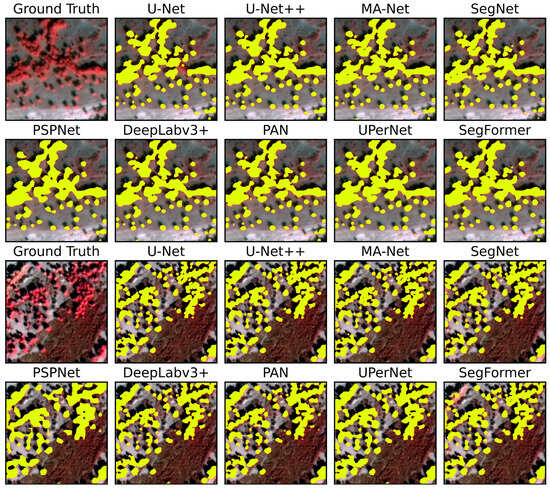
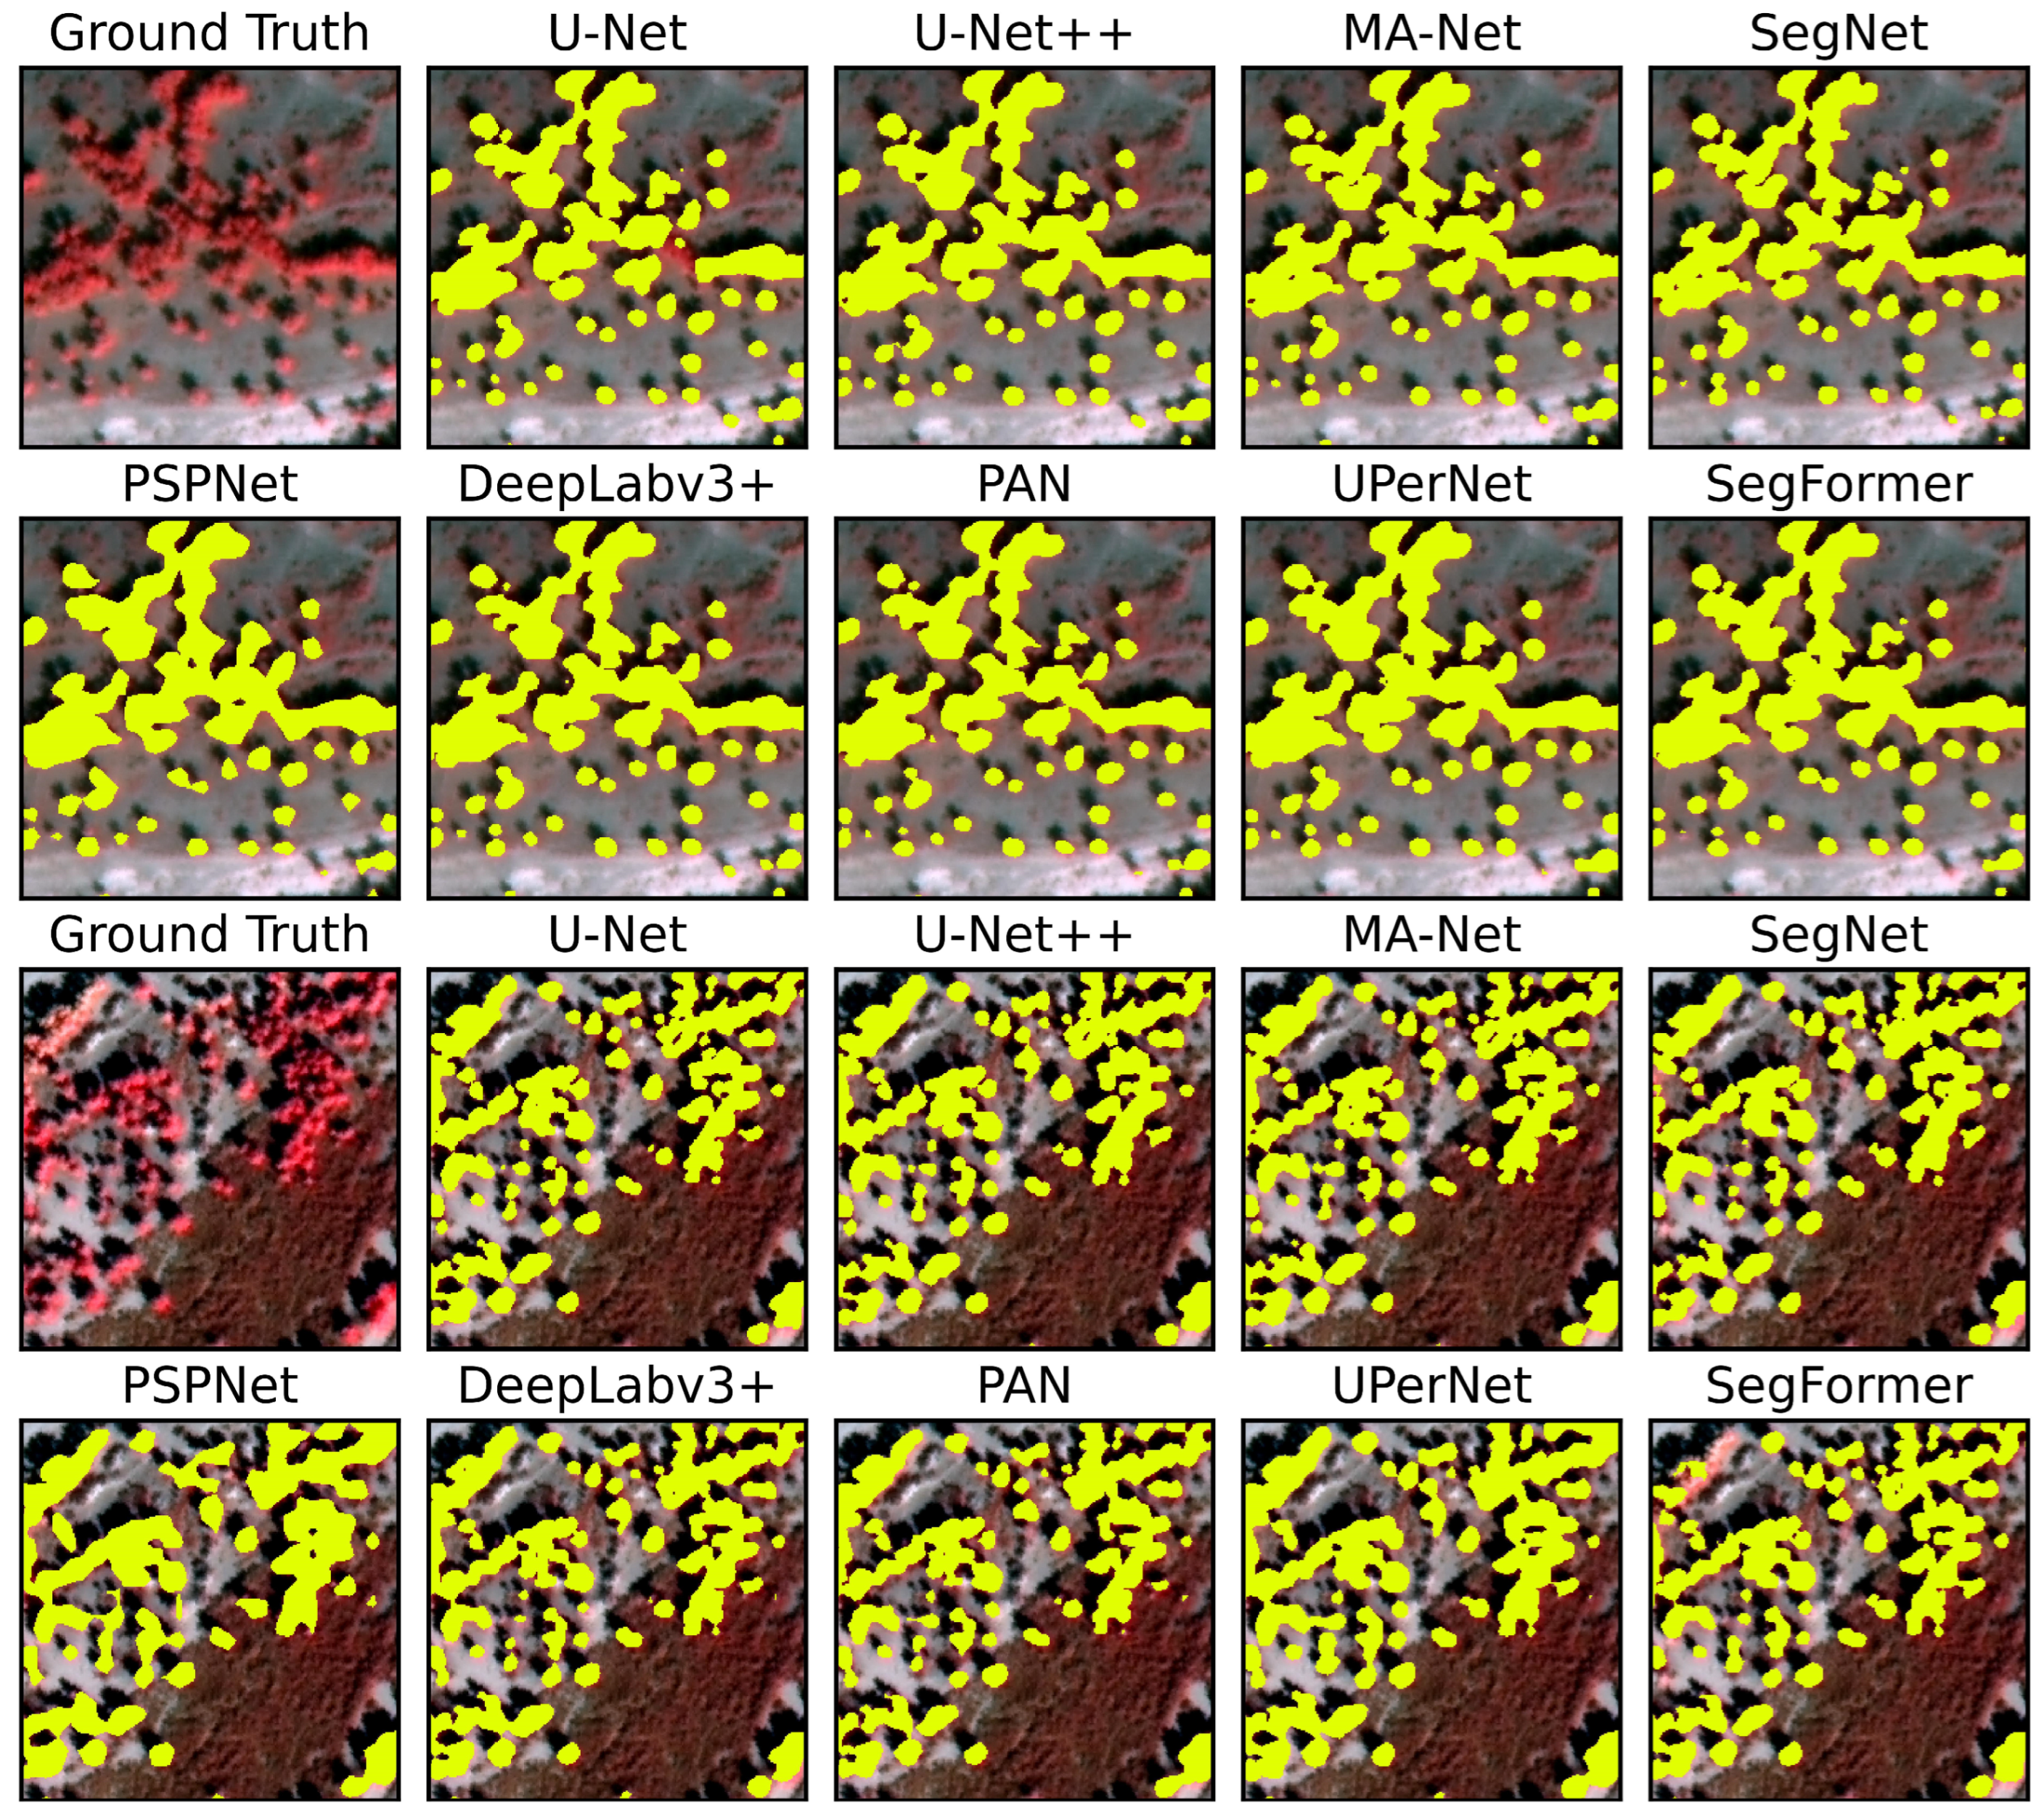
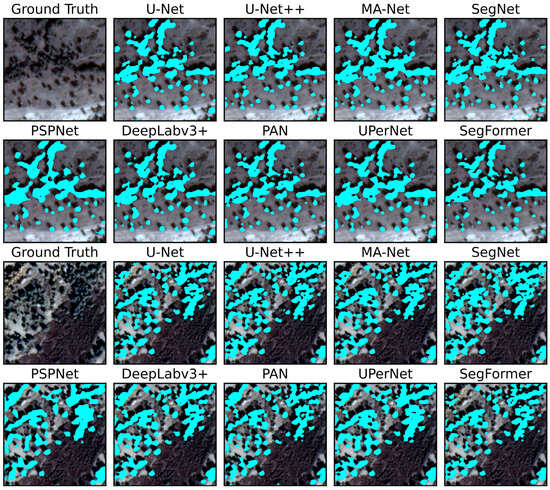
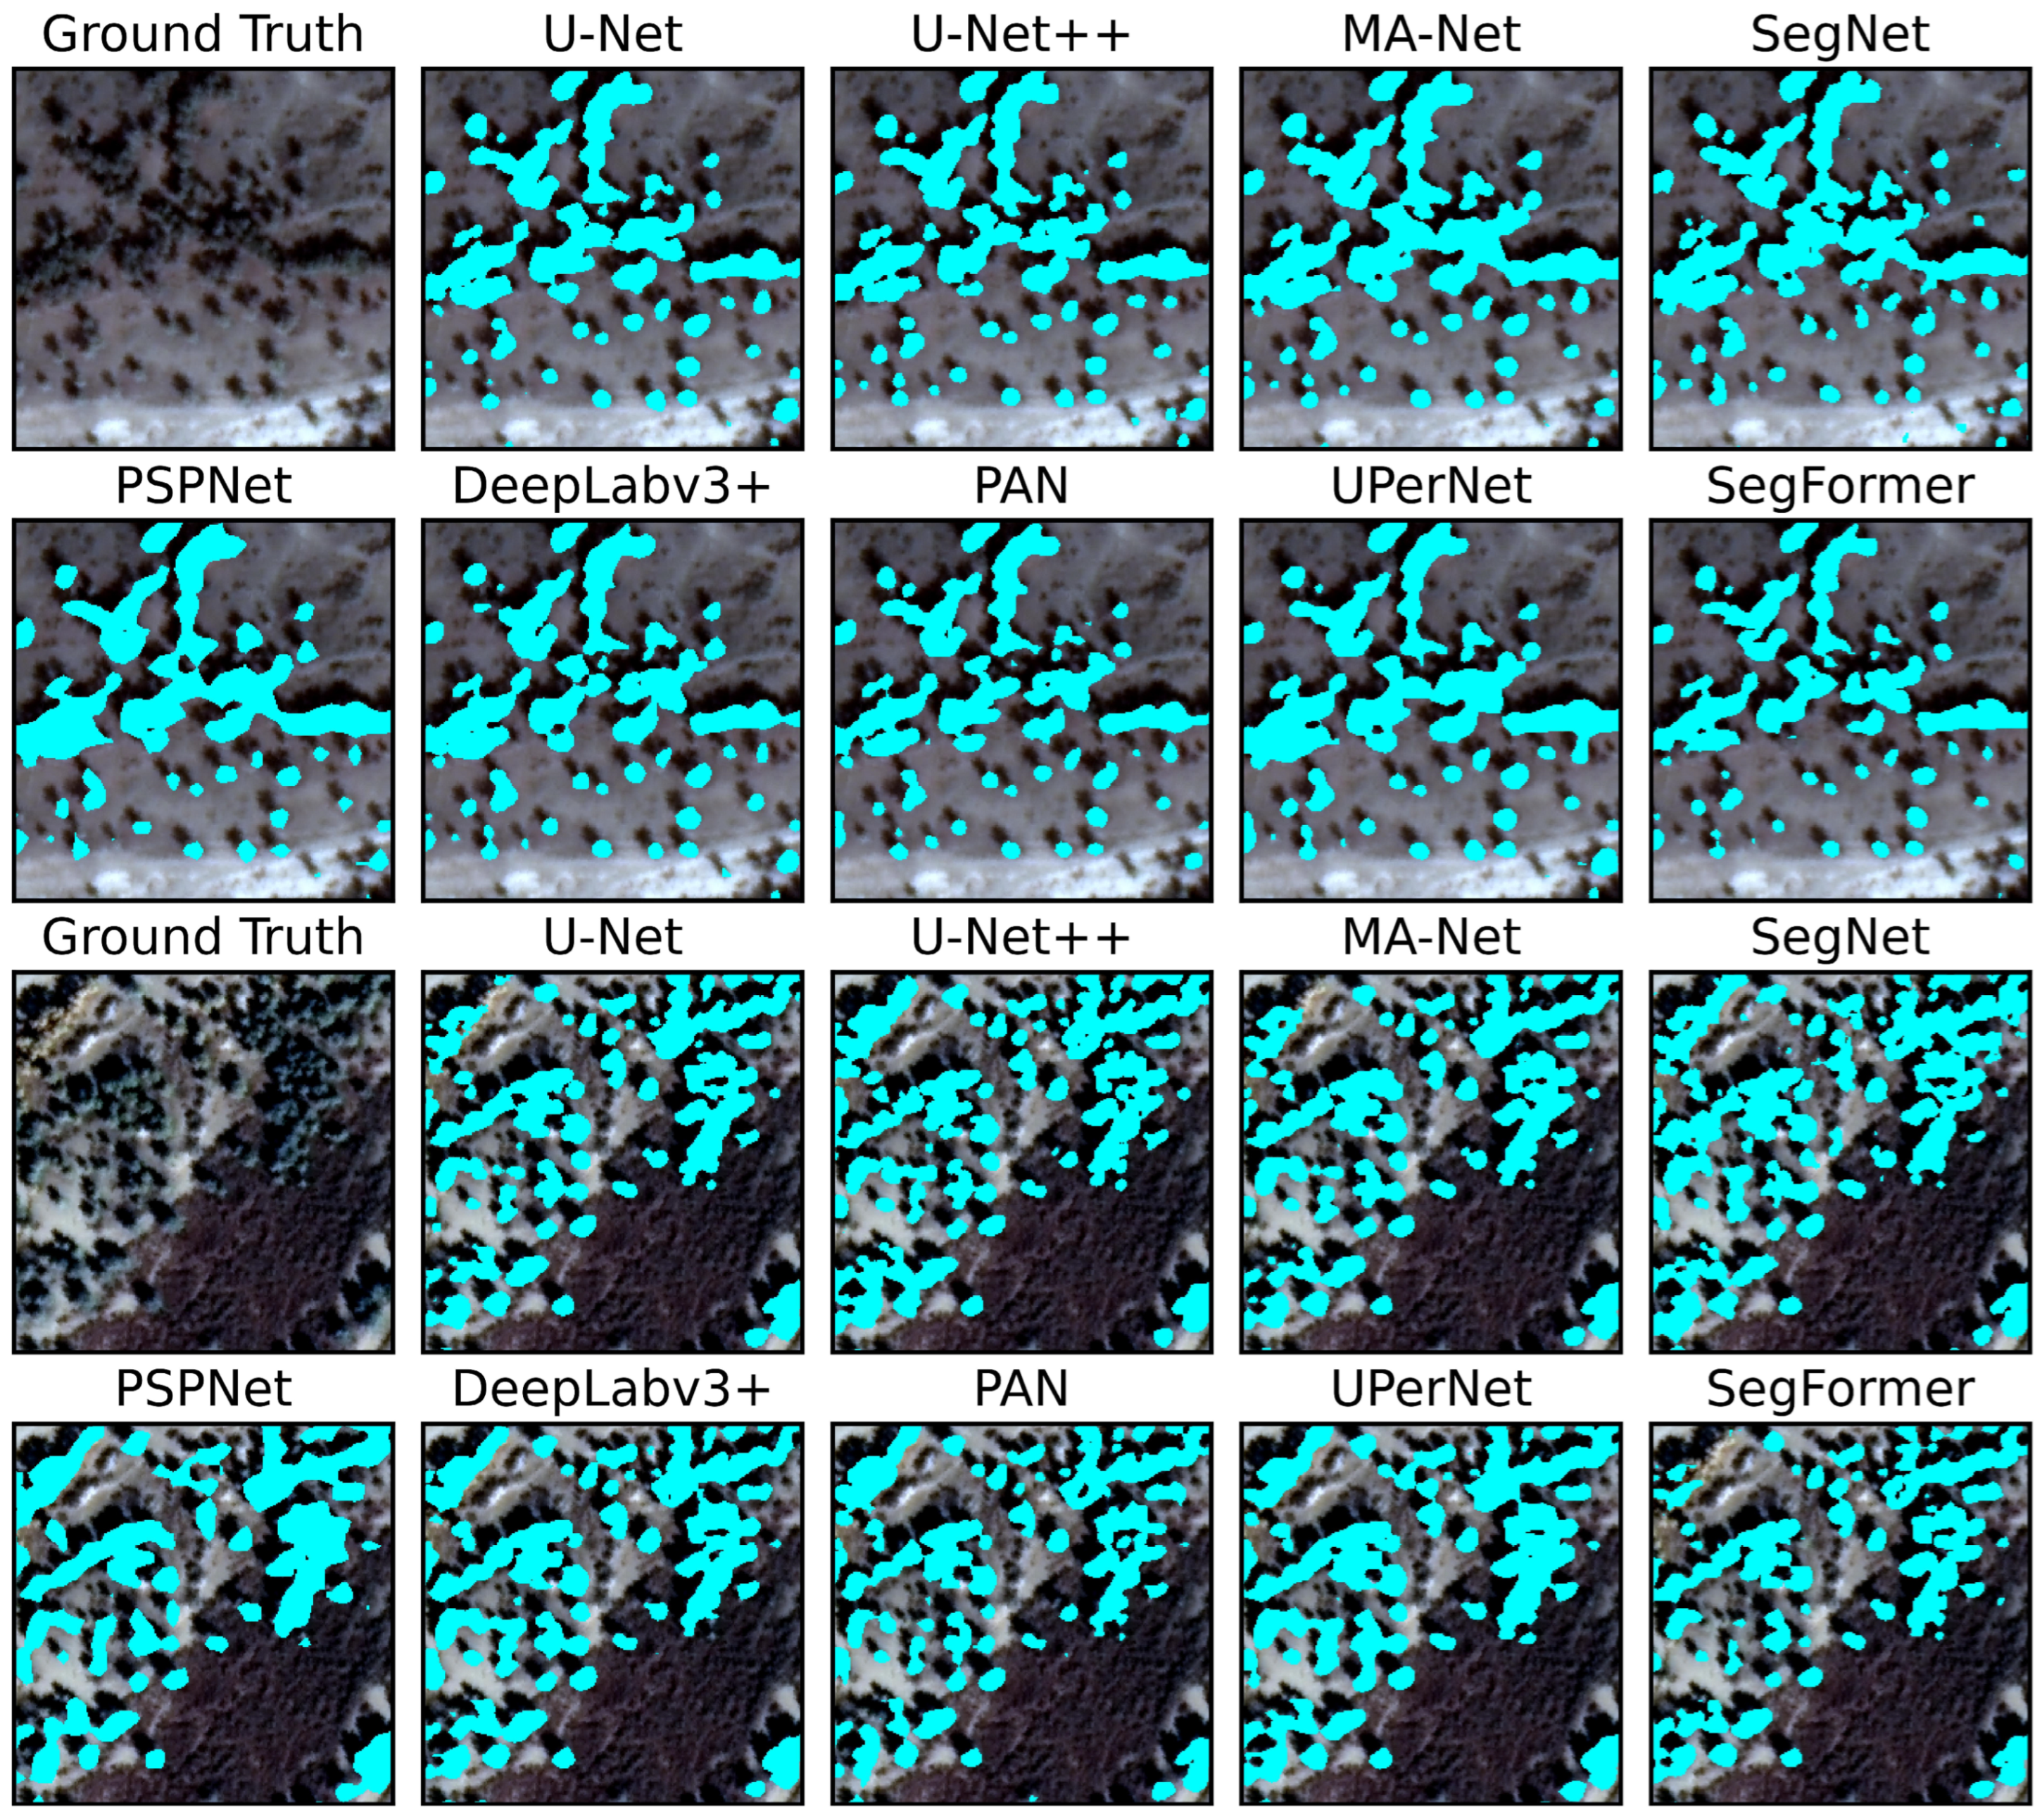
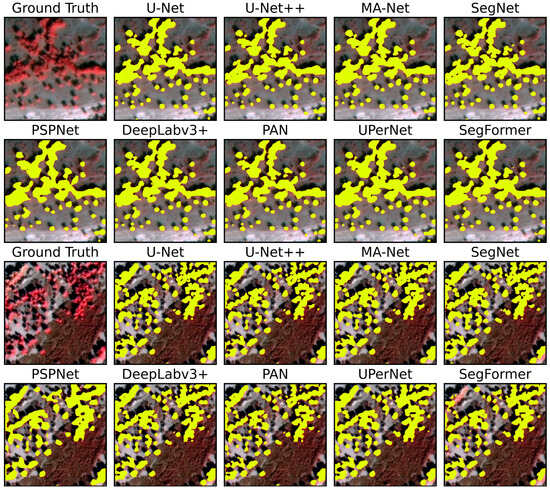
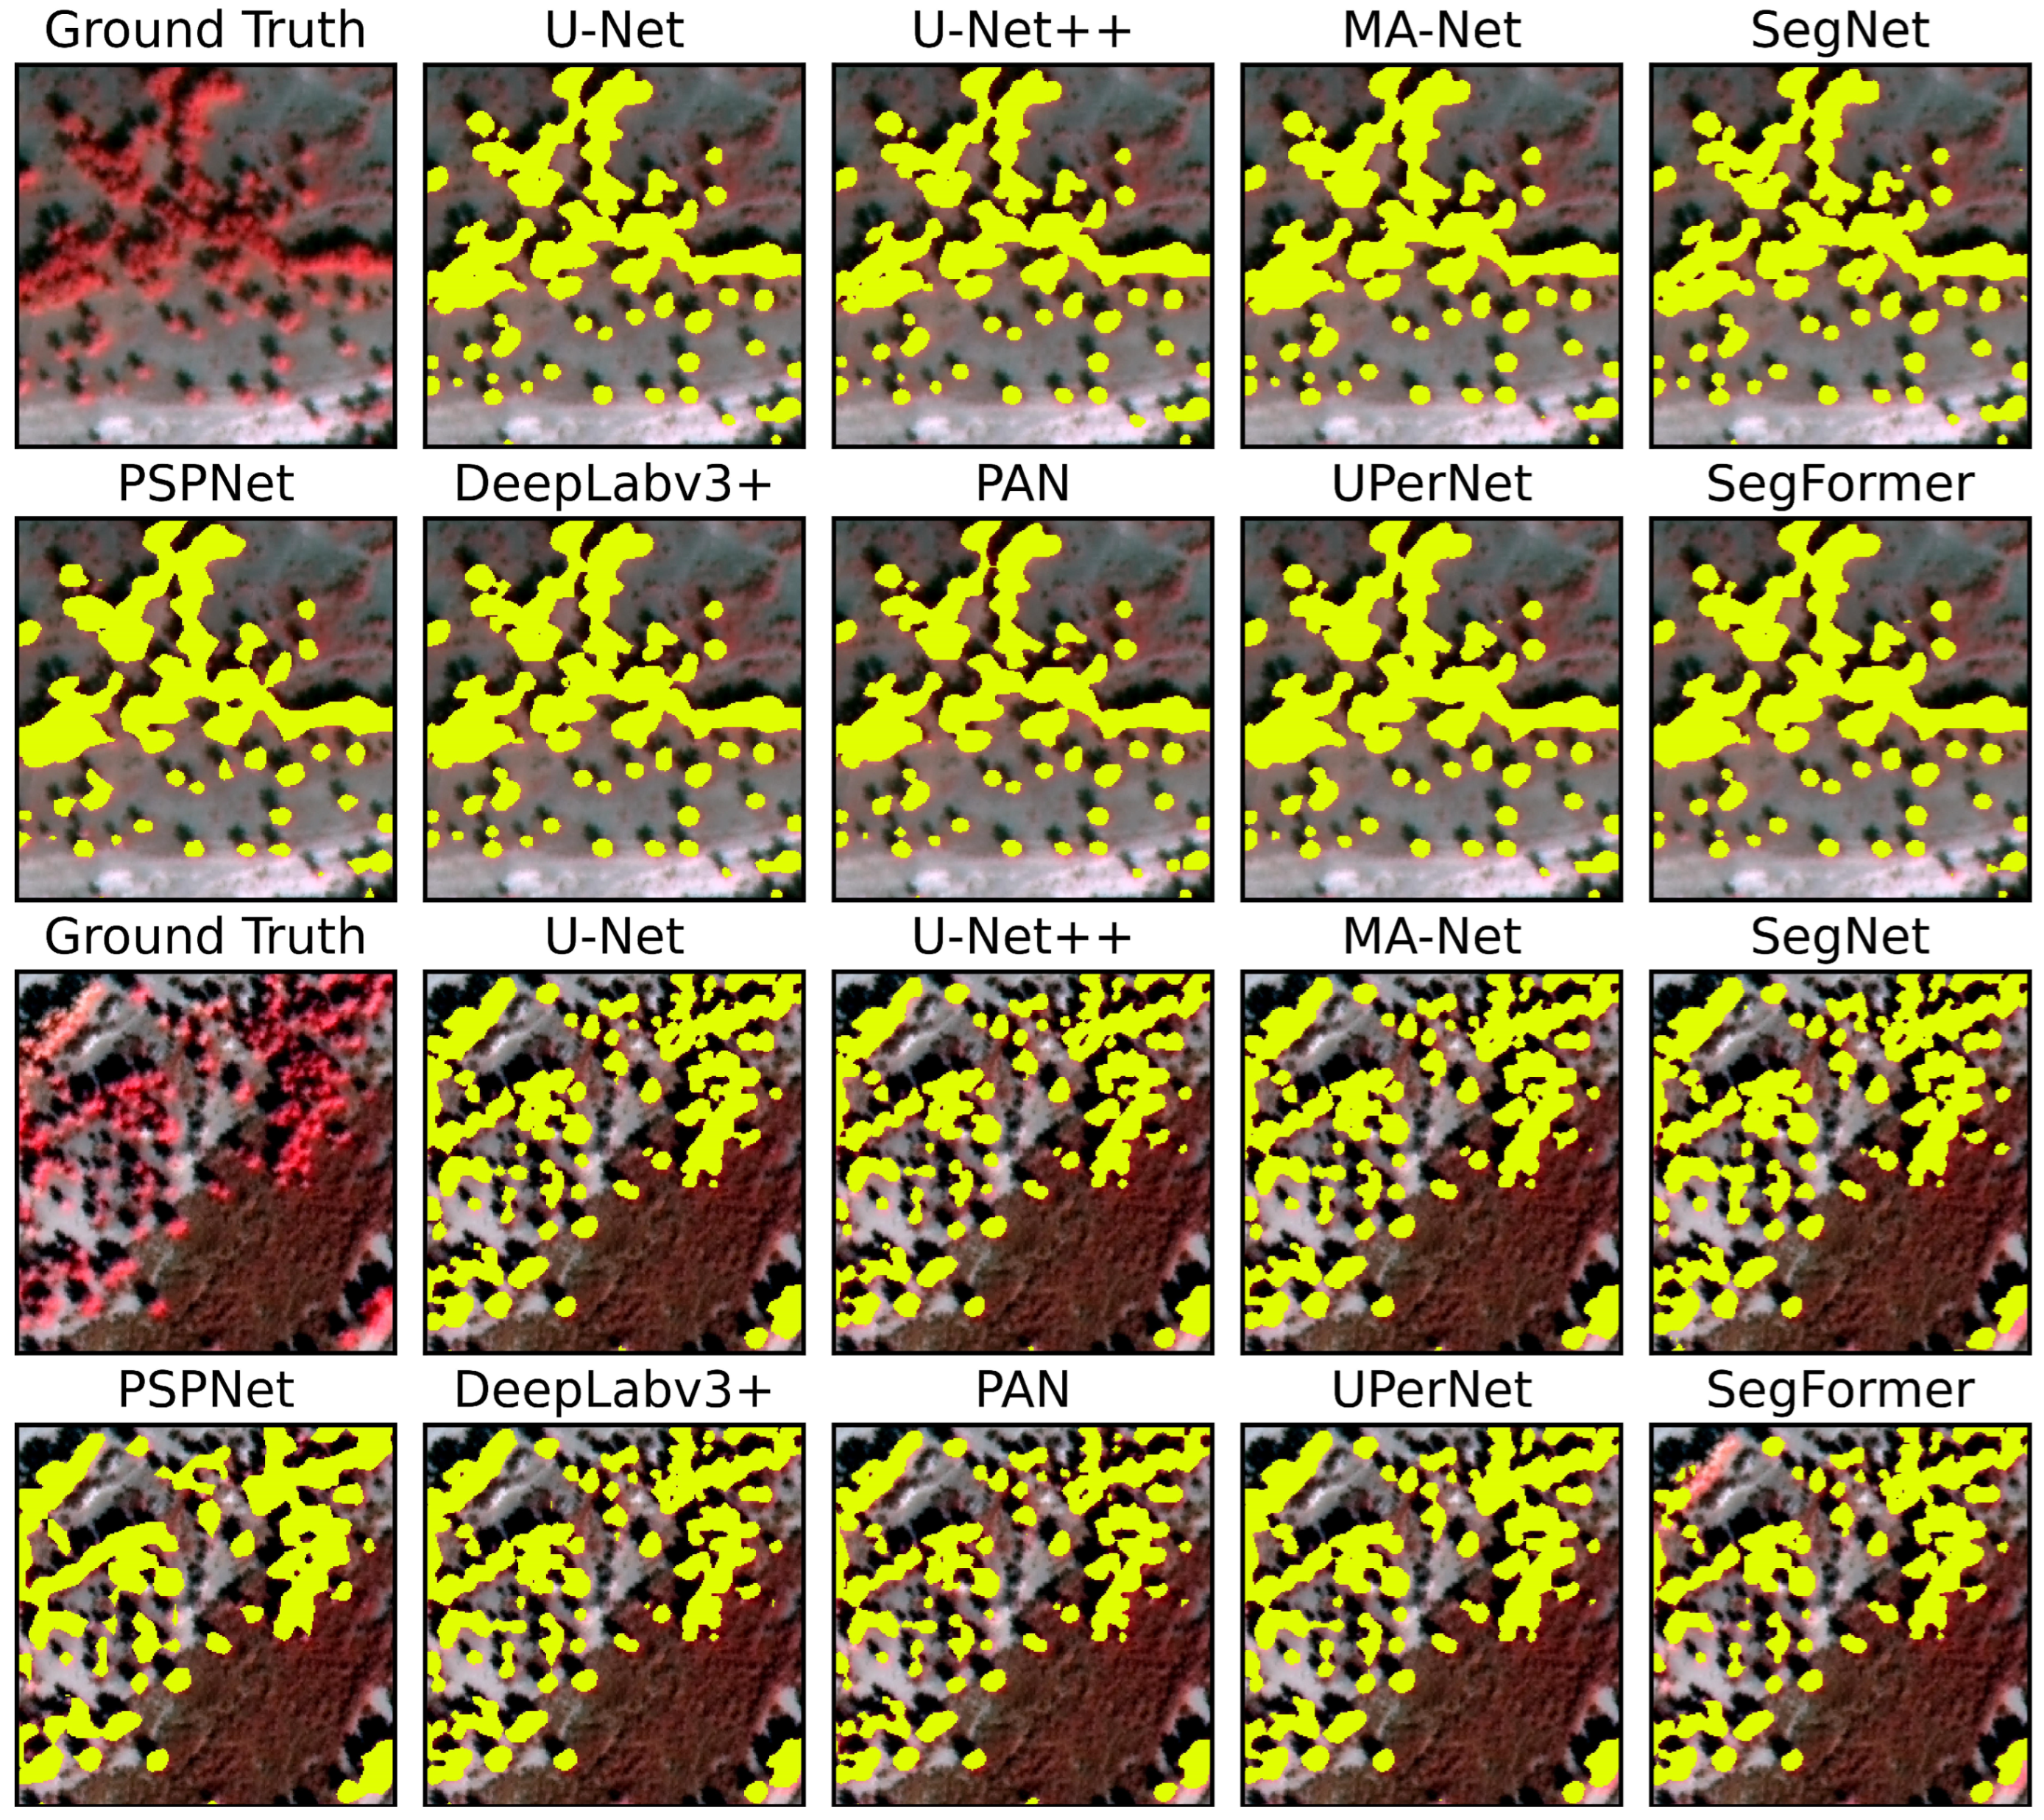
Considering solely the identification accuracy of sparse Populus euphratica forests, MA-Net, DeepLabV3+, U-Net++, and U-Net all ensured high accuracy (IoU ≥ 75%), with no significant differences among the four models; all were capable of effectively identifying sparse Populus euphratica forests under complex backgrounds (Figure 6 and Figure 7). In terms of the morphology and contours of predicted images, the predictions closely matched the ground truth, with clear and accurate boundaries of sparse forests contours, low omission and commission errors for small individual Populus euphratica trees, and good stability. Therefore, all four models meet the accuracy requirements for extracting Populus euphratica sparse forests.
Figure 6.
Comparison of prediction results from various deep neural network models on the standard false-color image dataset. The yellow mask pixels in each subfigure represent Populus euphratica prediction results.
Figure 7.
Comparison of prediction results from various deep neural network models on the true-color image dataset. The cyan mask pixels in each subfigure represent Populus euphratica prediction results.
From the perspective of model application, a comprehensive comparison of performance, structural characteristics, and improvement potential reveals that the U-Net model possesses certain advantages. In terms of performance, U-Net’s identification accuracy is essentially on par with MA-Net and DeepLabv3+: U-Net achieved an IoU of 0.7505, differing by less than 1% from the best-performing MA-Net (IoU = 0.7581) and U-Net++ (IoU = 0.7567); in Precision, U-Net outperformed MA-Net; in Recall, the difference from MA-Net was only 1.43%. Structurally, U-Net features a concise architecture that is easy to modify and extend, and both U-Net and its variants are the most widely applied models, making it suitable as a baseline for modular improvements. Although other models achieve slightly higher accuracy, their relatively complex structures limit further improvement potential. In terms of improvement potential, targeted optimizations can address U-Net’s limitations such as fixed receptive field and insufficient edge preservation. Therefore, selecting U-Net as the baseline model for constructing a Populus euphratica sparse forests identification network is a relatively reasonable choice.
4.3. Recognition Results of Sparse Populus euphratica Forests Based on the SPS-Net Model
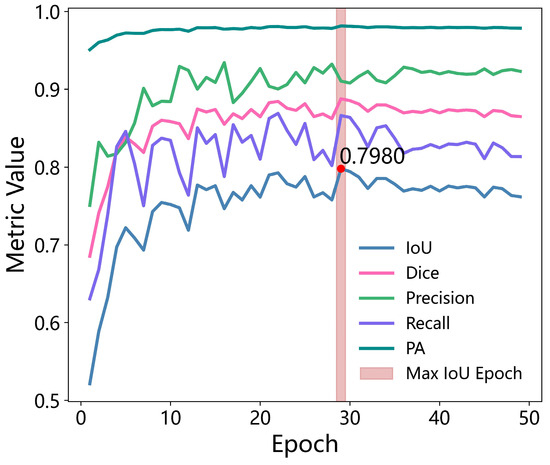
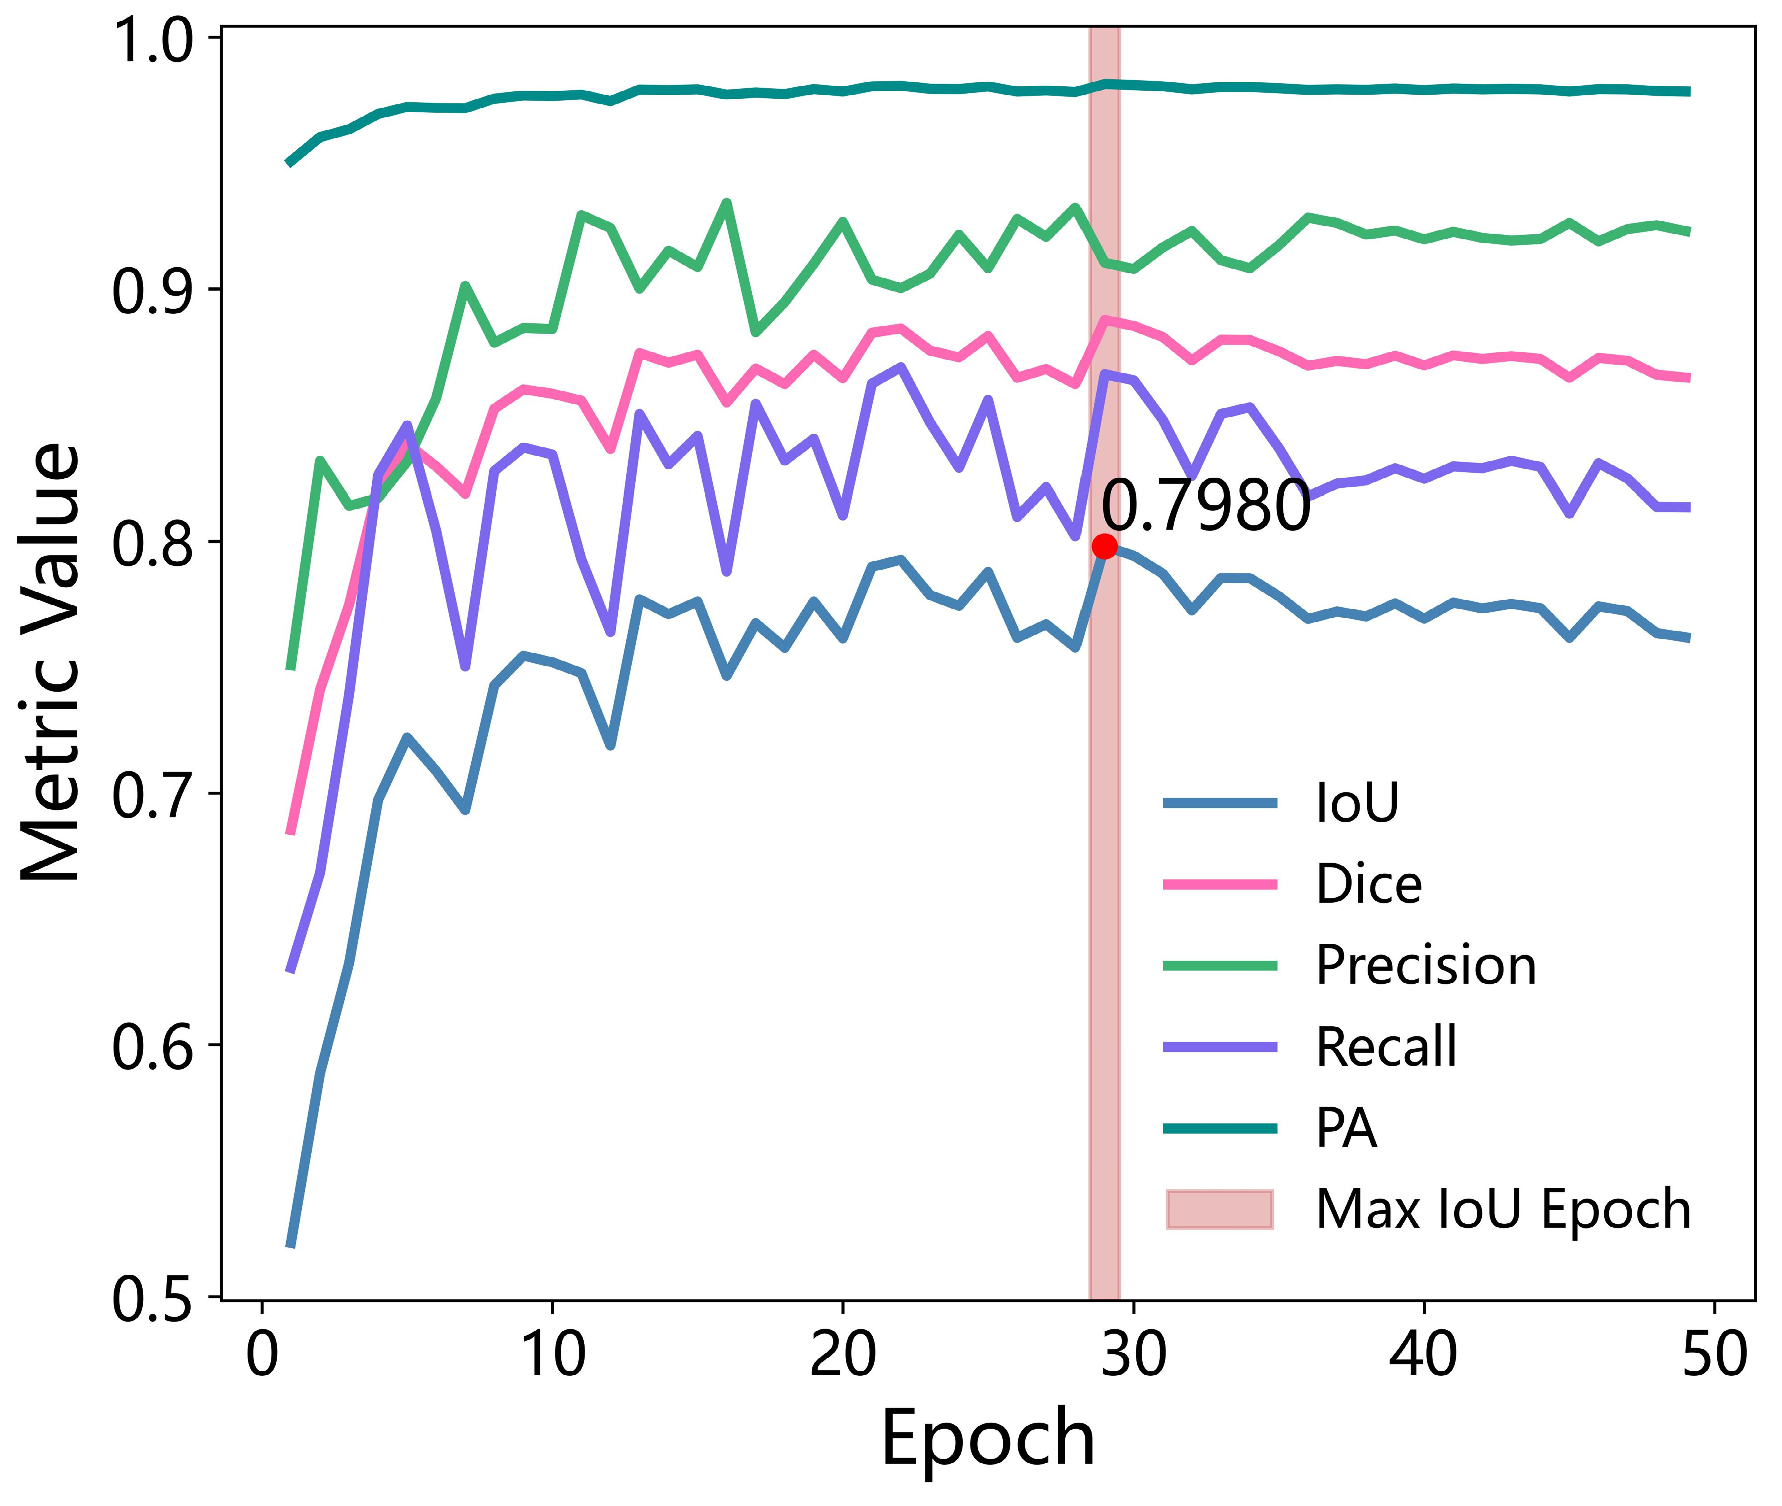
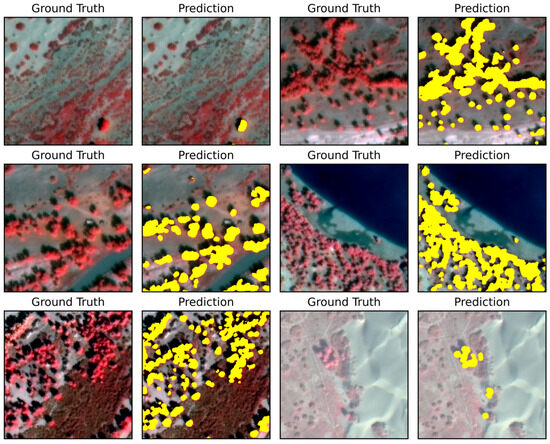
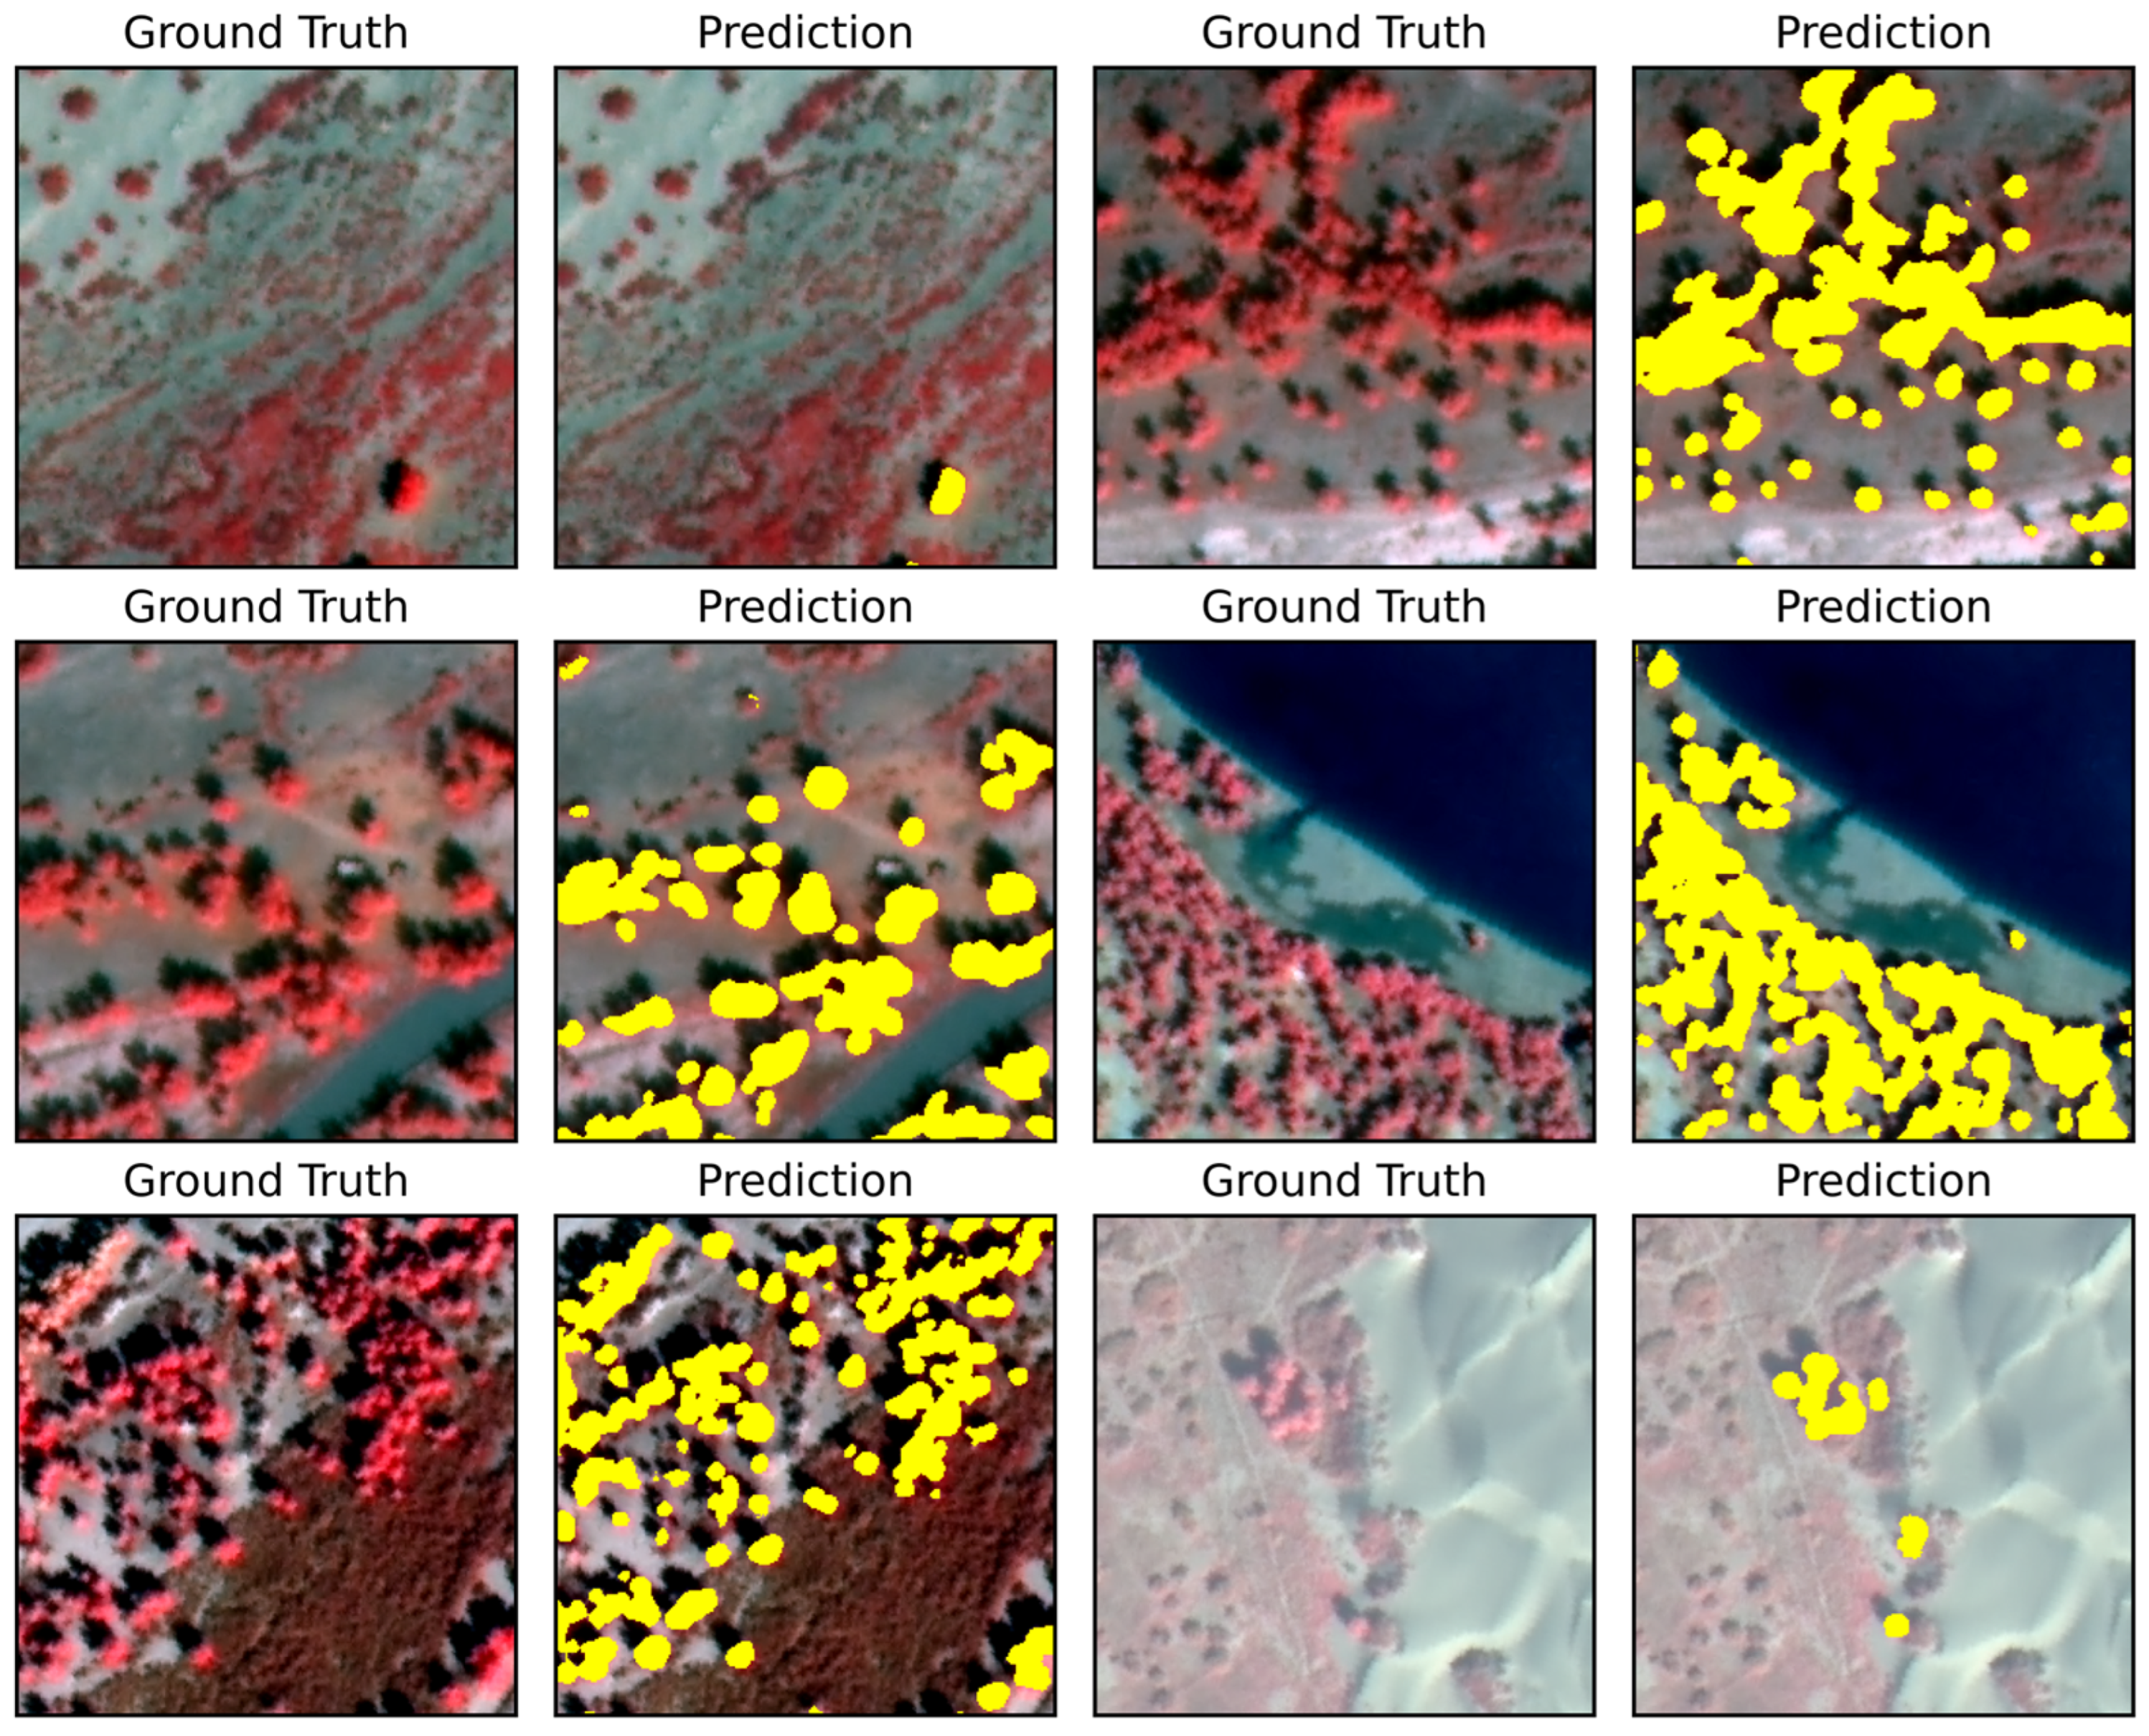
Based on the optimized labels, the SPS-Net model was trained using the false-color sample set with the following settings: maximum number of epochs = 100, batch size = 16, initial learning rate = 0.0001. Prediction accuracy indicates that the SPS-Net model, built upon U-Net, performs excellently. The SPS-Net model showed significant improvement across four accuracy metrics: IoU reached 0.798 (Figure 8), a 6.3% increase over the initial U-Net model; Dice improved by 3.7%; Precision improved by 4.1%; and Recall increased by about 2.7%. Prediction images show that the model can effectively identify sparse Populus euphratica forests from complex backgrounds (Figure 9). It maintains good stability across multi-class, complex land cover backgrounds (desert areas, river and lake edges, desert transition zones, Populus euphratica and Tamarix chinensis coexistence zones, etc.), with prediction results highly consistent with ground truth annotations. Based on GF-2 data, using the U-Net network as the baseline model to construct a lightweight, low-cost scheme suitable for sparse Populus euphratica forests identification is feasible.
Figure 8.
Changes in IoU, Dice, Precision, Recall, and PA during the training iteration of the Populus euphratica segmentation network.
Figure 9.
Example of Populus euphratica network prediction results. ‘Ground Truth’ is the original ground image; ‘Prediction’ is the prediction result. The yellow mask represents Populus euphratica.
4.4. SPS-Net Model Testing
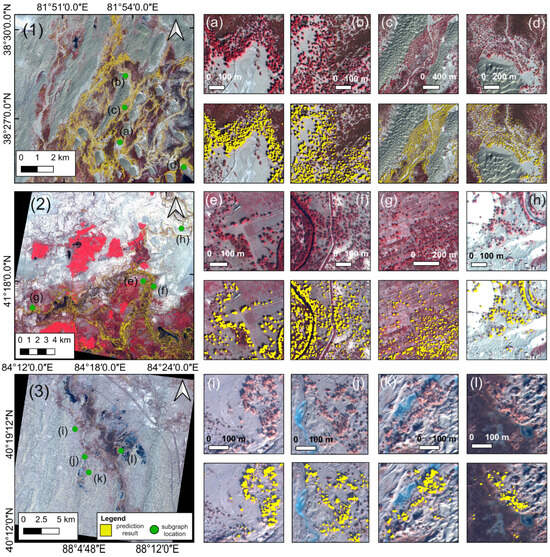
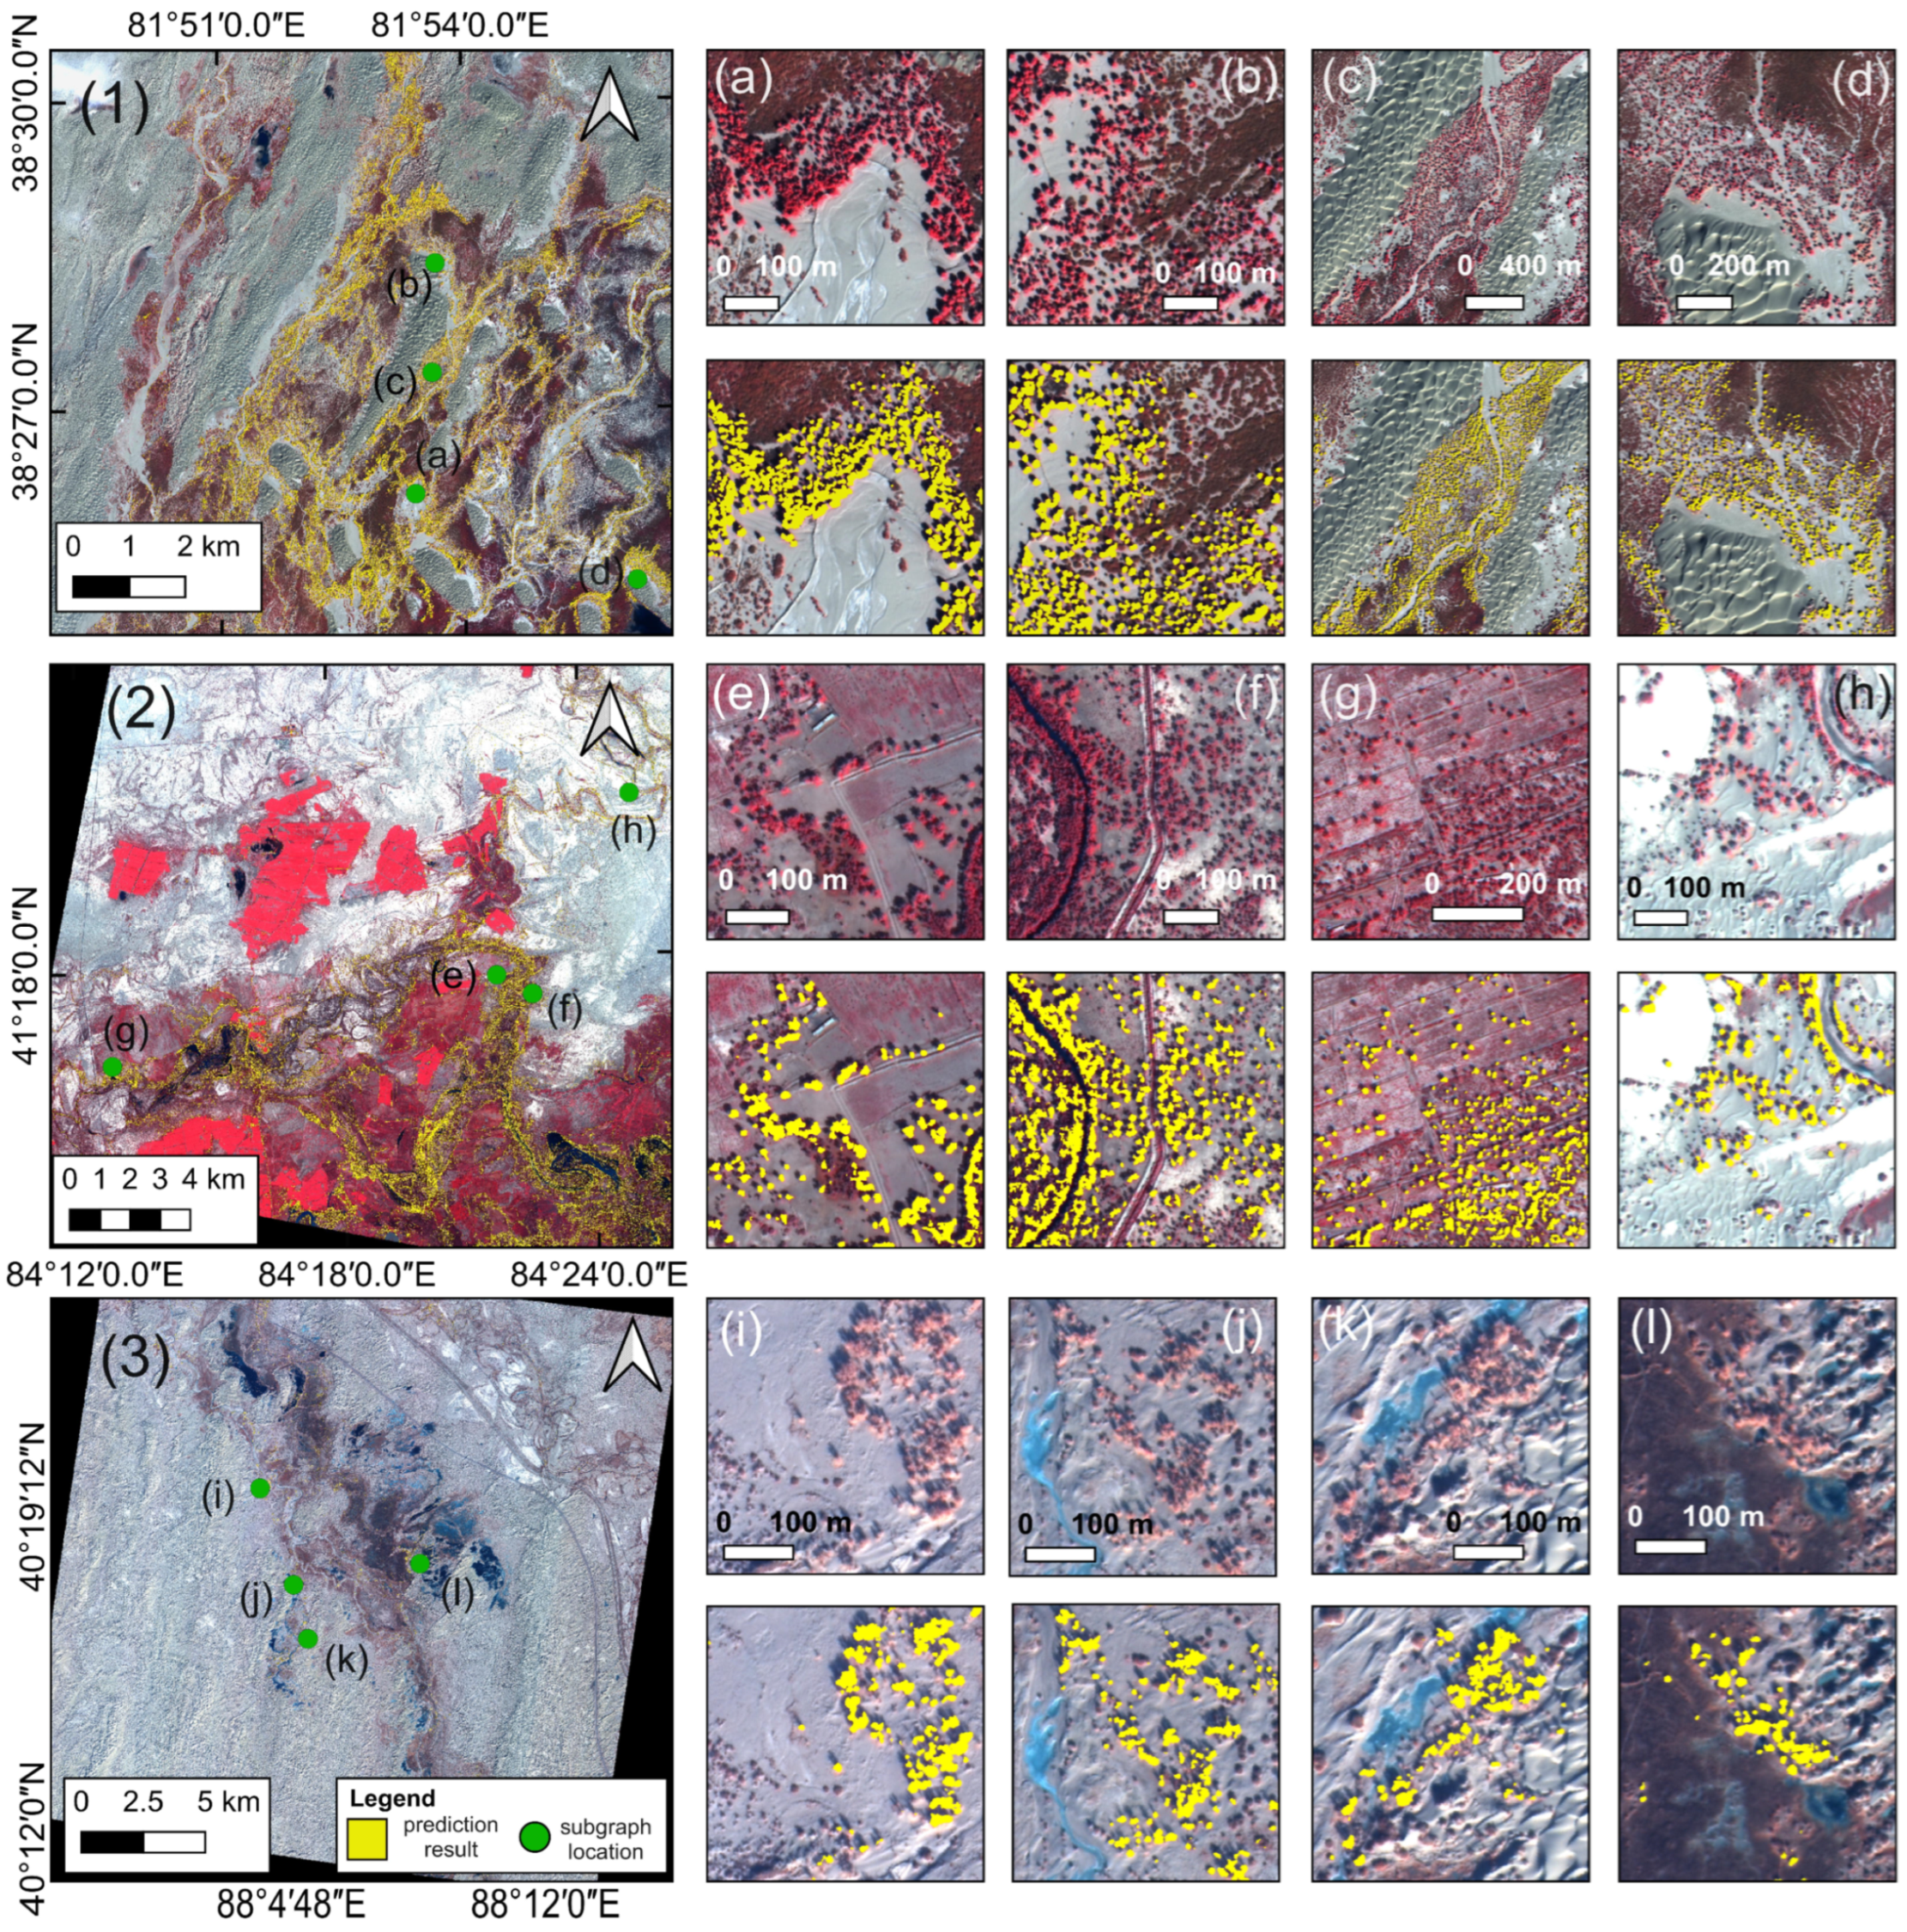
Three scenes of GF-2 imagery from typical sparse Populus euphratica forests areas were selected for further testing of the model’s generalization ability. Image 1 is located in the terminal oasis of the Keriya River (81.8°E–82°E, 38.3°N–38.5°N), within the Taklimakan Desert. The oasis contains large areas of sparse Populus euphratica forests, with main vegetation being Populus euphratica and Tamarix chinensis. Image 2 is located in the middle reaches of the Tarim River, on the northern edge of the Taklimakan Desert (84.2°E–84.4°E, 41.2°N–41.4°N). This area has complex land cover types, including farmland, wetland, desert, rivers, and lakes, with sparse Populus euphratica in the northern desert region. Image 3 is located in the lower reaches of the Tarim River (88.0°E–88.2°E, 40.1°N–40.3°N), on the eastern side of the Taklimakan Desert. The area is dominated by desert and gobi, with sparse Populus euphratica distributed along the riverbanks.
A transfer test was conducted on the SPS-Net model. The results show that the model maintains good accuracy stability in large-scale sparse Populus euphratica forests identification tasks. In cross-regional tasks over large spatial extents, it maintains high classification accuracy. In multi-class, complex land cover scenarios (Figure 10), it ensures accurate identification of sparse Populus euphratica forests, rarely missing individual sparse trees. The identified contours of individual sparse trees closely fit the actual situation. At a large spatial scale, its prediction results are largely consistent with the spatial pattern of Populus euphratica distribution along river channels. Overall, the network demonstrates broad applicability and strong generalization capability in real, complex scenarios.
Figure 10.
Identification results of the SPS-Net on GF-2 imagery. (1) Test image 1, located in the hinterland of Taklimakan Desert, with an imaging date of 14 October 2023. (2) Test image 2, located in the middle reaches of the Tarim River, with an imaging date of 19 September 2023. (3) Test image 3, located in the lower reaches of the Tarim River, with an imaging date of 31 December 2022. (a–l) represent close-up views of the identification results of the sparse Populus euphratica forests.
5. Discussion
5.1. Main Difficulties in Precise Identification of Sparse Populus euphratica Forests
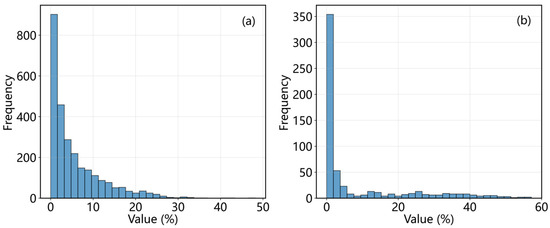
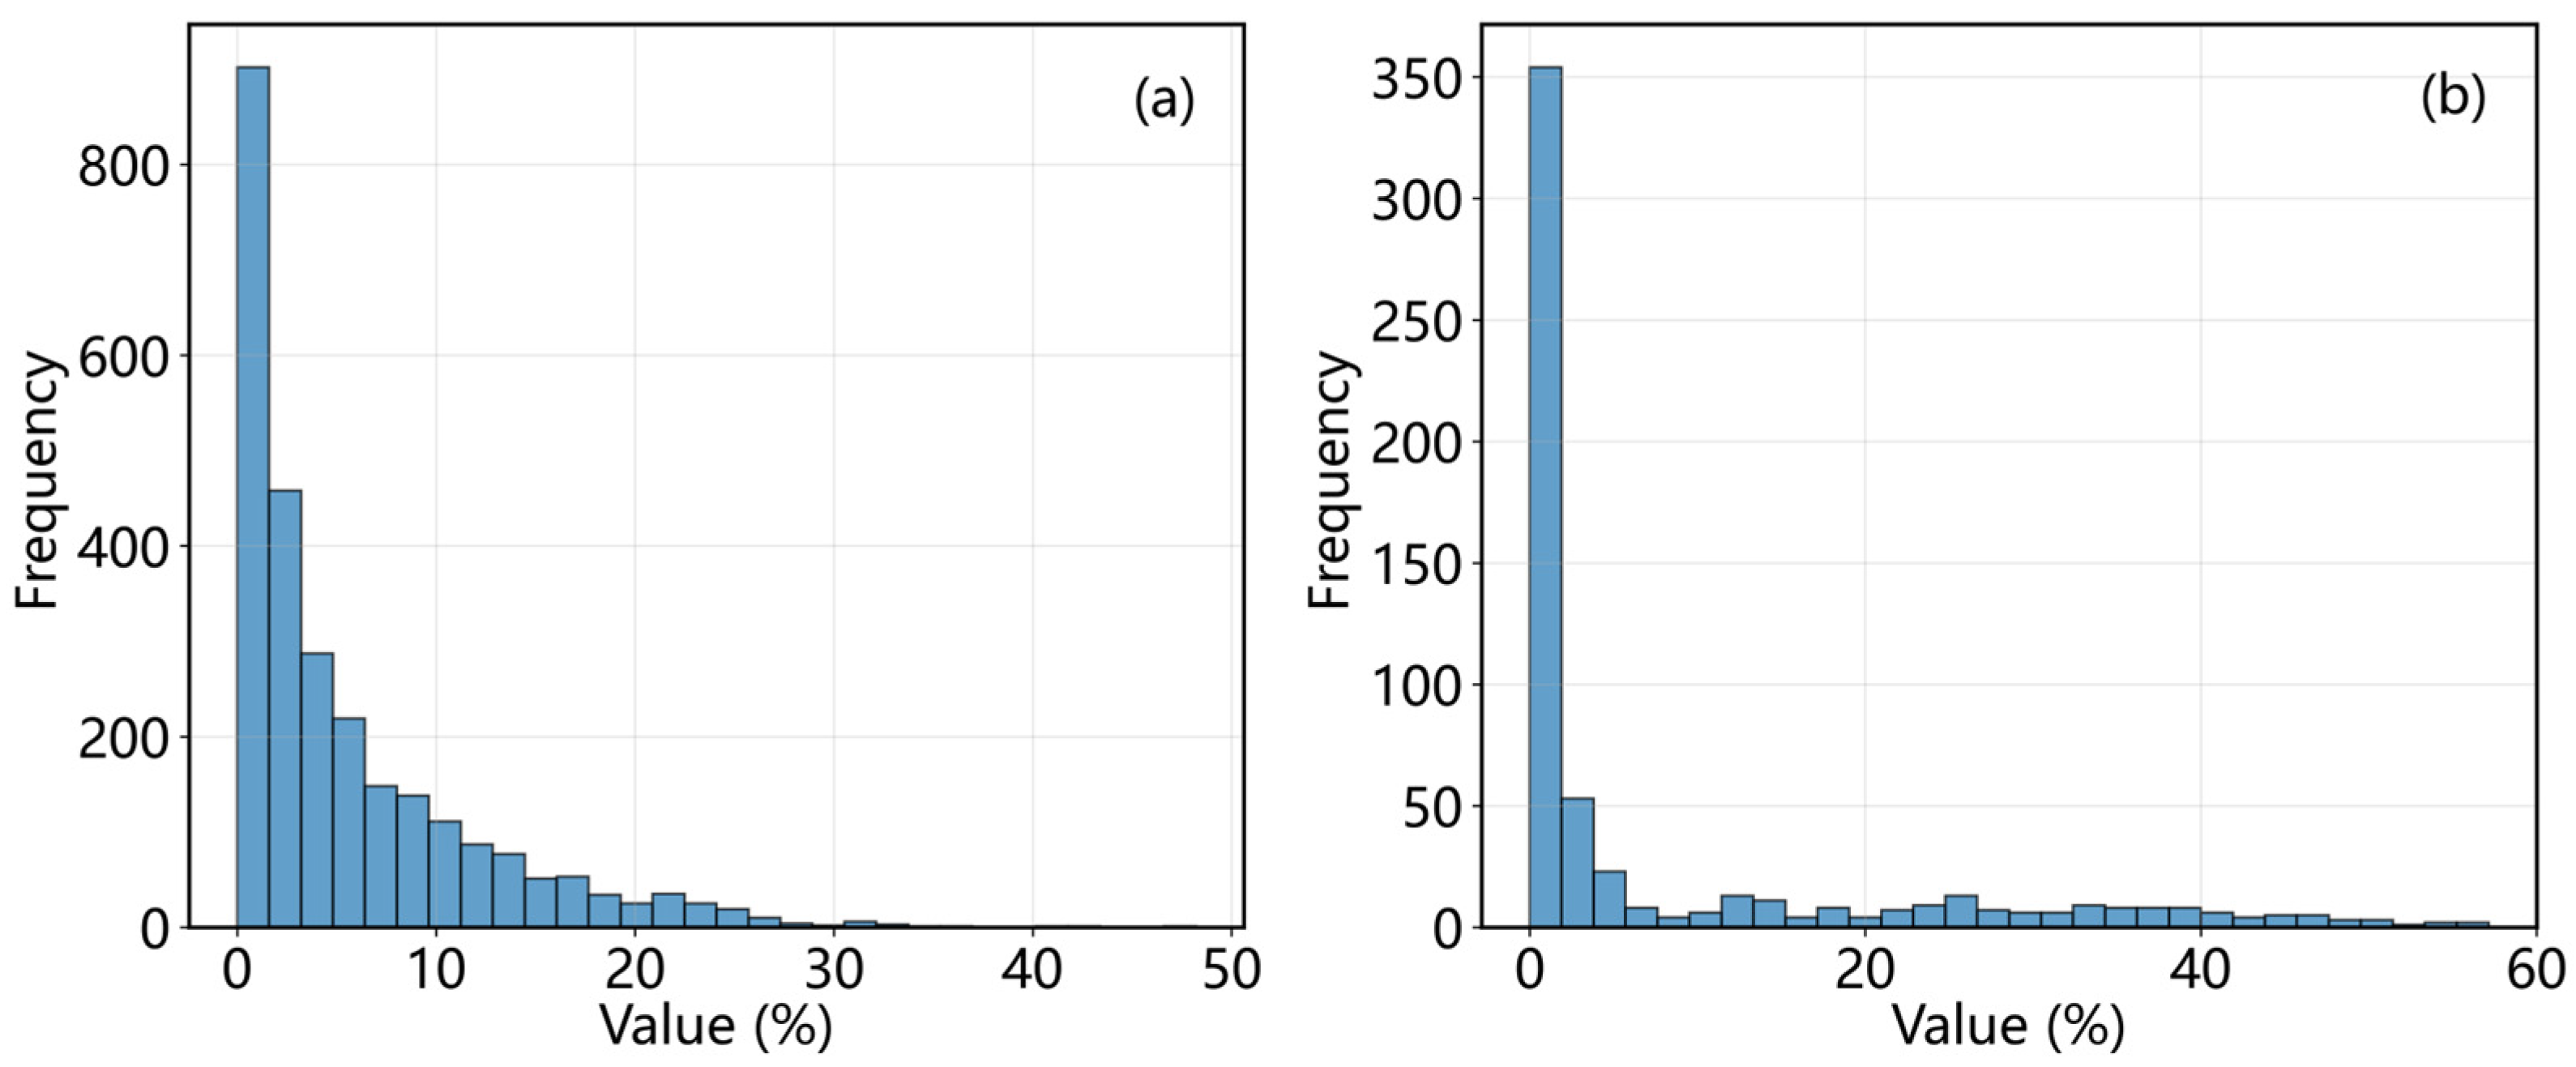
Isolated, small-crown Populus euphratica trees present a challenge in sparse forests extraction. The identification of sparse Populus euphratica forests involves a large number of isolated, small-crown individual trees. This study constructed a labeled sample set for sparse Populus euphratica forests containing 3299 images. In the training sample dataset, approximately 81% of the images had a Populus euphratica pixel proportion less than 10%. In the validation sample set, about 74% of the images had a Populus euphratica pixel proportion less than 10% (Figure 11). The large disparity between target and background pixel proportions causes the model to be insensitive to target signals, significantly weakening identification accuracy.
Figure 11.
Statistics of Populus euphratica pixel proportion in labeled images. (a) Frequency of Populus euphratica pixel proportion in the training set. (b) Frequency of Populus euphratica pixel proportion in the validation set.
5.2. Effectiveness Analysis of GF-2 Data
The combination of the sub-meter data advantages of GF-2 imagery and the spatial information mining capability of deep learning models constitutes an effective solution for recognizing Populus euphratica sparse forests. Firstly, the sub-meter spatial resolution (0.8 m) of GF-2 ensures the identifiability of Populus euphratica sparse forests at the data level. The crown widths of Populus euphratica trees are typically small. In medium-resolution imagery (e.g., Sentinel-2, 10 m), they often exist as mixed pixels, causing the target signal to be “diluted” by the background and making detection difficult. The resolution of GF-2 matches the scale of individual tree crowns, enabling the representation of fine structures such as crown contours, textures, and shadows, thereby effectively mitigating the mixed pixel problem [49]. At the data input level, GF-2 preserves a stronger “target signal,” laying a solid data foundation for subsequent recognition. Although its spectral information is limited, the morphological details provided by the high spatial resolution can compensate for the shortcomings in the spectral dimension and improve classification performance [64,65]. Secondly, deep learning models can effectively mine the spatial information within images, transforming raw pixels into discriminative high-level semantic features [42,66]. Through hierarchical convolutional structures, deep learning automatically learns abstract features ranging from edges and textures to shapes [67,68]. For Populus euphratica sparse forests, the model can effectively capture features such as its distinctive umbrella-shaped crown structure, textural contrast with the background soil, and shadow projection patterns. This enables the model to distinguish it from morphologically similar elements like Tamarix chinensis shrubs, bare land, or shadows within the complex desert background.
5.3. SPS-Net Architecture
To address challenges in sparse Populus euphratica forests recognition, such as blurred target boundaries and scale variations caused by the mixture of individual trees and patches, this study employs U-Net as the baseline model and constructs an improved segmentation network (SPS-Net) that integrates the max-pooling indices mechanism from SegNet and the Atrous Spatial Pyramid Pooling (ASPP) module from DeepLabv3+. The SPS-Net model incorporates targeted designs in two key aspects to enhance performance. First, the max-pooling indices mechanism from SegNet is utilized to strengthen the precise restoration of boundary features. To tackle the difficulty in boundary localization caused by the small crown size and blurred edges of Populus euphratica, the standard skip connections in the U-Net architecture are replaced with SegNet’s max-pooling indices mechanism. Although U-Net’s skip connections transmit spatial details, they also carry substantial background noise, exacerbating the aliasing of shallow features and deep semantics. The max-pooling indices mechanism records the locations of maximum responses during downsampling and performs non-linear upsampling in the decoder, enabling asymmetric spatial guidance that focuses the model on high-frequency information representing the edges of Populus euphratica crowns [56]. This design specifically targets the “small tree crown with blurred edges” characteristic of Populus euphratica sparse forests. Without introducing additional parameters, it strengthens the model’s ability to recover the contours of discrete small targets, avoiding boundary dilation or underfitting. Second, the ASPP module combined with residual convolution blocks enhances the model’s capacity to perceive multi-scale contextual information [69]. In Populus euphratica sparse forests imagery, there exist both small targets of individual trees and patch structures clustered along river channels. A single receptive field is insufficient to cover the “individual tree and patch” multi-scale coexistence and the complex background characteristics [70]. In this study, the ASPP module from DeepLabv3+ is integrated into the bottleneck layer. By employing parallel atrous convolutions with varying dilation rates, it broadens the receptive field while maintaining feature map resolution [71], enabling the model to simultaneously capture the local texture of individual trees and the macroscopic distribution patterns of clustered patches [69,72]. The incorporation of residual convolution blocks helps mitigate gradient issues associated with deeper networks, ensuring the integrity of feature transmission across layers [68,73]. This design helps overcome the spatial scale heterogeneity of Populus euphratica sparse forests, reduces missed detections caused by insufficient receptive fields, and enhances the model’s ability to suppress interference from the desert background.
5.4. Samples Optimization
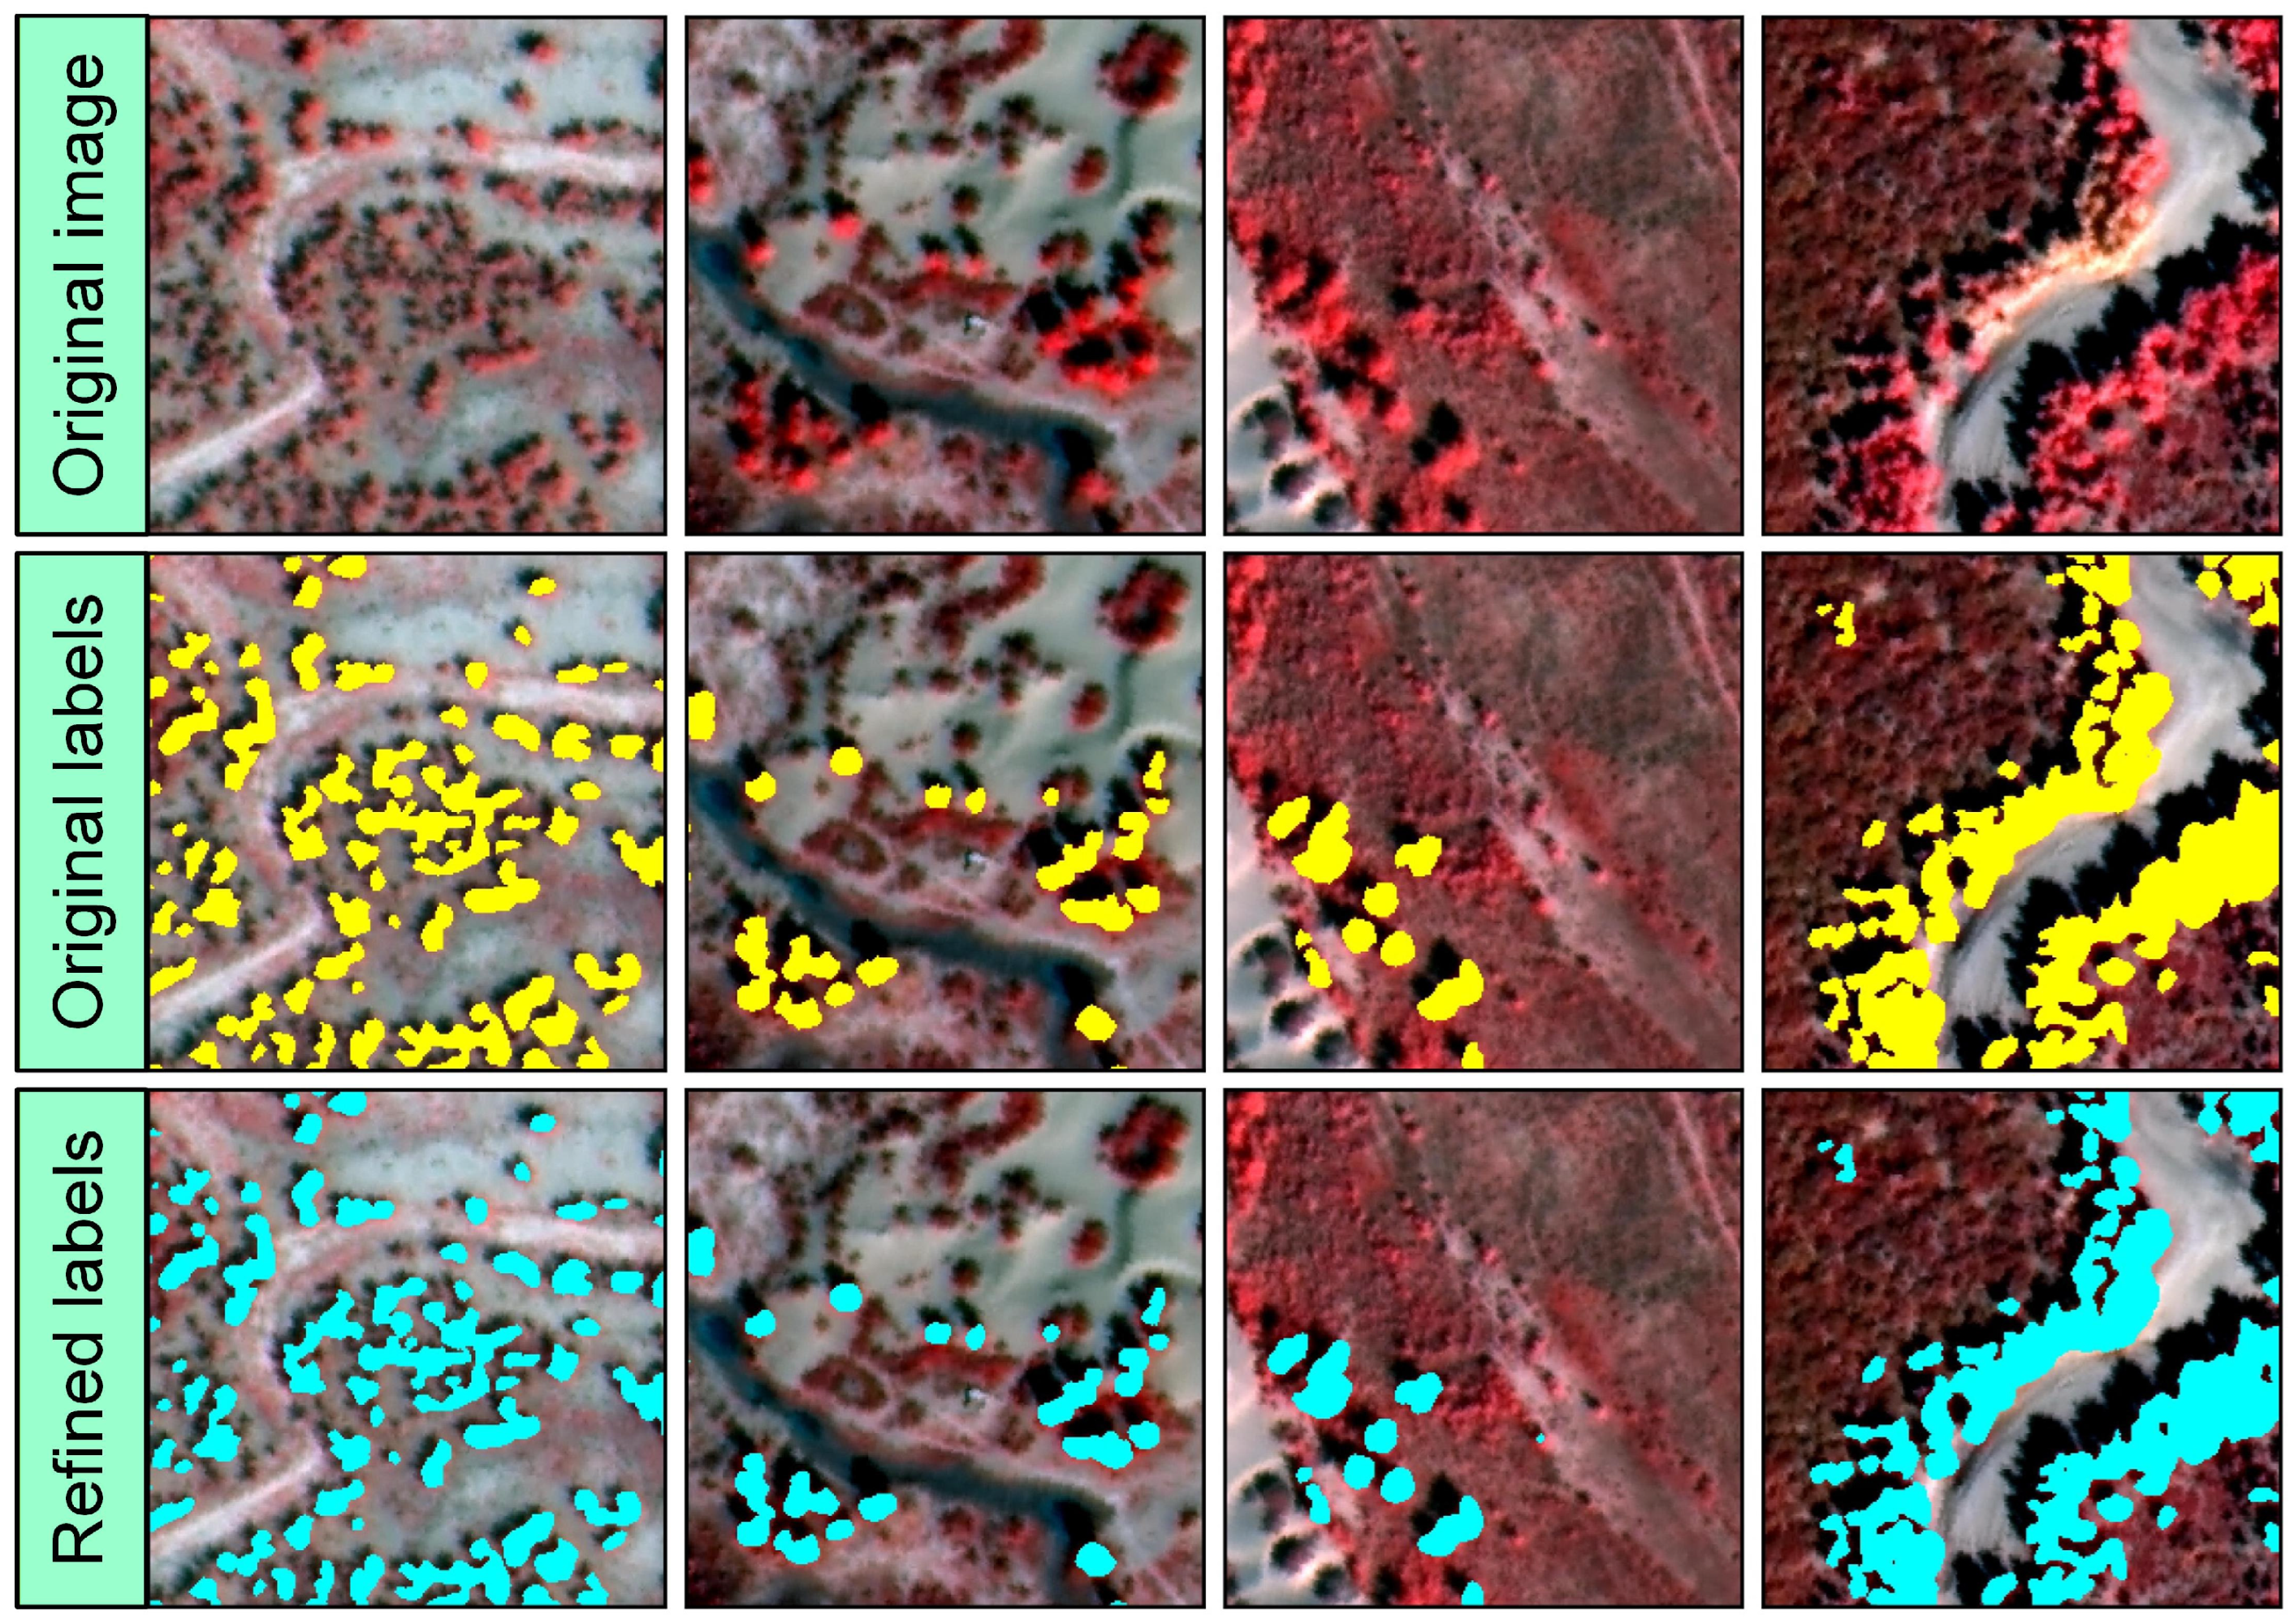
Optimizing the training sample set is an effective way to improve accuracy in small target identification tasks [63]. Given that MA-Net performed relatively well in the Populus euphratica segmentation task on the false-color dataset, we used its training set to train the model. The obtained model parameters were then used to predict all images in the training set. Finally, the prediction results were fused with the original manual annotations to obtain the corrected training set labels, while the validation set was completely isolated from the optimization process. The average IoU between the optimized labels and the original labels was 0.9218, indicating relatively minor overall changes. This optimization mainly adjusted the boundary regions of Populus euphratica. The optimized labels still largely retained the overall information of the original labels.
Comparing sample images before and after optimization (Figure 12), the results show that optimization primarily focused on label edges. Specifically, it included removing some shadow pixels inside or at the edges of Populus euphratica and supplementing some edge pixels and Populus euphratica pixels missed in the original labels. The corrected labels have more accurate, smooth, and natural boundaries, closer to actual land cover distribution, while also preserving the patch information from the original manual labels.
Figure 12.
Effect of label boundary optimization. Yellow indicates original label pixels; cyan indicates corrected label pixels.
The optimized false-color training set labels were used to train nine models, including U-Net and SegNet, to evaluate their training accuracy and prediction performance on the optimized labels. Both accuracy comparison and prediction effects (Figure 13) indicate that optimized labels help achieve higher accuracy in the sparse Populus euphratica forests segmentation task. Among them, DeepLabV3+ showed the most significant improvement in IoU and Dice metrics, reaching 0.7641 and 0.8663 (Table 2), respectively. U-Net++ achieved the highest PA and Precision, reaching 0.9795 and 0.8884. MA-Net had the highest Recall at 0.8685. Except for PSPNet, the overall accuracy of all models trained on the optimized labels improved compared to the original labels. Taking IoU as an example, except for PSPNet, the improvement for other models ranged between 0.3% and 6.9%, with SegNet showing the largest improvement and PAN the smallest.
Figure 13.
Comparison of prediction effects from various deep neural networks trained using optimized labels. The yellow mask in each subfigure represents Populus euphratica prediction results.
Table 2.
Model Accuracy of Each Model Trained on Optimized Labels.
6. Conclusions
This study focused on the fine identification of sparse Populus euphratica forests. Using GF-2 satellite imagery as the data source, we systematically compared nine mainstream deep learning models to select a suitable baseline model for this task and subsequently constructed the SPS-Net segmentation network. The main conclusions are as follows:
- (1)
- False-color imagery synthesized from near-infrared, red, and green bands helps improve the accuracy of deep learning models. Compared to true-color imagery, the average IoU of the nine models on the false-color data shows a relative improvement of about 20%, resulting in more stable identification and clearer boundaries.
- (2)
- Four models—U-Net, U-Net++, DeepLabV3+, and MA-Net—performed well in the sparse Populus euphratica forests task, with IoU exceeding 0.75 based on the false-color dataset.
- (3)
- Using U-Net as the baseline model, this study introduced the max-pooling indices mechanism, Atrous Spatial Pyramid Pooling (ASPP), and residual connection modules to construct SPS-Net. This model demonstrated good accuracy in the sparse Populus euphratica forests identification task, achieving an IoU of 0.8, a relative improvement of approximately 6.3% over the baseline model. SPS-Net exhibits good adaptability and stability for extracting sparse Populus euphratica forests under complex background conditions, and can provide data support for the dynamic monitoring, ecological restoration, and sustainable management of natural Populus euphratica forests.
Author Contributions
Conceptualization, H.L. and J.Z.; methodology, H.L. and J.Z.; software, H.L. and Q.Z.; validation, H.L., Q.Z. and J.Z.; formal analysis, H.L.; investigation, J.Z.; resources, S.L. and Q.S.; data curation, S.L.; writing—original draft preparation, H.L. and J.Z.; writing—review and editing, H.L. and J.Z.; visualization, H.L.; supervision, S.L. and Q.S.; project administration, S.L.; funding acquisition, S.L. All authors have read and agreed to the published version of the manuscript.
Funding
This work was supported by the National Key R&D Program of China [No. 2023YFF1303802] and the National Natural Science Foundation of China [NSFC, Grant No. 32201349].
Data Availability Statement
The original contributions presented in this study are included in the article; further inquiries can be directed to the corresponding author.
Conflicts of Interest
The authors declare no conflicts of interest.
Abbreviations
The following abbreviations are used in this manuscript:
| GF-2 | Gaofen-2 |
| SPS-Net | Sparse Populus euphratica forest Segmentation Network |
| IoU | Intersection over Union |
| ASPP | Atrous Spatial Pyramid Pooling |
References
- Aishan, T.; Halik, Ü.; Betz, F.; Gärtner, P.; Cyffka, B. Modeling height–diameter relationship for Populus euphratica in the Tarim riparian forest ecosystem, Northwest China. J. For. Res. 2016, 27, 889–900. [Google Scholar] [CrossRef] [Scilit]
- Lang, P.; Jeschke, M.; Wommelsdorf, T.; Backes, T.; Lv, C.; Zhang, X.; Thomas, F.M. Wood harvest by pollarding exerts long-term effects on Populus euphratica stands in riparian forests at the Tarim River, NW China. For. Ecol. Manag. 2015, 353, 87–96. [Google Scholar] [CrossRef] [Scilit]
- Rajput, V.D.; Minkina, T.; Yaning, C.; Sushkova, S.; Chapligin, V.A.; Mandzhieva, S. A review on salinity adaptation mechanism and characteristics of Populus euphratica, a boon for arid ecosystems. Acta Ecol. Sin. 2016, 36, 497–503. [Google Scholar] [CrossRef] [Scilit]
- Li, H.; Zou, J.; Zhao, Q.; Hu, J.; Liu, S.; Shi, Q.; Cheng, W. Delineating the Distribution Outline of Populus euphratica in the Mainstream Area of the Tarim River Using Multi-Source Thematic Classification Data. Remote Sens. 2026, 18, 157. [Google Scholar] [CrossRef] [Scilit]
- Li, H.; Shi, Q.; Wan, Y.; Shi, H.; Imin, B. Using Sentinel-2 Images to Map the Populus euphratica Distribution Based on the Spectral Difference Acquired at the Key Phenological Stage. Forests 2021, 12, 147. [Google Scholar] [CrossRef] [Scilit]
- Chen, Y.; Chen, Y.; Li, W.; Zhang, H. Response of the accumulation of proline in the bodies of Populus euphratica to the change of groundwater level at the lower reaches of Tarim River. Chin. Sci. Bull. 2003, 48, 1995–1999. [Google Scholar] [CrossRef] [Scilit]
- Guo, X.; Li, J.; Zhang, J.; Wei, C.; Li, Z. Vegetation growth improvement Inadequately represents the ecological restoration of the Populus euphratica forests in Xinjiang, China. Ecol. Indic. 2025, 170, 113086. [Google Scholar] [CrossRef] [Scilit]
- Wan, Y.; Peng, L.; Li, H.; Anwaier, A.; Li, D.; Ma, Y.; Dai, Y.; Shi, Q. Water-use characteristics of Populus euphratica trees in response to flood and groundwater depth in desert oasis. Environ. Exp. Bot. 2024, 226, 105915. [Google Scholar] [CrossRef] [Scilit]
- Wang, D.; Yu, Z.; Peng, G.; Zhao, C.; Ding, J.; Zhang, X. Water use strategies of Populus euphratica seedlings under groundwater fluctuation in the Tarim River Basin of Central Asia. CATENA 2018, 166, 89–97. [Google Scholar] [CrossRef] [Scilit]
- Chen, Y.; Chen, Y.; Xu, C.; Ye, Z.; Li, Z.; Zhu, C.; Ma, X. Effects of ecological water conveyance on groundwater dynamics and riparian vegetation in the lower reaches of Tarim River, China. Hydrol. Process. 2010, 24, 170–177. [Google Scholar] [CrossRef] [Scilit]
- Ling, H.; Zhang, P.; Xu, H.; Zhao, X. How to Regenerate and Protect Desert Riparian Populus euphratica Forest in Arid Areas. Sci. Rep. 2015, 5, 15418. [Google Scholar] [CrossRef] [Scilit] [PubMed]
- Arkin, A.; Yusup, A.; Halik, Ü.; Abliz, A.; Ainiwaer, A.; Tian, A.; Mijiti, M. Unveiling Population Structure Dynamics of Populus euphratica Riparian Forests Along the Tarim River Using Terrestrial LiDAR. Forests 2025, 16, 368. [Google Scholar] [CrossRef] [Scilit]
- Halik, Ü.; Aishan, T.; Betz, F.; Kurban, A.; Rouzi, A. Effectiveness and challenges of ecological engineering for desert riparian forest restoration along China’s largest inland river. Ecol. Eng. 2019, 127, 11–22. [Google Scholar] [CrossRef] [Scilit]
- Yusup, A.; Halik, Ü.; Abliz, A.; Aishan, T.; Keyimu, M.; Wei, J. Population Structure and Spatial Distribution Pattern of Populus euphratica Riparian Forest Under Environmental Heterogeneity Along the Tarim River, Northwest China. Front. Plant Sci. 2022, 13, 844819. [Google Scholar] [CrossRef] [Scilit]
- Guo, Y.; Li, X.; Zhao, Z.; Wei, H. Modeling the distribution of Populus euphratica in the Heihe River Basin, an inland river basin in an arid region of China. Sci. China Earth Sci. 2018, 61, 1669–1684. [Google Scholar] [CrossRef] [Scilit]
- Li, H.; Zhao, Q.; Hu, J.; Zou, J.; Ding, C.; Ji, L.; Liu, S.; Cheng, W. Populus euphratica extraction based on deep learning of spatiotemporal Information using Sentinel data. Int. J. Remote Sens. 2025, 46, 6322–6349. [Google Scholar] [CrossRef] [Scilit]
- Neyns, R.; Canters, F. Mapping of Urban Vegetation with High-Resolution Remote Sensing: A Review. Remote Sens. 2022, 14, 1031. [Google Scholar] [CrossRef] [Scilit]
- Mohammadpour, P.; Viegas, D.X.; Viegas, C. Vegetation Mapping with Random Forest Using Sentinel 2 and GLCM Texture Feature—A Case Study for Lousã Region, Portugal. Remote Sens. 2022, 14, 4585. [Google Scholar] [CrossRef] [Scilit]
- Xiahou, M.; Peng, M.; Shen, Z.; Wen, Q.; Wang, C.; Liu, Y.; Zhang, Q.; Peng, L.; Yu, C.; Ou, X.; et al. Vegetation mapping of Yunnan Province by integrating remote sensing, field observations, and models. Sci. China Earth Sci. 2025, 68, 836–849. [Google Scholar] [CrossRef] [Scilit]
- Horvath, P.; Halvorsen, R.; Simensen, T.; Bryn, A. A comparison of three ways to assemble wall-to-wall maps from distribution models of vegetation types. GISci. Remote Sens. 2021, 58, 1458–1476. [Google Scholar] [CrossRef] [Scilit]
- Peng, Y.; He, G.; Wang, G. Spatial-temporal analysis of the changes in Populus euphratica distribution in the Tarim National Nature Reserve over the past 60 years. Int. J. Appl. Earth Obs. Geoinf. 2022, 113, 103000. [Google Scholar] [CrossRef] [Scilit]
- Peng, Y.; He, G.; Wang, G.; Zhang, Z. Large-Scale Populus euphratica Distribution Mapping Using Time-Series Sentinel-1/2 Data in Google Earth Engine. Remote Sens. 2023, 15, 1585. [Google Scholar] [CrossRef] [Scilit]
- Zou, J.; Li, H.; Ding, C.; Liu, S.; Shi, Q. Mapping Natural Populus euphratica Forests in the Mainstream of the Tarim River Using Spaceborne Imagery and Google Earth Engine. Remote Sens. 2024, 16, 3429. [Google Scholar] [CrossRef] [Scilit]
- Guo, X.; Zhu, L.; Yang, Z.; Yang, C.; Li, Z. Spatial–Temporal Changes in the Distribution of Populus euphratica Oliv. Forests in the Tarim Basin and Analysis of Influencing Factors from 1990 to 2020. Forests 2024, 15, 1384. [Google Scholar] [CrossRef] [Scilit]
- Immitzer, M.; Atzberger, C.; Koukal, T. Tree Species Classification with Random Forest Using Very High Spatial Resolution 8-Band WorldView-2 Satellite Data. Remote Sens. 2012, 4, 2661–2693. [Google Scholar] [CrossRef] [Scilit]
- Wang, H.; Li, J.; Van de Voorde, T.; Zhou, C.; De Maeyer, P.; Ma, Y.; Shen, Z. Individual Populus euphratica Tree Detection in Sparse Desert Forests Based on Constrained 2-D Bin Packing. IEEE Trans. Geosci. Remote Sens. 2024, 62, 4407219. [Google Scholar] [CrossRef] [Scilit]
- Zhou, G.; Yu, L.; Gao, E.; Lu, Y. DMEFF-Net: A Dynamic Multiscale Enhanced Feature Fusion Model for Small Object Detection in Remote Sensing Images. IEEE J. Sel. Top. Appl. Earth Obs. Remote Sens. 2026, 19, 1006–1022. [Google Scholar] [CrossRef] [Scilit]
- Lechner, A.M.; Stein, A.; Jones, S.D.; Ferwerda, J.G. Remote sensing of small and linear features: Quantifying the effects of patch size and length, grid position and detectability on land cover mapping. Remote Sens. Environ. 2009, 113, 2194–2204. [Google Scholar] [CrossRef] [Scilit]
- Ji, W.; Wang, L. Discriminating Saltcedar (Tamarix ramosissima) from Sparsely Distributed Cottonwood (Populus euphratica) Using a Summer Season Satellite Image. Photogramm. Eng. Remote Sens. 2015, 81, 795–806. [Google Scholar] [CrossRef] [Scilit]
- Liu, H.; Li, X.; Wang, L.; Zhang, Y.; Wang, Z.; Lu, Q. MS-YOLOv11: A Wavelet-Enhanced Multi-Scale Network for Small Object Detection in Remote Sensing Images. Sensors 2025, 25, 6008. [Google Scholar] [CrossRef] [Scilit]
- Siddique, A.; Li, Z.; Azeem, A.; Zhang, Y.; Li, Y. Dual-Scale Former with Fourier Feature Pyramid Network for Tiny Object Detection in Remote Sensing. Expert Syst. Appl. 2025, 288, 127618. [Google Scholar] [CrossRef] [Scilit]
- Zhu, Z.; Zheng, R.; Qi, G.; Li, S.; Li, Y.; Gao, X. Small Object Detection Method Based on Global Multi-Level Perception and Dynamic Region Aggregation. IEEE Trans. Circuits Syst. Video Technol. 2024, 34, 10011–10022. [Google Scholar] [CrossRef] [Scilit]
- Zhang, H.; Li, X. Spatial distribution pattern of Populus euphratica populations in the lower reaches of tarim river. Acta Bot. Boreali-Occident. Sin. 2006, 26, 2125–2130. [Google Scholar]
- Chen, P.; Ren, Y.; Zhang, B.; Zhao, Y. Class Imbalance in the Automatic Interpretation of Remote Sensing Images: A Review. IEEE J. Sel. Top. Appl. Earth Obs. Remote Sens. 2025, 18, 9483–9508. [Google Scholar] [CrossRef] [Scilit]
- Xu, Y.; Ji, H. Contextual-Semantic Interactive Perception Network for Small Object Detection in UAV Aerial Images. Remote Sens. 2025, 17, 3581. [Google Scholar] [CrossRef] [Scilit]
- Tian, Z.; Chen, Z.; Sun, Q. Learning De-Biased Representations for Remote-Sensing Imagery. Adv. Neural Inf. Process. Syst. 2024, 37, 57970–57992. [Google Scholar]
- Shi, D.; Zhao, C.; Shao, J.; Feng, M.; Luo, L.; Ouyang, B.; Huang, J. Context-Aware Enhanced Feature Refinement for small object detection with Deformable DETR. Front. Neurorobot. 2025, 19, 1588565. [Google Scholar] [CrossRef] [Scilit]
- Elizar, E.; Zulkifley, M.A.; Muharar, R.; Zaman, M.H.; Mustaza, S.M. A Review on Multiscale-Deep-Learning Applications. Sensors 2022, 22, 7384. [Google Scholar] [CrossRef] [Scilit]
- Jin, H.; Li, H. An enhanced approach for few-shot segmentation via smooth downsampling mask and label smoothing loss. Image Vis. Comput. 2024, 148, 105113. [Google Scholar] [CrossRef] [Scilit]
- Ji, X.; Chang, J.; Ji, Y. Adaptive Separation Fusion: A Novel Downsampling Approach in CNNS. J. Artif. Intell. Soft Comput. Res. 2024, 15, 14. [Google Scholar] [CrossRef] [Scilit]
- Wu, J.; Pan, Z.; Lei, B.; Hu, Y. LR-TSDet: Towards Tiny Ship Detection in Low-Resolution Remote Sensing Images. Remote Sens. 2021, 13, 3890. [Google Scholar] [CrossRef] [Scilit]
- Zhang, J.; Zhao, X.; Gao, G. MKSNet: Advanced Small Object Detection in Remote Sensing Imagery with Multi-Kernel and Dual Attention Mechanisms. In Proceedings of the MultiMedia Modeling; Springer: Singapore, 2025; pp. 394–407. [Google Scholar]
- Liu, Y.; Ji, Y.; Ren, Q.; Shi, B.; Liu, N.; Lu, M.; Wu, N. An Innovative Small-Target Detection Approach Against Information Attenuation: Fusing Enhanced Programmable Gradient Information and a Novel Mamba Module. Sensors 2025, 25, 2117. [Google Scholar] [CrossRef] [Scilit]
- Assefa, A.A.; Tian, W.; Acheampong, K.N.; Aftab, M.U.; Ahmad, M. Small-Scale and Occluded Pedestrian Detection Using Multi Mapping Feature Extraction Function and Modified Soft-NMS. Comput. Intell. Neurosci. 2022, 2022, 9325803. [Google Scholar] [CrossRef] [Scilit]
- Guo, R.; Gui, Y.; Zhang, J.; Li, F. Learnable Bilateral Downsampling and Triple-Augmented Feature Fusion in YOLOv8 for Small Object Detection of UAV Aerial Images. In Proceedings of the Neural Information Processing; Springer: Singapore, 2026; pp. 393–408. [Google Scholar]
- Liu, X.; Zhou, S.; Ma, J.; Sun, Y.; Zhang, J.; Zuo, H. DFAS-YOLO: Dual Feature-Aware Sampling for Small-Object Detection in Remote Sensing Images. Remote Sens. 2025, 17, 3476. [Google Scholar] [CrossRef] [Scilit]
- Tang, Z.; Xuan, C.; Zhang, T.; Gao, X.; Liu, S.; Zhang, M. Assessment of plant diversity index in degraded desert grassland using UAV hyperspectral multimodal data and Encoder-CNN. Sci. Rep. 2025, 15, 30678. [Google Scholar] [CrossRef] [Scilit]
- Li, R.; Zhao, J.; Fan, Y. Research on CTSA-DeepLabV3+ Urban Green Space Classification Model Based on GF-2 Images. Sensors 2025, 25, 3862. [Google Scholar] [CrossRef] [Scilit] [PubMed]
- He, G.; Li, S.; Huang, C.; Xu, S.; Li, Y.; Jiang, Z.; Xu, J.; Yang, F.; Wan, W.; Zou, Q.; et al. Comparison of Algorithms and Optimal Feature Combinations for Identifying Forest Type in Subtropical Forests Using GF-2 and UAV Multispectral Images. Forests 2024, 15, 1327. [Google Scholar] [CrossRef] [Scilit]
- Lasaponara, R.; Masini, N. Pan-Sharpening Techniques to Enhance Archaeological Marks: An Overview. In Satellite Remote Sensing: A New Tool for Archaeology; Lasaponara, R., Masini, N., Eds.; Springer: Dordrecht, The Netherland, 2012; pp. 87–109. [Google Scholar]
- Maurer, T. How to Pan-Sharpen Images Using the Gram-Schmidt Pan-Sharpen Method—A Recipe. Int. Arch. Photogramm. Remote Sens. Spat. Inf. Sci. 2013, 40, 239–244. [Google Scholar] [CrossRef] [Scilit]
- Zhong, X.; Han, X.; Jia, X.; Huang, W.; Liu, W.; Su, S.; Yu, X.; Ye, M. ICLR: Instance Credibility-Based Label Refinement for label noisy person re-identification. Pattern Recognit. 2024, 148, 110168. [Google Scholar] [CrossRef] [Scilit]
- Kim, H.; Hwang, S.; Kwak, S.; Ok, J. Active label correction for semantic segmentation with foundation models. arXiv 2024, arXiv:2403.10820. [Google Scholar] [CrossRef] [Scilit]
- Ronneberger, O.; Fischer, P.; Brox, T. U-Net: Convolutional Networks for Biomedical Image Segmentation. In Proceedings of the Medical Image Computing and Computer-Assisted Intervention—MICCAI 2015; Springer: Cham, Switzerland, 2015; pp. 234–241. [Google Scholar]
- Zhao, H.; Shi, J.; Qi, X.; Wang, X.; Jia, J. Pyramid scene parsing network. In Proceedings of the IEEE Conference on Computer Vision and Pattern Recognition; CVF: New York, NY, USA, 2017; pp. 2881–2890. [Google Scholar]
- Badrinarayanan, V.; Kendall, A.; Cipolla, R. SegNet: A Deep Convolutional Encoder-Decoder Architecture for Image Segmentation. IEEE Trans. Pattern Anal. Mach. Intell. 2017, 39, 2481–2495. [Google Scholar] [CrossRef] [Scilit]
- Zhou, Z.; Rahman Siddiquee, M.M.; Tajbakhsh, N.; Liang, J. UNet++: A Nested U-Net Architecture for Medical Image Segmentation. In Proceedings of the Deep Learning in Medical Image Analysis and Multimodal Learning for Clinical Decision Support; Springer: Cham, Switzerland, 2018; pp. 3–11. [Google Scholar]
- Chen, L.-C.; Zhu, Y.; Papandreou, G.; Schroff, F.; Adam, H. Encoder-decoder with atrous separable convolution for semantic image segmentation. In Proceedings of the European Conference on Computer Vision (ECCV); CVF: New York, NY, USA, 2018; pp. 801–818. [Google Scholar]
- Li, H.; Xiong, P.; An, J.; Wang, L. Pyramid attention network for semantic segmentation. arXiv 2018, arXiv:1805.10180. [Google Scholar] [CrossRef] [Scilit]
- Xiao, T.; Liu, Y.; Zhou, B.; Jiang, Y.; Sun, J. Unified perceptual parsing for scene understanding. In Proceedings of the European Conference on Computer Vision (ECCV); CVF: New York, NY, USA, 2018; pp. 418–434. [Google Scholar]
- Fan, T.; Wang, G.; Li, Y.; Wang, H. MA-Net: A Multi-Scale Attention Network for Liver and Tumor Segmentation. IEEE Access 2020, 8, 179656–179665. [Google Scholar] [CrossRef] [Scilit]
- Xie, E.; Wang, W.; Yu, Z.; Anandkumar, A.; Alvarez, J.M.; Luo, P. SegFormer: Simple and efficient design for semantic segmentation with transformers. Adv. Neural Inf. Process. Syst. 2021, 34, 12077–12090. [Google Scholar]
- Isensee, F.; Jaeger, P.F.; Kohl, S.A.A.; Petersen, J.; Maier-Hein, K.H. nnU-Net: A self-configuring method for deep learning-based biomedical image segmentation. Nat. Methods 2021, 18, 203–211. [Google Scholar] [CrossRef] [Scilit]
- Ding, X.; Wang, X.; Guo, G.; Pu, Z.; Li, Z.; Liu, H.; Wang, Q. Land type classification based on U-net Using multispectral images of Gaofen-2 satellite. In Proceedings of the 2025 4th International Symposium on Robotics, Artificial Intelligence and Information Engineering (RAIIE), Zhenjiang, China, 6–8 June 2025; pp. 42–46. [Google Scholar]
- Ma, D.; Liu, B.; Huang, Q.; Zhang, Q. MwdpNet: Towards improving the recognition accuracy of tiny targets in high-resolution remote sensing image. Sci. Rep. 2023, 13, 13890. [Google Scholar] [CrossRef] [Scilit] [PubMed]
- Krizhevsky, A.; Sutskever, I.; Hinton, G. ImageNet Classification with Deep Convolutional Neural Networks. In Proceedings of the NIPS 2012; NeurIPS: New York, NY, USA, 2012. [Google Scholar]
- LeCun, Y.; Bengio, Y.; Hinton, G. Deep learning. Nature 2015, 521, 436–444. [Google Scholar] [CrossRef] [Scilit]
- He, K.; Zhang, X.; Ren, S.; Sun, J. Deep Residual Learning for Image Recognition. In Proceedings of the IEEE Conference on Computer Vision and Pattern Recognition (CVPR); IEEE: New York, NY, USA, 2016. [Google Scholar]
- Chen, L.C.; Papandreou, G.; Kokkinos, I.; Murphy, K.; Yuille, A.L. DeepLab: Semantic Image Segmentation with Deep Convolutional Nets, Atrous Convolution, and Fully Connected CRFs. IEEE Trans. Pattern Anal. Mach. Intell. 2018, 40, 834–848. [Google Scholar] [CrossRef] [Scilit] [PubMed]
- Hu, L.; Zhou, X.; Ruan, J.; Li, S. ASPP-LANet: A Multi-Scale Context Extraction Network for Semantic Segmentation of High-Resolution Remote Sensing Images. Remote Sens. 2024, 16, 1036. [Google Scholar] [CrossRef] [Scilit]
- Hong, Q.; Zhu, Y.; Liu, W.; Ren, T.; Shi, C.; Lu, Z.; Yang, Y.; Deng, R.; Qian, J.; Tan, C. A segmentation network for farmland ridge based on encoder-decoder architecture in combined with strip pooling module and ASPP. Front. Plant Sci. 2024, 15, 1328075. [Google Scholar] [CrossRef] [Scilit] [PubMed]
- Yu, F.; Koltun, V. Multi-Scale Context Aggregation by Dilated Convolutions. In Proceedings of the ICLR 2016, San Juan, Puerto Rico, 2–4 May 2016. [Google Scholar]
- Huang, G.; Liu, Z.; Maaten, L.V.D.; Weinberger, K.Q. Densely Connected Convolutional Networks. In Proceedings of the 2017 IEEE Conference on Computer Vision and Pattern Recognition (CVPR), Honolulu, HI, USA, 21–26 July 2017; pp. 2261–2269. [Google Scholar]

Disclaimer/Publisher’s Note: The statements, opinions and data contained in all publications are solely those of the individual author(s) and contributor(s) and not of MDPI and/or the editor(s). MDPI and/or the editor(s) disclaim responsibility for any injury to people or property resulting from any ideas, methods, instructions or products referred to in the content. |
© 2026 by the authors. Licensee MDPI, Basel, Switzerland. This article is an open access article distributed under the terms and conditions of the Creative Commons Attribution (CC BY) license.