Highlights
What are the main findings?
- A semi-supervised framework integrating Dynamic Mutual Training (DMT) and spatio-temporal weighting improved segmentation accuracy by 3.33 percentage points using only 24.5% labeled data.
- The proposed spatio-temporal decision mechanism reduced the false positive rate in non-burning seasons from 5.14% to 0.23%, effectively distinguishing agricultural fires from industrial and solar interferences.
What are the implications of the main findings?
- The approach advances fire attribution from static location overlays to dynamic spatio-temporal reasoning, resolving long-standing confusion between agricultural and non-agricultural thermal anomalies.
- This spatio-temporal framework significantly suppresses out-of-season false alarms and mitigates location bias, providing a robust and scalable tool for precise agricultural emission monitoring.
Abstract
Straw burning is a major source of regional air pollution. However, its reliable remote sensing detection faces problems in distinguishing agricultural fires from non-agricultural thermal anomalies, adequately leveraging burning seasonality, and overcoming the scarcity of pixel-level annotations. To comprehensively address these issues, this study proposes an end-to-end framework for straw burning identification that integrates spatio-temporal weighting and semi-supervised learning. The framework introduces a data-driven spatial weight optimization method to automatically learn discriminative weights for diverse land cover types (e.g., farmland, industry), replacing subjective empirical settings. Furthermore, a temporal weighting model, developed using Kernel Density Estimation, dynamically adjusts classification confidence according to historical burning seasonality, enhancing recall during peak seasons while suppressing off-season false positives. Finally, an adapted Dual-Backbone Dynamic Mutual Training (DB-DMT) strategy collaboratively leverages both limited labeled (24.5%) and abundant unlabeled (75.5%) high-resolution imagery, significantly improving model generalization in label-scarce scenarios. Validation across five representative regions of China demonstrated the framework’s superior performance, achieving a semantic segmentation mean Intersection over Union (mIoU) improvement of 3.33% (to 71.92%) and increasing precision in Henan from 95.21% to 97.71%. Crucially, the framework effectively reduced the off-season false positive rate (FPR) from 5.14% to a mere 0.23% in highly industrialized regions like Tianjin. By systematically mitigating both spatial geolocation bias and seasonal phenology confusion, our approach offers a robust and scalable solution for straw burning monitoring and a transferable paradigm for other environmental remote sensing applications.
1. Introduction
Open burning of crop residues, particularly rice and wheat straw, represents a critical yet episodic source of regional air pollution in agricultural regions worldwide. In China, the total theoretical yield of crop straw nationwide reached 700 million tonnes in 2014 [1], However, constrained by inadequate comprehensive utilization infrastructure, an estimated 100 million tons is still burned in situ despite government bans [2,3], contributing to severe regional haze events that can elevate ambient PM2.5 concentrations by 3–5 times within hours [4,5]. The implementation of China’s nationwide straw burning ban since 2015 has created urgent demand for large-scale, near-real-time monitoring systems to support enforcement [6]. However, traditional ground-based patrol methods face fundamental scalability problems: with over 2 million km2 of cropland distributed across diverse agricultural regions [7], field inspections cannot achieve the temporal coverage needed to detect short-duration burning events (often lasting only 1–3 h) or the spatial coverage to identify scattered hotspots across provincial boundaries.
Satellite-based thermal anomaly detection offers a transformative solution to this monitoring challenge. NASA’s Fire Information for Resource Management System (FIRMS), integrating data from the Visible Infrared Imaging Radiometer Suite (VIIRS) (375 m resolution) and the Moderate Resolution Imaging Spectroradiometer (MODIS) (1 km resolution), provides global coverage of active fire detections with 3–6 h latency [8,9]. However, their application to agricultural straw burning discrimination faces a fundamental attribution challenge: thermal anomalies cannot inherently distinguish between crop residue fires, forest fires, industrial heat sources (e.g., steel mills, power plants), or solar specular reflectors (e.g., photovoltaic panels, calm water surfaces) [10,11]. This spectral-thermal ambiguity is exacerbated by geolocation uncertainty—VIIRS fire centroids can be offset by 100–375 m from actual burn scars due to pixel size and geolocation errors [12]—making pixel-level land cover classification at the detected centroid unreliable. The challenge is particularly acute in China’s densely populated agricultural regions, where cropland is frequently interspersed with villages, factories, and infrastructure, creating heterogeneous “agricultural-industrial mosaic” landscapes [13].
Existing approaches to straw burning discrimination can be categorized into three paradigms, each with distinct limitations that constrain operational deployment.
The first paradigm employs land cover masking, where thermal anomalies are cross-referenced with static land use datasets such as the China Land Cover Dataset (CLCD, Wuhan University, Wuhan, China) [14], Dynamic World (DM) (Google, Mountain View, CA, USA) [15], or ESA WorldCover (ESRI, European Space Agency, Paris, France) [16] to filter fire points overlapping with cropland pixels. While computationally efficient (3–5 ms per fire point), this method suffers from three critical deficiencies: (i) the pixel-center assumption fails to account for geolocation uncertainty and can lead to systematic misclassification when the centroid falls on adjacent roads or buildings while the actual burn scar is in cropland [17]; (ii) spatial resolution mismatch between coarse thermal sensors (375 m–1 km) and fine-resolution land cover products (10–30 m) introduces mixed-pixel effects that dilute cropland signals in heterogeneous landscapes [18]; and (iii) temporal lag, as most land cover datasets are updated annually and cannot capture rapid land use transitions such as cropland converted to solar farms or industrial zones [19].
The second paradigm leverages deep learning, particularly Convolutional Neural Networks (CNNs), for semantic image understanding. Researchers have employed CNNs to extract hierarchical features from optical or thermal imagery, utilizing architectures like DeepLabV3+ to perform semantic segmentation of the land cover surrounding fire points, thereby inferring the fire source [20,21]. However, these supervised methods encounter two major barriers: (i) Prohibitive annotation costs—the efficacy of data-driven models is contingent on extensive pixel-level annotations, yet delineating fine-grained land cover boundaries in high-resolution imagery is labor-intensive and costly, limiting generalization across large-scale regions [22,23]; and (ii) Neglect of temporal patterns—most generic segmentation models focus solely on spatial features, ignoring the strong seasonal regularity (phenology) of straw burning, which leads to misclassification of industrial heat sources during non-planting seasons [24,25,26].
The third paradigm attempts multi-source data fusion, integrating thermal anomalies with auxiliary information such as burned area products [27,28], meteorological constraints [29], or crop phenology indices [30]. While theoretically promising, these methods encounter practical barriers: (i) data latency—burned area products like MODIS MCD64A1 have 8–16 day detection delays [31], unsuitable for near-real-time enforcement; (ii) regional calibration requirements—meteorological thresholds vary significantly across climate zones and require localized tuning [32]; and (iii) data availability inconsistencies, particularly for historical periods or cloud-contaminated regions [33].
While each aforementioned paradigm possesses distinct limitations when applied in isolation, their strategic integration creates a complementary synergy capable of fundamentally resolving the complex attribution challenge. Specifically, coupling multi-scale semantic segmentation with thermal anomaly detection elegantly resolves the spatial geolocation uncertainty inherent in single-pixel masking by analyzing broader contextual buffers. Simultaneously, integrating data-driven temporal phenology equips generic deep learning models with a crucial seasonal prior, effectively suppressing out-of-season non-agricultural thermal interference (e.g., industrial heat sources) that spatial models alone cannot distinguish. Finally, the strategic application of semi-supervised learning bypasses the prohibitive annotation bottleneck of traditional CNNs, extracting robust spatial features from limited and fragmented labeled data.
Despite the theoretical potential of these individual components, no existing framework has successfully unified these complementary strengths into a single, cohesive pipeline to simultaneously address: (i) spatial uncertainty in fire point geolocation; (ii) seasonal burning confusion without overfitting to non-agricultural heat sources; and (iii) severe label scarcity in high-resolution remote sensing.
To fill these critical gaps, this study proposes an end-to-end spatio-temporal decision framework that seamlessly integrates context-aware semantic segmentation, data-driven spatial weighting, and semi-supervised learning to achieve robust straw burning discrimination. The framework is built upon three innovations:
Selective Temporal Modulation applies temporal weighting exclusively to cropland while preserving fixed weights for non-agricultural sources, reflecting that straw burning is seasonally confined to harvest periods (May–June, September–October), whereas industrial emissions occur year-round.
Context-Aware Spatial Reasoning performs semantic segmentation on a contextual window surrounding each fire point, constructing a land cover composition vector that accounts for geolocation uncertainty. Spatial weights are optimized using Differential Evolution on expert-labeled data.
An Enhanced Dual-Backbone Dynamic Mutual Training (DB-DMT) adapts the original Dynamic Mutual Training (DMT) strategy [34] for remote sensing by iteratively exchanging high-quality pseudo-labels between architecturally distinct networks (Xception and MobileNetV2). Unlike the original single-backbone DMT—which relies on dynamic bias weights and risks confirmation bias—this bidirectional distillation achieves 3.33 pp mIoU improvement (68.59% → 71.92%) with only 24.5% samples labeled.
The main contributions of this work are as follows:
- (1)
- A Physically Interpretable Spatio-Temporal Framework. The discrimination score is explicitly represented as land cover composition weighted by optimized spatio-temporal coefficients, enabling decision traceability. By applying temporal modulation exclusively to cropland, the framework achieves >97% precision with computational efficiency (scalar operations only), suitable for operational deployment.
- (2)
- An Enhanced DB-DMT Strategy. By restructuring the original DMT framework into a dual-backbone architecture, our semi-supervised mechanism achieves 71.92% mean Intersection over Union (mIoU) with only 1225 labeled samples, outperforming the original single-backbone DMT baseline by up to 2.09 pp and significantly improving detection of thermally confounding classes (Water Body: +13.2 pp, Photovoltaic Array: +8.1 pp).
- (3)
- Comprehensive Cross-Regional Validation. Evaluated across five regions spanning four agricultural ecoregions and contrasting seasons, the framework reduces misclassifications by 53–76% in high-incidence regions (Henan: 28 vs. 119 errors) while maintaining exceptional specificity in non-burning seasons (Tianjin: FPR = 0.23% vs. 9.81%). In extreme class-imbalance scenarios (e.g., a 1020:1 negative-to-positive ratio in Guangxi), it sustains near-perfect sensitivity while strictly bounding false alarms to single digits (FP = 9), demonstrating robust resistance to majority-class background noise.
2. Materials and Methods
2.1. Dataset Construction
Fire Point Data Acquisition and Remote Sensing Image Sample Construction
Thermal anomaly data were sourced from NASA’s Fire Information for Resource Management System (FIRMS, National Aeronautics and Space Administration, Washington, DC, USA), covering mainland China for 2023. FIRMS integrates fire point products from VIIRS (375 m resolution) and MODIS (1 km resolution), providing latitude, longitude, detection timestamp, and confidence level [10,11]. (Terminology Note: Throughout this manuscript and its associated figures, the terms “fire points” or “raw fire points” are used interchangeably to denote these initial, unclassified thermal anomalies prior to source attribution. These raw anomalies encompass various high-temperature sources, including actual agricultural fires, industrial emissions, and solar reflections. Distinguishing true straw burning from this heterogeneous mixture is the core objective of our proposed framework.)
To ensure spatial representativeness, a stratified sampling strategy was implemented: (a) at least one fire point per provincial division was retained; (b) a minimum 1000 m inter-point distance threshold was enforced to eliminate spatial redundancy. After filtering, 5007 fire points were retained (Figure 1).
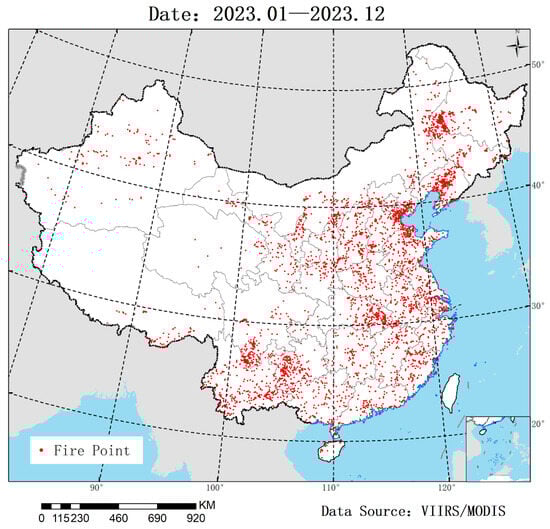
Figure 1.
Spatial distribution of thermal anomalies across China in 2023, used for constructing the satellite image dataset. The data were acquired from the NASA FIRMS platform, derived from VIIRS and MODIS sensors.
For each fire point, a 1000 m × 1000 m image patch was extracted from a 2023 nationwide mosaic constructed from Gaofen-2/6/7 satellites (2 m ground sampling distance after orthorectification and radiometric normalization, China National Space Administration, Beijing, China). This dimension: (i) fully encompasses VIIRS/MODIS geolocation uncertainty (±100–375 m), and (ii) captures sufficient contextual information (adjacent cropland, villages, industrial zones) for semantic inference. All patches were resampled to 512 × 512 pixels using bicubic interpolation.
From the 5007 patches, 1225 samples (24.5%) underwent pixel-level annotation by three professional interpreters into eight land cover classes: Cropland, Forest, Water Body, Residential Building, Industrial Facility, Photovoltaic Array, Bare Land, and Other.
The remaining 3782 unlabeled images serve as the unlabeled data pool for semi-supervised learning, to be used for pseudo-label generation and mutual training via the DB-DMT strategy. Figure 2 displays representative annotated samples from the dataset, showcasing different land cover types.
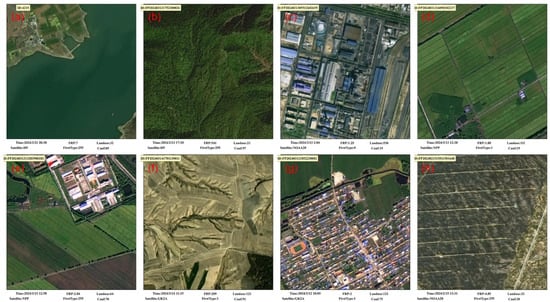
Figure 2.
Representative examples of high-resolution satellite imagery from the dataset. The panels, from top left to bottom right, show: (a) water body, (b) forest, (c) industrial facility, (d) cropland, (e) mixed industrial and agricultural area, (f) bare land, (g) residential buildings, and (h) photovoltaic array.
2.2. Spatio-Temporal Decision Framework
2.2.1. System Architecture and Workflow
Traditional fire point classification methods based on land cover masking rely on a critical assumption: the detected fire centroid coincides with the actual combustion source. However, this assumption is fundamentally violated in operational settings due to: (i) geolocation uncertainty inherent in VIIRS/MODIS thermal bands (±100–375 m offset from true burn scars [17,23]), causing centroids to fall on adjacent roads or buildings; (ii) mixed-pixel effects in heterogeneous landscapes where multiple land cover types coexist within a single sensor footprint; and (iii) temporal variability, as straw burning exhibits strong seasonal patterns (harvest windows) that static land cover products cannot capture.
To overcome these limitations, we design a modular, interpretable decision framework that decouples spatial context modeling from temporal pattern adaptation, enabling robust discrimination across diverse agricultural regions and seasons. The framework operates through four sequential stages (Figure 3):
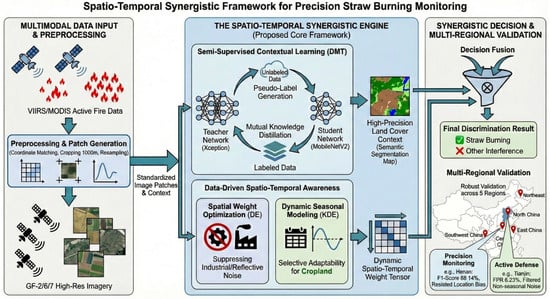
Figure 3.
Schematic of the proposed spatio-temporal decision framework for straw burning fire point identification.
Stage 1: Data Preparation and Spatial Filtering
Fire point products from VIIRS and MODIS are automatically retrieved daily from FIRMS via its Application Programming Interface (API), extracting thermal anomaly records with metadata including latitude, longitude, detection UTC timestamp, and confidence level. The following preprocessing filters are applied sequentially:
- Regional Filtering: Restrict data to mainland China’s geographic extent (73°E–135°E, 18°N–54°N).
- Confidence Screening: Retain only fire points with confidence ≥ 50% (FIRMS nominal threshold) to exclude low-quality detections.
- Spatial Deduplication: Apply nearest-neighbor distance filtering with a 1000 m threshold to eliminate redundant points within the same fire event.
Stage 2: Image Patch Extraction and Standardization
For each retained fire point, a 1000 m × 1000 m image patch is cropped from the 2023 nationwide Gaofen satellite mosaic (ground sampling distance = 2 m). All patches are uniformly resampled to 512 × 512 pixels to ensure consistent input dimensions for downstream processing.
Stage 3: Semantic Segmentation and Spatial Feature Extraction
The resampled image patch is fed into a trained DeepLabV3+ model (Section 2.2.2) with either Xception or MobileNetV2 backbone, producing a pixel-level semantic segmentation map with 8 land cover classes. All deep learning models were implemented using the PyTorch framework (version 2.4.0, Meta AI, Menlo Park, CA, USA). The segmentation output is aggregated into an 8-dimensional spatial distribution vector :
where denotes the pixel count of land cover class k in patch i, and classes correspond to the following: (1) Other, (2) Cropland, (3) Industrial Facility, (4) Residential Building, (5) Forest, (6) Bare Land, (7) Photovoltaic Array, and (8) Water Body.
This vector encodes the spatial signature of the fire point’s surrounding environment, capturing not just the dominant class but the compositional diversity that distinguishes, for example, an industrial zone (high Industrial Facility + Residential Building counts) from a rural burning event (high Cropland + sparse buildings).
Stage 4: Spatio-Temporal Decision Fusion
The spatial distribution vector is combined with a dynamically modulated temporal weighting factor to compute a final discrimination score for each land cover class. Spatial weights are optimized from expert-labeled data using Differential Evolution (Section 2.2.3), while temporal weights are derived from multi-year seasonal fire patterns via Kernel Density Estimation (Section 2.2.4). Critically, temporal modulation is applied exclusively to the cropland class, preserving fixed weights for all other land cover types to prevent the suppression of perennial thermal sources (e.g., industrial facilities, photovoltaic arrays) during non-burning seasons. The class with the highest weighted score determines the final classification as either straw burning or non-straw burning.
This framework enables high-precision, retraining-free discrimination through three key design principles:
- (a)
- Physical Interpretability: The decision score directly reflects ‘land cover area × spatio-temporal weight,’ enabling intuitive analysis of false alarms.
- (b)
- Selective Adaptability: Temporal modulation is confined to cropland, ensuring robust performance across seasons without overfitting to non-agricultural heat sources.
- (c)
- Computational Efficiency: The decision mechanism requires only scalar multiplication and argmax—no neural inference—making it suitable for large-scale, near real-time operational deployment.
2.2.2. DB-DMT for Semi-Supervised Segmentation
Supervised deep learning for semantic segmentation typically requires thousands of pixel-level annotated images to achieve robust generalization [35]. However, in nationwide remote sensing applications like straw burning monitoring, acquiring such large labeled datasets is prohibitively expensive: depending on scene complexity, expert annotation of a single 512 × 512 image patch can take anywhere from 3 to 15 min. For a modest dataset of 1225 images, this translates to approximately 60–300 h of manual labeling effort.
To alleviate this annotation bottleneck while maintaining high segmentation accuracy, we adopt and structurally enhance the Dynamic Mutual Training (DMT) strategy originally introduced by Feng et al. [34].
From Original DMT to Dual-Backbone DMT (DB-DMT)
The original DMT paradigm was proposed to address the “confirmation bias” inherent in standard self-training (ST), where a single model continuously reinforces its own incorrect, high-confidence predictions [36,37]. DMT elegantly solves this by introducing a dual-model mutual training mechanism. It typically employs two models with the identical backbone architecture but differentiates their learning states by dynamically applying varying bias weights or perturbations. These two models act as peers, mutually evaluating and selecting high-confidence pseudo-labels to train one another, effectively preventing rapid error accumulation.
However, when applied to highly heterogeneous remote sensing imagery, the original DMT faces a critical limitation: pseudo-label homogenization. Because the two mutually training models share the exact same structural architecture, their receptive fields and feature extraction preferences eventually converge. Over successive training iterations, they become prone to making the same types of spatial errors, reducing the effectiveness of the mutual review process.
To overcome this, we propose a structurally modified approach tailored for remote sensing: Dual-Backbone DMT (DB-DMT). Instead of relying on weight perturbations within identical networks, DB-DMT explicitly leverages two architecturally distinct networks to enforce true cognitive diversity and cross-architecture consensus:
- Xception: Excels at multi-scale contextual modeling through depthwise separable convolutions and Atrous Spatial Pyramid Pooling (ASPP), capturing long-range dependencies for delineating large agricultural parcels.
- MobileNetV2: Emphasizes local boundary details through inverted residual blocks, providing complementary fine-grained features.
Core Mechanism
By alternating teacher-student roles between these structurally distinct architectures, DB-DMT implements bidirectional knowledge distillation. The mechanism operates through a self-reinforcing cycle (Figure 4):
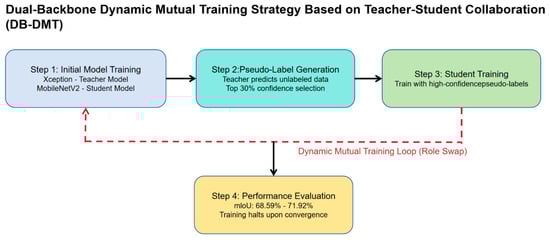
Figure 4.
Framework of the DB-DMT Strategy for Semi-Supervised Semantic Segmentation.
- (a)
- One model (teacher) generates high-confidence pseudo-labels for unlabeled samples using a class-adaptive confidence thresholding mechanism—selecting only the top-performing predictions per class to suppress noise.
- (b)
- The other model (the student) is trained on the combined set of ground-truth labels and high-quality pseudo-labels. Because the student possesses a fundamentally different architecture, it learns the teacher’s distilled knowledge while resisting the teacher’s structural biases.
- (c)
- Upon achieving performance improvement, the roles are swapped: the student becomes the new teacher, and the original teacher becomes the student.
This iterative, bidirectional exchange continues until model performance stabilizes, ensuring that both models progressively learn richer, more discriminative features while suppressing noisy pseudo-labels.
Addressing Geographical Remote Sensing Challenges
This design explicitly addresses two key problems in agricultural remote sensing:
- Geographically rooted class imbalance:
The class imbalance in our task is not an artifact of sampling, but a direct consequence of China’s heterogeneous land use geography. Fire point samples were selected using stratified random sampling by province to ensure national representativeness. Yet provinces exhibit stark contrasts in dominant industries and land use patterns: for instance, the Northeast is dominated by cropland and forest, while the Yangtze River Delta hosts dense industrial facilities and photovoltaic arrays. As a result, land cover classes such as Water Body and Photovoltaic Array—which are common sources of thermal anomalies—appear with extremely low frequency in the vicinity of fire points across most provinces, rendering their discriminative features spatially rare yet thermally confounding.
- Regionally distributed label scarcity:
With only 1225 pixel-level annotated images nationwide (fewer than 40 per province), the labeled data cannot capture the full spectrum of regional land cover diversity. The DB-DMT mechanism transforms this limitation into an opportunity: by leveraging unlabeled data as a spatial regularization signal, it effectively expands the effective training distribution across provinces, not just pixels—enabling the model to generalize beyond the few labeled regions.
2.2.3. Adaptive Spatial Weight Optimization via Differential Evolution
The spatial context surrounding a fire point is critical for discriminating its true origin, yet traditional pixel-center classification methods fail catastrophically when the detected centroid—offset by 100–375 m from the actual burn scar—falls on adjacent roads, buildings, or water bodies. To overcome this limitation, we formulate fire source attribution as a context-aware inference problem: rather than classifying the land cover class at a single pixel, we infer the fire origin from the statistical composition of land cover types within a 500 m-radius spatial window.
Problem Formulation
Given an image patch i and its 8-dimensional spatial distribution vector (Equation (1)), we seek a weight vector that minimizes the 0–1 classification loss over a labeled training set of samples:
where
- is the expert-annotated binary label (1 = straw burning, 0 = non-straw burning);
- is the indicator function (returns 1 if the condition holds and 0 otherwise);
- is the 0–1 loss (returns 1 for incorrect prediction, 0 for correct).
This non-convex, discrete optimization problem is solved using the Differential Evolution (DE) algorithm [38,39]. The final optimized weights, along with their corresponding land cover classes, are reported in Section 3.2.
This formulation encodes the key insight from expert annotation: the three annotators explicitly classified fire sources based on spatial distribution patterns (e.g., “this fire is in cropland because 70% of pixels are farmland, with only sparse buildings”), not the centroid class.
2.2.4. Temporal Weight Modeling via Kernel Density Estimation
Agricultural straw burning exhibits pronounced seasonality aligned with harvest cycles: wheat straw burning peaks in May-June (summer harvest), corn/rice straw burning peaks in September-October (autumn harvest), with near-zero activity during winter months (December-February) when crops are growing [40]. However, existing fire detection systems treat all thermal anomalies equally, regardless of temporal context, leading to high false alarm rates during non-burning seasons when industrial heat emissions or solar reflections dominate.
To capture this temporal heterogeneity, we develop a data-driven temporal weighting function that dynamically modulates the confidence of fire point classifications based on the historical probability of straw burning occurrence at a given time t (Day of Year). Critically, to isolate the true agricultural signal from confounding sources, we construct the temporal model using fire points filtered to cropland pixels only, ensuring the learned seasonal pattern reflects real straw burning behavior rather than the constant presence of non-agricultural heat sources.
Data Preparation and Cropland Filtering
Historical fire point data from 2021 to 2023 were retrieved from FIRMS, yielding 1.2 million thermal anomalies across China. To extract the agricultural burning signal, we applied a spatial mask using the Dynamic World V1 global land cover product [15], retaining only fire points located within pixels classified as “Crops” (confidence > 0.7). This cropland filtering is a strategic design choice validated in prior work [41,42]: by pre-filtering to agricultural contexts, the temporal model learns the true seasonal signature of straw burning, uncorrupted by year-round industrial emissions.
After filtering, 320,000 cropland fire points remained, with clear bimodal temporal distribution (Figure 5a) matching known harvest windows in China’s major grain-producing regions.
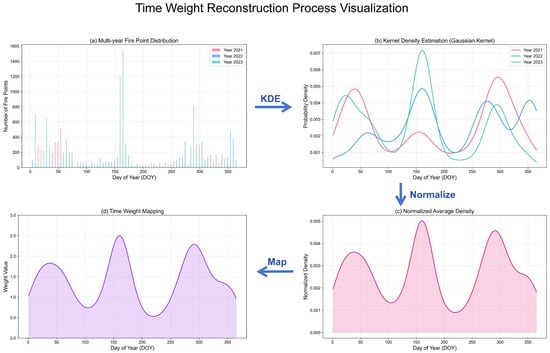
Figure 5.
The process of temporal weight modeling, illustrated with Henan Province as an example: (a) Multi-year temporal distribution of raw fire points by Day of Year (DOY) from 2021 to 2023. (b) Application of Kernel Density Estimation (KDE, Equation (4)) to convert discrete events into continuous annual probability density function.; (c) Normalization and averaging of the annual densities (Equation (6)) to eliminate inter-annual variations. (d) Linear mapping of the normalized average density to the final time weights (Equation (7)), with a range of [0.5, 2.5].
Kernel Density Estimation
For the filtered fire points, each detection timestamp is converted to Day of Year , forming the observation sequence . We employ Kernel Density Estimation (KDE) [43], a non-parametric method that constructs a smooth probability density function from discrete observations, to model the underlying temporal distribution:
where is the Gaussian kernel function:
The bandwidth is adaptively determined using Scott’s rule [44]:
where is the sample standard deviation and is the sample size. Scott’s rule asymptotically balances the bias and variance of the estimate and is especially suitable for unimodal, approximately normally distributed time-series data like agricultural burning cycles.
Multi-Year Normalization
To eliminate inter-annual variability in total fire counts (which fluctuates due to policy enforcement, weather conditions, or crop yield), we normalize and average the annual density functions across 2021–2023:
where is the number of years. This normalization ensures that each year’s density integrates to 1, emphasizing the temporal distribution pattern (when burning occurs) rather than absolute magnitudes (how many fires). The averaged density reveals a stable, repeatable annual pattern (Figure 5c) robust to year-to-year fluctuations.
Linear Mapping to Temporal Weights
The normalized density is linearly mapped to a temporal weight
where and . This range was empirically tuned on the validation set to balance two objectives:
- (a)
- Suppression during non-burning seasons: When (e.g., January–February), , down-weighting Cropland’s contribution by 50% to reduce false alarms from non-agricultural sources;
- (b)
- Amplification during peak burning seasons: When (e.g., early June or October), , increasing Cropland’s influence by 150% to enhance detection sensitivity.
Visualization of Temporal Modeling Workflow
Figure 5 illustrates the complete workflow for reconstructing the temporal weights, using Henan Province as an example:
- Figure 5a: The raw fire point data show clear seasonal distribution patterns, concentrated in May–June (wheat harvest) and September–October (corn harvest).
- Figure 5b: After smoothing with KDE, the discrete events are transformed into a continuous probability density curve.
- Figure 5c: After normalization and averaging across three years (Equation (6)), inter-annual variability is effectively suppressed, revealing a stable, repeatable annual pattern.
- Figure 5d: The final temporal weights (Equation (7)) range from 0.5 to 2.5, accurately capturing the seasonal dynamics of straw burning while remaining insensitive to absolute fire counts.
2.2.5. Spatio-Temporal Fusion and Decision Mechanism
It is critical to emphasize that the spatio-temporal fusion described herein functions as a decoupled, post-processing decision mechanism executed during the inference stage, rather than a differentiable layer within the neural network. The deep learning framework’s responsibility strictly concludes at generating the semantic segmentation mask of the 512 × 512 contextual patch. Once the discrete land cover distribution (i.e., pixel counts for each class) is extracted from the predicted mask, the subsequent spatial weighting and temporal modulation are executed as deterministic mathematical operations, requiring no gradient backpropagation. This decoupled design ensures that the robust classification logic operates seamlessly alongside any standard semantic segmentation network.
Selective Temporal Modulation
For a given fire point detected at time (Day of Year) with spatial distribution vector , the final weight for each land cover class is computed as
where is the optimized spatial weight from Equation (2), and is the temporal modulation factor from Equation (7).
Critical Design Rationale: Temporal scaling is applied exclusively to Cropland (class 2), leaving the spatial weights of all background classes (e.g., Industrial Facility, Water Body, Forest) strictly constant. This selective strategy is driven by both mathematical necessity and ecological reality. Mathematically, because the final classification rule relies on an argmax function (Equation (10)) to determine the highest-scoring class, applying a global temporal scalar to all categories would preserve their relative rank order, rendering the temporal prior entirely redundant. Ecologically, straw burning is a highly seasonal practice, whereas industrial thermal emissions and solar reflections are stable, year-round phenomena. By isolating the temporal penalty solely to the Cropland score during non-burning seasons, the framework dynamically shifts the decision boundary. This asymmetric modulation ensures that the stable thermal signatures of industrial facilities can rightfully dominate the classification output when out-of-season heat sources are detected, effectively suppressing false alarms.
Score Computation and Classification Rule
Operating on the discrete outputs of the segmentation model, the discrimination score for each land cover class is computed as the dot product of its pixel count and the modulated weight:
where is the pixel count of class in the 512 × 512 image patch. The fire point is classified as straw burning if and only if:
Otherwise, it is classified as non-straw burning. This hard, deterministic decision rule translates the semantic distribution directly into a binary image-level classification, providing a highly interpretable and operational output suitable for environmental enforcement, where ambiguous probabilistic detections would hinder resource allocation.
2.2.6. Evaluation Metrics
Performance was assessed at two hierarchical levels reflecting the decision pipeline’s structure:
Pixel-Level (Semantic Segmentation): Evaluated on the test set using standard segmentation metrics: mIoU, mean Pixel Accuracy (mPA), and mean Precision (mPrecision) across 8 land cover classes. These metrics quantify the DeepLabV3+ model’s ability to delineate land cover boundaries, where mIoU is the gold standard penalizing both over-segmentation (false positives) and under-segmentation (false negatives).
Image-Level (Fire Point Classification): Evaluated on five independent regional test sets using Precision, Recall, F1-score, Overall Accuracy (OA), and FPR.
All metrics follow standard definitions in machine learning and remote sensing literature. Confusion matrix elements—TPs (true positives), TNs (true negatives), FPs (false positives), FNs (false negatives)—are defined for the binary task of “straw burning” vs. “non-straw burning” at the image patch level.
3. Results
3.1. Computational Efficiency and Operational Feasibility
Beyond accuracy, the proposed framework is designed for operational deployment in near-real-time monitoring systems. The entire decision pipeline—from spatial context extraction to final fire-type classification—requires only ~120 ms per fire point on an NVIDIA RTX 4070 Ti GPU (batch size = 1, (Nvidia Corporation, Santa Clara, CA, USA)). This includes: (1) one forward pass through DeepLabV3+ for cropland segmentation (~80 ms), (2) pixel-count aggregation (<20 ms), (3) temporal–spatial score computation (<1 ms), and (4) argmax-based label assignment (<1 ms). Consequently, the system can process approximately 8 fire points per second. For a typical daily FIRMS load of 500–10,000 thermal anomalies across China, the full inference pipeline completes within 2–40 min, satisfying the operational requirement for same-day verification and enforcement responses.
3.2. Semantic Segmentation Performance Under Label Scarcity
To assess the robustness of the framework’s core semantic segmentation component under realistic label-scarce conditions, we evaluate model performance on the independent test set of 368 manually annotated image patches (Section 2.1. Each patch (512 × 512 pixels) was centered on a VIIRS/MODIS fire point and extracted from the 5007-image collection, ensuring representation of diverse agricultural landscapes across China. The labeled dataset was partitioned via stratified random sampling at a 6:1:3 ratio, yielding:
- Training set: 735 images (60%)
- Validation set: 122 images (10%, used for spatial weight optimization in Section 2.2.3)
- Test set: 368 images (30%, used for all segmentation evaluations reported here)
3.2.1. Training Protocol and Baseline Performance
Training Configuration: Both DeepLabV3+ models—with MobileNetV2 and Xception backbones—were trained under fully supervised settings using the Adam optimizer (β1 = 0.9, β2 = 0.999) with an initial learning rate of 10−2, decayed via cosine annealing over 120 epochs. Data augmentation strategies included the following:
- −
- Random horizontal and vertical flipping (p = 0.5);
- −
- Random rotation (±15°);
- −
- Brightness perturbation (±20%).
Experiments were conducted on an NVIDIA RTX 4070 Ti GPU (12 GB VRAM) with batch size = 8 during supervised training (reduced to 4 during semi-supervised phases due to memory constraints).
Baseline Performance (Fully Supervised):
Table 1 summarizes the performance of the two backbone networks trained solely on the 735 labeled images. The Xception-based model achieved superior results across all metrics:

Table 1.
Performance Comparison Of Semantic Segmentation Models On The Independent Test Set.
- mIoU: 68.59% (vs. 66.42% for MobileNetV2, +2.17 pp);
- mPA: 82.14% (vs. 80.98%, +1.16 pp);
- mPrecision: 80.69% (vs. 78.66%, +2.03 pp).
These results confirm that Xception’s depthwise separable convolutions and ASPP module provide stronger multi-scale contextual modeling in heterogeneous agricultural landscapes, justifying its selection as the initial teacher model for subsequent semi-supervised training.
3.2.2. Semi-Supervised Learning Gains via DB-DMT
To enhance generalization under limited labeling (24.5% annotation rate), the DB-DMT strategy leveraged both the 735 labeled patches and the remaining 3782 unlabeled images. The workflow proceeded through two alternating phases as detailed in Section 2.2.2:
Phase 1: Teacher-to-Student Knowledge Transfer
The Xception model (baseline mIoU = 68.59%) generated pseudo-labels for the unlabeled set using class-adaptive confidence thresholding (top 30% per class retained to handle severe class imbalance). A mixed dataset—combining ground-truth labels and high-quality pseudo-labels (2 labeled + 2 pseudo-labeled samples per mini-batch)—was used to train the MobileNetV2 student model. After 40 epochs, MobileNetV2-DB-DMT achieved mIoU = 70.08%, an improvement of +3.66 percentage points over its supervised baseline (66.42%).
Phase 2: Student-to-Teacher Refinement
The improved MobileNetV2-DB-DMT model became the new teacher and retrained the original Xception model using the same mixed-batch strategy. The final Xception-DB-DMT model reached mIoU = 71.92%, improving by +3.33 percentage points over its initial performance (68.59%).
Comparison with Original DMT Baselines:
To rigorously quantify the advantage of our dual-backbone architecture, we compared it against the original single-backbone DMT framework. In this baseline implementation, each model independently generates and trains on pseudo-labels utilizing the original dynamic bias-weight adjustment strategy without architectural role-swapping:
- MobileNetV2-DMT (Baseline): mIoU = 67.99% (vs. 70.08% for DB-DMT, +2.09 pp gain)
- Xception-DMT (Baseline): mIoU = 71.30% (vs. 71.92% for DB-DMT, +0.62 pp gain) (p < 0.001)
The 0.62 pp mIoU improvement from DB-DMT over the original DMT baseline is statistically significant at the 99.9% confidence level. This indicates that the dual-backbone bidirectional knowledge exchange genuinely suppresses noise accumulation and confirmation bias more effectively than the single-network dynamic weighting strategy.
3.2.3. Qualitative Assessment and Class-Wise Performance Analysis
Visual Comparison of Segmentation Quality
Figure 6 presents a representative case study involving a floating photovoltaic array adjacent to a water body—a scenario particularly challenging for fire point discrimination due to spectral-thermal similarity (both water surfaces and solar panels exhibit high reflectance in thermal bands, mimicking fire signatures).
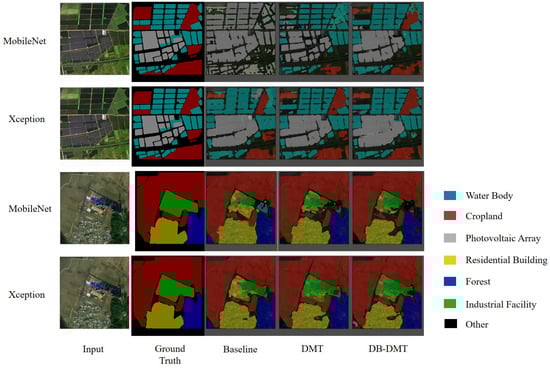
Figure 6.
Visual comparison of semantic segmentation results on the test set. From left to right: input image, ground truth, prediction from the baseline model, DMT, DB-DMT.
Key Observations:
- Baseline Models: Misclassified solar panels as “Water Body” due to spectral similarity.
- DMT Models: Improved coverage but exhibited jagged edges and residual misclassification.
- DB-DMT Models: Achieved sharp boundaries and correct classification of fine structures, with high spatial consistency to ground truth.
Class-Wise IoU Analysis
To quantify DB-DMT’s impact on individual land cover classes—particularly those critical for fire point discrimination—Figure 7 presents class-wise Intersection over Union (IoU) metrics across all models.
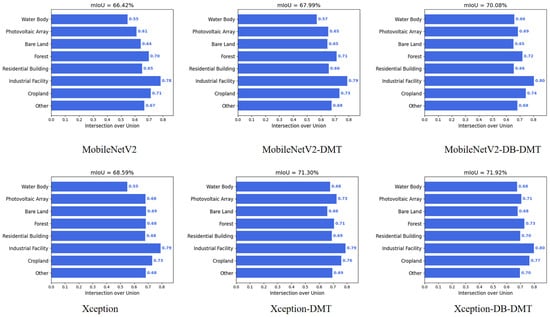
Figure 7.
Class-wise Intersection over Union (IoU) performance on the test set. The mIoU for each model is reported at the top of each subplot.
Key Findings:
- Water Body: Xception-DB-DMT increased IoU from 55.1% to 68.3% (+13.2 pp, +24.0%), This enhancement is particularly important for agricultural regions with dense networks of rivers and lakes (such as the middle and lower reaches of the Yangtze River), as it can effectively prevent thermal anomalies from water reflections being misclassified as fire points.
- Photovoltaic Array: MobileNetV2-DB-DMT improved IoU by +8.1 pp; Industrial Facility by +2.2 pp—both key sources of thermal interference.
- Minor Classes (Forest, Bare Land, Residential Building): All showed consistent gains (2–6 pp), indicating broad generalization capability.
Implication for Fire Point Classification:
The class-wise analysis reveals a critical insight: DB-DMT’s improvements are disproportionately concentrated in thermally confounding classes (Water Body: +24% relative gain, Photovoltaic Array: +17.5%, Industrial Facility: +13.3%) rather than evenly distributed across all classes. This targeted enhancement directly addresses the failure modes of fire point discrimination, where false alarms arise from misclassifying non-agricultural thermal sources.
3.2.4. Optimization Results of Spatial Weights
The Differential Evolution (DE) algorithm was applied to learn the optimal spatial weight vector w* using expert-labeled data from Section 2.2.3. The process is fully supervised by human interpretation:
- A total of 1225 image patches were manually classified into “straw burning” or “non-straw burning” by three remote sensing experts.
- These binary labels serve as the supervision signal for learning discriminative weights.
For each image patch , an 8-dimensional feature vector was constructed, capturing the spatial composition around the fire point.
The optimization minimizes the 0–1 classification loss defined in Equation (1) of Section 2.2.3, with fitness evaluated on the 122-image validation set. This ensures that the learned weights maximize agreement with expert judgment while avoiding overfitting.
The DE algorithm was configured with the following standard settings:
- Population size: 20 individuals;
- Scaling factor (F): 0.5;
- Crossover probability (CR): 0.7;
- Mutation strategy: “rand/1/bin”;
- Search bounds: for all classes;
- Termination criterion: After 300 generations or when fitness improvement < 0.1% over 20 consecutive generations. Experiments show that the algorithm typically converges within 200–250 generations.
These parameters were selected based on established practices in evolutionary computation and are widely used in remote sensing optimization tasks [45]. No additional hyperparameter tuning was performed beyond the fixed configuration.
The final optimized weight vector is:
These weights correspond to the following land cover classes (in order):
Other, Cropland, Industrial Facility, Residential Building, Forest, Bare Land, Photovoltaic Array, and Water Body.
Analysis of the results indicates the following:
- Industrial Facility (12.474) and Photovoltaic Array (6.742) receive high suppression, consistent with their role as primary interference sources.
- Cropland (1.735) has moderate positive weight, allowing activation only when combined with seasonal confidence.
- Water Body (3.086) is also highly weighted, reflecting specular reflection risks.
3.3. Generalization Capability Performance
3.3.1. Study Areas and Dataset Configuration
To systematically evaluate the generalization capability of the proposed framework under diverse spatio-temporal conditions, five representative regions across China were selected as study sites. Spatially, these regions encompass four major agricultural ecoregions—Northeast, North, Central, and South—forming a multi-dimensional validation framework. Temporally, they cover contrasting burning and non-burning seasons to test model robustness against different interference types. The geographical distribution of these regions is detailed in Figure 8.
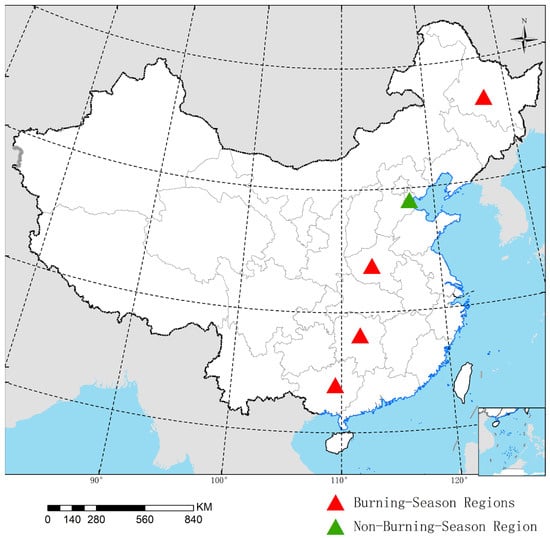
Figure 8.
Spatial Distribution of Five Representative Experimental Regions Across China.
The specific characteristics of the five experimental regions are as follows:
- Henan Province (31°23′–36°22′N, 110°21′–116°39′E): Located in the Huang-Huai-Hai Plain (a core region of the North China Plain), this area features a warm-temperate semi-humid monsoon climate and a typical winter wheat-summer corn rotation system. The validation period was set from 28 May to 1 June 2024, coinciding with the intensive winter wheat harvest and peak straw burning activities, serving to validate detection sensitivity in a high-incidence agricultural zone.
- Wangkui County, Heilongjiang Province (46°38′–47°22′N, 126°00′–127°07′E): Situated in the Songnen Plain in Northeast China, this is a large-scale dryland farming area dominated by corn cultivation. Due to the high-latitude climate and heavy post-harvest snowfall, burning activities are collectively postponed until the following April (the “spring burning peak”). The validation was conducted during the “spring burning peak” from April 8 to 11, 2024, to test model generalization in high-latitude, delayed-burning conditions.
- Hunan Province (24°38′–30°08′N, 108°47′–114°15′E): Located in the middle reaches of the Yangtze River, this region is characterized by small-scale rice farming under a subtropical monsoon climate. Unlike the large-scale drylands of the north, Hunan presents a high degree of land fragmentation, forming a complex “field-water-village” mosaic [46]. The validation focused on the harvest season from 9 October to 12 October, 2024, testing performance in highly heterogeneous landscapes.
- Baise City, Guangxi (22°51′–25°07′N, 104°28′–107°44′E): Located on the edge of the Yunnan-Guizhou Plateau, this region features typical Karst mountain topography with high forest coverage (73.06%) [47]. While sugarcane is cultivated here (harvested in February), thermal anomalies predominantly originate from forest fires. This experiment (18–22 February 2024) was designed to validate false alarm suppression in a scenario dominated by extreme negative samples (forest fires vs. straw burning).
- Tianjin Municipality (38°34′–40°15′N, 116°43′–118°04′E): As a highly urbanized (85.49%) peri-urban zone in the Bohai Rim, Tianjin serves as a critical control group [48]. The validation covered the period from 1 to 31 August 2024, a crop growing season with no agricultural burning window. Therefore, thermal anomalies detected during this period primarily stem from industrial heat sources and specular reflections, providing an ideal setting to evaluate specificity during a non-burning season.
The ground truth for fire points was obtained through the manual interpretation of multi-source, high-resolution imagery (1 m to 16 m) from HJ-2, Gaofen (GF-2/6/7), and Ziyuan (ZY-3) satellites. The procedure involved projecting FIRMS fire point coordinates onto the high-resolution imagery and comparing pre- and post-fire images. Events were confirmed as straw burning if cropland pixels changed from straw coverage to exhibiting significant dark burn scars (Figure 9). Points showing no significant surface change were classified as non-straw burning [49,50]. Samples obscured by clouds or fog were excluded.
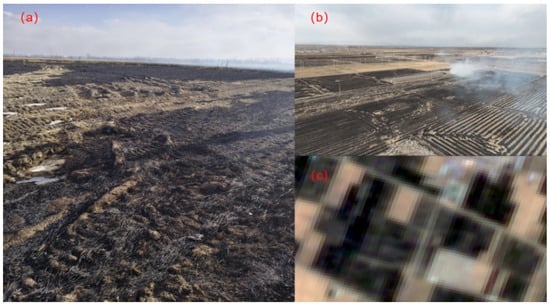
Figure 9.
Multi-scale validation of burn scars after straw burning: (a) ground-level photograph; (b) UAV aerial image; (c) high-resolution satellite image crop. All show the characteristic dark, ash-covered scars on harvested cropland.
To establish a fair comparative baseline, three mainstream land cover datasets were selected as control groups: Dynamic World V1 (DW), China Land Cover Dataset (CLCD), and Esri Land Cover (ESRI).
Evaluation metrics aligned with the framework defined in Section 2.2.6, including Precision, Recall, F1-score, and OA. Table 2 summarizes the key performance indicators for each region. Specifically, for the three agricultural identification scenarios (Henan, Wangkui, Hunan), the F1-score is highlighted to demonstrate detection accuracy; for the two interference-dominated scenarios (Baise, Tianjin), the FPR is reported to quantify the model’s capability in suppressing false alarms.
Table 2.
Overall Performance Summary Across Five Experimental Regions.
In typical agricultural scenarios (Henan and Wangkui), the framework achieved high sensitivity, with F1-scores exceeding 98%. In complex landscapes (Hunan), it maintained robust identification capabilities (F1-score of 95.00%) despite heavy fragmentation. Crucially, in interference-dominated regions (Baise and Tianjin), the framework demonstrated superior false alarm suppression, maintaining a False Positive Rate (FPR) below 1%, significantly outperforming traditional land-use masking methods.
3.3.2. Identification Performance in Typical and Complex Agricultural Scenarios
This section evaluates the framework’s identification accuracy across three distinct agricultural landscapes.
Performance in Intensive Farming Zones (Henan Province). In the typical winter wheat-summer corn rotation zone of Henan, a total of 888 valid samples were evaluated after excluding cloud-obscured points. The proposed framework demonstrated superior sensitivity to clustered burning events. As detailed in Table 3, the full method achieved the highest F1-score of 98.14%, outperforming the baseline Xception model (96.97%) and significantly surpassing the best control group, CLCD (91.91%). The core advantage lies in mitigating “location bias.” Traditional land cover masks often misclassify fires when the thermal anomaly center falls on a farm building adjacent to a burning field, leading to systematic false negatives. In contrast, our method, by leveraging the semantic context of the surrounding 500 m area, reduced the number of misclassified samples from 119 (CLCD) to 28. Visual results in Figure 10 confirm that the identified fire points align precisely with the spatial clustering of burn scars.
Table 3.
Performance Comparison Of Fire Point Classification Models In Henan Province (n = 888).
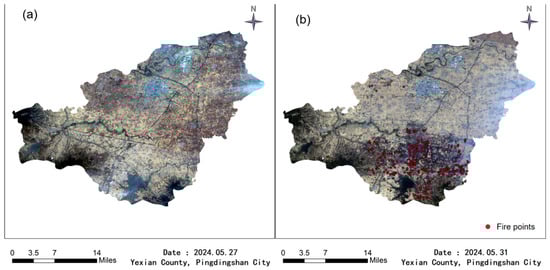
Figure 10.
Remote sensing imagery of straw burning in Ye County, Henan Province: (a) pre-fire (27 May); (b) post-fire (31 May), overlaid with 243 fire points (red dots). Dark burn scars validate clustering.
Adaptability to Delayed Burning Seasons (Wangkui County). In the large-scale dryland farming area of Wangkui (n = 1097), all methods achieved high accuracy (>99%) due to the homogeneous land cover, exhibiting a “ceiling effect”. However, the ablation study in Table 4 highlights the critical role of temporal modeling. Initially, applying spatial weights alone caused a slight drop in Recall (from 98.81% to 96.98%) because the strong suppression of non-crop features inadvertently filtered out some peripheral burning pixels. Upon introducing temporal weights modeled via KDE, the Recall recovered to 98.53%, pushing the final F1-score to 99.54%. This fluctuation confirms that the temporal prior successfully captured the unique “spring burning peak” characteristic of Northeast China, compensating for spatial over-suppression. The extensive burn scars shown in Figure 11 further validate the agricultural origin of these events.
Table 4.
Performance Comparison Of Fire Point Classification Models In Wangkui County (n = 1097).
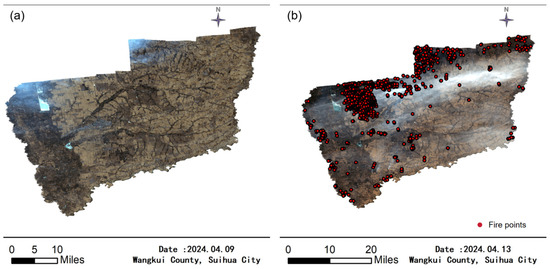
Figure 11.
Spring straw burning in Wangkui County, Heilongjiang Province: (a) image from 9 April; (b) image from 13 April, overlaid with fire points (red dots). Extensive burn scars confirm agricultural origin.
Robustness in Fragmented Landscapes (Hunan Province). The “field-water-village” mosaic in Hunan (n = 770) presented the most challenging scenario8. As shown in Table 5, the complex landscape caused the CLCD baseline to suffer from low Precision (87.12%) due to the confusion between scattered villages and croplands. The proposed framework effectively addressed this through the synergistic optimization of spatio-temporal weights. The spatial optimization assigned a high negative weight to “Water Body” (3.086), suppressing false alarms from water reflections, while the temporal weight enhanced the sensitivity to “Cropland” during the October harvest season. Consequently, the full method achieved an F1-score of 95.00%, an improvement of 4.05 percentage points over CLCD. The total number of misclassified samples was reduced from 109 to 56, demonstrating robust adaptability in heterogeneous environments (see Figure 12).
Table 5.
Accuracy Statistics of Fire Point Classification Models in Hunan Province (n = 770).
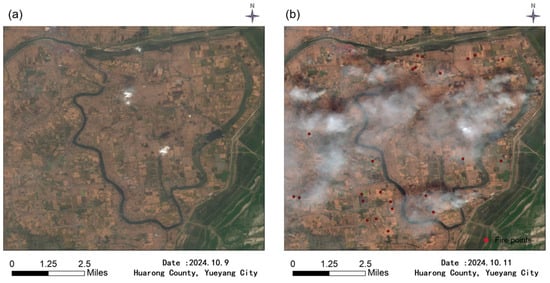
Figure 12.
Autumn straw burning event in Huarong County, Hunan Province: (a) image from 9 October 2024; (b) image from 11 October 2024, showing thick smoke rising from the location of a fire point (red dot).
Detailed confusion matrices for these three regions are provided in Appendix A (Figure A1, Figure A2 and Figure A3), demonstrating the progressive reduction in false positives and false negatives across different model variants.
3.3.3. False Alarm Suppression in Interference-Dominated Scenarios
This section assesses the framework’s specificity in scenarios dominated by non-agricultural thermal anomalies, focusing on the suppression of industrial heat sources and forest fires.
Discrimination in Forest-Dominated Regions (Baise City). The experiment in Baise involved an extreme imbalance of negative samples (n = 1021), with a forest fire to straw burning ratio of 1020:1. As presented in Table 6, all evaluated methods successfully identified the single straw burning event (100% Recall), validating sensitivity to positive samples even in rare-event scenarios. Regarding false alarm suppression, the spatial-only Xception baseline achieved the best performance with an FPR of 0.69% (7 false detections), significantly outperforming the CLCD land use mask (FPR 9.41%, 96 false detections). However, the introduction of temporal weights caused a slight increase in FPR to 2.25% (23 false detections). This reflects a trade-off in the spatio-temporal modeling: since February overlaps with the sugarcane harvest season, the temporal prior enhanced the agricultural probability, causing the model to over-trust seasonality and misclassify some forest fires in the mountainous terrain shown in Figure 13. Despite this side effect, the proposed framework still maintained a far lower error rate than traditional land use masking methods.
Table 6.
Performance Comparison of Fire Point Classification Models in Baise City, Guangxi (n = 1021, TP = 1).
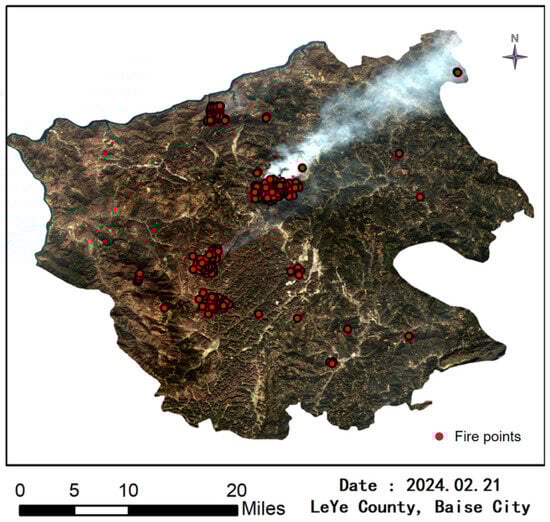
Figure 13.
Distribution of forest fires in Leye County, Baise City. Fire points (red) correlate strongly with forested terrain.
Specificity in Non-Burning Seasons (Tianjin Municipality). In the peri-urban context of Tianjin, a total of 425 thermal anomalies were detected during the non-burning season (August), all of which were confirmed as negative samples (True Negatives) via manual verification. As shown in Table 7, the baseline Xception model initially exhibited a False Positive Rate (FPR) of 5.14% (22 false detections) due to interference from industrial heat sources. However, upon integrating spatio-temporal weights, the FPR dropped dramatically to 0.23% (only 1 false detection). This improvement stems from a dual suppression mechanism: the temporal weight for August minimized the confidence of the “Cropland” class (weight set to 0.5), effectively inhibiting the agricultural burning hypothesis, while the spatial optimization assigned a high negative weight to “Industrial Facility” (12.474). In contrast, the CLCD, which misclassified peri-urban buildings as cropland, yielded a high FPR of 9.81% (42 false detections). The dispersed distribution of these filtered non-agricultural points is illustrated in Figure 14.
Table 7.
False alarm suppression performance in Tianjin (n = 425, TP = 0).
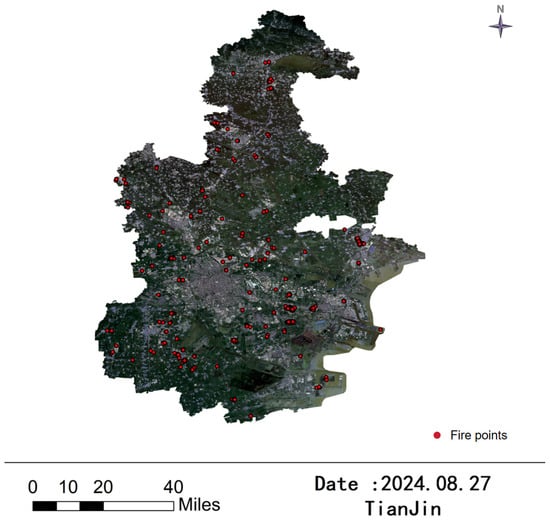
Figure 14.
Spatial distribution of thermal anomaly points in Tianjin in August 2024 (non-burning season). The fire points exhibit a dispersed pattern and are mostly located in urban and industrial areas.
Detailed confusion matrices for Baise City are provided in Appendix A (Figure A4).
3.4. Hyperparameter Sensitivity Analysis
3.4.1. Sensitivity of Differential Evolution (DE) Parameters
To systematically validate the empirical parameter configurations of the Differential Evolution (DE) algorithm utilized for spatial weight optimization, we conducted a sensitivity analysis evaluating the convergence behavior on the 122-image validation set. While the crossover probability (CR = 0.7) and mutation strategy (“rand/1/bin”) were maintained at their universally established default values [51], our analysis focused on the two most critical parameters governing exploration-exploitation dynamics for our specific task: Population Size (NP) and Scaling Factor (F).
As illustrated in Figure 15a, when evaluating NP values of 10, 20, and 30, a smaller population (NP = 10) exhibits premature convergence with higher residual errors. Conversely, while NP = 30 achieves convergence in fewer generations than NP = 20, it incurs a 50% higher computational overhead per generation. Since NP = 20 eventually reaches the exact same optimal error floor, it was selected as the optimal trade-off between convergence capacity and computational efficiency.
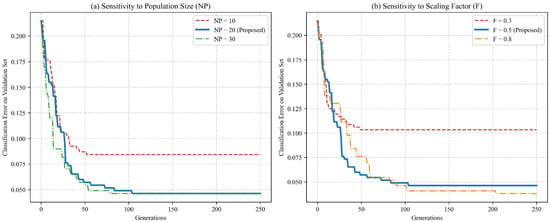
Figure 15.
Convergence curves of the Differential Evolution (DE) algorithm on the validation set for hyperparameter sensitivity analysis: (a) sensitivity to population size (NP) with F fixed at 0.5; (b) sensitivity to scaling factor (F) with NP fixed at 20. The proposed configuration (NP = 20, F = 0.5) achieves the optimal balance between convergence speed, computational efficiency, and robust generalization.
Similarly, Figure 15b demonstrates the sensitivity to the scaling factor F (tested at 0.3, 0.5, and 0.8). A small step size (F = 0.3) restricts spatial exploration, leading to premature convergence with an error of 0.1033. The proposed configuration (F = 0.5) presents a rapid and smooth monotonic descent, stabilizing at a highly accurate validation error of 0.0462 (an accuracy of 95.38%) by generation 100. Interestingly, while a larger scaling factor (F = 0.8) eventually reaches a marginally lower absolute error (0.0380), it requires over 200 generations to squeeze out this microscopic 0.8% gain. In heuristic optimization for remote sensing, such delayed and hyper-specific exploitation typically indicates over-tuning to the limited validation distribution (i.e., falling into a sharp local minimum). Therefore, F = 0.5 was strategically maintained as the optimal configuration to ensure that the learned spatial weights generalize robustly across the five independent regional test scenarios, preventing validation overfitting.
3.4.2. Sensitivity of Temporal Weight Bounds
To mathematically justify the configuration of the temporal weight limits [0.5, 2.5], we conducted a comprehensive sensitivity analysis evaluating both extreme regional scenarios and global classification performance. As depicted in Figure 16, relying solely on static spatial features without temporal modulation yields a baseline global Overall Accuracy (OA) of 96.35% across the five tested regions, while leaving the model vulnerable to off-season industrial anomalies (Tianjin FPR = 1.66%).
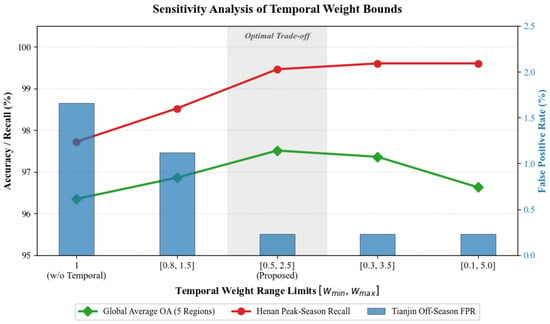
Figure 16.
Dual-axis sensitivity analysis of the temporal weight bounds based on real classification outcomes. The proposed [0.5, 2.5] bounds represent the mathematically optimal threshold, successfully minimizing the off-season False Positive Rate (FPR) in Tianjin and maximizing the Global Average Overall Accuracy (OA) across all five tested regions before over-penalization degrades system robustness.
Expanding the weight bounds to the proposed [0.5, 2.5] effectively suppresses the off-season FPR in Tianjin to its absolute minimum floor (0.23%), while simultaneously boosting the peak-season fire detection Recall in Henan to 99.46%. Crucially, at this exact configuration, the Global Average OA reaches its peak at 97.51%.
Further adopting more aggressive bounds (e.g., [0.3, 3.5] or [0.1, 5.0]) provides zero additional benefit for suppressing FPR in Tianjin (which remains stagnant at 0.23%) and offers only microscopic marginal gains in Henan’s Recall (+0.14%). However, these extreme penalties begin to introduce severe confirmation bias, disrupting the semantic stability in regions with weak seasonality (e.g., Guangxi OA dropping from 99.31% to 97.46%) and causing Henan’s regional OA to degrade to 95.50%. This inverted U-shape trajectory of the global accuracy unequivocally proves that the [0.5, 2.5] range is not an arbitrary empirical choice, but the optimal dynamic equilibrium for nationwide straw burning detection.
4. Discussion
4.1. Analysis of Error Patterns and Method Adaptability Under Regional Heterogeneity
The superior performance of the proposed framework across diverse agricultural landscapes is driven by the synergy of three core mechanisms: adaptive spatial weight optimization, dynamic temporal modeling, and semi-supervised co-training. These components collectively resolve the limitations of traditional methods in handling spatial heterogeneity, temporal variability, and label scarcity.
- (a)
- Adaptive Spatial Weight Optimization: From Expert Rules to Data-Driven Suppression. Traditional fire point classification relies heavily on empirical thresholds or static land cover masks, which lack regional adaptability. By employing the DE algorithm, this study shifts the paradigm to data-driven optimization. The learned weights reveal a clear physical interpretation: “Industrial Facility” (12.474) and “Photovoltaic Array” (6.742) received the highest contribution weights. In the argmax decision logic (Equation (8)), these high weights grant these interference sources a “strong veto power.” Even if a pixel contains some cropland, the presence of small but high-weight industrial features will force the classification result to “Non-Straw Burning.” This competitive suppression mechanism is the primary reason for the significant Precision improvements observed in Henan (+2.50%) and Hunan (+1.11%), effectively filtering out sub-pixel interference that traditional binary masks often miss.
- (b)
- Dynamic Temporal Modeling: Enforcing Phenological Consistency. Existing methods often treat thermal anomalies as static events, overlooking the strong seasonality of agricultural burning. The proposed KDE-based temporal weighting integrates phenological consistency into the decision process. By modeling the historical burning probability, the framework transforms the detection logic from “is there a fire?” to “is there a fire at the expected time?”
- Proactive Defense: In the non-burning season (e.g., August in Tianjin), the temporal weight for cropland drops to its minimum (0.5). This acts as a proactive filter, reducing the false alarm rate from 2.80% to 0.23% without requiring additional spatial data.
- Seasonal Enhancement: Conversely, during the harvest season (e.g., October in Hunan), the high temporal weight amplifies the signal of agricultural fires, increasing Recall by 2.43%. This dynamic adjustment enables the model to “breathe” with the agricultural calendar.
- (c)
- Data-Efficient Semi-Supervised Learning: Mitigating Confirmation Bias. A critical barrier in deep learning for remote sensing is the scarcity of pixel-level annotations (only 24.5% labeled data in this study). The DB-DMT strategy addresses this by leveraging the complementary inductive biases of two distinct backbones. Xception focuses on deep contextual features, while MobileNetV2 emphasizes lightweight spatial features. Unlike standard self-training, which often reinforces a single model’s errors (confirmation bias), the dual-model synergy ensures that only pseudo-labels with high consensus are retained. This mutual correction process significantly reduced noise accumulation, leading to a 3.33% improvement in mIoU for semantic segmentation and ensuring that the F1-scores of the semi-supervised models consistently outperformed the fully supervised baselines across all five validation regions.
4.2. Error Analysis and Limitations
While the proposed framework demonstrates robust generalization across diverse ecoregions, a deep dive into specific error patterns reveals the physical boundaries of the spatio-temporal weighting mechanism.
- (a)
- Mitigating Location Bias in Heterogeneous Agricultural Areas. In complex landscapes like Henan, traditional methods (e.g., Dynamic World) suffer from “Location Bias”—systematic false negatives occurring when the center of a thermal anomaly falls on a non-cropland pixel (e.g., a farm building) adjacent to the actual burning field. As illustrated in Figure 17, our framework resolves this by semantically segmenting a 500 m contextual buffer rather than relying on single-pixel coordinates. This approach comprehensively evaluates the surrounding land cover composition, reducing false negatives in Henan from 68 (CLCD) to 4, a reduction of 94%.
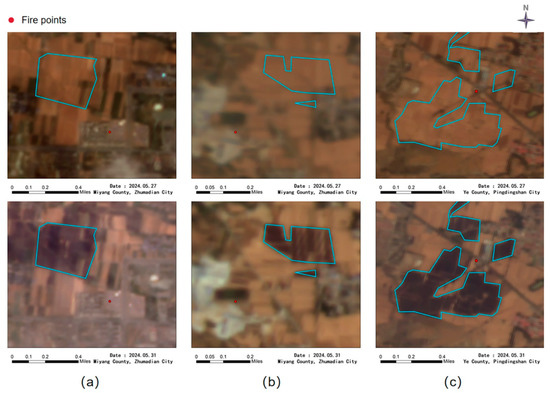 Figure 17. Typical examples of false negatives caused by location bias in land use methods. (a) Case 1; (b) Case 2; (c) Case 3. In each subfigure, the top row shows the pre-fire image, and the bottom row shows the post-fire image. The red dot is the fire point location, and the blue-bordered area is the actual burn scar. Despite the large nearby burn scar, the event was misclassified as non-straw burning because the fire point’s center fell on a building.
 - (b)
- The Trade-off between False Alarm Suppression and Local Sensitivity. In fragmented “field-water-village” mosaics like Hunan, a competitive suppression effect was observed (Figure 18). The high negative weight assigned to “Water Body” (3.086) effectively suppressed false alarms caused by reflections but occasionally diluted the “Cropland” signal (weight 1.735) in pixel-mixed areas, leading to missed detections (False Negatives). However, this trade-off yielded a net benefit in total error reduction. While the CLCD had fewer false negatives, it generated an extremely high number of false positives (FP = 81) by mislabeling buildings as cropland. In contrast, our method controlled false positives at 44, resulting in a significantly lower total error (FP + FN = 72 vs. 109 for CLCD).
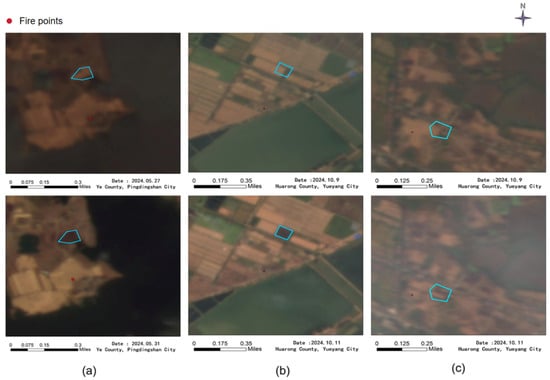 Figure 18. Typical examples of false negatives caused by the presence of large areas of non-cropland in the image: (a) A case from Henan Province; (b,c) cases from Hunan Province.
Crucially, this “area suppression effect” is fundamentally linked to the 1000 m × 1000 m contextual buffer size. This scale is not arbitrary but dictated by the physical hardware constraints of the satellite sensors. While MODIS provides visible bands at finer resolutions, the thermal infrared bands (e.g., Bands 21, 22, 31, 32) critical for active fire detection operate at a 1000 m spatial resolution. Because thermal anomalies are often captured using sub-pixel detection algorithms, the exact sub-pixel location of a fire within that footprint is highly uncertain. Therefore, a 1000 m × 1000 m patch is the minimum requisite window to guarantee the inclusion of the true fire source. However, in southern fragmented terrains like Hunan, a bounding box of this size inevitably encapsulates vast amounts of background features (e.g., forests and water bodies). During the spatial weight aggregation, the sheer pixel volume of these non-agricultural backgrounds mathematically dilutes the signal of small, localized terraced fields.
- Limitation and Improvement: The reliance on global patch statistics lacks sensitivity to local burn scar morphology. Future work will introduce a spatial attention mechanism to enable the model to focus specifically on burn scar regions rather than global patch proportions, thereby mitigating this “area suppression” effect caused by the coarse spatial resolution limits of thermal sensors.
- (c)
- The Validity Boundary of Spatio-Temporal Priors: The temporal weighting mechanism acts as a “double-edged sword,” providing proactive defense in non-burning seasons while introducing risks in confounding scenarios.
- Proactive Defense (Tianjin): In the non-burning season (August), the temporal weight successfully reduced the False Positive Rate (FPR) from 5.14% to 0.23%. By down-weighting the cropland confidence to 0.5, the model effectively filtered industrial heat sources that spatially resembled fires but occurred out of season (Figure 19).
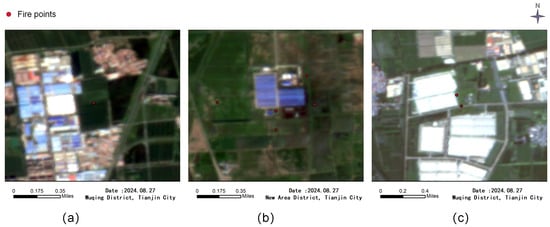 Figure 19. Typical examples of false positives from the land use method in Tianjin during the non-burning season: (a,c) industrial heat sources; (b) greenhouse. These thermal anomalies were incorrectly classified as agricultural straw burning due to their spatial proximity to farmlands. The red dots represent the locations of the detected fire points.
 - Prior Failure (Baise): The Baise case exposed a critical failure mode where the temporal prior was misleading. Since the forest fire season overlapped with the sugarcane harvest window (February), the temporal up-weighting erroneously reinforced the cropland class, causing the FPR to rise from 0.69% to 2.25% by misclassifying forest fires as straw burning. A deeper analysis of the spatial distribution of these errors reveals a distinct geographical pattern: the misclassified fire points are overwhelmingly concentrated in the ecotones (border areas) between sugarcane plantations and dense forest regions. As visually confirmed by the high-resolution basemap imagery of the fire points (Figure 20a–c), Guangxi’s complex karst topography frequently forces sugarcane to be cultivated directly adjacent to forested hillsides. This interleaving geography results in highly mixed semantic features within the 1000 m × 1000 m observation patches. When the aggressive temporal weight is applied during the overlapping season, the model is prone to interpreting any ambiguous thermal anomaly within these mixed “sugarcane-forest” interfaces as an agricultural fire, thereby inflating the FPR.
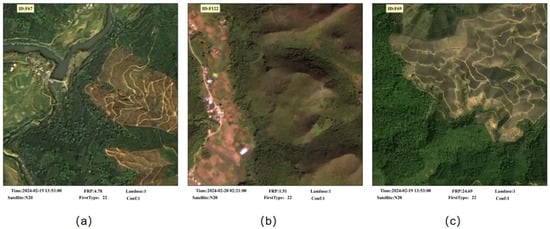 Figure 20. Typical examples of misclassified fire points in the fragmented agro-forestry ecotones of Baise, Guangxi: (a–c) High-resolution basemap imagery illustrating the actual underlying land cover of the detected thermal anomalies. The close proximity and highly interleaved boundaries between sugarcane plantations (harvested in this season) and dense forests lead to mixed semantic features within the observation patches. This spatial mixing causes the temporal prior to erroneously amplify the agricultural confidence of adjacent forest fires, driving up the False Positive Rate.
 - Limitation and Improvement: This highlights the risk of fire origin confusion in overlapping seasons and fragmented ecotones. A necessary technical upgrade is to construct an adaptive fire origin classifier. When continuous mountain fire points are detected, the system should automatically switch to a “Forest Fire Mode” and freeze the agricultural temporal weights.
- (d)
- Operational Constraint: Image Timeliness: A general limitation of this study is the use of archived imagery (2023), which may not reflect real-time land use changes in 2024, such as newly constructed factories in urban-rural fringes. This mismatch contributes to residual discrimination biases. Operational deployment should integrate near-real-time satellite data with a dynamic change detection module to update the land cover basemap continuously.
4.3. Systematic Comparison with Traditional Methods
Compared to the mainstream “fire point + land use mask” methods, the framework proposed in this study demonstrates significant advantages across three key dimensions: data precision, temporal modeling, and decision logic. A systematic comparison detailing these advantages is presented in Table 8.
Table 8.
Systematic Comparison of the Proposed Framework and Traditional Methods.
This work advances fire source discrimination from pixel-level spatial coincidence to spatio-temporal contextual reasoning, aligning detection logic with the underlying physical and ecological mechanisms of straw burning.
5. Conclusions
The open burning of straw remains a critical challenge for regional air quality management, demanding precise monitoring solutions that transcend the limitations of current remote sensing methods. To address the confounding of thermal sources, the neglect of seasonal characteristics, and the scarcity of labeled data, this study proposed an end-to-end identification framework integrating semi-supervised learning with adaptive spatio-temporal weighting. Systematic validation across five representative agricultural ecoregions in China (Henan, Heilongjiang, Hunan, Guangxi, and Tianjin) has demonstrated the framework’s robustness and generalization capability.
The primary contributions and findings of this study are as follows:
- Data-Driven Spatial Adaptability: By replacing subjective expert rules with a Differential Evolution-based optimization mechanism, the framework automatically learns discriminative weights for diverse land covers. This strategy significantly enhanced interference suppression, particularly in distinguishing industrial heat sources and water reflections in complex landscapes like Hunan.
- Phenology-Aware Temporal Modeling: This dynamic adjustment acts as a “proactive defense,” reducing the False Positive Rate (FPR) in non-burning seasons (e.g., Tianjin) from 5.14% to 0.23%, while enhancing recall during harvest peaks.
- Label-Efficient Generalization: Addressing the annotation bottleneck, the DB-DMT strategy effectively leveraged unlabeled data. Even with only 24.5% labeled samples, the synergistic evolution of the dual-backbone network achieved stable performance gains across all test regions, confirming its viability for large-scale, cost-effective deployment.
Overall, this research marks a paradigm shift from traditional “pixel-level location matching” to “spatio-temporal contextual reasoning.” By synergizing semantic context with seasonal probabilities, the proposed method overcomes the inherent “location bias” of land use masks and the “temporal blindness” of static algorithms.
Despite these advancements, limitations remain regarding the timeliness of the annual clear-sky archived land cover data and the discrimination of fire origins in overlapping seasons (e.g., forest vs. crop fires in Baise). Future research will focus on (1) integrating near-real-time satellite data with change detection modules to update basemaps; (2) developing adaptive classifiers to dynamically switch between forest and agricultural fire modes; and (3) introducing spatial attention mechanisms to refine local burn scar detection.
Beyond agricultural straw burning, the proposed spatio-temporal decision paradigm offers a highly transferable blueprint for the broader remote sensing literature. By elegantly decoupling sub-pixel thermal anomaly detection from contextual semantic analysis, this framework can be directly adapted for other environmental monitoring challenges characterized by high spatial heterogeneity and seasonal rhythms. Such applications include wildfire source tracking in complex agro-forestry ecotones, industrial emission regulation (identifying concealed high-energy-consuming facilities based on stable thermal signatures), and tropical deforestation monitoring. Ultimately, this study provides a reproducible, scalable solution for environmental regulation, offering scientific support for managing non-point source pollution and achieving dual carbon goals.
Author Contributions
Conceptualization, X.L., H.C. and Y.T.; methodology, X.L. and H.C.; software, X.L.; validation, H.C., Y.T. and C.Z.; formal analysis, X.L.; investigation, X.L.; resources, H.C. and C.Z.; data curation, X.L.; writing—original draft preparation, X.L.; writing—review and editing, H.C., Y.T. and C.Z.; visualization, X.L.; supervision, H.C., Y.T. and G.C.; project administration, Y.T. and G.C.; funding acquisition, H.C., Y.T. and G.C. All authors have read and agreed to the published version of the manuscript.
Funding
This research was funded by the National Key R&D Program of China, grant number 2023YFC3709501. The APC was funded by the National Key R&D Program of China, grant number 2023YFC3709501.
Data Availability Statement
The data presented in this study are available on request from the corresponding author. The data are not publicly available due to privacy restrictions and project confidentiality.
Conflicts of Interest
The authors declare no conflict of interest.
Abbreviations
The following abbreviations are used in this manuscript:
| ASPP | Atrous Spatial Pyramid Pooling |
| CLCD | China Land Cover Dataset |
| CNN | Convolutional Neural Network |
| DE | Differential Evolution |
| DMT | Dynamic Mutual Training |
| DW | Dynamic World |
| FIRMS | Fire Information for Resource Management System |
| FPR | False Positive Rate |
| KDE | Kernel Density Estimation |
| mIoU | mean Intersection over Union |
| MODIS | Moderate Resolution Imaging Spectroradiometer |
| mPA | mean Pixel Accuracy |
| OA | Overall Accuracy |
| VIIRS | Visible Infrared Imaging Radiometer Suite |
Appendix A

Figure A1.
Confusion matrices for fire point classification in Henan (n = 888): (a–f) proposed variants; (g–i) control methods. The Full Method (e) shows optimal balance.
Figure A1.
Confusion matrices for fire point classification in Henan (n = 888): (a–f) proposed variants; (g–i) control methods. The Full Method (e) shows optimal balance.


Figure A2.
Confusion matrices for fire point classification in the Wangkui County (n = 1097): (a–f) proposed variants; (g–i) control methods. The Full Method (e) shows optimal balance.
Figure A2.
Confusion matrices for fire point classification in the Wangkui County (n = 1097): (a–f) proposed variants; (g–i) control methods. The Full Method (e) shows optimal balance.


Figure A3.
Confusion matrices for fire point classification in the Hunan Province (n = 770): (a–f) proposed variants; (g–i) control methods. The Full Method (e) shows optimal balance.
Figure A3.
Confusion matrices for fire point classification in the Hunan Province (n = 770): (a–f) proposed variants; (g–i) control methods. The Full Method (e) shows optimal balance.


Figure A4.
Confusion matrices for fire point classification in Baise City, Guangxi (n = 1021, TP = 1): (a–f) proposed variants; (g–i) control methods.
Figure A4.
Confusion matrices for fire point classification in Baise City, Guangxi (n = 1021, TP = 1): (a–f) proposed variants; (g–i) control methods.

References
- Ren, J.; Yu, P.; Xu, X. Straw Utilization in China—Status and Recommendations. Sustainability 2019, 11, 1762. [Google Scholar] [CrossRef]
- Wen, X.; Chen, W.; Chen, B.; Yang, C.; Tu, G.; Cheng, T. Does the Prohibition on Open Burning of Straw Mitigate Air Pollution? An Empirical Study in Jilin Province of China in the Post-Harvest Season. J. Environ. Manag. 2020, 264, 110451. [Google Scholar] [CrossRef] [PubMed]
- Zhang, H.; Ye, X.; Cheng, T.; Chen, J.; Yang, X.; Wang, L.; Zhang, R. A laboratory study of agricultural crop residue combustion in China: Emission factors and emission inventory. Atmos. Environ. 2008, 42, 8432–8441. [Google Scholar] [CrossRef]
- Cheng, Z.; Wang, S.; Fu, X.; Watson, J.G.; Jiang, J.; Fu, Q.; Chen, C.; Xu, B.; Yu, J.; Chow, J.C.; et al. Impact of biomass burning on haze pollution in the Yangtze River delta, China: A case study in summer 2011. Atmos. Chem. Phys. 2014, 14, 4573–4585. [Google Scholar] [CrossRef]
- Li, X.; Wang, S.; Duan, L.; Hao, J.; Li, C.; Chen, Y.; Yang, L. Particulate and trace gas emissions from open burning of wheat straw and corn stover in China. Environ. Sci. Technol. 2007, 41, 6052–6058. [Google Scholar] [CrossRef]
- Wang, H.; Wang, F.; Sun, R.; Gao, C.; Wang, Y.; Sun, N.; Wang, L.; Bi, Y. Policies and regulations of crop straw utilization in foreign countries: Experience and inspiration for China. Trans. Chin. Soc. Agric. Eng. 2016, 32, 216–222. (In Chinese) [Google Scholar]
- Han, H.; Lin, H. Patterns of Agricultural Diversification in China and Its Policy Implications for Agricultural Modernization. Int. J. Environ. Res. Public Health 2021, 18, 4978. [Google Scholar] [CrossRef]
- Schroeder, W.; Oliva, P.; Giglio, L.; Csiszar, I.A. The New VIIRS 375 m active fire detection data product: Algorithm description and initial assessment. Remote Sens. Environ. 2014, 143, 85–96. [Google Scholar] [CrossRef]
- Giglio, L.; Schroeder, W.; Justice, C.O. The collection 6 MODIS active fire detection algorithm and fire products. Remote Sens. Environ. 2016, 178, 31–41. [Google Scholar] [CrossRef]
- Wooster, M.J.; Xu, W.; Nightingale, T. Sentinel-3 SLSTR active fire detection and FRP product: Pre-launch algorithm development and performance evaluation using MODIS and ASTER datasets. Remote Sens. Environ. 2012, 120, 236–254. [Google Scholar] [CrossRef]
- Jiang, Y.; Kong, J.; Zhong, Y.; Zhang, Q.; Zhang, J. An Enhanced Algorithm for Active Fire Detection in Croplands Using Landsat-8 OLI Data. Land 2023, 12, 1246. [Google Scholar] [CrossRef]
- Csiszar, I.; Schroeder, W.; Giglio, L.; Ellicott, E.; Vadrevu, K.P.; Justice, C.O.; Wind, B. Active fires from the Suomi NPP Visible Infrared Imaging Radiometer Suite: Product status and first evaluation results. J. Geophys. Res. Atmos. 2014, 119, 803–816. [Google Scholar] [CrossRef]
- Wang, X.; Hao, J.-Q.; Dai, Z.-Z.; Haider, S.; Chang, S.; Zhu, Z.-Y.; Duan, J.-J.; Ren, G.-X. Spatial-temporal characteristics of cropland distribution and its landscape fragmentation in China. Farming Syst. 2024, 2, 100078. [Google Scholar] [CrossRef]
- Yang, J.; Huang, X. The 30 m annual land cover dataset and its dynamics in China from 1990 to 2019. Earth Syst. Sci. Data 2021, 13, 3907–3925. [Google Scholar] [CrossRef]
- Brown, C.F.; Brumby, S.P.; Guzder-Williams, B.; Birch, T.; Hyde, S.B.; Mazzariello, J.; Czerwinski, W.; Pasquarella, V.J.; Haertel, R.; Ilyushchenko, S.; et al. Dynamic World, Near real-time global 10 m land use land cover mapping. Sci. Data 2022, 9, 251. [Google Scholar] [CrossRef]
- Zanaga, D.; Van De Kerchove, R.; Daems, D.; De Keersmaecker, W.; Brockmann, C.; Kirches, G.; Wevers, J.; Cartus, O.; Santoro, M.; Fritz, S.; et al. ESA WorldCover 10 m 2021 v200; Zenodo: Geneva, Switzerland, 2022. [Google Scholar] [CrossRef]
- Liang, D.; Cao, B.; Wang, Q.; Jia, K.; Qi, J.; Zhao, W.; Yan, K. A New Detection Method for Land Surface Anomalies From the Perspective of Thermal Infrared Remote Sensing. IEEE Trans. Geosci. Remote Sens. 2025, 63, 5007216. [Google Scholar] [CrossRef]
- Chen, J.; Jönsson, P.; Tamura, M.; Gu, Z.; Matsushita, B.; Eklundh, L. A simple method for reconstructing a high-quality NDVI time-series data set based on the Savitzky–Golay filter. Remote Sens. Environ. 2004, 91, 332–344. [Google Scholar] [CrossRef]
- Song, X.-P.; Hansen, M.C.; Stehman, S.V.; Potapov, P.V.; Tyukavina, A.; Vermote, E.F.; Townshend, J.R. Global land change from 1982 to 2016. Nature 2018, 560, 639–643. [Google Scholar] [CrossRef]
- Ma, L.; Liu, Y.; Zhang, X.; Ye, Y.; Yin, G.; Johnson, B.A. Deep learning in remote sensing applications: A meta-analysis and review. ISPRS J. Photogramm. Remote Sens. 2019, 152, 166–177. [Google Scholar] [CrossRef]
- Zhu, X.X.; Tuia, D.; Mou, L.; Xia, G.-S.; Zhang, L.; Xu, F.; Fraundorfer, F. Deep learning in remote sensing: A comprehensive review and list of resources. IEEE Geosci. Remote Sens. Mag. 2017, 5, 8–36. [Google Scholar] [CrossRef]
- Long, Y.; Xia, G.-S.; Yang, W.; Zhang, L.; Li, D. Toward Dataset Construction for Remote Sensing Image Interpretation. In Proceedings of the 2021 IEEE International Geoscience and Remote Sensing Symposium (IGARSS), Brussels, Belgium, 11–16 July 2021; pp. 1210–1213. [Google Scholar] [CrossRef]
- Li, Z.; Sun, W.; Zheng, L.; Wang, Y. A review of semi-supervised learning frameworks for semantic segmentation of remote sensing images. Acad. J. Comput. Inf. Sci. 2024, 7, 76–80. [Google Scholar] [CrossRef]
- Huang, X.; Li, M.; Li, J.; Song, Y. A high-resolution emission inventory of crop burning in fields in China based on MODIS thermal anomalies/fire products. Atmos. Environ. 2012, 50, 9–15. [Google Scholar] [CrossRef]
- Fu, J.; Song, S.; Guo, L.; Chen, W.; Wang, P.; Duanmu, L.; Shang, Y.; Shi, B.; He, L. Interprovincial Joint Prevention and Control of Open Straw Burning in Northeast China: Implications for Atmospheric Environment Management. Remote Sens. 2022, 14, 2528. [Google Scholar] [CrossRef]
- Zhang, F.; Wang, Y.; Du, Y.; Zhu, Y. A Spatio-Temporal Encoding Neural Network for Semantic Segmentation of Satellite Image Time Series. Appl. Sci. 2023, 13, 12658. [Google Scholar] [CrossRef]
- Giglio, L.; Boschetti, L.; Roy, D.P.; Humber, M.L.; Justice, C.O. The Collection 6 MODIS burned area mapping algorithm and product. Remote Sens. Environ. 2018, 217, 72–85. [Google Scholar] [CrossRef]
- Chuvieco, E.; Yue, C.; Heil, A.; Mouillot, F.; Alonso-Canas, I.; Padilla, M.; Tansey, K. A new global burned area product for climate assessment of fire impacts. Glob. Ecol. Biogeogr. 2016, 25, 619–629. [Google Scholar] [CrossRef]
- Abatzoglou, J.T.; Kolden, C.A.; Williams, A.P.; Lutz, J.A.; Smith, A.M.S. Climatic influences on interannual variability in regional burn severity across western US forests. Int. J. Wildland Fire 2017, 26, 269–275. [Google Scholar] [CrossRef]
- Sakamoto, T.; Wardlow, B.D.; Gitelson, A.A.; Verma, S.B.; Suyker, A.E.; Arkebauer, T.J. A two-step filtering approach for detecting maize and soybean phenology with time-series MODIS data. Remote Sens. Environ. 2010, 114, 2146–2159. [Google Scholar] [CrossRef]
- Roy, D.P.; Boschetti, L.; Justice, C.O.; Ju, J. The collection 5 MODIS burned area product—Global evaluation by comparison with the MODIS active fire product. Remote Sens. Environ. 2008, 112, 3690–3707. [Google Scholar] [CrossRef]
- Giglio, L.; Randerson, J.T.; Van Der Werf, G.R. Analysis of daily, monthly, and annual burned area using the fourth-generation global fire emissions database (GFED4). J. Geophys. Res. Biogeosci. 2013, 118, 317–328. [Google Scholar] [CrossRef]
- Raimond, K. A review on availability of remote sensing data. In Proceedings of the 2015 IEEE Technological Innovation in ICT for Agriculture and Rural Development (TIAR); IEEE: New York, NY, USA, 2015; pp. 150–155. [Google Scholar]
- Feng, Z.; Zhou, Q.; Gu, Q.; Tan, X.; Cheng, G.; Lu, X.; Shi, J.; Ma, L. DMT: Dynamic mutual training for semi-supervised learning. Pattern Recognit. 2022, 130, 108777. [Google Scholar] [CrossRef]
- Lin, H.; Upchurch, P.; Bala, K. Block annotation: Better image annotation for semantic segmentation with sub-image decomposition. arXiv 2020, arXiv:2002.06626. [Google Scholar] [CrossRef]
- Hestness, J.; Narang, S.; Ardalani, N.; Diamos, G.; Jun, H.; Kianinejad, H.; Patwary, M.M.; Yang, Y.; Zhou, Y. Deep learning scaling is predictable, empirically. arXiv 2017, arXiv:1712.00409. [Google Scholar] [CrossRef]
- Gómez-Chova, L.; Tuia, D.; Moser, G.; Camps-Valls, G. Multimodal classification of remote sensing images: A review and future directions. IEEE Geosci. Remote Sens. Mag. 2015, 3, 8–36. [Google Scholar] [CrossRef]
- Ghosh, A.; Das, S.; Chowdhury, A.; Giri, R. An improved differential evolution algorithm with fitness-based adaptation of the control parameters. Inf. Sci. 2011, 181, 3749–3765. [Google Scholar] [CrossRef]
- Bolufé-Röhler, A.; Han, W. A data-centric approach to parameter tuning, an application to differential evolution. In 2023 IEEE Congress on Evolutionary Computation (CEC); IEEE: New York, NY, USA, 2023; pp. 1–9. [Google Scholar]
- Zhang, T.; De Jong, M.C.; Wooster, M.J.; Xu, W.; Wang, L. Trends in eastern China agricultural fire emissions derived from a combination of geostationary (Himawari) and polar-orbiting (VIIRS) fire radiative power products. Atmos. Chem. Phys. 2020, 20, 10687–10705. [Google Scholar] [CrossRef]
- Wang, Z.; Chen, L.; Gu, H. Monitoring of crop residue burning in North China on the basis of MODIS data. Remote Sens. Technol. Appl. 2008, 23, 611–617. [Google Scholar] [CrossRef]
- Jang, E.; Kang, Y.; Im, J.; Lee, D.-W.; Yoon, J.; Kim, S.-K. Detection and Monitoring of Forest Fires Using Himawari-8 Geostationary Satellite Data in South Korea. Remote Sens. 2019, 11, 271. [Google Scholar] [CrossRef]
- Silverman, B.W. Density Estimation for Statistics and Data Analysis, 1st ed.; Routledge: Milton Park, UK, 1998. [Google Scholar] [CrossRef]
- Sandler, M.; Howard, A.; Zhu, M.; Zhmoginov, A.; Chen, L.C. Mobilenetv2: Inverted residuals and linear bottlenecks. In Proceedings of the IEEE Conference on Computer Vision and Pattern Recognition; IEEE: New York, NY, USA, 2018; pp. 4510–4520. [Google Scholar]
- Zhou, B.; Chen, L.; Gao, X.; Sui, B.; Luo, B.; Li, W.; Tan, P. Analysis of the temporal and spatial characteristics of straw incineration in Hunan province based on multi-source meteorological satellite. In Proceedings of the Third International Conference on Remote Sensing, Surveying, and Mapping (RSSM 2024), Wuhan, China, 12–14 January 2024; Volume 13170, p. 131700B. [Google Scholar] [CrossRef]
- Guangxi Zhuang Autonomous Region Bureau of Statistics. Guangxi Statistical Yearbook 2023; Guangxi Zhuang Autonomous Region Bureau of Statistics: Nanning, China, 2023. Available online: http://tjj.gxzf.gov.cn/tjsj/tjnj/material/tjnj20200415/2023/indexch.htm (accessed on 24 May 2025).
- Tianjin Municipal Planning and Natural Resources Bureau. Tianjin Municipal Annual State-Owned Construction Land Supply Plan for 2023; Tianjin Municipal Planning and Natural Resources Bureau: Tianjin, China, 29 March 2023. Available online: https://ghhzrzy.tj.gov.cn/zwgk_143/tzgg/202303/t20230329_6153913.html (accessed on 24 May 2025).
- Liu, P.; Liu, Y.; Guo, X.; Zhao, W.; Wu, H.; Xu, W.; Xu, W. Burned area detection and mapping using time series Sentinel-2 multispectral images. Remote Sens. Environ. 2023, 296, 113753. [Google Scholar] [CrossRef]
- Pinto, M.M.; Libonati, R.; Trigo, R.M.; Trigo, I.F.; DaCamara, C.C. A deep learning approach for mapping and dating burned areas using temporal sequences of satellite images. ISPRS J. Photogramm. Remote Sens. 2020, 160, 260–274. [Google Scholar] [CrossRef]
- Yuan, Q. Multi-source remote sensing-based forest fire monitoring. Int. Arch. Photogramm. Remote Sens. Spat. Inf. Sci. 2025, 48, 189–193. [Google Scholar] [CrossRef]
- Zheng, F.; Simpson, A.R.; Zecchin, A.C. Parametric analysis of differential evolution algorithm applied to water distribution system optimization. In Proceedings of the Conference on Computing and Control for the Water Industry (CCWI 2011), Exeter, UK, 5–7 September 2011; pp. 5–11. [Google Scholar]


Disclaimer/Publisher’s Note: The statements, opinions and data contained in all publications are solely those of the individual author(s) and contributor(s) and not of MDPI and/or the editor(s). MDPI and/or the editor(s) disclaim responsibility for any injury to people or property resulting from any ideas, methods, instructions or products referred to in the content. |
© 2026 by the authors. Licensee MDPI, Basel, Switzerland. This article is an open access article distributed under the terms and conditions of the Creative Commons Attribution (CC BY) license.