


Highlights
What are the main findings?
- Hyperspectral ASD data combined with machine learning enabled highly accurate detection and quantification of Septoria leaf blotch in winter wheat, with Random Forest giving the best classification performance and CatBoost providing the highest regression accuracy.
- A reduced spectral feature set based on green, red, red-edge, and NIR bands achieved classification performance comparable to the full hyperspectral spectrum. Although UAV multispectral data showed lower regression accuracy than ASD hyperspectral measurements, they still enabled effective field-scale disease assessment using a limited number of multispectral bands.
What are the implications of the main findings?
- Key diagnostic information for Septoria leaf blotch detection is concentrated in a limited number of spectral regions, which supports the development of simpler and more operational remote sensing systems for field disease monitoring.
- Hyperspectral ASD sensing can serve as a high-quality reference for model development, while UAV multispectral imaging offers scalable and practical potential for precision agriculture applications at field scale.
Abstract
Septoria leaf blotch (SLB), caused by Zymoseptoria tritici, is one of the most destructive foliar diseases of wheat and requires accurate methods for early detection and disease severity assessment. This study evaluated the potential of hyperspectral ASD measurements and UAV multispectral imagery combined with machine learning for the detection and quantification of SLB in winter wheat. Six spectral datasets derived from hyperspectral reflectance, UAV multispectral imagery, and vegetation indices were analyzed using CatBoost, Random Forest, and XGBoost algorithms. Random Forest achieved the highest classification performance, reaching an accuracy of 0.9583 and a balanced accuracy of 0.9483. For disease severity prediction, the best performance was obtained using ASD-derived vegetation indices with Random Forest (R2 = 0.9199), while CatBoost consistently provided high regression accuracy across hyperspectral datasets. A reduced set of green, red, red-edge, and near-infrared bands produced classification results comparable to those obtained with the full hyperspectral spectrum, indicating that most diagnostic information is concentrated within these spectral regions. Although UAV multispectral data showed lower accuracy than hyperspectral measurements, particularly for disease severity prediction, they enabled effective field-scale disease monitoring. These findings demonstrate that hyperspectral sensing provides a valuable reference for developing accurate disease detection models, whereas UAV multispectral imagery represents a practical and scalable solution for operational precision agriculture.
1. Introduction
Septoria leaf blotch (SLB) of wheat, caused by Z. tritici (Desm.) Quaedvlieg & Crous, is among the most severe fungal diseases of wheat cultivated in temperate regions. This pathogen is widespread in Europe, including Poland, and represents one of the major threats to the yield stability of both winter and spring wheat [1]. Under conditions favorable for disease development, yield losses may reach as much as 30–50%, particularly in years with high infection pressure [2,3].
The development of SLB is strongly dependent on environmental conditions, particularly temperature, air humidity, and the duration of leaf wetness. Optimal conditions for infection and pathogen development include moderate temperatures of approximately 20–25 °C and high humidity, which promote spore germination and disease spread [4]. A characteristic feature of SLB is its relatively long latent period, exceeding seven days [5,6], which significantly hampers early detection under field conditions.
Effective management of SLB requires precise and timely assessment of disease severity. However, traditional methods based on visual symptom assessment are subjective, time-consuming, and affected by considerable observer-related variability, especially at the early stages of disease development [7,8]. Symptoms of SLB, such as chlorotic and necrotic lesions with pycnidia, develop gradually and may be confused with symptoms of abiotic stress, nutrient deficiencies, or natural leaf senescence.
In response to these limitations, increasing attention has been paid to remote sensing methods for plant disease detection using optical imaging. Various measurement platforms are used in crop health monitoring studies, including satellite, airborne, ground-based, and unmanned aerial vehicle (UAV) systems. Satellite and airborne data enable the observation of large areas; however, their use may be limited by spatial and temporal resolution, weather conditions, the availability of suitable imagery, and the costs associated with acquiring very high-resolution data. In contrast, ground-based systems provide highly detailed measurements but are usually characterized by limited spatial coverage and considerable time requirements when monitoring larger areas.
Against this background, UAV platforms equipped with optical imaging systems represent an effective tool for crop monitoring, combining high spatial resolution, flexibility in data acquisition timing, and the ability to conduct observations at the field scale. These solutions may support precision crop protection management by identifying areas with an increased risk of infection and enabling more targeted application of fungicide treatments. RGB images represent an attractive solution due to their low cost, ease of data acquisition, and applicability under field conditions [9,10]. However, it should be emphasized that they record only broad bands in the visible range, typically 400–700 nm, which limits their ability to detect early physiological changes occurring in plant tissues before they become visible to the naked eye.
Greater information detail is provided by multispectral and hyperspectral data, which enable the recording of reflectance changes in spectral regions associated with photosynthetic pigment content, tissue structure, and plant water status. Hyperspectral imaging allows the identification of subtle changes related to chlorophyll degradation, disturbances in leaf structure, and changes in water content, often before visible disease symptoms appear [11]. However, the high cost of equipment, large data volume, and complexity of data processing limit the broader application of this technology in agricultural practice.
An example of the application of hyperspectral data in studies on the detection and assessment of the intensity of SLB of wheat is provided by the experiments of Latchoumane et al. [12], in which changes in the spectral characteristics of leaves infected by Z. tritici were analyzed based on HSI images recorded over a period of 22 days. Time-resolved spectroscopy and hyperspectral imaging have also been used to investigate the progression of Z. tritici infection and its interaction with leaf senescence. Villesseche [13] applied near-infrared spectroscopy, hyperspectral imaging, and chemometric analysis to characterize the temporal and spatial responses of durum wheat to Septoria infection under controlled conditions.
In contrast to those laboratory-based studies, Anderegg et al. [14] investigated the use of hyperspectral measurements to assess wheat infection by Z. tritici under field conditions. Using partial least squares regression (PLS) models, high prediction performance for SLB parameters was obtained, while the classification accuracy of healthy and infected plants reached 93%, confirming the considerable potential of this method also under field conditions. A further field-based application was reported by Zhelezova et al. [15], who used a portable non-imaging VIS–NIR hyperspectrometer to evaluate damage caused by Septoria tritici blotch and Stagonospora nodorum blotch in spring wheat prior to harvest. Point spectral measurements were acquired directly from leaves and ears at late stages of infection, specifically 37 days after STB inoculation and 30 days after SNB inoculation. A perceptron neural network provided high accuracy in distinguishing healthy from diseased plant material, whereas the differentiation of mild and moderate disease severity classes was substantially less reliable. These results demonstrate the potential of field-based point spectroscopy for pre-harvest disease assessment, while also highlighting limitations in the quantitative discrimination of intermediate infection levels. The relationship between disease-induced physiological changes and spectral responses was further examined by Danilov et al. [16] in artificially inoculated winter wheat under field conditions. The fungal diseases investigated included Septoria leaf blotch (SLB), alongside other naturally developing fungal infections. Ground-based spectrometric measurements and UAV remote sensing were combined with laboratory determinations of chlorophyll a and b contents. The relationships between chlorophyll concentration and spectral characteristics varied depending on the predominant fungal disease and the observation period, while selected spectral channels allowed disease severity levels to be differentiated. Moreover, significant correlations between ground-based and UAV-derived spectral measurements indicated the potential for transferring information obtained by proximal spectroscopy to remote crop monitoring.
Attempts have also been made to assess wheat infection by Z. tritici using satellite imagery. Malakhov [17] reported a moderate correlation of approximately 0.5 between disease severity and data from Landsat 8 and Sentinel-2 sensors. These results indicate that satellite data may support disease monitoring at larger spatial scales, although their usefulness for precise assessment of disease severity may be limited by spatial resolution, revisit frequency, and the influence of cloud cover.
The integration of image-based and spectral data with machine learning algorithms offers the possibility of developing objective, automated, and scalable tools for monitoring SLB of wheat. Such models may support both the classification of healthy and infected plants and the quantitative assessment of disease severity, providing information useful for precision agriculture systems and for decision-making related to the optimization of fungicide protection [7,11].
The main objective of this study was to evaluate the applicability of hyperspectral and multispectral remote sensing data for the detection and quantitative assessment of SLB in winter wheat. The specific objectives were: (i) to compare the performance of full-range ASD hyperspectral data, selected ASD spectral bands corresponding to UAV camera channels, UAV multispectral data, and vegetation indices; (ii) to assess the effectiveness of CatBoost, Random Forest, and XGBoost algorithms in classifying healthy and infected wheat leaves and predicting disease severity; and (iii) to identify the most informative spectral regions and vegetation indices associated with disease symptoms and infection progression.
2. Materials and Methods
2.1. Study Area
The study was conducted in experimental plots at the Agricultural Experimental Station in Winna Góra, belonging to the Institute of Plant Protection—National Research Institute in Poznań. Winna Góra is located at 52°11′N, 17°17′E and is characterized by a temperate transitional climate, influenced by both polar maritime and continental air masses (Figure 1). Average temperatures during the growing season (April–September) in Winna Góra typically range from approximately 10–12 °C in April to about 17–19 °C in September. The warmest month is July, with a long-term mean temperature usually around 18–20 °C. However, significant deviations from these values are observed in individual years. June is a particularly important month from the perspective of biological processes and crop production. During this period, the average air temperature in Winna Góra is usually around 16–18 °C, but in warmer years it may exceed 19–20 °C, while in cooler years it can drop to around 15 °C. Thus, June represents a transitional month between the period of intensive spring growth and the phase of summer temperature maxima, and its thermal conditions strongly influence the development of crop biomass and yield formation. Precipitation in Winna Góra is highly variable. During the growing season, periods of rainfall deficit frequently occur, especially in the summer months, which increases the risk of agricultural drought. At the same time, years with precipitation totals substantially exceeding the long-term average are also observed. Weather conditions in June 2025 were characterized by a mean monthly minimum temperature of 12 °C and a mean monthly maximum temperature of 24 °C. The average relative air humidity reached 71%, while the total monthly precipitation amounted to 89 mm. The weather conditions recorded in June 2025 can be considered favorable for the development and progression of SLB symptoms in wheat, due to the relatively high air humidity and substantial precipitation, which created conducive conditions for pathogen infection and spread.
Figure 1.
Study area. (a) Location of the study site in Poland, (b) fields surrounding the Agricultural Experimental Station in Winna Góra, and (c) aerial view of 8 crop plots with 10 permanent sampling points marked with red dots.
2.2. Experimental Design
The field experiment was conducted at the Experimental Station of the Institute of Plant Protection in Winna Góra, located 60 km south of Poznań, Poland. The winter wheat cultivar Arkadia was used in the experiment. Wheat was sown on 10 October 2024 in accordance with agronomic recommendations for the region. Based on multiple field observations, the selected cultivar is considered moderately resistant to Z. tritici. Therefore, a gradual development of disease symptoms during the growing season was expected. No fungicide treatments were applied during the experiment to allow the natural development of SLB. The study was designed as an observational field experiment aimed at developing and evaluating machine-learning models under natural disease conditions rather than comparing different treatment effects. The experiment consisted of eight adjacent plots, each with an area of 44 m2. Within each plot, ten permanent sampling points were established and used throughout the study for leaf sampling, hyperspectral measurements, and UAV image acquisition.
2.3. Spectral Measurements
Hyperspectral measurements were conducted at three growth stages: 30 May 2025 (BBCH 71), 10 June 2025 (BBCH 73), and 23 June 2025 (BBCH 77). The dataset comprised 240 observations, obtained from eight experimental plots, ten permanent sampling points within each plot, and three assessment dates. Crop canopy reflectance spectra were acquired at ten sampling points within each experimental plot using a portable ASD FieldSpec Pro spectroradiometer (Analytical Spectral Devices Inc., Boulder, CO, USA). Spectral measurements were recorded over the 350–1000 nm range with a spectral resolution of 3 nm and over the 1000–2500 nm range with a spectral resolution of 10 nm. The instrument was equipped with a 25° field-of-view optic, and measurements were performed at a fixed distance of 1.5 m above the upper crop canopy (Figure 2). All measurements were collected under cloudless conditions within one hour of solar noon in order to minimize variability associated with solar irradiance. Prior to each measurement session, radiometric calibration was performed using a white reference panel (Spectralon). Spectral regions affected by strong atmospheric water absorption and low signal-to-noise ratio (SNR), specifically 1340–1445 nm, 1790–1955 nm, and 2400–2500 nm, were excluded from further analyses. The ASD FieldSpec measurements were used as a reference dataset to characterize spectral patterns associated with different levels of stripe rust severity. The hyperspectral data were not intended to directly simulate the spectral response of the UAV multispectral sensor; instead, approximately corresponding spectral regions were compared to assess whether similar spectral information could be identified in both measurement approaches.
Figure 2.
Spectral data acquisition.
2.4. RGB Data Acquisition
After hyperspectral measurements were performed in the field, 10 randomly selected flag leaves were collected from each measurement location. The leaves were placed in plastic bags labeled with information indicating their position within the plot. All samples were kept on ice in a plastic container during transport to the laboratory.
In the laboratory, the leaves were placed between sheets of paper in a notebook and pressed overnight under heavy books prior to RGB image acquisition on the following day. RGB images were acquired using a digital camera (Canon EOS 80D, Canon Inc., Tokyo, Japan) at three time points during the growing season, with image acquisition performed one day after hyperspectral measurements. Detailed camera specifications are provided in Table 1.
Table 1.
Parameters of images captured with RGB and multispectral cameras under laboratory and field conditions, respectively.
The RGB camera was mounted on a tripod at the nadir position with a constant height of 0.75 m above the leaf placed on a black surface and illuminated by four separate 70-watt lamps. In total, 2400 (10 leaves × 8 plots × 10 points × 3 dates) images of leaves were captured in the laboratory (Figure 3).
Figure 3.
Representative images of healthy wheat leaves and leaves exhibiting Septoria leaf blotch (SLB) symptoms, captured under controlled laboratory conditions.
2.5. Multispectral Image Acquisition
Multispectral UAV imagery was acquired using a Parrot Sequoia multispectral camera mounted on a Parrot Bluegrass UAV. Flights were conducted at an altitude of 30 m above ground level, resulting in a ground sampling distance of approximately 2.8–2.9 cm per pixel for single-band images. The sensor recorded images in four spectral bands: green (530–570 nm); red (640–680 nm); red-edge (730–740 nm); and near-infrared (770–810 nm). The images were radiometrically calibrated to surface reflectance using calibration images of a reference panel with known spectral reflectance properties. Band-specific orthomosaics were generated in Pix4D and subsequently used to extract multispectral reflectance values and calculate vegetation indices.
2.6. Spectral Indices
Based on hyperspectral data acquired with an ASD spectroradiometer and multispectral imagery collected from the UAV platform, ten vegetation indices were calculated (Table 2). For the hyperspectral data, reflectance values were averaged within four spectral ranges corresponding to the UAV camera bands: 530–570, 640–680, 730–740, and 770–810 nm.
Table 2.
Vegetation indices (VIs) used as predictors in the machine learning models. G–mean value of the green channel, R–mean value of the red channel, and RE–mean value of the red-edge channel.
2.7. Image Processing—Assessment of Disease Severity
Leaf disease severity was quantified using the Trainable Weka Segmentation approach. Prior to analysis, all images were preprocessed by resizing them to 5500 × 1000 pixels to improve computational efficiency, followed by brightness normalization, contrast enhancement, and application of a uniform black background to improve segmentation performance and classification consistency. After segmentation, disease severity was determined as the proportion of symptomatic tissue relative to the total leaf area and was calculated according to the following equation:
where DS is the disease severity (%), Ad is the area of symptomatic tissue (pixels), and Al is the total leaf area (pixels). Disease severity at each sampling point was calculated by averaging the severity values obtained from 10 leaves. Considering three assessment dates, this procedure yielded 240 disease severity observations, which were subsequently used as response variables in the analyzed models. Leaves exhibiting disease symptoms covering up to 3% of the leaf area were considered healthy. This operational threshold was adopted to reduce uncertainty associated with very low disease severities, which are difficult to assess reliably and are particularly prone to estimation errors during visual annotation and image-based quantification. The 3% threshold does not represent a biological definition of disease absence; rather, it was used to distinguish symptom-free or nearly symptom-free leaves from leaves with clearly detectable disease development. Therefore, the classification results should be interpreted as discrimination between healthy/near-healthy and diseased leaves under the adopted operational criteria. Future studies should evaluate the sensitivity of classification performance to alternative disease severity thresholds (e.g., 1%, 3%, and 5%) to further assess the robustness of this approach.
DS (%) = Ad × 100/Al
2.8. Model Development
Six types of datasets were used for SLB modeling: (i) the full hyperspectral spectrum (350–2500 nm), (ii) a four-band hyperspectral subset corresponding to the spectral ranges of the multispectral drone camera (530–570, 640–680, 730–740, and 770–810 nm), (iii) average reflectance values calculated for these four bands and referred to as GRReNir (Green, Red, Red-edge, Near-Infrared reflectance features), (iv) ten spectral indices calculated from the hyperspectral GRReNir bands, (v) multispectral GRReNir data, and (vi) ten spectral indices calculated from the multispectral GRReNir bands. Each dataset was paired with wheat leaf disease severity values quantified under controlled laboratory conditions using RGB image analysis for disease modeling. In total, 240 observations were used for model development. Classification and regression analyses were performed using three machine learning algorithms: CatBoost, Random Forest (RF), and Extreme Gradient Boosting (XGBoost). CatBoost is a gradient boosting algorithm designed to efficiently handle complex datasets, with built-in mechanisms to reduce overfitting and improve predictive performance, particularly in heterogeneous data. Random Forest (RF) is an ensemble learning method based on multiple decision trees constructed using bootstrap aggregation, which enhances robustness and reduces variance by averaging predictions from individual trees. XGBoost is an optimized gradient boosting framework that builds decision trees sequentially by minimizing prediction errors, offering high computational efficiency and strong predictive performance. The dataset was randomly split into training (70%) and testing (30%) subsets using stratified sampling. Given the spatial and temporal organization of the data (plots, sampling points, and measurement dates), observations can exhibit intra-group similarity. The resulting train–test partition therefore reflects this structure, and model performance is interpreted with respect to these inherent dependencies. A fixed random seed (set.seed = 123) was applied to ensure reproducibility of the results. Model performance was evaluated using an independent test set not involved in model training and assessed using confusion matrix-derived metrics, including accuracy, sensitivity, and specificity. For the XGBoost model, predictor variables were standardized prior to training, whereas no scaling was applied for CatBoost and Random Forest models. Feature importance was evaluated using model-specific approaches, including PredictionValuesChange (CatBoost), the Boruta algorithm (Random Forest), and Gain-based importance (XGBoost). Because these measures are based on different mathematical definitions, they were used to identify the ranking of informative variables within each model and were not interpreted as directly comparable numerical values across algorithms. For classification, the reliability of the models was evaluated using the following metrics: Accuracy, Kappa, Sensitivity, Specificity, and Balanced Accuracy, according to the formulas below:
where
- TP—True Positives;
- FP—False Positives;
- FN—False Negatives;
- TN—True Negatives.
For regression of plant disease severity, model reliability was evaluated based on the coefficient of determination (R2) and the root mean square error (RMSE), according to the following formulas:
where
- —observed value;
- —value predicted by the model;
- —mean of the observed values;
- —number of observations.
- —observed value;
- —value predicted by the model;
- —number of observations.
3. Results
3.1. Disease Severity Assessment
The development of SLB symptoms showed a clear and strong increase over the observation period (Figure 4). On 30 May, disease severity remained at a very low level, with quartile values ranging from 0.35 to 0.80, indicating limited and early-stage infection with low variability among samples. By 10 June, a moderate increase in disease intensity was observed. Quartile values increased to 1.37 (Q1), 1.82 (Q2), and 2.71 (Q3), corresponding to an approximately three- to four-fold rise compared to the initial assessment. This suggests an ongoing expansion of infection and transition from latent to active disease development.
Figure 4.
Temporal changes in disease severity. Letters (a, b, c) indicate homogeneous groups according to Tukey’s test (p ≤ 0.05); means sharing the same letter do not differ significantly. Dots on the plots represent outliers.
Representative UAV images acquired during the observation period are presented in Figure 5. The images show temporal changes in the appearance and spatial heterogeneity of the wheat canopy between 30 May, 10 June, and 23 June 2025. These visual changes accompanied the progression of crop development and the increase in disease symptoms observed during the study period. However, because canopy appearance may also be affected by phenological development, senescence, and other environmental factors, the images should be interpreted as a complementary visual representation rather than as direct evidence of SLB severity.
Figure 5.
Representative UAV images of the experimental wheat plots acquired on three dates, illustrating temporal changes in canopy appearance during the observation period.
A rapid escalation of disease severity occurred between 10 and 23 June. During this period, quartile values increased sharply to 10.59, 12.73, and 15.76 for Q1, Q2, and Q3, respectively. This represents a substantial, near-order-of-magnitude increase in symptom severity, indicating an epidemic phase of disease development. At this stage, a marked increase in variability among samples was also observed, reflecting heterogeneous disease progression within the crop canopy. Overall, disease progression followed an exponential-like pattern, characterized by a slow initial increase, followed by rapid epidemic development under favorable environmental conditions.
Figure 6 illustrates the temporal changes in canopy reflectance spectra measured on 30 May (BBCH 71), 10 June (BBCH 73), and 23 June (BBCH 77). Distinct differences in spectral response were observed across the measurement dates, with the magnitude and direction of changes depending on the wavelength region. In the visible range (350–700 nm), reflectance exhibited relatively small temporal variations. A slight increase in reflectance was observed in the blue and green regions (approximately 450–600 nm), with the highest values recorded on 23 June, whereas differences in the red region (around 650–700 nm) were comparatively small. The most pronounced temporal changes occurred in the red-edge and near-infrared (NIR) regions (700–1300 nm). Reflectance reached its highest values on 30 May, decreased on 10 June, and was lowest on 23 June. The reduction was particularly evident in the red-edge region (approximately 720–760 nm), where the maximum reflectance declined from approximately 0.45 on 30 May to about 0.36 on 23 June. A similar decreasing trend was observed throughout the NIR plateau, indicating progressive changes in canopy structure and physiological condition during disease development. In contrast, reflectance in the shortwave infrared (SWIR) region increased over time. Within the SWIR1 range (1450–1800 nm), reflectance gradually increased from 30 May to 23 June, with the greatest differences observed around 1600–1700 nm. A similar trend was found in the SWIR2 region (2000–2450 nm), where the highest reflectance values were consistently recorded on 23 June.
Figure 6.
Spectral characteristics of wheat at three time points (BBCH 71, BBCH 73, BBCH 77).
Overall, the temporal spectral response was characterized by a progressive decrease in reflectance in the red-edge and NIR regions accompanied by an increase in reflectance in the SWIR region. These changes correspond to the progression of Zymoseptoria tritici infection and are consistent with reductions in chlorophyll content, deterioration of leaf internal structure, and decreasing canopy water content as disease severity increased during the growing season.
3.2. Classification Models
3.2.1. Model Performance
The effectiveness of wheat plant classification, including the distinction between healthy plants and those infected by Septoria leaf blotch, varied depending on the spectral range, data source, and machine learning algorithm used (Table 3).
Table 3.
Performance metrics (Accuracy, Kappa, Sensitivity, Specificity and Balanced Accuracy) of CatBoost, Random Forest, and XGBoost models in classifying healthy wheat leaves and leaves affected by SLB using ASD hyperspectral and UAV multispectral data and vegetation indices.
For ASD full spectrum, the highest performance was achieved by the Random Forest model, with a classification accuracy of 0.9583 and a balanced accuracy of 0.9483. The CatBoost model obtained slightly lower, yet still very high values (accuracy = 0.9444; balanced accuracy = 0.9423), whereas the XGBoost model showed the lowest performance (accuracy = 0.9167; balanced accuracy = 0.9134). When the analysis was limited to the ASD four-band subset simulating UAV camera channels (530–570, 640–680, 730–740, and 770–810 nm), results were similar to those obtained using the full spectrum. The CatBoost model achieved an accuracy of 0.9306 and a balanced accuracy of 0.9306, while Random Forest and XGBoost reached 0.9583/0.9483 and 0.9444/0.9366, respectively. Analysis of the ASD mean of the four-band subset (GRReNir) showed that, for CatBoost, classification parameters were slightly lower than for the full spectrum. In contrast, Random Forest produced identical results to the full spectrum, and XGBoost achieved slightly better performance. In the case of ASD Indices GRReNir, all models generated identical Accuracy and Balanced Accuracy values, namely 0.9583 and 0.9483. For the UAV Four-Band subset GRReNir calculated from data acquired using a UAV-mounted camera, performance was slightly lower. For CatBoost, Accuracy and Balanced Accuracy were 0.8451 and 0.8534, for Random Forest 0.8592 and 0.8463, and for XGBoost 0.8592 and 0.8588. For UAV indices Indices GRReNir, CatBoost and Random Forest achieved Accuracy and Balanced Accuracy of 0.8451 and 0.8285, whereas XGBoost reached 0.8592 and 0.8713.
A comparison of the three machine learning models revealed differences in their performance characteristics. Random Forest most frequently achieved the highest classification accuracy and kappa coefficient, indicating high stability and robustness to input variability. CatBoost produced results very similar to Random Forest while maintaining high stability across different spectral configurations, suggesting good generalization ability with reduced feature sets. XGBoost showed slightly lower performance for the full hyperspectral range; however, for UAV-based data, it achieved the best results. In this case, it reached the highest balanced accuracy (0.8713) and high sensitivity (0.9286), indicating strong effectiveness in detecting infected plants under conditions similar to practical field applications.
3.2.2. Spectral Feature Selection
For ASD full spectrum (350–2500 nm), the highest feature importance values were observed for wavelengths in the red region in CatBoost (701 and 660 nm) and Random Forest (637 and 629 nm), as well as in the green region for XGBoost (511 and 507 nm) (Figure 7). In two models, wavelengths from the SWIR range were also important: 1783–2280 nm for CatBoost and 1966–2293 nm for XGBoost. For ASD four-band subset (530–570, 640–680, 730–740, 770–810 nm), the dominant contribution came from red wavelengths (CatBoost: 680, 663, 674, 642, 665 nm; Random Forest: 641, 640, 679, 660, 655, 656, 678 nm; XGBoost: 640, 659, 641 nm) and green wavelengths (CatBoost: 560, 547 nm; Random Forest: 566, 567, 570 nm; XGBoost: 565, 560, 530, 566 nm). The red-edge region was important for CatBoost (731, 730, 740 nm) and XGBoost (730, 737 nm). For the ASD mean of the four-band subset (GRReNir), the order of band importance for CatBoost and Random Forest was: Red, Green, NIR, Red-edge, whereas for XGBoost it was: Red, Green, Red-edge, NIR. Analysis of ASD Indices GRReNir indicated that NDVI and GNDVI indices, using green, red, and NIR bands, had the highest feature importance across all models. Results from the UAV Four-Band subset GRReNir differed slightly from ASD-based results. For Random Forest and XGBoost, the importance ranking was: Green, Red, NIR, Red-edge. For XGBoost, the green channel remained the most important, but NIR ranked second and red third. Analysis of UAV indices Indices GRReNir confirmed the major importance of GNDVI, whereas NDVI was less significant.
Figure 7.
Feature importance for the classification of healthy wheat leaves and leaves affected by SLB using CatBoost, Random Forest, and XGBoost models based on RGB images acquired under laboratory conditions, ASD hyperspectral data, UAV multispectral data, and vegetation indices collected under field conditions.
Random Forest showed the most uniform distribution of feature importance among the analyzed algorithms. The importance of both spectral bands and indices was relatively balanced across the range, without strongly dominant predictors. In contrast, CatBoost exhibited a more heterogeneous distribution, although still less concentrated than XGBoost. Several features reached clearly higher importance, but many wavelengths and indices still contributed meaningfully to classification. XGBoost demonstrated the most selective behavior, with only a few spectral bands or individual indices reaching very high importance, while the contribution of remaining features was marginal. These differences reflect the distinct feature importance definitions and feature selection strategies implemented by each machine learning algorithm and therefore should be interpreted qualitatively rather than as directly comparable quantitative measures.
3.3. Regression Models
3.3.1. Model Performance
The analysis of regression model performance (CatBoost, Random Forest, and XGBoost) in predicting wheat infection levels depending on spectral range and data source showed variable results (Figure 8). To provide a more detailed characterization of model error, RMSE was calculated separately for two disease severity intervals (0–10% and 10–20%) as well as for the entire disease severity range (0–20%). This approach is particularly recommended when early detection is crucial and prediction error varies significantly across severity levels.
Figure 8.
Performance metrics (R2 and RMSE (0, 10), RMSE [10–20), and RMSE (0–20)) of CatBoost, Random Forest, and XGBoost models in predicting SLB severity using ASD hyperspectral and UAV multispectral data and vegetation indices. (0, 10), [10–20), and (0–20) are two classes of disease severity (0–10% and 10–20%) as well as the entire disease severity range (0–20%) in percent.
For ASD full spectrum, the highest prediction performance was achieved by CatBoost (R2 = 0.9067, RMSE 0–20% = 2.019). For Random Forest and XGBoost, R2 and RMSE (0–20%) were 0.8987/2.102 and 0.8964/2.781, respectively. For ASD four-band subset (530–570, 640–680, 730–740, 770–810 nm), high prediction performance was also observed: CatBoost (R2 = 0.907, RMSE 0–20% = 1.978), Random Forest (R2 = 0.8454, RMSE 0–20% = 2.591), and XGBoost (R2 = 0.8476, RMSE 0–20% = 2.52). Using the ASD mean of the four-band subset (GRReNir), CatBoost again showed the highest performance (R2 = 0.9037, RMSE 0–20% = 2.0), followed by XGBoost (R2 = 0.8322, RMSE 0–20% = 2.712) and Random Forest (R2 = 0.7782, RMSE 0–20% = 3.287). Models based on ASD Indices GRReNir achieved high accuracy: CatBoost (R2 = 0.9172, RMSE 0–20% = 1.871), Random Forest (R2 = 0.9199, RMSE 0–20% = 1.864), and XGBoost (R2 = 0.8863, RMSE 0–20% = 2.193). Results from the UAV Four-Band subset GRReNir were lower compared to ASD-based measurements: CatBoost (R2 = 0.6592, RMSE 0–20% = 3.68), Random Forest (R2 = 0.6247, RMSE 0–20% = 3.792), and XGBoost (R2 = 0.613, RMSE 0–20% = 3.939). For UAV indices Indices GRReNir, performance metrics were also lower than ASD-based indices: CatBoost (R2 = 0.6249, RMSE 0–20% = 3.895), Random Forest (R2 = 0.7311, RMSE 0–20% = 3.176), and XGBoost (R2 = 0.5863, RMSE 0–20% = 4.139).
Among the analyzed algorithms, CatBoost showed the highest stability and robustness to spectral information reduction, consistently achieving high R2 and low RMSE (0–20%) for ASD data. Random Forest and XGBoost produced similar results for both full spectrum and simulated band subsets. Comparison of R2 values indicated an advantage of XGBoost over Random Forest for ASD GRReNir ranges, whereas Random Forest performed better for index-based inputs. These conclusions are confirmed by RMSE (0–20%) values. The spectral and multispectral responses presented in Figure 5 were linked with the corresponding field-measured disease severity (DS) values obtained from RGB-based leaf segmentation at the same sampling locations and assessment dates.
3.3.2. Spectral Feature Selection
For ASD full spectrum (350–2500 nm), the highest feature importance values were found in the red region (CatBoost: 651 nm, Random Forest: 670 nm) and red-edge (XGBoost: 751 nm) (Figure 9). The ASD FieldSpec measurements were used as a reference dataset to characterize spectral patterns associated with different levels of stripe rust severity. The hyperspectral data were not intended to directly simulate the spectral response of the UAV RGB sensor; instead, approximately corresponding spectral regions were compared to assess whether similar spectral information could be identified in both measurement approaches. Differences between models were mainly related to the contribution of SWIR wavelengths. In CatBoost, 7 out of the 10 most important wavelengths were in the SWIR range, while in Random Forest all 10 were in the VIS range. In XGBoost, important wavelengths were distributed across VIS (4), NIR (2), and SWIR (4). Because feature importance was calculated using algorithm-specific methods, the importance values were interpreted qualitatively as rankings of informative predictors within each model rather than as directly comparable quantitative measures across algorithms.
Figure 9.
Feature importance for predicting Septoria leaf blotch severity using CatBoost, Random Forest, and XGBoost models based on RGB images acquired under laboratory conditions, ASD hyperspectral data, UAV multispectral data, and vegetation indices collected under field conditions.
For the ASD four-band subset, red wavelengths dominated. CatBoost and Random Forest each had 7 important red bands, whereas XGBoost had 4. NIR appeared only once and only for XGBoost. For the ASD mean of the four-band subset (GRReNir), the green range was most important for CatBoost, while the red range dominated for Random Forest and XGBoost. For ASD Indices GRReNir, the most important indices were Datt1 (CatBoost) and NDVI (Random Forest and XGBoost). For UAV Four-Band subset GRReNir, the most important ranges were Green for CatBoost, NIR for Random Forest, and Red for XGBoost. For UAV indices Indices GRReNir, GNDVI was most important for CatBoost and Random Forest, while Datt1 dominated in XGBoost.
Random Forest exhibited the most balanced feature importance profile among the analyzed models. Both spectral bands and indices had comparable importance across the entire range, suggesting that the model relied on information distributed across multiple predictors rather than on a small subset of dominant variables. CatBoost showed a more differentiated importance distribution, whereas XGBoost was the most selective model, with only a few spectral bands or indices receiving high importance scores. These differences should be interpreted in the context of the algorithm-specific feature importance measures and model architectures rather than as directly comparable quantitative estimates.
4. Discussion
4.1. Effectiveness of Hyperspectral and Multispectral Data for Septoria Leaf Blotch Detection and Severity Estimation
The results obtained confirm that spectral data constitute an effective tool for the detection and quantitative assessment of SLB of wheat, while their diagnostic value depends primarily on spectral resolution and the range of the recorded spectrum. In our study, clear differences were observed between the potential of ASD hyperspectral measurements and multispectral data acquired from UAV platforms. The highest model performance was obtained for hyperspectral data, indicating that the development of infection caused by Z. tritici leads to complex optical changes in plants, visible not only in the visible region but also in the red-edge, NIR, and SWIR regions.
The results presented are consistent with previous studies demonstrating the high sensitivity of hyperspectral measurements to physiological, biochemical, and structural changes occurring in plant tissues under biotic stress. In the study by Niu et al. [28], conducted under laboratory conditions on individual leaves, SLB was detected as early as seven days before the appearance of visual symptoms, while the applied PLS-DA model achieved an overall classification accuracy of 96.97%. These findings highlight the particular usefulness of hyperspectral imaging for detecting early disease-related changes that are not yet macroscopically visible. It should be noted, however, that laboratory experiments conducted on individual leaves are characterized by much greater control of measurement conditions than studies carried out at the canopy level. In this context, the results of Bebronne et al. [29] are particularly relevant; at the canopy level, they achieved an accuracy of 81% and a κ coefficient of 0.60 when distinguishing plots with Septoria tritici blotch (STB) severity below and above 100 area under disease pressure curve (AUDPC). These findings indicate that ground-based hyperspectral measurements can retain high diagnostic value even under conditions of greater environmental variability.
In our study, models developed using ASD data showed high performance, reaching coefficients of determination (R2) in the range of 0.88–0.95. Such high values indicate not only a good fit of the models to the data but also their ability to capture relationships between the spectral signal and the degree of plant infection. This is particularly important because, under field conditions, the spectral signal of the canopy results from the interaction of many overlapping factors, including plant structure, growth stage, canopy closure, soil moisture, illumination variability, and the spatial heterogeneity of disease symptoms. The results suggest that, despite this complexity, hyperspectral data retain sufficient information detail to enable effective detection and prediction of disease severity.
At the same time, it should be emphasized that in our study, the performance of models based on UAV data was lower than that of models using ASD measurements. This result suggests that operational multispectral UAV systems exhibit only marginally lower performance compared to ASD data in classification, whereas their limitations are more evident in regression tasks requiring accurate quantification of disease severity. Vagelas et al. [30] demonstrated the possibility of using multispectral UAV cameras to distinguish protected plots from those showing symptoms of Septoria leaf blotch; however, their findings suggest that, for more detailed assessment of disease severity, a limited number of broad spectral bands may be insufficient. The lower usefulness of UAV data is also affected by technical and environmental factors, such as variable illumination conditions, atmospheric effects, imaging geometry, flight altitude, spatial resolution, radiometric calibration, and canopy heterogeneity.
4.2. Spectral Signatures of Disease Development and Importance of Diagnostic Wavelength Regions
The analysis of feature importance highlighted the green, red, red-edge, and NIR regions as the most informative spectral predictors. Although the present study did not directly measure physiological traits such as chlorophyll content, water status, or leaf structural properties, the importance of these spectral regions is consistent with previous studies reporting their sensitivity to disease-induced physiological and structural changes. In particular, visible wavelengths have frequently been associated with changes in photosynthetic pigments, the red-edge region with alterations in chlorophyll-related properties, and the NIR region with modifications in leaf internal structure. Therefore, the observed importance of these spectral regions should be interpreted as being consistent with previous findings.
These results are consistent with the observations of Fahrentrapp et al. [31] and Mahlein [11], who indicated that different spectral regions correspond to different plant properties: the visible range is mainly associated with pigments, NIR with tissue structure, and SWIR with water content and biochemical properties. Similar conclusions were presented in the study by Malakhov [32], which demonstrated the usefulness of visible, red-edge, and NIR regions in assessing cereal health. Ualiyeva et al. [33], analyzing wheat diseases in the VNIR range, also demonstrated the possibility of distinguishing healthy plants from those infected by different pathogens, including the causal agent of Septoria leaf blotch. The importance of the red-edge region is further supported by studies on other plant diseases, including Fernández et al. [34], who demonstrated the high sensitivity of this spectral region to early stages of disease stress in potato late blight.
An important conclusion from the present study is that a limited set of Green–Red–Red-edge–NIR bands enabled classification performance comparable to that of models using the full spectrum. This indicates that the key diagnostic information related to disease presence is largely concentrated in specific wavelength regions. This has important practical implications, as it suggests the possibility of developing simpler, cheaper, and more operational monitoring systems based on multispectral cameras. These results correspond with the studies by Chivasa et al. [35] and Gogoi et al. [36], in which combinations of green, red, red-edge, and NIR bands enabled effective detection of cereal diseases with substantially lower data complexity than full hyperspectral imaging.
4.3. Contribution of SWIR Information to Disease Severity Assessment
One of the most important findings of the present study was the importance of SWIR wavelengths, particularly for regression models based on full ASD spectra.
One of the most important limitations of typical UAV systems is the lack of the SWIR range, which proved important in regression models based on ASD data. Most cameras used on low-altitude UAV platforms in agricultural applications cover the visible and near-infrared ranges, most commonly approximately 400–900 nm, which limits their ability to record changes related to tissue water status and biochemical properties. Previous studies have shown that infection by Z. tritici may lead not only to chlorophyll degradation but also to structural changes, disturbances in plant water relations, and progressive tissue necrosis, which are particularly well expressed in the SWIR range. The importance of this range in the diagnosis of SLB is confirmed by numerous studies. Yu et al. [37] showed that hyperspectral measurements in the VIS–SWIR range enable both classification of healthy and infected plants and quantitative assessment of infection severity, achieving classification accuracy of approximately 93%.
Yu et al. [33] also indicated the high effectiveness of water-related indices, especially NDWI, suggesting that SLB infection leads to biochemical changes and accelerated senescence, which are expressed in spectral characteristics related to water absorption. Similar observations were reported by Anderegg et al. [12], who observed an increase in SWIR reflectance in infected canopies compared with healthy canopies already at early stages of disease development.
Particularly important information on the significance of SWIR is provided by the study of Bohnenkamp et al. [38], in which spectral changes in wheat leaves infected by different pathogens, including Z. tritici, were analyzed. The authors showed increased reflectance in this range in the case of Septoria leaf blotch, tan spot, and powdery mildew. In the case of Septoria leaf blotch, the first significant changes in SWIR were observed at the stage when a dense network of hyphae had already developed in the intercellular spaces of the mesophyll, followed by the formation of pycnidia. This means that the SWIR range may reflect not only secondary effects of infection, such as necrosis, but also deeper anatomical and physiological changes occurring in tissues. Latchoumane et al. [12] also demonstrated that differences between healthy and infected leaves recorded with a SWIR camera became noticeable only a few days after inoculation and were clearly visible from approximately 10–15 days onward.
The lower performance of UAV-based models likely resulted from multiple factors, including differences in observation scale, canopy structure, illumination conditions, pixel mixing effects, and radiometric properties. The absence of SWIR information may have provided an additional limitation but should not be considered the primary cause of reduced prediction accuracy. This is also confirmed by the findings of Kim et al. [39], who demonstrated that high spectral resolution in the SWIR range enables the detection of even small changes in plant water content. Since SLB leads to disturbances in water status, tissue degradation, and accelerated leaf senescence, the full 350–2500 nm spectrum provides more complete information than a limited set of multispectral bands.
4.4. Role of Vegetation Indices in Spectral Assessment of Septoria Leaf Blotch Severity
The analysis of vegetation indices used in our study demonstrated the usefulness of both NDVI and GNDVI; however, their importance depended on the type of data and the modeling objective. In the case of ASD data, classical vegetation indices showed high utility, which results from their relationship with photosynthetic activity, chlorophyll content, and overall plant condition. At the same time, the superiority of GNDVI over NDVI in some analyses, particularly for UAV data, indicates that the green band may be more sensitive to early disease-related changes than the classical combination of red and NIR. This is consistent with the findings of Sereda et al. [40], who emphasized that NDVI is a relatively nonspecific index, strongly responding to the general condition of the canopy, whereas GNDVI better reflects changes in chlorophyll content.
However, it should be noted that individual vegetation indices have limited diagnostic value in distinguishing biotic stress from other factors, such as nutrient deficiencies, drought, leaf senescence, or mechanical damage. For this reason, the interpretation of indices should be carried out with caution, preferably in a temporal context or in combination with additional spectral information. Sereda et al. [40] indicated that analyzing changes in indices over time allows the dynamics of infection development to be captured more effectively than a single measurement. Similarly, the results of Yu et al. [37], indicating the high effectiveness of NDWI, suggest that in the case of Septoria leaf blotch, indices related not only to chlorophyll but also to water content and senescence processes may be particularly valuable.
The importance of selecting appropriate indices is also confirmed by the study of Groll et al. [41], which showed that the effectiveness of SLB detection depends on wheat cultivar and its level of resistance. Cultivars differing in their response to infection may exhibit different rates of symptom development, varying intensity of chlorotic and necrotic changes, and diverse physiological responses, which directly affect the values of spectral indices. Odilbekov et al. [42], analyzing a large number of spectral indices, showed that indices specifically designed to capture subtle biochemical changes, such as LRDSI and D2, may outperform classical vegetation indices in terms of SLB symptoms. These findings indicate that future studies should consider not only standard NDVI and GNDVI indices but also indices more specific to pigment-related, structural, and water-related changes. The combined use of several groups of indices and full sets of spectral features may be particularly promising, as it allows the complex nature of canopy response to infection to be captured more effectively.
4.5. Performance of Machine Learning Algorithms for Spectral Disease Assessment
An important element of the present study was the evaluation of the usefulness of different machine learning algorithms. The high stability of Random Forest models is consistent with numerous reports indicating the robustness of this algorithm to data noise, feature collinearity, and the risk of overfitting. In the analysis of hyperspectral data, this is particularly important because such data are usually high-dimensional, and adjacent bands are strongly correlated. Random Forest effectively uses information distributed across many features while limiting the influence of less important variables. Ualiyeva et al. [33] identified Random Forest as the most effective algorithm for the automatic identification of SLB based on hyperspectral data, while Kahsay [43] demonstrated its superiority over other classification models in terms of accuracy, sensitivity, and specificity.
CatBoost, in turn, showed particularly high usefulness in regression tasks, which can be explained by its ability to model complex, nonlinear relationships between spectral features and disease severity. Boosting algorithms often perform well in situations where relationships between predictors and the response variable are nonlinear and difficult to describe using classical statistical methods. These results correspond with the studies by Harish et al. [44], Padmanabhuni et al. [45], and Darmawan et al. [46], who demonstrated the high effectiveness of CatBoost in plant disease detection tasks based on image and spectral data.
XGBoost, although also effective, showed a more selective character, which may indicate its greater sensitivity to feature selection and the representativeness of the training set. Similar observations were reported by Majumdar et al. [47], who obtained high but dataset-dependent classification performance in plant disease classification using XGBoost.
It should be emphasized, however, that the assessment of machine learning algorithm performance in field studies should consider not only predictive metrics but also the validation strategy, the representativeness of the training set, and the possible occurrence of spatial dependence among samples. This is particularly important in experiments based on spectral data acquired from plots, where observations may be partially spatially correlated or may result from similar microenvironmental conditions. Therefore, future studies should consider cross-seasonal or cross-location validation, or validation based on independent field experiments, which would allow the generalization ability of the models to be more fully assessed.
4.6. Integration of Hyperspectral and UAV Technologies for Operational Disease Monitoring and Precision Agriculture
The studies of Villesseche [13], Zhelezova et al. [15], and Danilov et al. [16] indicate that spectral assessment of Septoria-related damage should be considered simultaneously in temporal, physiological, and observation-scale contexts. Villesseche [13] emphasized the spatio-temporal evolution of spectral responses and their interaction with senescence, Zhelezova et al. [15] demonstrated that discrimination between healthy and diseased tissues is more reliable than differentiation among intermediate severity levels, and Danilov et al. [16] linked disease-related spectral variation with chlorophyll content while demonstrating partial correspondence between ground-based and UAV observations. The present findings extend these observations by showing, within a common field experiment, that proximal hyperspectral measurements can provide highly accurate classification and severity estimates, whereas UAV multispectral data preserve sufficient information for spatial disease screening but provide less accurate quantitative severity predictions.
From an operational perspective, these findings confirm the complementary roles of proximal hyperspectral measurements and UAV multispectral imagery. ASD measurements provide detailed spectral information that is consistent with physiological changes reported in previous studies and can serve as reference data for model calibration, whereas UAV platforms enable rapid and spatially detailed monitoring of agricultural fields. The integration of these data sources, supplemented with meteorological, phenological, and agronomic information, may significantly improve the accuracy of disease severity prediction under production conditions. Such an approach makes it possible to combine the high information detail of hyperspectral measurements with the operational capability and scalability of UAV imaging.
In conclusion, the results of this study indicate that hyperspectral reflectance data, particularly in the VIS–NIR–SWIR range, constitute a highly effective tool for the detection and quantitative assessment of SLB of wheat. UAV data, despite their lower accuracy, show considerable application potential due to their scalability, rapid data acquisition, and capacity for operational canopy monitoring. The most promising direction for future research is therefore the integration of the high information detail of hyperspectral measurements with the operational capability of UAV imaging, supported by advanced machine learning algorithms and additional environmental information. This approach has direct applications in precision agriculture, enabling earlier, more objective, and spatially differentiated decision-making regarding fungicide protection in wheat.
4.7. Study Limitations and Perspectives for Future Research
Several limitations of the present study should be considered when interpreting the relationship between spectral responses and disease severity. First, physiological and biochemical traits potentially associated with disease-induced spectral changes, such as chlorophyll content, plant water status, leaf area index (LAI), leaf inclination angle, chlorophyll fluorescence, and leaf structural characteristics, were not directly measured. Consequently, the feature importance analysis identifies statistically informative spectral predictors but should not be interpreted as direct evidence of the physiological mechanisms underlying disease development. The physiological interpretations presented in this study are therefore based on previous literature describing spectral responses of wheat to pathogen infection rather than on direct measurements performed in the experiment. Future studies integrating hyperspectral measurements with physiological and biochemical assessments would provide a more comprehensive understanding of the mechanisms responsible for the observed spectral responses.
A further limitation concerns the comparison between ASD hyperspectral measurements and UAV multispectral imagery. The ASD data were used as a reference dataset to characterize spectral patterns associated with different levels of SLB severity; however, the hyperspectral measurements were not intended to directly simulate the spectral response of the UAV sensor. Instead, approximately corresponding spectral regions were compared to evaluate whether similar spectral information could be identified using both measurement approaches. Averaging ASD reflectance values within selected wavelength ranges represents a simplification and does not fully reproduce the spectral response characteristics, bandwidths, and radiometric properties of the UAV sensor. Therefore, ASD measurements should be considered as a reference for evaluating spectral patterns related to disease severity rather than as a direct proxy for UAV-derived observations. Future studies using calibrated multispectral or hyperspectral UAV sensors could provide a more detailed evaluation of the relationship between field-scale spectral measurements and disease progression.
Another important limitation is the potential mismatch between the scale of disease assessment and spectral observations. Disease severity was quantified at the flag leaf level using RGB images of ten sampled leaves collected from each assessment point, whereas ASD and UAV measurements represented canopy-level reflectance. Consequently, the relationship between leaf-level disease severity and canopy spectral response may be influenced by canopy architecture, leaf overlap, background vegetation, illumination variability, and mixed spectral signals. This scale mismatch may have weakened the association between the reference disease measurements and the spectral predictors.
Finally, disease identification was based on characteristic symptoms consistent with Z. tritici infection observed during field assessments; however, pathogen identity was not confirmed using molecular or microbiological methods. Therefore, the potential contribution of other biotic or abiotic stress factors, including infections caused by other foliar pathogens, nutritional stress, or natural leaf senescence, cannot be completely excluded. These factors may have influenced the observed spectral responses and should be considered in future studies incorporating pathogen confirmation and complementary physiological assessments.
An additional limitation of the present study is that model performance was evaluated using a single stratified train–test partition rather than multiple repeated random partitions. Consequently, the stability and generalization of the models across different data splits were not directly assessed. To reduce the potential impact of this limitation, the training and testing datasets were generated using stratified random sampling to preserve the distribution of disease severity, and model training and hyperparameter optimization were performed using 10-fold cross-validation within the training dataset. Nevertheless, future studies should evaluate model performance across multiple independent data partitions or repeated cross-validation schemes and report the corresponding variability of performance metrics.
Finally, several additional factors may limit the generalizability of the proposed models. The experiment was conducted under specific location and environmental conditions, which may limit the direct generalization of the results to other regions, growing seasons, and wheat cultivars. In addition, the development of SLB is strongly dependent on weather conditions, especially temperature, humidity, and leaf wetness duration; therefore, models developed solely on the basis of spectral data should be supported by information describing environmental variability in order to more fully explain infection dynamics. Furthermore, UAV data are particularly susceptible to variability in measurement conditions; therefore, further improvement of radiometric calibration procedures, atmospheric correction, and flight standardization will be necessary in the future.
In subsequent stages of research, it would be advisable to extend the analyses to multi-seasonal and multi-location data and to include a larger number of cultivars with different levels of resistance to Z. tritici, which would enable the stability of the models to be assessed across a broader range of environmental and biological conditions. It would also be worth considering the use of deep learning methods, including convolutional neural networks, recurrent models, and architectures integrating spatial, spectral, and temporal information. Such approaches may be particularly useful in the analysis of UAV imagery, in which, in addition to spectral information, textural features, describing the spatial variability and organization of pixel values, play an important role. The integration of spectral, textural, and temporal data may increase the ability of models to identify subtle changes in canopy structure and improve the discrimination of disease symptoms from other sources of variability.
5. Conclusions
This study demonstrated that spectral data combined with machine learning algorithms enable accurate detection and quantification of SLB in winter wheat. Hyperspectral ASD measurements achieved the highest performance, with classification accuracy reaching 95.74% and regression models achieving R2 values of up to 0.95, outperforming UAV multispectral data, particularly for disease severity estimation. A reduced Green–Red–Red-edge–NIR spectral subset provided classification results comparable to those obtained using the full hyperspectral spectrum, indicating that simplified multispectral systems may be suitable for operational disease detection.
Among the evaluated algorithms, Random Forest provided the most stable classification performance, whereas CatBoost achieved the highest regression accuracy. Feature importance analysis identified the visible, red-edge, NIR, and SWIR regions as the most informative spectral domains for disease assessment. These findings demonstrate that hyperspectral ASD measurements provide valuable reference information, while UAV multispectral imagery offers considerable potential for operational field-scale monitoring.
Future studies should validate the proposed approach across multiple growing seasons, locations, and wheat cultivars and integrate spectral information with meteorological, physiological, and agronomic data to improve the robustness and generalization of disease prediction models.
Author Contributions
Conceptualization, A.W., J.P. and M.W.; Methodology, A.W., J.P. and M.W.; Validation, M.W. and S.K.; Formal Analysis J.C.; Investigation, K.P.; Resources, I.Ś. and M.J.; Data Curation, J.P., M.W., S.K., I.Ś., K.P. and M.J.; Writing—Original Draft, A.W. and J.P.; Writing—Review and Editing, A.W. and J.P.; Visualization, M.W.; Supervision, A.W. All authors have read and agreed to the published version of the manuscript.
Funding
This research received no external funding.
Institutional Review Board Statement
Not applicable.
Informed Consent Statement
Not applicable.
Data Availability Statement
The data presented in this study are available on request from the corresponding author. The data are not publicly available due to their large size and ongoing related analyses.
Conflicts of Interest
The authors declare no conflicts of interest.
References
- Fones, H.; Gurr, S. The impact of Septoria leaf blotch disease on wheat: An EU perspective. Fungal Genet. Biol. 2015, 79, 3–7. [Google Scholar] [CrossRef] [Scilit] [PubMed]
- Palmer, C.L.; Skinner, W. Mycosphaerella graminicola: Latent infection, crop devastation and genomics. Mol. Plant Pathol. 2002, 3, 63–70. [Google Scholar] [CrossRef] [Scilit] [PubMed]
- Çat, A. Evaluation of some bread wheat (Triticum aestivum L.) varieties reaction to Septoria leaf blotch disease. Turk. J. Agric. Res. 2023, 11, 18–25. [Google Scholar] [CrossRef] [Scilit]
- Dancer, J.; Daniels, A.; Cooley, N.; Foster, S. Septoria tritici and Stagonospora nodorum as model pathogens for fungicide discovery. In Septoria on Cereals: A Study of Pathosystems; Lucas, J.A., Bowyer, P., Anderson, H.M., Eds.; CABI: Wallingford, UK, 1999; pp. 316–333. [Google Scholar]
- Dean, R.; Van Kan, J.A.L.; Pretorius, Z.A.; Hammond-Kosack, K.E.; Di Pietro, A.; Spanu, P.D.; Rudd, J.J.; Dickman, M.; Kahmann, R.; Ellis, J.; et al. The top 10 fungal pathogens in molecular plant pathology. Mol. Plant Pathol. 2012, 13, 414–430. [Google Scholar] [CrossRef] [Scilit] [PubMed]
- Kema, G.H.J.; Yu, D.Z.; Rijkenberg, F.H.J.; Shaw, M.W.; Baayen, R.P. Histology of the pathogenesis of Mycosphaerella graminicola in wheat. Phytopathology 1996, 86, 777–786. [Google Scholar] [CrossRef] [Scilit]
- Bock, C.H.; Poole, G.H.; Parker, P.E.; Gottwald, T.R. Plant disease severity estimated visually, by digital photography and image analysis, and by hyperspectral imaging. Crit. Rev. Plant Sci. 2010, 29, 59–107. [Google Scholar] [CrossRef] [Scilit]
- Oerke, E.-C. Remote sensing of diseases. Annu. Rev. Phytopathol. 2020, 58, 225–252. [Google Scholar] [CrossRef] [Scilit] [PubMed]
- Mutka, A.M.; Bart, R.S. Image-based phenotyping of plant disease symptoms. Front. Plant Sci. 2015, 5, 734. [Google Scholar] [CrossRef] [Scilit] [PubMed]
- Barbedo, J.G.A. A novel algorithm for semi-automatic segmentation of plant leaf disease symptoms using digital image processing. Trop. Plant Pathol. 2016, 41, 210–224. [Google Scholar] [CrossRef] [Scilit]
- Mahlein, A.-K.; Kuska, M.; Behmann, J.; Polder, G.; Walter, A. Hyperspectral sensors and imaging technologies in phytopathology. Annu. Rev. Phytopathol. 2018, 56, 535–558. [Google Scholar] [CrossRef] [Scilit] [PubMed]
- Latchoumane, L.; Ecarnot, M.; Bendoula, R.; Roger, J.-M.; Mas-Garcia, S.; Villesseche, H.; Tavernier, F.; Ryckewaert, M.; Gorretta, N.; Roumet, P.; et al. Early detection of Zymoseptoria tritici. Data Brief 2025, 59, 111404. [Google Scholar] [CrossRef] [Scilit] [PubMed]
- Villesseche, H. Caractérisation de la Dynamique Spatio-Temporelle de Processus Complexes Chez le blé par Spectroscopie Proche Infra-Rouge et Imagerie Hyperspectrale. Ph.D. Thesis, University of Montpellier, Montpellier, France, 2023. [Google Scholar]
- Anderegg, J.; Hund, A.; Karisto, P.; Mikaberidze, A. In-field detection and quantification of Septoria leaf blotch using spectral–temporal features. Front. Plant Sci. 2019, 10, 1355. [Google Scholar] [CrossRef] [Scilit] [PubMed]
- Zhelezova, S.V.; Pakholkova, E.V.; Veller, V.E.; Voronov, M.A.; Stepanova, E.V.; Zhelezova, A.D.; Sonyushkin, A.V.; Zhuk, T.S.; Glinushkin, A.P. Hyperspectral non-imaging measurements and perceptron neural network for pre-harvesting assessment of damage degree caused by Septoria/Stagonospora blotch diseases of wheat. Agronomy 2023, 13, 1045. [Google Scholar] [CrossRef] [Scilit]
- Danilov, R.; Istomin, D.S.; Kremneva, O.; Gasiyan, K.E.; Zimin, M.V.; Ponomarev, A.V. Correlation between chlorophyll content and spectral characteristics of wheat (Triticum aestivum L.) affected with fungal diseases. Res. Crops 2025, 26, 421. [Google Scholar]
- Malakhov, D.V. The septoria leaf blotch of wheat in Central Kazakhstan: Prognosis, evaluation and monitoring with remotely sensed data. J. Appl. Sci. Technol. Trends 2022, 3, 64–73. [Google Scholar] [CrossRef] [Scilit]
- Rouse, J.W., Jr.; Haas, R.H.; Schell, J.A.; Deering, D.W. Monitoring vegetation systems in the Great Plains with ERTS. In Third Earth Resources Technology Satellite-1 Symposium; NASA SP-351; NASA: Washington, DC, USA, 1974; pp. 309–313. [Google Scholar]
- Gitelson, A.A.; Kaufman, Y.J.; Merzlyak, M.N. Use of a green channel in remote sensing of global vegetation from EOS-MODIS. Remote Sens. Environ. 1996, 58, 289–298. [Google Scholar] [CrossRef] [Scilit]
- Barnes, E.; Clarke, T.; Richards, S.E.; Colaizzi, P.; Haberland, J.; Kostrzewski, M.; Waller, P.; Choi, C.Y.; Riley, E.; Thompson, T.; et al. Coincident detection of crop water stress, nitrogen status and canopy density using ground-based multispectral data. In Proceedings of the Fifth International Conference on Precision Agriculture, Bloomington, MN, USA, 16–19 July 2000. [Google Scholar]
- Harmon, C.S. From Hyperspectral Indices to Global Fluorescence: PACE Vegetation Indices as Predictors of Terrestrial Photosynthesis. Ph.D. Thesis, Virginia Tech, Blacksburg, VA, USA, 2026. [Google Scholar]
- Daughtry, C.S.T.; Walthall, C.L.; Kim, M.S.; de Colstoun, E.B.; McMurtrey, J.E. Estimating corn leaf chlorophyll concentration from leaf and canopy reflectance. Remote Sens. Environ. 2000, 74, 229–239. [Google Scholar] [CrossRef] [Scilit]
- Haboudane, D.; Miller, J.R.; Tremblay, N.; Zarco-Tejada, P.J.; Dextraze, L. Integrated narrow-band vegetation indices for prediction of crop chlorophyll content. Remote Sens. Environ. 2002, 81, 416–426. [Google Scholar] [CrossRef] [Scilit]
- Rondeaux, G.; Steven, M.; Baret, F. Optimization of soil-adjusted vegetation indices. Remote Sens. Environ. 1996, 55, 95–107. [Google Scholar] [CrossRef] [Scilit]
- Roujean, J.-L.; Bréon, F.-M. Estimating PAR absorbed by vegetation from bidirectional reflectance measurements. Remote Sens. Environ. 1995, 51, 375–384. [Google Scholar] [CrossRef] [Scilit]
- Haboudane, D.; Miller, J.R.; Pattey, E.; Zarco-Tejada, P.J.; Strachan, I.B. Hyperspectral vegetation indices for predicting green LAI. Remote Sens. Environ. 2004, 90, 337–352. [Google Scholar] [CrossRef] [Scilit]
- Datt, B. A new reflectance index for remote sensing of chlorophyll content. J. Plant Physiol. 1999, 154, 30–36. [Google Scholar] [CrossRef] [Scilit]
- Niu, Z.; Li, Y.; Moncada, J.D.S.; Johnson, W.; Lang, E.B.; Li, X.; Jin, J. Proximal hyperspectral imaging for early detection of Septoria leaf blotch. Comput. Electron. Agric. 2025, 235, 110400. [Google Scholar] [CrossRef] [Scilit]
- Bebronne, R.; Carlier, A.; Meurs, R.; Leemans, V.; Vermeulen, P.; Dumont, B.; Mercatoris, B. In-field proximal sensing of wheat diseases using multispectral imagery. Biosyst. Eng. 2020, 197, 257–269. [Google Scholar] [CrossRef] [Scilit]
- Vagelas, I.; Cavalaris, C.; Karapetsi, L.; Koukidis, C.; Servis, D.; Madesis, P. Protective effects of fungicide for wheat diseases. Agronomy 2022, 12, 2000. [Google Scholar] [CrossRef] [Scilit]
- Fahrentrapp, J.; Ria, F.; Geilhausen, M.; Panassiti, B. Detection of gray mold infection prior to symptoms. Front. Plant Sci. 2019, 10, 628. [Google Scholar] [CrossRef] [Scilit] [PubMed]
- Malakhov, D.V. The septoria leaf blotch of wheat in Central Kazakhstan: Prognosis, evaluation and monitoring with remotely sensed data. J. Geoinform. Environ. Res. 2021, 2, 28. [Google Scholar] [CrossRef] [Scilit]
- Ualiyeva, R.M.; Kaverina, M.M.; Osipova, A.V.; Kairbayev, Y.B.; Zhangazin, S.B.; Iksat, N.N.; Mapitov, N.B. VNIR hyperspectral signatures for early detection of wheat diseases. Plants 2025, 14, 3644. [Google Scholar] [CrossRef] [Scilit] [PubMed]
- Fernández, C.I.; Leblon, B.; Haddadi, A.; Wang, K.; Wang, J. Potato late blight detection using spectral regions. Remote Sens. 2020, 12, 1292. [Google Scholar] [CrossRef] [Scilit]
- Chivasa, W.; Mutanga, O.; Biradar, C. UAV-based multispectral phenotyping for disease resistance. Remote Sens. 2020, 12, 2445. [Google Scholar] [CrossRef] [Scilit]
- Gogoi, N.K.; Deka, B.; Bora, L.C. Remote sensing for plant disease detection: A review. Agric. Rev. 2018, 39, 307–313. [Google Scholar] [CrossRef] [Scilit]
- Yu, K.; Anderegg, J.; Mikaberidze, A.; Karisto, P.; Mascher, F.; McDonald, B.A.; Walter, A.; Hund, A. Hyperspectral canopy sensing of wheat septoria. Front. Plant Sci. 2018, 9, 1195. [Google Scholar] [CrossRef] [Scilit] [PubMed]
- Bohnenkamp, D.; Behmann, J.; Paulus, S.; Steiner, U.; Mahlein, A.-K. A hyperspectral library of foliar diseases. Phytopathology 2021, 111, 1583–1593. [Google Scholar] [CrossRef] [Scilit] [PubMed]
- Kim, D.M.; Zhang, H.; Zhou, H.; Du, T.; Wu, Q.; Mockler, T.C.; Berezin, M.Y. Image-derived indices of water-stressed plants. Sci. Rep. 2015, 5, 15919. [Google Scholar] [CrossRef] [Scilit] [PubMed]
- Sereda, I.; Danilov, R.; Kremneva, O.; Zimin, M.; Podushin, Y. Remote monitoring of wheat leaf diseases. Plants 2023, 12, 3223. [Google Scholar] [CrossRef] [Scilit] [PubMed]
- Gröll, K.; Graeff, S.; Claupein, W. Use of vegetation indices to detect plant diseases. In Agrarinformatik im Spannungsfeld Zwischen Regionalisierung und Globalen Wertschöpfungsketten—Referate der 27. GIL Jahrestagung; Gesellschaft für Informatik e.V.: Bonn, Germany, 2007; pp. 91–94. [Google Scholar]
- Odilbekov, F.; Armonienė, R.; Henriksson, T.; Chawade, A. Machine learning identification of Septoria symptoms. Front. Plant Sci. 2018, 9, 685. [Google Scholar] [CrossRef] [Scilit] [PubMed]
- Kahsay, M.E. Classification of Wheat Leaf Septoria Disease Using Machine Learning. Master’s Thesis, Addis Ababa Science and Technology University, Addis Ababa, Ethiopia, 2019. [Google Scholar]
- Harish, M.; Kumar, T.V.; Rajasekaran, P.; Poovizhi, P.; Pondinesh, G.; Vigneshwaran, R. Analysis on Early Prediction of Cotton Plant Leaf Diseases Using CatBoost Algorithm. In Proceedings of the 2024 2nd International Conference on Sustainable Computing and Smart Systems (ICSCSS), Coimbatore, India, 10–12 July 2024; pp. 1458–1466. [Google Scholar]
- Padmanabhuni, S.S.; Narayana, J.L.; Prasad, V.N.D.; Vardhan, S.S.; Srinivas, R.V.; Ahmed, S.A.S. Smart system for disease identification using neural networks. AIP Conf. Proc. 2025, 3298, 020043. [Google Scholar] [CrossRef] [Scilit]
- Darmawan, A.Y.; Tanga, Y.M.P.; Unjung, J. Grape leaf disease classification using EfficientNet and CatBoost. J. Soft Comput. Explor. 2025, 6, 1–8. [Google Scholar] [CrossRef] [Scilit]
- Majumdar, P. Plant leaf disease detection using XGBoost with OPTUNA. SN Comput. Sci. 2025, 6, 891. [Google Scholar] [CrossRef] [Scilit]
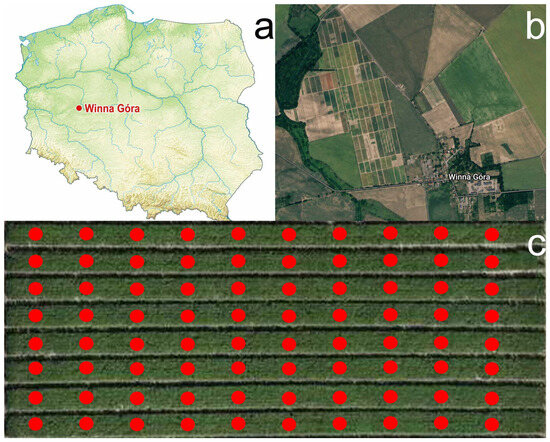
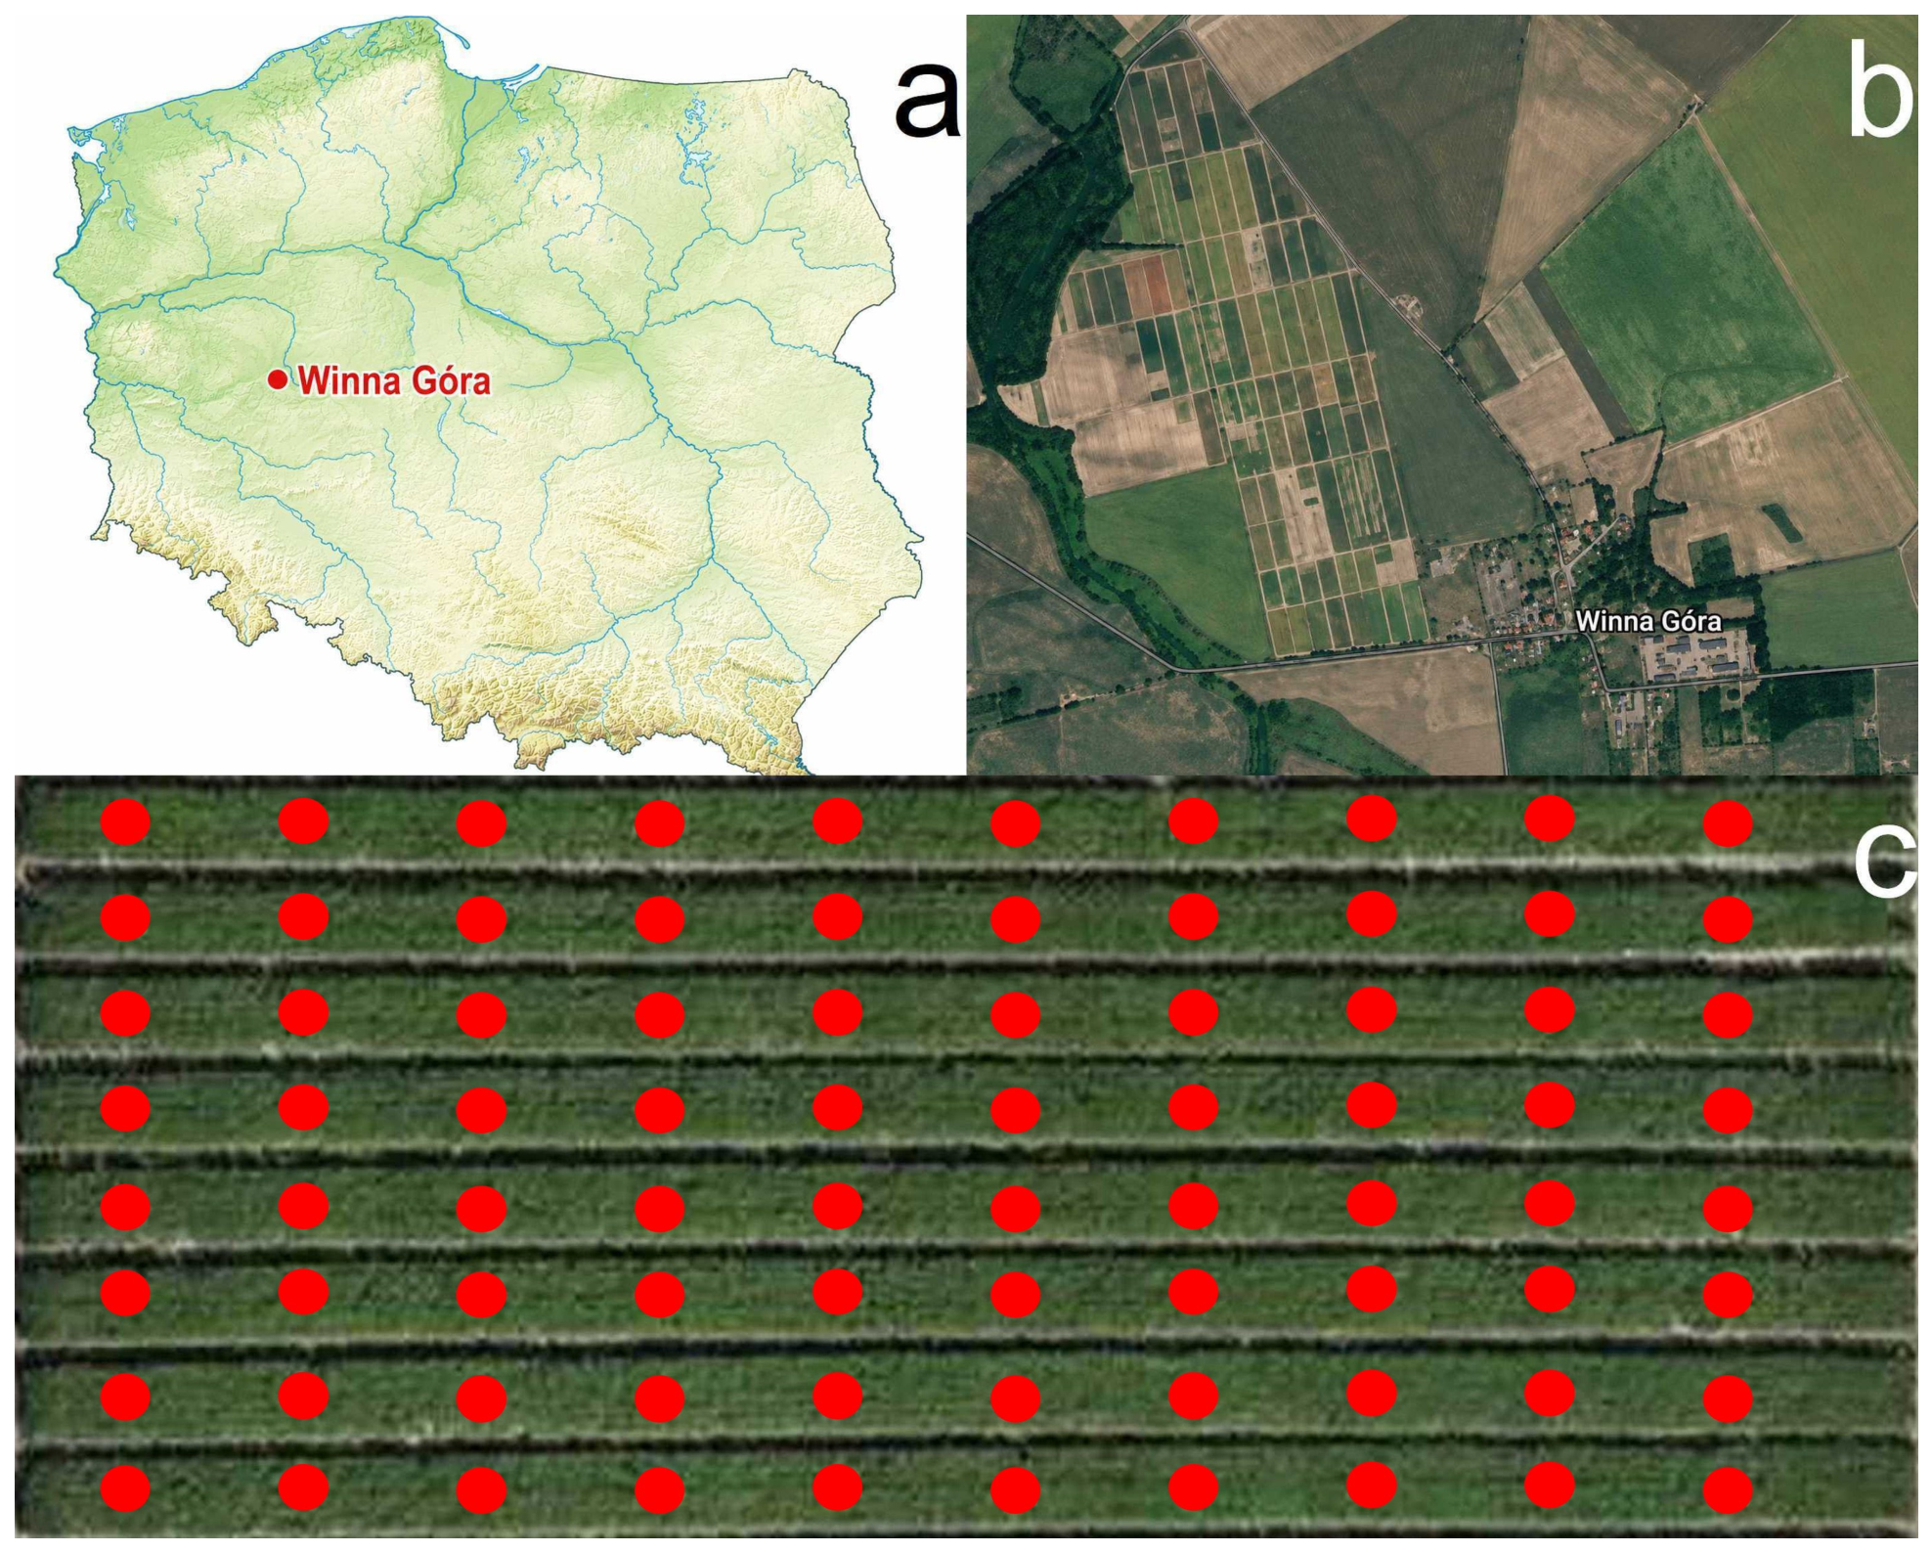
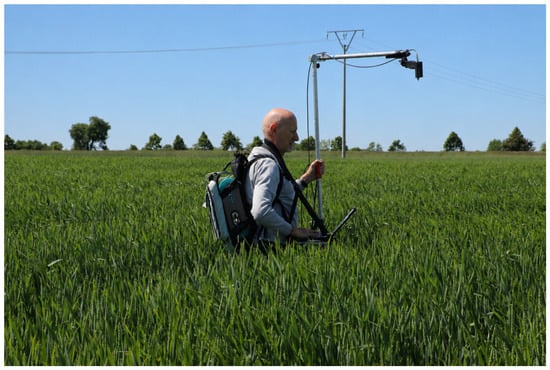
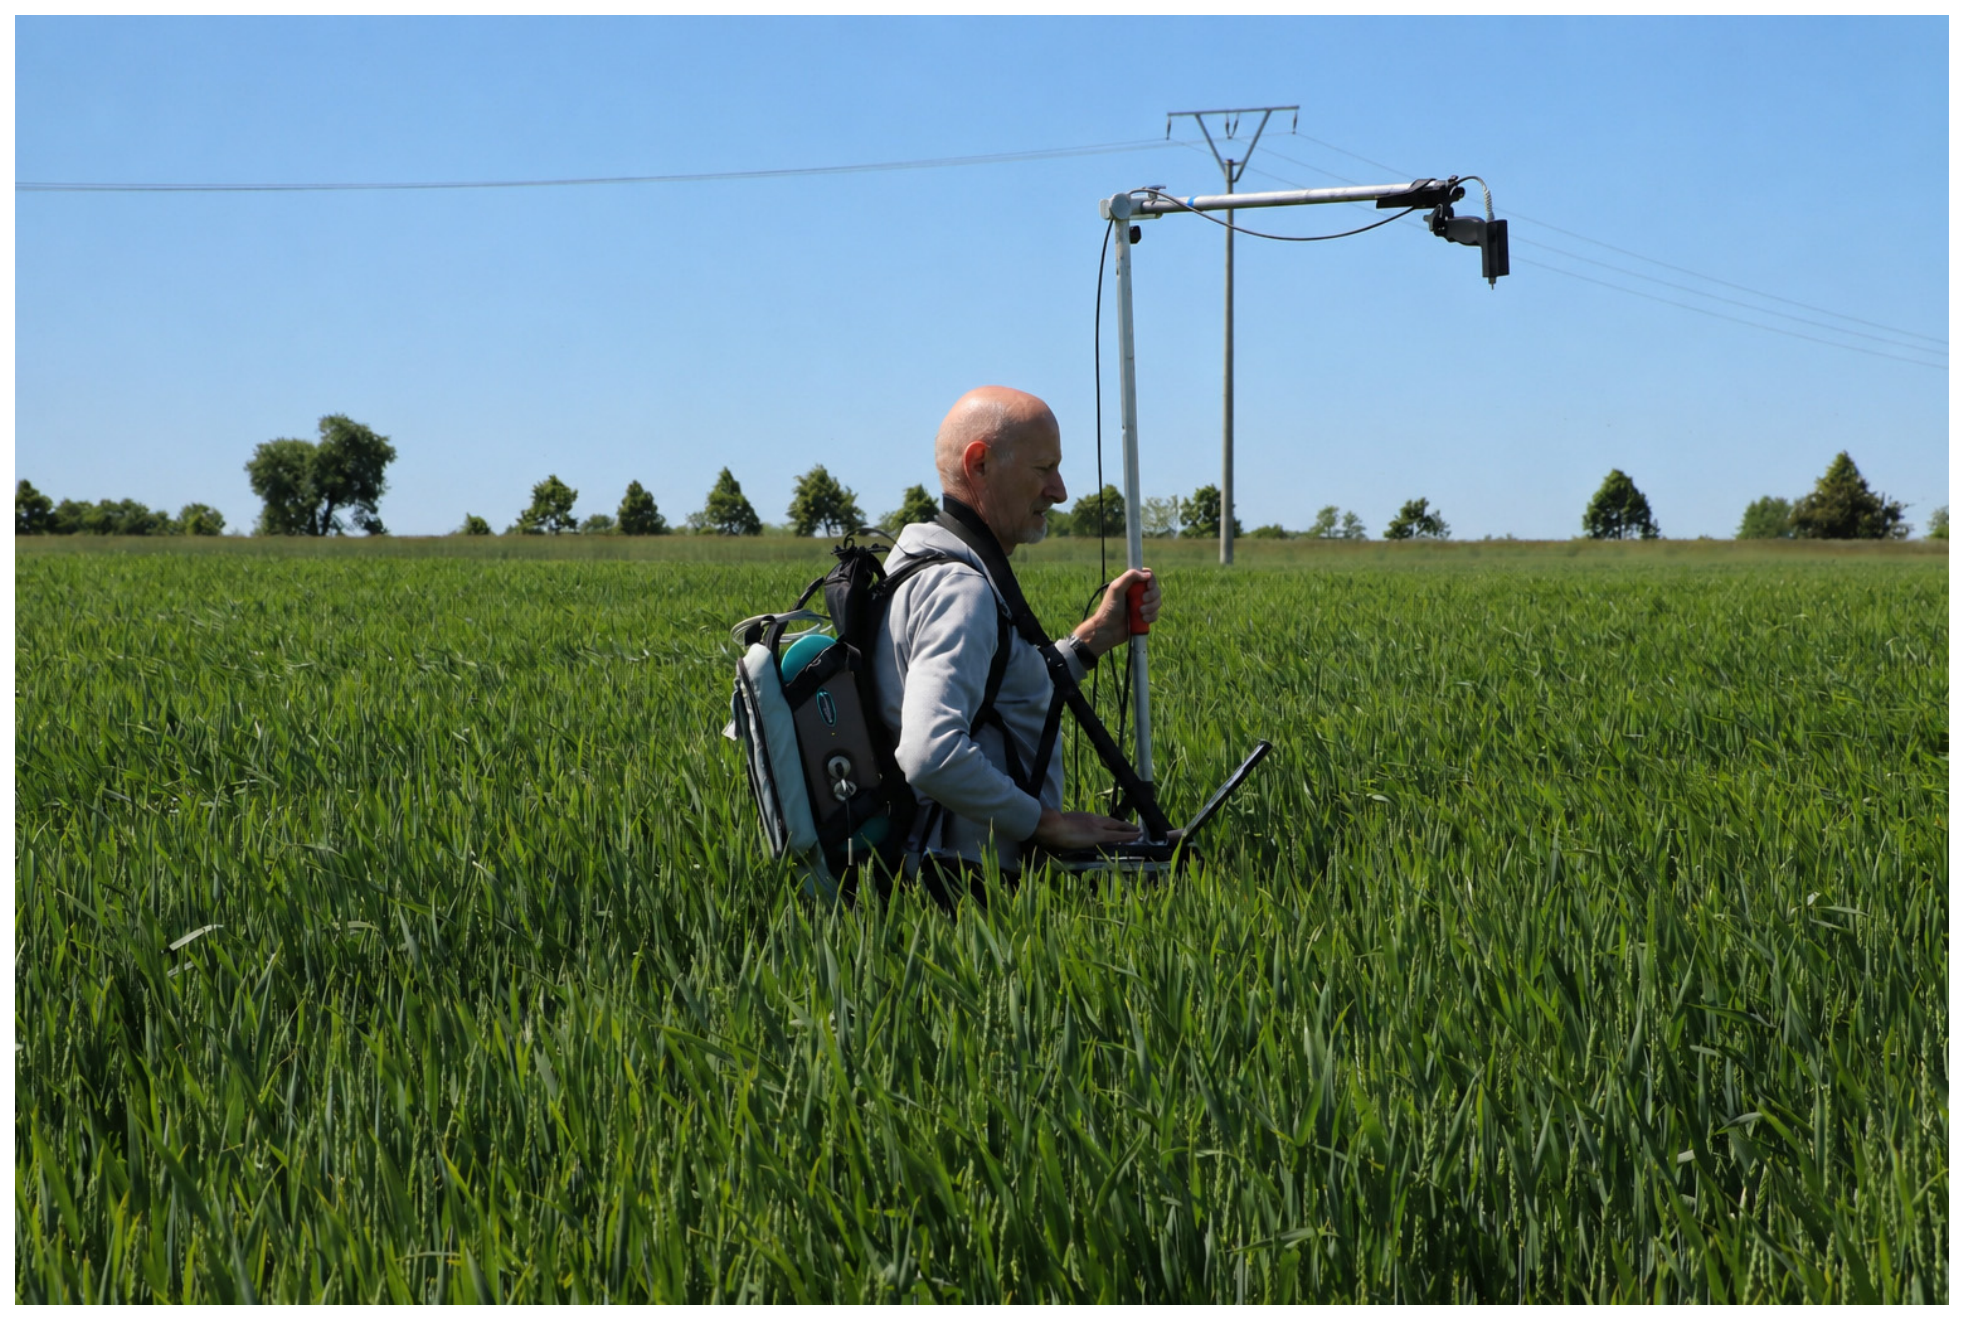
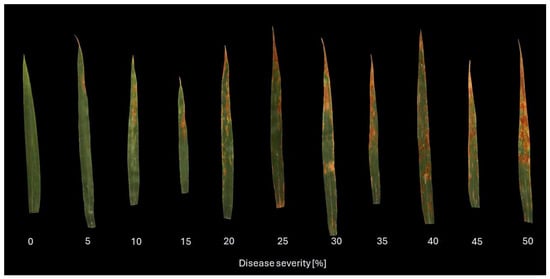
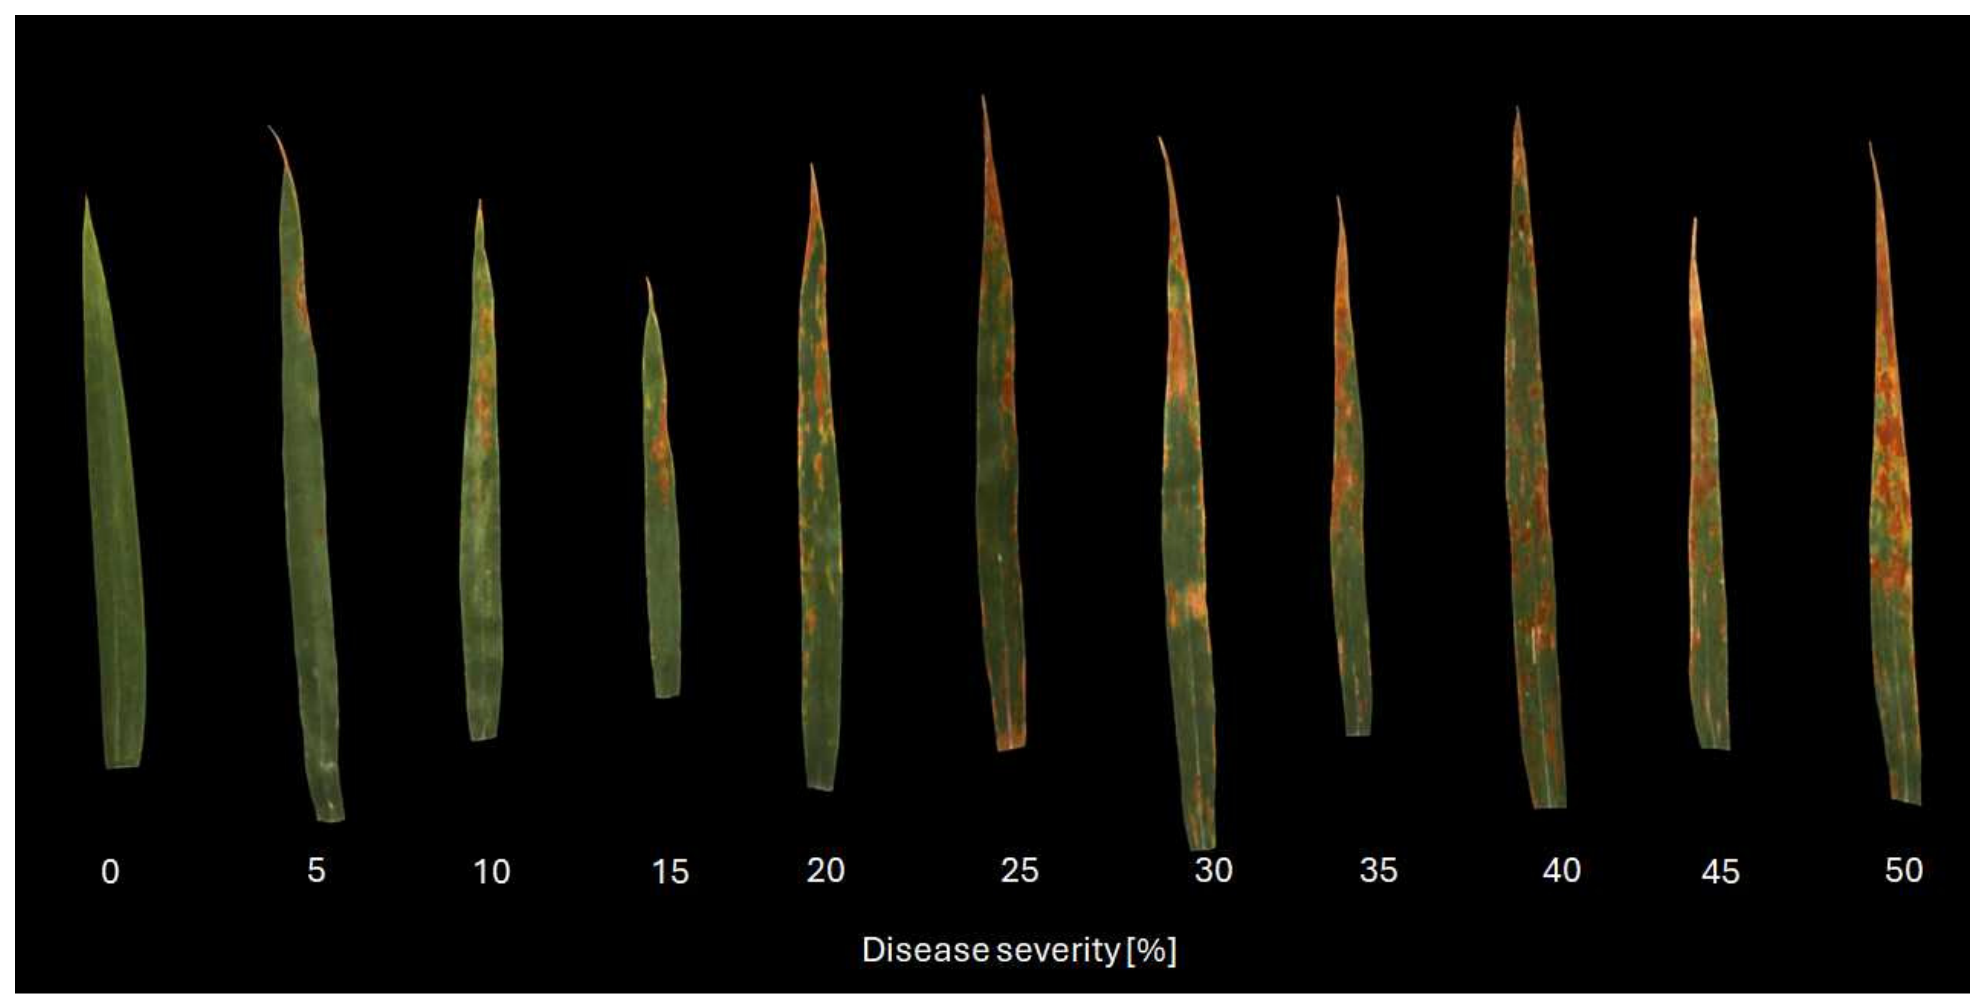
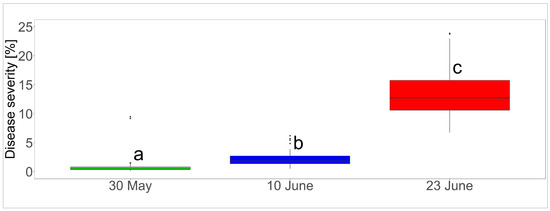
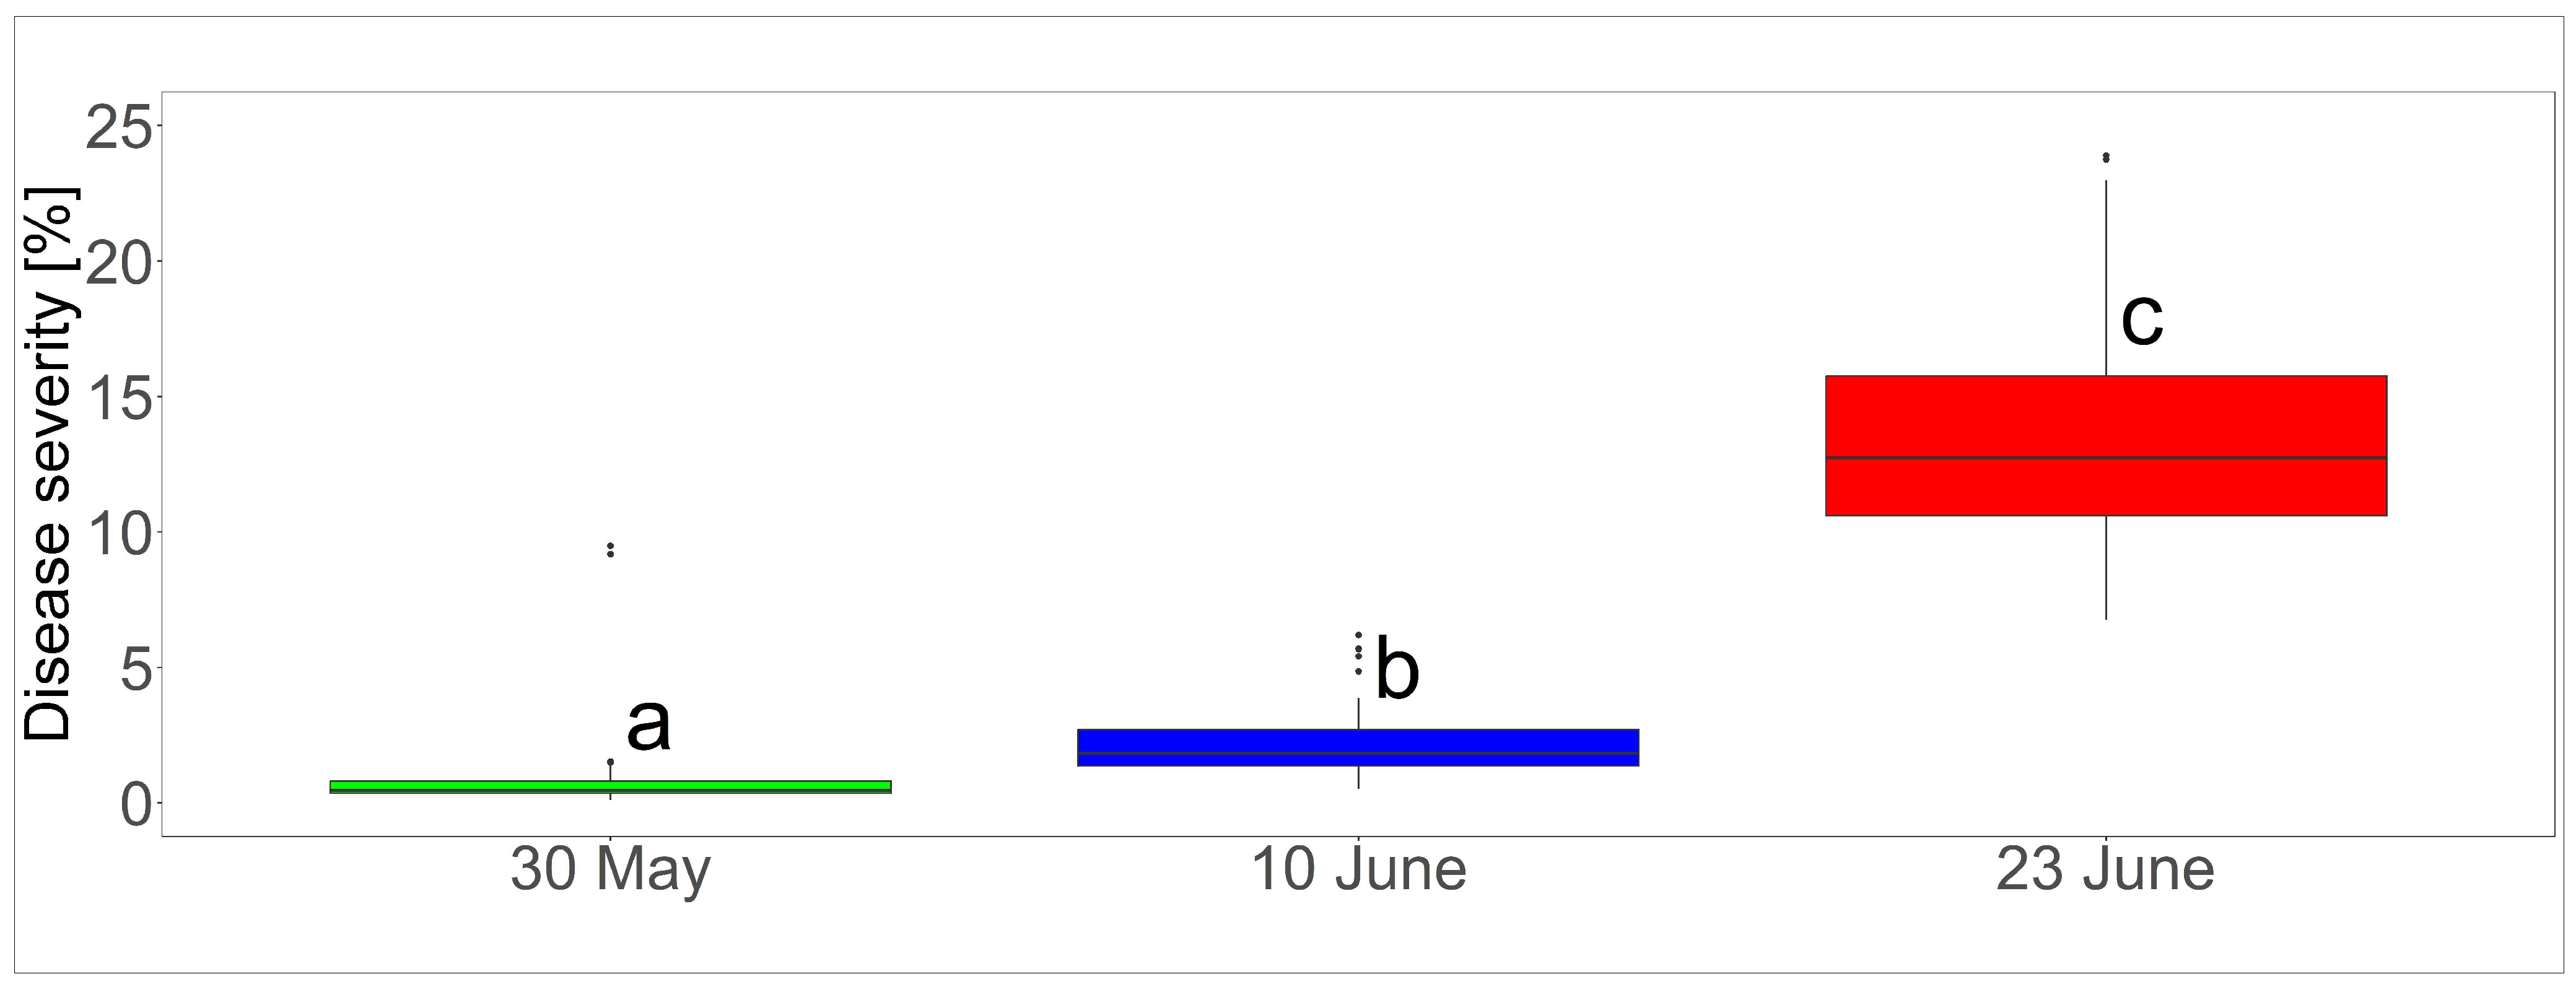
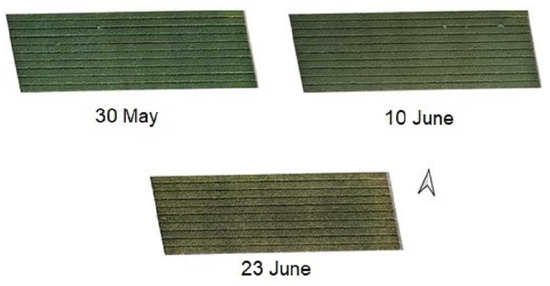
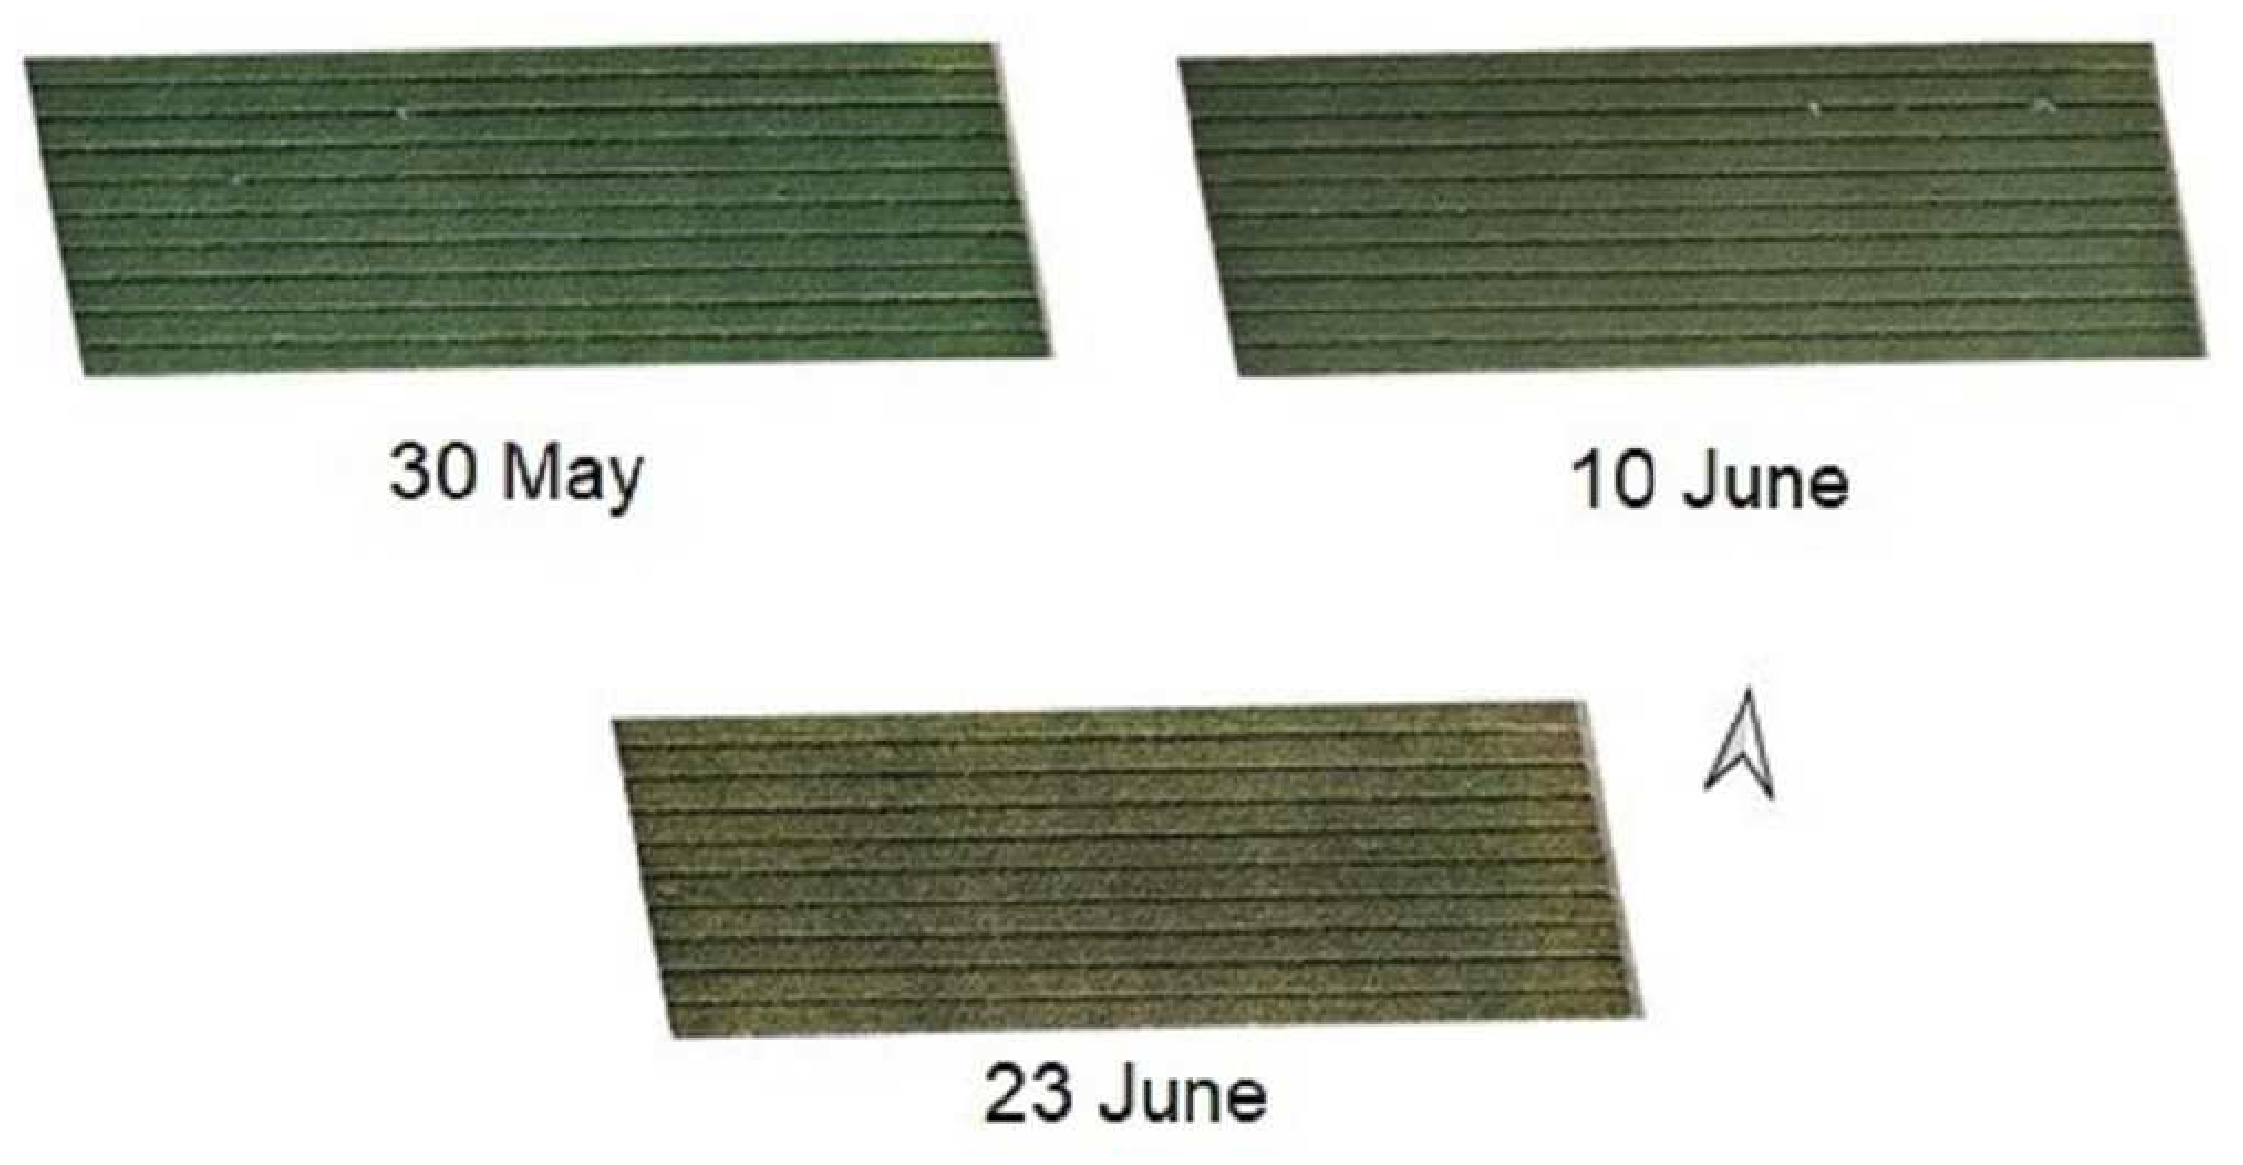
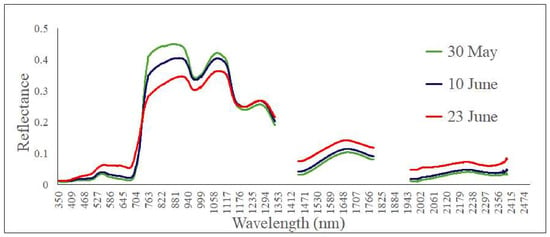
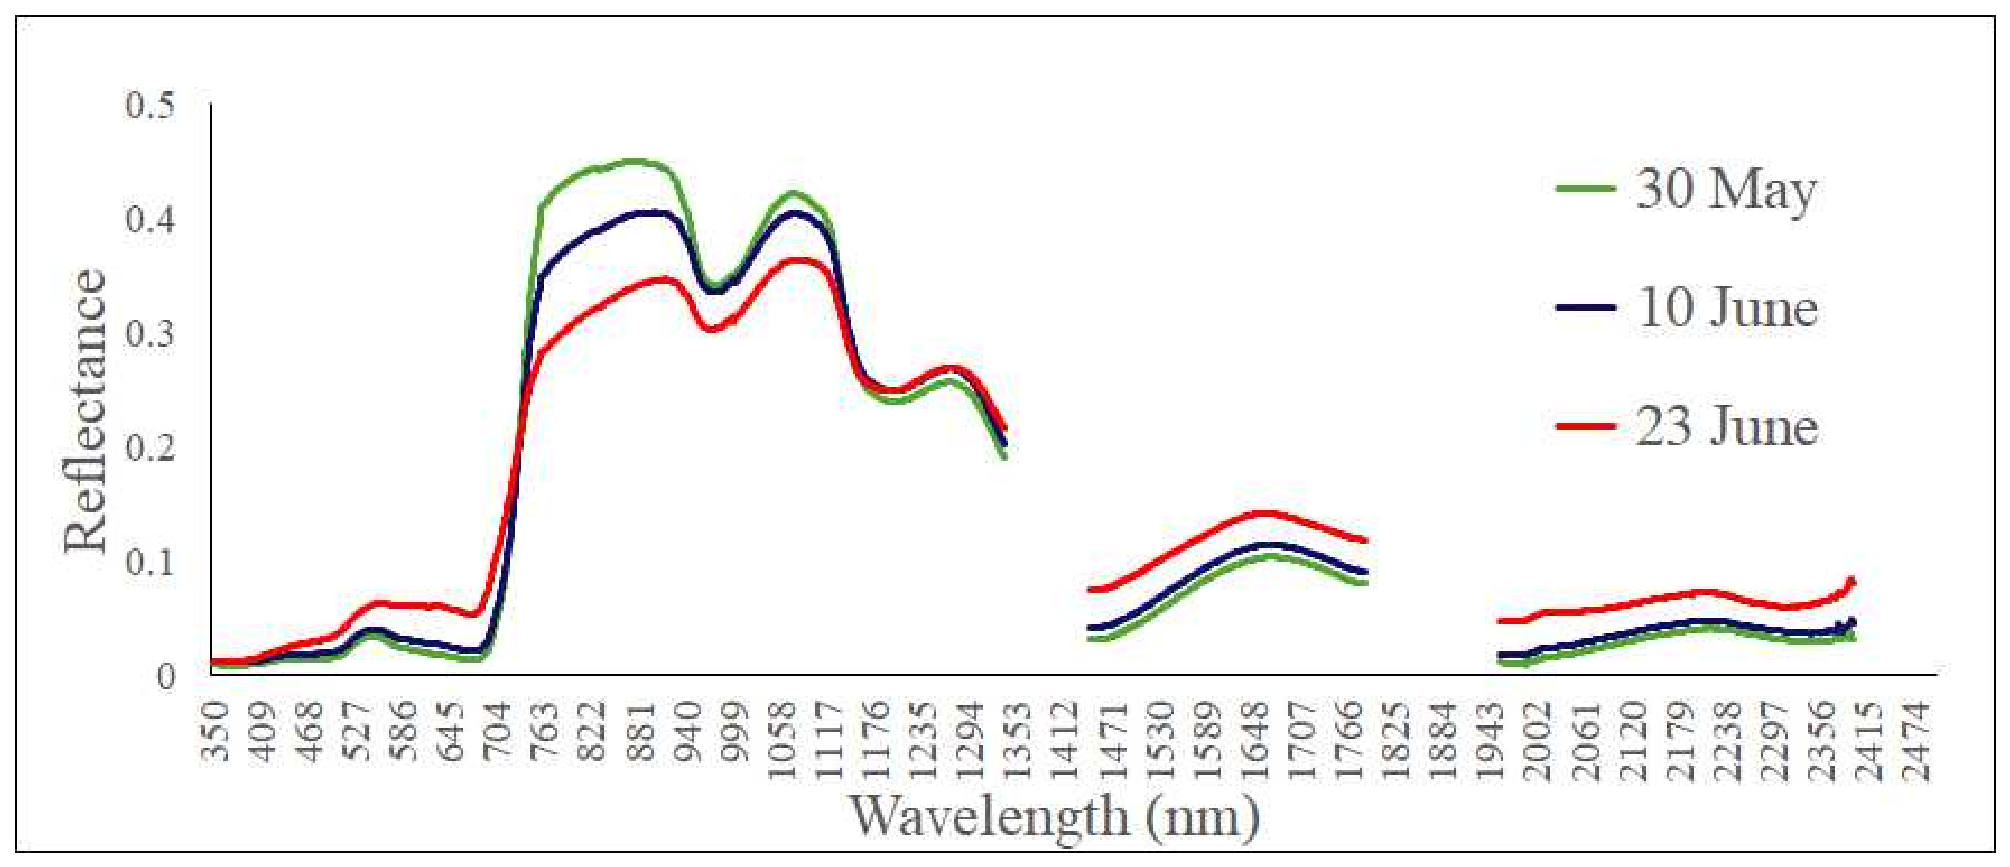
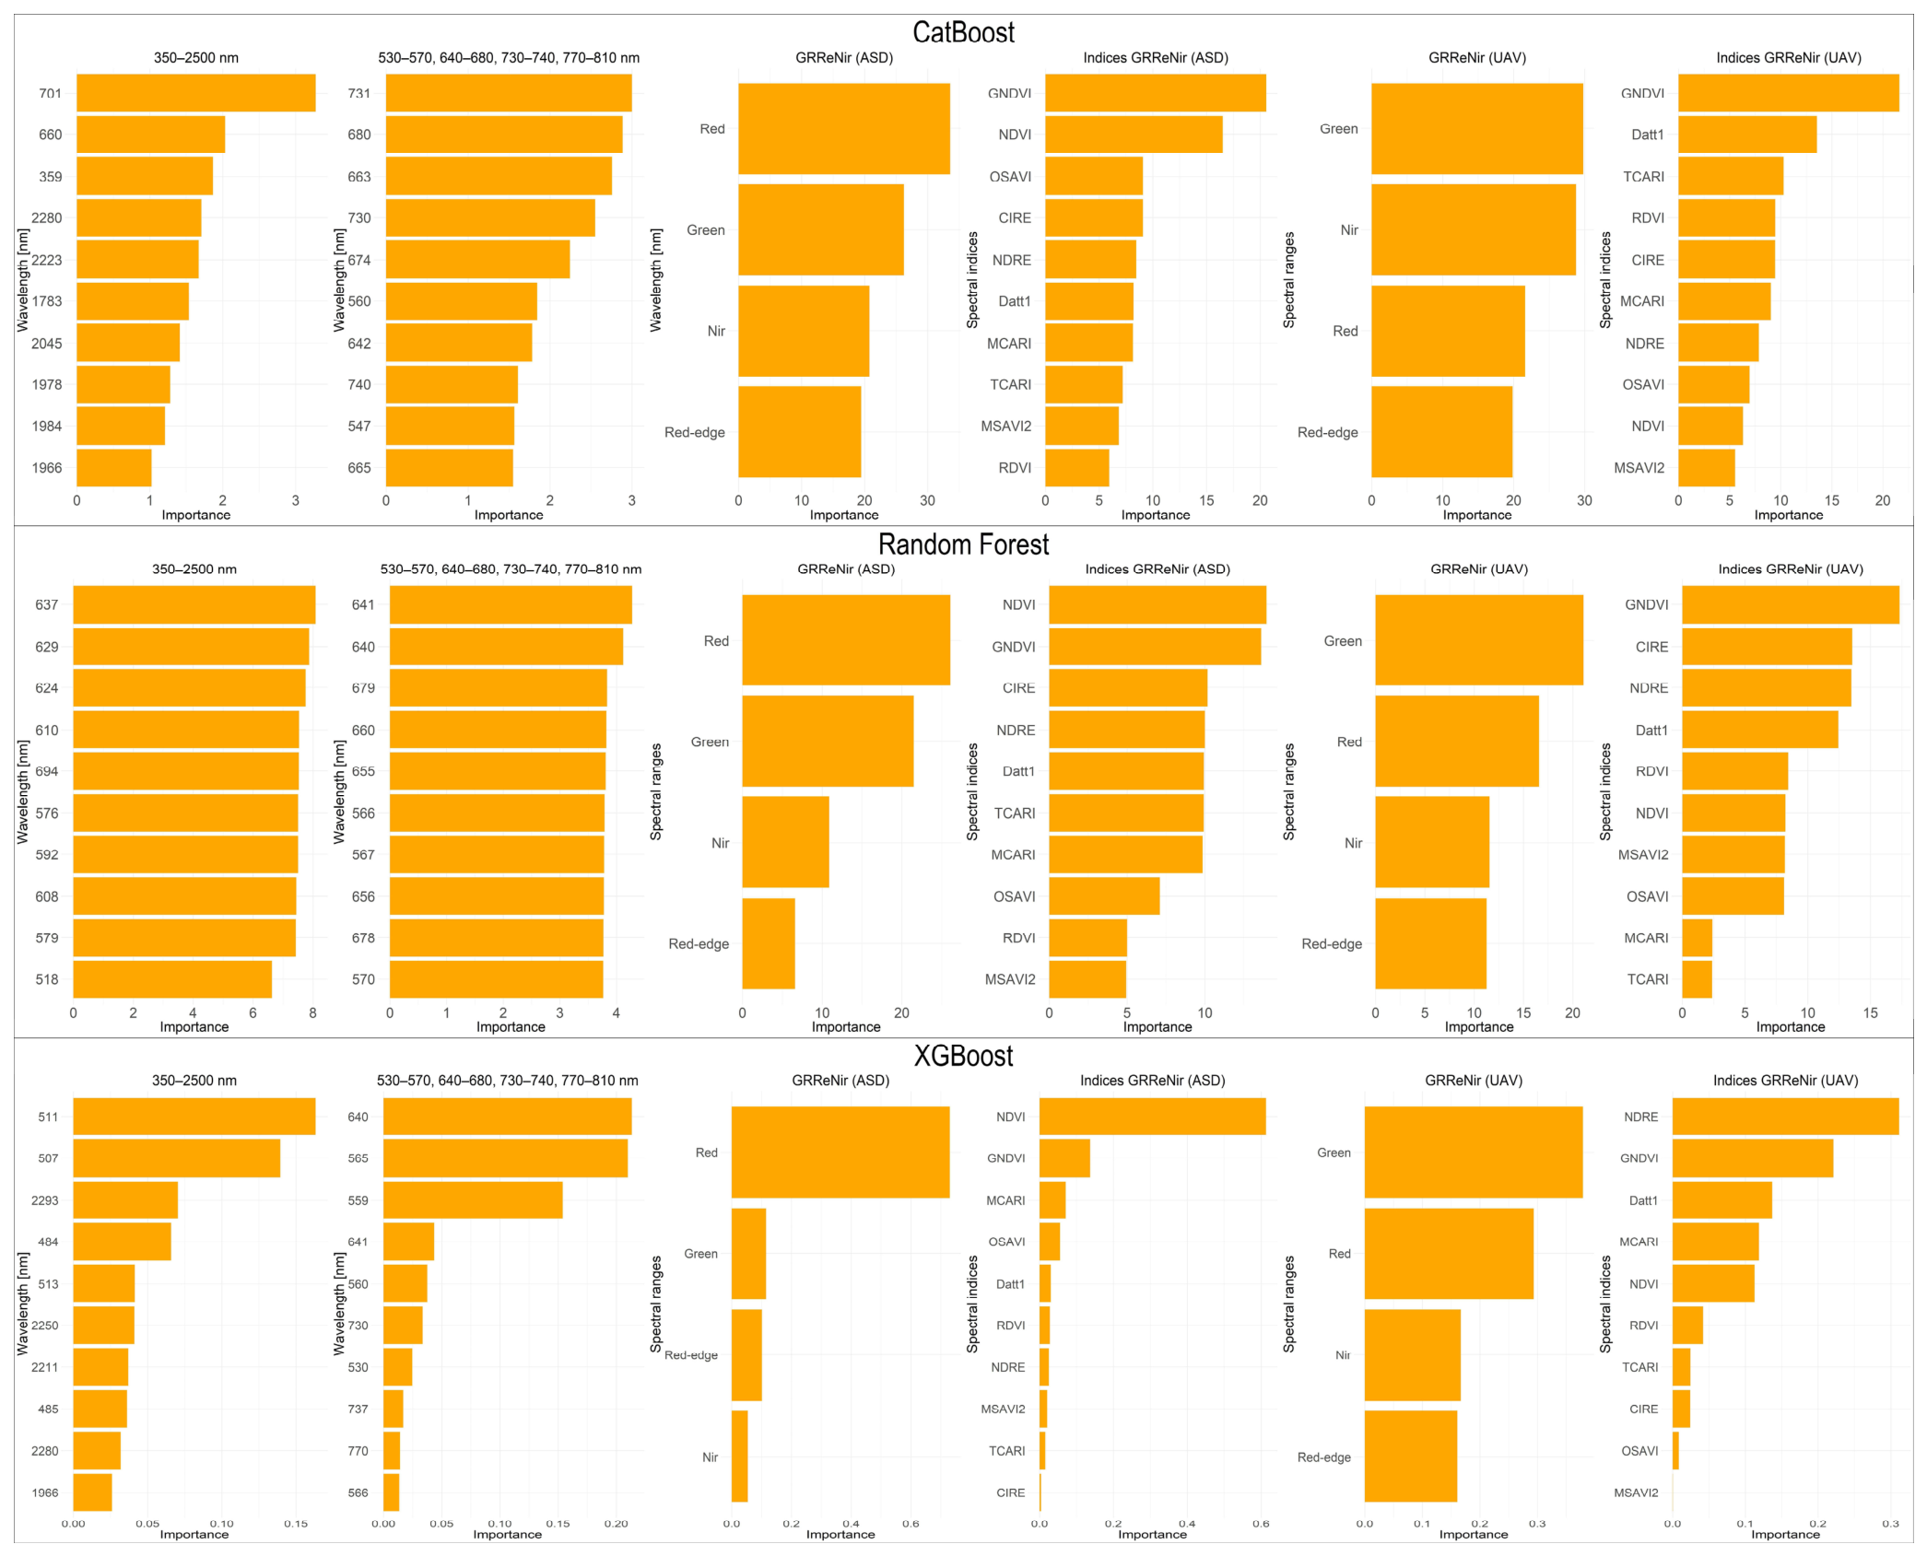
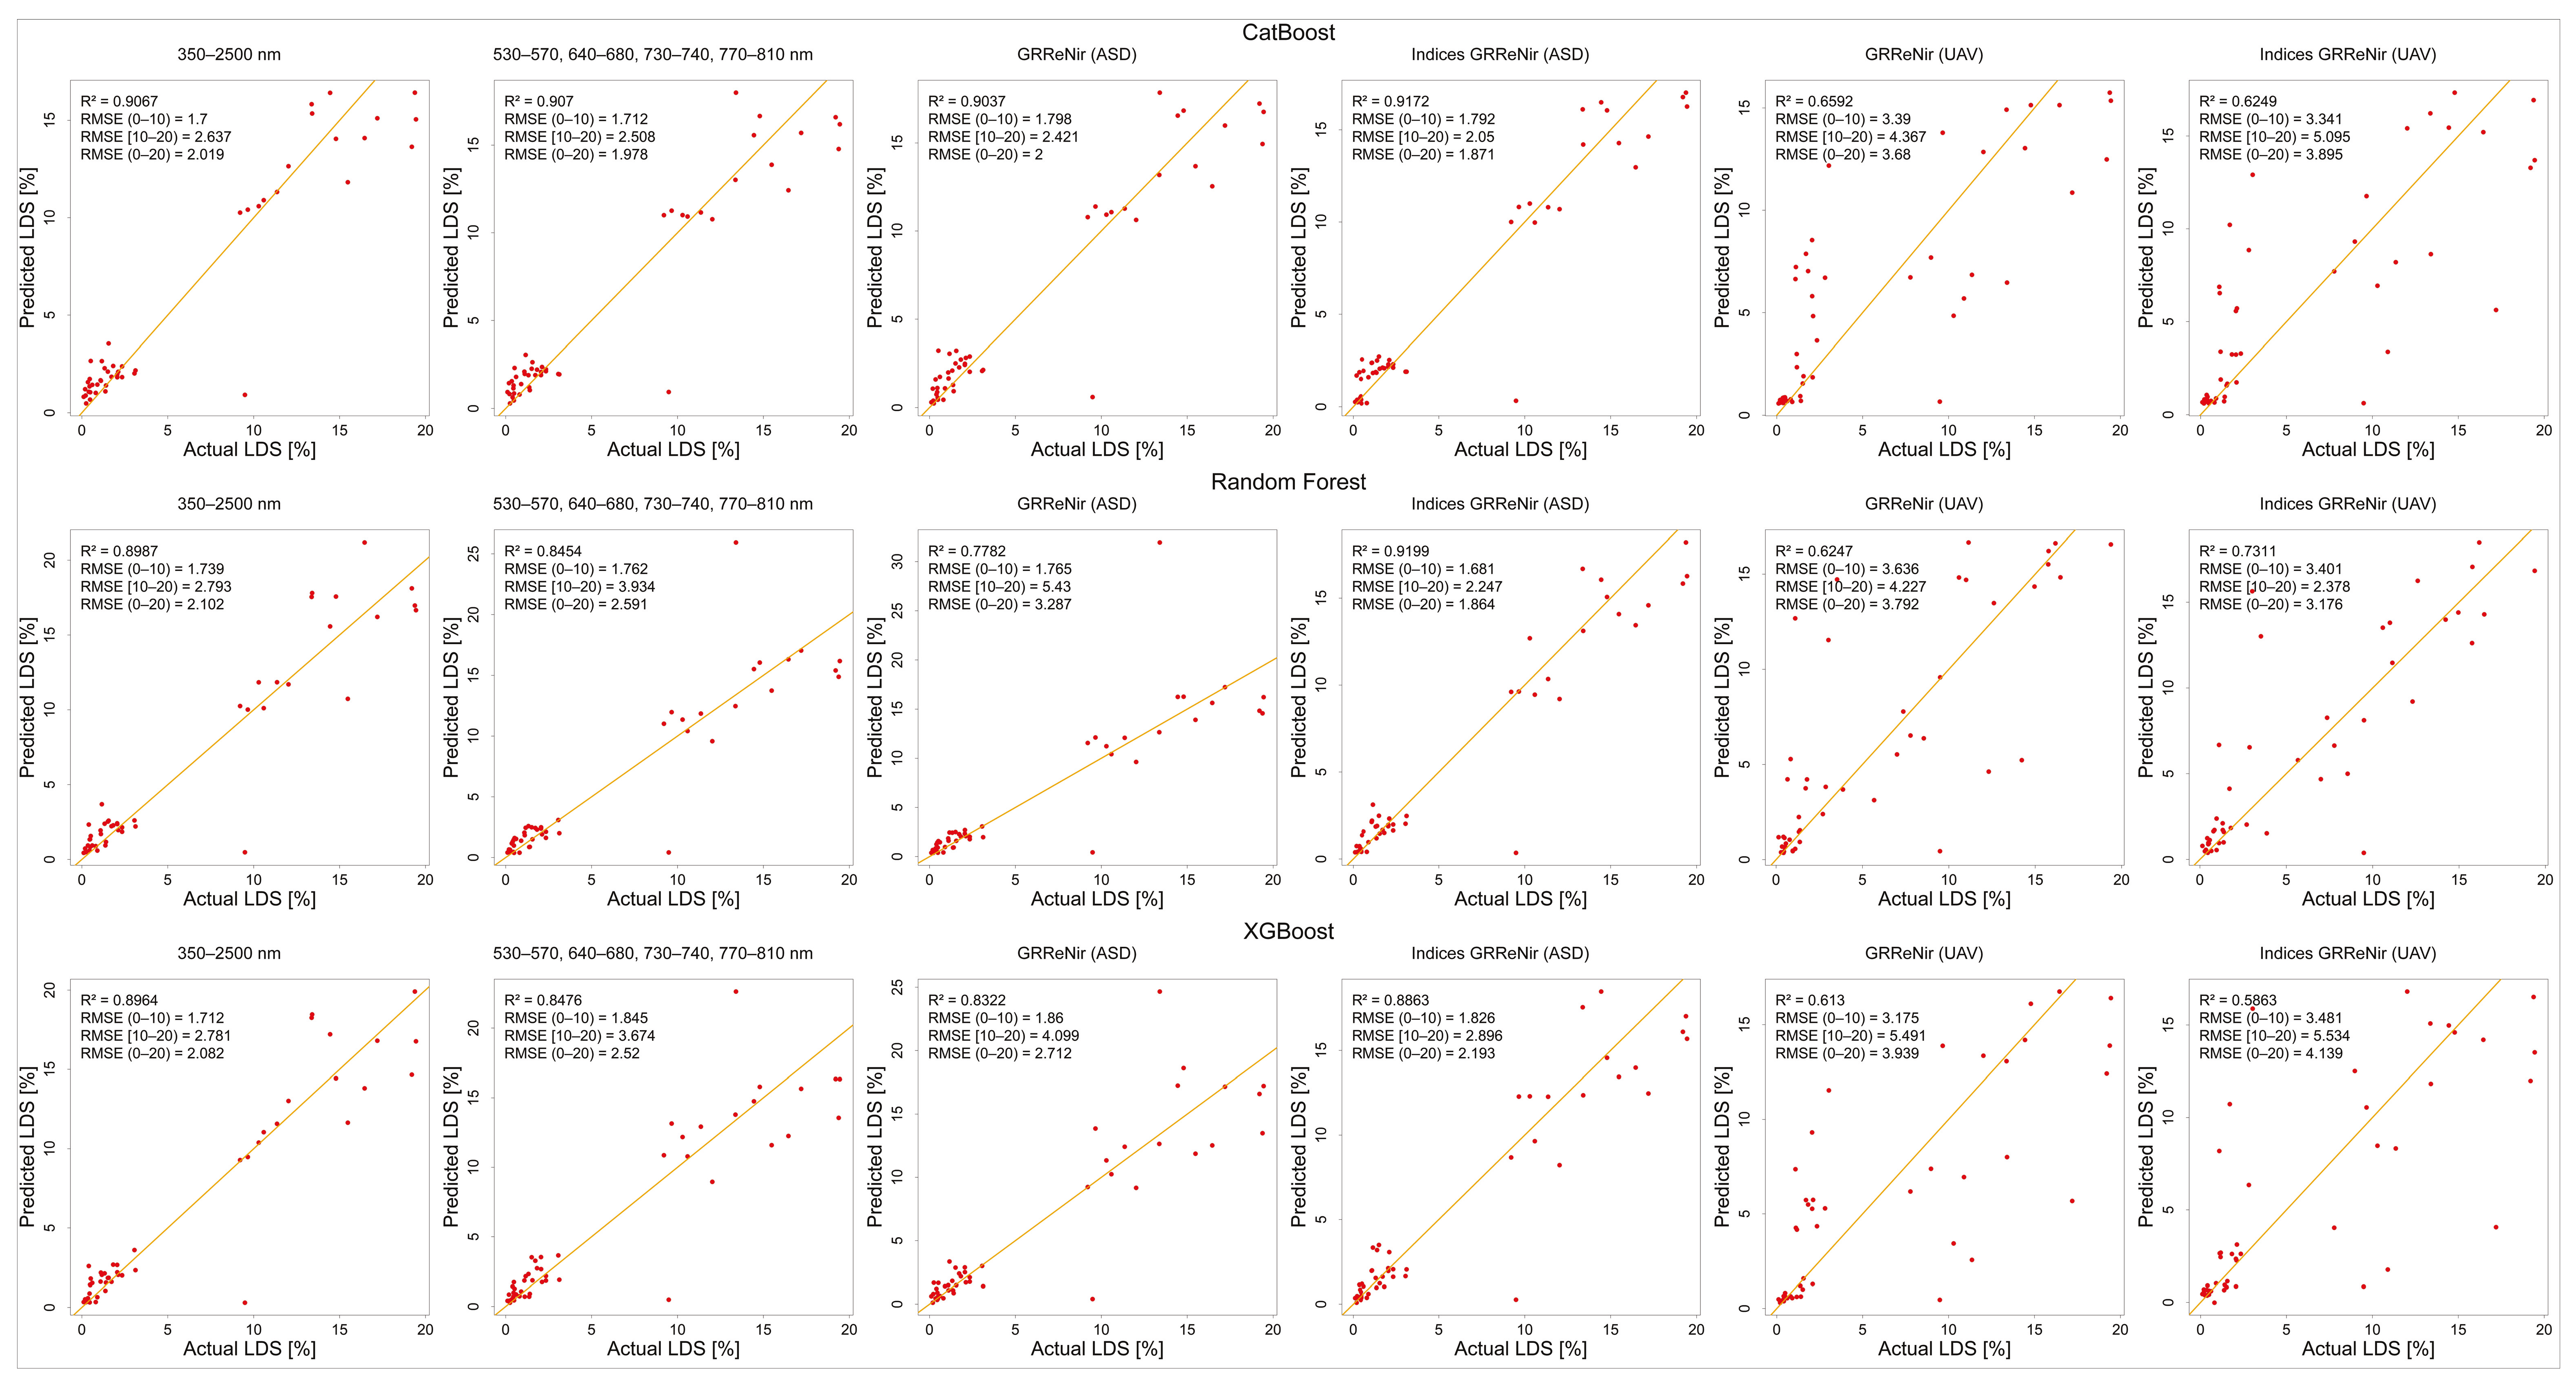
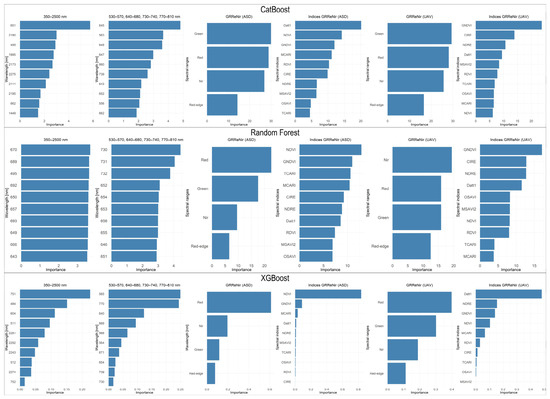
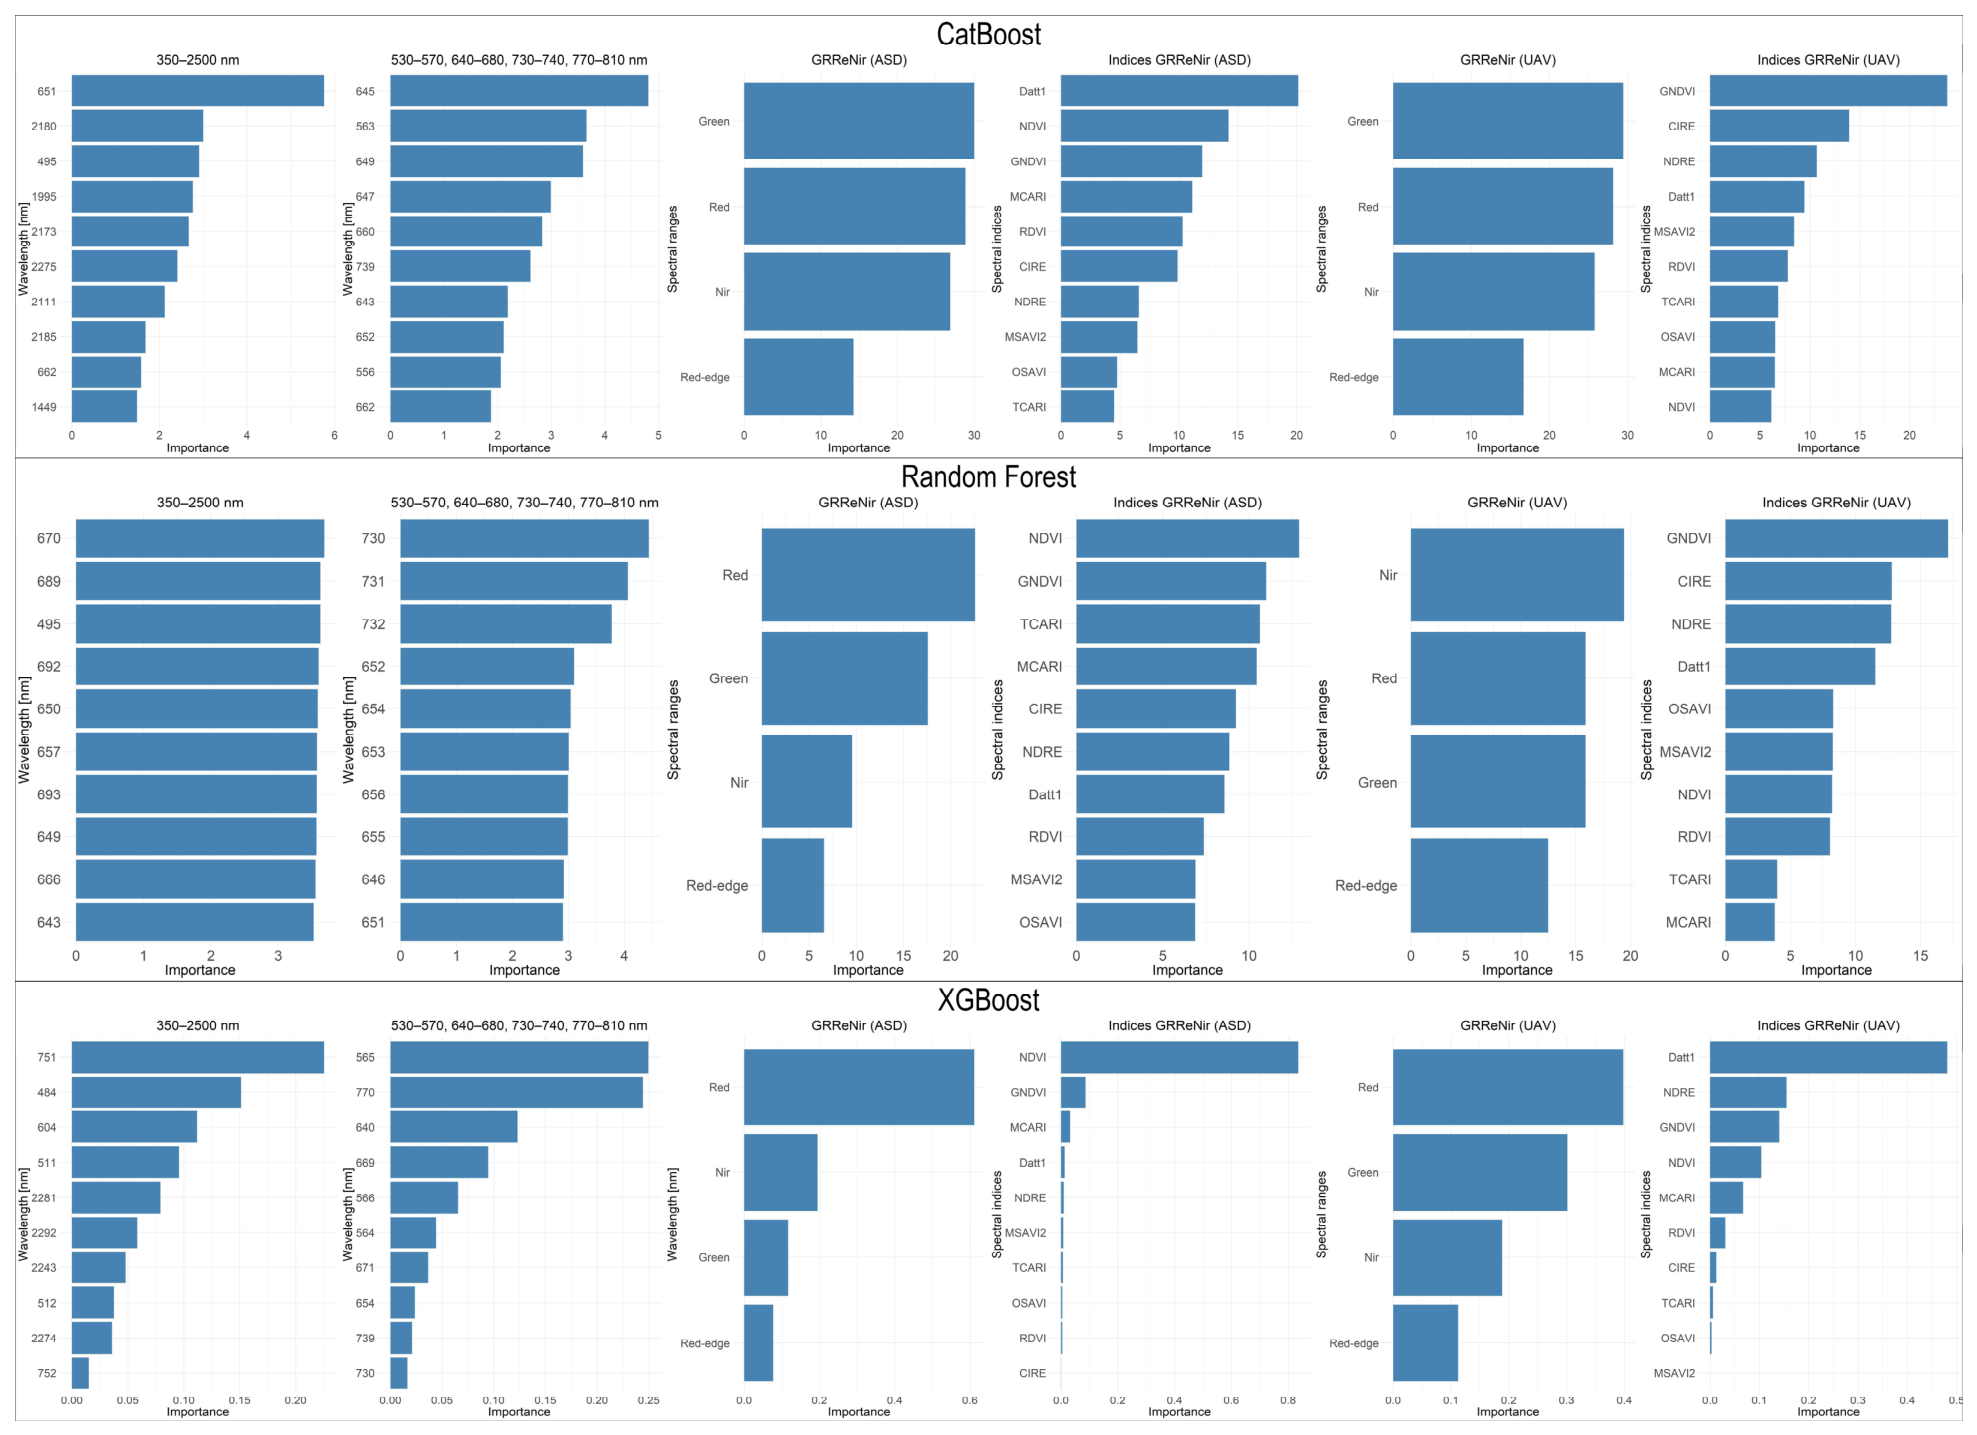

Disclaimer/Publisher’s Note: The statements, opinions and data contained in all publications are solely those of the individual author(s) and contributor(s) and not of MDPI and/or the editor(s). MDPI and/or the editor(s) disclaim responsibility for any injury to people or property resulting from any ideas, methods, instructions or products referred to in the content. |
© 2026 by the authors. Licensee MDPI, Basel, Switzerland. This article is an open access article distributed under the terms and conditions of the Creative Commons Attribution (CC BY) license.