1. Introduction
Reliable marine environmental information supports maritime operations, sea-surface surveillance, and radar target detection. The sea surface is shaped by atmospheric forcing, ocean currents, and bathymetry, and its state directly affects radar backscatter [
1]. As key descriptors of the marine environment, wave parameters directly determine the spatiotemporal distribution characteristics of radar echoes from the sea surface, thereby significantly affecting the accuracy and reliability of target detection. Accurate retrieval of wave parameters from sea clutter is therefore relevant to marine monitoring and radar surveillance.
Early studies investigated the retrieval of wave spectra from marine-radar image sequences. In the field of wave spectrum inversion from radar sea clutter, several inversion methods have been developed for X-band scanning marine-radar image sequences. Young et al. [
2] used a three-dimensional Fourier transform to extract ocean wave spectra from sequences of radar echo images. Nieto-Borge et al. [
3] further applied this method to shipborne X-band radar to obtain the frequency and relative wave direction corresponding to the dominant spectral peak of the wave spectrum. Chen et al. [
4,
5] investigated a new method based on empirical orthogonal function (EOF) analysis to extract wave parameters from shipborne X-band radar image sequences.
Parallel work retrieved sea-surface information from synthetic-aperture-radar (SAR) imagery. Hasselmann et al. [
6] formulated a nonlinear integral mapping from the two-dimensional ocean-wave spectrum to the SAR image spectrum. Engen and Johnsen [
7] developed a nonlinear closed-form transformation from the ocean wave spectrum to the SAR image cross-spectrum. Bao and Alpers [
8] adopted a quasi-linear transformation approximation and supplemented the nonlinear case with Monte Carlo simulations. In recent years, some scholars have also proposed empirical or semi-empirical algorithms for retrieving ocean wave parameters based on SAR image parameters [
9,
10,
11]. Li et al. [
12] further refined the modulation function of the real aperture radar.
In addition to shipborne marine scanning radar and satellite remote sensing SAR, high-frequency ground wave radar is another important remote-sensing technique for wave observation. In 1977, Barrick derived a theoretical model based on first-order and second-order sea surface backscattering to extract wave parameters from high-frequency radar Doppler spectra [
13]. Wyatt and her collaborators [
14,
15] made substantial and sustained contributions to the inversion of the ocean wave directional spectrum from HF radar Doppler spectra, developing key inversion algorithms such as the relaxation method and extensively validating the technique across various sea states and radar configurations. In 1990, Howell and Walsh [
16] used the echo signal of shipborne high-frequency radar to extract a non-directional wave height spectrum. In 2014, Li and others [
17] transformed the wave parameter inversion problem into quadratic optimization with non-negative constraints.
In recent years, deep learning methods have been widely used in the field of wave parameter inversion due to their powerful nonlinear mapping capabilities and end-to-end characteristics. Gao et al. [
18] used the SVM regression model and SAR image characteristic parameters to estimate the significant wave height. Wang et al. [
19] compiled approximately 30,000 matched Gaofen-3 quad-polarization SAR samples and developed a deep residual convolutional network for significant-wave-height retrieval. Yang et al. [
20] applied a Vision Transformer to significant-wave-height estimation from X-band marine-radar images and proposed the SWHFormer method, which captures global sea surface features through a self-attention mechanism using only a single fully polarimetric radar image. Chen et al. [
21] proposed the RSMamba architecture, which introduced a state-space model for remote-sensing image feature extraction. Their approach overcomes the limitations of the Mamba model in non-causal modeling of two-dimensional images through a dynamic multi-path activation mechanism. Wan et al. [
22] further extended the joint inversion framework by integrating SAR and SWIM spectrometer data to construct a multi-parameter joint inversion model based on the XGBoost algorithm, capable of simultaneously retrieving wave height, wave period, wind speed, and wind direction. To our knowledge, few studies have evaluated wave parameter retrieval from measured microwave-band echoes acquired by tower-based non-scanning radar. Tower-based non-scanning pulsed radar can only acquire two-dimensional range-pulse echo data without azimuth information, and existing research rarely involves wave parameter inversion from this type of radar data. To date, effective inversion methods based on such radar echo data remain lacking.
This paper focuses on two-dimensional range-pulse echo data blocks from a tower-based non-scanning pulsed radar. Such data contain only range and pulse dimensions without azimuth information. From each block, statistical and spectral descriptors are extracted to form a one-dimensional feature vector that serves as the input to the inversion model. Consequently, traditional analysis methods based on 2D images or spectra are not directly applicable. In recent years, hybrid architectures combining ResNet and Transformer have been widely explored. Dosovitskiy et al. [
23] proposed Vision Transformer, which includes a hybrid variant that uses a modified ResNet as a front-end backbone to extract image feature maps. These maps are then flattened and fed into a standard Transformer encoder for global modeling. Since then, the ResNet–Transformer paradigm has been extended to various tasks and data types, leading to multiple fusion strategies across different fields [
24,
25,
26,
27]. For example, Xu et al. [
28] proposed STRN, which alternately stacks Swin Transformer layers and dual ResNet blocks in the deep feature extraction stage of a U-shaped generator. This design achieves micro-level complementarity between global context and local details. Shi et al. [
29] proposed SpikingResformer, which adopts a multi-stage ResNet downsampling backbone and embeds dual spiking self-attention modules within each stage, forming hierarchically nested spiking residual blocks that balance multi-scale local features and global dependencies under purely spike-driven computation.
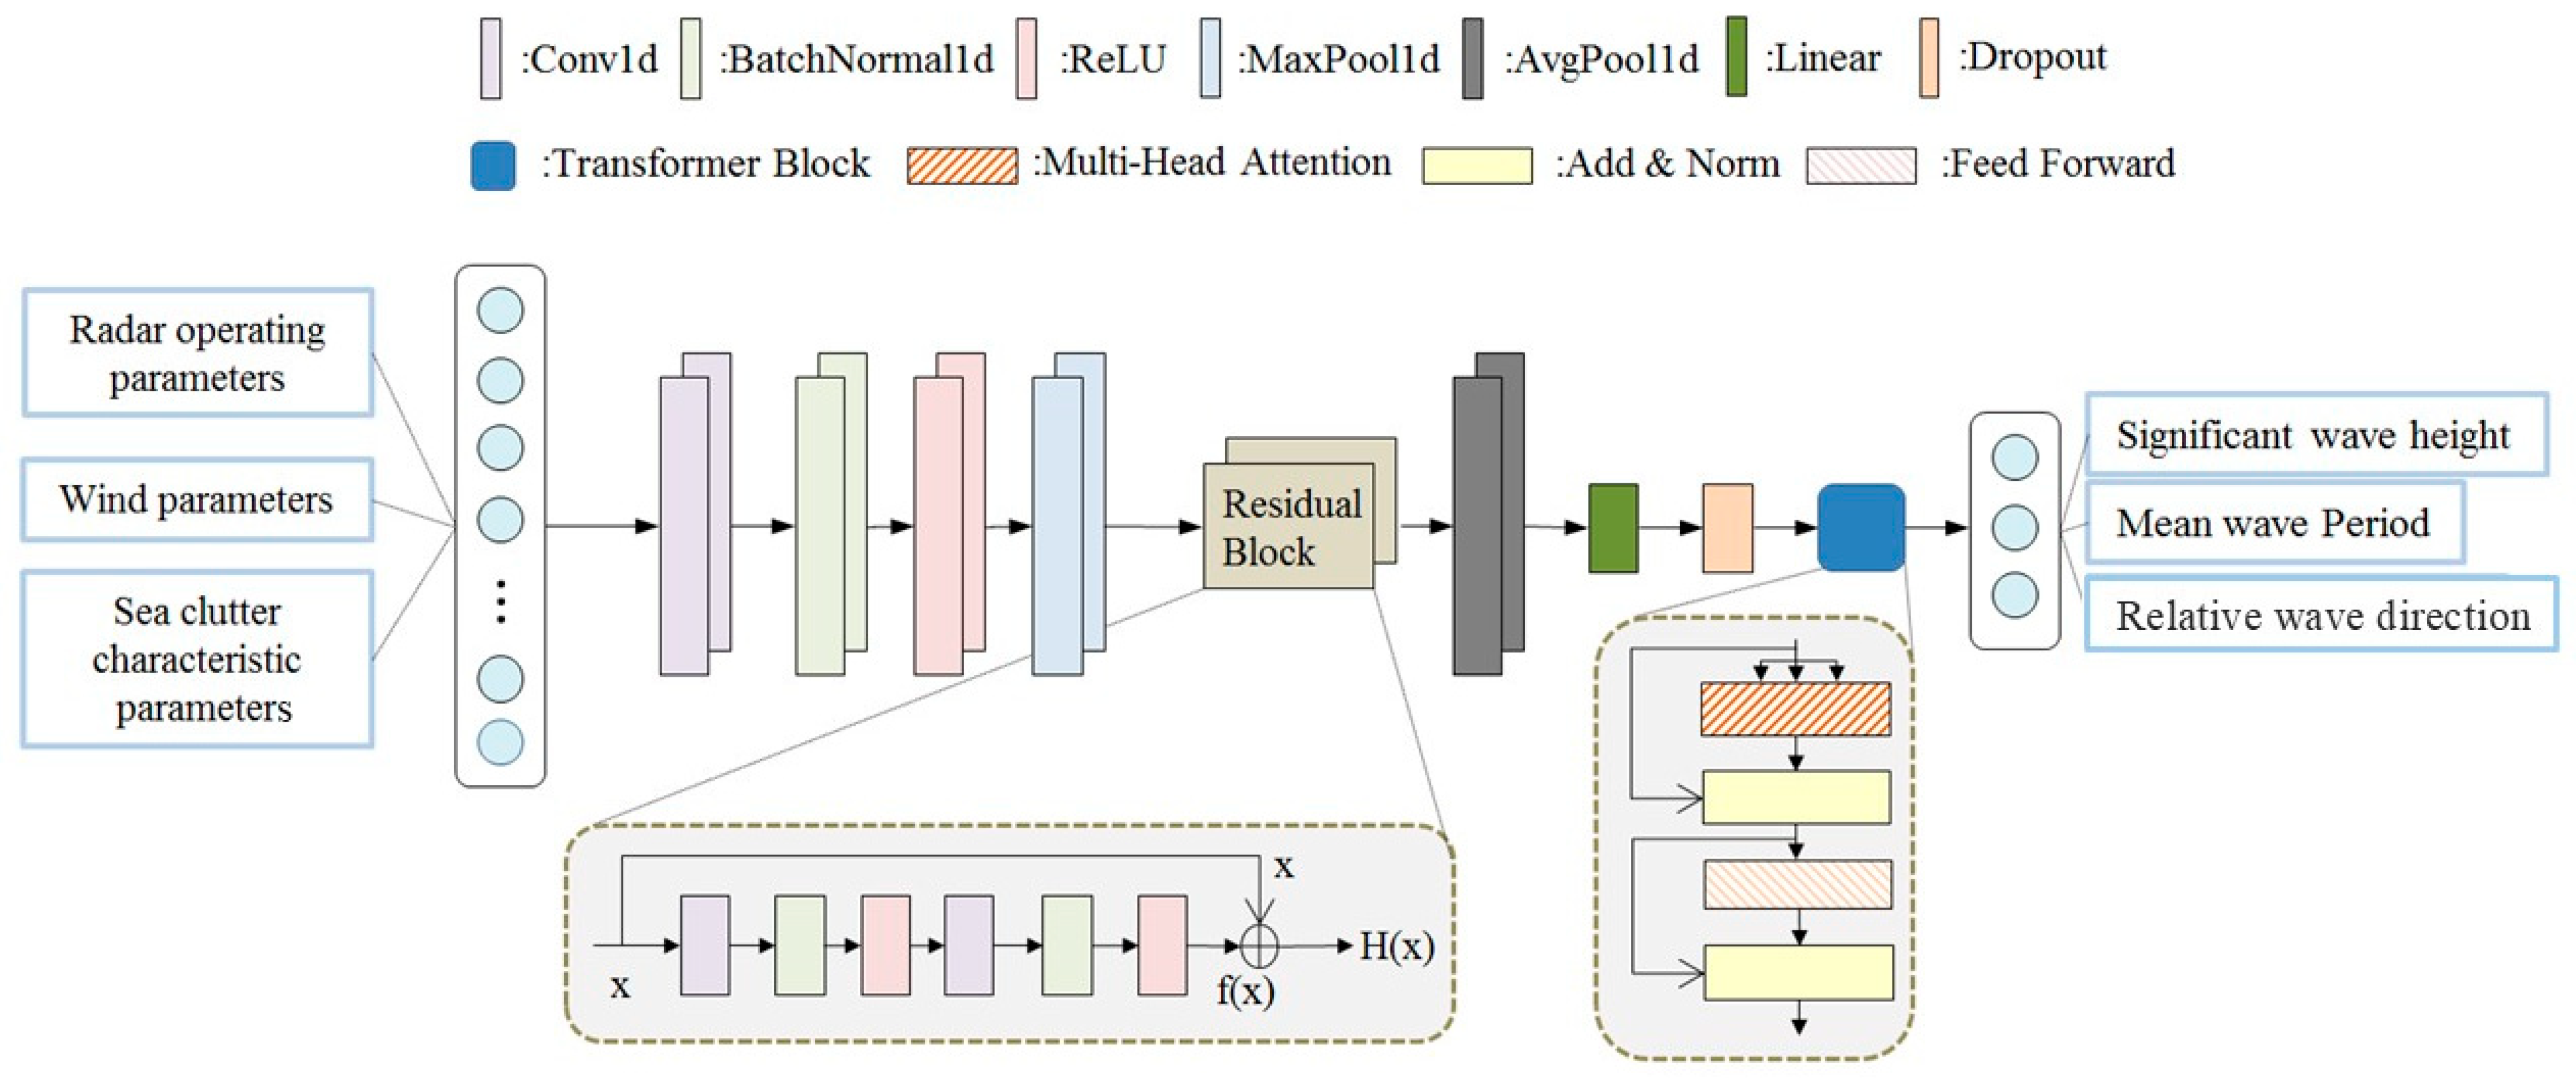
These studies show that ResNet–Transformer fusion has led to several effective paradigms. However, most of these methods are designed for well-structured data such as 2D images or multivariate time series, which differ fundamentally from the data used in our work. To address this, we propose a wave parameter inversion method based on a hybrid ResNet–Transformer network. Specifically, we adopt a serial fusion architecture. A shallow 1D ResNet first extracts local correlations and edge information from adjacent dimensions of the input feature vector. The output feature sequence is then fed into a Transformer encoder, where multi-head self-attention captures global interactions among features at the same time instance. This design leverages the complementary strengths of ResNet in local feature extraction and Transformer in global context modeling. Our method uses descriptors extracted from the radar echo blocks together with radar operating and wind parameters. It simultaneously estimates relative wave direction, mean wave period, and significant wave height. The trained model does not require azimuth information or concurrent contact measurements during inference; buoy observations are required as reference labels during model development and validation. The microwave-band tower-based radar system can be flexibly deployed at elevated coastal sites, offering potential for all-weather, low-cost monitoring. This work provides a new pathway for extracting wave information from microwave-band tower-based radar sea clutter data.
The rest of this paper is organized as follows.
Section 2 introduces the method of extracting characteristics of measured sea clutter data and constructing a dataset.
Section 3 describes in detail the construction of the ResNet–Transformer network model.
Section 4 reports the inversion results;
Section 5 presents the discussion of the experimental results, and
Section 6 presents the conclusions.
4. Results
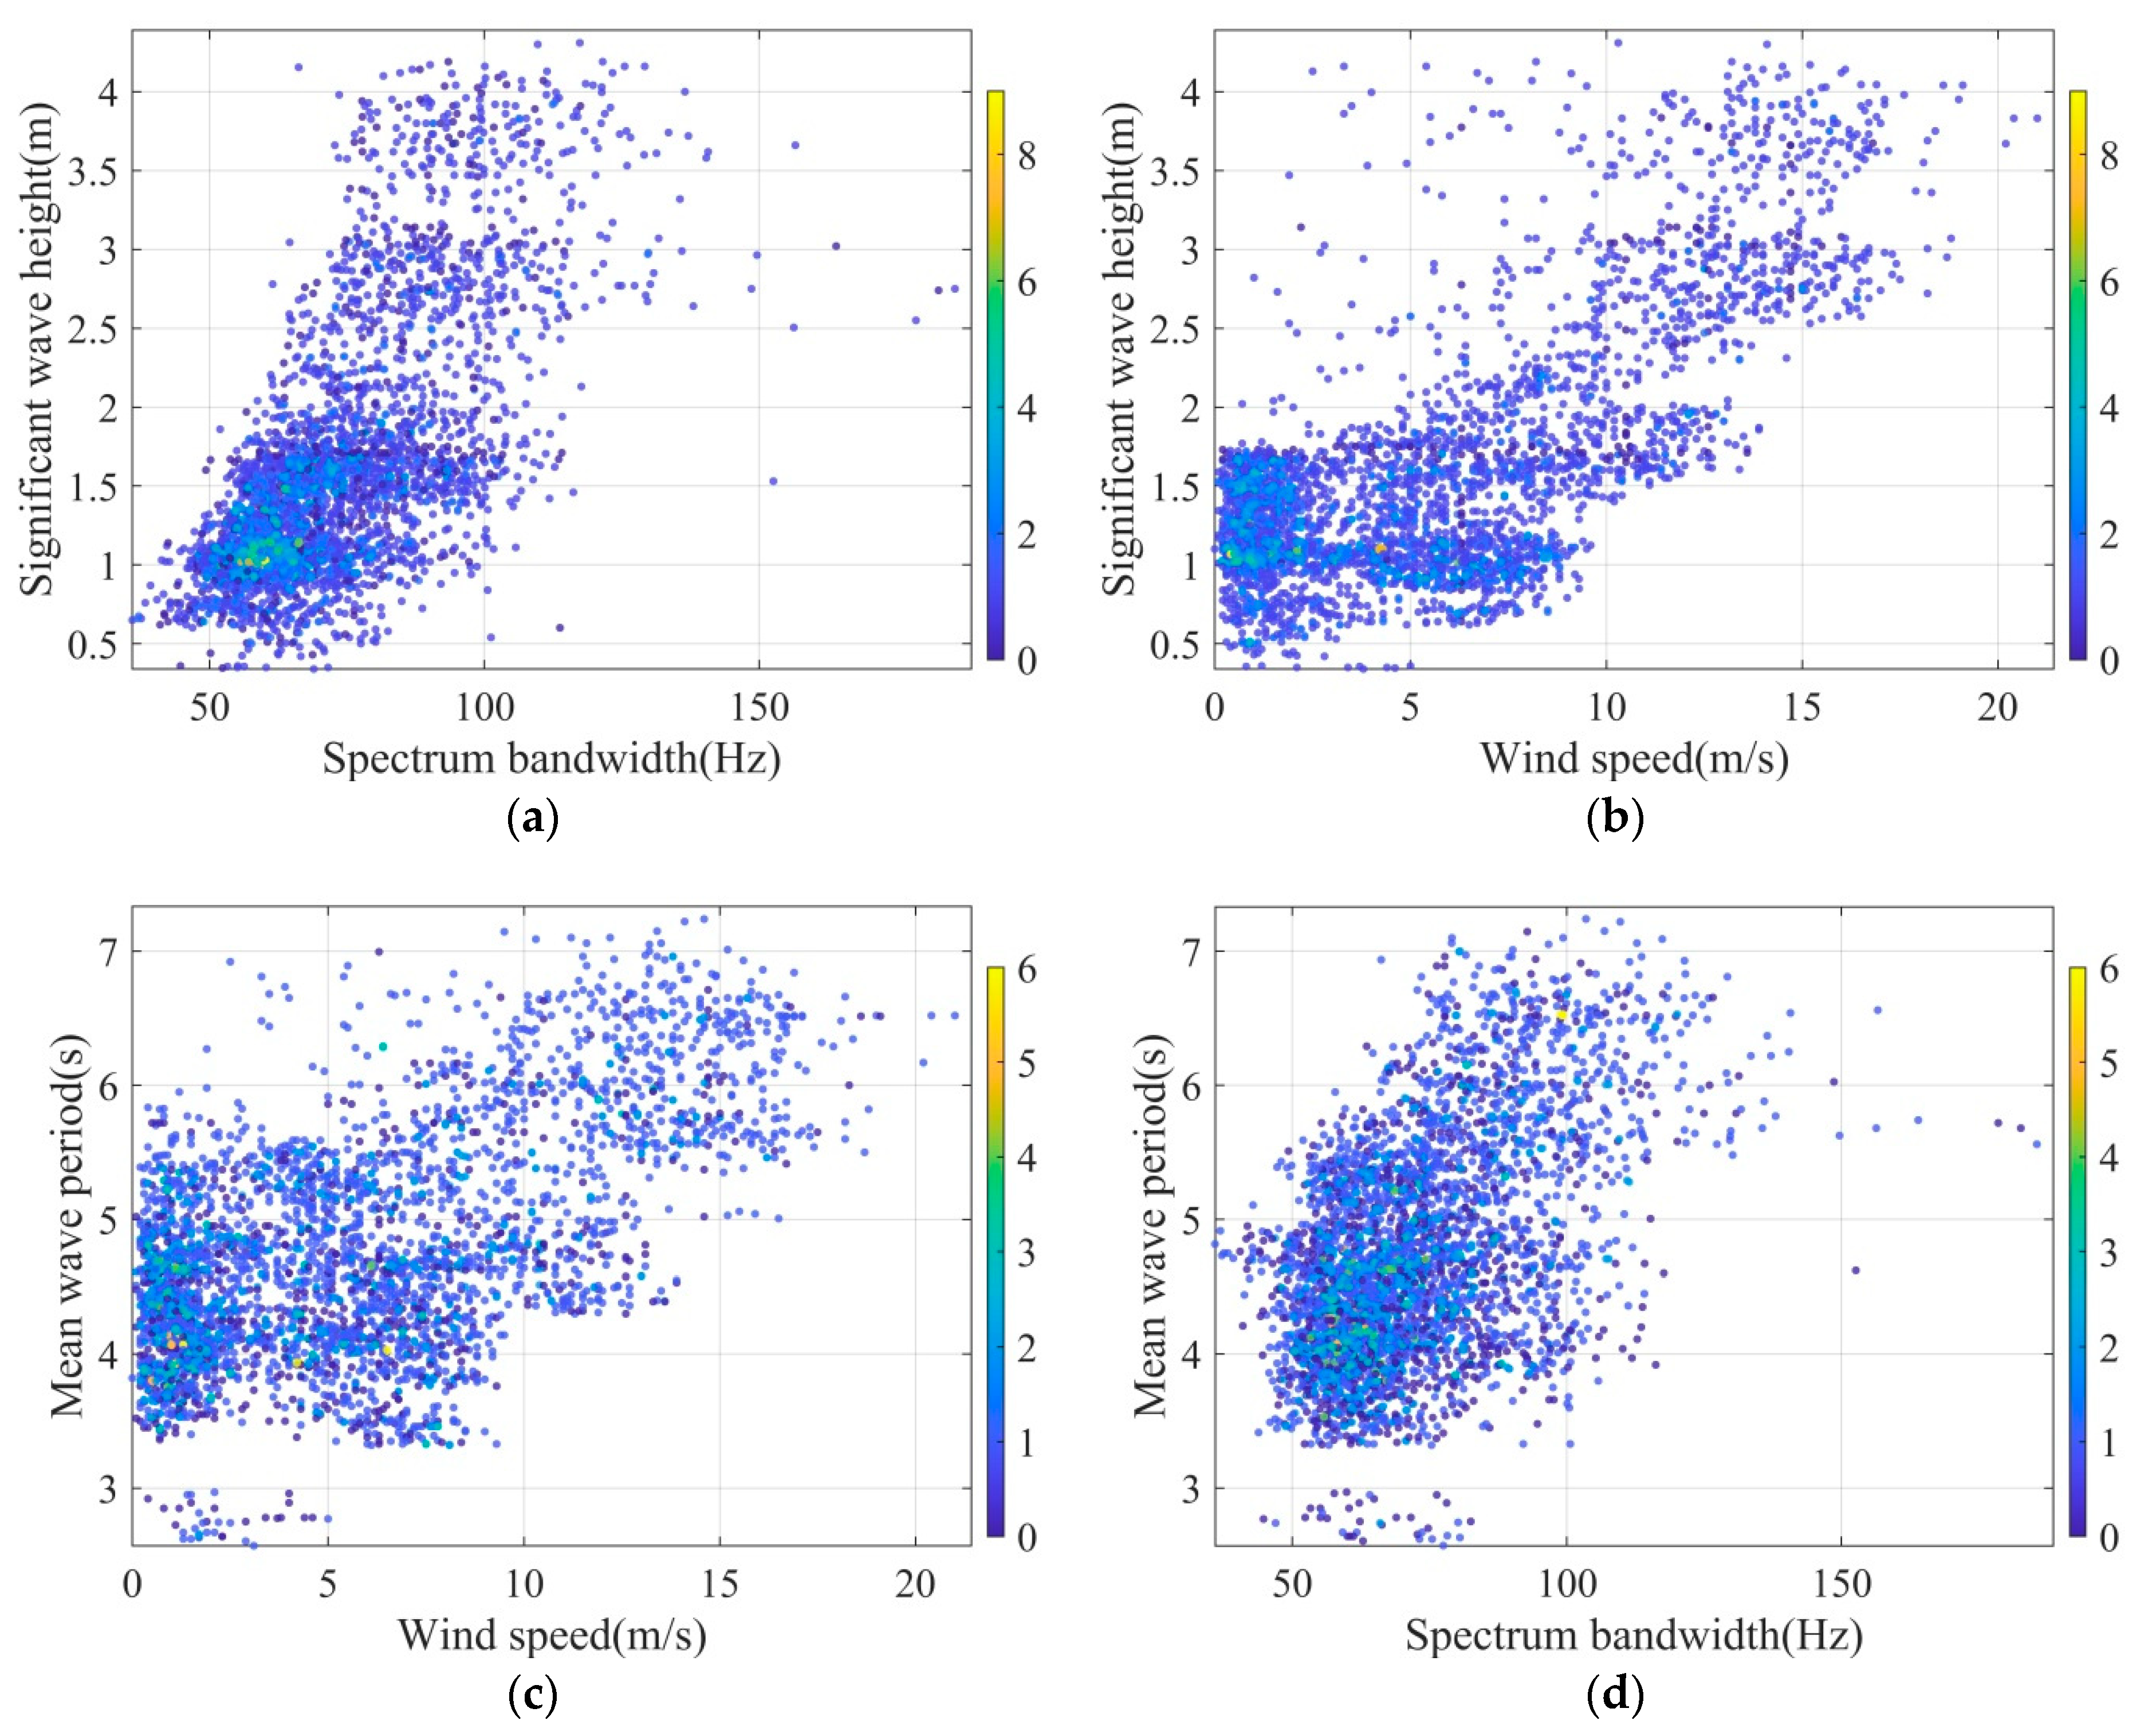
The dataset constructed in this paper comprises 3673 samples and covers a wide range of radar operating parameters and marine environmental conditions. There is a certain time interval between every two consecutive samples in the dataset, so there are no duplicate wind parameters or duplicate wave parameters; each sample corresponds to a distinct sea surface condition. Therefore, we ensure that no duplicate input or output parameter combinations exist among the samples. We treat each sample as independent and adopt a random shuffling strategy for dataset partitioning. This approach guarantees that data from different sea states are evenly distributed across the training set, validation set, and test set. The split ratio is 80%, 10%, and 10%. The proposed wave parameter inversion model is built on a deep learning framework. During training, the initial learning rate is set based on the dataset characteristics. The learning rate is then multiplied by a weight decay coefficient every 100 epochs. This strategy enables rapid convergence in the early training stage and supports fine-tuning in later stages. To comprehensively assess inversion performance, we adopt five widely used regression metrics, namely the mean absolute error (MAE), root mean squared error (RMSE), mean absolute percentage error (MAPE), Pearson correlation coefficient, and coefficient of determination (R2).
Based on the measured sea clutter dataset, we employ the proposed ResNet–Transformer network as the core inversion model. Four baseline models are selected for comparison, including a deep neural network (DNN), a shallow ResNet-18, random forest (RF), and XGBoost [
43]. The DNN comprises six fully connected layers, having 128, 256, 1024, 256, 128, and 64 neurons. A dropout layer with a rate of 30% is added after each fully connected layer to prevent overfitting. The shallow ResNet-18 is the network structure described in
Section 3.1 but without the Transformer module. The RF and XGBoost are implemented as standard ensemble learning methods, and their hyperparameters are optimized via grid search.
To ensure fair comparisons, all models were trained and evaluated on the identical training and test data splits. For the deep learning models, which include DNN, shallow ResNet-18, and the proposed ResNet–Transformer, we adopted the multi-task uncertainty-weighted loss function and a unified learning rate decay schedule that decays by 0.1 every 100 epochs. For the RF and XGBoost models, we used their standard regression loss functions, namely mean squared error, and optimized their hyperparameters via grid search independently. These models do not involve multi-task loss weighting or learning rate decay. All other experimental conditions, such as data preprocessing and evaluation metrics, were kept consistent across all models.
In model performance comparison, in order to quantitatively measure the improvement of the proposed model compared to the baseline model, the relative change rate is usually used as an indicator. This indicator intuitively reflects the degree of performance improvement or degradation by calculating the difference between the new value proposed and the old baseline value as a percentage of the old value. The calculation formula is as follows:
where
represents the index value of the proposed model and
represents the index value of the benchmark model.
Table 4 summarizes the inversion performance of the five models for each wave parameter. Overall, the proposed ResNet–Transformer consistently achieves the highest inversion accuracy across all three wave parameters. For relative wave direction, the proposed model attains an R
2 of 0.773, which surpasses the DNN with 0.531 and the shallow ResNet-18 with 0.703. Its performance is comparable to the RF with 0.772 and exceeds the XGBoost with 0.694. For mean wave period, the proposed model achieves an R
2 of 0.654. This result markedly outperforms the DNN with 0.055 and the shallow ResNet-18 with 0.577, and also surpasses the RF with 0.387 and the XGBoost with 0.503. Notably, although the shallow ResNet-18 yields an MAE close to that of the proposed model with 0.475 versus 0.418, the higher R
2 achieved by the proposed model indicates its superior capability in explaining data variance. For significant wave height, the proposed model attains the best performance with an R
2 of 0.860 This result outperforms all four baseline models: the DNN with 0.653, the shallow ResNet-18 with 0.783, the RF with 0.743, and the XGBoost with 0.697.
Compared with the DNN, the proposed model reduces the MAE by 34.5% for relative wave direction, by 40.5% for mean wave period, and by 27.6% for significant wave height. Compared with the shallow ResNet-18, the improvements are 8.4%, 12.0%, and 12.7%, respectively. These consistent improvements across all evaluation metrics further confirm the effectiveness of the proposed hybrid architecture. The key advantage of the Transformer lies in its ability to capture global interactions among features across different dimensions. While ResNet effectively extracts local correlations, the Transformer complements it by modeling global interactions that are not easily captured by convolutional operations alone. This is particularly important for wave parameter inversion, where the relationships among different feature dimensions are often non-local and complex.
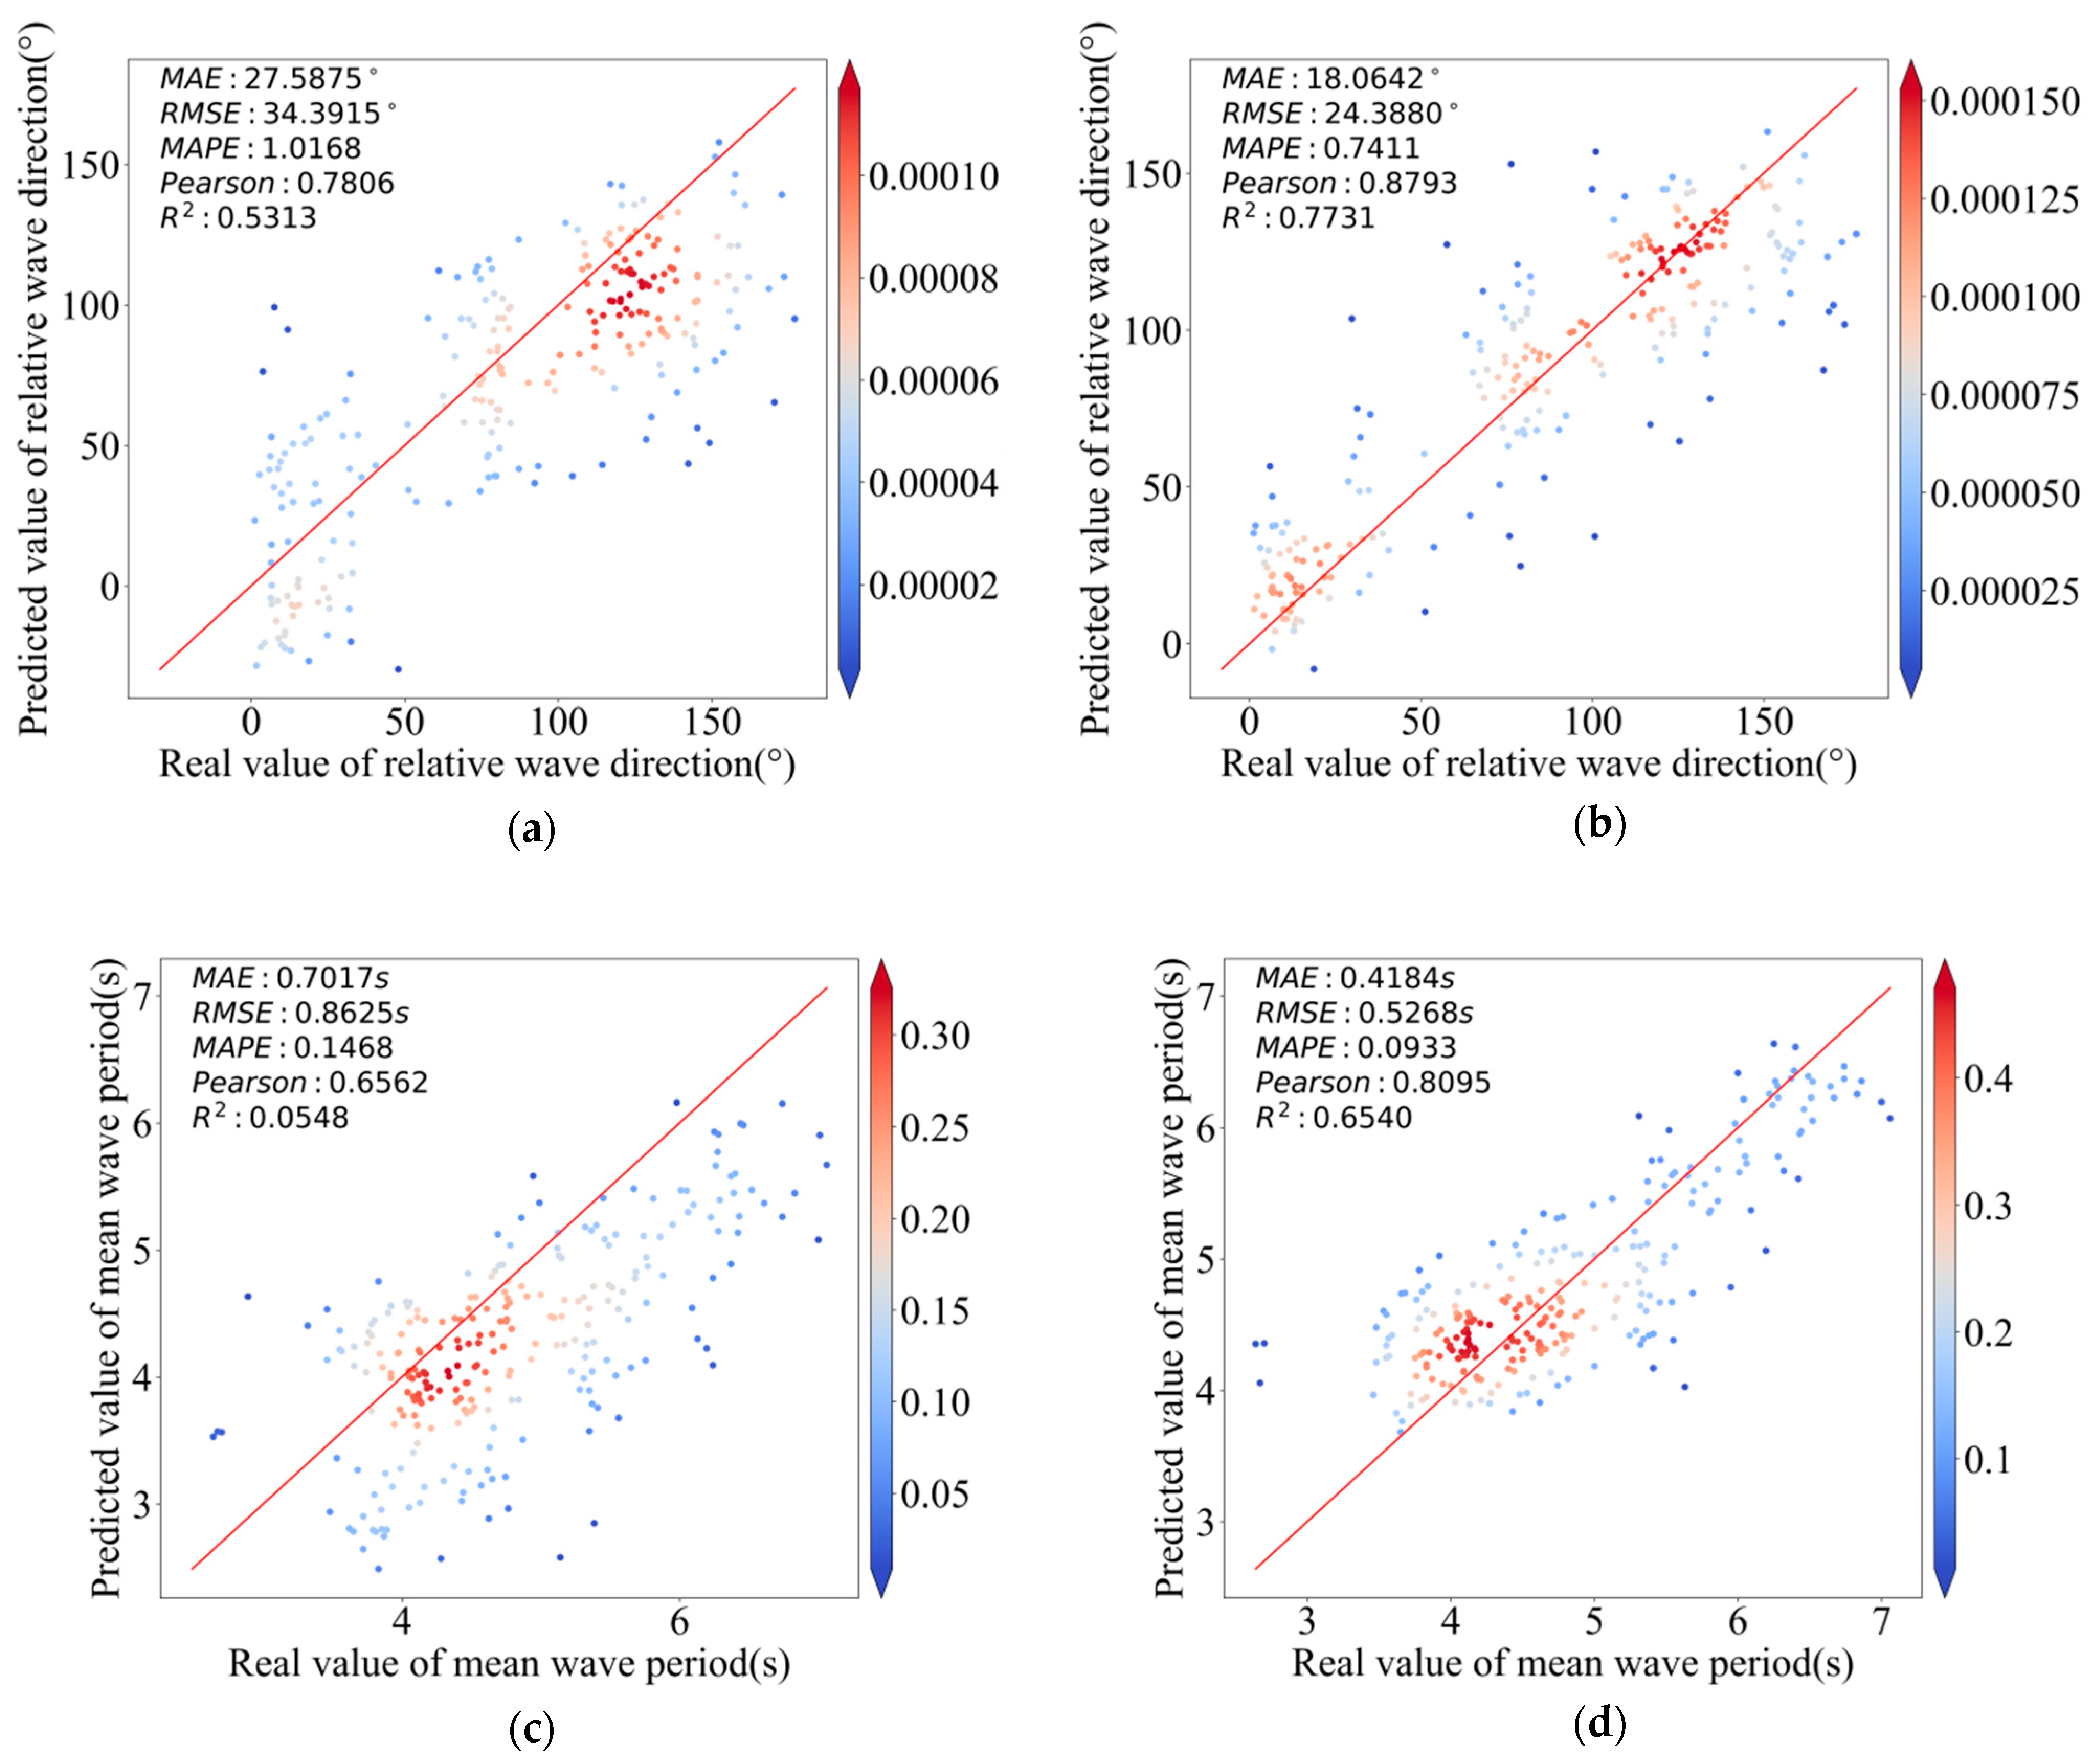
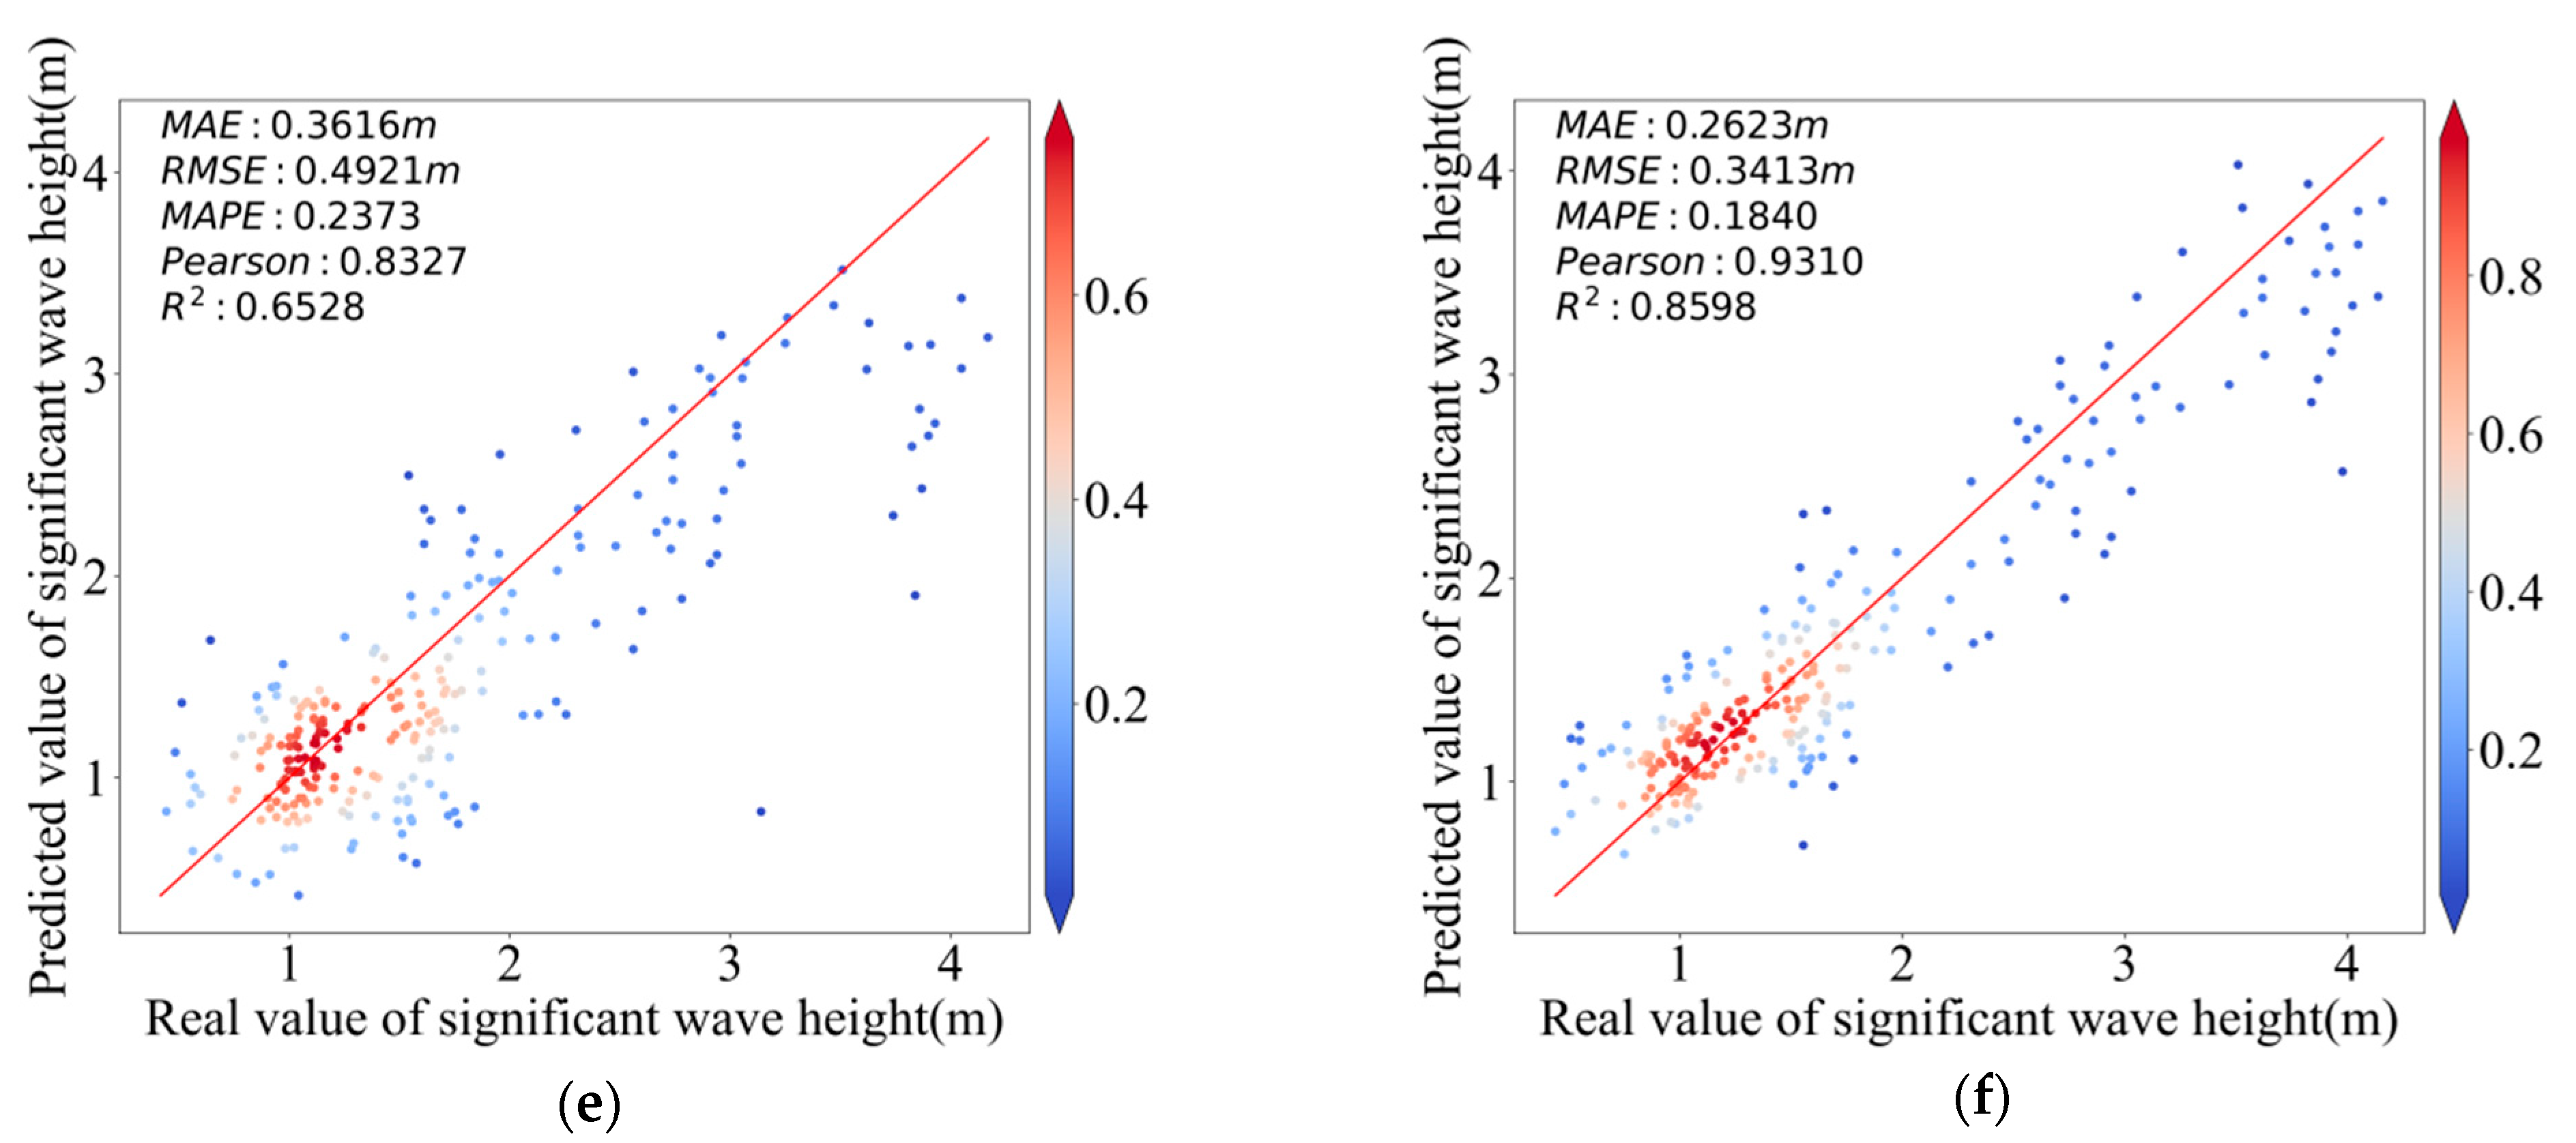
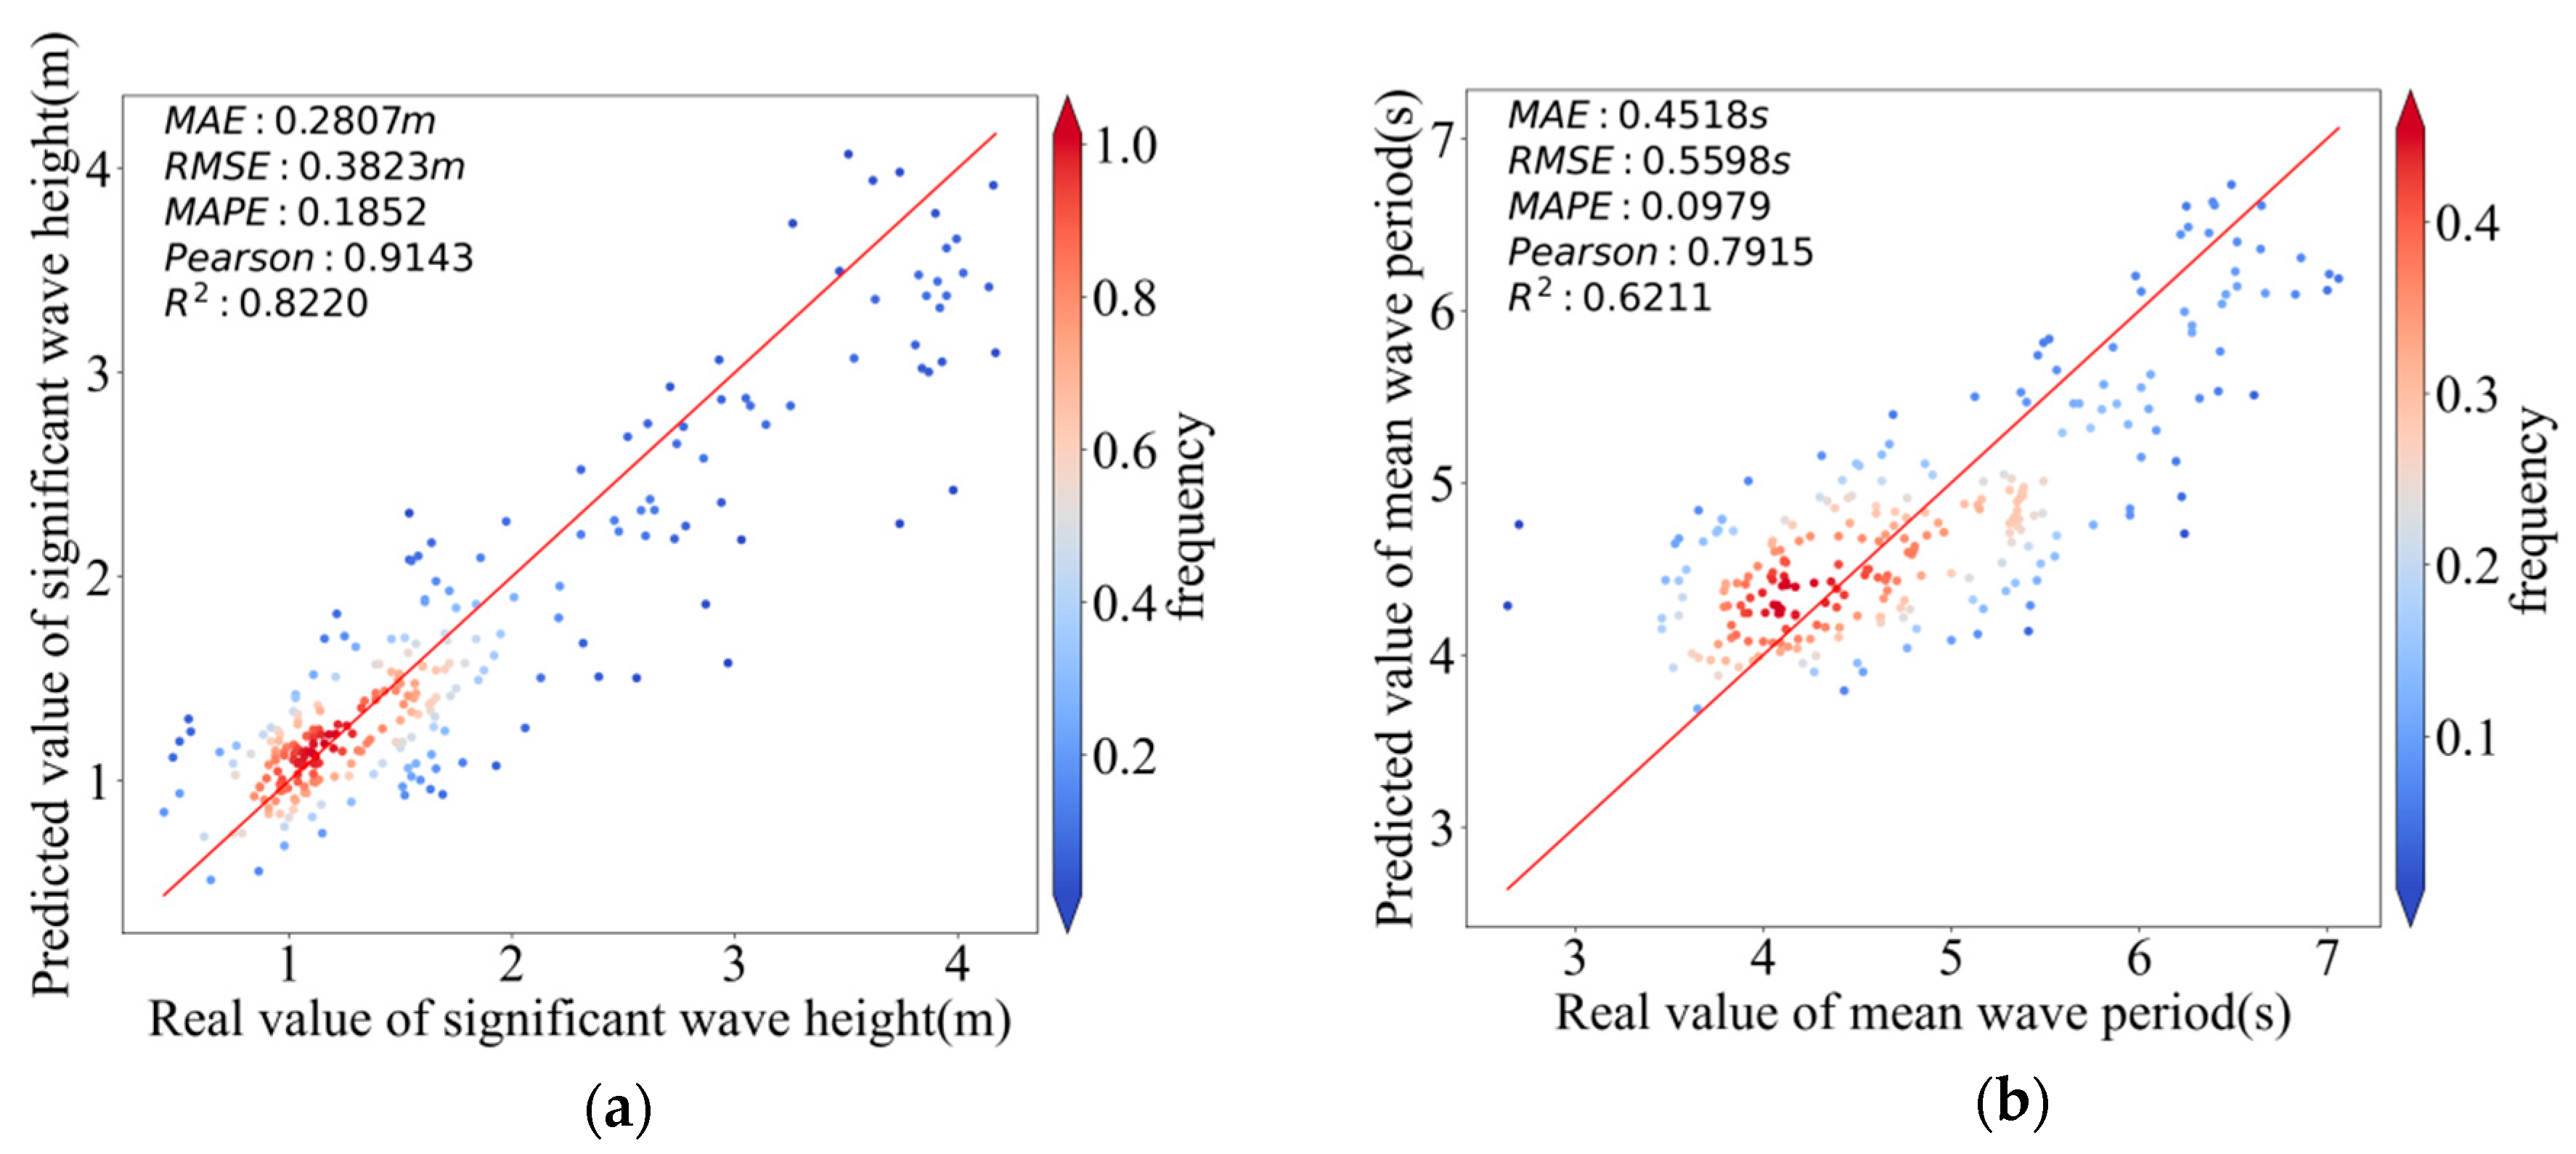
Figure 3 presents the inversion results of the DNN model and the proposed ResNet–Transformer network in scatter plots.
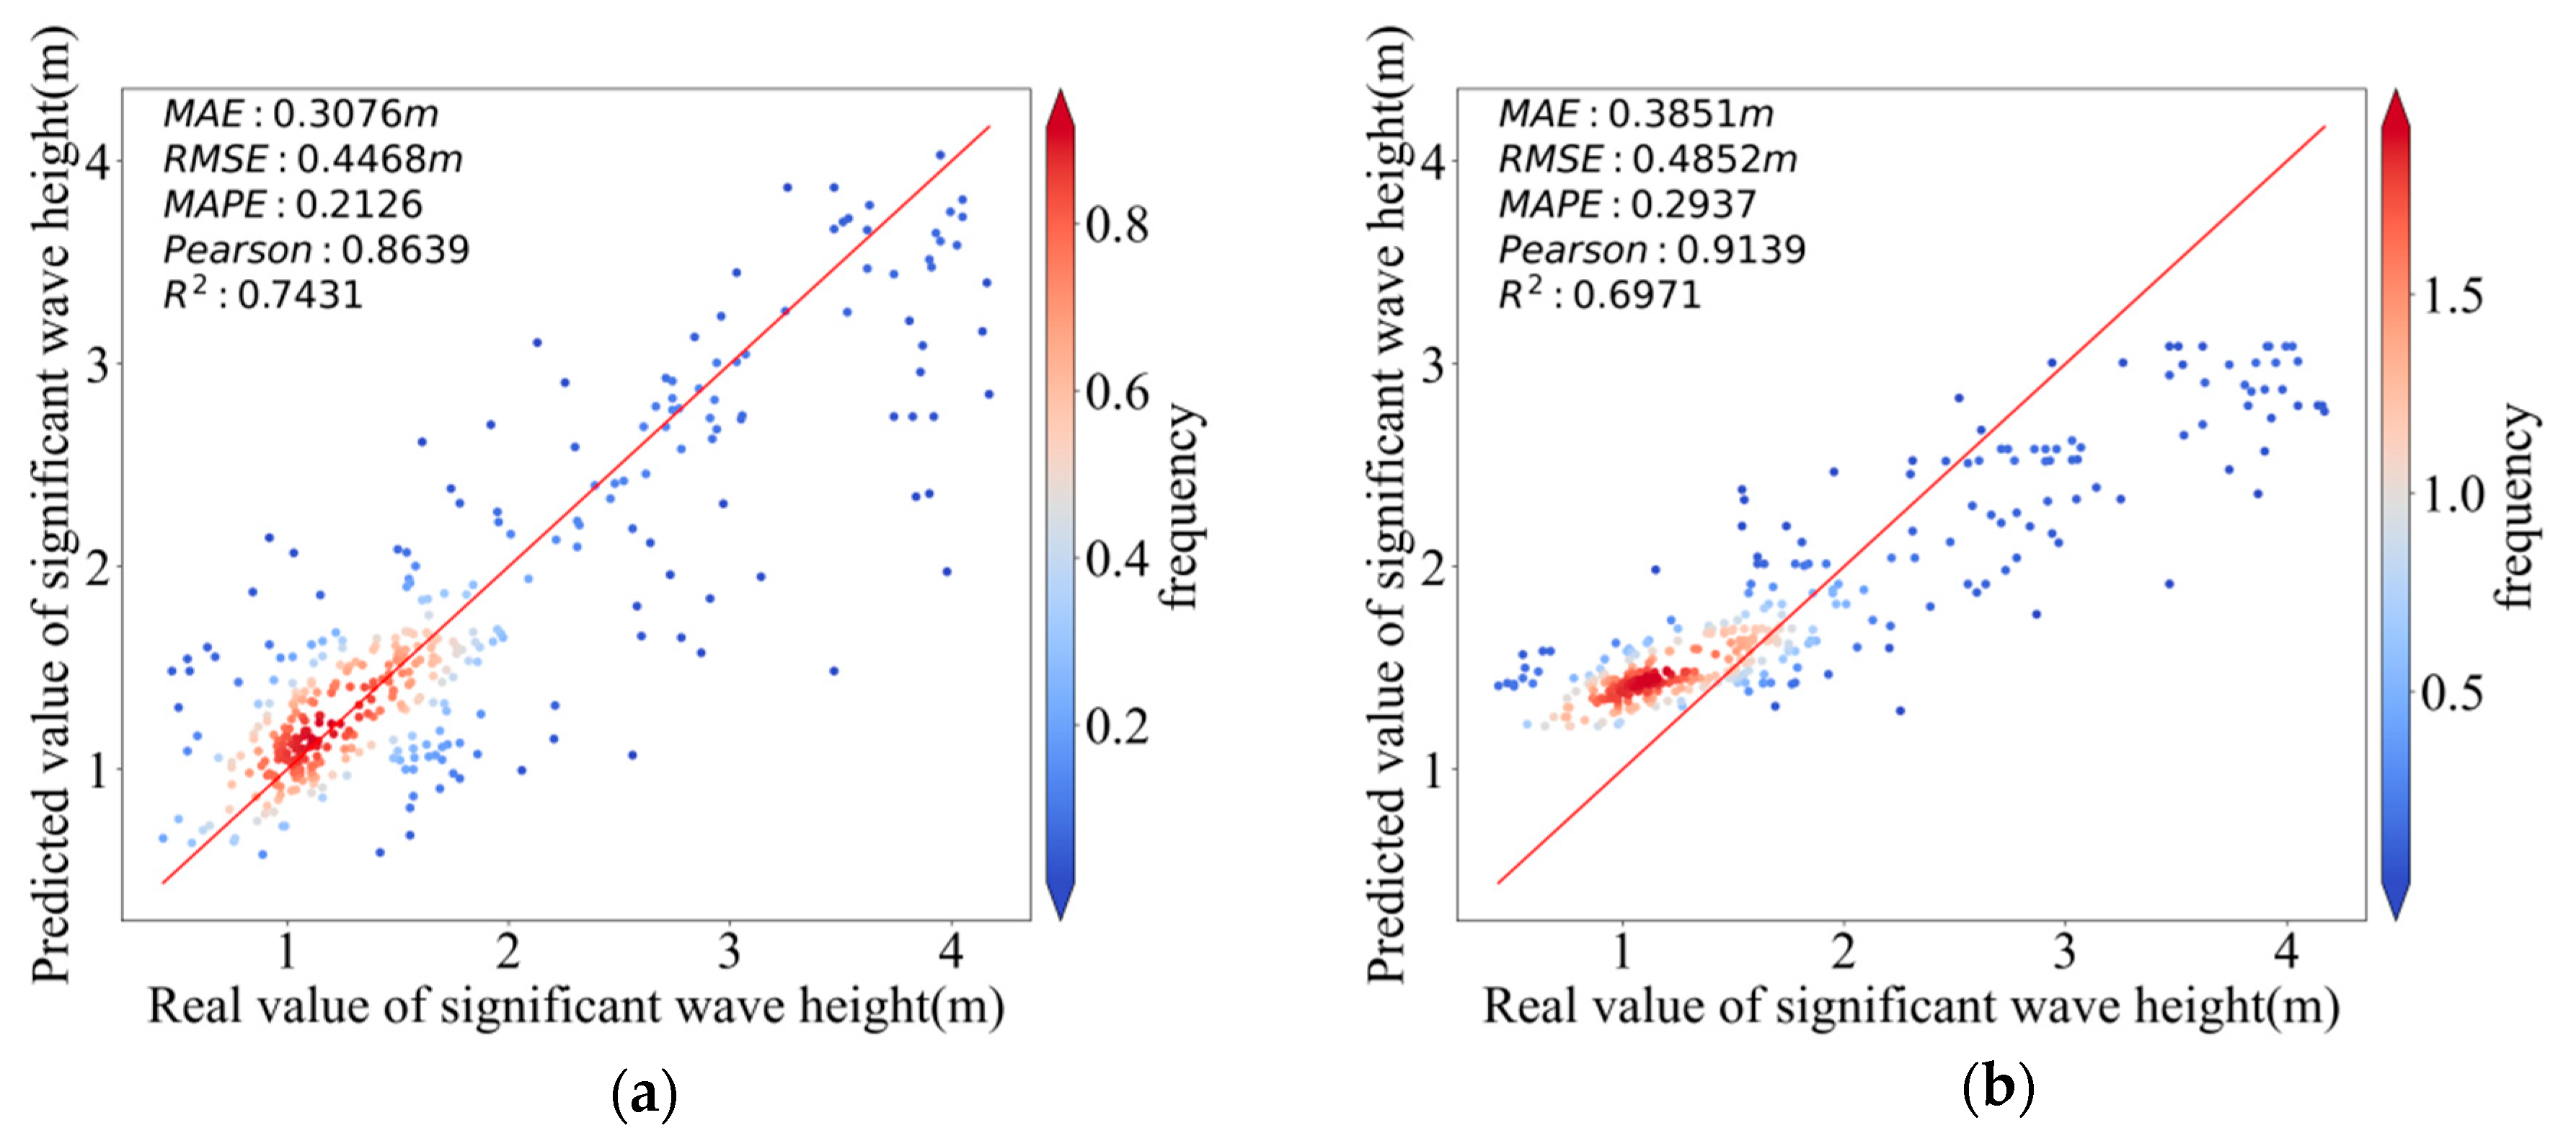
Figure 4 shows the SWH predictions from RF and XGBoost. In these figures, the horizontal axis denotes the true values and the vertical axis denotes the predicted values. Scatter points closer to the red diagonal line indicate more accurate predictions. The color intensity represents the local density of data points. As shown in
Figure 3, the scatter points of the proposed model are more tightly clustered around the diagonal than those of the DNN model, indicating higher inversion accuracy. The evaluation metrics displayed in the upper-left corner of each subplot further validate the superior performance of the proposed network.
In summary, the comparative experimental results demonstrate that the proposed ResNet–Transformer hybrid network consistently achieves the highest inversion accuracy across all three wave parameters under identical training and evaluation conditions. The most substantial improvements over the baseline models are observed for relative wave direction and significant wave height, where the R2 values are improved by up to 0.242 and 0.207 compared to the DNN, respectively, while the performance for mean wave period also surpasses all competitors with a notable margin over the shallow ResNet-18. The superior performance of the proposed architecture can be attributed to the synergistic combination of the residual convolutional module and the Transformer encoder.
Nevertheless, certain limitations of the current study should be acknowledged. The dataset, though comprehensive, is limited to non-scanning radar echo measurements from specific geographic regions and seasonal conditions. The generalizability of the proposed model to other radar configurations, carrier frequencies, or extreme weather scenarios remains to be verified. Moreover, the inversion performance for mean wave period, with an R2 of 0.654, is relatively lower than that for significant wave height, indicating that period estimation is inherently more challenging due to its stronger sensitivity to noise and spectral broadening.
5. Discussion
5.1. Comparison of Inversion Accuracy Under Different Sea States
To systematically evaluate the model generalization capability under different sea state levels, the test set data are further divided into low, medium, and high sea state categories according to the significant wave height. The low sea state corresponds to level 2 sea state data, the medium sea state corresponds to level 3 and level 4 sea state data, and the high sea state corresponds to level 5 and level 6 sea state data. The errors between the inversion results and the true values under different sea states are listed in
Table 5.
It can be observed from
Table 5 that the model performs consistently well across all sea states, though the inversion accuracy varies for different wave parameters. For relative wave direction, the error under high sea states is significantly lower than that under low and medium sea states. The MAE for high sea states is 13.930 degrees with an RMSE of 18.022 degrees, while the MAE values for the low and medium sea states are 19.441 degrees and 18.981 degrees, respectively, and the corresponding RMSE values are 26.771 degrees and 25.381 degrees. This indicates that high sea states are more favorable for accurate wave direction estimation. For significant wave height, the MAEs for low and medium sea states are 0.251 m and 0.220 m, respectively, whereas the MAE for high sea states increases to 0.401 m, indicating a degradation in absolute inversion accuracy under high sea conditions. The RMSE follows a similar trend, with values of 0.315 m, 0.286 m and 0.489 m for low, medium and high sea states, respectively. For mean wave period, the errors decrease progressively from low to high sea states, with MAE values of 0.518 s, 0.419 s, and 0.318 s and RMSE values of 0.638 s, 0.525 s, and 0.397 s, respectively.
Overall, the inversion results under different sea states are satisfactory. High sea states are most conducive to accurate estimation of relative wave direction and mean wave period, but the absolute inversion accuracy for significant wave height decreases notably. Low sea states yield the largest errors for relative wave direction and mean wave period, but the smallest absolute error for significant wave height. Medium sea states exhibit intermediate errors and a relatively balanced performance. The reasons for this outcome include not only the different evolution mechanisms of wave parameters under various sea states, but also the imbalanced data distribution across sea states in the dataset. The number of samples under high sea states is substantially smaller than that under low and medium sea states. This data imbalance may also affect the results. Although the model performs well in terms of relative trends under high sea states, the limited sample size may lead to less robust training and may partly explain the increased absolute error for significant wave height. In contrast, the larger sample sizes under low and medium sea states provide more training examples, which helps reduce absolute errors for significant wave height. However, the weaker wind–wave correlation under these conditions constrains the model′s ability to accurately capture directional relationships. Therefore, both the physical mechanism of wind–wave coupling and the data quantity imbalance jointly shape the inversion performance across different sea states.
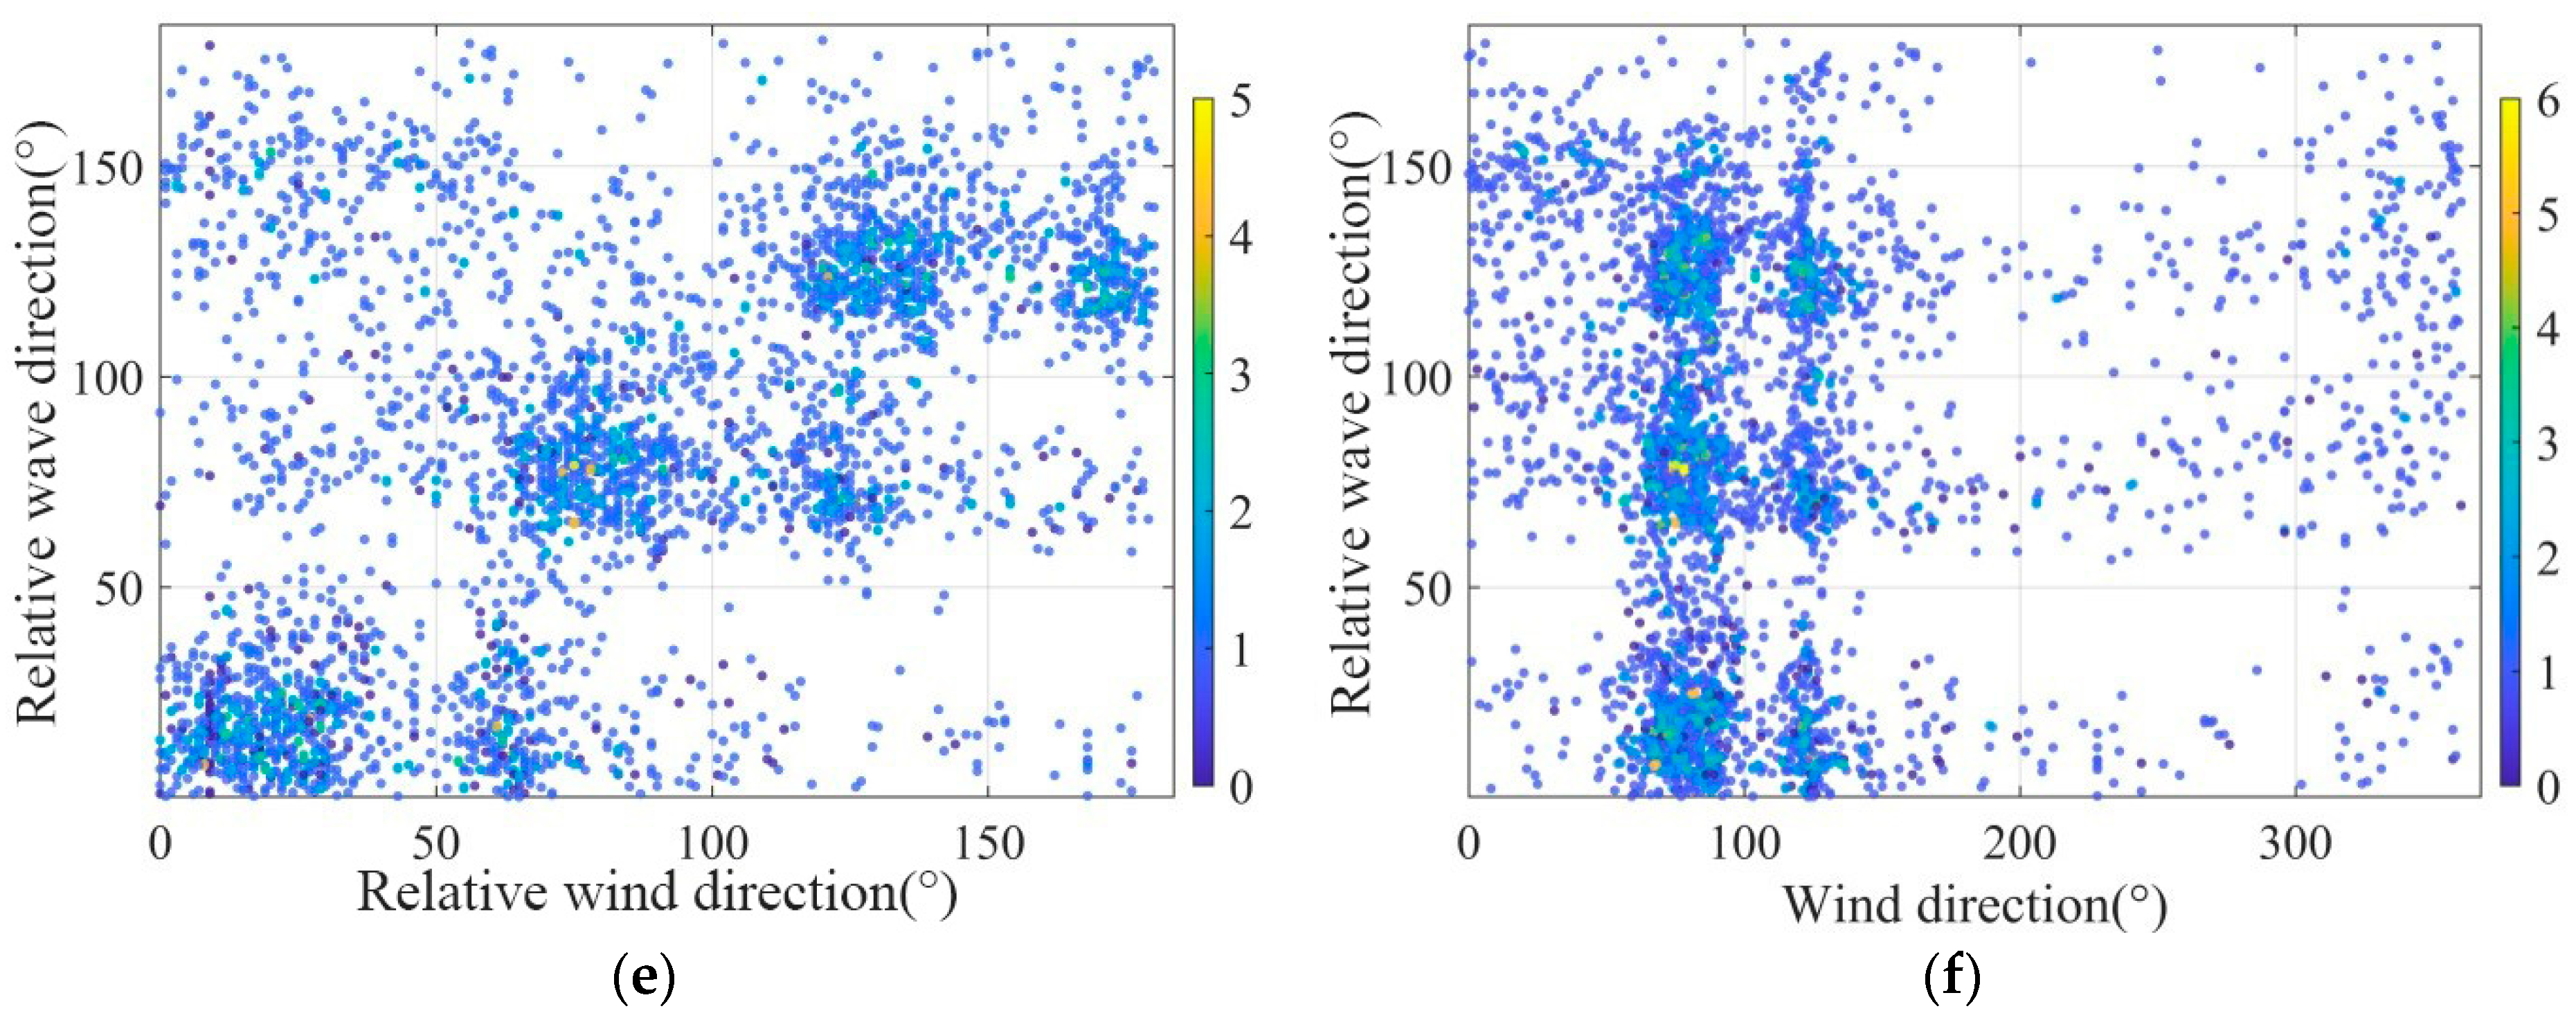
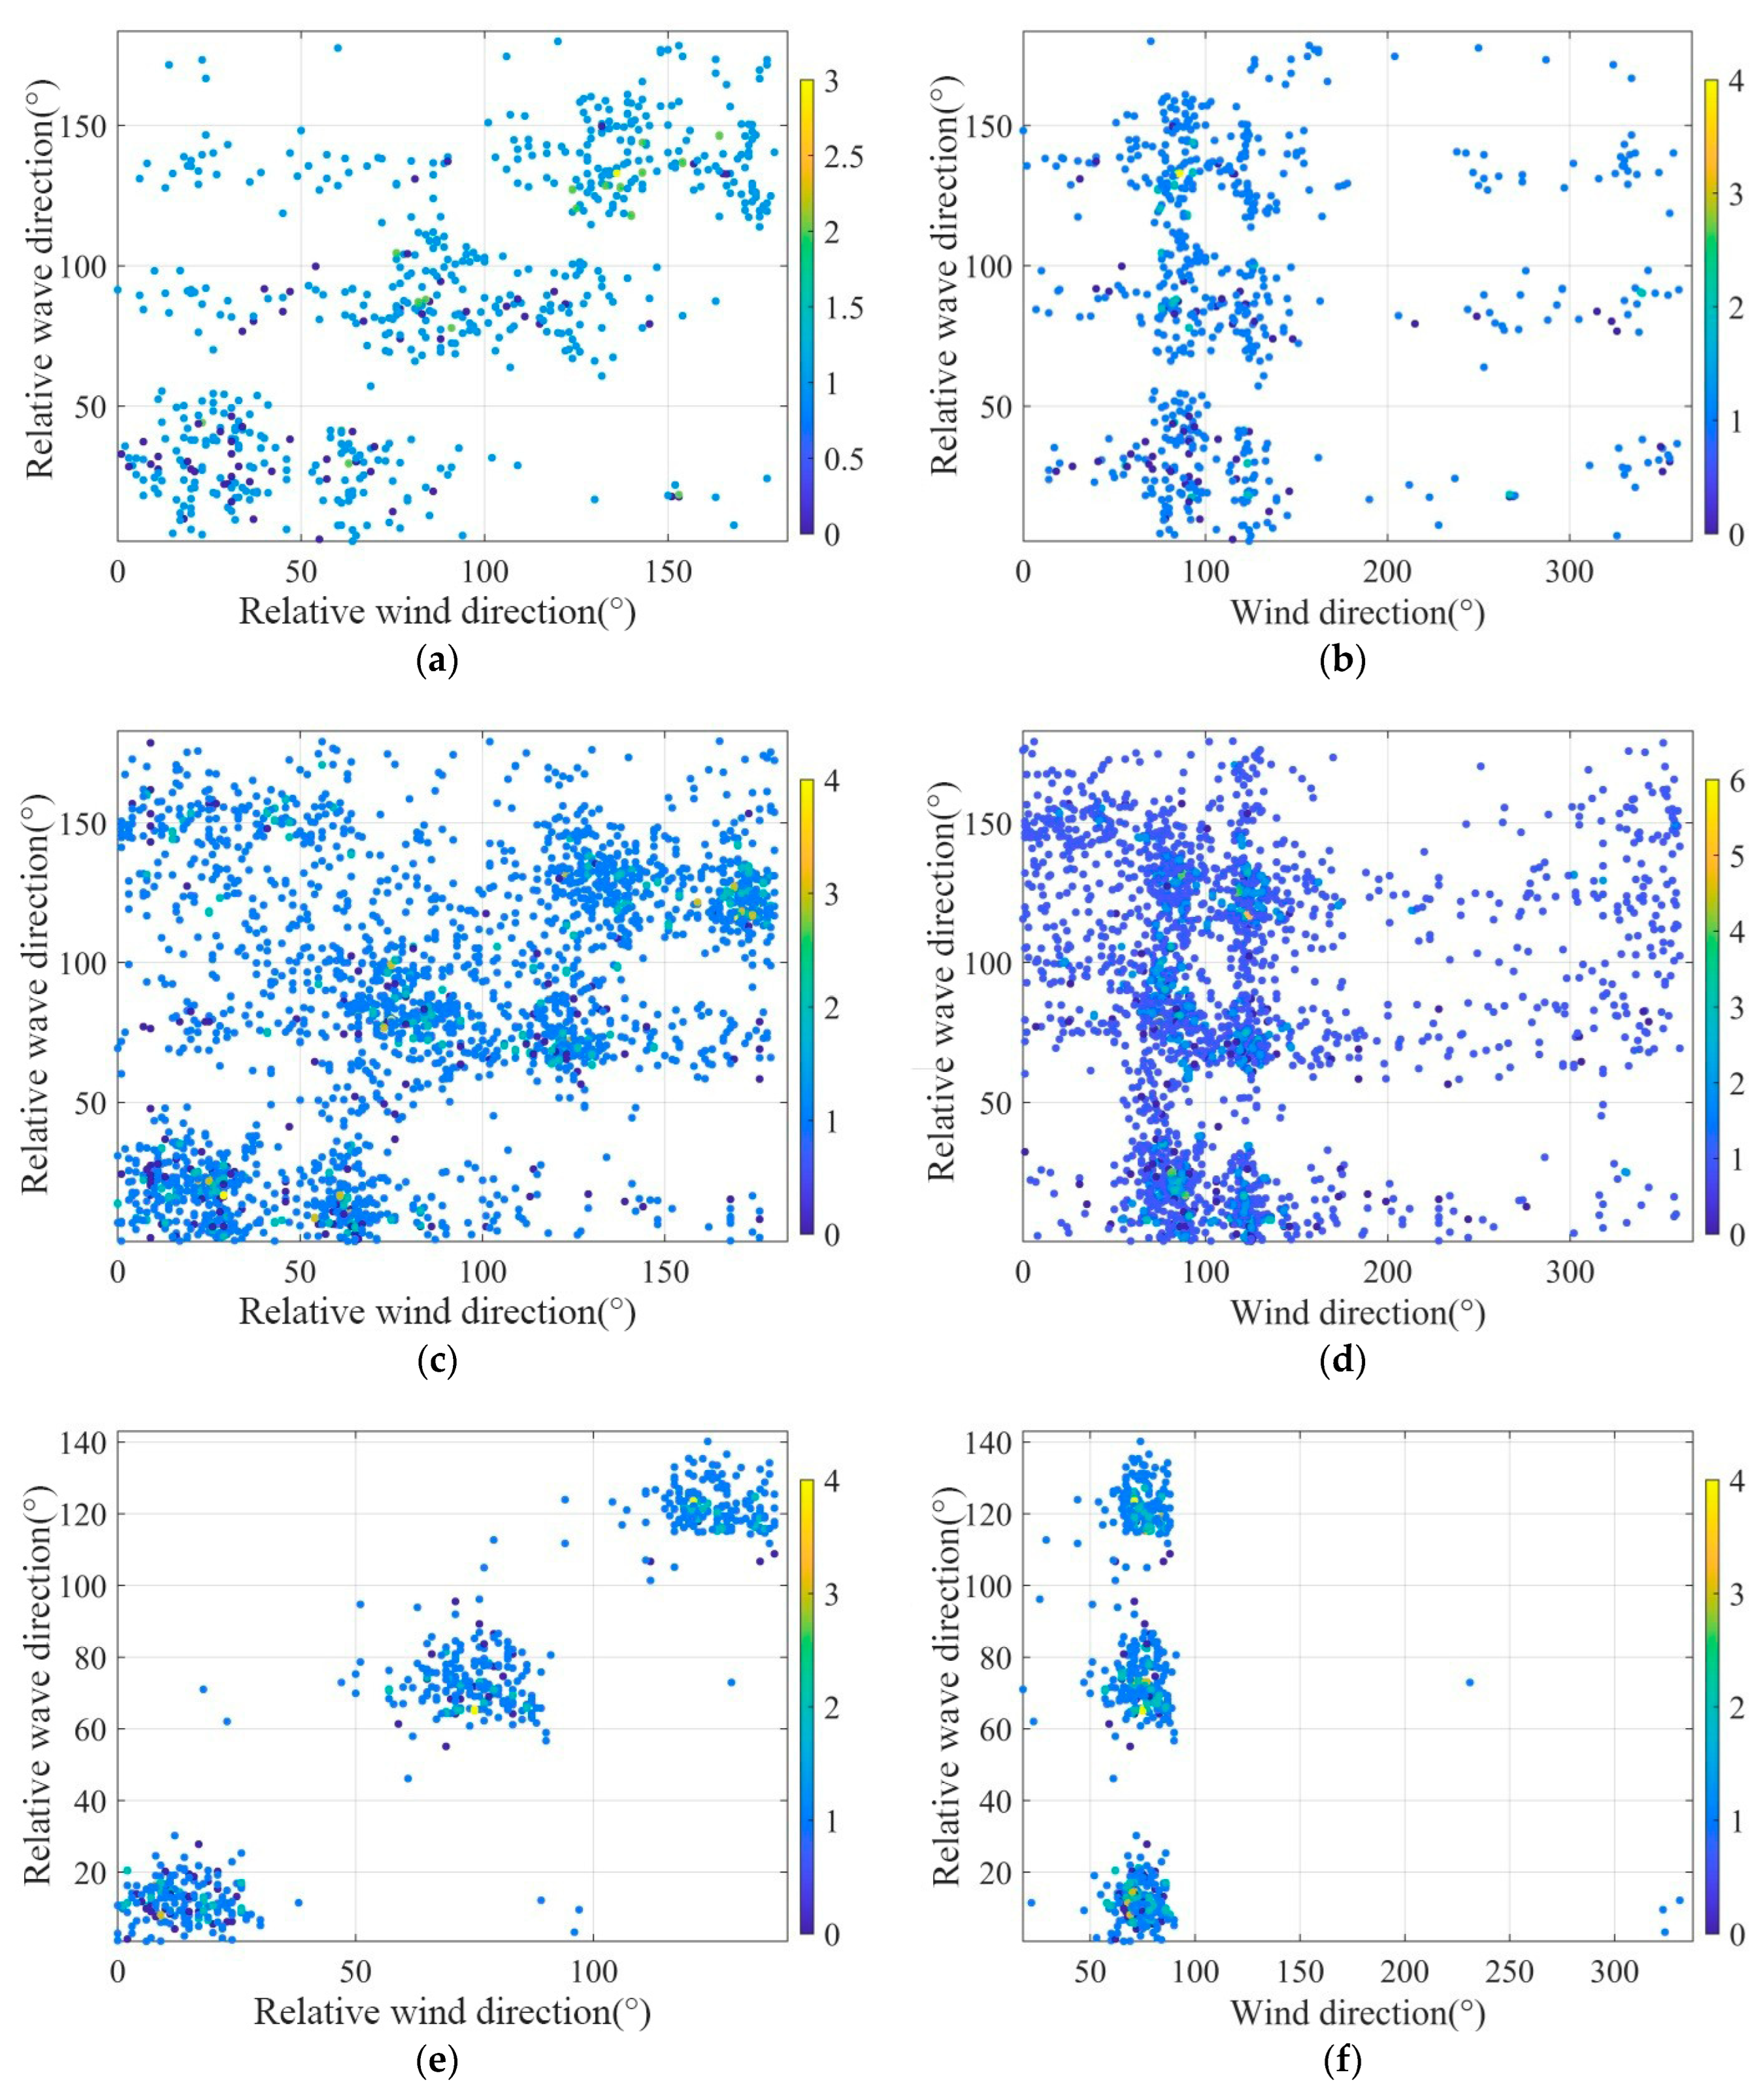
The superior performance of wave direction inversion under high sea states deserves further investigation. From a physical oceanographic perspective, under high sea states, the wind forcing is stronger and more persistent, leading to a more fully developed sea state with enhanced wind–wave coupling. The directional alignment between wind and waves becomes more pronounced, resulting in a tighter and more consistent relationship between wind parameters and relative wave direction. This physical consistency is reflected in the data, as shown in
Figure 5, where the correlation between wind direction, relative wind direction, and relative wave direction under high sea states is generally higher than that under medium and low sea states. The plots suggest stronger alignment at high sea states; this hypothesis should be tested quantitatively.
5.2. Relative Contributions of Sea Clutter and Wind Inputs
The input features used in this study include wind parameters such as wind speed, wind direction, and relative wind direction. These parameters are physically coupled with wave parameters. To quantify the respective contributions of sea clutter features and wind parameters to wave parameter inversion, we designed two ablation experiments, one using only wind parameters as input features, and another excluding wind parameters from the full feature set. The comparison results of the two experiments are presented in
Table 6, with discussions organized around three aspects below.
For relative wave direction, the model relying solely on wind parameters achieves an R2 of 0.680 and a Pearson correlation of 0.826. When wind parameters are excluded, performance drops notably to an R2 of 0.591 and a Pearson correlation of 0.772. This indicates that wind information contributes substantially to wave direction inversion, which is physically expected given the strong coupling between local wind fields and wave propagation direction. The relative wave direction generally follows the wind direction under open-sea conditions, consistent with classical wave generation theory. However, the remaining predictive power after removing wind inputs suggests that sea clutter characteristics and radar operating parameters also carry independent directional information.
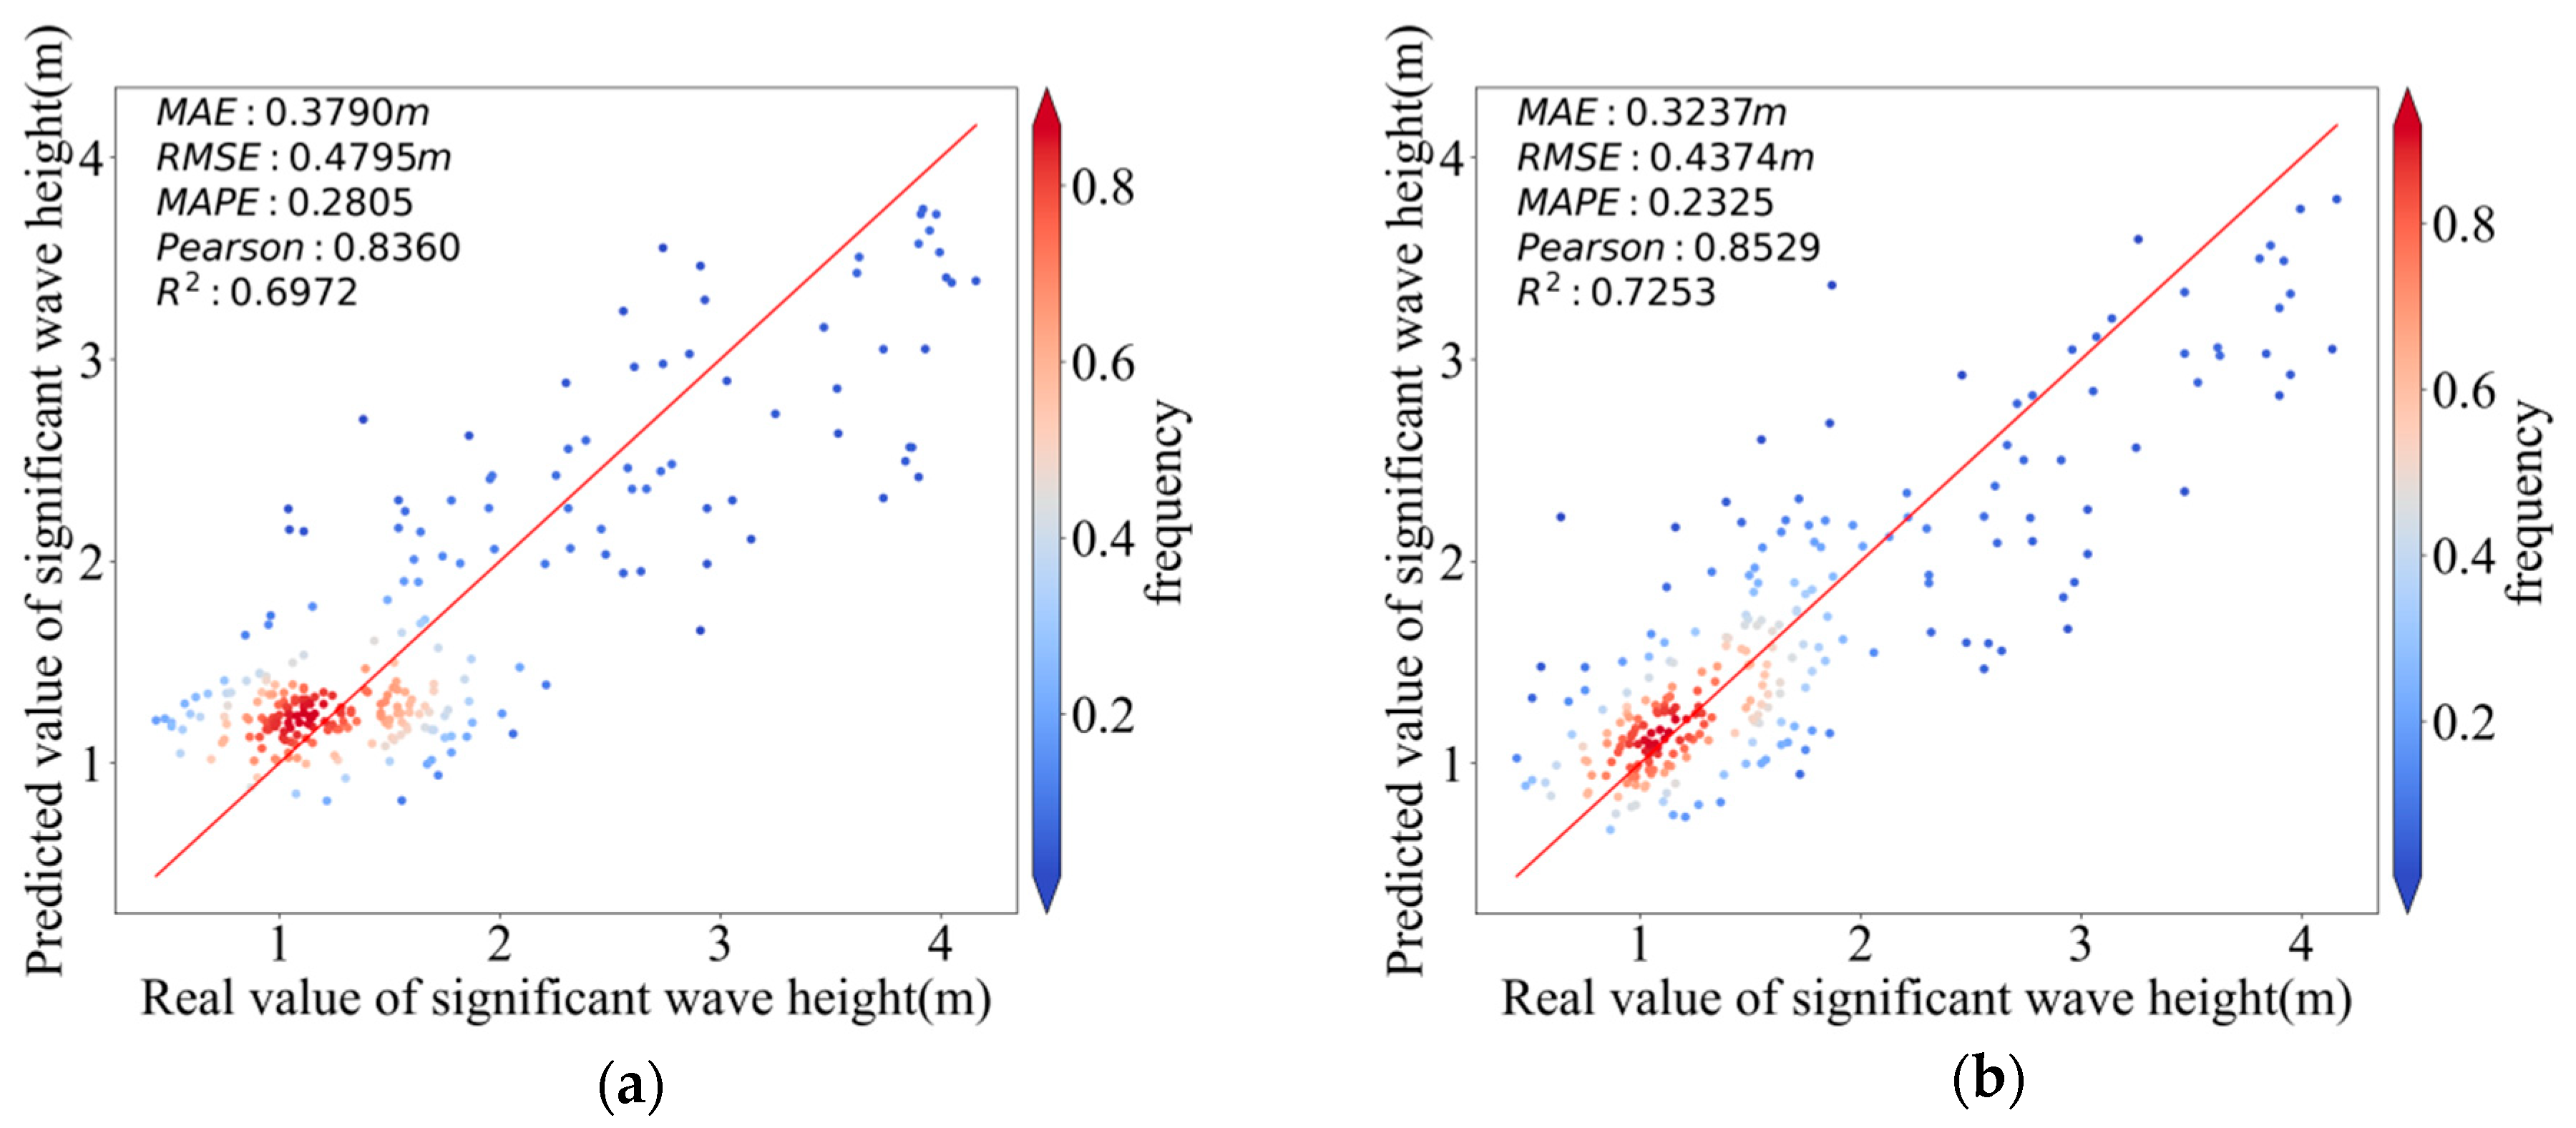
For significant wave height, the model using only wind parameters achieves an R
2 of 0.697, whereas the model excluding wind parameters achieves an R
2 of 0.725, as shown in
Figure 6. This modest difference indicates that the non-wind features contribute slightly more predictive information than the wind parameters alone. However, neither feature group is sufficient on its own. Combining the wind and non-wind features increases the R
2 to 0.860. These results indicate that the two feature groups provide complementary information and that their fusion is important for accurate significant-wave-height retrieval.
For mean wave period, the contributions appear more balanced but relatively modest overall. The model with only wind parameters achieves an R2 of 0.449, while excluding wind parameters yields an R2 of 0.473. The overall low R2 values across both configurations indicate that mean wave period is inherently more difficult to retrieve from either wind inputs or sea clutter features alone. This is physically reasonable because wave period is governed by a broader range of factors including fetch, duration, and swell propagation from distant storms, which are not fully captured by local wind conditions or instantaneous sea clutter measurements.
In summary, the ablation analysis indicates that the relative contributions of wind parameters and non-wind features vary across the three wave parameters. Wind information contributes more strongly to relative wave direction. For significant wave height, the non-wind features provide slightly better performance than wind parameters alone, whereas combining the two feature groups improves performance compared with using either group alone. For mean wave period, the two feature groups exhibit comparable but relatively limited predictive capabilities. Therefore, the ablation analysis validates the complementary value of wind parameters, sea-clutter characteristic parameters, and radar operating parameters in wave parameter retrieval. Jointly feeding these parameters into the network helps achieve more robust and comprehensive retrieval results.
5.3. Effect of the Multi-Task Loss Function
To evaluate the effectiveness of the multi-task uncertainty-weighted loss function, we conducted a comparative experiment in which this loss was replaced by a standard equally weighted mean squared error loss while keeping all other configurations identical. The results obtained without the multi-task loss are summarized in
Table 7, whereas the corresponding results with the multi-task loss are those reported for the ResNet–Transformer model in
Table 4 in
Section 4.
Figure 7 presents some of the prediction result plots obtained without the multi-task loss.
A direct comparison between the predictions without the multi-task loss, and those with the multi-task loss, which are reported in
Table 4, reveals that the multi-task loss consistently improves the inversion accuracy for all three wave parameters. For relative wave direction, the multi-task loss reduces the root mean squared error by approximately 6.4% and increases the coefficient of determination by nearly 0.031 relative to the equally weighted baseline. For mean wave period, the R
2 increases from 0.621 to 0.654. For significant wave height, the multi-task loss also yields a clear gain, lowering the mean absolute error and enhancing the Pearson correlation coefficient.
These improvements confirm that the homoscedastic-uncertainty weighting mechanism can automatically balance the contributions of each regression branch according to their intrinsic difficulties, thereby avoiding the need for manual tuning of loss weights. This is particularly important because the three target parameters have different physical scales and exhibit different sensitivities to the input features. The observed performance enhancement demonstrates that the multi-task loss function is a valuable component of the proposed framework, enabling the network to allocate appropriate attention to each parameter and thus achieve a better validation performance under the present experimental setting.
5.4. Limitations and Future Research
Although the proposed network achieves satisfactory performance on the current dataset, several limitations remain to be addressed in future research.
The sea clutter data used in this study were all collected from specific sea areas of China. The wave evolution mechanisms in other sea areas, such as open oceans or regions with significantly different tidal regimes, may differ considerably from those in the coastal waters considered here. The generalization capability of the current model across different sea areas has not been fully validated. Future work should collect sea clutter data from multiple sea areas with diverse oceanographic conditions to evaluate the cross-region adaptability of the model.
Given the current limited number of samples and the short data acquisition period, we plan to collect additional experimental data, expand the test conditions, and include data with small grazing angles in the future. With sufficient data, we will rigorously partition the dataset by different years to further enhance the model’s generalization performance.
Furthermore, the present experiments were conducted with only a single radar system. Different radar configurations, including operating frequency, waveform parameters, and hardware characteristics, may produce distinct clutter signatures that affect inversion performance. The transferability of the proposed method to other radar systems requires further investigation.
In summary, while the proposed method demonstrates good potential for wave parameter inversion from tower-based non-scanning radar data, further efforts are needed to enhance its generalization capability, robustness, and accuracy across diverse conditions and radar configurations.
6. Conclusions
At present, shipborne radar, satellite radar, and high-frequency radar are mostly used to invert wave parameters based on radar echo data. There are few studies on inversion based on tower-based non-scanning radar. To expand the approaches for wave parameter inversion using tower-based non-scanning radar, this paper proposes a method to invert wave parameters based on one-dimensional range time-series echo data. This method is based on a deep learning network and uses radar echo characteristic parameters, wind parameters, and radar operating parameters to invert and obtain wave parameters, which expands the wave parameter inversion approach. The ResNet–Transformer network model proposed in this paper shows superior performance in the three output parameters of relative wave direction, mean wave period, and significant wave height. Compared with the DNN model, the MAE of the relative wave direction inversion is reduced by 34.5%, the RMSE is reduced by 29.1%, and the R2 is increased by 45.6%. The MAE of the mean wave period inversion is reduced by 40.5%, and the RMSE is reduced by 38.9%. The MAE of the significant wave height inversion is reduced by 27.6%, the RMSE is reduced by 30.7%, and the R2 is increased by 31.7%. These results show that the proposed network model achieves good results in all three parameters, especially in relative wave direction and significant wave height. In terms of actual measurement accuracy verification, the root mean squared error of the relative wave direction, the root mean squared error of the mean wave period, and the significant wave height root mean squared error of the final inversion based on the measured dataset are 24.4°, 0.5 s, and 0.3 m, which can achieve high-precision inversion.
In summary, the ResNet–Transformer hybrid network model architecture proposed in this paper can effectively utilize the characteristic parameters, radar operating parameters and wind parameters of microwave band tower-based radar echo data to achieve high-precision inversion of sea surface wave parameters. In order to study the applicability of the model in different sea states, this paper further conducts in-depth data analysis of the inversion results under different sea states. The verification results show that the model can achieve good results in different sea states. Therefore, the hybrid network model studied in this paper provides a reliable technical approach for wave measurement under complex sea states.
Nevertheless, the current model’s generalizability across different sea areas, low grazing angle conditions, and diverse radar configurations remains to be validated. Future work will focus on collecting multi-region and multi-system data to further improve its robustness and applicability.