


Highlights
What is the main finding?
- Adopting a “forward-time search and backward-time verification” framework, this study constructs a warm-season (March–September) convection initiation (CI)-labeled dataset spanning 2018–2023 for central and eastern China based on weather radar observations, which contains around 25.6 million grid points labeled with identified CI occurrences.
What are the implications of the main finding?
- The convection initiation (CI)-labeled dataset supplies realistic, high-quality and long-term CI samples to train artificial intelligence models for CI identification and nowcasting, further improving the nowcasting and early warning performance for severe convective weather.
Abstract
Advances in artificial intelligence models offer promising approaches for intelligent convection initiation (CI) identification—a critical step in severe weather nowcasting—thereby driving demand for high-quality, long-term labeled datasets. Accordingly, this study develops a CI identification technique using quality-controlled, gridded composite reflectivity data from the weather radar and CMA global atmospheric reanalysis wind data over central-eastern China (2018–2023) to construct a labeled dataset. The proposed CI identification method integrates a “forward-time search and backward-time verification” strategy, which involves three key steps: screening grid points with absent or weak convection; monitoring these points for convective development within 30 min; and finally, confirming the first occurrence of convection. Additionally, quality control is applied to eliminate the influence of outliers and anomalous radar data. The resulting dataset constructed from 829 severe convective processes comprises ~25.6 million grid points labeled for CI occurrences at one or more lead times of 10, 20, or 30 min to resolve spatiotemporal evolution. Of these, 71.90% are accompanied by surface weather phenomena. This study provides a reliable dataset to support the learning of intelligent identification and nowcasting models for CI events. Furthermore, based on this dataset, the spatiotemporal distribution characteristics of warm-season CI over central-eastern China are delineated.
1. Introduction
Severe convective weather—encompassing short-term heavy rainfall, thunderstorm gales, hail, tornadoes, and squall lines—is characterized by its abrupt onset and high destructive potential. It poses a significant threat to public safety, infrastructure, and socio-economic stability [1,2,3,4]. Nevertheless, the nowcasting of such events remains a core challenge in meteorology. Convection Initiation (CI), defined as the formal triggering of convective activity [5], serves as a critical precursor. Its accurate identification is essential for improving the nowcasting performance for severe convective weather [6,7,8,9].
The small spatial scale and rapid evolution of nascent convection pose significant challenges for conventional observational methods in effectively monitoring CI. In contrast, high spatiotemporal-resolution observations from geostationary satellites and weather radar networks are particularly well suited for detecting CI [10,11]. Satellite data provides valuable information regarding cloud-top brightness temperature, cloud area, and phase; consequently, it can reflect the temperature and height variations in convective clouds, allowing CI identification through the setting of thresholds [10,12,13,14]. It is widely used in CI nowcasting, such as utilizing Geostationary Operational Environmental Satellite data to combine cloud-top cooling rates and type–phase trends, or to track convective movements via monitoring the key infrared convective cloud fields [13,15,16]. However, since these observations primarily focus on convective cloud information, current satellite-based CI identification applied to forecasting may suffer from a high false alarm rate. Furthermore, brightness temperature observations are also subject to uncertainties arising from cloud-top phase, micro-physical properties, and cloud overlap, which consequently affects CI identification [11].
Radar-based CI identification leverages high-resolution weather radar to detect convective echoes based on thresholds related to their intensity and structural evolution [11]. Many studies operationally define CI as the moment when radar composite reflectivity (CR) first reaches or exceeds 35 dBZ or 40 dBZ [17,18,19,20]. Determining whether convection is occurring for the “first time” can be achieved by tracking storms and recording their initial detection time [21,22,23] or by examining the spatiotemporal neighborhood surrounding a convective cell to identify whether any pre-existing convection exists in the vicinity [19,20,24,25]. For most relevant studies targeting specific regions and seasons, the spatiotemporal window adopted to diagnose prior convection activity is generally assigned a fixed value, which is empirically determined according to the geographic domain and season under investigation. Furthermore, based on radar-identified CI events, statistical analysis shows that CI occurs more frequently over mountainous terrain, with a seasonal maximum during summer and a diurnal peak in the afternoon [20,23,26,27].
The rapid advancement of artificial intelligence (AI) has spurred its growing application in severe weather nowcasting, as well as in the identification and tracking of convective systems [28,29,30,31,32]. Existing studies have constructed AI frameworks to detect and forecast CI using meteorological satellite data [33,34], and further research reveals that models integrating satellite and radar observations deliver substantially better predictive performance than those relying solely on a single data source [35]. Generative reasoning models, a significant branch of AI, offer new approaches for the intelligent identification and nowcasting of convective systems. Consequently, developing high-quality, long-term labeled datasets that accurately capture the initiation of convective systems—to support the learning of intelligent identification and nowcasting models for CI events—has become an urgent priority. Furthermore, given China’s vast territorial extent and complex climatic conditions, convective weather exhibits distinct regional and seasonal variations, thus the CI-labeled dataset ought to possess broad spatiotemporal coverage to fully encompass these diverse characteristics. Weather radar observations, which provide ground truth information on the actual occurrence of CI based on convective cells and offer extensive spatial coverage along with high spatiotemporal resolution, provide a robust data foundation for constructing such datasets.
Based on CR from the weather radar network and background wind data over central-eastern China, this study investigates techniques for the dynamic identification of CI events, which demonstrate broad spatiotemporal applicability and are thus suitable for diverse geographic regions and varying meteorological conditions. Utilizing this technique, we constructed a labeled CI event dataset for the warm seasons from 2018 to 2023 over central-eastern China. To prevent false information from affecting AI model learning, the dataset construction prioritized sample accuracy, emphasizing quality over quantity in the labeling process. Additionally, statistical analyses were performed on the accompanying weather phenomena and occurrence frequency of CI events.
The remainder of this paper is organized as follows. Section 2 describes the data used in this study and the CI identification method. Section 3 presents selected CI cases as well as the statistical characteristics of all CI events identified in this study. Section 4 presents a description of the generated CI-labeled dataset. Finally, Section 5 discusses the key findings, and Section 6 summarizes the study.
2. Data and Method
2.1. Data
This study utilizes gridded CR data products derived from the weather radar network over central and eastern China (20–40°N, 104–125°E) during the warm seasons (March–September) between 2018 and 2023 to label CI events. In constructing this data product, systematic quality control procedures were applied to the raw radar base data. These include: removal of noise (e.g., isolated points), elimination of radial electromagnetic interference echoes, filtering of non-meteorological echoes such as ground clutter, anomalous propagation (super-refraction), and sea wave clutter, suppression of clear-air echoes, and velocity de-aliasing. Missing and abnormal radar data are excluded from mosaic processing. The resulting gridded CR product has a spatial resolution of 0.01° × 0.01° (covering a 2001 × 2101 grid) and a temporal resolution of 10 min. To ensure quality and continuity, radar data over the ocean and outside the China boundary were excluded, resulting in a final retention of approximately 2.8 million grid points. In addition, manual inspection was also conducted on the radar mosaic.
Furthermore, to characterize the background wind conditions of convective systems, this study extracts the zonal and meridional wind components at three key isobaric levels (850 hPa, 700 hPa, and 500 hPa) from the CMA Global Atmospheric Reanalysis Version 1.5 [36]. The three-layer averaged wind is adopted to characterize the steering flow of convective systems, thereby endowing the identification method with stability and general applicability across different convective system types, geographical regions, and seasons. The wind data are provided at a 0.1° × 0.1° spatial resolution and an hourly temporal resolution.
To improve CI identification accuracy and computational efficiency, the Severe Convective Weather Dataset for AI application (SCWDS) [37] was referenced to locate convective systems, from which processes of short-term heavy rainfall, thunderstorm gales, and hail events were extracted. For each process, the time window was expanded to include 2 h before the start time and 1 h after the end time, and the radar data within these corresponding periods at 10 min intervals were used for CI identification. During the period from 2018 to 2023, a total of 131,818 valid time steps across 829 severe convective processes were finally adopted for the CI identification. In addition, hourly observational data from automatic weather stations are used to match corresponding weather phenomena after CI genesis, so as to validate CI identification results and support dataset reliability evaluation.
2.2. CI Identification Method
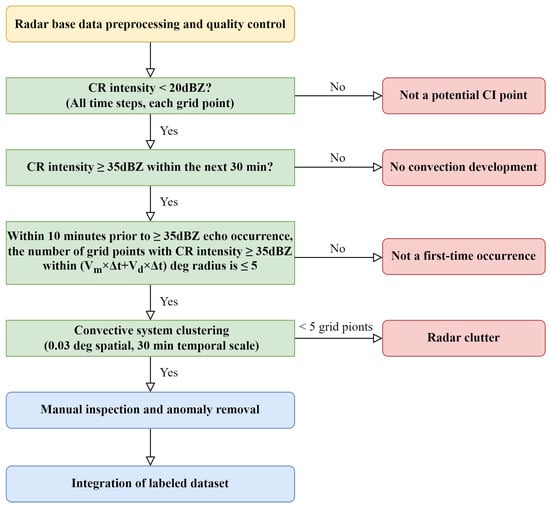
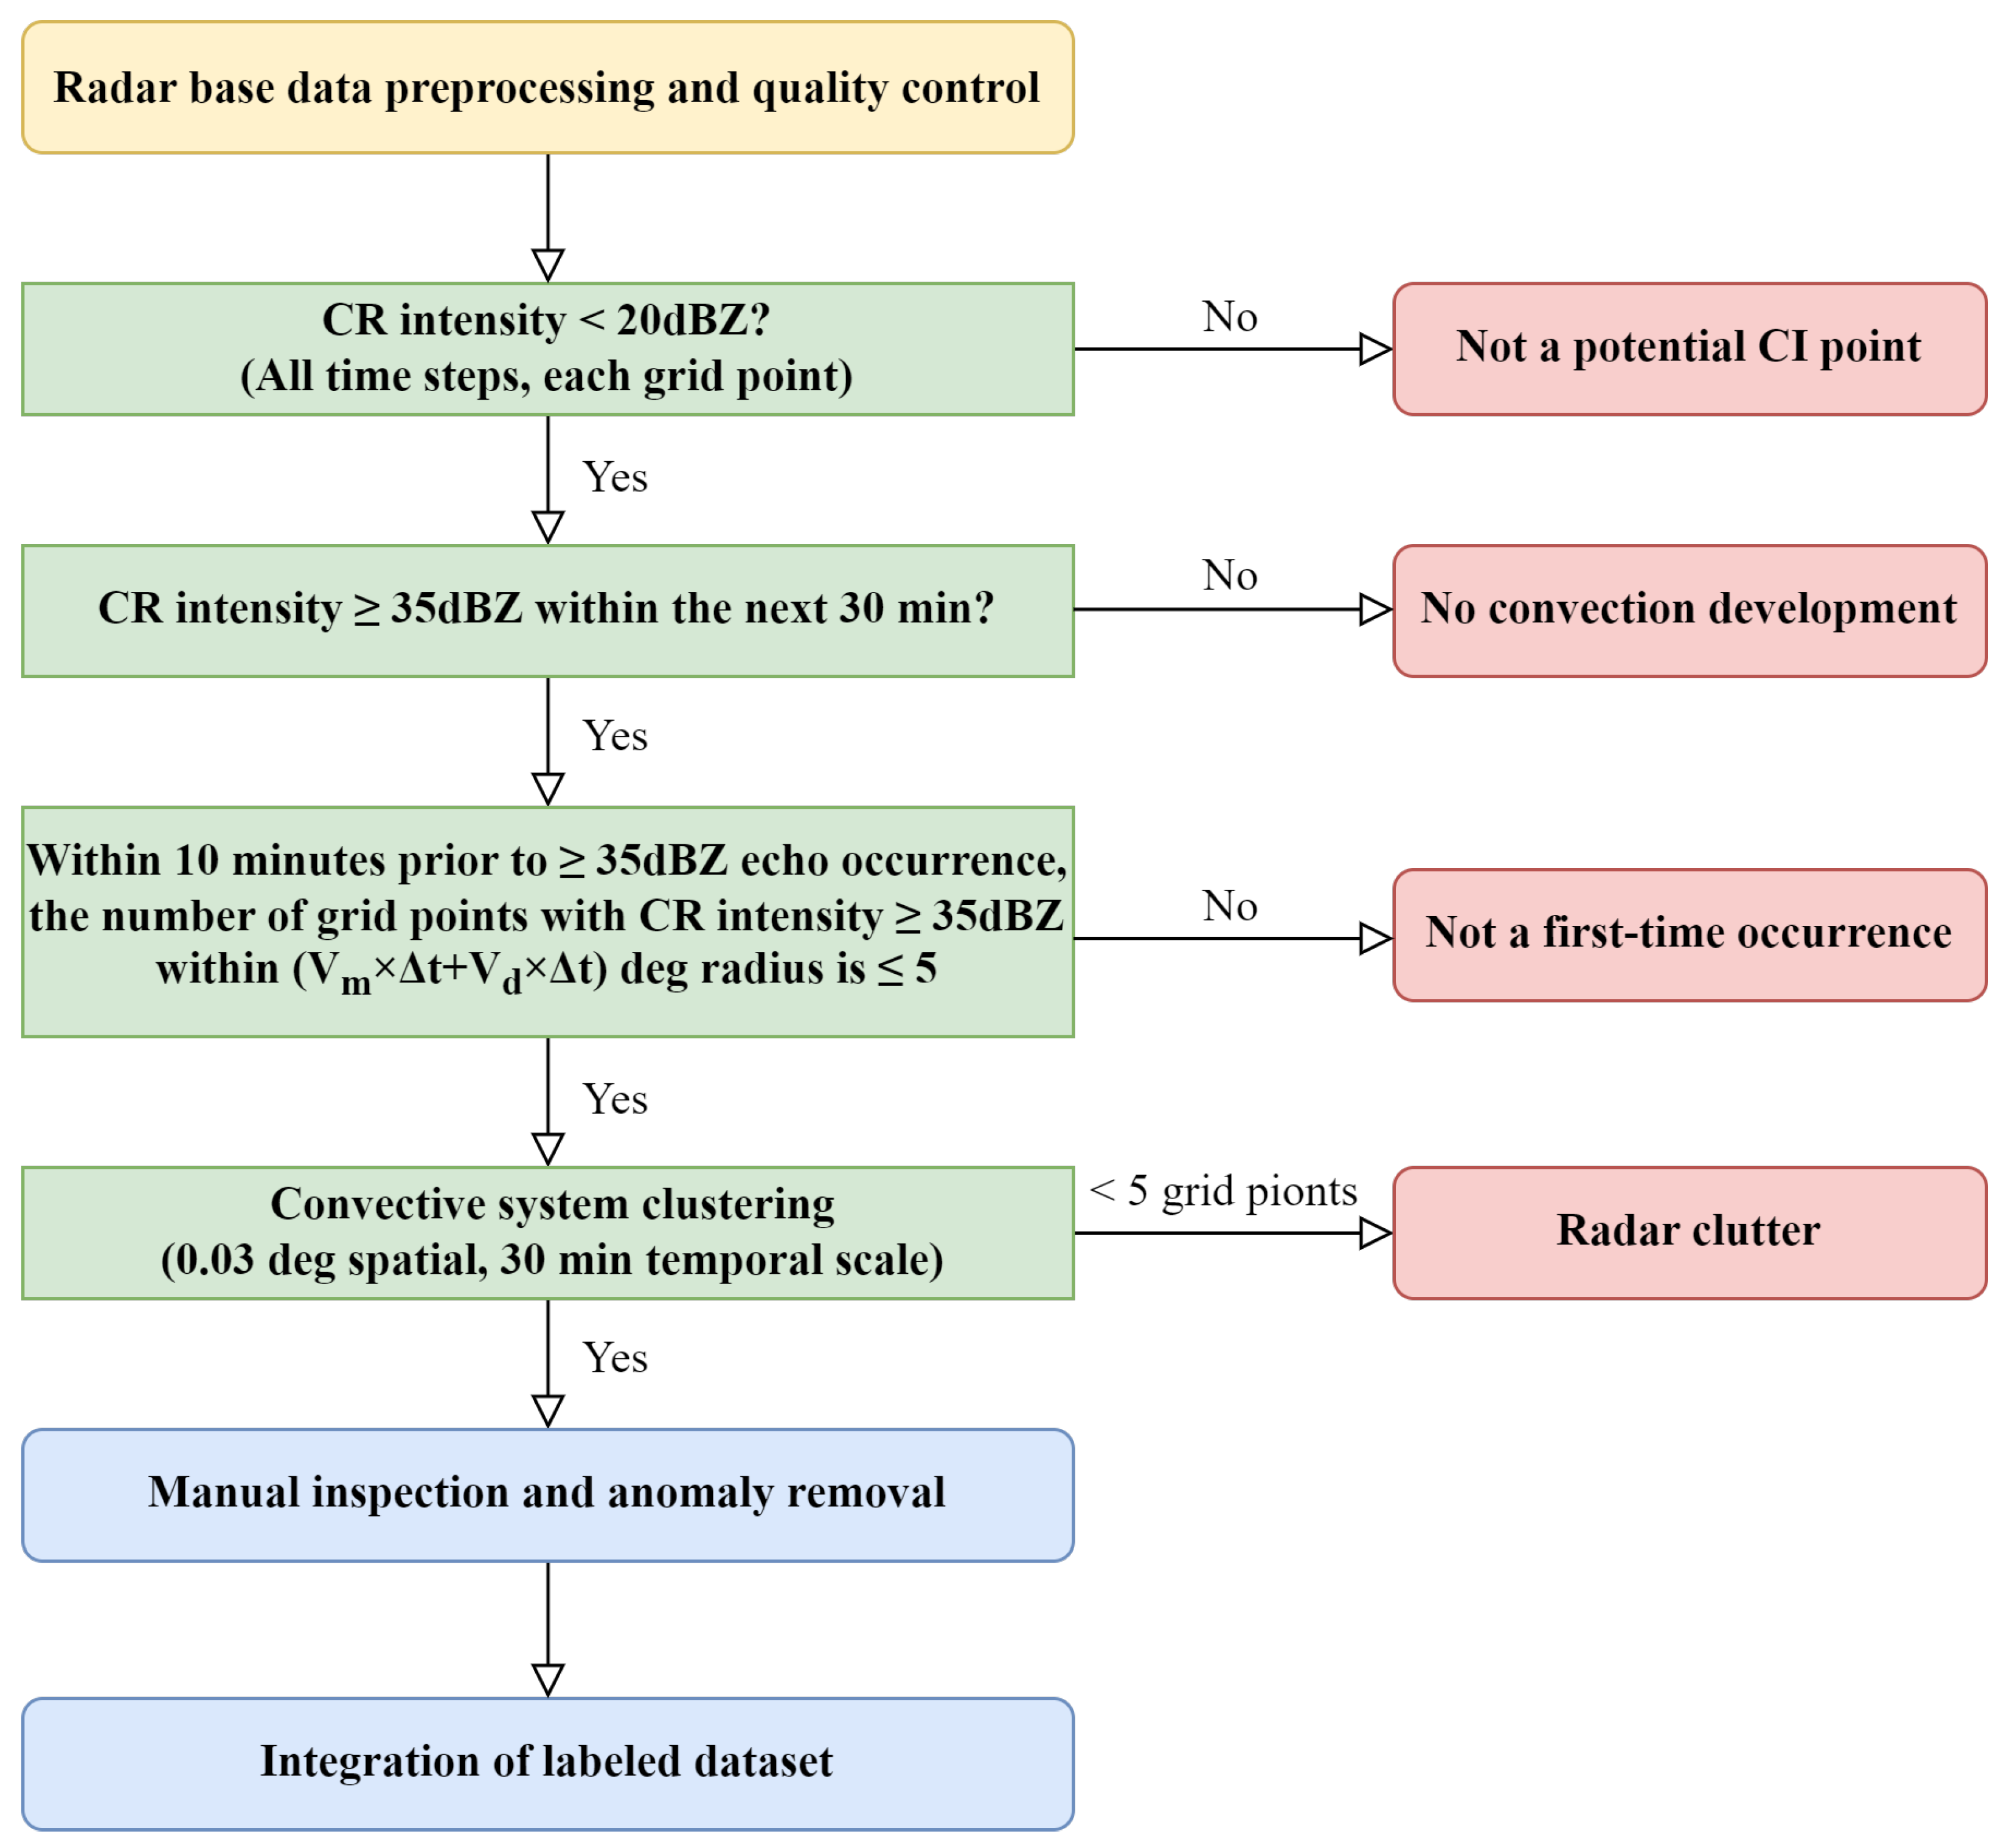
Based on weather radar data and meso-scale wind fields, this study develops a CI event identification algorithm by integrating forward-time search and backward-time verification. The algorithm is adopted to build a CI-labeled dataset that captures the spatiotemporal evolution features of CI. The specific workflow is illustrated in Figure 1.
Figure 1.
Convection initiation (CI) Identification Algorithm Flowchart.
- (1)
- Preprocess and conduct quality control on time-series radar data corresponding to severe convective cases in SCWDS.
- (2)
- Identify grid points with no convection or weak convection. For each grid point, if the CR intensity at time T0 is less than 20 dBZ, that grid point (i, j) is designated as a potential convection starting point.
- (3)
- Determine whether convection develops within the next 30 min. Examine the CR intensity at grid point (i, j) at the three subsequent time steps—T1 = T0 + 10 min, T2 = T0 + 20 min, and T3 = T0 + 30 min. If the CR intensity reaches or exceeds 35 dBZ at any of these times, convection is considered to have occurred at that grid point [25,38,39].
- (4)
- Determine whether the convection is a first-time occurrence. For any grid point (i, j) where the CR intensity reaches or exceeds 35 dBZ, a backward-in-time check is performed over the preceding 10 min to assess whether organized strong echoes already existed in its vicinity. Taking into account both the steering influence of the environmental wind field on convective system motion and the intrinsic development of the system, the inspection area is defined as a square centered on the target grid point with a side length of 2 × (Vm × Δt + Vd × Δt) deg. Here, Δt denotes the time interval (10 min). Vm denotes the three-layer averaged environmental wind speed, which is regarded as the steering flow, expressed in deg per 10 min. For this variable, the approximation that 1 km/10 min corresponds to 0.01 deg/10 min is adopted. Since the background wind field varies relatively slowly, hourly mean values are used to characterize environmental winds within each hour; that is, the same hourly mean value is applied for all 10 min discrimination results in the hourly window. And Vd represents the convective system’s intrinsic development speed. Given that thunderstorm cells typically span tens of kilometers and their developing stage usually lasts from about 10 min to half an hour [40], a relatively rapid development speed of approximately 0.1 deg per 10 min is adopted in this study. If, within this defined spatial region and at the time 10 min earlier, there are no more than 5 grid points with CR intensity ≥ 35 dBZ, the event is classified as a initiated (first-time) convection.
- (5)
- Convective system clustering and removal of radar clutter effects. After identifying initial convective grid points, the detected convective systems are clustered using the DBSCAN algorithm [41], which groups together grid points exhibiting strong convection within a spatial radius of 0.03 deg and a temporal window of 30 min into the same convective system. Clusters containing fewer than 5 grid points are discarded to mitigate the influence of radar ground clutter, thus enhancing the accuracy and reliability of the identification results.
- (6)
- Manual inspection and anomaly removal. To ensure the quality of the final CI-labeled dataset, the spatial statistical characteristics of CI frequency from 2018 to 2023 were analyzed on a year-by-year basis. It was identified that long-term radar data anomalies often manifest as large-scale clustered points in the spatial distribution map. To address this, the DBSCAN algorithm was applied to cluster grid points with an annual CI frequency greater than 10, and records corresponding to clusters containing more than 60 members were subsequently excluded. Furthermore, a spatial alignment check was performed: if grid points with an annual CI frequency greater than 10 formed dense, continuous straight lines along either the longitudinal or latitudinal directions, the associated records were also removed. Over the six-year period, CI records at a total of 80,095 grid points were removed.
- (7)
- Integration of labeled dataset. To accommodate forecasting requirements at different lead times, CI identification results are separately generated for events expected to occur within the next 10, 20, and 30 min, constructing a labeled CI dataset with spatiotemporal evolution features.
2.3. Parameter Sensitivity Test
During the construction of the CI identification algorithm, random cases were initially selected to validate the method’s performance. Whenever missed detections or false alarms were observed during the validation phase, an analysis of the underlying causes was conducted, and the relevant parameters were iteratively adjusted to optimize the algorithm’s accuracy (Table 1). The specific parameter values determined through this iterative optimization process have been described in Section 2.2.
Table 1.
Parameter configurations of the five test groups and the number of grid points identified with Convection initiation (CI) occurrence during the randomly selected periods.
To evaluate the sensitivity of the identification results to the convective system’s intrinsic development speed (Vd) in Step 4, three sets of tests are conducted using data from two randomly selected periods: 10:10 on 8 April 2019 to 23:20 on 9 April 2019, and 06:10 on 12 August 2019 to 06:40 on 13 August 2019. In these tests, Vd was set to 0, 0.05 deg/10 min, and 0.1 deg/10 min, respectively. The results show that as the value of Vd increases, the number of grid points identified as undergoing CI gradually decreases.
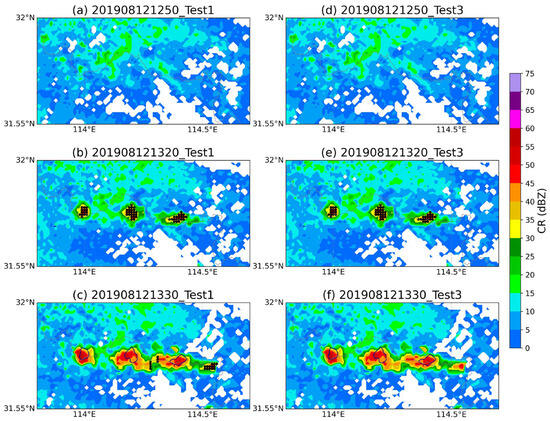
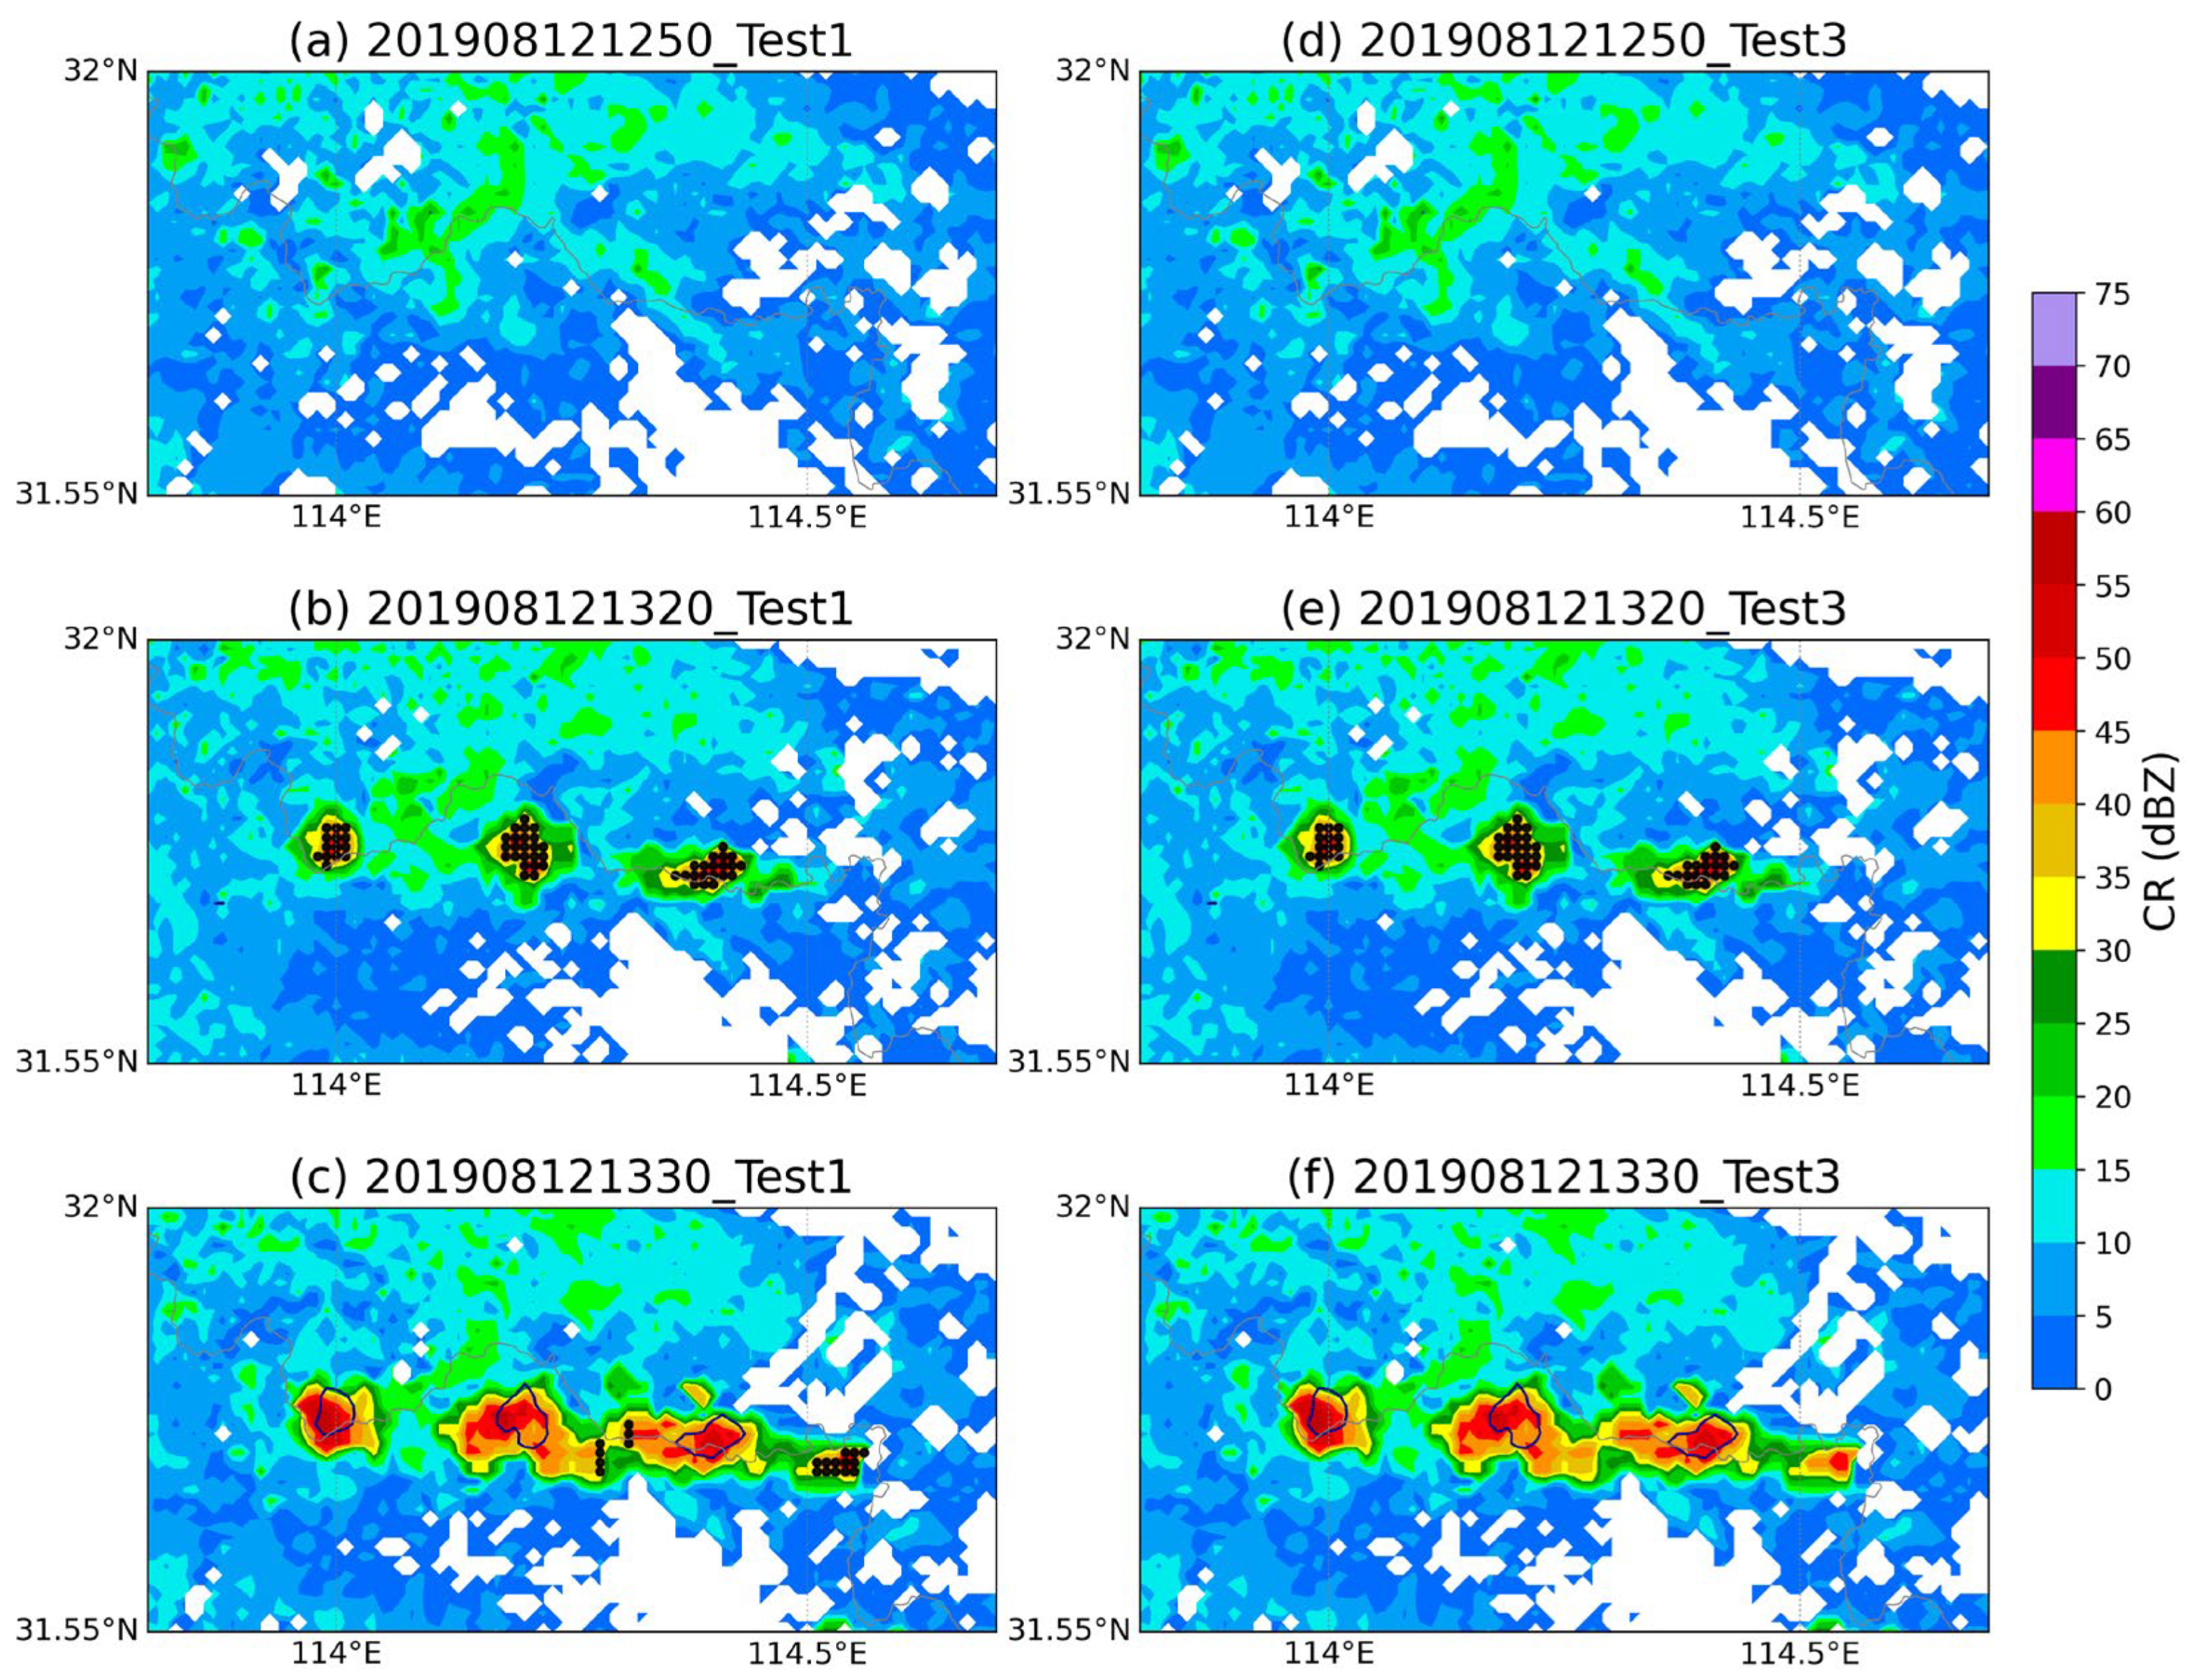
However, setting a relatively fast system development speed (0.1 deg/10 min) effectively reduces the interference from convective system movement and development. For example, in Test 1, no large-scale strong echoes (>20 dBZ) were observed in the target region at 15:50 on 12 August 2019 (Figure 2a), or in the following 20 min. At 13:20, echoes exceeding 35 dBZ emerged for the first time, leading to a successful CI identification by the Test 1 method (Figure 2b). Yet, as the convective system developed, this method redundantly flagged the surrounding areas of the initially identified thunderstorm cell at 13:30 (Figure 2c). A similar issue arose in Test 2. This may be attributed to the setup of the systematic strong echo screening range, which accounted for the movement of the convective system but overlooked its internal development or utilized a setting for development speed that was too low. In contrast, Test 3 accurately identified the initial emergence of strong echoes at 13:20 on 12 August 2019, and successfully prevented redundant marking at the cell’s edges at 13:30 (Figure 2d–f). Consequently, 0.1 deg/10 min was ultimately selected as the convective system’s intrinsic development speed.
Figure 2.
Radar composite reflectivity (CR) mosaics at (a,d) 12:50, (b,e) 13:20, and (c,f) 13:30 on 12 August 2019, and the identified CI grid points (black markers) via the Test 1 (left panels) and Test 3 (right panels) methods. Dark blue contours denote the 35 dBZ echo regions at 10 min prior.
In Step 4, the sensitivity of the grid point threshold (defined as CR intensity ≥ 35 dBZ at the time 10 min earlier) was evaluated by testing values of 5 (Test 3) and 10 (Test 4). It was indicated that as the grid point threshold increases, the number of grid points identified with CI occurrences accordingly. However, the identification performance for typical cases was not significantly altered by this variation. To maximize the exclusion of antecedent strong echoes, the more conservative threshold of 5 grid points was ultimately adopted.
In Step 5, the DBSCAN algorithm parameters—specifically the spatial radius and the minimum number of grid points required to retain a cluster—were set to 0.03 deg with 5 points (Test 3) and 0.05 deg with 4 points (Test 5) for comparative testing. It was indicated that while an increase in radius and a decrease in the minimum point threshold led to a larger number of identified CI grid points, no significant difference was observed in the identification of typical cases. Consequently, the combination of 0.03 deg and 5 points was ultimately adopted for its stricter requirements regarding spatial continuity and its superior capability in noise filtering.
Based on the parameter sensitivity tests conducted across the CI identification workflow, relatively strict configurations were ultimately adopted for all key parameters. Although such stringent settings might lead to the omission of CI events, prioritizing the authenticity and reliability of the labeled dataset was deemed crucial. This approach was adopted to prevent erroneous inputs or noise from compromising the AI model training quality.
3. Results
In subsequent case studies and statistical analyses of CI events in this study, the different lead-time identification results described above are integrated and deduplicated. When multiple CI identifications correspond to the same future event at a given grid point (e.g., “CI occurring in 30 min” identified at T0, “in 20 min” at T1, and “in 10 min” at T2), only the earliest record (i.e., the identification made at T0) is retained. This ensures uniqueness of the data used in analyses. Ultimately, a total of approximately 25.6 million grid points experiencing CI events are used for statistical analyses.
3.1. Case Analysis
To further evaluate the practical performance of the CI identification method based on weather radar proposed in this study, three typical severe convective weather events were selected for case analysis.
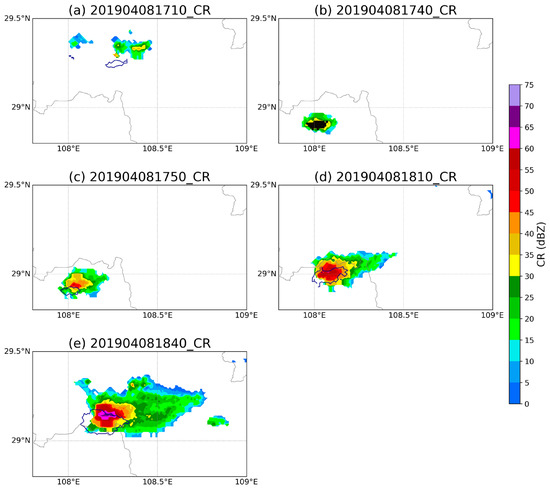
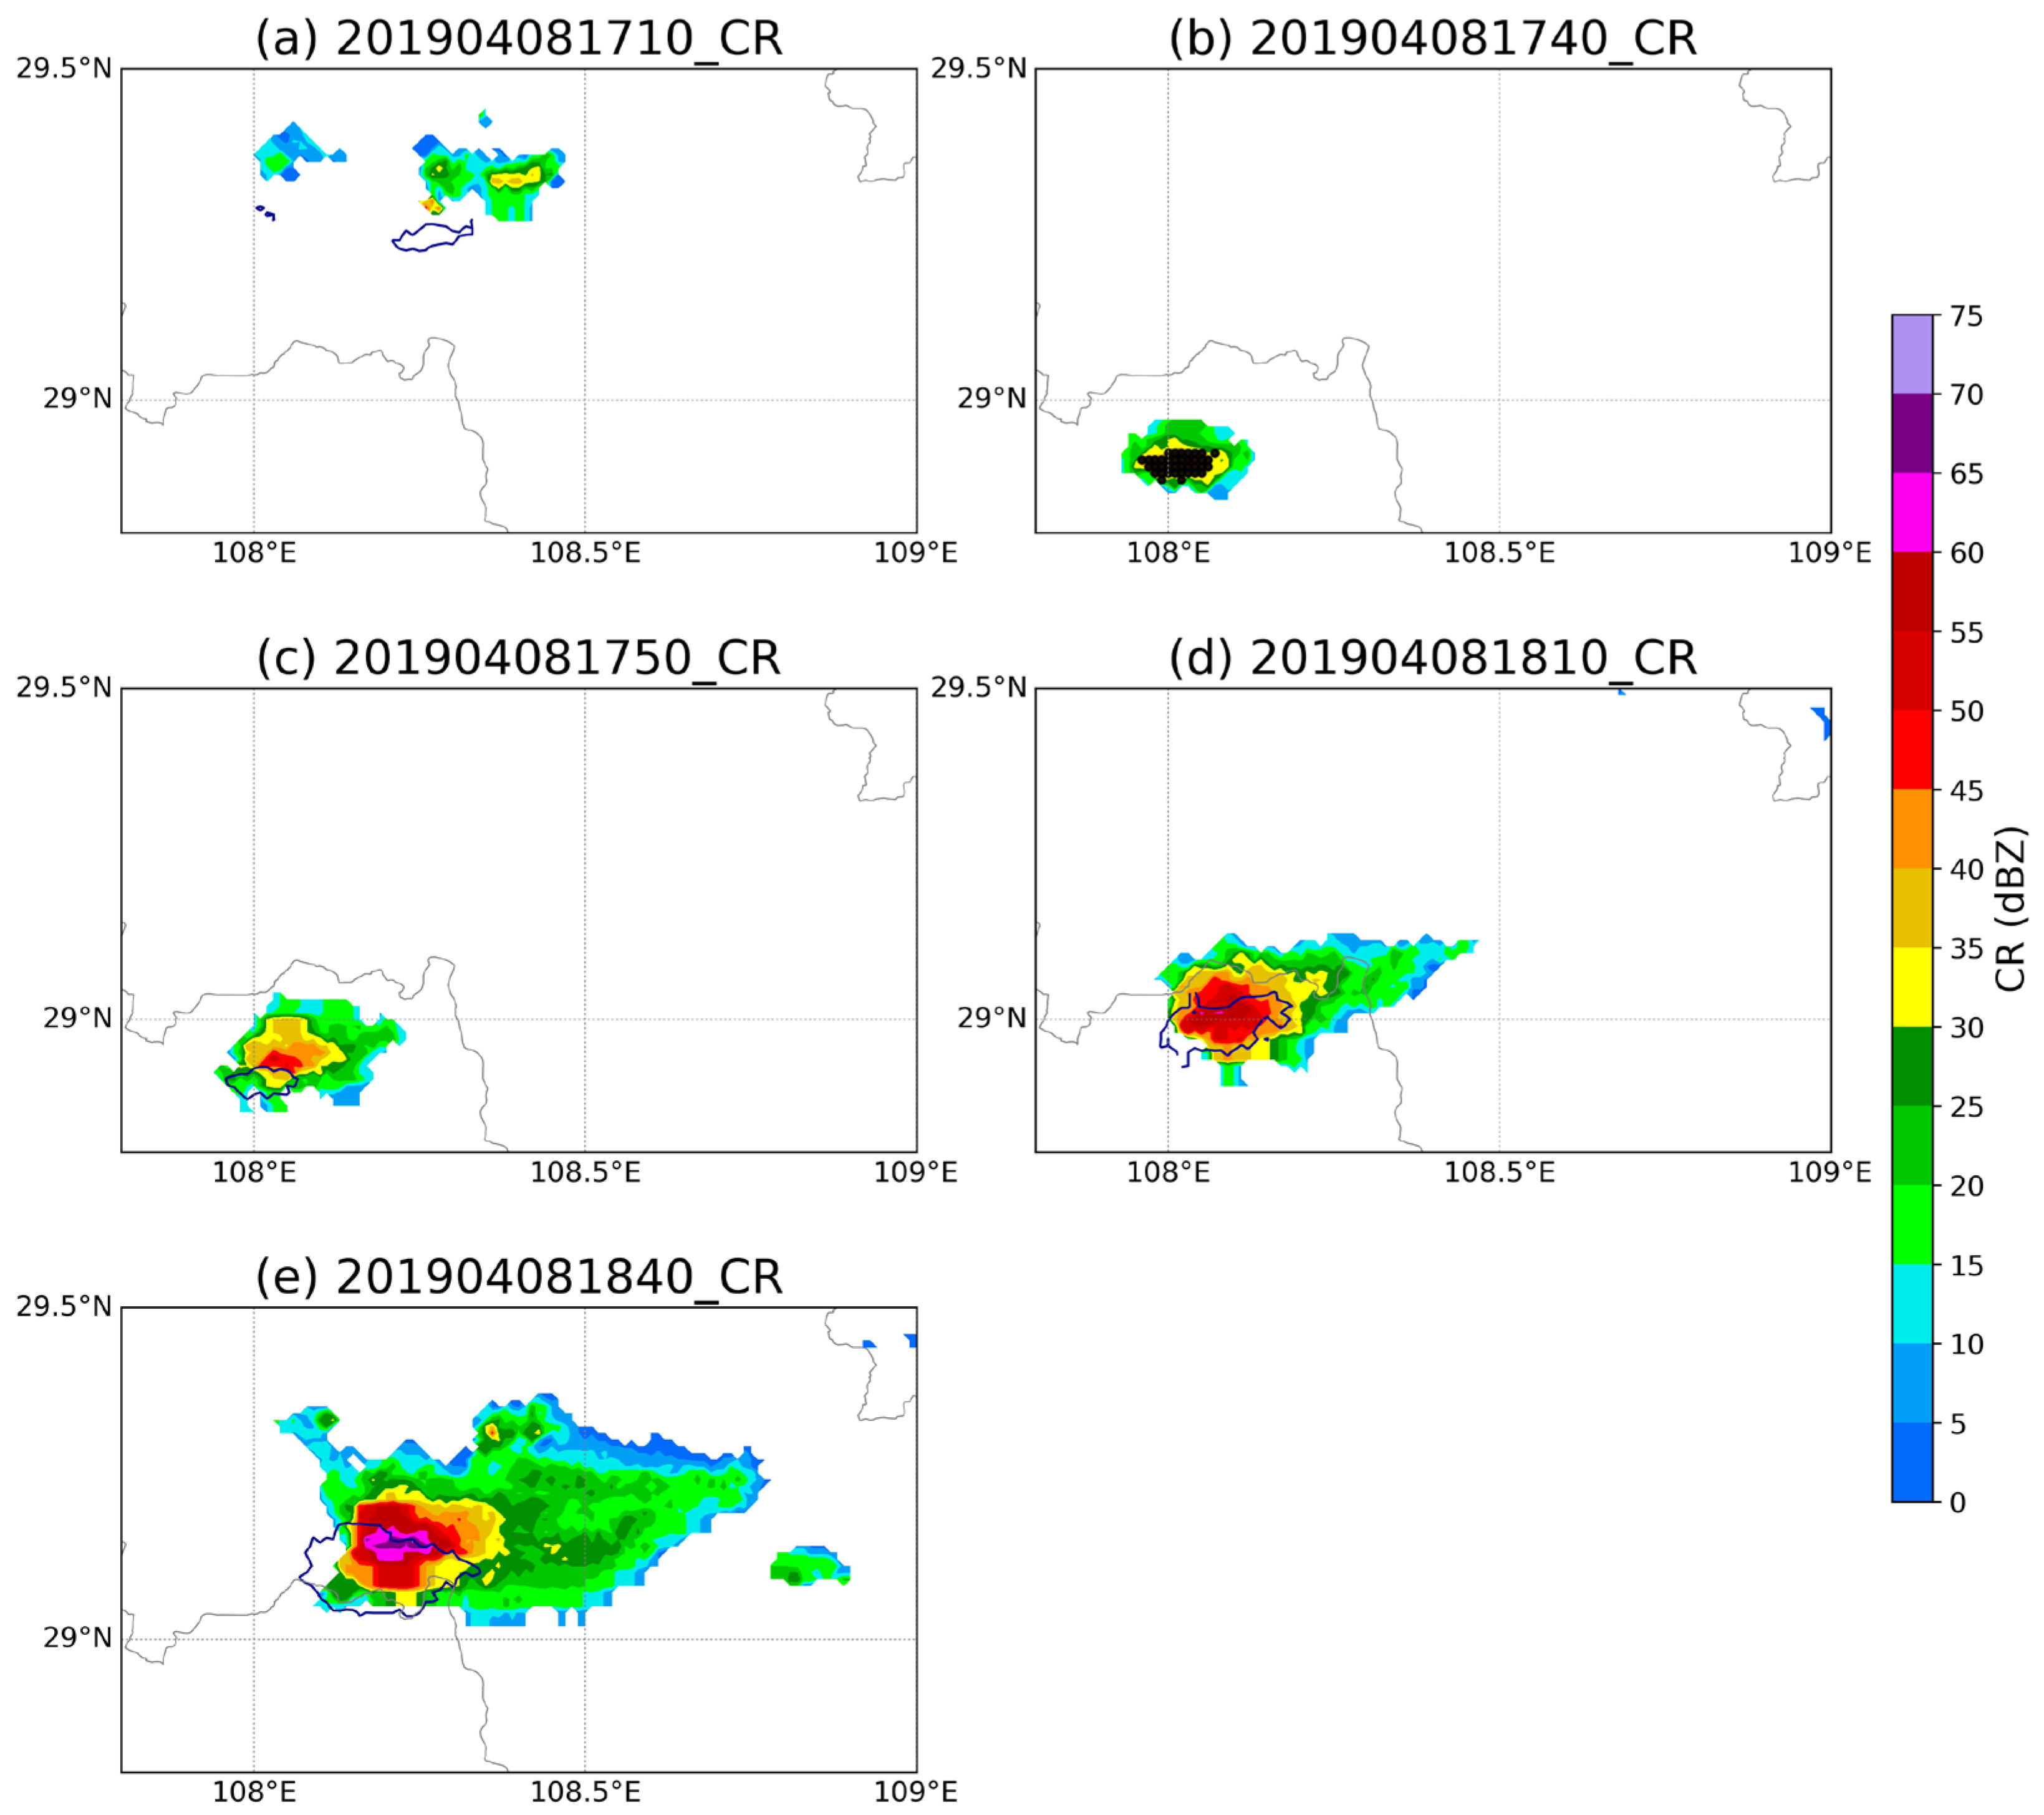
At 17:40 on 8 April 2019, the proposed method identified a CI event in northeastern Guizhou (Figure 3b). Subsequently, the convective system continued to develop and rapidly intensified; by 18:40, the maximum radar reflectivity reached 65 dBZ, indicating intense convection (Figure 3). This demonstrates that the proposed method can effectively capture the initial signal of convection in this case, and provide an early warning basis for the subsequent development of severe convective weather.
Figure 3.
Radar CR mosaics at (a) 17:10, (b) 17:40, (c) 17:50, (d) 18:10, and (e) 18:40 on 8 April 2019, and the identified CI grid points (black markers). Dark blue contours denote the 35 dBZ echo regions at 10 min prior.
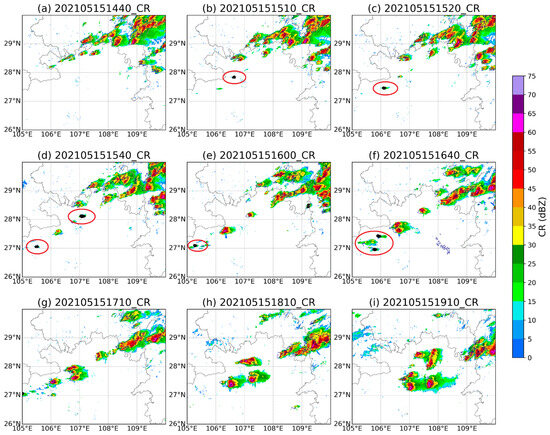
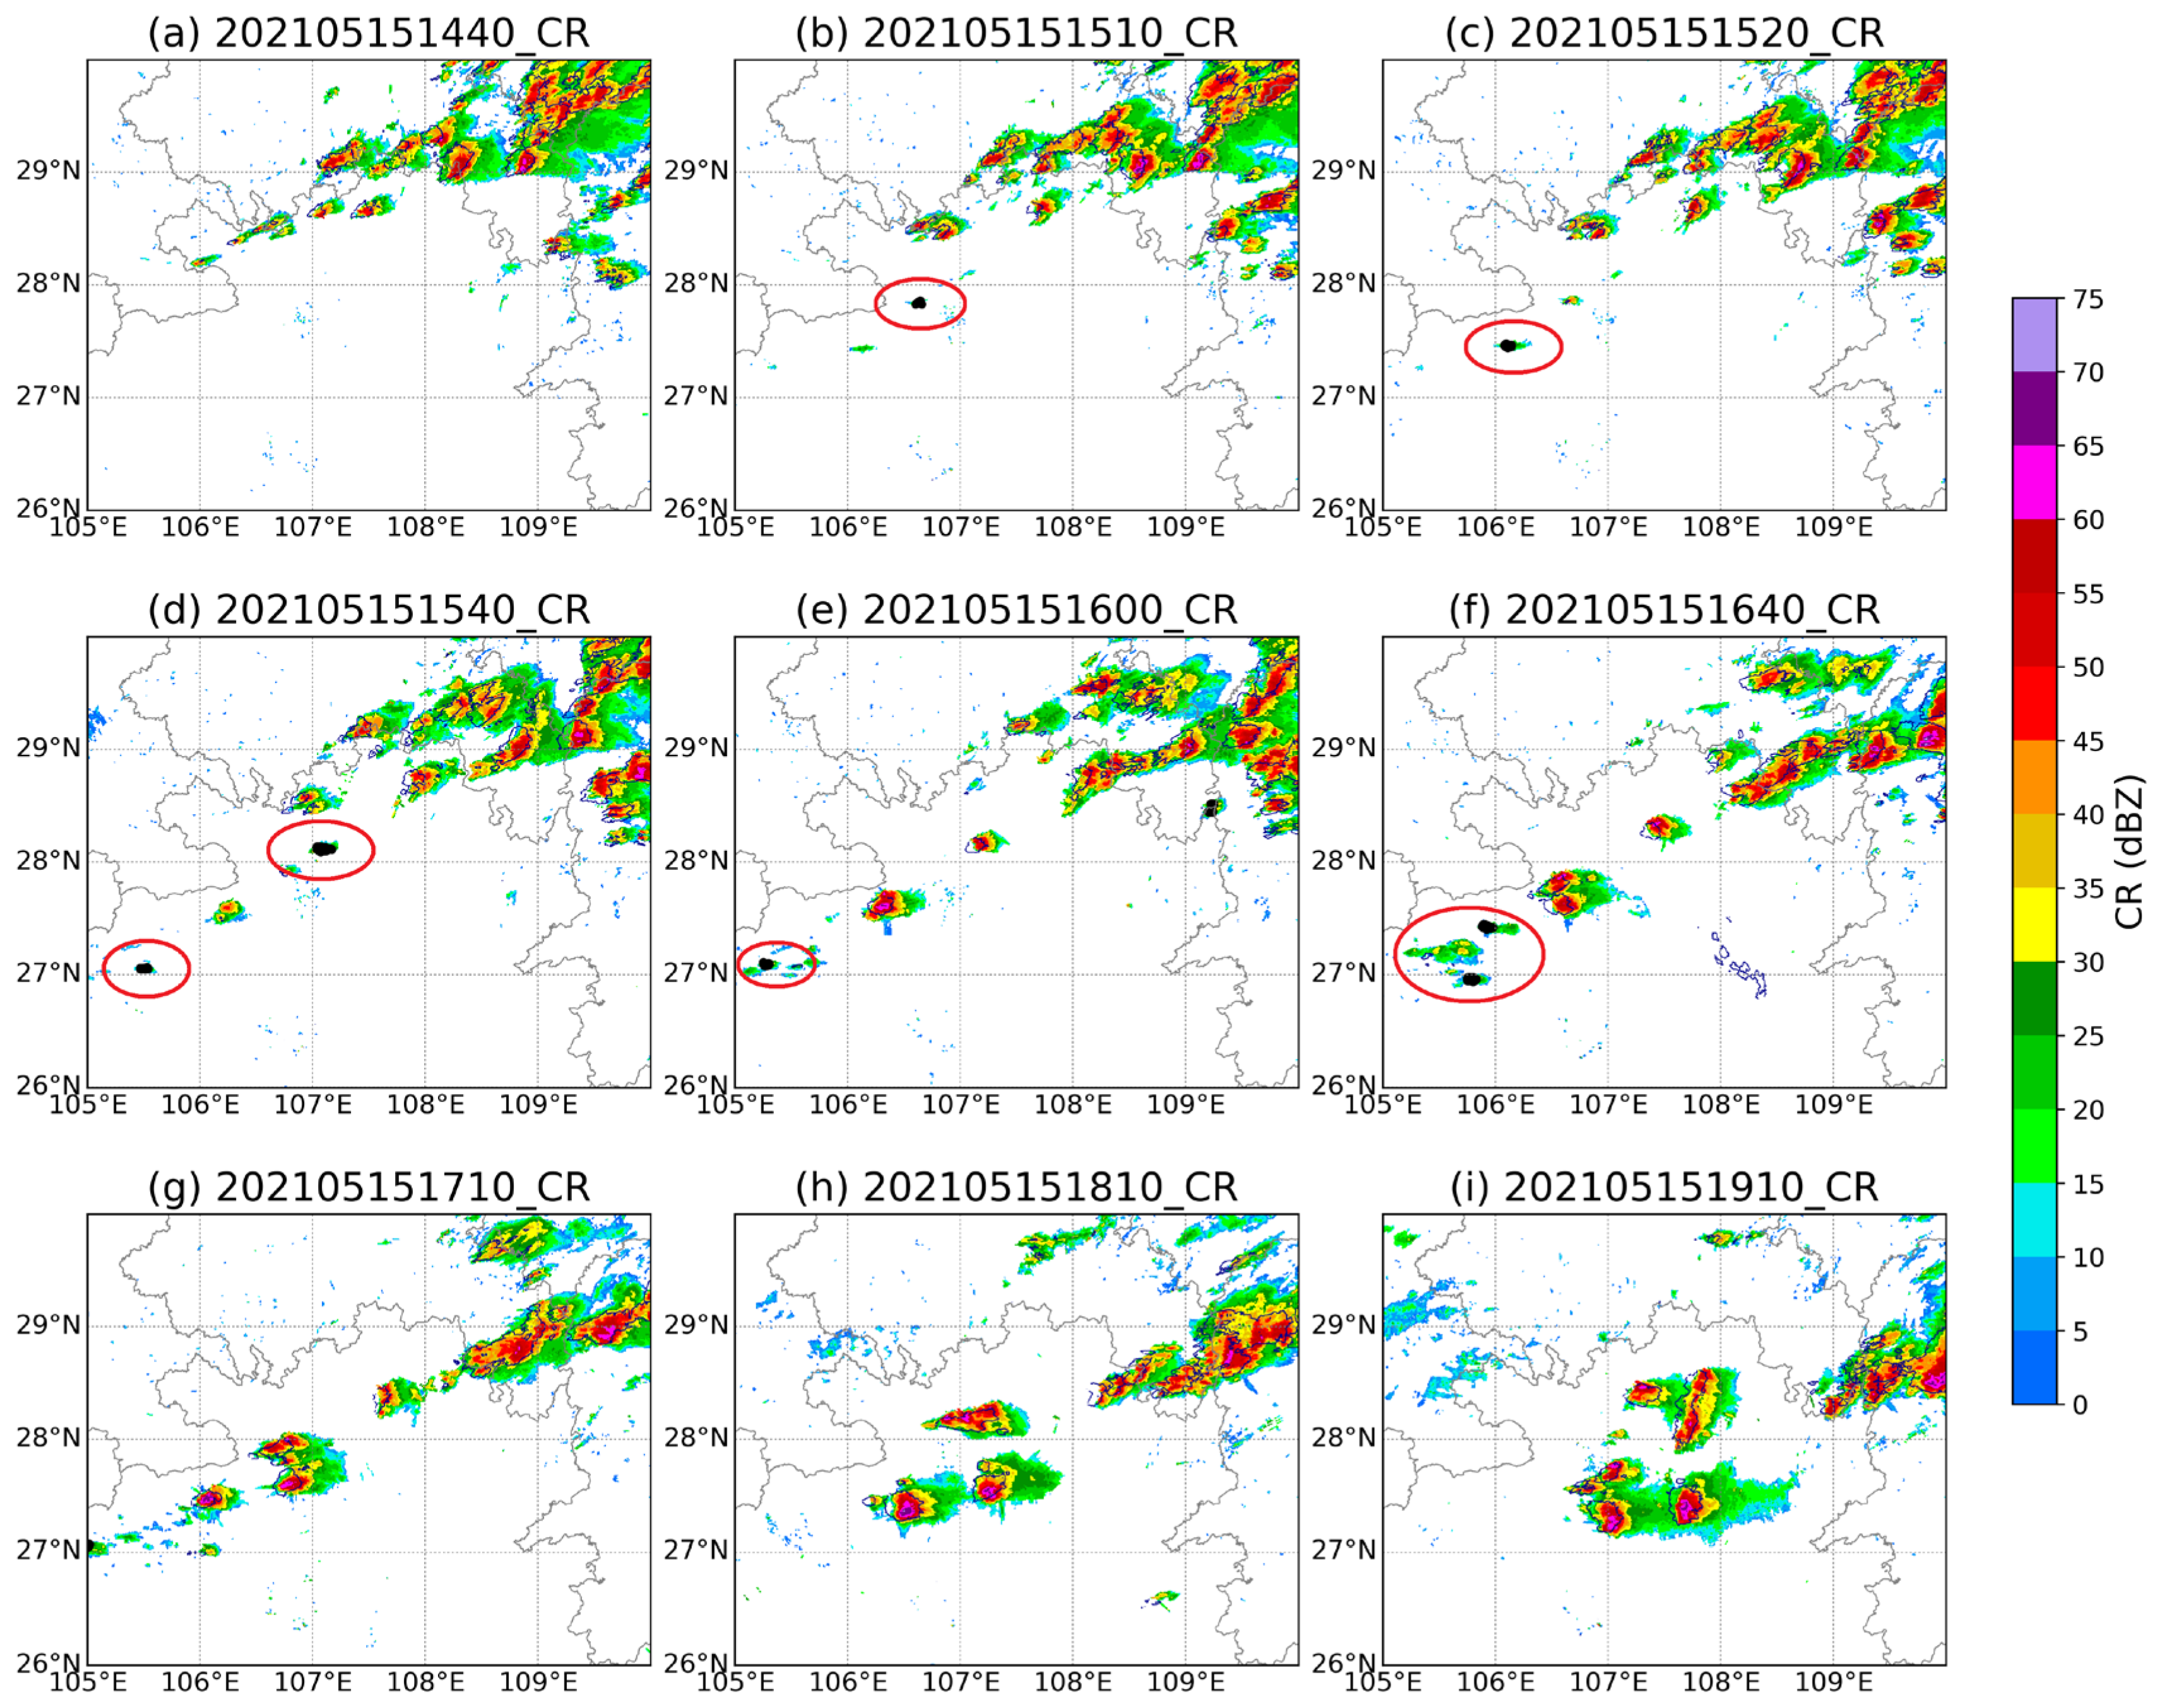
From the afternoon into the night of 15 May 2021, an extreme gale and hail event struck northeastern Guizhou Province: hail was reported in 12 counties, with the largest recorded hailstone diameter reaching 40 mm; 47 meteorological stations recorded instantaneous wind gusts of at least Beaufort force 8, with the strongest gust reaching Beaufort force 14—surpassing the highest wind speed ever recorded in Guizhou since the commencement of meteorological observations; additionally, 104 stations recorded heavy rainfall; leading to severe casualties and substantial economic losses. In terms of convective system evolution, the thunderstorm complex initially exhibited a linear multicell structure and gradually developed into an irregularly distributed multicell storm system [42]. Starting at 15:10 (Figure 4b), multiple small-scale convective cloud clusters emerged successively over northern Guizhou, aligned in a quasi-linear pattern and progressively organizing into a convective cloud band (Figure 4). The proposed CI identification method accurately identified the initiation of multiple convective clusters during this event—at 15:10, 15:20, 15:40, 16:00, and 16:40 (highlighted by red circles in Figure 4)—demonstrating its robust detection capability in this complex multicell convective system.
Figure 4.
Same as Figure 3, but for (a) 14:40, (b) 15:10, (c) 15:20, (d) 15:40, (e) 16:00, (f) 16:40, (g) 17:10, (h) 18:10, and (i) 19:10 on 15 May 2021.
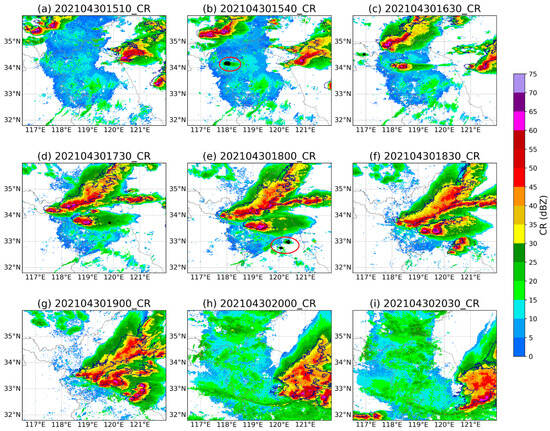
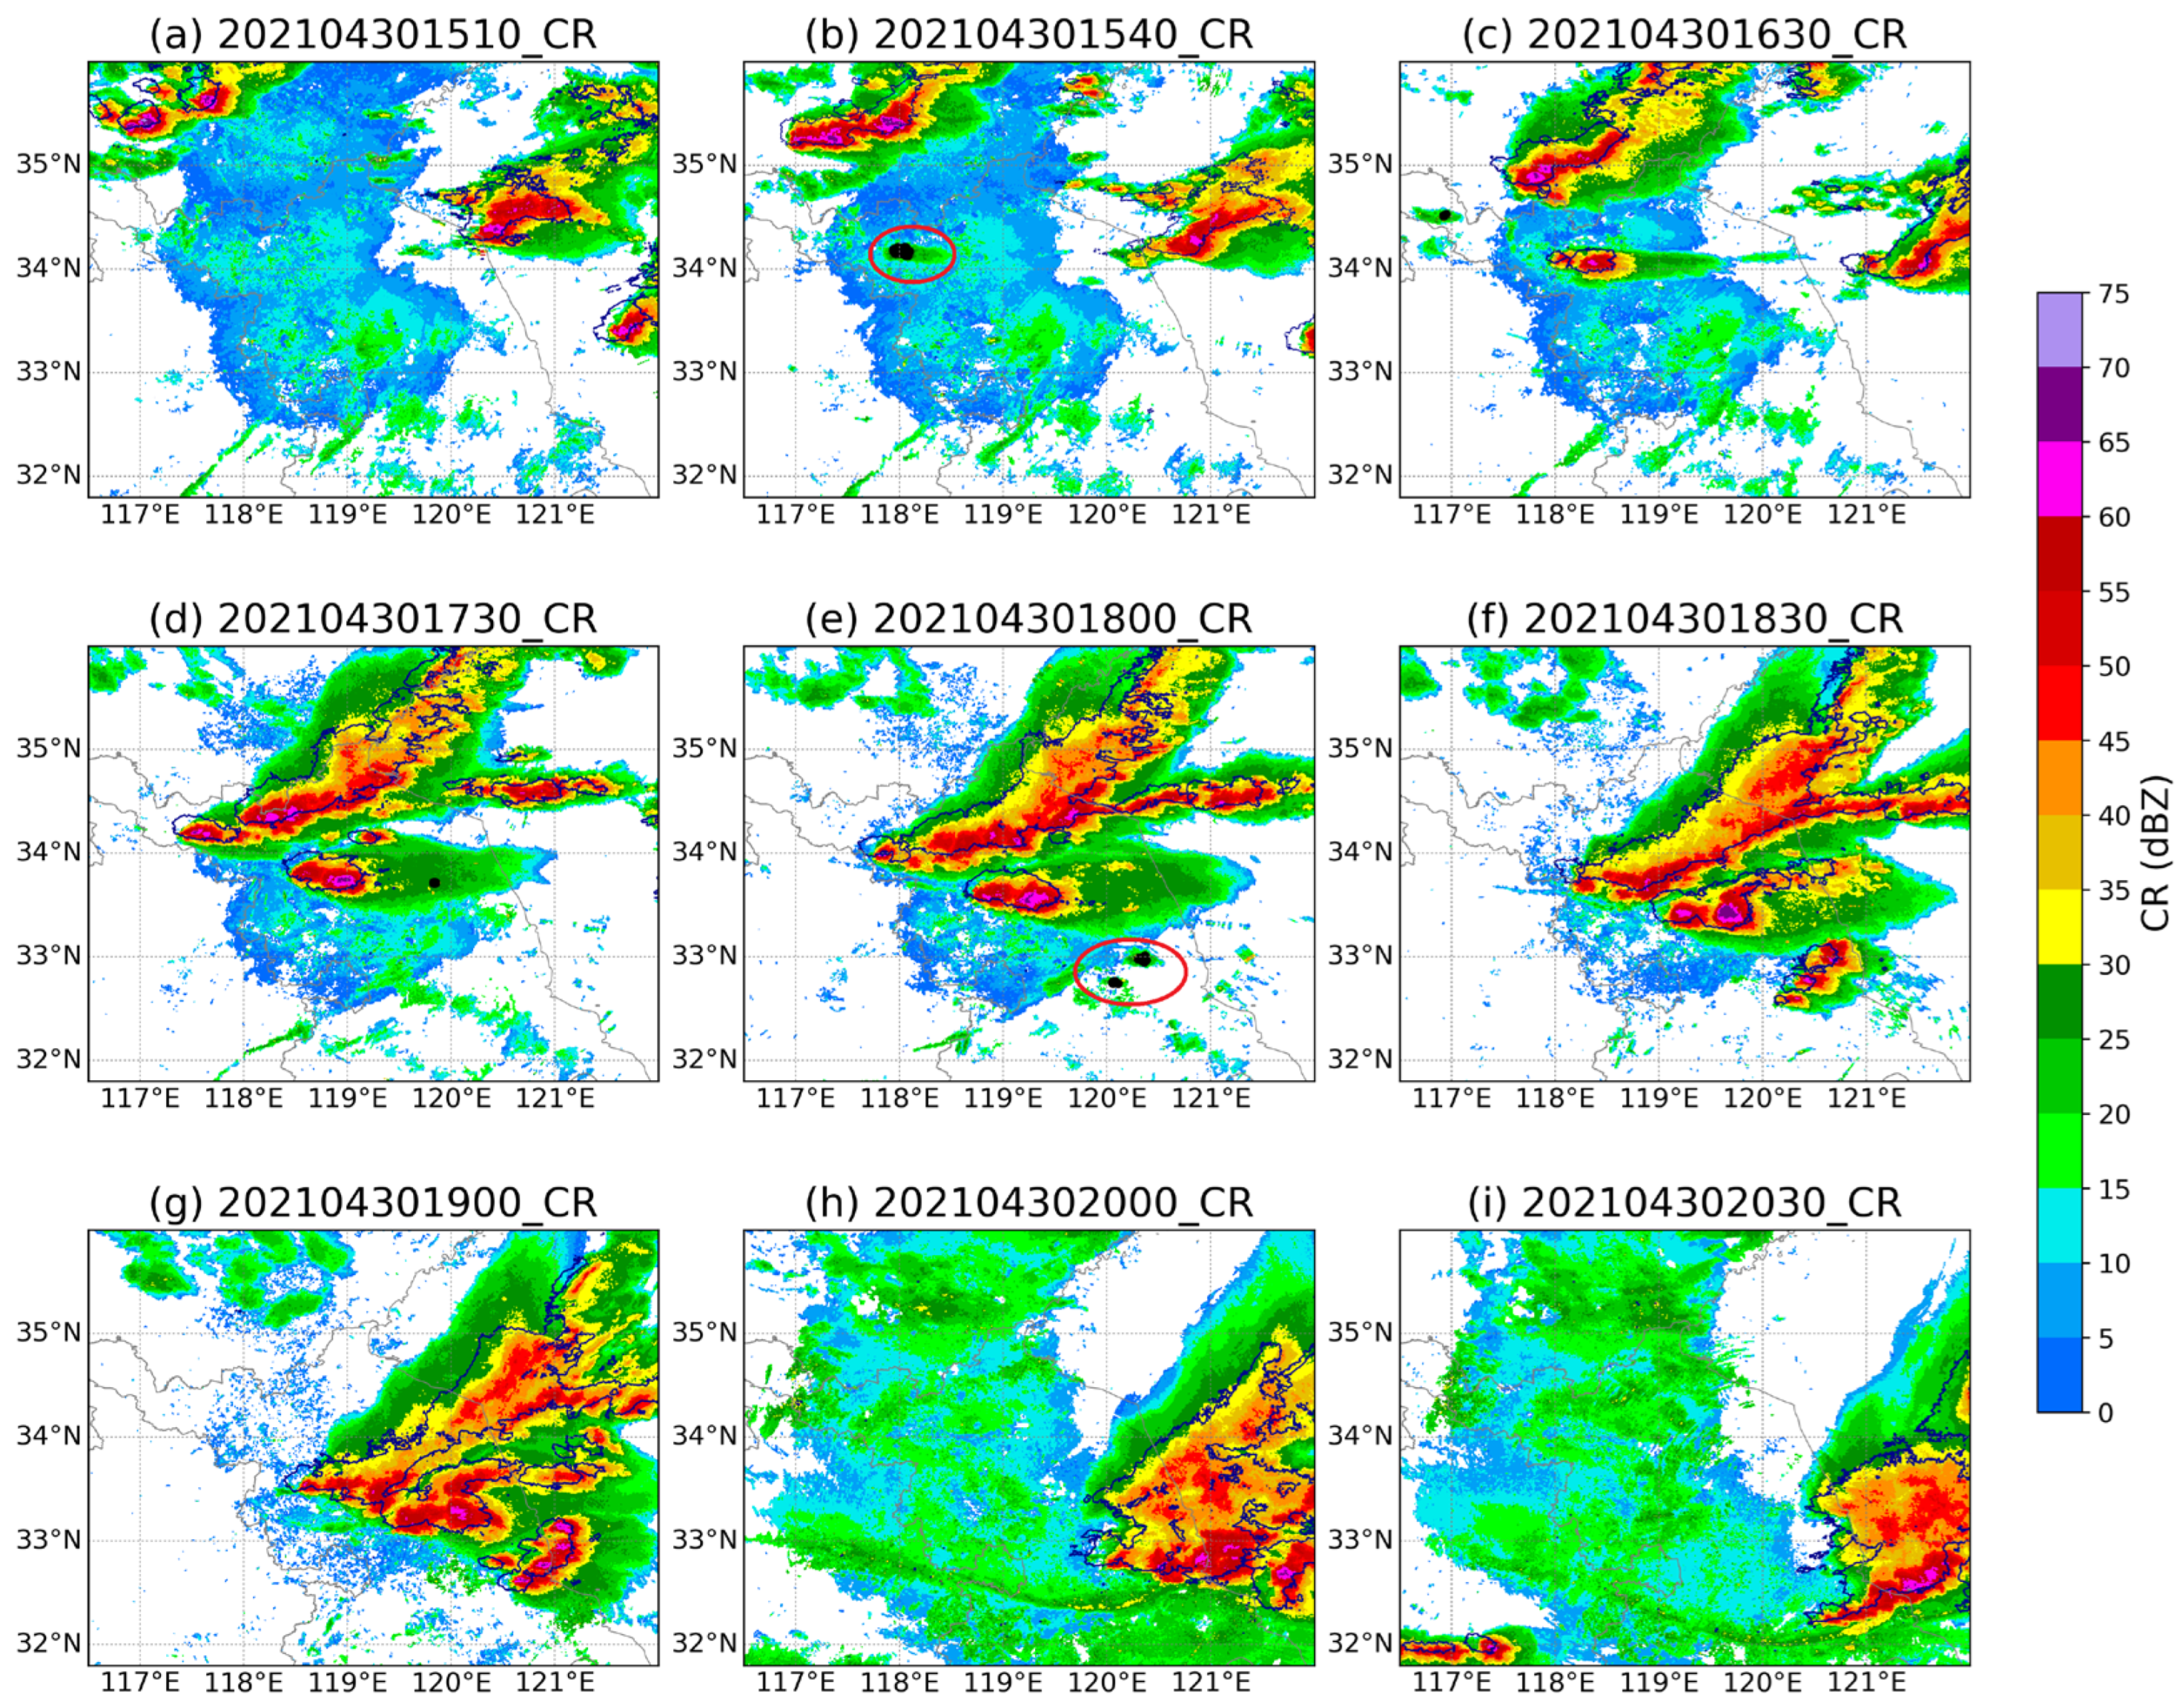
From the afternoon into the night of 30 April 2021, Jiangsu Province experienced widespread severe convective weather, featuring extreme phenomena such as convective gales and hail. The event was highly destructive: gales exceeding Beaufort force 8 affected central and eastern Jiangsu, with several stations in Huai’an and Nantong recording wind speeds reaching Beaufort force 12. Maximum wind speeds in many stations broke historical records, resulting in casualties, extensive crop damage, building collapses, and other severe impacts [43]. For this event, the proposed CI identification method not only accurately identified the initial convective triggering at 15:40 (Figure 5b, highlighted by red circles) but also effectively captured newly developed isolated storms around the main convective system during its development and propagation phase at 18:00 (Figure 5e, highlighted by red circles). This further demonstrates that the proposed method is not only applicable to the identification of isolated convective cells, but also has a certain capability for detecting newly generated storms around mature thunderstorm systems.
Figure 5.
Same as Figure 3, but for (a) 15:10, (b) 15:40, (c) 16:30, (d) 17:30, (e) 18:00, (f) 18:30, (g) 19:00, (h) 20:00, and (i) 20:30 on 30 April 2021.
In summary, analyses of three typical severe convective events demonstrate that the radar-based CI identification method proposed in this study exhibits the capability in identifying initial convection for both isolated single-cells and complex multicell systems, and also shows promising potential for detecting newly formed storm cells around mature thunderstorm systems during their development and propagation. The CI-labeled dataset generated using this method demonstrates strong potential for operational application in severe convective monitoring and nowcasting.
3.2. CI Statistical Feature
To evaluate the performance of the CI identification, hourly observations of precipitation, maximum wind speed, and weather phenomena from over 69,000 automatic weather stations in the study area are employed to statistically analyze the surface weather characteristics subsequent to CI. For each identified CI event, surface weather phenomena within a 0.25° radius around the CI location are statistically analyzed up to 2 h after CI genesis. Results demonstrate that 71.9% of all identified CI events are accompanied by surface precipitation, winds of Grade 5 or above, or hail. Furthermore, CI events accompanied by following surface wind speeds exceeding 17 m/s account for 1.63%. Events featuring subsequent rainfall above 16 mm/h (rainstorms) and 20 mm/h (short-term heavy rainfall) represent 5.52% and 4.16%, respectively.
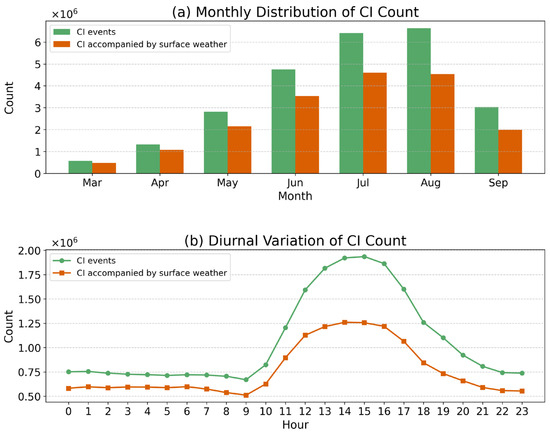
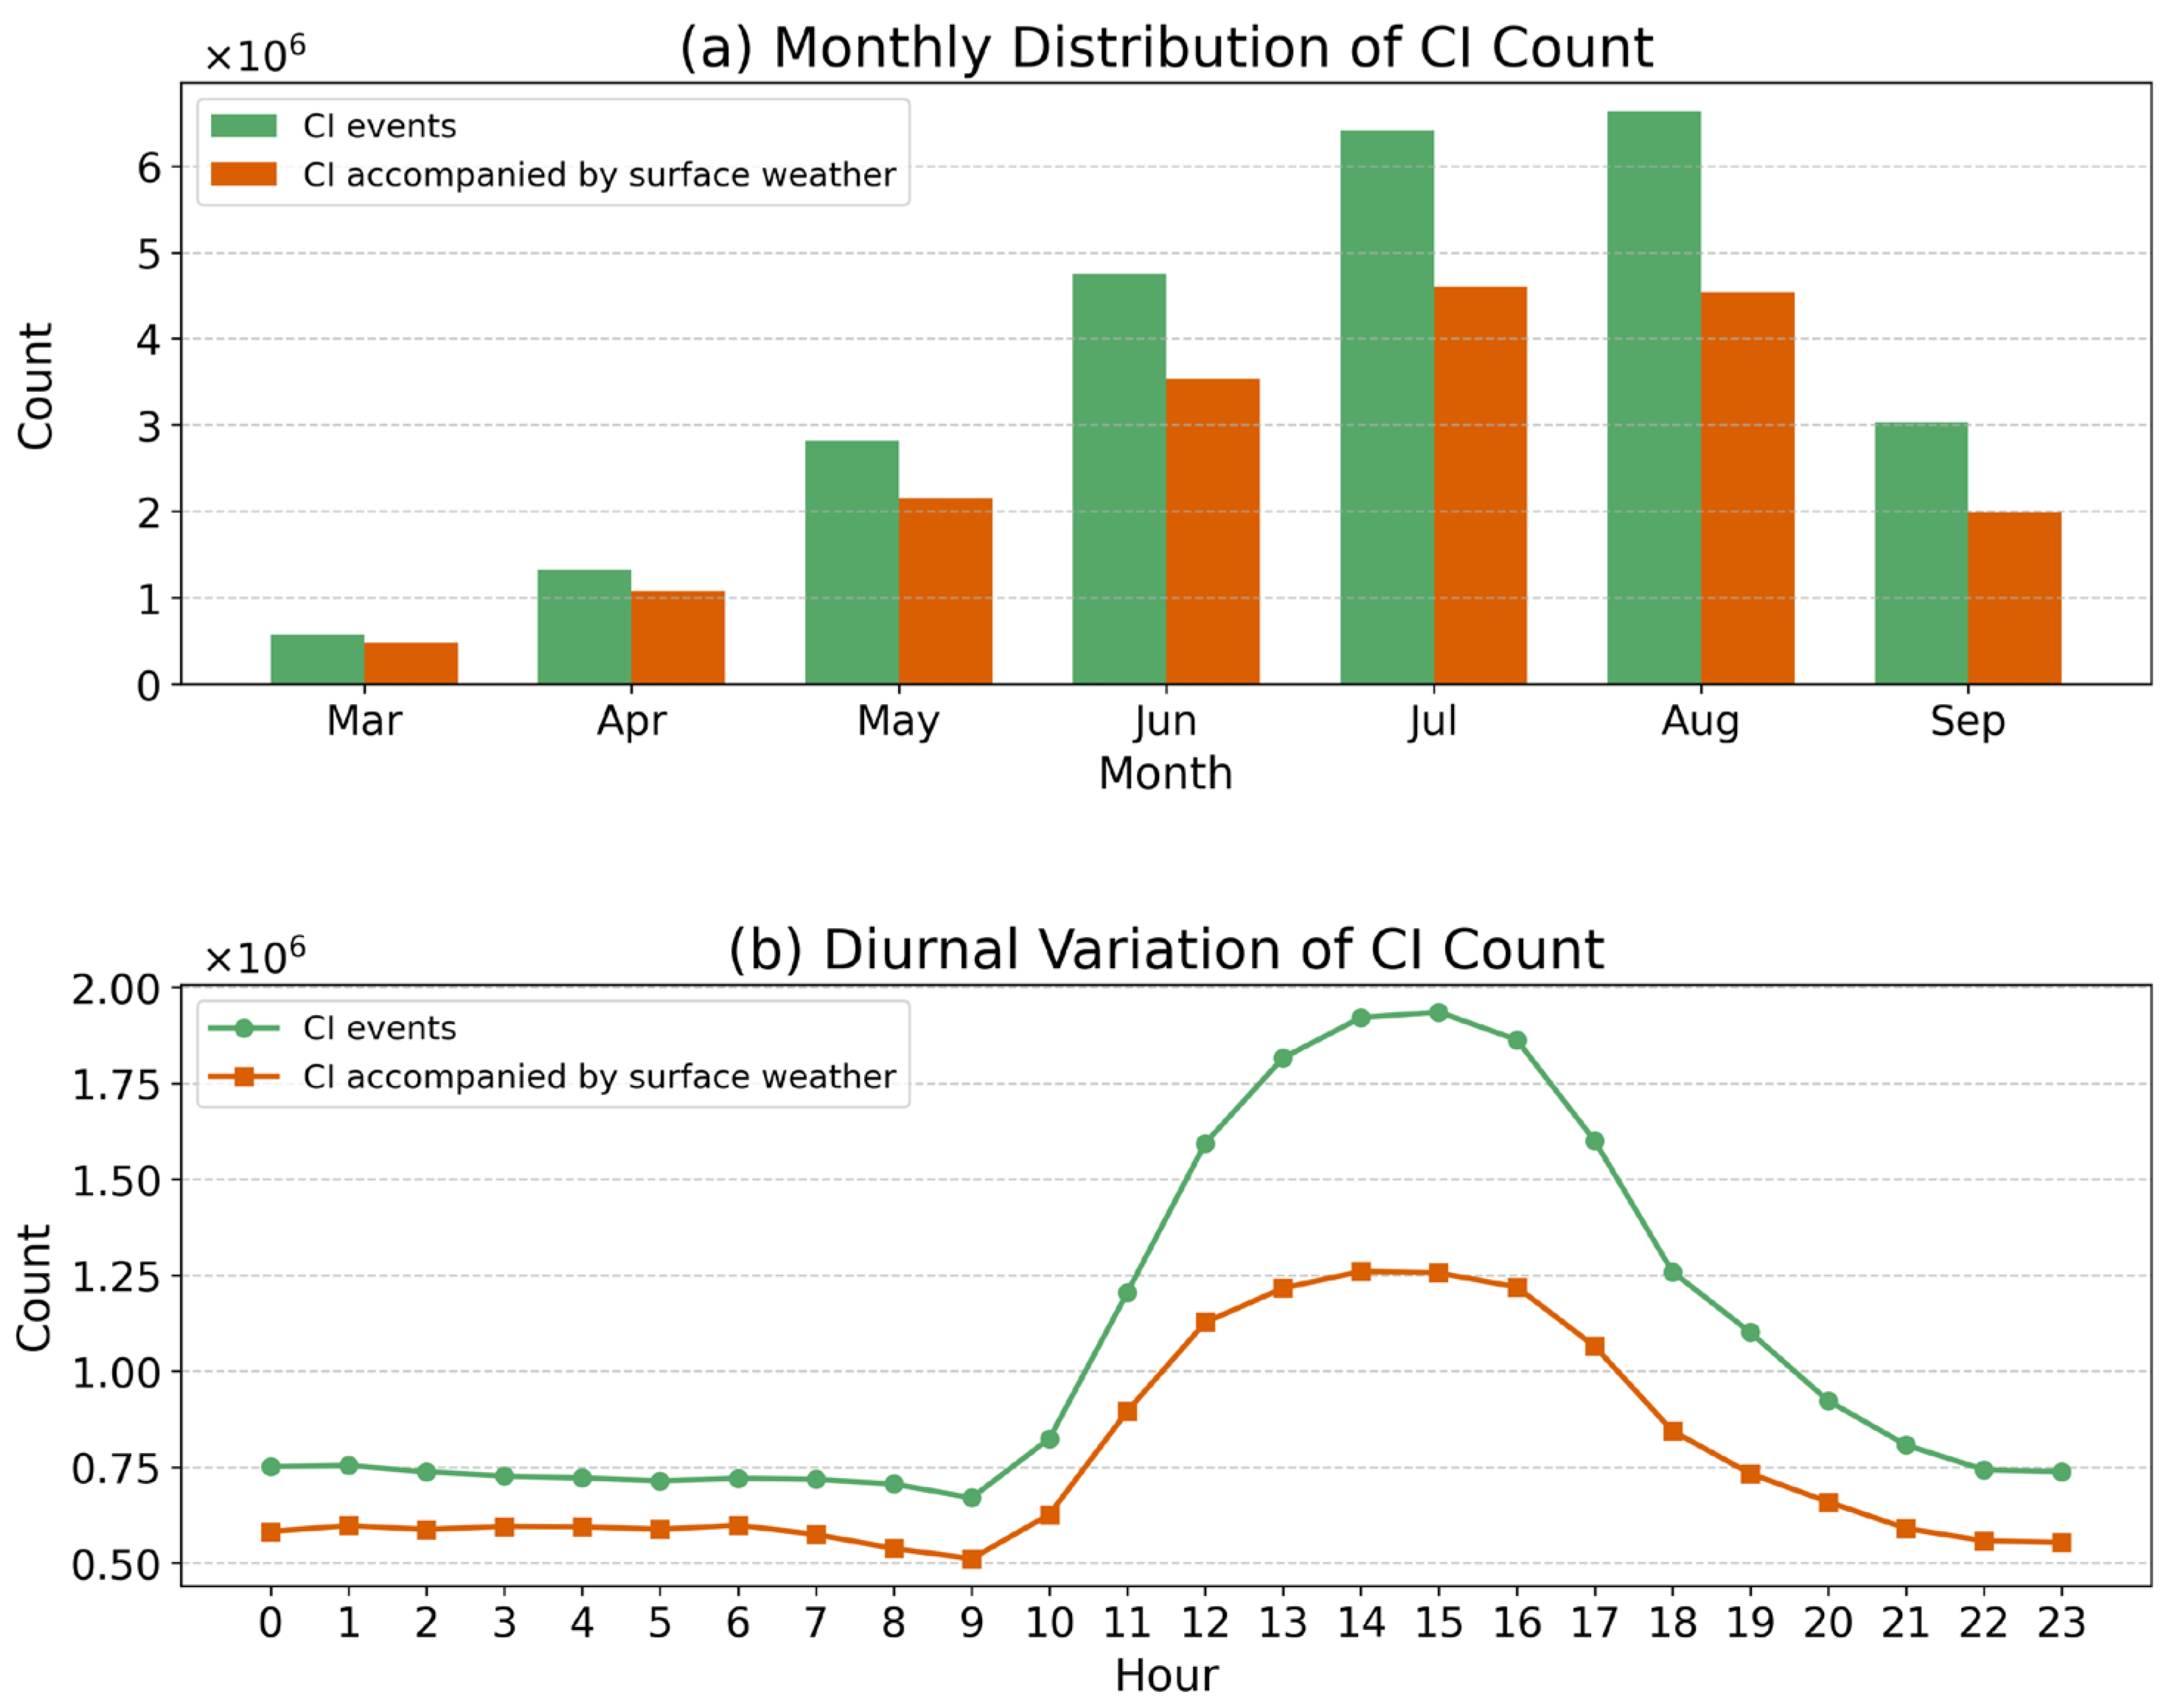
Based on the identification results, the temporal statistical characteristics of CI over central and eastern China exhibit pronounced regularity. In terms of seasonal variation (Figure 6a), CI occurrence frequency is generally low during spring (March–April). As the season progresses, increasing solar radiation and intensified surface heating gradually elevate CI frequency, which peaks in August. The warm and moist atmospheric environment during this period provides thermodynamic and dynamic conditions conducive to convection triggering. In autumn (September), the solar elevation angle decreases, solar radiation weakens, and the atmospheric stratification becomes more stable, leading to a marked decline in CI occurrence frequency. Regarding diurnal variation (Figure 6b), CI frequency begins to rise from around 09:00 (BJT), reaching a peak in the afternoon. This characteristic indicates a strong linkage between CI occurrence and surface heating. During daytime, near-surface solar radiation rapidly increases, enhancing boundary layer instability and strengthening turbulent mixing. These processes facilitate the upward transport of low-level moisture and heat, thereby triggering convection. Consequently, CI events are predominantly concentrated between midday and evening. The seasonal and diurnal variations in the frequency of CI events accompanied by surface weather phenomena are consistent with those of all identified CI events. Kruskal–Wallis tests indicated that both monthly and diurnal variations in CI event frequency are statistically significant (p-value < 0.001).
Figure 6.
(a) Monthly distribution of CI count and (b) diurnal variation in CI count. Green bars/lines denote the count of all identified CI events, while orange bars/lines represent the count of CI events accompanied by surface weather phenomena.
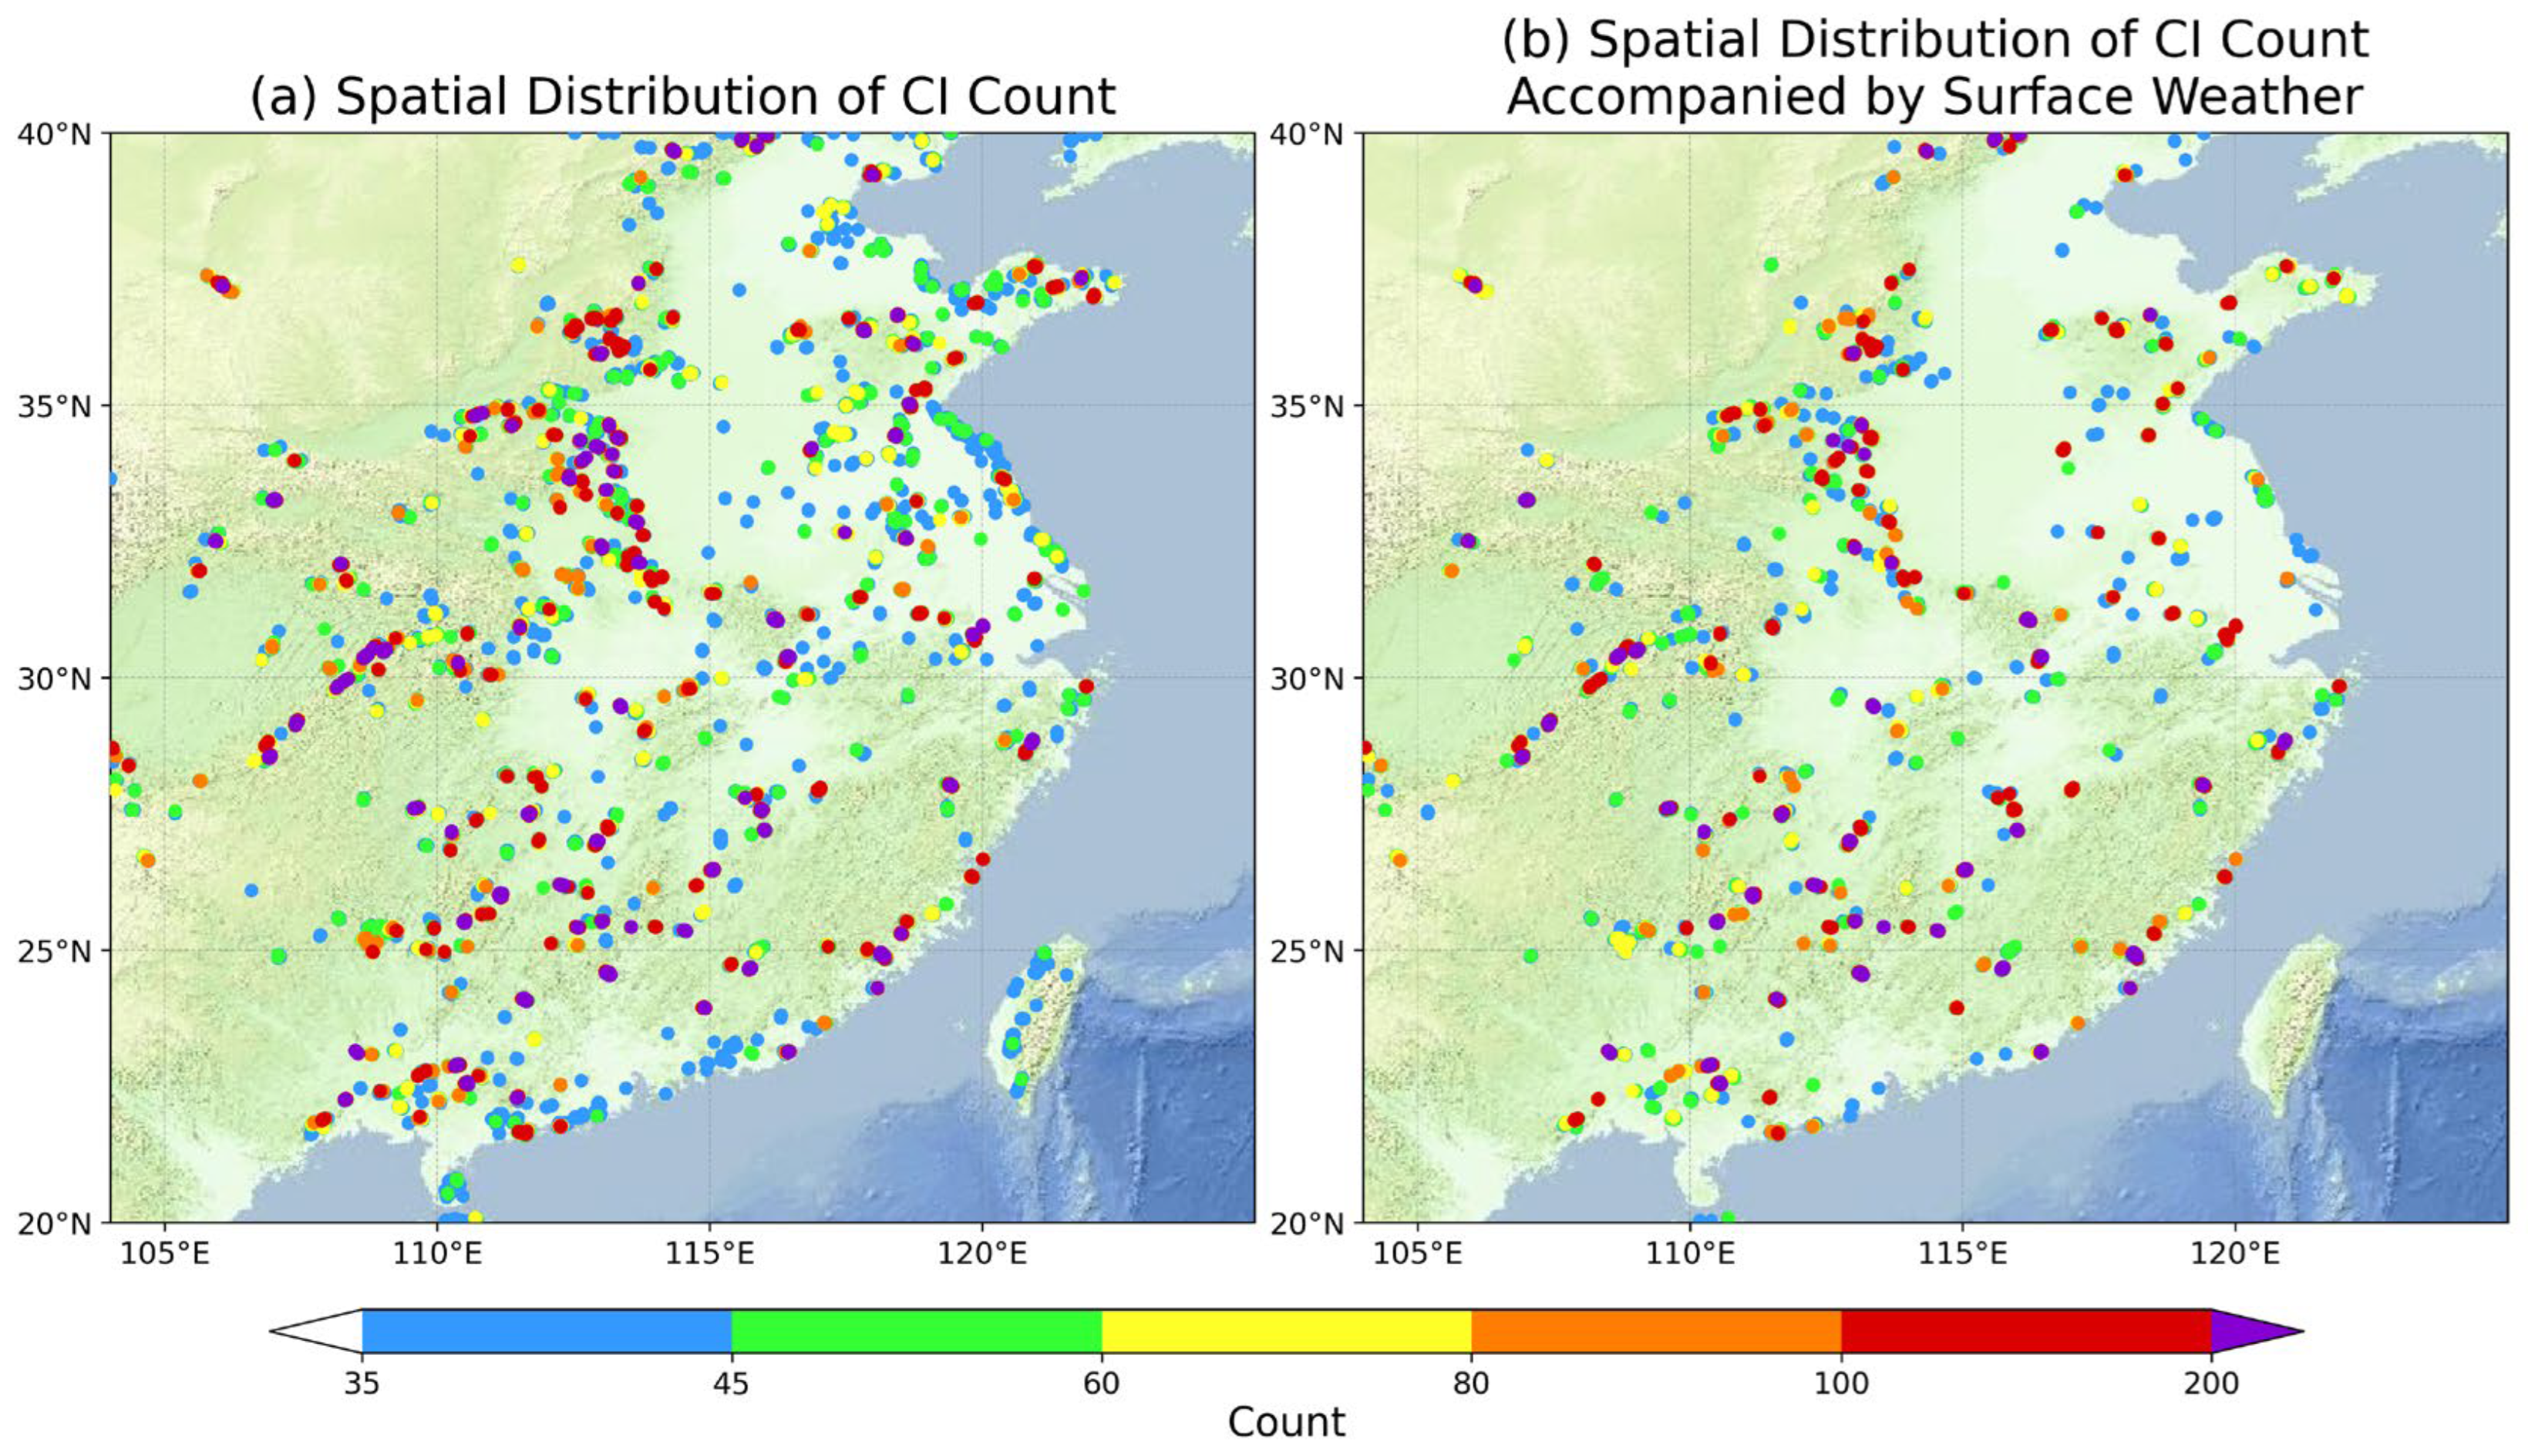
A further analysis of the spatial distribution of CI occurrence counts at every grid cell (Figure 7) reveals significant regional differences across land areas of central and eastern China. In South China, Guangxi Province exhibits relatively high CI frequency. Located at low latitudes, Guangxi receives abundant solar radiation year-round, providing ample thermal energy. Additionally, it is consistently influenced by warm, moist airflows from the South China Sea and the Bay of Bengal, ensuring a stable moisture supply; this persistently humid environment offers a favorable thermodynamic foundation for convection. Moreover, Guangxi’s terrain—characterized by extensive hills and low mountains—enhances atmospheric vertical motion through orographic lifting, which further facilitates the release of convective instability energy. The combined effects of favorable thermodynamics and topography sustain a high level of CI activity in this region [26]. Although coastal regions of Guangdong and Fujian also possess hot and humid environmental conditions theoretically conducive to convection, their CI frequencies identified in this study are comparatively lower—possibly due to limitations in radar data quality in these areas. The Jiangnan hilly region (including Hunan, Jiangxi, and surrounding areas) is another CI hotspot. This region features pronounced topographic undulations. Uneven surface heating on slopes, coupled with orographic lifting, effectively promotes convective triggering. Furthermore, during summer, this region is subject to the influence of the Western Pacific Subtropical High and the East Asian summer monsoon, which jointly create favorable thermodynamic and moisture conditions for CI. In northern China, where overall thermal and moisture conditions are weaker than in the south, CI events are primarily concentrated in mountainous areas—including the Taihang Mountains, Qinling Mountains, Dabie Mountains, and Mount Tai—largely driven by terrain-induced uneven surface heating and orographic lifting effects. Consistent with the spatial distribution of all identified CI events, those accompanied by surface weather phenomena are also predominantly concentrated in these key areas.
Figure 7.
Spatial distribution of CI occurrence counts at every grid cell over China’s central and eastern mainland: (a) all identified CIs; (b) CIs associated with surface weather phenomena.
In summary, the spatiotemporal statistical characteristics of CI over land areas in central and eastern China result from the synergistic effects of thermal conditions, moisture availability, and topographic influences, giving rise to a distinct feature: temporally, CI frequency increases in spring, peaks in summer, declines in autumn, and is concentrated in the afternoon; spatially, CI occurs more frequently in southern regions than in the north, with a pronounced concentration in mountainous areas. These findings align with previous studies investigating regional statistical properties of CI [20,23,26,27]. It should be noted that the statistical analysis in this chapter is based solely on the identified CI results. The identification process inevitably misses observations removed due to radar data anomalies. Therefore, lower CI counts in certain regions or periods may be artifacts of data quality rather than true CI characteristics.
4. Dataset Description
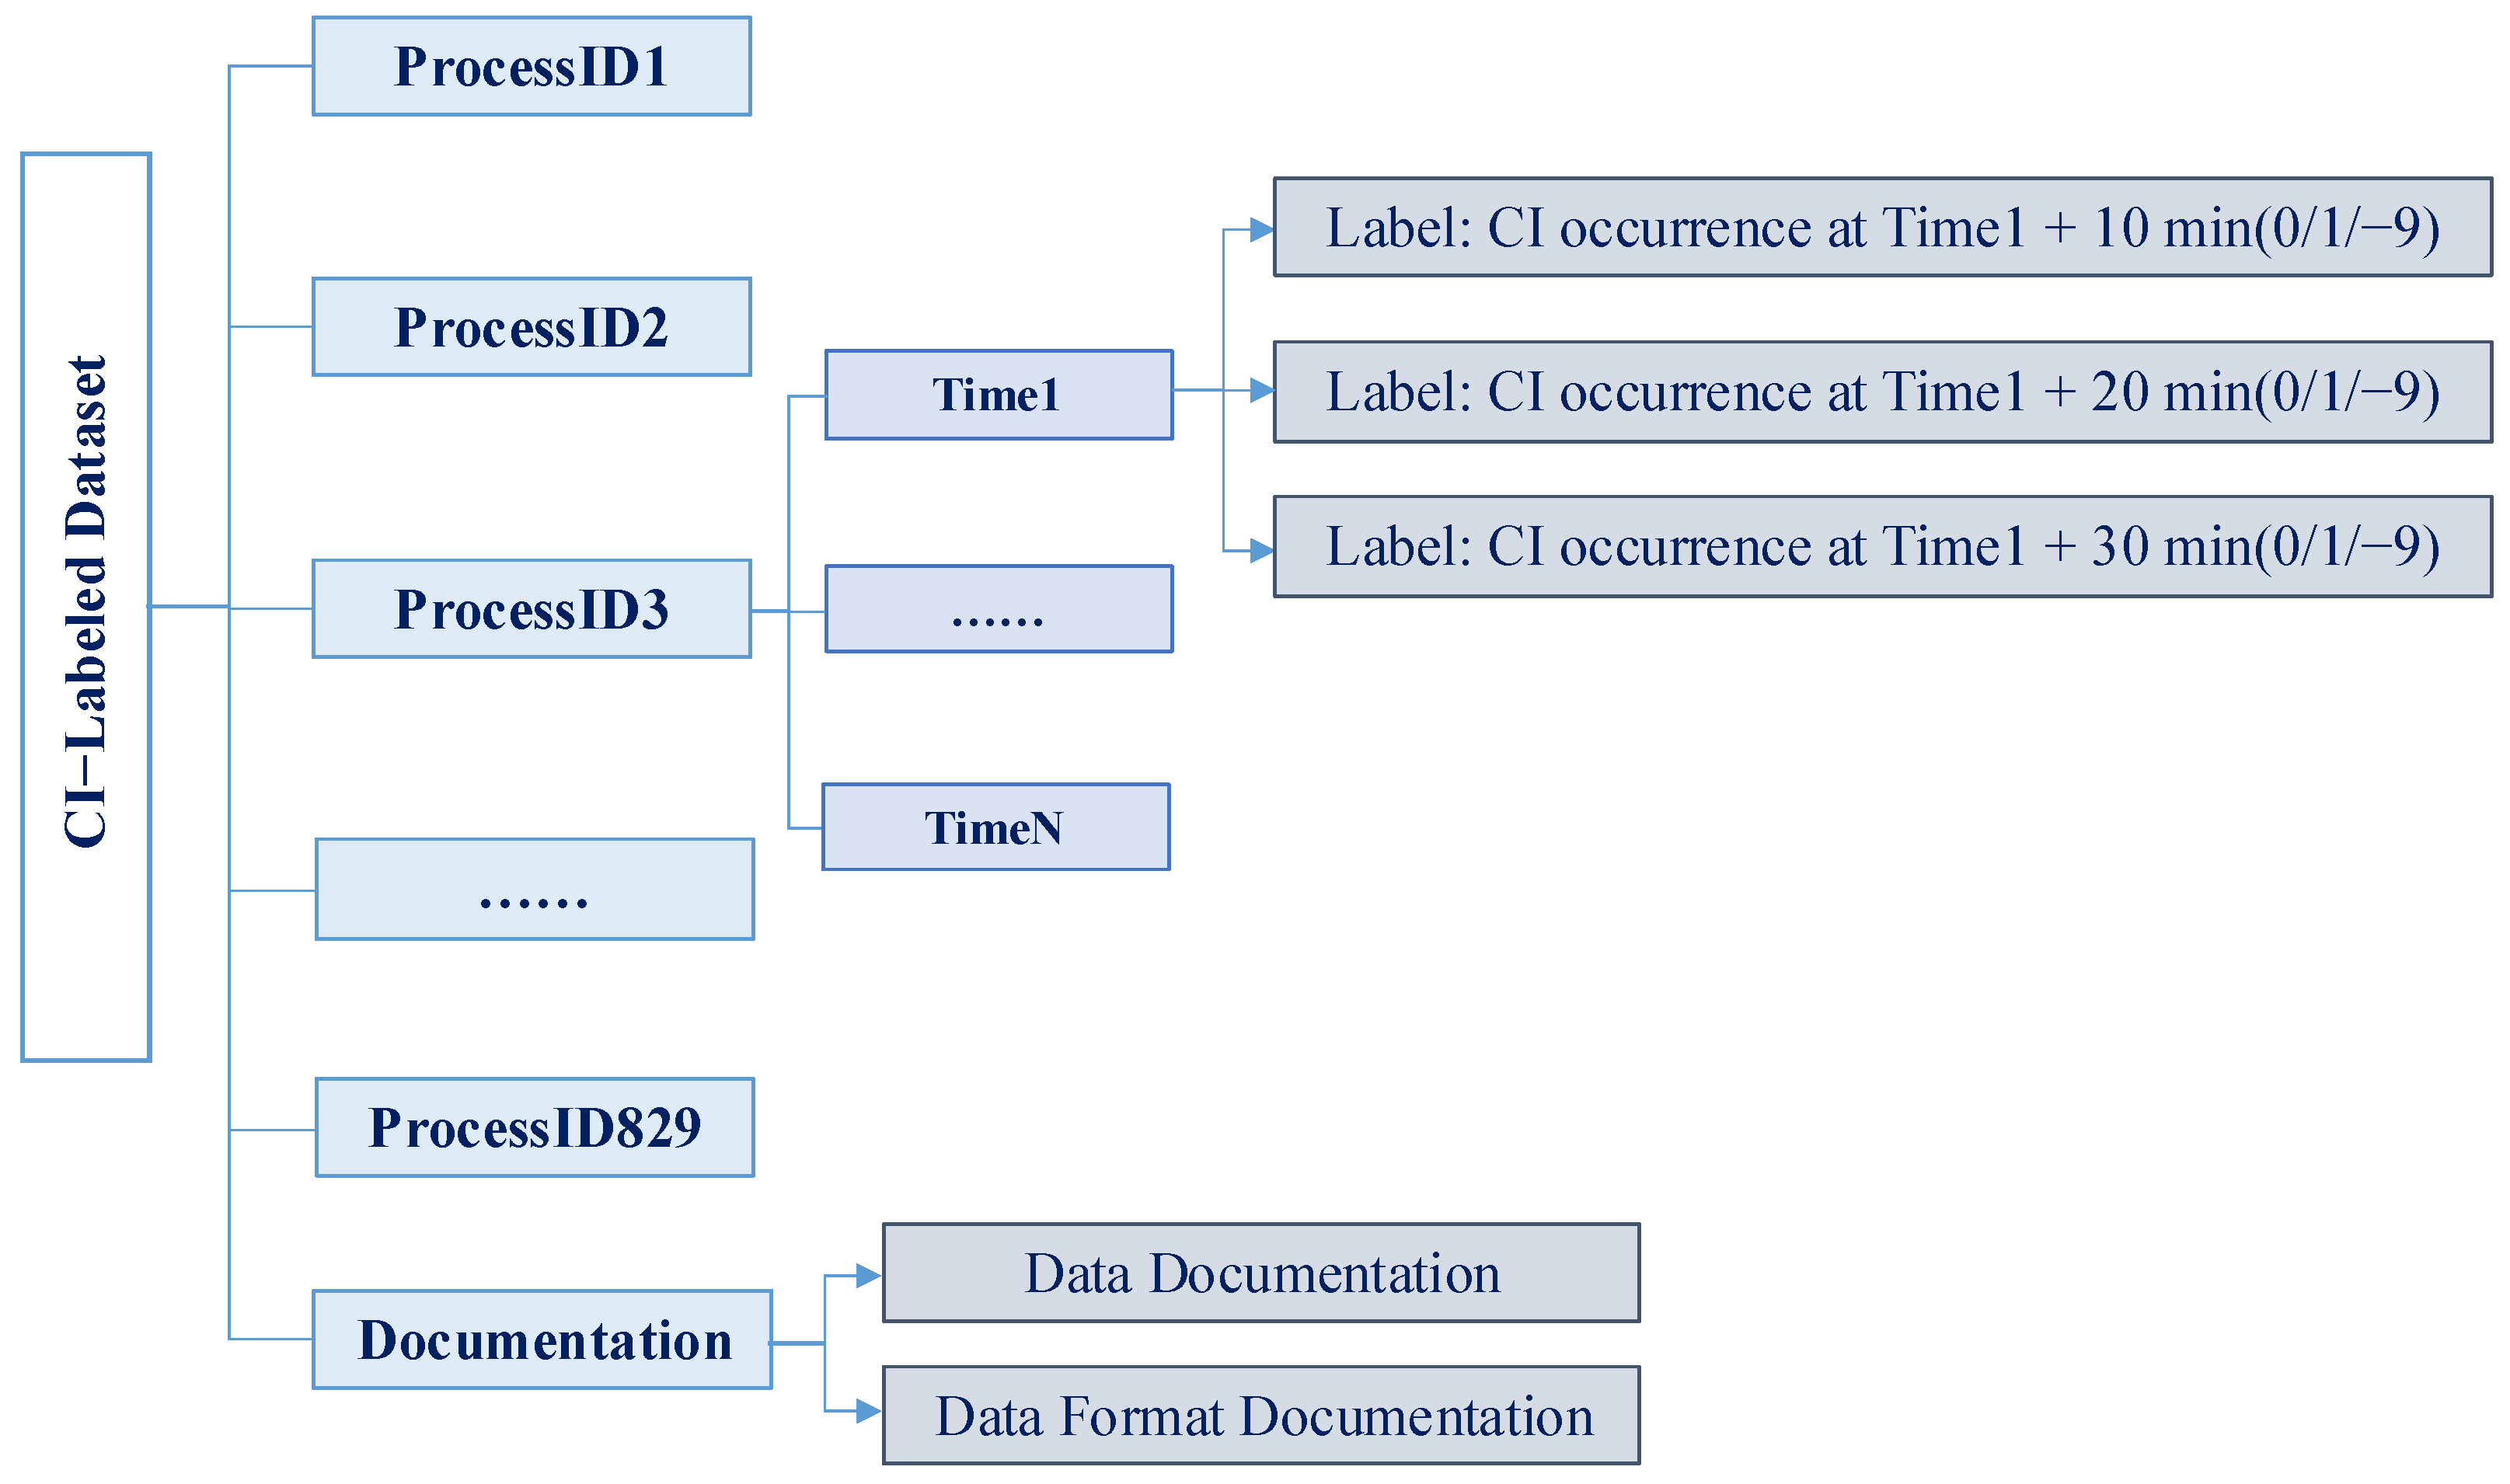
The CI-labeled dataset developed in this study is organized based on 829 severe convective weather processes from the SCWDS. For each process, the dataset includes data at 10 min intervals, spanning from 2 h before the start time to 1 h after the end time, resulting in a total of 131,818 time steps. Each time step is assigned three distinct labels indicating whether CI occurs at 10, 20, and 30 min into the future, respectively (1 for occurrence, 0 for non-occurrence). Additionally, a documentation file is provided to facilitate the use of the dataset. Content and structure of CI-labeled dataset are shown in Figure 8. Users shall select labels with the required lead time and partition the dataset into training and test subsets according to their own research requirements.
Figure 8.
Content and structure of CI-labeled dataset.
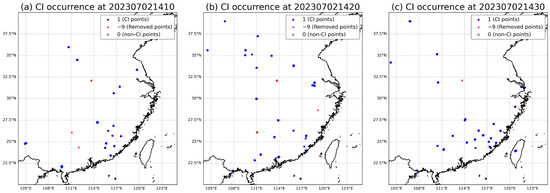
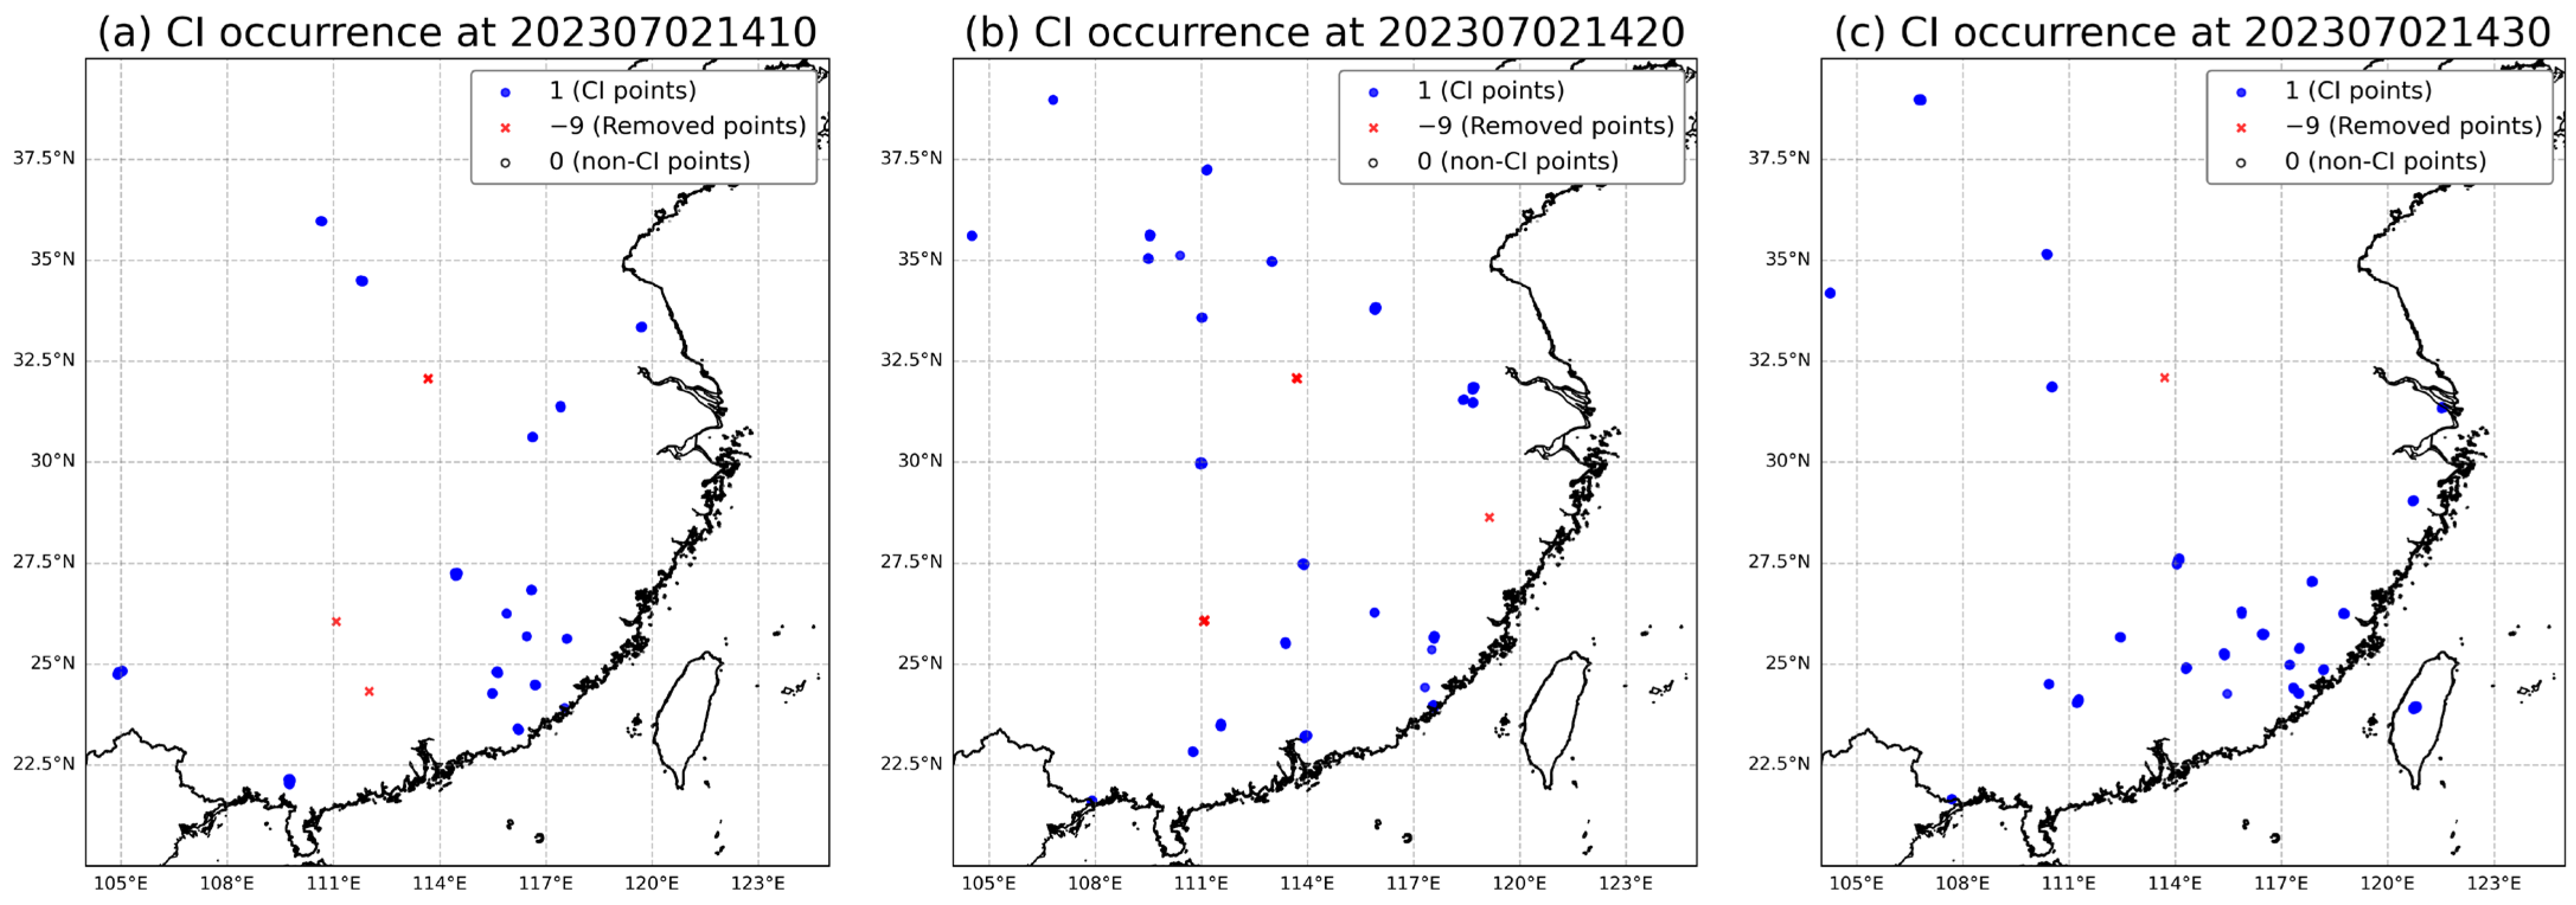
For AI model training, the dataset must contain sufficient non-CI samples (i.e., negative samples). The dataset consists of multiple consecutive time steps, and the covered area features comprehensive radar coverage with relatively high data quality. Furthermore, the radar data in this study has undergone rigorous algorithmic and manual quality control. Therefore, grid points where CI is not identified within the sample sequences can be regarded as CI negative samples, with the label set to 0. Conversely, grid points where CI occurs are labeled as 1, while CI records removed in Step 6 (Manual inspection and anomaly removal) are marked as −9 (as shown in Figure 9).
Figure 9.
CI label example identified at 14:00 on 2 July 2023. The CI event occurring (a) 10, (b) 20, and (c) 30 min later.
5. Discussion
This study presents a radar and wind field-based CI identification technique and constructs a warm-season (March–September) CI-labeled dataset for central and eastern China, which holds significant value for severe convective monitoring and nowcasting. However, to determine whether a convection event is genuinely “first-time”, the method applies a strict spatial distance threshold from pre-existing organized strong echoes—aimed at ensuring the authenticity of identified CI events. While this conservative approach effectively reduces interference from the propagation and evolution of existing convective systems, it may inadvertently omit CI events occurring near mature thunderstorm cores. To address this limitation, future work could refine the logic for identifying the “first appearance” of convective cells by explicitly accounting for the monitoring and trajectory of ambient convective systems. Additionally, the identification method employs multiple thresholds determined via sensitivity tests on a subset of samples. A limitation remains, as the convective development rate is set as a fixed threshold, ignoring seasonal and regional variations; future studies should adjust this parameter regionally and seasonally. Furthermore, grid points with CR < 20 dBZ (indicating no or weak convection) are treated as potential CI starting points. However, since these states are physically distinct, subsequent research should incorporate higher-resolution data or cloud-top information to better differentiate them. Moreover, the echo intensity associated with CI also warrants more in-depth exploration.
Considering computational efficiency and resource constraints, the dataset construction was conditioned on severe convective cases from SCWDS. Although the temporal domain was extended to include the 2 h prior to the severe convective start time and 1 h after the end time, the spatial domain remained fixed over Southeast China. Consequently, while times and regions unaffected by severe convection provide samples of clear skies, stratus and stratocumulus clouds, weak isolated convection, etc. The resulting dataset theoretically includes both CI events that developed into severe weather and those that did not intensify, as well as negative samples without CI signals. However, the dataset may still exhibit limitations regarding sample diversity and may inadvertently omit CI events occurring outside the studied temporal window. Future studies could address this limitation by utilizing data with an extended time window and integrating more diverse weather types to improve model generalization in practical applications.
Furthermore, in the statistical analysis of surface weather characteristics following CI events, this study adopted hourly surface weather data to ensure computational efficiency. Nevertheless, the temporal resolution mismatch between the hourly weather observations and the 10 min CI data may extend the weather matching time window, potentially introducing non-CI-related weather phenomena and leading to misjudgment. Consequently, the weather matching is used merely to validate the reasonableness of the identification outcomes. For more accurate labeling of CI-related surface weather phenomena, higher-temporal-resolution meteorological data are essential.
Additionally, developing intelligent CI identification and forecasting techniques based on the CI-labeled dataset developed in this study will not only enable a systematic evaluation of its effectiveness but also support the optimization of CI identification technique for diverse application scenarios, thereby further improving identification accuracy. The CI identification method and dataset presented in this paper have been extensively applied by colleagues to investigate CI statistical features and intelligent forecasting in regions such as Guangxi, North China, Hubei, etc. These studies have preliminarily confirmed the reliability of both the method and the dataset, with several related findings accepted for publication [44,45] or currently under review.
It is worth noting that CI is a rare event, with the proportion of CI grid points in the dataset being less than 0.1%. This necessitates special attention to the class imbalance problem during AI model training. Since manual inspection of radar data for CI identification currently extends to 2023, the CI-labeled dataset will be continuously expanded alongside future data updates.
6. Conclusions
CI is a critical precursor to severe convective weather, and its timely and accurate identification is of great significance for improving nowcasting and warning capabilities of severe weather. Based on gridded CR radar data and reanalysis wind products in central and eastern China corresponding to severe convective processes, this study develops a dynamic CI identification method that integrates “forward-time search and backward-time verification”. Using this approach, and adhering to the principle of “quality over quantity”, we constructed a CI-labeled dataset for the warm season (March–September) in China’s central and eastern mainland from 2018 to 2023 to provide authentic CI information for AI model learning. This dataset comprises approximately 25.6 million grid points that experienced CI events, with 71.90% of those accompanied by surface precipitation, winds of Grade 5 or above, or hail. Furthermore, we analyzed the spatiotemporal statistical characteristics of CI events.
The specific steps of the CI identification method are as follows: First, screen all grid points at each time step and select grids characterized by non-convective conditions or only weak convection. Second, examine whether convection develops over each preselected grid within the following 30 min. Finally, confirm whether the convection is a first-time occurrence—i.e., whether organized, intense radar reflectivity echoes existed in the vicinity 10 min before the convection appears. Once CI grid points are confirmed, clustering analysis is applied to remove outliers, followed by manual quality control to eliminate the influence of anomalous radar data, thereby enhancing the accuracy and reliability of the identification results. Finally, identified CI events with lead times of 10, 20, and 30 min are used to produce a CI-labeled dataset that incorporates spatiotemporal evolution information and meets the requirements of different forecast horizons.
Case studies of three typical convective events demonstrate that the method proposed in this study is capable of accurately capturing the initiation of both isolated single-cells and complex multicell systems, and also exhibits a certain capability in identifying newly formed cells around mature thunderstorm cores during their propagation and evolution. Spatiotemporal statistical analysis of CI events over the warm season (March–September) from 2018 to 2023 across China’s central and eastern mainland reveals the following features: The frequency of CI events gradually increases from spring to summer, peaking in August and declining in September. CI events predominantly occur between midday and evening. High-frequency CI regions are closely associated with topography, thermal conditions, and moisture availability, notably including Guangxi, the Jiangnan hilly areas (e.g., Hunan and Jiangxi), and mountainous regions in northern China. The seasonal, diurnal, and spatial distribution characteristics of CI events accompanied by surface weather phenomena are generally similar to the aforementioned overall features.
Author Contributions
Conceptualization and methodology, S.Z., Z.H. and N.L.; software, Z.H.; formal analysis, S.Z.; investigation, S.Z.; resources, N.L.; data curation, Y.L.; writing—original draft preparation, S.Z.; supervision, N.L.; funding acquisition, N.L. All authors have read and agreed to the published version of the manuscript.
Funding
This research was funded by the Joint Fund for Meteorology of the National Natural Science Foundation of China, grant number U2442217, and the National Meteorological Information Centre Key Innovation Team for Artificial Intelligence Training Dataset for Meteorological Applications (NMIC-2024-ZD01).
Data Availability Statement
CMA Global Atmospheric Reanalysis Version 1.5 is available on the Website of the China Meteorological Data Service Centre (https://data.cma.cn/ai/#/detail?id=1 (accessed on 9 May 2025)). The weather radar network data and observational data from automatic weather stations used in this study are not publicly available due to data security restrictions. The CI-labeled data generated in this article are not readily available because they are part of an ongoing study. Request to access the CI-labeled data should be directed to the corresponding author.
Acknowledgments
We acknowledge any support given that is not covered by the author contribution or funding sections, including administrative and technical support.
Conflicts of Interest
The authors declare no conflicts of interest.
Abbreviations
The following abbreviations are used in this manuscript:
| AI | Artificial intelligence |
| CI | Convection initiation |
| CR | Composite reflectivity |
| CMA | China Meteorological Administration |
| SCWDS | Severe Convective Weather Dataset for AI application |
References
- Xu, H. A Study of Forecasting Convective Initiation Based on Method of Box-Averaged. Master’s Thesis, Ocean University of China, Qingdao, China, 2013. (In Chinese) [Google Scholar]
- Fang, Z.Y. The evolution of meteorological satellites and the insight from it. Adv. Meteorol. Sci. Technol. 2014, 4, 27–34. (In Chinese) [Google Scholar]
- Qin, D.Y.; Fang, Z.Y. Research progress of geostationary satellite-based convective initiation. Meteorol. Mon. 2014, 40, 7–17. (In Chinese) [Google Scholar]
- Cui, L.L. Prospect of convective initiation identification based on new generation geostationary meteorological satellite. Adv. Meteorol. Sci. Technol. 2022, 12, 80–84. (In Chinese) [Google Scholar]
- Ziegler, C.L. Deep convection initiation: State of the science, limits of understanding, and future directions. In Proceedings of the 94th American Meteorological Society Annual Meeting, Atlanta, GA, USA, 2–6 February 2014. [Google Scholar]
- Yu, X.D.; Zhou, X.G.; Wang, X.M. The advances in the nowcasting techniques on thunderstorms and severe convection. Acta Meteorol. Sin. 2012, 70, 311–337. (In Chinese) [Google Scholar]
- Sun, J.S.; Dai, J.H.; He, L.F.; Zheng, Y.Y.; Yu, X.D.; Xu, A.H. Basic Principles and Techniques of Severe Convective Weather Forecasting: Handbook of Severe Convective Weather Forecasting in China; China Meteorological Press: Beijing, China, 2014; pp. 22–161. (In Chinese) [Google Scholar]
- Weckwerth, T.M.; Hanesiak, J.; Wilson, J.W.; Trier, S.B.; Degelia, S.K.; Gallus, W.A.; Roberts, R.D.; Wang, X. Nocturnal convection initiation during PECAN 2015. Bull. Am. Meteorol. Soc. 2019, 100, 2223–2239. [Google Scholar] [CrossRef] [Scilit]
- Cui, X.Y.; Chen, M.X.; Qin, R.; Han, L. Research advances in the convective initiation mechanisms. Meteorol. Mon. 2021, 47, 1297–1318. (In Chinese) [Google Scholar]
- Huang, Y.P.; Li, W.B.; Zhao, Y.C.; Bai, L.Q. A review of radar- and satellite-based observational studies and nowcasting techniques on convection initiation. Adv. Earth Sci. 2019, 34, 1273–1287. (In Chinese) [Google Scholar]
- Yao, X.P.; Cao, X.M. Research progress and prospect of atmospheric convection initiation. Trans. Atmos. Sci. 2023, 46, 940–949. (In Chinese) [Google Scholar]
- Maddox, R.A. Mesoscale convective complexes. Bull. Am. Meteorol. Soc. 1980, 61, 1374–1387. [Google Scholar]
- Mecikalski, J.R.; Bedka, K.M. Forecasting convective initiation by monitoring the evolution of moving cumulus in daytime GOES imagery. Mon. Weather Rev. 2006, 134, 49–78. [Google Scholar] [CrossRef] [Scilit]
- Mecikalski, J.R.; Bedka, K.M.; Paech, S.J.; Litten, L.A. A statistical evaluation of GOES cloud-top properties for nowcasting convective initiation. Mon. Weather Rev. 2008, 136, 4899–4914. [Google Scholar] [CrossRef] [Scilit]
- Sieglaff, J.M.; Cronce, L.M.; Feltz, W.F.; Bedka, K.M.; Pavolonis, M.J.; Heidinger, A.K. Nowcasting Convective Storm Initiation Using Satellite-Based Box-Averaged Cloud-Top Cooling and Cloud-Type Trends. J. Appl. Meteorol. Climatol. 2011, 50, 110–126. [Google Scholar] [CrossRef] [Scilit]
- Mecikalski, J.R.; Williams, J.K.; Jewett, C.P.; Ahijevych, D.; LeRoy, A.; Walker, J.R. Probabilistic 0–1-h Convective Initiation Nowcasts that Combine Geostationary Satellite Observations and Numerical Weather Prediction Model Data. J. Appl. Meteorol. Climatol. 2015, 54, 1039–1059. [Google Scholar] [CrossRef] [Scilit]
- Roberts, R.D.; Rutledge, S. Nowcasting storm initiation and growth using GOES-8 and WSR-88D data. Weather Forecast. 2003, 18, 562–584. [Google Scholar] [CrossRef] [Scilit]
- Walker, J.R.; Mackenzie, W.M.; Mecikalski, J.R.; Jewett, C.P. An enhanced geostationary satellite-based convective initiation algorithm for 0–2-h nowcasting with object tracking. J. Appl. Meteorol. Climatol. 2012, 51, 1931–1949. [Google Scholar] [CrossRef] [Scilit]
- Fabry, F.; Meunier, V.; Treserras, B.P.; Cournoyer, A.; Nelson, B. On the climatological use of radar data mosaics: Possibilities and challenges. Bull. Am. Meteorol. Soc. 2017, 98, 2135–2148. [Google Scholar] [CrossRef] [Scilit]
- Bai, L.; Chen, G.; Huang, L. Image processing of radar mosaics for the climatology of convection initiation in South China. J. Appl. Meteorol. Climatol. 2020, 59, 65–81. [Google Scholar] [CrossRef] [Scilit]
- Dixon, M.; Wiener, G. TITAN: Thunderstorm identification, tracking, analysis, and nowcasting—A radar-based methodology. J. Atmos. Ocean. Technol. 1993, 10, 785–797. [Google Scholar] [CrossRef] [Scilit]
- Johnson, J.T.; MacKeen, P.L.; Witt, A.; Mitchell, E.D.W.; Stumpf, G.J.; Eilts, M.D.; Thomas, K.W. The Storm Cell Identification and Tracking Algorithm: An Enhanced WSR-88D Algorithm. Weather Forecast. 1998, 13, 263–276. [Google Scholar] [CrossRef] [Scilit]
- Wang, Y.; Han, L.; Wang, H.Q. Statistical characteristics of convective initiation in the Beijing-Tianjin region revealed by six-year radar data. J. Meteorol. Res. 2014, 28, 1127–1136. [Google Scholar] [CrossRef] [Scilit]
- Bai, L.; Chen, G.; Huang, Y.; Meng, Z. Convection initiation at a coastal rainfall hotspot in South China: Synoptic patterns and orographic effects. J. Geophys. Res. Atmos. 2021, 126, e2021JD034642. [Google Scholar] [CrossRef] [Scilit]
- Cao, L.; Wu, M.; Luo, Y.; Chen, F. An objective algorithm for identification of post-Meiyu convection initiation and its spatiotemporal distribution over the urban agglomeration of Jiangsu and Shanghai. Acta Meteorol. Sin. 2024, 82, 275–288. (In Chinese) [Google Scholar]
- Wei, Q.; Sun, J.; Meng, X.; Zhang, Y.; Zheng, L.; Ma, Z. Convection initiation over central–eastern China: Statistics show higher frequencies over mountains with less stringent atmospheric conditions and more heterogeneous surface characteristics. Atmos. Res. 2026, 328, 108438. [Google Scholar] [CrossRef] [Scilit]
- Zhang, F.; Zhang, Q.; Sun, J.; Xu, J. Convection initiation during the Meiyu environment in the YangtzeHuai River Basin of China. J. Geophys. Res. Atmos. 2023, 128, e2022JD038077. [Google Scholar] [CrossRef] [Scilit]
- Nan, G.Q.; Chen, M.X.; Qin, R.; Han, L.; Cao, W. Identification, tracking and classification method of mesoscale convective system based on radar composite reflectivity mosaic and deep learning. Acta Meteorol. Sin. 2021, 79, 1002–1021. (In Chinese) [Google Scholar]
- Pan, X.; Lu, Y.; Zhao, K.; Huang, H.; Wang, M.; Chen, H. Improving nowcasting of convective development by incorporating polarimetric radar variables into a deep-learning model. Geophys. Res. Lett. 2021, 48, e2021GL095302. [Google Scholar] [CrossRef] [Scilit]
- Zhou, K.H.; Zheng, Y.G.; Han, L.; Dong, W.S. Advances in application of machine learning to severe convective weather monitoring and forecasting. Meteorol. Mon. 2021, 47, 274–289. (In Chinese) [Google Scholar]
- Yang, X.; Dai, K.; Zhu, Y. Progress and challenges of deep learning techniques in intelligent grid weather forecasting. Acta Meteorol. Sin. 2022, 80, 649–667. (In Chinese) [Google Scholar]
- Li, Y. Using Deep Learning for Severe Convective Nowcasting. Doctoral Thesis, Nanjing University of Information Science and Technology, Nanjing, China, 2023. (In Chinese) [Google Scholar]
- Han, D.; Lee, J.; Im, J.; Sim, S.; Lee, S.; Han, H. A Novel Framework of Detecting Convective Initiation Combining Automated Sampling, Machine Learning, and Repeated Model Tuning from Geostationary Satellite Data. Remote Sens. 2019, 11, 1454. [Google Scholar] [CrossRef] [Scilit]
- Fan, D.; Greybush, S.J.; Clothiaux, E.E.; Gagne, D.J. Physically Explainable Deep Learning for Convective Initiation Nowcasting Using GOES-16 Satellite Observations. Artif. Intell. Earth Syst. 2024, 3, e230098. [Google Scholar] [CrossRef] [Scilit]
- Sun, F.; Li, B.; Min, M.; Qin, D. Toward a Deep-Learning-Network-Based Convective Weather Initiation Algorithm From the Joint Observations of Fengyun-4A Geostationary Satellite and Radar for 0–1h Nowcasting. IEEE J. Sel. Top. Appl. Earth Obs. Remote Sens. 2023, 16, 3455–3468. [Google Scholar] [CrossRef] [Scilit]
- Zhang, T.; Zhou, Z.J.; Liu, Z.Q.; Shi, C.; Yao, S.; Jiang, L.; Yao, Y.; Zhang, Z.; Liang, X.; Zhang, Z.; et al. The CMA global atmospheric reanalysis version 1.5 (CRA1.5). J. Meteorol. Res. 2025, 39, 1379–1398. [Google Scholar] [CrossRef] [Scilit]
- Liu, N.; Xiong, A.Y.; Zhang, Q.; Liu, Y.J.; Zhan, Y.J.; Liu, Y.M. Development of basic dataset of severe convective weather for artificial intelligence training. J. Appl. Meteorol. Sci. 2021, 32, 530–541. (In Chinese) [Google Scholar]
- Reif, D.W.; Bluestein, H.B. A 20-year climatology of nocturnal convection initiation over the central and southern Great Plains during the warm season. Mon. Weather Rev. 2017, 145, 1615–1639. [Google Scholar] [CrossRef] [Scilit]
- Weckwerth, T.M.; Wilson, J.W.; Hagen, M.; Emerson, T.J.; Pinto, J.O.; Rife, D.L.; Grebe, L. Radar climatology of the COPS region. Q. J. R. Meteorol. Soc. 2011, 137, 31–41. [Google Scholar] [CrossRef] [Scilit]
- Zhu, Q.G.; Lin, J.R.; Shou, S.W.; Tang, D.S. Principles and Methods of Synoptic Meteorology; China Meteorological Press: Beijing, China, 2007; pp. 401–437. (In Chinese) [Google Scholar]
- Ester, M.; Kriegel, H.; Sander, J.; Xu, X. A density-based algorithm for discovering clusters in large spatial databases with noise. In Proceedings of the Second International Conference on Knowledge Discovery and Data Mining (KDD-96); AAAI Press: Portland, OR, USA, 1996; pp. 226–231. [Google Scholar]
- Zhou, M.; Du, X.; Luo, J.; Qi, D.; Zhou, W. Analysis of environmental field and radar echo characteristics for an extreme wind and hail event occurred in Guizhou on 15 May 2021. Torrential Rain Disasters 2022, 41, 158–166. (In Chinese) [Google Scholar]
- Wu, H.; Sun, J.; Mu, R.; Zhuang, X.; Lü, R.; An, L. Analysis of extreme convective gusts caused by two types of weather storms during a strong convection event. Acta Meteorol. Sin. 2023, 81, 205–217. (In Chinese) [Google Scholar]
- Pan, M.; Hu, Z.; Zhang, W.; Zhang, D.; Chen, Y.; Wang, M. Spatiotemporal distribution characteristics and relationship on terrain of Convection Initiation in Hubei Province. Torrential Rain Disasters 2026, 45, 554–563. (In Chinese) [Google Scholar]
- Xu, Z.B.; Hu, Z.; Zheng, J.; Dong, Z.; Zhang, Y.; Su, H. Research on intelligent forecasting technology of convection initiation in Hainan and the South China Sea Islands. J. Trop. Meteorol. 2026; in press. (In Chinese)

Disclaimer/Publisher’s Note: The statements, opinions and data contained in all publications are solely those of the individual author(s) and contributor(s) and not of MDPI and/or the editor(s). MDPI and/or the editor(s) disclaim responsibility for any injury to people or property resulting from any ideas, methods, instructions or products referred to in the content. |
© 2026 by the authors. Licensee MDPI, Basel, Switzerland. This article is an open access article distributed under the terms and conditions of the Creative Commons Attribution (CC BY) license.