


Highlights
What are the main findings?
- Combines satellite and aircraft data to characterize aerosol/cloud spatial patterns and vertical structures across typical Chinese regions.
- Aerosol vertical and microphysical properties differ greatly across regions. Polluted northern areas retain heavy aerosol burdens up to 3 km with fine particles, while dust and coastal zones have coarser aerosols.
- Satellite AOD correlates with aircraft aerosol data, modulated by upper-atmosphere aerosols and hygroscopic growth. Cloud droplet number concentration negatively correlates with droplet size.
What are the implications of the main findings?
- The consistency between MODIS retrievals and aircraft in-situ data verifies the reliability of MODIS aerosol products for regional atmospheric environmental assessment.
- Vertical aircraft measurements provide critical vertical constraints to complement column-integrated satellite data, offering observational support for improving aerosol–cloud parameterization schemes in climate models.
- The multi-source satellite–aircraft joint observation framework can be widely applied to aerosol–cloud interaction studies in regions with complex natural and anthropogenic emissions.
Abstract
Aerosols exert significant impacts on Earth’s radiation balance through direct and indirect effects, with the latter representing the largest uncertainty in current climate models. To clarify aerosol–cloud interactions over China, this study synergized MODIS satellite retrievals (2015–2020) with in-situ MA60 aircraft observations across six representative regions. Satellite data provided aerosol optical depth (AOD), cloud optical depth (COD), cloud effective radius (CER), and cloud phase, while aircraft measurements delivered vertical profiles and microphysical properties of aerosols and cloud droplets. Results show that AOD exhibits a “high east, low west” pattern, with hotspots in the North China Plain and Sichuan Basin, and a significant decreasing trend over polluted regions. Cloud phase is spatially heterogeneous, with water clouds dominating the southeast and ice clouds prevailing in the northwest (>85% over the Tibetan Plateau). Water cloud COD shows a southeast-high–northwest-low distribution, with a clear inverse CER-COD correlation. Aircraft data reveal that polluted northern sites have high near-surface aerosol concentrations with small effective diameters (~0.3 μm), while cloud droplet number concentration and size spectra vary markedly across regions. These findings provide a robust observational foundation for improving aerosol–cloud interaction parameterizations in climate models.
1. Introduction
Aerosols are a critical component of the Earth–atmosphere–ocean system. They affect the planet’s radiation balance not only through direct scattering and absorption of radiation, known as the direct aerosol radiation effect, but also by altering the micro- and macro-physical properties of clouds. These modifications influence cloud formation, lifetime, and precipitation efficiency, collectively known as the indirect aerosol–radiation effects [1,2]. Representing these indirect effects remains the largest source of uncertainty in current climate models [3] because even modest changes in cloud characteristics can propagate through the entire weather and climate system. Consequently, advancing our understanding of the characteristics and distributions of aerosols and clouds is essential for elucidating the aerosol–cloud–precipitation chain and for quantifying aerosol impacts on climate.
Nowadays, there are many technical methods for detecting aerosols and clouds, mainly including remote sensing methods and in-situ aircraft observations. Ground-based remote sensing instruments, such as AERONET, are capable of capturing the vertical distribution characteristics of aerosols and clouds with high precision for fixed observation sites, yet their deployment is geographically limited [4]. Satellite remote sensing can provide long time series and spatially continuous aerosol and cloud products, and with the continuous improvement of the algorithm in recent years, the accuracy of the product has been greatly improved [5,6,7,8]. However, the primary disadvantage of satellite data is that it can only reflect the integration columnar properties of the atmosphere, and it cannot obtain the vertical structure microphysical characteristics of aerosols and clouds.
In contrast, although the number of samples for aircraft in-situ observation is limited, the airborne aerosol and cloud detection equipment can obtain high-precision vertical distribution and microphysical information of atmospheric aerosols and clouds, which can be a good supplement to satellite remote sensing products [9,10]. In the past observations, due to the limitations of airspace and flight costs, a lot of aircraft observations were focused on the characteristics of aerosols and clouds under different weather backgrounds in local areas. Recently, a number of aircraft experiments in China have been carried out by the weather modification center, CMA, which provided a great foundation for studying the characteristics of aerosols and clouds in different regions and environments across the country [11,12,13,14].
This study integrates MODIS satellite remote sensing data (2015–2020) and MA60 aircraft in-situ observation data from six representative regions in China to conduct a comprehensive analysis of aerosols and clouds from macro and micro perspectives. Specifically, this study aims to reveal the spatiotemporal distribution characteristics of aerosol and cloud parameters across China based on MODIS data, analyze the vertical distribution and microphysical characteristics of aerosols and cloud droplets under different environmental backgrounds through aircraft in-situ observations, and explore the basic correlation between aerosol background conditions and cloud microphysical parameters, with the research results expected to provide a scientific basis for further studies on aerosol–cloud interactions and regional climate effect assessment in China.
2. Data
2.1. MODIS Satellite Data
To obtain the characteristics of aerosols and clouds with long-term temporal and continuous space coverage, MODIS data were used to analyze the distribution of aerosols and clouds in China in recent years. MODIS is the main sensor on the TERRA and AQUA polar-orbiting satellites launched by the National Aeronautics and Space Administration (NASA, Goddard Space Flight Center, Greenbelt, MD, USA). They cooperate with each other to obtain global meteorological data of 36 bands within the 0.4–14.4 μm spectral range every one to two days. The data products of the two satellites are named with MOD and MYD, respectively [5,6].
MODIS Level 2 aerosol (MOD04/MYD04 C6.1) and cloud (MOD06/MYD06 C6.1) products spanning January 2015 to December 2020 were utilized in this study, with all datasets downloaded from the NASA Land Atmosphere Near Real-time Capability for website (https://ladsweb.modaps.eosdis.nasa.gov, accessed on 1 January 2022) [15,16]. This time range was selected to maintain consistency with the aircraft observation period. Key retrieved parameters included aerosol optical depth (AOD) at a 550 nm wavelength, which was derived via the Deep Blue (DB) algorithm for its high retrieval accuracy over China’s land surfaces and bright areas [17], cloud optical depth (COD) and cloud effective radius (CER) as the core microphysical parameters for characterizing cloud optical properties and particle size features, and cloud phase, which is classified into liquid water cloud, ice cloud, and undetermined cloud based on the 8 μm, 11 μm, and 12 μm infrared channels [18]. To ensure data reliability, only the highest quality AOD data with a quality assurance (QA) value of 3 were retained for subsequent analysis, while cloud phase data marked with missing values (Value = 0) or clear sky conditions (Value = 1) were excluded entirely.
The original MODIS data were processed through a systematic four-step procedure: first, geometric correction was conducted via the MODIS geometric correction model to eliminate spatial distortion in the raw data; second, MODIS swath data were spliced and then clipped to the study area of the Chinese mainland using the China administrative boundary vector map; third, all preprocessed data were resampled to a uniform spatial resolution of 0.1° × 0.1° employing bilinear interpolation to facilitate consistent spatial analysis; and finally, rigorous quality control was implemented to remove abnormal values induced by sensor noise and atmospheric interference. The DB algorithm was prioritized for AOD retrieval over the traditional Dark Target (DT) algorithm due to its superior accuracy across China’s land areas, particularly in heavily polluted regions [19,20,21]. COD retrieval adopted the 0.645 μm band for land-based clouds and the 0.858 μm band for ocean-based clouds, while CER was retrieved using the 2.13 μm and 3.75 μm infrared bands [22,23].
2.2. Aircraft In-Situ Observation Data
This study conducts observational investigations into the vertical distribution features and microphysical properties of atmospheric aerosols and cloud droplet particles, utilizing the Modern Ark 60 (MA60) aircraft operated by the Weather Modification Center of the China Meteorological Administration. Compared with conventional small-sized observation aircraft, the MA60 platform possesses superior comprehensive performance, enabling it to support aerosol and cloud physics observation experiments across diverse regions of China [11,12]. The airborne detection equipment includes three core instruments including the Passive Cavity Aerosol Spectrometer Probe (PCASP, Droplet Measurement (DMT) Inc., Boulder, CO, USA) for measuring aerosol particles ranging 0.1–3 μm within 30 variable size channels and delivering aerosol number concentration data with a measurement error limited to 10–15% [24,25,26]; the Cloud Droplet Probe (CDP, DMT, Boulder, CO, USA) for sampling cloud droplets of 2–50 μm over 30 size bins with a systematic measurement uncertainty of 20% [27,28]; and the Aircraft Integrated Meteorological Measurement System (AIMMS, Aventech Research Inc., Barrie, ON, Canada) for recording ambient air temperature, pressure, humidity, three-dimensional wind, latitude, longitude, altitude and other information during the flight [11]. All instruments receive annual official calibration from DMT and undergo rigorous debugging and performance validation prior to each flight observation.
Six representative observation regions were selected, covering Northeast, North, Central, East, South, and Northwest China and representing different environmental backgrounds (anthropogenic pollution, clean tourist area, coastal area, dust-affected area). The basic information about the observation regions is shown in Table 1.
Table 1.
Basic information about aircraft observation regions.
A total of 32 flight observations were carried out, with each flight lasting 2–4 h. The aircraft obtained aerosol, cloud particle, and meteorological element data at different altitudes during the ascent and descent stages (0–6000 m). All observations were conducted under sunny or cloudy conditions with no obvious surface precipitation to avoid the interference of precipitation on aerosol and cloud particle measurements.
Strict data quality control was carried out on the original aircraft observation data to eliminate abnormal values and ensure data reliability, which included eliminating aerosol data in cloud areas and observation cases with obvious temperature inversion layers, removing outliers and abnormal values of AIMMS meteorological data, conducting signal overflow screening, stray light removal, noise reduction and depth of field correction for PCASP and CDP scattering probes, eliminating the 1 min unstable data of the CCN counter after switching supersaturation, and defining cloud areas with the threshold of cloud droplet number concentration (Nc) > 10 cm−3 and liquid water content (LWC) > 0.001 g/m3 with only 5 continuous height layers meeting the threshold identified as valid cloud areas [11,12].
3. Results and Discussions
3.1. Spatial-Temporal Distribution Characteristics of Aerosols in China
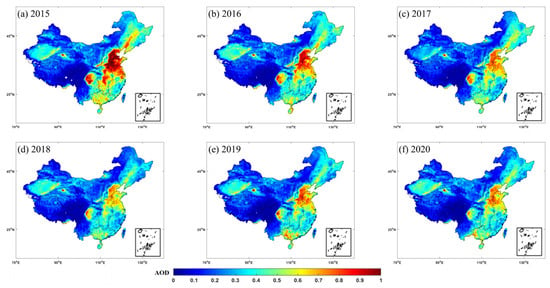
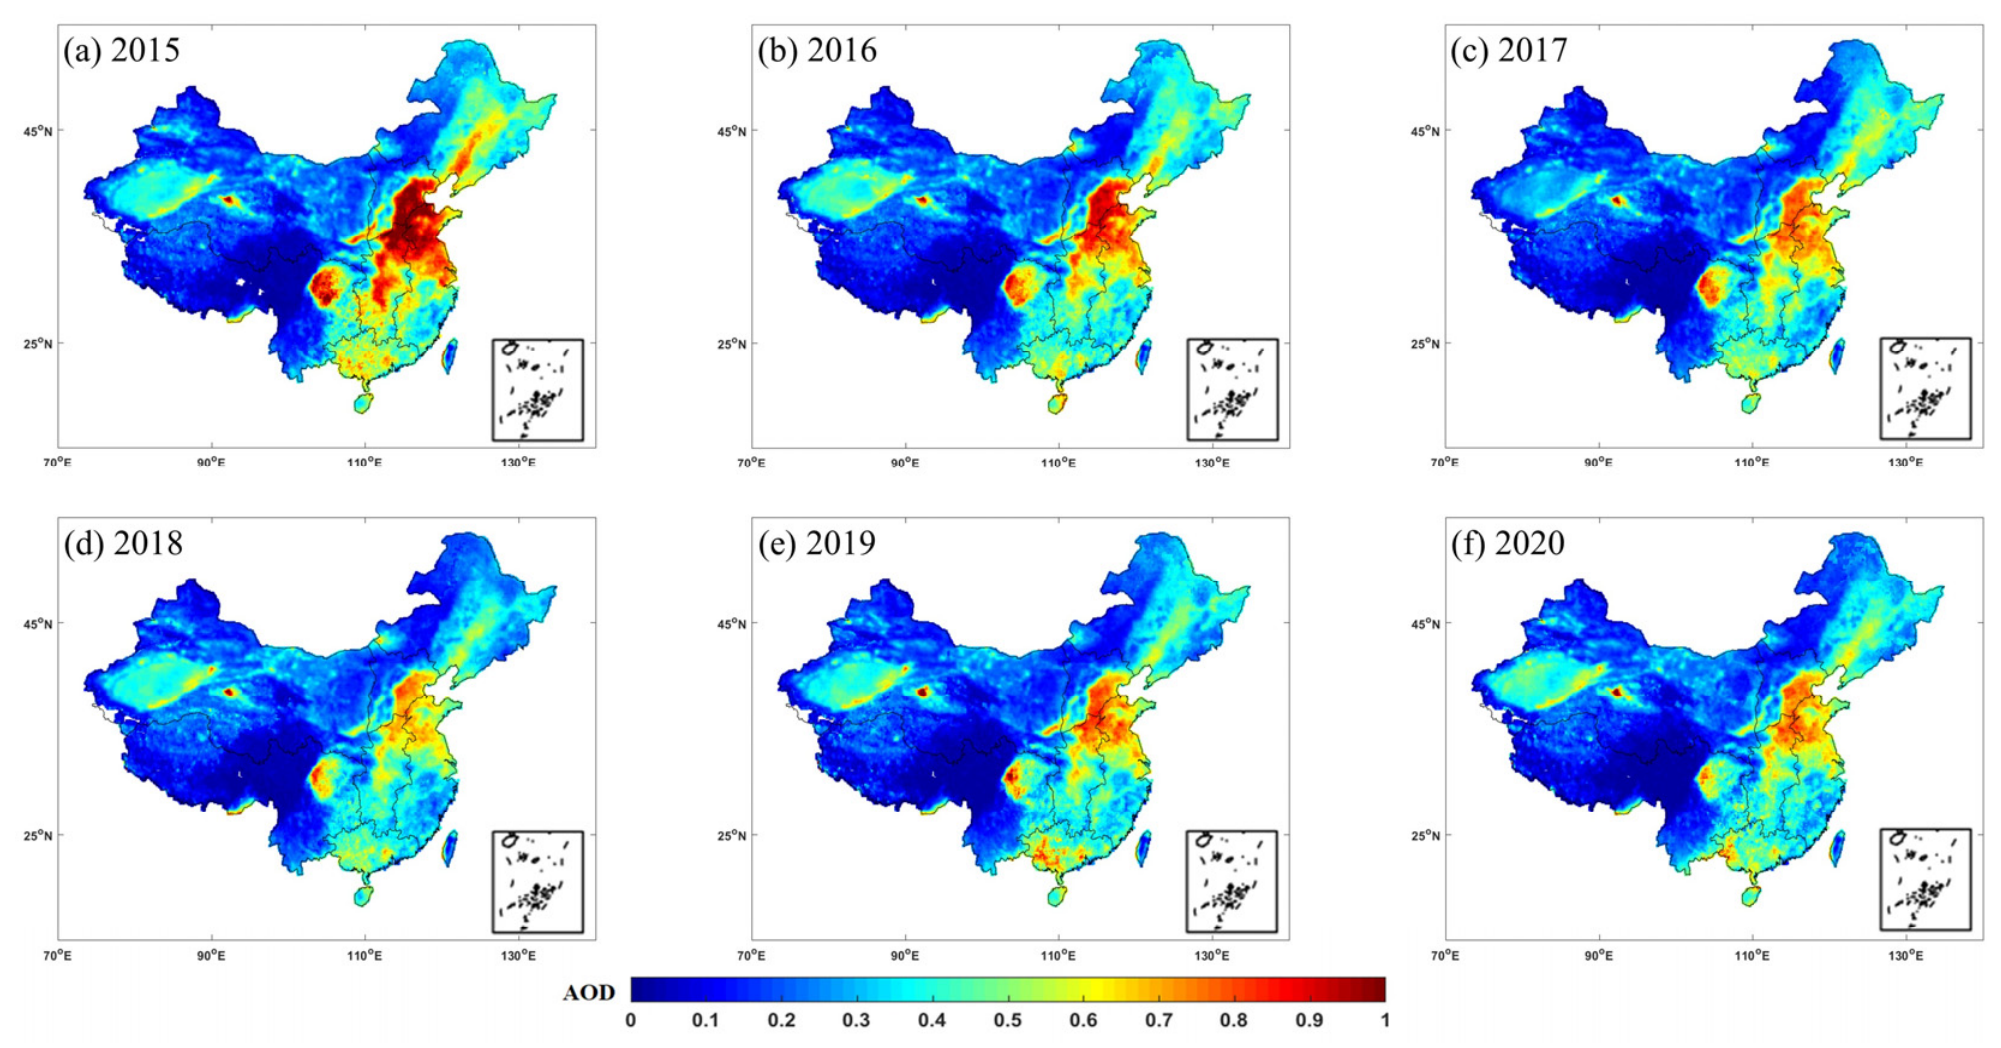
The spatial distribution of the annual average AOD in China from 2015 to 2020 is shown in Figure 1. The overall spatial distribution of China is an obvious pattern of high in the east and low in the west. In the eastern region of China, the high-value areas of AOD are mainly concentrated in the North China Plain (especially Beijing Tianjin Hebei region), the Yangtze River Delta and the Pearl River Delta, which are affected by high population density, developed industry and heavy anthropogenic emissions [29]. In the western region of China, the high value area of AOD mainly appears in the Sichuan Basin, Qaidam Basin, and Tarim Basin, which are affected by the terrain and natural environment. The Sichuan Basin has an average AOD of about 0.67, higher than the surrounding areas, due to industrial emissions and terrain-induced poor aerosol diffusion [30]. The Tarim Basin and Qaidam Basin in northwest China are affected by sand dust and basin terrain, resulting in high natural aerosol loading [31,32]. The low-value areas of AOD are mainly distributed in the Qinghai–Tibet Plateau, Inner Mongolia grassland and other regions with sparse population, less human activity and a clean atmospheric environment.
Figure 1.
Inter-annual variation of average AOD in China from 2015 to 2020.
The national average AOD in China from 2015 to 2020 was 0.35, 0.32, 0.30, 0.29, 0.30 and 0.29, respectively, showing a significant downward trend. The decline is mainly concentrated in the eastern anthropogenically polluted regions: the AOD of the North China Plain decreased from 1.21 in 2015 to about 0.70 in 2020, and the Sichuan Basin also saw a significant AOD decline with the reduction of pollution emissions. In contrast, the AOD in western regions affected by natural conditions (Tarim Basin, Qaidam Basin) showed no significant inter-annual change. This decline is consistent with the emission reductions following China’s Air Pollution Prevention and Control Plan launched in 2013 [33,34], though meteorological variability may also have contributed to the observed trend.
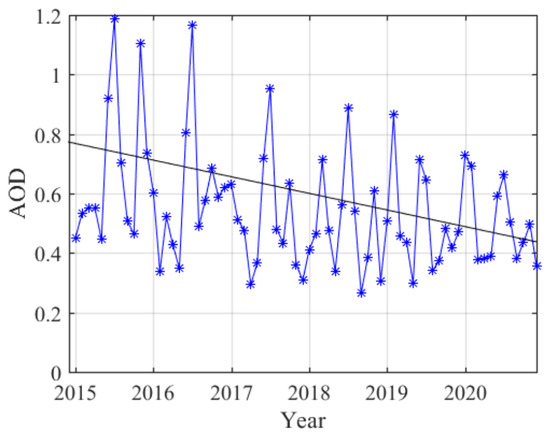
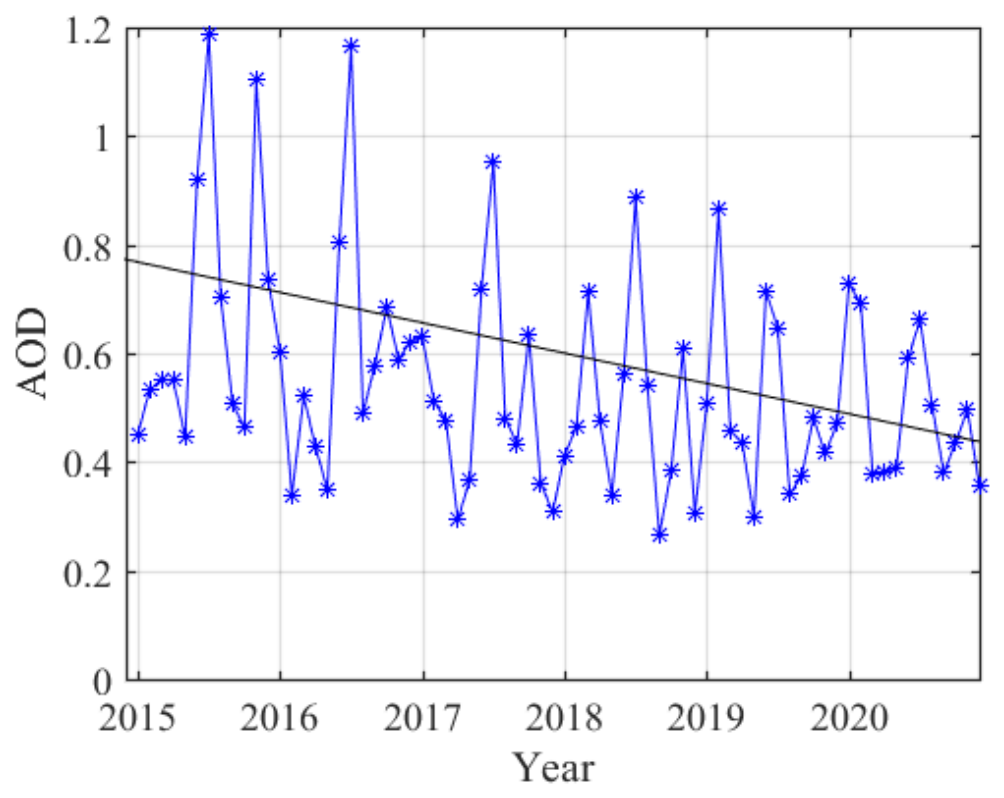
To provide a more detailed view of the AOD trend, we examined the monthly AOD variations over the Beijing–Tianjin–Hebei region, one of the most polluted areas in China. As shown in Figure 2, this region has exhibited a significant downward trend from 2015 to 2020. The six-year mean AOD values were 0.67, 0.59, 0.51, 0.50, 0.49, and 0.48, respectively. On the monthly scale, July consistently recorded the highest AOD values, with a multi-year monthly mean of 0.92 and a peak value of 1.19 in July 2015. June ranked second with a mean of 0.72. In contrast, May and September exhibited relatively low AOD levels, with means of 0.36 and 0.42, respectively.
Figure 2.
Monthly variation of AOD over the Beijing–Tianjin–Hebei region from 2015 to 2020. The blue dots and lines represent the monthly mean AOD values, and the black soild line denotes the linear fitting trend over the six-year period.
3.2. Spatial Distribution Characteristics of Clouds in China
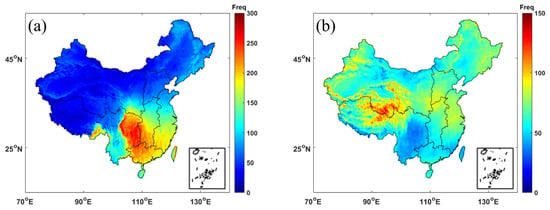
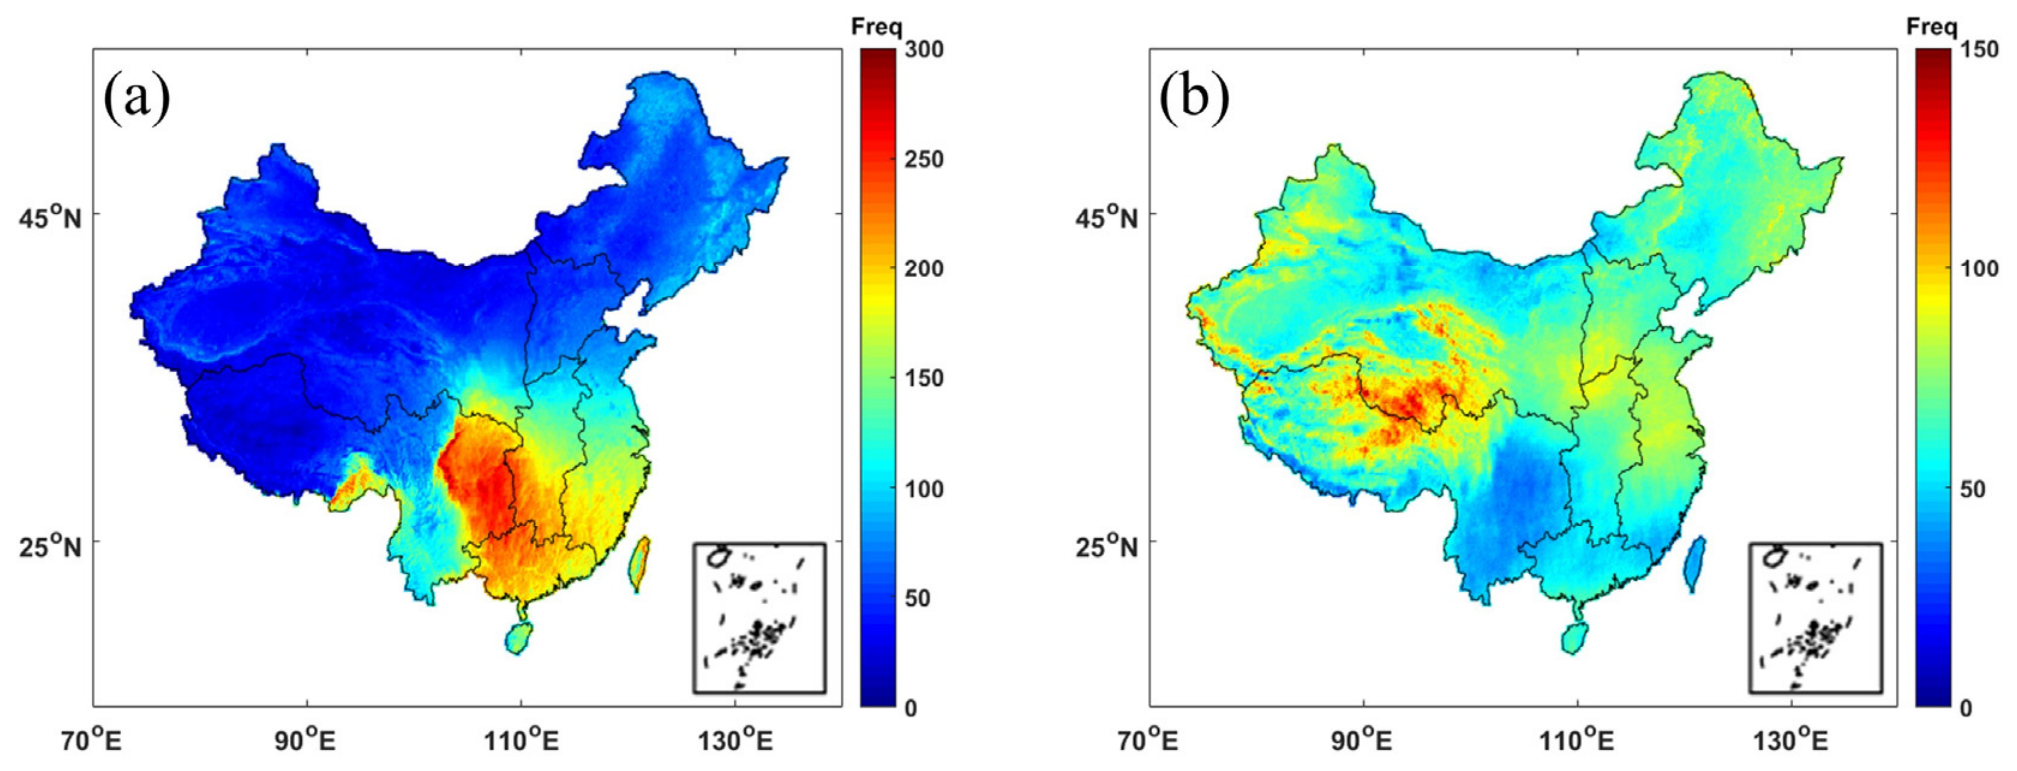
The difference in the phase and optical characteristics between water clouds and ice clouds determines that there are obvious differences in their roles in the aerosol–cloud radiation interaction. In water clouds, droplets primarily exist as spherical particles. In contrast, ice crystal particles in ice clouds exhibit a more diverse range of shapes, including hexagonal plates, columns, dendrites, needles, and capped columns. These differences in phase state, diameter, and shape between water cloud particles and ice cloud particles result in significant differences in their effects on light scattering and absorption. So according to MODIS cloud phase classification data, clouds in China are divided into water clouds and ice clouds, with obvious regional differences in their occurrence frequency as shown in Figure 3. The annual average occurrence frequency of water clouds in China is 81.62 times, mainly distributed from the Sichuan Basin to the southeast coastal areas, with the Sichuan Basin having the highest frequency of 292 times per year, accounting for about 80% of the whole year, while the Qinghai–Tibet Plateau has the lowest frequency of only 0.29 times per year due to low temperature and scarce water vapor.
Figure 3.
Annual average comparison of the occurrence frequencies of clouds over China from 2015 to 2020: (a) water clouds; (b) ice clouds.
The annual average occurrence frequency of ice clouds in China is 65.01 times lower than that of water clouds, mainly distributed in high-altitude mountainous areas such as the Qinghai–Tibet Plateau and the Qilian Mountains, with the highest frequency reaching 157.43 times per year, and the low-frequency areas are the Sichuan Basin, the Yunnan–Guizhou Plateau and the southeast coastal areas with the lowest average of about 2.05 times per year.
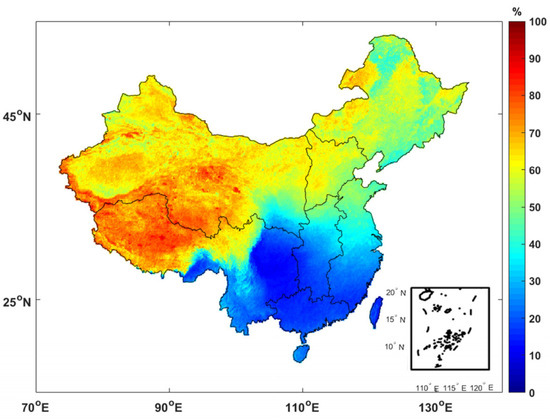
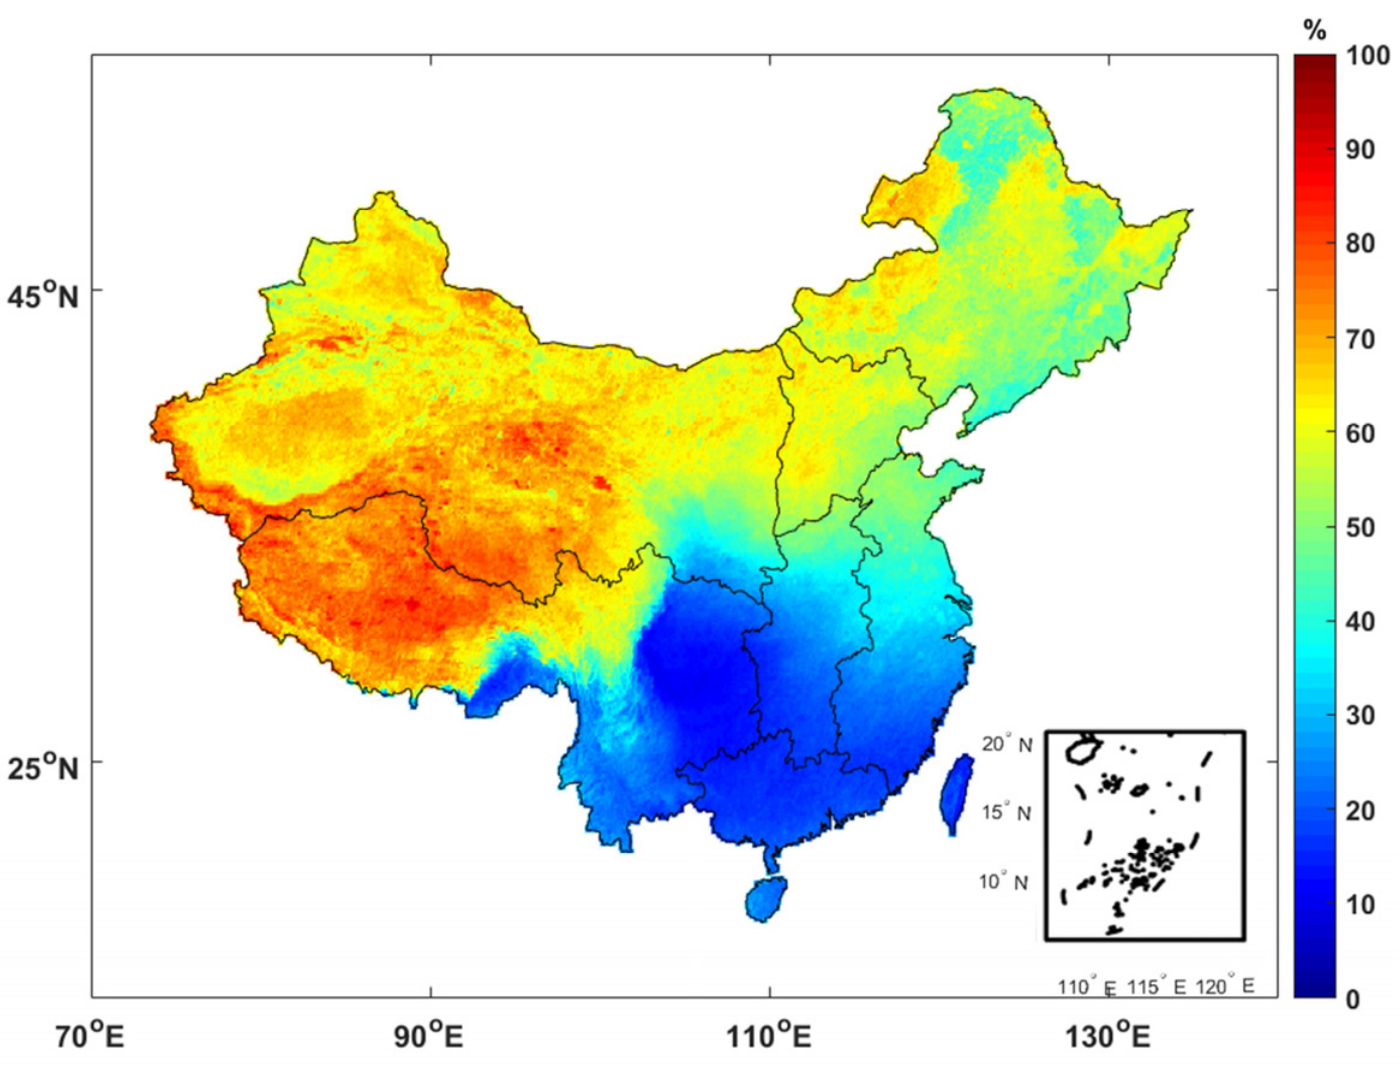
The proportion of ice clouds to total clouds from 2015 to 2020 was calculated, and the results are shown in Figure 4. The proportion of ice clouds in total clouds in China is 48.15%, with a significant north–south difference. The Qinghai–Tibet Plateau has the highest proportion of more than 85% and up to 93.11%, followed by Xinjiang and Inner Mongolia at about 70% and the northern North China Plain including Beijing–Tianjin–Hebei and Shanxi at about 60%, while from the Sichuan Basin to the southeast coast, clouds are dominated by water clouds with the proportion of ice clouds generally less than 30%.
Figure 4.
The proportion of ice clouds in total cloud cover in China from 2015 to 2020.
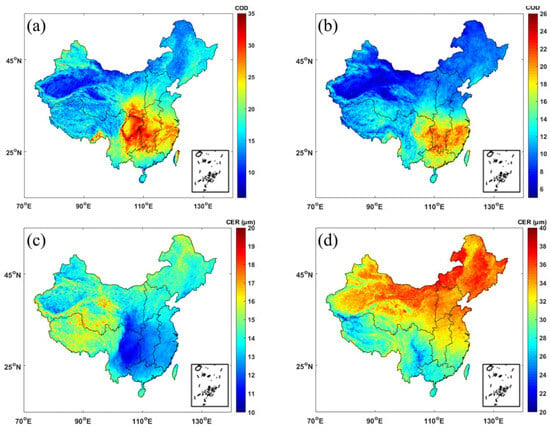
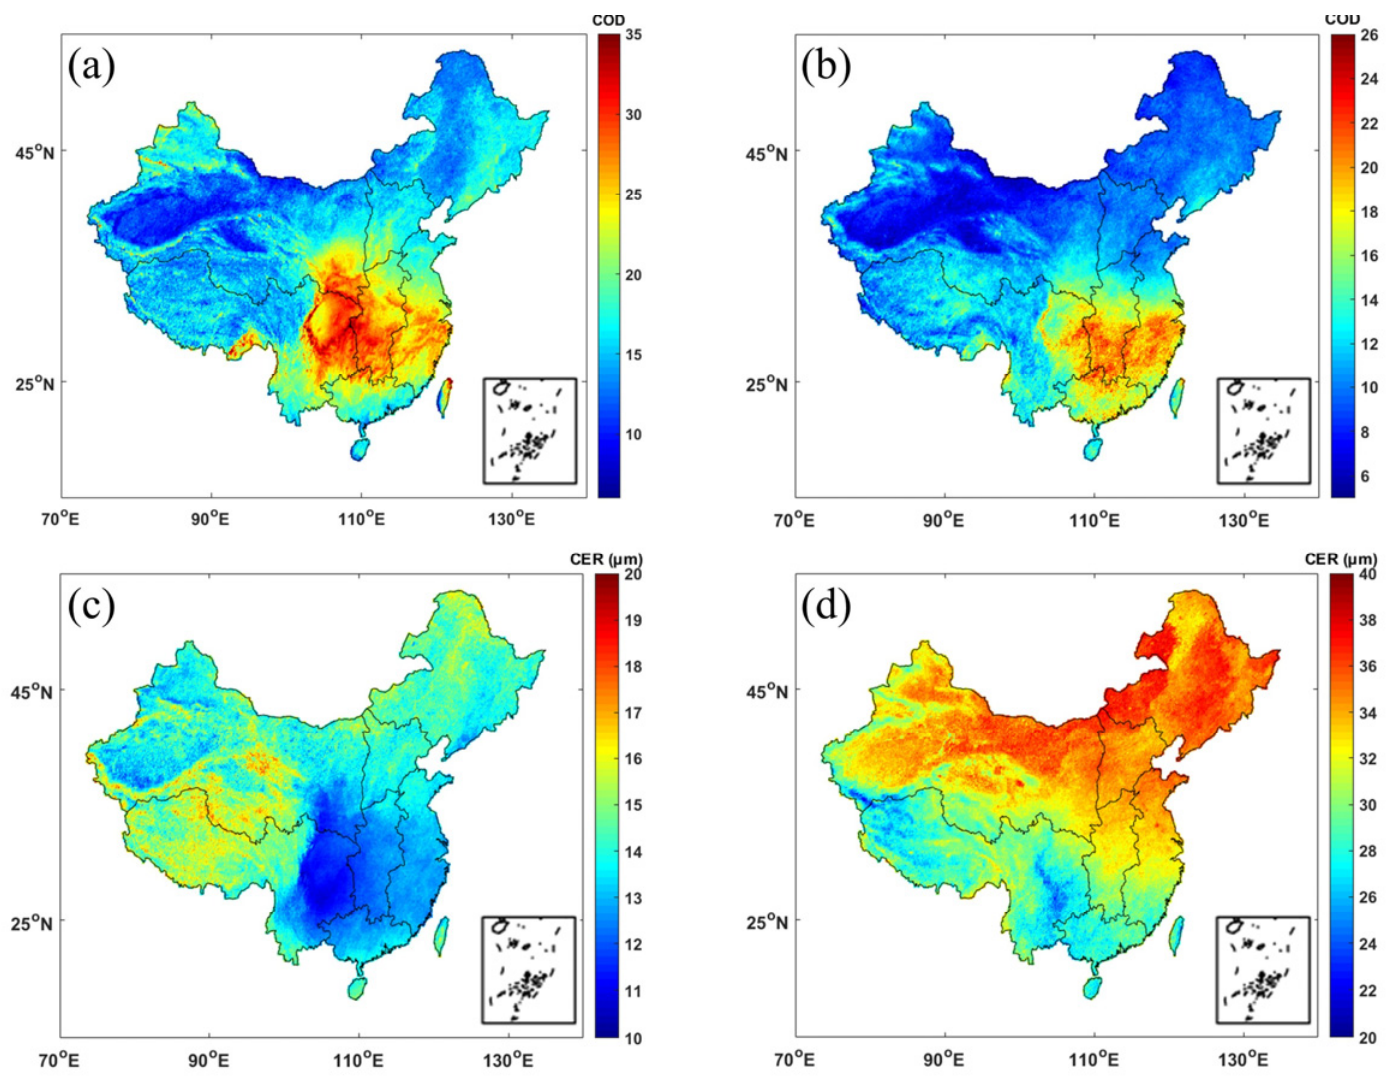
COD is the extinction ability of clouds in the atmosphere on the whole path. This parameter can represent the cloud amount and cloud thickness of clouds in the atmosphere. The cloud effective radius (CER) represents the mean size of cloud droplets in the atmosphere and plays an important role in the process of aerosol-cloud-precipitation [22]. The distribution of average COD and CER of ice clouds and water clouds in China from 2015 to 2020 is shown in Figure 5.
Figure 5.
Comparison of COD and CER for water clouds and ice clouds over China from 2015 to 2020: (a) COD for water clouds; (b) COD for ice clouds; (c) CER for water clouds; (d) CER for ice clouds.
The COD of water clouds over China from 2015 to 2020 is 16.16 and shows a spatial pattern of “southeast high and northwest low”. Although AOD decreased significantly in areas heavily influenced by human activities during the six-year period, there was no significant difference in the annual mean values of COD over the same period. The high-value areas include the Sichuan Basin with a COD of 38.47, the highest in China, as well as Central China and South China. The high COD in the Sichuan Basin is attributed to the combined blocking effect of the Qinghai–Tibet Plateau and westerly winds as well as sufficient water vapor from the Yangtze River and its tributaries, and South China is affected by the East Asian summer monsoon with abundant precipitation and water vapor, forming a high COD area. The low-value areas are inland regions in the northwest such as the Tarim Basin and the Qaidam Basin with the lowest COD of only 6.20, owing to scarce water vapor caused by long distance from water sources and terrain blocking of water vapor transmission. The North China Plain, as a high AOD area, has a significantly lower COD than the southern regions, reflecting the insufficient water vapor condition in northern China that restricts cloud formation. For ice clouds, except for the Tibetan Plateau region, the overall COD values over other parts of China were generally lower than those of water clouds. The national average ice cloud COD over the six-year period was 11.25, with the low-value region still located near the Tarim Basin, where the minimum value was 5.21. In contrast, the high-value region of ice cloud COD was distributed more southeastward compared to that of water clouds, with a maximum value of 25.42. It can be observed that although ice clouds account for a relatively low proportion of total clouds in South China and occur less frequently, their ice cloud COD remains a high-value area nationwide. This is primarily because these regions have abundant water vapor; once clouds form, the ample water vapor supply facilitates the development of relatively deep cloud layers.
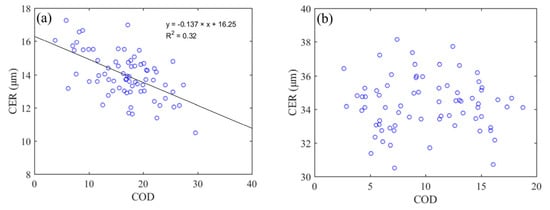
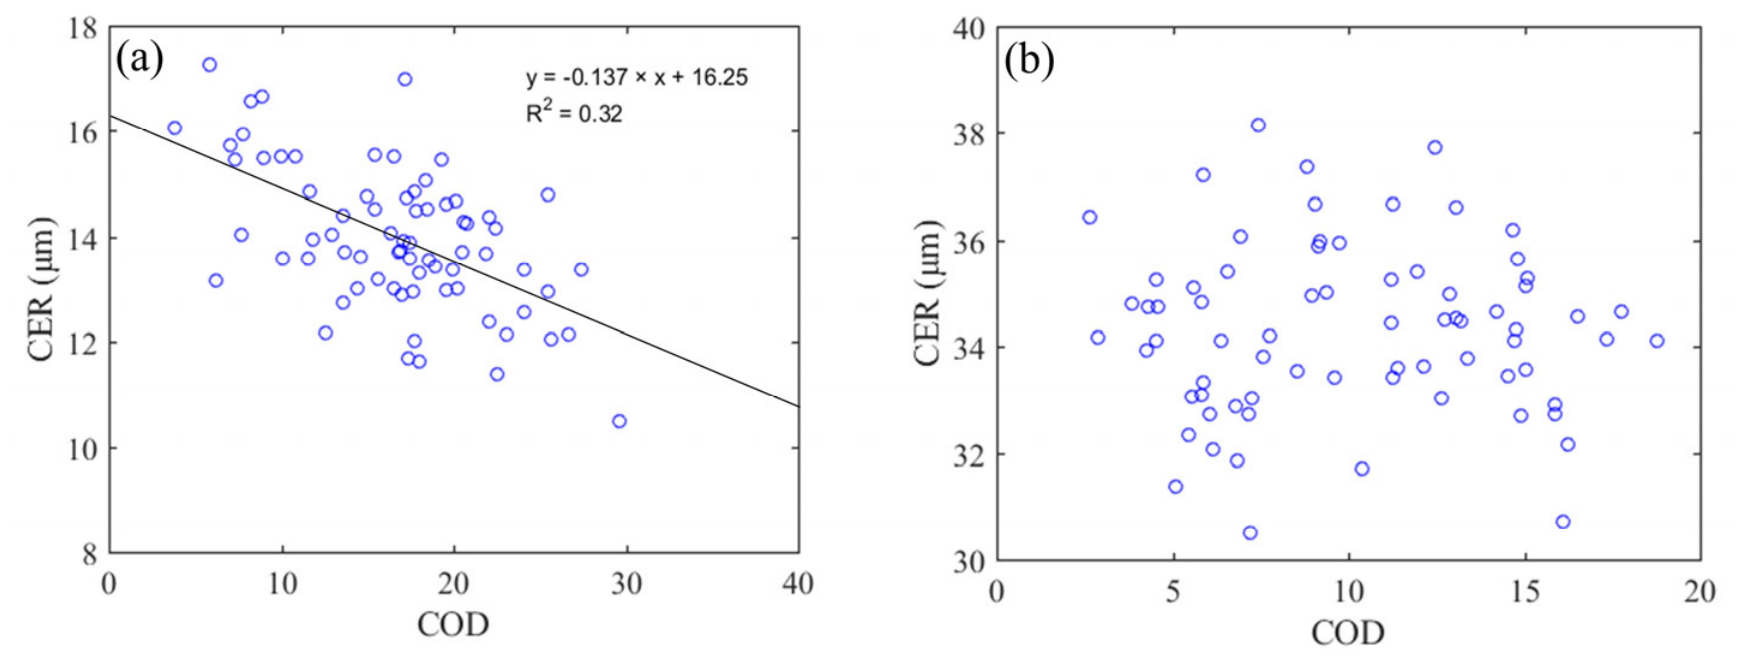
There are significant differences in CER between water clouds and ice clouds in China with quite distinct distribution characteristics. The national average CER of water clouds is 14.22 μm, ranging from 10.39 to 20.31 μm, with the maximum value in the Qinghai–Tibet Plateau and the minimum value in the Sichuan Basin. In contrast, the average CER of ice clouds is 32.29 μm, almost twice that of water clouds, ranging from 21.25 to 39.14 μm. To clarify the distribution relationship between COD and CER, their scatter plots in the Beijing–Tianjin–Hebei region are analyzed, as shown in Figure 6. It can be seen that water clouds exhibit a more pronounced inverse correlation between CER and COD, with a correlation coefficient of −0.56. This result is also supported by the nationwide distribution indicating that higher COD (i.e., more cloud droplets) corresponds to smaller CER. This is because an increase in cloud droplet number concentration intensifies competition for water vapor, thereby reducing the amount of water vapor available to each droplet and hindering its growth. However, the nationwide distribution results also show that the correlation between ice cloud CER and COD is not as evident as that of water clouds. The scatter points for COD and CER in the Beijing–Tianjin–Hebei region are relatively dispersed, reflecting the complex formation and growth processes of ice crystal particles, which are affected by more factors such as temperature and vertical motion than liquid water droplets [35].
Figure 6.
Comparison and statistical results of COD and CER in the Beijing–Tianjin–Hebei region: (a) water clouds; (b) ice clouds. The blue dots represent the samples of COD and the corresponding CER, and the black soild line denotes the linear fitting result.
3.3. Aircraft Observation of Aerosol Vertical and Microphysical Properties
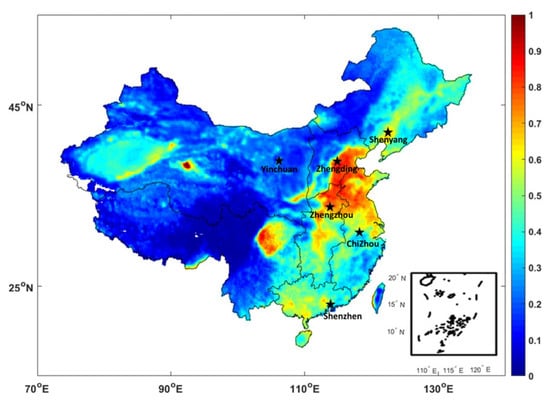
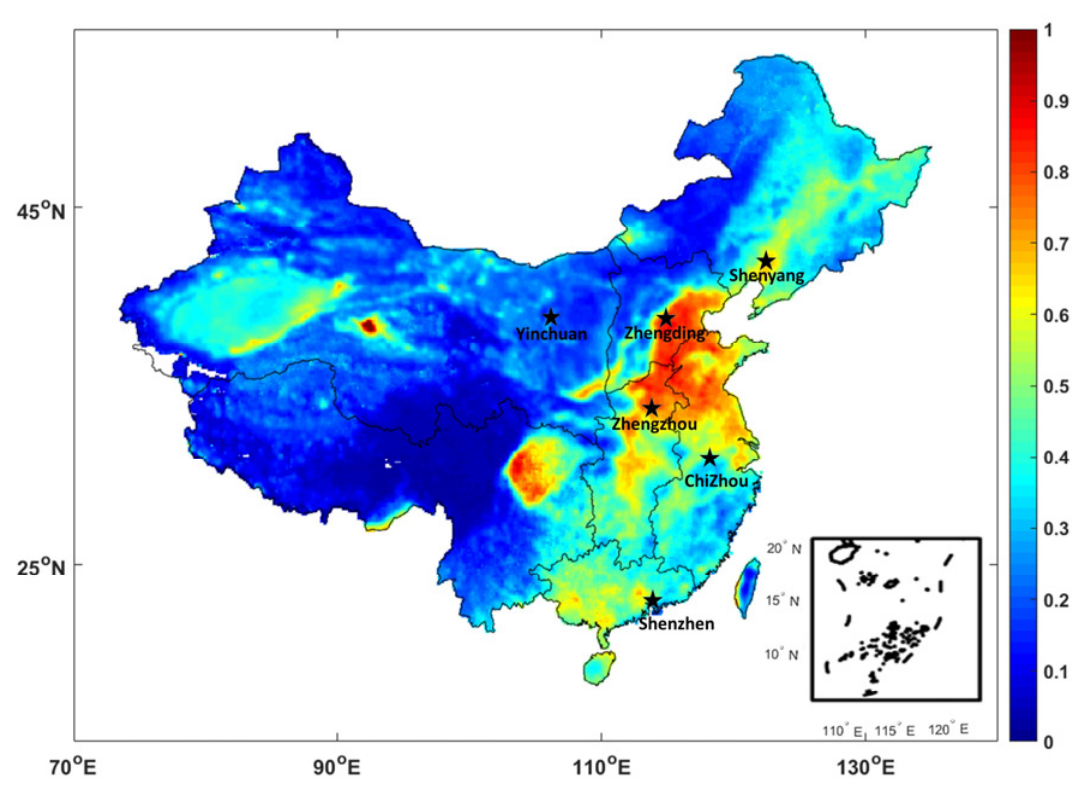
The in-situ observation data of MA60 aircraft in China were collected, and the local representative cases were selected to study the vertical distribution and particle size distribution characteristics of aerosols and clouds in different regions of China. The selected positions were located in Shenyang, Liaoning, Zhengding, Hebei, Zhengzhou, Henan, Chizhou, Anhui, Shenzhen, Guangdong, and Yinchuan, Ningxia. The locations of the observations are shown in Figure 7. To understand the aerosol background of the observation area, the average distribution of AOD in China from 2015 to 2020 is superimposed in the figure.
Figure 7.
The location of aircraft observation, the star symbols represent the positions of the aircraft observations.
The aircraft data used in this study are from 32 flights, and the aerosol, cloud particles, and other meteorological elements at different altitudes were obtained during the ascent and descent stage of the aircraft. The aircraft observation periods were sunny or cloudy, and there was no obvious precipitation near the ground. The basic flight information, such as date, starting and finish times, thermal inversion layer height, and cloud height, is listed in Table 2, where ‘///’ denotes cases with no detectable inversion or cloud layer.
Table 2.
The basic information about aircraft observation in China.
To ensure the accuracy of aerosol data and the comparability of individual cases in different regions, when comparing the vertical profiles of aerosols, we first eliminate the aerosol data in clouds and the cases with an obvious inversion layer [11].
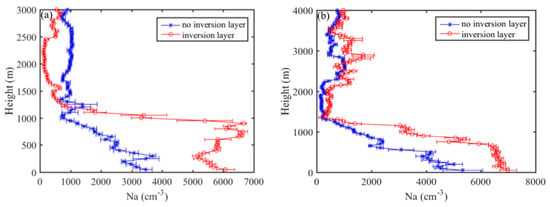
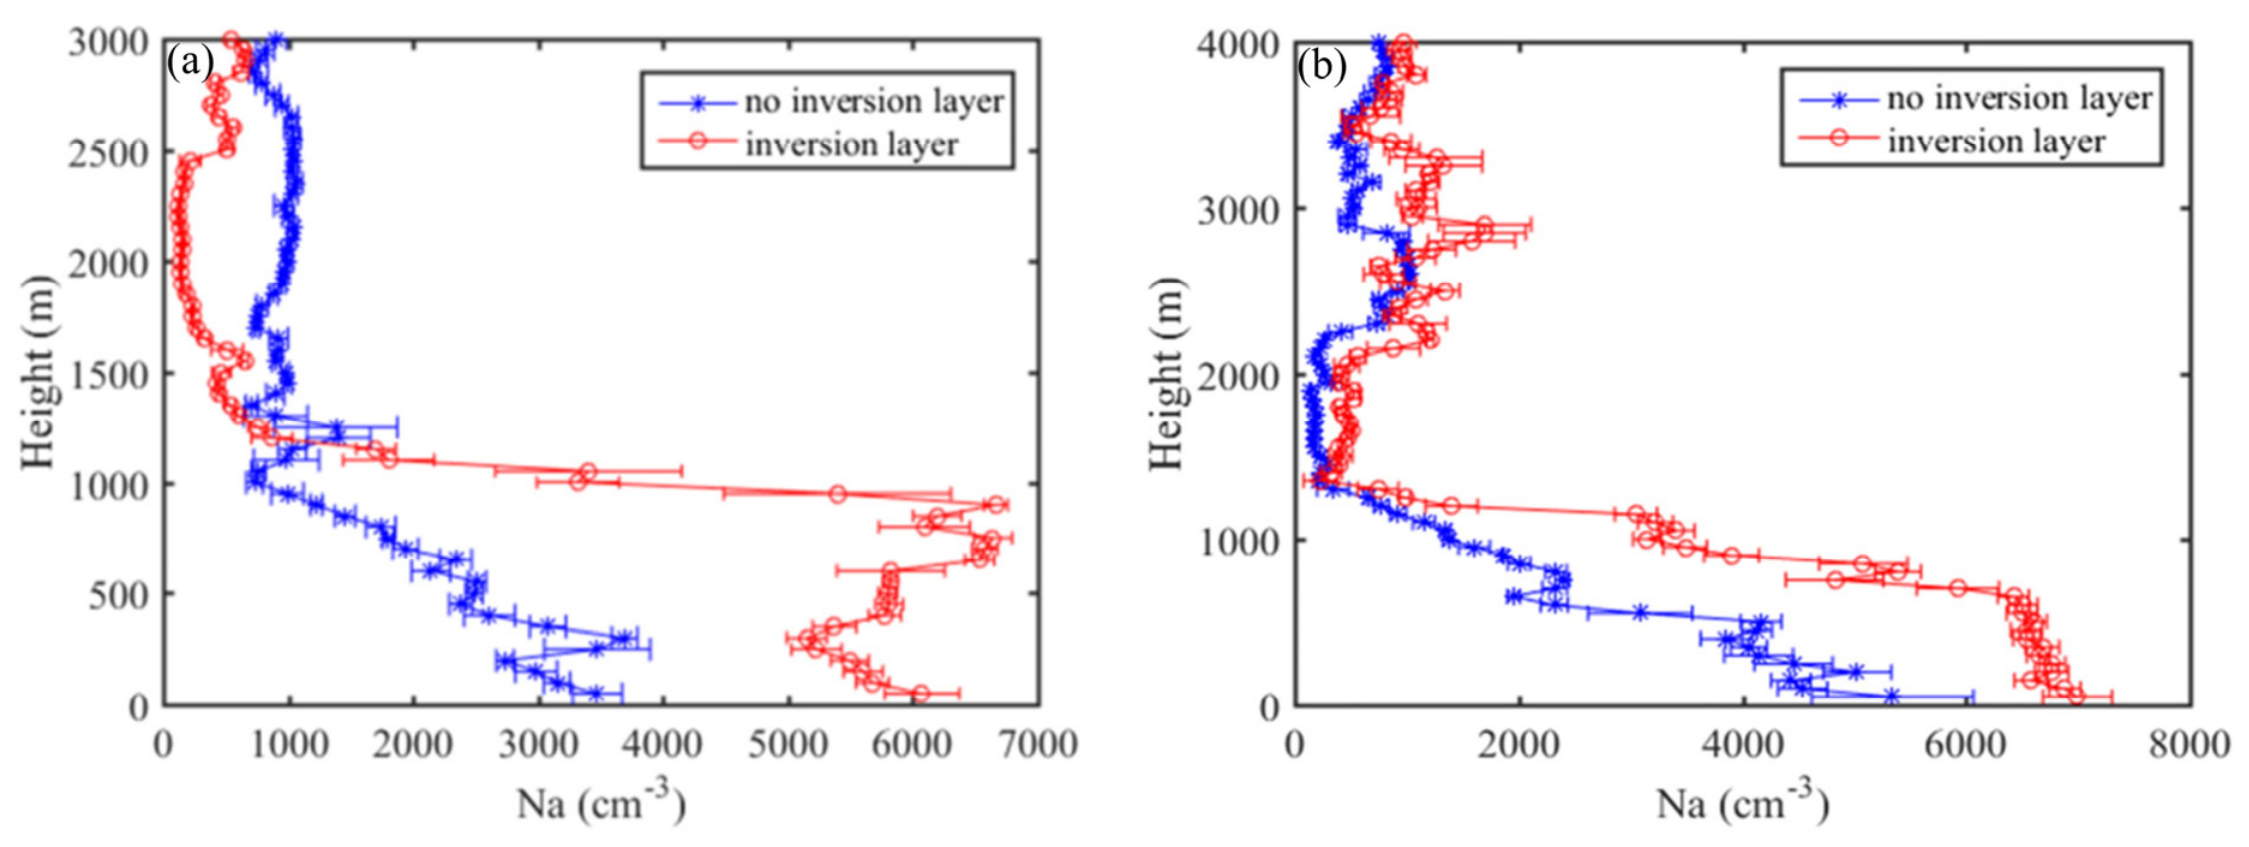
The presence of an inversion layer leads to markedly different vertical aerosol distributions. As shown in Figure 8, in cases with a clear temperature inversion, near-surface aerosol number concentrations are significantly higher, and pollutants accumulate below the inversion layer, dropping sharply above it. As shown in Figure 8a, in the Zhengding case without a significant temperature inversion, the near-surface aerosol number concentration was 3475.6 ± 197.3 cm−3, decreasing steadily with altitude and stabilizing around 1300 m. In contrast, the case with a clear inversion, with the inversion layer at 1051 m, showed a much higher near-surface concentration of 6073.1 ± 296.7 cm−3. Within the inversion layer, concentrations remained high, exceeding those in the non-inversion case by more than three times at some altitudes, but they dropped sharply above the layer, falling below the non-inversion case beyond 1300 m. Similarly, the Zhengzhou cases in Figure 8b exhibited comparable characteristics. The near-surface concentration was 6996.8 ± 309.9 cm−3 with an inversion (inversion height 825 m), compared to 5345.5 ± 701.8 cm−3 without an inversion. Aerosols accumulated significantly within the inversion layer, with near-surface levels nearly twice as high as in the non-inversion case. These results indicate that the presence of an inversion layer leads to markedly different vertical aerosol distributions, with pollutant accumulation below the inversion and rapid dispersion above it.
Figure 8.
The differences in the vertical distribution of aerosol particles in cases with and without an inversion layer, (a) Zhengding in Hebei; (b) Zhengzhou in Henan.
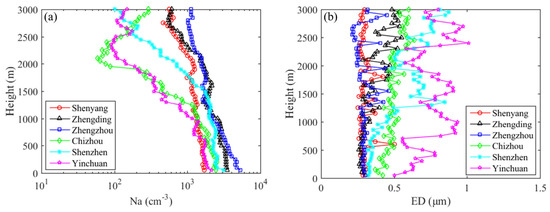
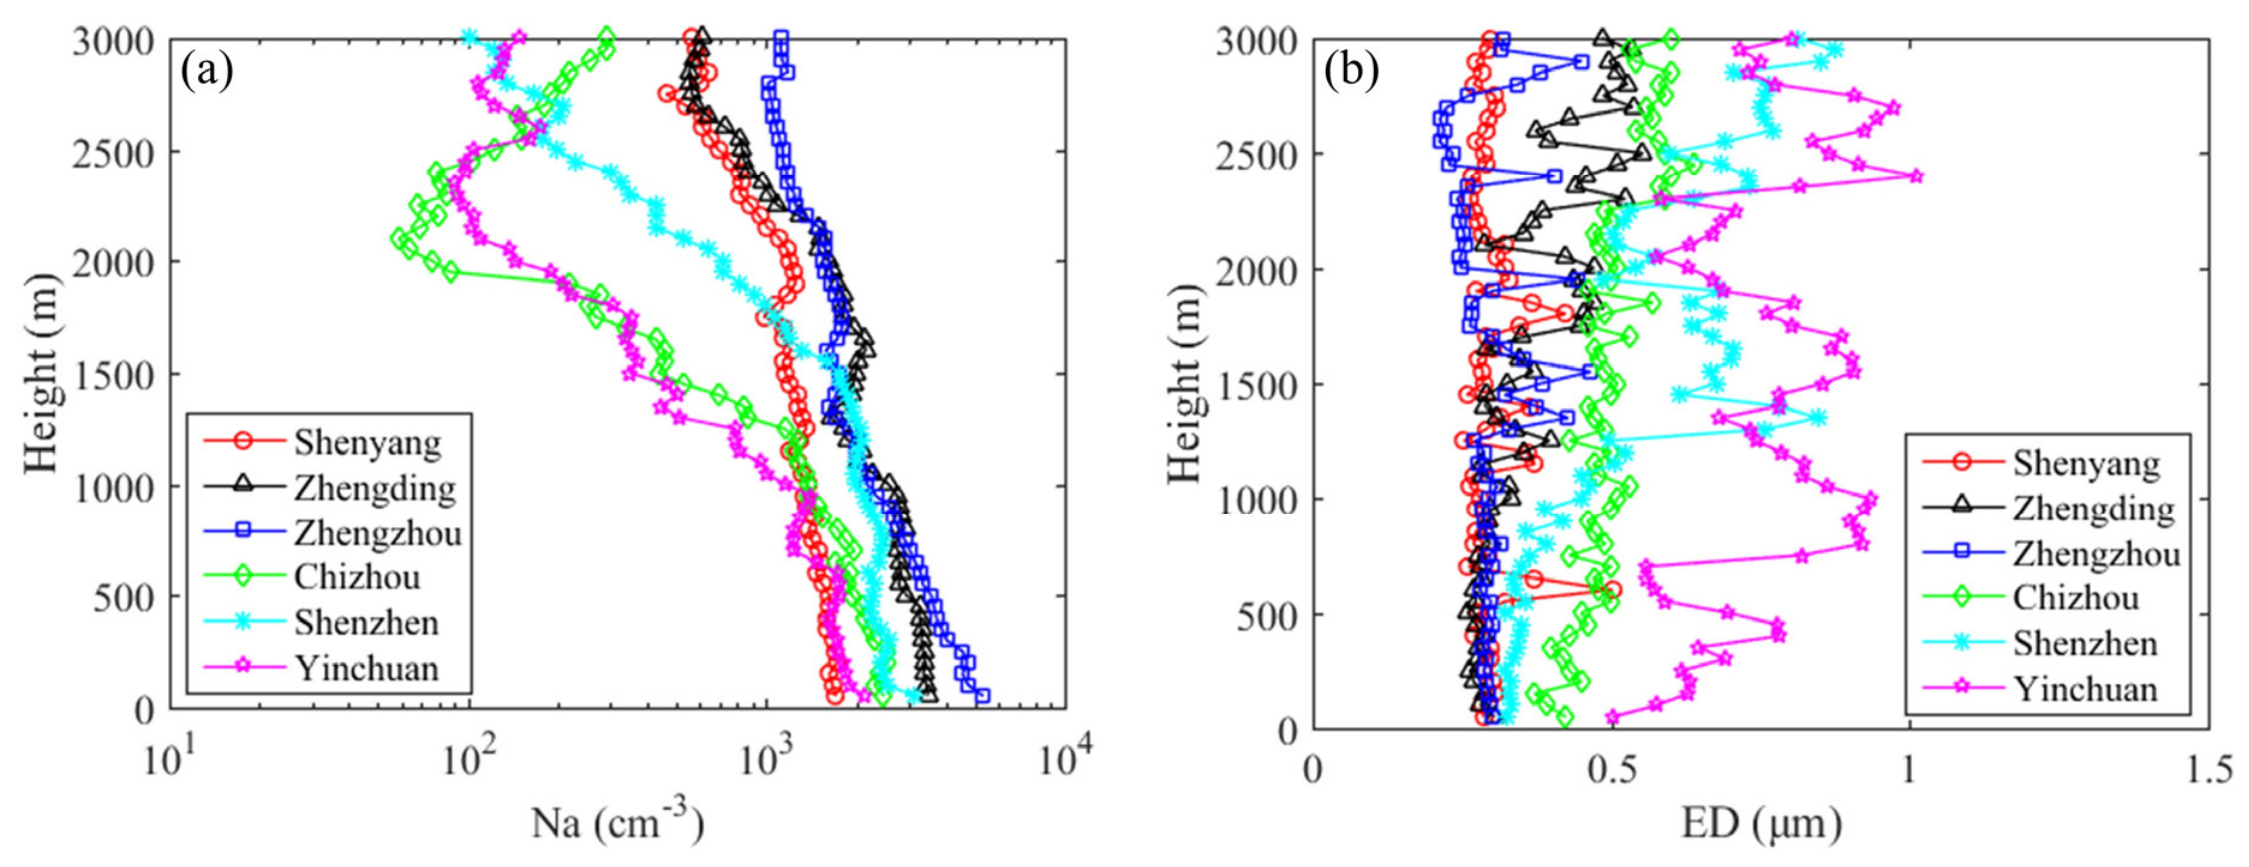
After excluding flights with clear temperature inversion and near-surface accumulation, a total of 25 valid flight sorties were retained. Each sortie yielded two aerosol profiles, with in-cloud data removed. The final aerosol profile counts for each region were 12 for Shenyang, 6 for Zhengding, 6 for Zhengzhou, 8 for Chizhou, 10 for Shenzhen, and 8 for Yinchuan. The statistical results of aerosol number concentration (Na) and effective diameter (ED) from aircraft observations across regions are shown in Figure 9.
Figure 9.
Comparison of vertical profiles of aerosols observed by aircraft in different regions, (a) Na; (b) ED.
Figure 9 reveals significant differences in the vertical profiles of Na across regions. Within the near-surface layer (0–500 m), Zhengzhou and Zhengding show notably higher concentrations than the other four regions, with mean values of 4271.9 cm−3 and 3318.0 cm−3, respectively. Shenyang and Yinchuan have the lowest near-surface concentrations, with mean values of 1656.0 cm−3 and 1786.8 cm−3, respectively. From the surface to 1000 m, all regions exhibit a decrease in aerosol concentration with increasing altitude, with little difference in the rate of decrease. Above 1000 m, the rate of decrease varies by region. Chizhou, Shenzhen, and Yinchuan show a marked increase in the reduction rate with altitude. In contrast, Shenyang, Zhengding, and Zhengzhou exhibit much slower decrease rates, with concentrations remaining high up to 3 km. Although Shenyang has a low near-surface concentration, its concentration at 3 km still reaches 559.2 cm−3, second only to Zhengzhou and close to that of Zhengding. This indicates more uniform vertical mixing of aerosols in these regions, allowing near-surface particles to be transported to higher altitudes. Above 2000 m, concentrations in Chizhou and Yinchuan increase with altitude, possibly due to long-range transport from surrounding areas, though they remain significantly lower than those in Zhengzhou, Zhengding, and Shenyang.
The comparison of the ED in different regions is shown in Figure 9b. Shenyang, Zhengding, and Zhengzhou are densely populated regions heavily influenced by anthropogenic sources such as traffic and industrial emissions. Correspondingly, their aerosol ED is relatively small, with near-surface values around 0.3 μm, and shows little variation from the surface to 3 km. In Zhengding, the ED slightly increases with altitude but remains within 0.5 μm. In Shenzhen, the ED is small within the 0–500 m layer (mean 0.33 μm) but increases notably with altitude above 500 m, reaching a maximum of 0.87 μm, likely due to the mixing of terrestrial anthropogenic aerosols with marine aerosols. Yinchuan, located in northwestern China, is significantly affected by dust, with generally larger aerosol particles; its ED ranges from 0.50 μm to 1.01 μm. In Chizhou, aircraft observations were conducted near Mount Jiuhua Scenic Area, where the air is relatively clean and anthropogenic pollution is low; the ED is larger than that in Shenyang, Zhengding, and Zhengzhou but considerably smaller than in dust-affected Yinchuan.
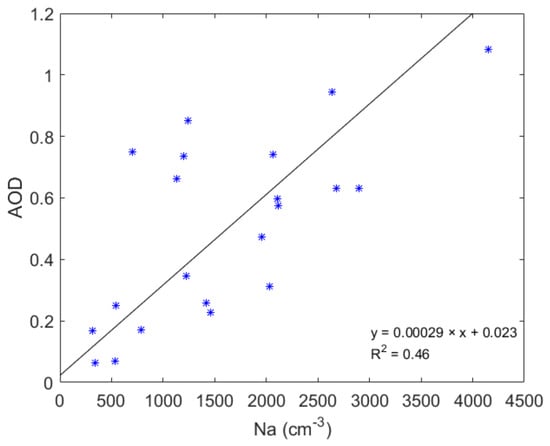
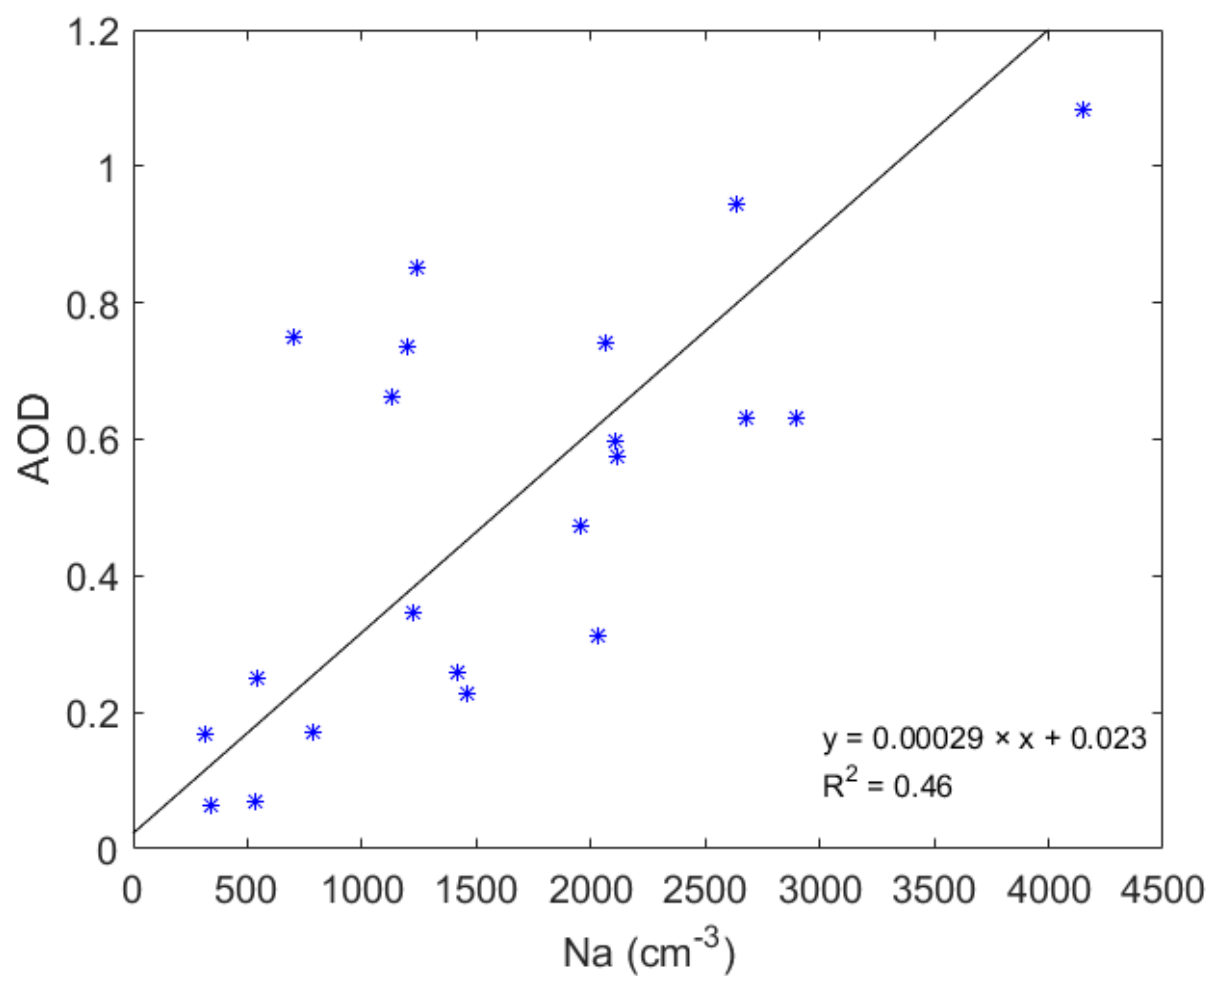
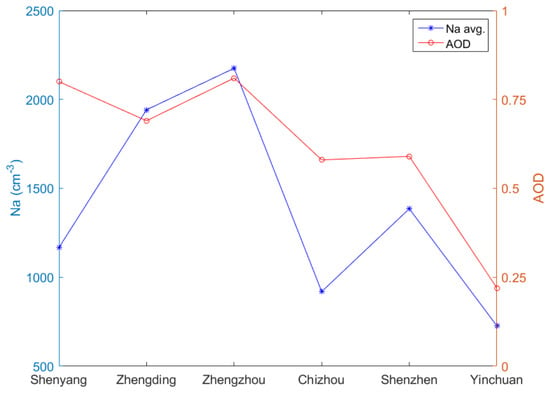
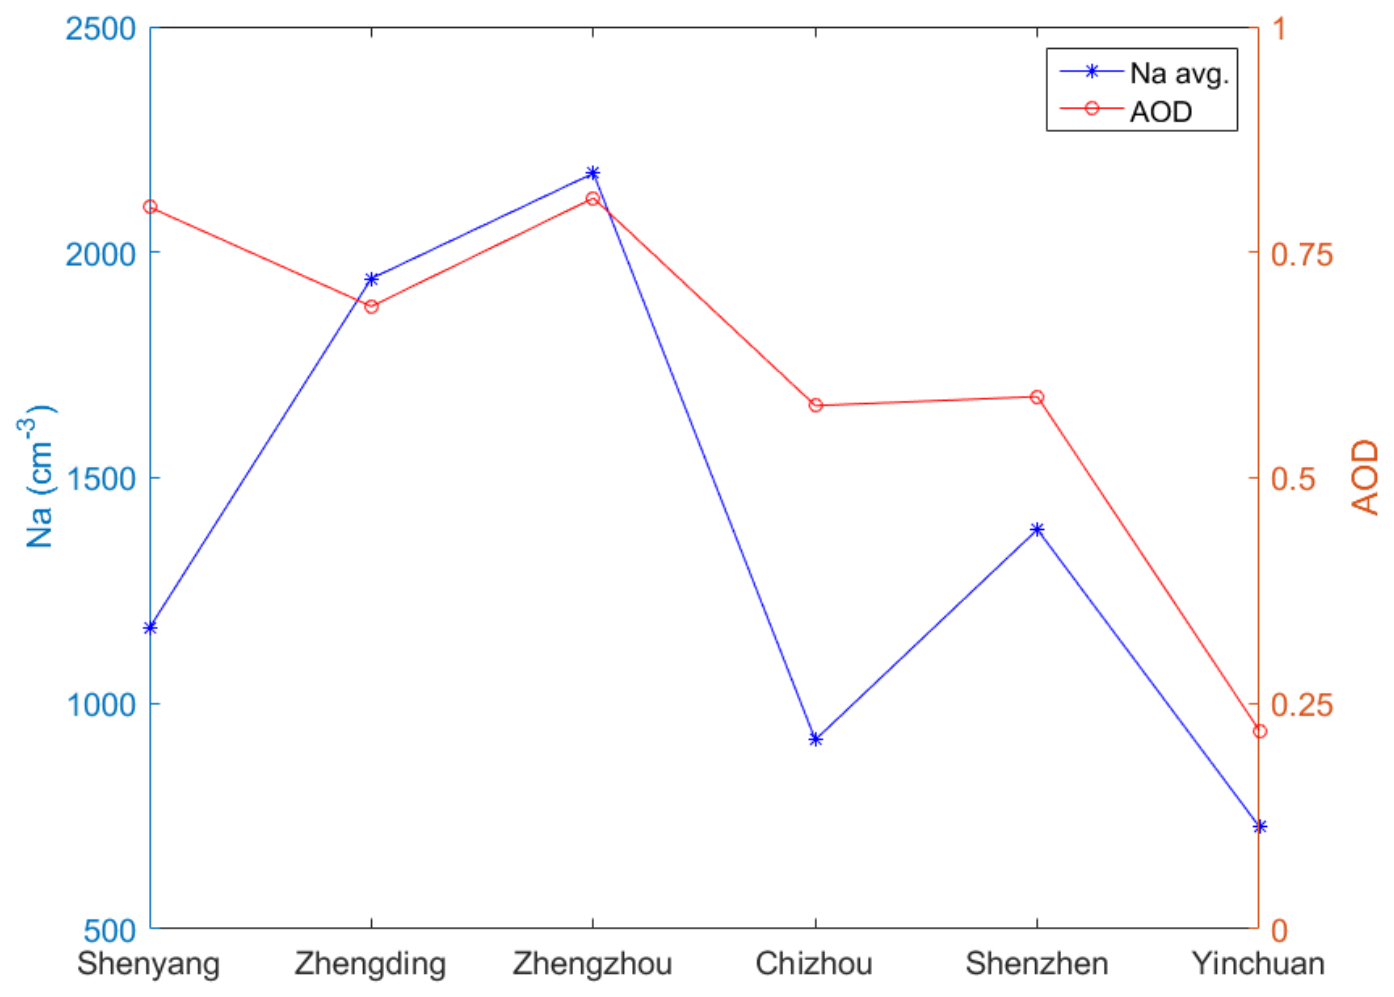
A comparison was conducted between the MODIS average AOD and the aircraft-measured Na within the 0–3000 m altitude range. Prior to the comparison, spatial and temporal matching between the MODIS and aircraft data was performed. The MODIS AOD data, with a spatial resolution of 0.1° × 0.1°, were acquired at approximately 10:00 and 13:00 local time each day. For each flight observation, the nearest available MODIS grid cell in both time and space was selected to match the aircraft sampling location, and if the closest grid cell contained missing values, the second-nearest grid point was used as a substitute. However, if none of the five nearest surrounding grid points had valid AOD values, the data comparison was not performed for that observation. It should be noted that although this matching process inevitably introduces some degree of temporal and spatial inconsistency, the diurnal variation of aerosol loading during the observation period was relatively small, and thus it is unlikely to have a significant impact on the comparison results. The comparison between the AOD and the vertically averaged Na (0–3000 m) is shown in Figure 10. To further clarify the relationship between AOD and Na across different regions, we averaged the AOD and Na values for each region and analyzed their regional-scale relationship, as shown in Figure 11.
Figure 10.
Scatter plot and linear fit between AOD and Na from 0 to 3000 m. The blue scatter points represent the samples of Na and the corresponding AOD, and the black soild line denotes the linear fitting result.
Figure 11.
Regional comparison of AOD with the Na from 0 to 3000 m across different areas.
It can be seen that the AOD and Na show broadly consistent trends across regions, with an overall correlation coefficient of 0.68, which verifies the utility of AOD data in reflecting the regional aerosol loading levels. But some discrepancies still remain. In the Shenyang region, the overall number concentration within 0–3000 m is relatively low, but the aerosol loading in the upper atmosphere above 2000 m is higher, resulting in a relatively high local AOD value, second only to that of the Zhengzhou region. This indicates that satellite-derived AOD is more strongly influenced by aerosols in the upper atmosphere. In the Chizhou region, the Na is only slightly higher than that in the Yinchuan region, but the area has abundant water vapor, and relative humidity influences the hygroscopic growth effect of aerosols and enhances the local AOD [29,36,37], making it significantly higher than that in Yinchuan.
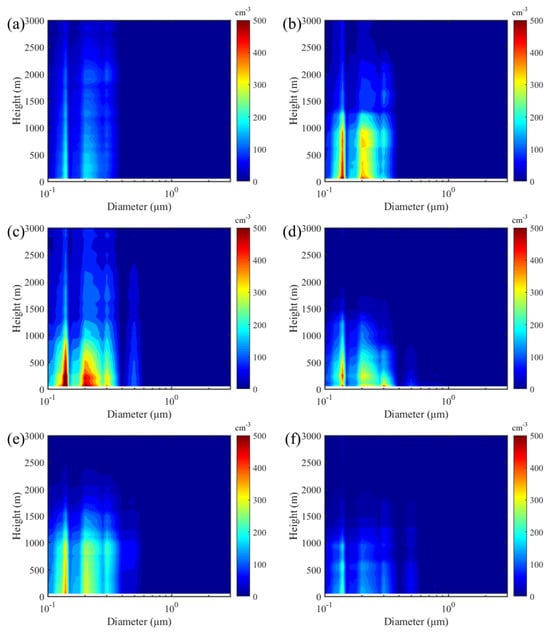
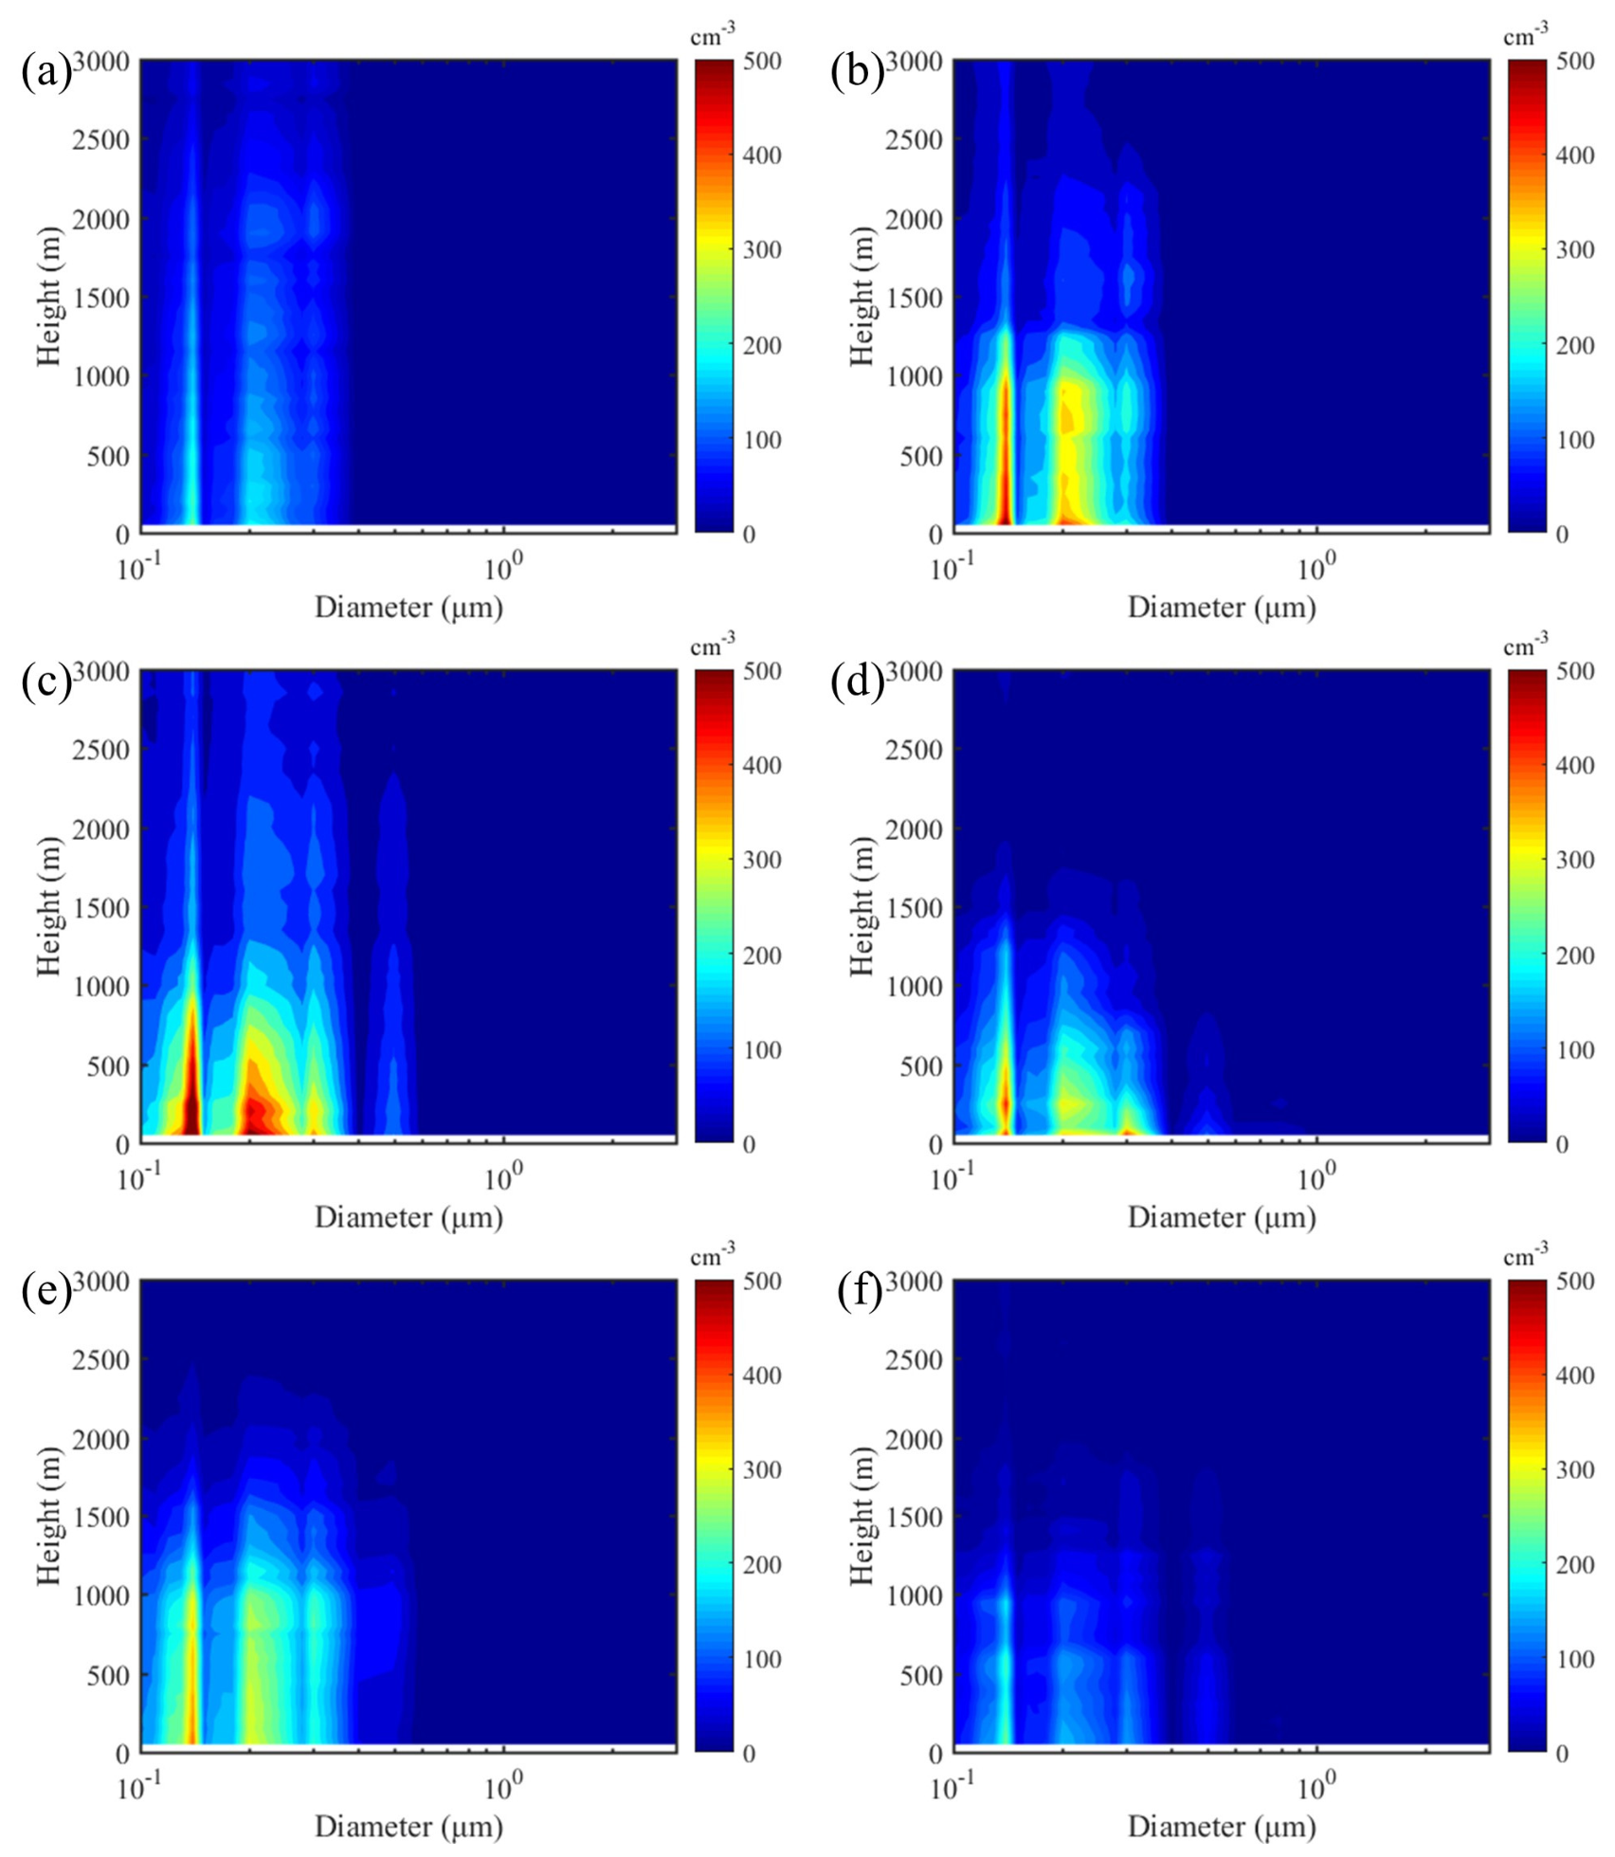
To investigate the microphysical characteristics of aerosols in the six regions, we analyzed the aerosol number concentration size distribution at various altitudes. The results are shown in Figure 12. In Shenyang, although the near-surface number concentration is low, aerosols can be transported up to nearly 3000 m, with little change in the size distribution. In Zhengzhou and Zhengding, aerosols are concentrated in the small-size range, with a narrow high-value spectral width. In Chizhou, the spectral width is slightly broader than that in Zhengzhou and Zhengding, with the proportion of particles above 0.3 μm being significantly higher. In Shenzhen and Yinchuan, the high-value spectral width is notably broader than in the other regions, though clear differences exist between the two. In Shenzhen, the concentration of large particles increases above 500 m and then gradually decreases, whereas in Yinchuan, the high concentration occurs near the surface, with aerosol number concentration decreasing as altitude increases. This indicates that the increase in large particles in Shenzhen is primarily due to marine-transported aerosols, while Yinchuan is mainly affected by local dust emissions.
Figure 12.
Vertical distributions of aerosol number concentration spectra observed by aircraft in different regions of China: (a) Shenyang, Liaoning; (b) Zhengding, Hebei; (c) Zhengzhou, Henan; (d) Chizhou, Anhui; (e) Shenzhen, Guangdong; (f) Yinchuan, Ningxia.
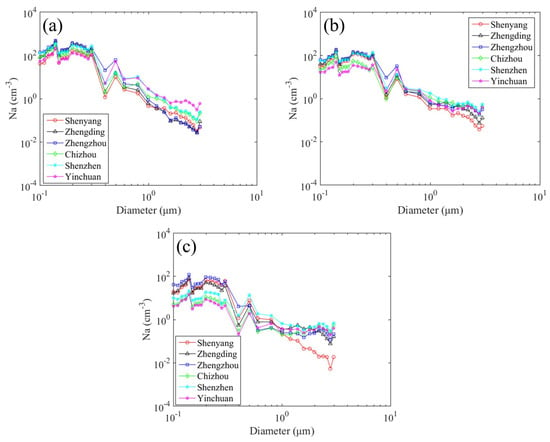
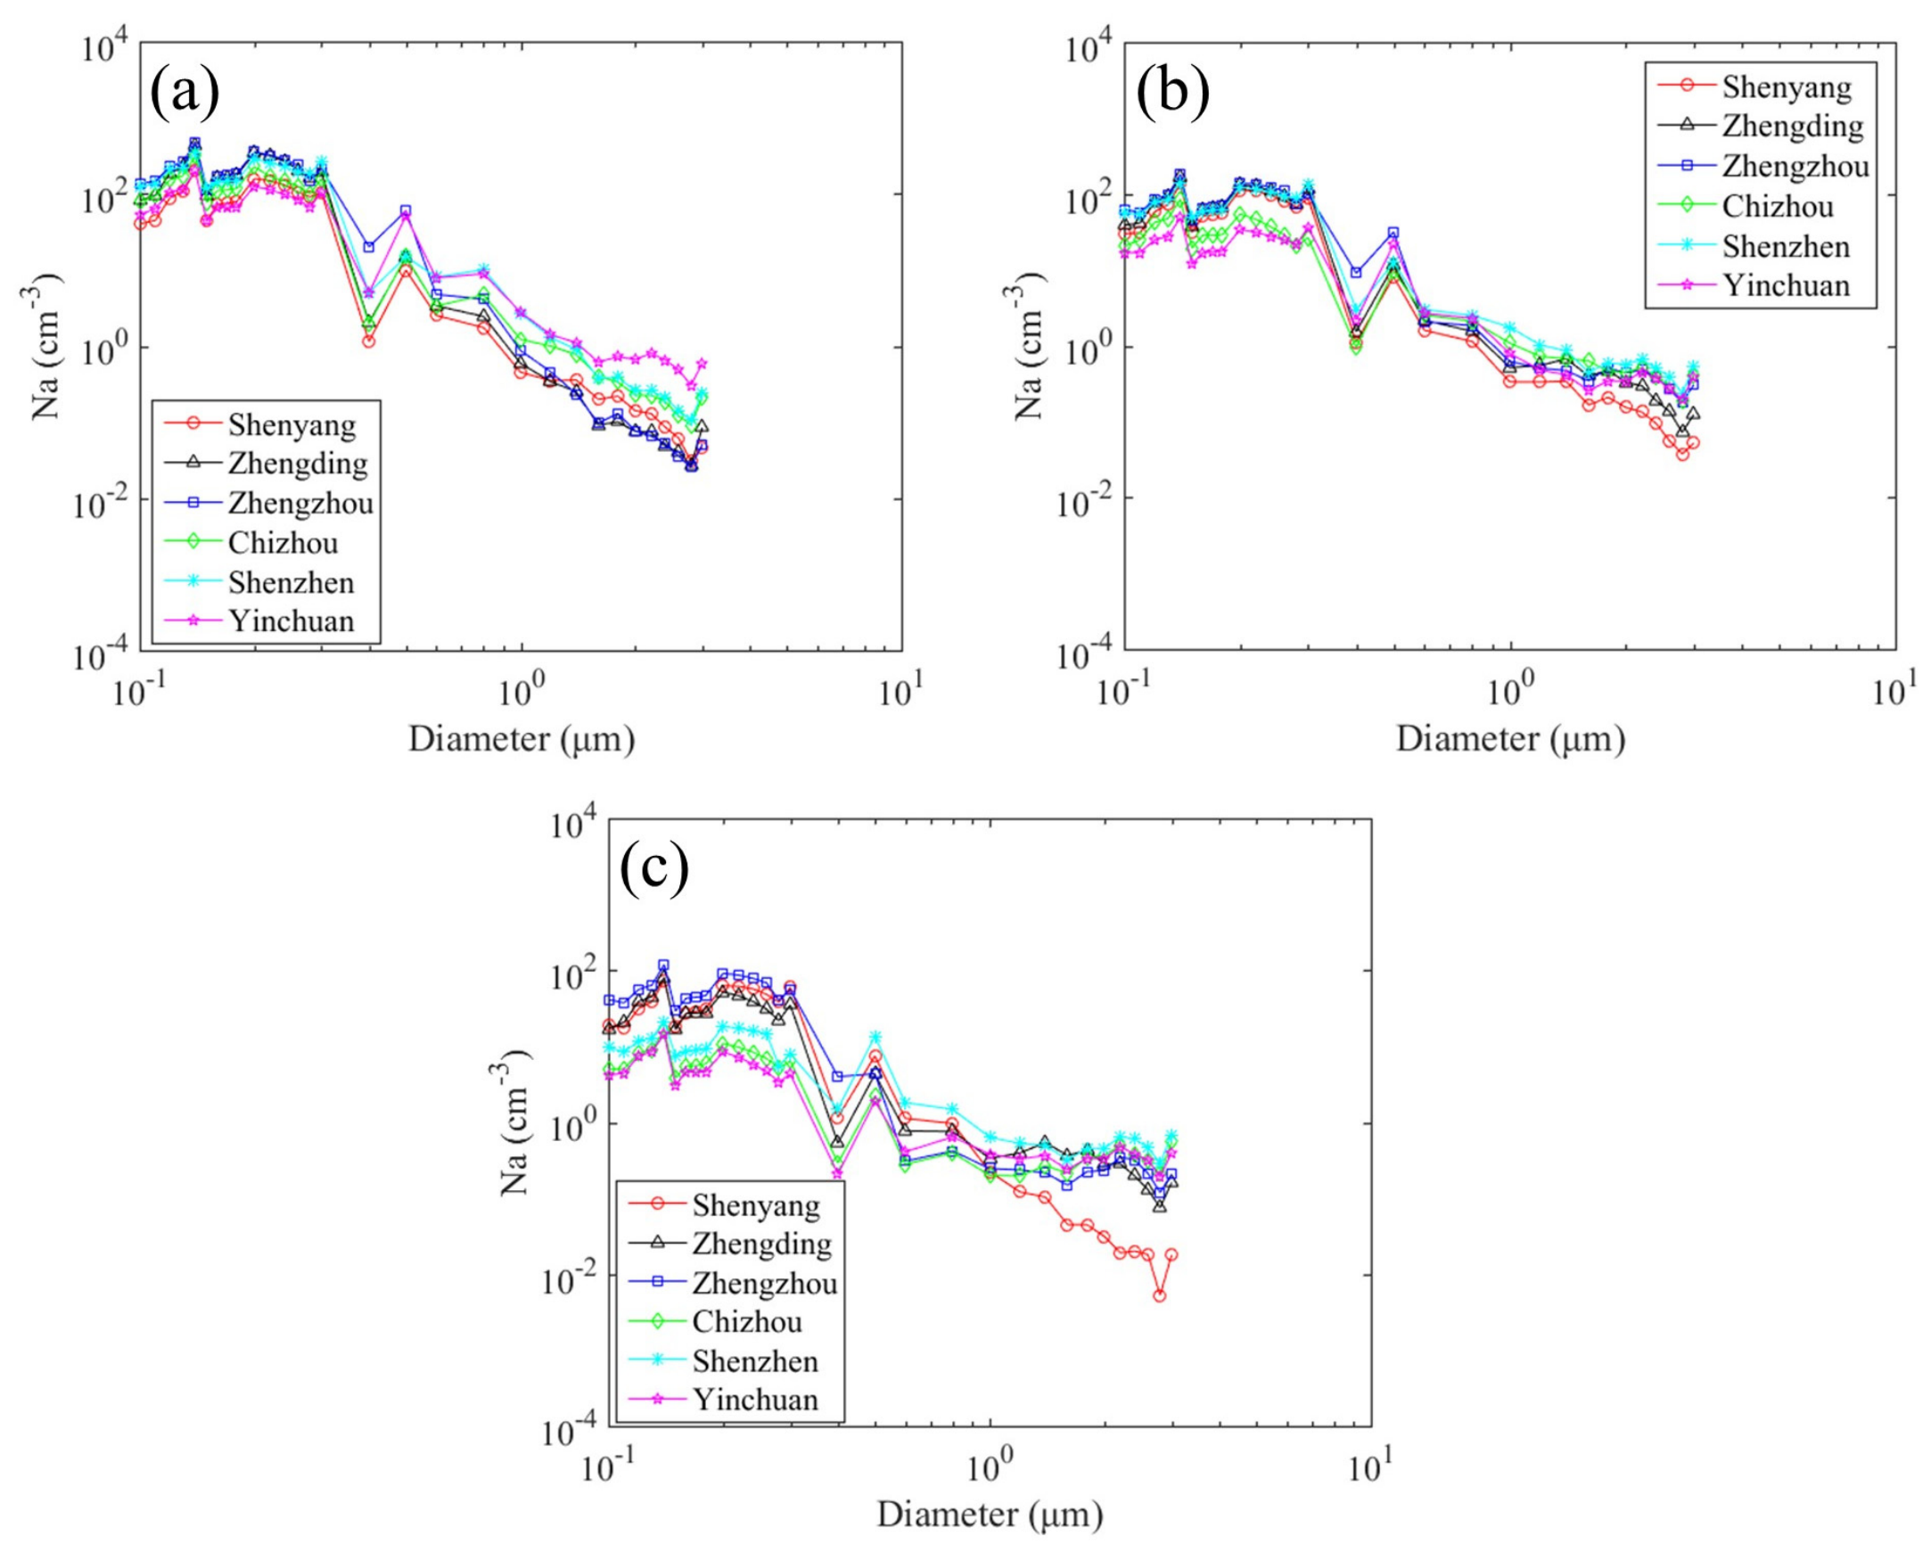
For a clearer comparison, we compared the aerosol size distributions across different altitude ranges for each region, as shown in Figure 13. We classified the data into three altitude ranges: 0–1000 m, 1000–2000 m, and 2000–3000 m. Across all ranges, Shenyang, Zhengding, and Zhengzhou exhibit a trend of having many small particles below 0.5 μm and few large particles above 1 μm. In contrast, Yinchuan has the lowest number concentration of small particles across all altitude ranges but a relatively high concentration of large particles, significantly higher than other regions within the 0–1000 m range. In Shenzhen, the aerosol size distribution within 0–1000 m is similar to those in Shenyang, Zhengding, and Zhengzhou. However, above 1000 m, especially in the 2000–3000 m range, Shenzhen shows a clear pattern of fewer small particles and more large particles.
Figure 13.
Size distributions of aerosol particles in different height: (a) 0–1000 m; (b) 1000–2000 m; (c) 2000–3000 m.
3.4. Microphysical Characteristics of Cloud Droplets from Aircraft Observation
Compared with the aerosol data obtained by PCASP, the number of cloud samples collected by CDP during aircraft observations is relatively limited. As listed in Table 2, a total of 18 cloud layers were sampled across 32 flight sorties. To ensure comparability among clouds from different regions, we selected one stratiform cloud sample with similar cloud thickness from each of the six regions for comparison, analyzing the vertical distribution and microphysical characteristics of cloud droplets formed in each region. The flight location, flight date, cloud base height (CBH), cloud top height (CTH), corresponding 0 °C height, and subcloud Na at 200 m below the cloud base for the selected cloud samples are shown in Table 3.
Table 3.
Basic information on cloud samples detected by the aircraft.
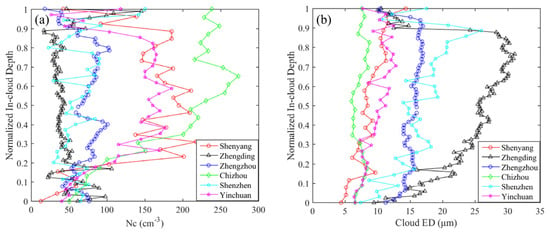
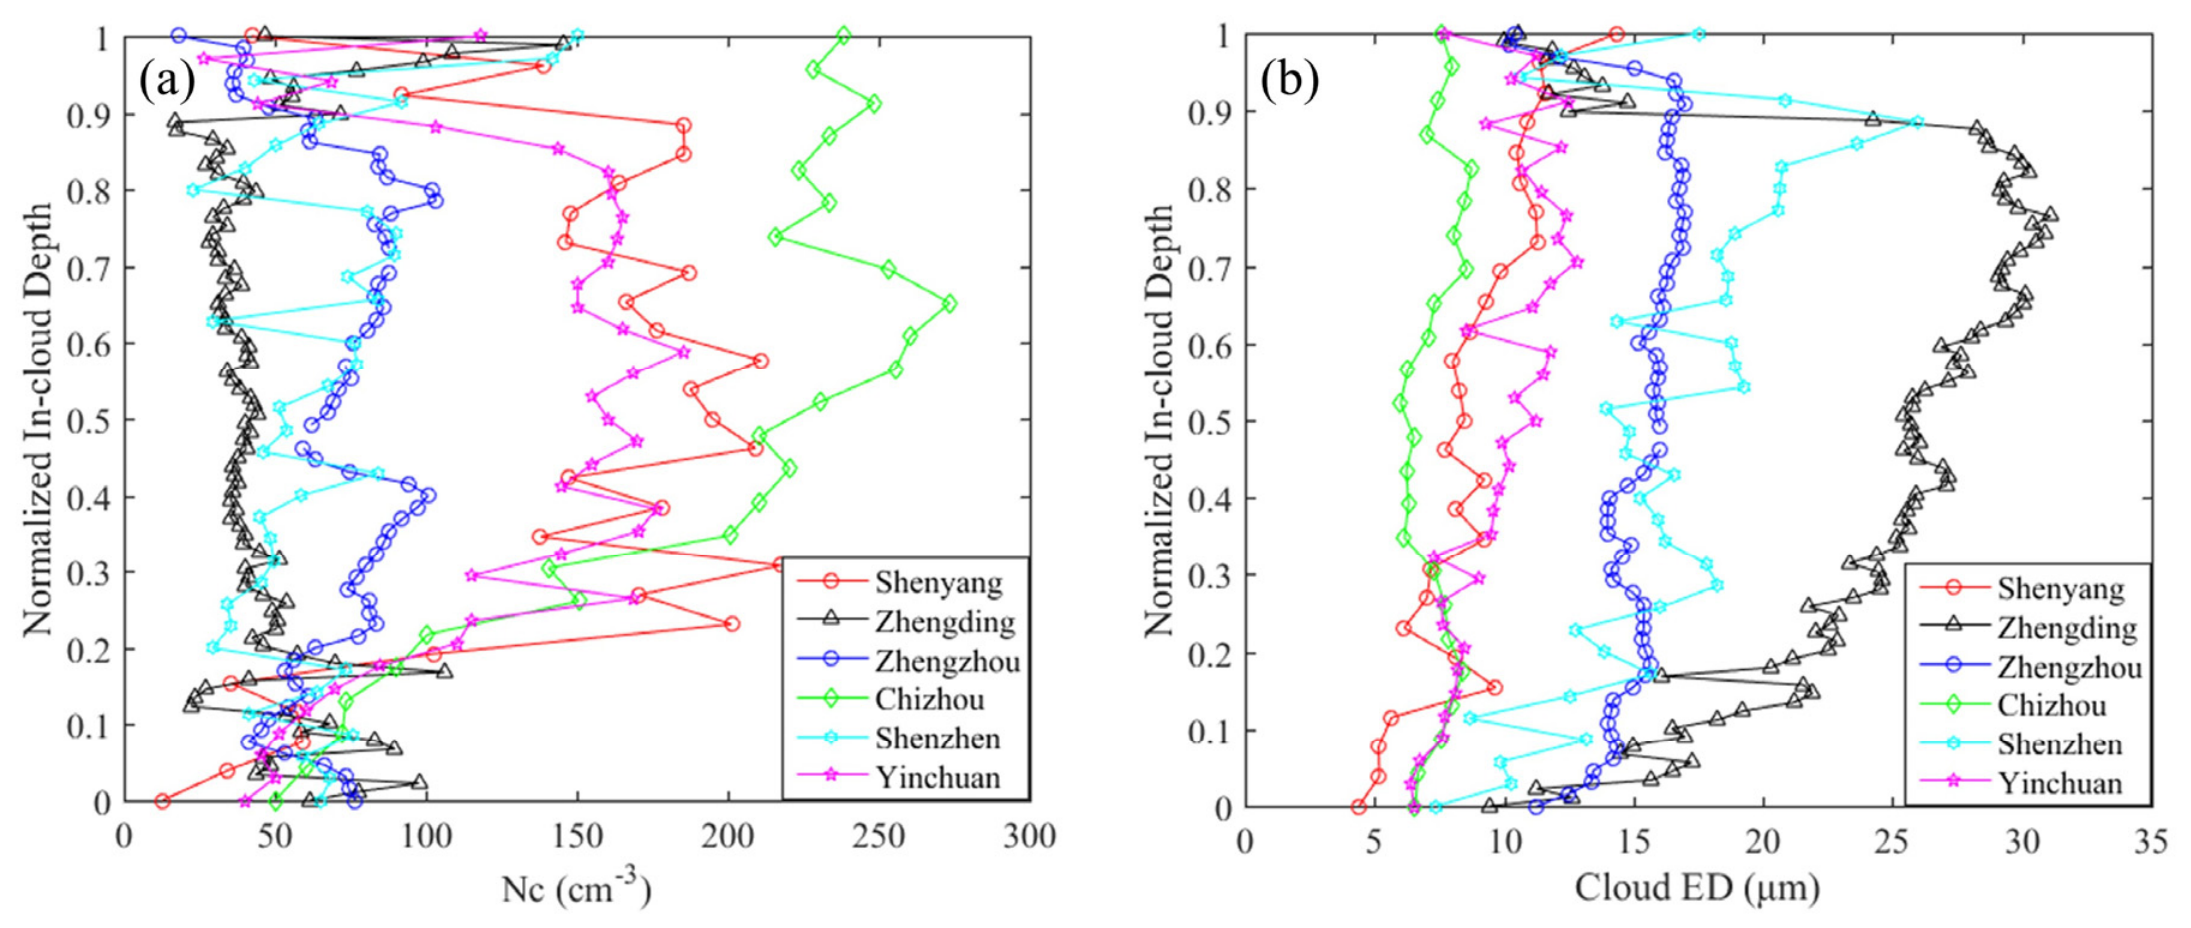
The cloud thickness of the selected cloud samples ranges from 340 m to 887 m. The cloud top heights of all cloud samples are below the 0 °C level, indicating that they are all composed of pure liquid cloud droplets. Aerosols 200 m below the cloud base are used to represent cloud-relevant aerosol particles. The subcloud Na across the regions, from highest to lowest, are Chizhou > Zhengzhou > Zhengding > Yinchuan > Shenzhen > Shenyang. Following the method of Zhao et al. (2018) [13], we normalized the cloud thickness to a range of 0 to 1 to facilitate comparative analysis. The vertical distributions of cloud droplet number concentration and cloud droplet effective diameter at different positions within the clouds for each region are shown in Figure 14.
Figure 14.
The vertical distribution of cloud parameters within each region: (a) cloud number concentration; (b) cloud ED.
The normalized cloud thickness values between 0 and 0.2 are defined as the cloud bottom, values between 0.8 and 1 are defined as the cloud top, and the remaining portion is defined as the cloud middle. As shown in Figure 14, the cloud droplet effective diameter generally shows an increasing trend from the cloud bottom to the cloud middle across all regions. Only in the cases of Zhengding, Zhengzhou, and Shenzhen does the effective diameter decrease at the cloud top. The cloud droplet number concentration is generally low at the cloud bottom, with significant fluctuations and no clear pattern, likely because this altitude range detected by the aircraft is at the cloud boundary. From the cloud bottom to the cloud middle, Zhengding consistently exhibits a low cloud droplet number concentration, mostly below 50 cm−3. In contrast, in all other regions, the cloud droplet number concentration initially increases rapidly with altitude, then the rate of increase slows, gradually reaching a relatively stable state.
Comparing the relationship between cloud droplet number concentration and cloud droplet effective diameter across regions, an inverse correlation is evident in the selected case studies, particularly in the cloud middle. For example, Zhengding has a lower cloud droplet number concentration compared to other regions, with a maximum cloud droplet effective diameter reaching 30 μm. In contrast, Chizhou, which is adjacent to the Yangtze River to the north and lakes to the east, has abundant water vapor supply, resulting in a significantly higher cloud droplet number concentration, reaching up to 250 cm−3, while its cloud droplet effective diameter is smaller, ranging from 6.01 μm to 8.74 μm. Comparisons of other cases also reflect this relationship, consistent with the earlier satellite-based findings: in general, regions with higher cloud droplet number concentrations tend to have smaller cloud droplet effective diameters. However, no clear positive or negative correlation is found between the subcloud Na (at 200 m below cloud base) and the corresponding cloud droplet parameters across regions. This indicates that in-depth analysis of aerosol–cloud relationships requires targeted studies, as such relationships are difficult to discern under varying environmental backgrounds and moisture conditions.
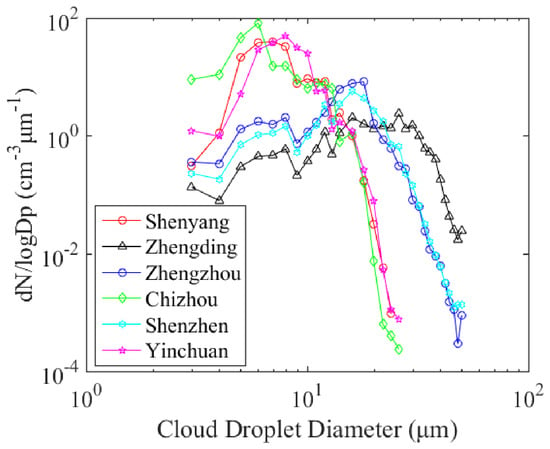
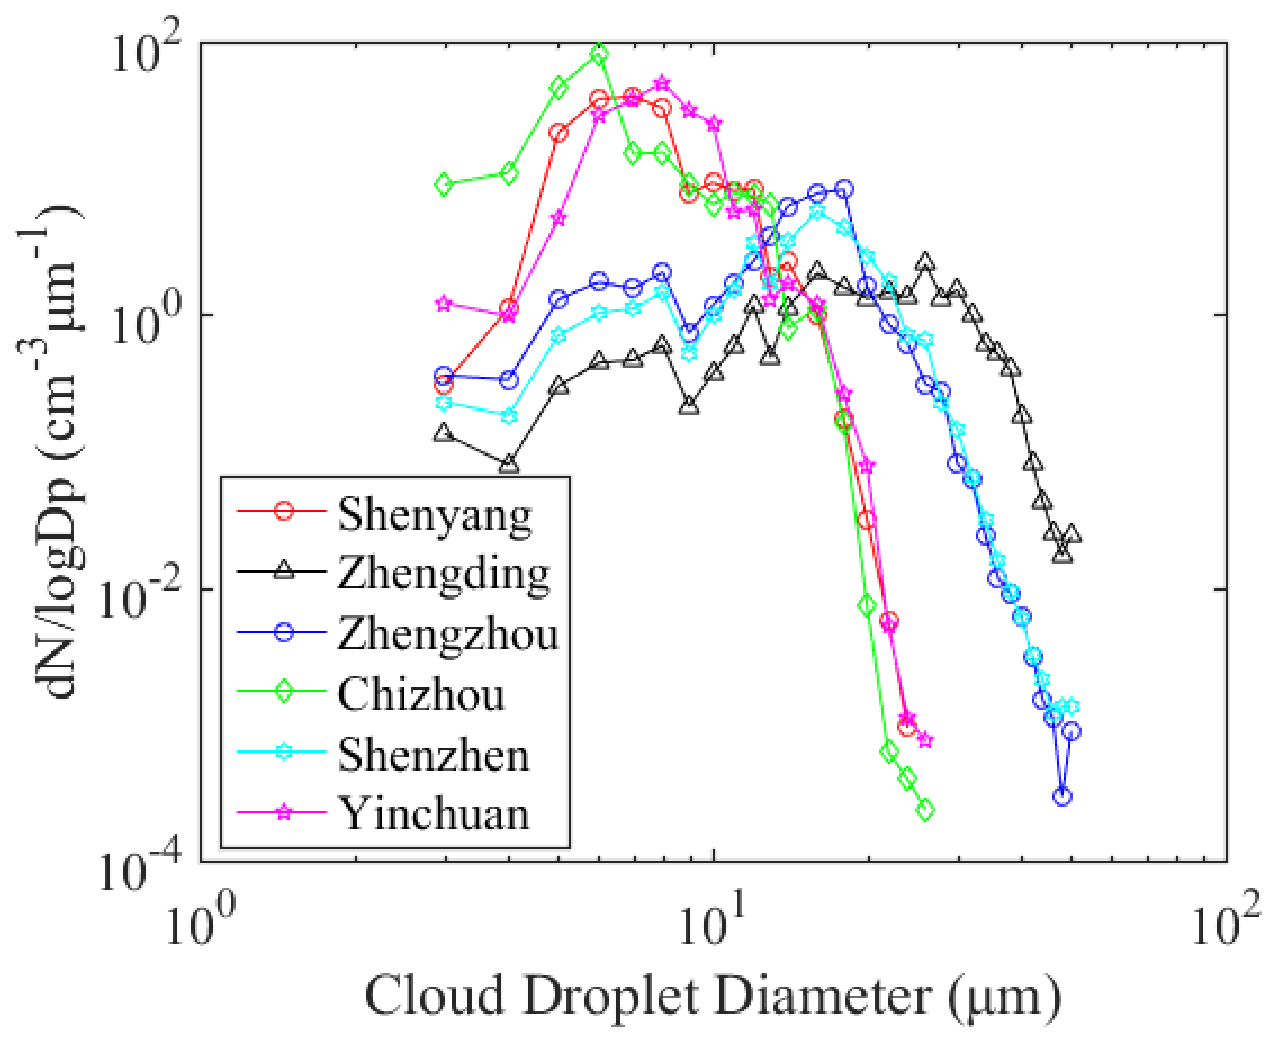
As shown in Figure 14, due to the influence of cloud boundaries, the cloud droplet concentration and effective diameter fluctuate significantly at the cloud bottom and cloud top, while they are relatively stable in the cloud middle. Therefore, we selected the cloud middle range to compare the number concentration size distribution of cloud droplets, as shown in Figure 15. The spectral shapes of Chizhou, Shenyang, and Yinchuan are generally similar, with peaks at 6 μm, 7 μm, and 8 μm, respectively, and maximum values close to 100 cm−3. The cloud droplets are predominantly small particles, mostly below 15 μm. The cloud droplet size distributions of Zhengzhou and Shenzhen are very close to each other, with peaks at 18 μm and 16 μm. Compared to Chizhou, Shenyang, and Yinchuan, the cloud droplet spectral width is broader, with the maximum droplet diameter reaching nearly 50 μm, but the maximum cloud droplet number concentration at the peak is only 20.5 cm−3. Compared to other regions, the cloud case in Zhengding has the highest number of large particles with diameters greater than 20 μm, but the overall number concentration across all size ranges is relatively low, with a peak at 26 μm and a cloud droplet number concentration of only 5.1 cm−3. Overall, clouds with broader spectral widths and larger peak diameters tend to have lower overall cloud droplet number concentrations.
Figure 15.
Comparison of the distribution of cloud droplet number concentration in clouds across different regions.
4. Conclusions
Based on the synergistic analysis of MODIS satellite retrievals (2015–2020) and in-situ MA60 aircraft measurements across six representative regions, the following conclusions are drawn:
- (1)
- From 2015 to 2020, the national average AOD over China showed a significant declining trend, with the most pronounced decreases observed over the North China Plain and Sichuan Basin. This decline is consistent with emission reductions following China’s clean air policies, though meteorological variability may have contributed as well. The spatial distribution of cloud phase shows pronounced regional heterogeneity, with water clouds prevailing in the southeast and ice clouds dominating the northwest. The highest ice cloud fraction is observed over the Tibetan Plateau, exceeding 85% of total cloud cover.
- (2)
- Aircraft observations reveal strong regional contrasts in aerosol microphysics. Heavily polluted northern sites (Zhengzhou, Zhengding) exhibit high near-surface aerosol number concentrations with small effective diameters (~0.3 µm) and narrow size spectra. Dust-affected Yinchuan shows larger particle sizes (>0.5 µm), while coastal Shenzhen displays a distinct marine influence with enhanced coarse-mode particles at higher altitudes, indicating that aerosol properties are strongly modulated by local sources and transport processes.
- (3)
- Cloud droplet number concentration varies markedly across regions, with the highest values observed in the clean, moisture-rich Chizhou area and the lowest in dust/coastal regions. An inverse correlation between Nc and ED is observed in the selected case studies, consistent with the Twomey effect, though this relationship is modulated by ambient aerosol type and liquid water availability, reflecting the complexity of aerosol–cloud interactions. Further studies with more comprehensive measurements are required for definitive attribution.
- (4)
- The positive correlation between satellite-retrieved AOD and aircraft-measured column-integrated aerosol concentration validates the reliability of MODIS products for regional air quality assessments. However, no significant correlation between ice cloud CER and COD highlights the need for improved representation of ice-phase microphysical processes in climate models.
Despite these advances, this study is constrained by the limited spatiotemporal coverage of aircraft campaigns and the lack of ice crystal microphysical measurements, which should be addressed in future observational and modeling efforts.
Author Contributions
Conceptualization, Y.C.; methodology, Y.C. and Y.D.; software, Y.C.; validation, Y.C., Y.D. and Y.G.; formal analysis, Y.C.; investigation, Y.G. and X.Z.; resources, W.L. and C.F.; data curation, X.Z. and C.F.; writing—original draft preparation, Y.C.; writing—review and editing, Y.C., Y.D., J.L. and W.X.; visualization, Y.C. and W.X.; supervision, J.L.; project administration, W.L. and J.L.; funding acquisition, Y.D. and J.L. All authors have read and agreed to the published version of the manuscript.
Funding
This research was funded by the National Natural Science Foundation of China (NSFC) under the Young Scientists Fund Program (Grant No. 42405094) and the general program (Grant No. 42575098).
Data Availability Statement
The original contributions presented in the study are included in the article, further inquiries can be directed to the corresponding author.
Acknowledgments
We are grateful to the anonymous reviewers and editors for appraising our manuscript and offering instructive comments. We acknowledge NASA for providing MODIS aerosol products (https://ladsweb.modaps.eosdis.nasa.gov, accessed on 1 January 2022). We sincerely thank the scientific teams for their efforts in producing and distributing these datasets.
Conflicts of Interest
The authors declare no conflicts of interest.
References
- Twomey, S. The Influence of Pollution on the Shortwave Albedo of Clouds. J. Atmos. Sci. 1977, 34, 1149–1152. [Google Scholar] [CrossRef] [Scilit]
- Albrecht, B.A. Aerosols, Cloud Microphysics, and Fractional Cloudiness. Science 1989, 245, 1227–1230. [Google Scholar] [CrossRef] [Scilit] [PubMed]
- IPCC. Climate Change 2021: The Physical Science Basis. Contribution of Working Group I to the Sixth Assessment Report of the Intergovernmental Panel on Climate Change; Cambridge University Press: Cambridge, UK; New York, NY, USA, 2021. [Google Scholar]
- Feingold, G.; Eberhard, W.L.; Veron, D.E.; Previdi, M. First Measurements of the Twomey Indirect Effect Using Ground-Based Remote Sensors. Geophys. Res. Lett. 2003, 30, 1287. [Google Scholar] [CrossRef] [Scilit]
- Justice, C.O.; Vermote, E.; Townshend, J.; Defries, R.; Roy, D.P.; Hall, D.K.; Salomonson, V.V.; Privette, J.L.; Riggs, G.; Strahler, A.; et al. The Moderate Resolution Imaging Spectroradiometer (MODIS): Land Remote Sensing for Global Change Research. IEEE Trans. Geosci. Remote Sens. 1998, 36, 1228–1249. [Google Scholar] [CrossRef] [Scilit]
- Li, C.; Mao, J.; Lau, A. Research on the Air Pollution in Beijing and Its Surroundings with MODIS AOD Products. Chin. J. Atmos. Sci. 2003, 27, 419–430. [Google Scholar] [CrossRef] [Scilit]
- Shang, H.; Chen, L.; Tao, J.; Su, L.; Jia, S. Synergetic Use of MODIS Cloud Parameters for Distinguishing High Aerosol Loadings From Clouds Over the North China Plain. IEEE J. Sel. Top. Appl. Earth Obs. Remote Sens. 2014, 7, 4879–4886. [Google Scholar] [CrossRef] [Scilit]
- Just, A.C.; De Carli, M.M.; Shtein, A.; Dorman, M.; Lyapustin, A.; Kloog, I. Correcting Measurement Error in Satellite Aerosol Optical Depth with Machine Learning for Modeling PM2.5 in the Northeastern USA. Remote Sens. 2018, 10, 803. [Google Scholar] [CrossRef] [Scilit] [PubMed]
- Li, J.; Li, P.; Yuan, L.; Yin, Y.; Wang, Z.; Li, J.; Li, Y.; Ren, G.; Cai, Z. Physical and Optical Properties of Atmospheric Aerosols in Summer at a Suburban Site in North China. Aerosol Air Qual. Res. 2017, 17, 1474–1488. [Google Scholar] [CrossRef] [Scilit]
- Gultepe, I.; Isaac, G.A. Aircraft Observations of Cloud Droplet Number Concentration: Implications for Climate Studies. Q. J. R. Meteorol. Soc. 2004, 130, 2377–2390. [Google Scholar] [CrossRef] [Scilit]
- Che, Y.; Zhang, Y.; Fang, C.; Zhou, X.; Xue, W.; Hu, X.; Duan, J.; Li, W.; Gao, Y.; Lu, G.; et al. Aerosol and Cloud Properties Over a Coastal Area from Aircraft Observations in Zhejiang, China. Atmos. Environ. 2021, 267, 118771. [Google Scholar] [CrossRef] [Scilit]
- Zhang, Q.; Quan, J.; Tie, X.; Huang, M.; Ma, X. Impact of Aerosol Particles on Cloud Formation: Aircraft Measurements in China. Atmos. Environ. 2011, 45, 665–672. [Google Scholar] [CrossRef] [Scilit]
- Zhao, C.; Qiu, Y.; Dong, X.; Wang, Z.; Peng, Y.; Li, B.; Wu, Z.; Wang, Y. Negative Aerosol-Cloud Re Relationship from Aircraft Observations Over Hebei, China. Earth Space Sci. 2018, 5, 19–29. [Google Scholar] [CrossRef] [Scilit]
- Li, J.; Yin, Y.; Li, P.; Li, Z.; Li, R.; Cribb, M.; Dong, Z.; Zhang, F.; Li, J.; Ren, G.; et al. Aircraft Measurements of the Vertical Distribution and Activation Property of Aerosol Particles Over the Loess Plateau in China. Atmos. Res. 2015, 155, 73–86. [Google Scholar] [CrossRef] [Scilit]
- Sayer, A.M.; Munchak, L.A.; Hsu, N.C.; Levy, R.C.; Bettenhausen, C.; Jeong, M.J. MODIS Collection 6 Aerosol Products: Comparison Between Aqua’s e-Deep Blue, Dark Target, and “Merged” Data Sets, and Usage Recommendations. J. Geophys. Res. Atmos. 2014, 119, 13965–13989. [Google Scholar] [CrossRef] [Scilit]
- Sayer, A.M.; Hsu, N.C.; Bettenhausen, C.; Jeong, M.J.; Meister, G. Effect of MODIS Terra Radiometric Calibration Improvements on Collection 6 Deep Blue Aerosol Products: Validation and Terra/Aqua Consistency. J. Geophys. Res. Atmos. 2015, 120, 12157–12174. [Google Scholar] [CrossRef] [Scilit]
- Meij, A.; Pozzer, A.; Lelieveld, J. Trend Analysis in Aerosol Optical Depths and Pollutant Emission Estimates Between 2000 and 2009. Atmos. Environ. 2012, 51, 75–85. [Google Scholar] [CrossRef] [Scilit]
- Baum, B.A.; Menzel, W.P.; Frey, R.A.; Ping, Y. MODIS Cloud Top Property Refinements for Collection 6. J. Appl. Meteorol. Clim. 2012, 51, 1145–1163. [Google Scholar] [CrossRef] [Scilit]
- Kaufman, Y.J.; Tanré, D.; Remer, L.A.; Vermote, E.F.; Chu, A.; Holben, B.N. Operational Remote Sensing of Tropospheric Aerosol Over Land from EOS Moderate Resolution Imaging Spectroradiometer. J. Geophys. Res. Atmos. 1997, 102, 17051–17067. [Google Scholar] [CrossRef] [Scilit]
- Hsu, N.C.; Jeong, M.J.; Bettenhausen, C.; Sayer, A.M.; Tsay, S.C. Enhanced Deep Blue Aerosol Retrieval Algorithm: The Second Generation. J. Geophys. Res. Atmos. 2013, 118, 9296–9315. [Google Scholar] [CrossRef] [Scilit]
- Levy, R.C.; Munchak, L.A.; Mattoo, S.; Patadia, F.; Remer, L.A.; Holz, R.E. Towards a Long-Term Global Aerosol Optical Depth Record: Applying a Consistent Aerosol Retrieval Algorithm to MODIS and VIIRS-Observed Reflectance. Atmos. Meas. Tech. 2015, 8, 4083–4110. [Google Scholar] [CrossRef] [Scilit]
- King, M.D.; Tsay, S.C.; Platnick, S.; Wang, M. Cloud Retrieval Algorithms for MODIS: Optical Thickness, Effective Particle Radius, and Thermodynamic Phase; Cambridge University Press: Cambridge, UK, 1997. [Google Scholar]
- Platnick, S.; King, M.D.; Ackerman, S.A.; Menzel, W.P.; Baum, B.A.; Riedi, J.C.; Frey, R.A. The MODIS Cloud Products: Algorithms and Examples from Terra. IEEE Trans. Geosci. Remote Sens. 2003, 41, 459–473. [Google Scholar] [CrossRef] [Scilit]
- Strapp, J.W.; Leaitch, W.R.; Liu, P. Hydrated and Dried Aerosol-Size-Distribution Measurements from the Particle Measuring Systems FSSP-300 Probe and the Deiced PCASP-100X Probe. J. Atmos. Ocean. Technol. 1992, 9, 548–555. [Google Scholar] [CrossRef] [Scilit]
- Dong, X.; Zhao, C.; Yang, Y.; Wang, Y.; Sun, Y.; Fan, R. Distinct Change of Supercooled Liquid Cloud Properties by Aerosols from an Aircraft-Based Seeding Experiment. Earth Space Sci. 2020, 7, e2020EA001196. [Google Scholar] [CrossRef] [Scilit]
- Zhang, D.; Li, Z.; Wu, H.; Wu, T.; Ren, R.; Cai, Z.; Liang, C.; Chen, L. Analysis of Aerosol Particle Number Size Distribution and Source Attribution at Three Megacities in China. Atmos. Environ. 2022, 279, 119114. [Google Scholar] [CrossRef] [Scilit]
- Lance, S.; Brock, C.A.; Rogers, D.; Gordon, J.A. Water Droplet Calibration of the Cloud Droplet Probe (CDP) and In-Flight Performance in Liquid, Ice and Mixed-Phase Clouds During ARCPAC. Atmos. Meas. Tech. 2010, 3, 1683–1706. [Google Scholar] [CrossRef] [Scilit]
- Faber, S.; French, J.R.; Jackson, R. Laboratory and In-Flight Evaluation of Measurement Uncertainties from a Commercial Cloud Droplet Probe (CDP). Atmos. Meas. Tech. 2018, 11, 3645–3659. [Google Scholar] [CrossRef] [Scilit]
- Xu, Q.; Chen, X.; Rupakheti, D.; Dong, J.; Tang, L.; Kang, S. Evaluation and Comparison of Spatio-Temporal Relationship between Multiple Satellite Aerosol Optical Depth (AOD) and Near-Surface PM2.5 Concentration over China. Remote Sens. 2022, 14, 5841. [Google Scholar] [CrossRef] [Scilit]
- Huang, F.; Gong, C.; Ma, W.; Liu, H.; Zhong, B.; Jing, C.; Fu, J.; Zhang, C.; Zhang, X. Analysis of Spatiotemporal Distribution Trends of Aerosol Optical Depth and Meteorological Influences in Gansu Province, Northwest China. Remote Sens. 2025, 17, 2874. [Google Scholar] [CrossRef] [Scilit]
- Wang, Y.; Xin, J.; Li, Z.; Wang, S.; Wang, P.; Hao, W.M.; Nordgren, B.L.; Chen, H.; Wang, L.; Sun, Y. Seasonal Variations in Aerosol Optical Properties Over China. J. Geophys. Res. Atmos. 2011, 116, D18209. [Google Scholar] [CrossRef] [Scilit]
- Peng, Z.; Yang, Y.; Jin, Y.; Wang, B.; Zhang, Z.; Pan, T.; Tian, Z. Multi-Source Remote Sensing-Constrained Evaluation of CMAQ Aerosol Optical Depth over Major Urban Clusters in China. Remote Sens. 2026, 18, 1134. [Google Scholar] [CrossRef] [Scilit]
- Gao, W.; Tang, G.; Xin, J.; Wang, L.; Wang, Y. Spatial-Temporal Variations of Ozone During Severe Photochemical Pollution Over the Beijing-Tianjin-Hebei Region. Res. Environ. Sci. 2016, 29, 654–663. [Google Scholar]
- Yang, X.; Yang, X.; Zhu, J.; Jiang, P.; Lin, H.; Cai, Z.; Huang, H.; Long, J. Synergic emissions reduction effect of China’s “Air Pollution Prevention and Control Action Plan”: Benefits and efficiency. Sci. Total Environ. 2022, 847, 157564. [Google Scholar] [CrossRef] [Scilit] [PubMed]
- Wang, Y.; Chai, T.; Li, J.; Feng, L.; Jian, J.; Huang, J.; McFarquhar, G.M. Dust Decline Amplifies High-Cloud Ice-to-Liquid Transition and Buffers the Radiative Feedback under Warming. Geophys. Res. Lett. 2026, 53, e2026GL121917. [Google Scholar] [CrossRef] [Scilit]
- Wang, Y.; Li, J.; Zhao, Y.; Li, Y.; Zhao, Y.; Wu, X. Distinct Diurnal Cycle of Supercooled Water Cloud Fraction Dominated by Dust Extinction Coefficient. Geophys. Res. Lett. 2022, 49, e2021GL097006. [Google Scholar] [CrossRef] [Scilit]
- Liu, Q.; Jia, X.; Quan, J.; Li, J.; Li, X.; Wu, Y.; Chen, D.; Wang, Z.; Liu, Y. New Positive Feedback Mechanism between Boundary Layer Meteorology and Secondary Aerosol Formation during Severe Haze Events. Sci. Rep. 2018, 8, 6095. [Google Scholar] [CrossRef] [Scilit] [PubMed]

Disclaimer/Publisher’s Note: The statements, opinions and data contained in all publications are solely those of the individual author(s) and contributor(s) and not of MDPI and/or the editor(s). MDPI and/or the editor(s) disclaim responsibility for any injury to people or property resulting from any ideas, methods, instructions or products referred to in the content. |
© 2026 by the authors. Licensee MDPI, Basel, Switzerland. This article is an open access article distributed under the terms and conditions of the Creative Commons Attribution (CC BY) license.