


Highlights
What are the main findings?
- Urban expansion in Ulaanbaatar may increase heating demand.
- Rooftop PV could offset 10.9% of coal-based heating but only with feed-in tariff support.
What are the implications of the main findings?
- Satellite-based assessments can effectively link urban growth, heating demand, and renewable energy potential in cold-climate cities.
- Urban expansion should be incorporated into long-term energy planning and decarbonization strategies.
Abstract
Ulaanbaatar, Mongolia, relies heavily on coal for winter heating, and continued urban expansion is expected to increase heating demand. This study investigated heating demand and rooftop PV potential in Ulaanbaatar from 2016 to 2025 using Google Earth Engine. Nighttime light intensity, heating degree days (HDD), and solar radiation datasets were integrated to evaluate changes in human activity, climate-driven heating demand, and rooftop solar resources. Electricity-equivalent heating demand, rooftop PV generation, coal displacement potential, and techno-economic performance under different policy scenarios were assessed. The results reveal a clear increase in urban built-up area during the study period, accompanied by rising nighttime light intensity, indicating growing urban activity. Despite relatively stable HDD, urban expansion implies increasing potential heating demands. Under the main rooftop PV deployment scenario, surplus electricity could theoretically offset approximately 10.9% of coal-based heating demand and reduce CO2 emissions by 1.126 MtCO2 yr−1 through resistance heating. When the same surplus was converted through heat pumps with COP = 1.86, the theoretical coal-heating offset increased to 20.3%. However, economically viable large-scale deployment remained strongly dependent on feed-in tariff support. These findings indicate that continued urban expansion may lead to higher heating demand in Ulaanbaatar and highlight both the opportunities and structural limitations of rooftop PV for decarbonizing coal-dependent heating systems in cold-climate cities.
1. Introduction
Ulaanbaatar, the capital city of Mongolia, is one of the most air-polluted cities in the world [1]. Severe air pollution has been associated with a range of adverse health outcomes, including reduced lung function and reproductive health problems [2,3]. The major source of this pollution is coal combustion, which remains the dominant energy source for electricity supply and household heating [4]. Ulaanbaatar is also regarded as the coldest capital city in the world [5], with winter temperatures frequently falling below −20 °C and an annual mean temperature of around 0 °C. Because heating demand is driven by its extreme cold, air pollution is most severe during winter [6], and coal-based heating energy consumption in the city exceeds electricity consumption by roughly a factor of 30.
Under a warming climate, the climatic component is expected to decline, and studies in other cold cities have reported decreasing heating demand as heating degree days fall [7,8]. However, city-scale heating energy consumption is driven not only by climate but by the quantity of heated building stock, and in rapidly urbanizing cold regions the growth of heated area has been shown to dominate over efficiency gains. In the Jing-Jin-Ji urban agglomeration of northern China, district heating energy consumption in the building sector rose by 120% between 2004 and 2016, with the expansion of heated area contributing consistently to the increase while improving heating energy intensity worked in the opposite direction [9]. Ulaanbaatar’s built-up area has continued to expand rapidly [10], much of it in low-density ger districts with poor insulation [11]. Reliable monitoring of urban expansion is therefore a prerequisite for evaluating its potential influence on city-scale heating demand.
Reliable quantification of urban expansion requires spatially consistent observations over long time periods. Satellite datasets provide such information and have been widely used for long-term monitoring of land use change at city scales, providing continuous spatial information for analyzing urban growth patterns and landscape transformation processes [12,13]. In recent years, satellite-based indicators have also been increasingly applied to evaluate climate conditions, human activity intensity, socioeconomic activity, and land use change [14,15,16]. These datasets provide valuable opportunities to investigate interactions among urban expansion, environmental change, and energy-related pressure within a single consistent spatial framework. Satellite-derived built-up area, however, records land cover rather than land use. An increase in classified built-up pixels does not by itself establish that the new area is an occupied, energy-consuming settlement rather than nominal land conversion, cleared ground, or vacant plots. An independent indicator of human activity is therefore required to confirm that measured expansion carries a corresponding energy implication. Nighttime light intensity provides this indicator. Artificial light emission at night is closely associated with population concentration, socioeconomic activity, and electricity consumption [17,18,19], and can be observed consistently across the same annual time series as the built-up area masks. Joint analysis of built-up area and nighttime light intensity was therefore used to examine whether mapped urban expansion was consistent with increasing human activity. Nighttime light was treated as a complementary indicator of urban activity rather than as direct validation of heating-energy consumption.
The Mongolian government has actively addressed air pollution issues and joined the Paris Agreement in 2016, and pledged to increase the share of renewable energy sources [20]. The government has also promoted a series of policies encouraging renewable and cleaner energy development [21]. Among these alternatives, solar energy has received increasing attention as a potential option [20]. Rooftop photovoltaic (PV) systems have also been considered possible low-carbon energy options for urban environments all over the world [22]. Recent studies have expanded from solar resource estimation toward techno-economic and policy-related assessments at the city scale, including self-consumption performance, economic feasibility, surplus electricity generation, and the effects of feed-in tariff (FIT) policies on deployment incentives [23,24,25]. However, most of these studies have focused on tropical or temperate cities, where electricity is the dominant energy vector and cooling-related electricity demand tends to coincide seasonally with periods of high solar generation [26]. In contrast, cold-climate cities with coal-dependent heating systems remain substantially underexplored. In these cities, the critical question is not only whether PV systems can reduce electricity-related emissions, but also whether surplus PV generation can offset coal heating demand, an indirect pathway that has not been quantified for a city of Ulaanbaatar’s thermal and structural characteristics.
Accordingly, this study aimed to (i) quantify the expansion of built-up area in Ulaanbaatar from 2016 to 2025 and examine, using nighttime light intensity, whether this expansion corresponds to intensified human activity; (ii) estimate the resulting change in cold-season heating demand; and (iii) evaluate the potential and structural limitations of urban-scale PV, deployed on that same built-up area, to displace coal-based heating under cold-climate conditions.
2. Materials and Methods
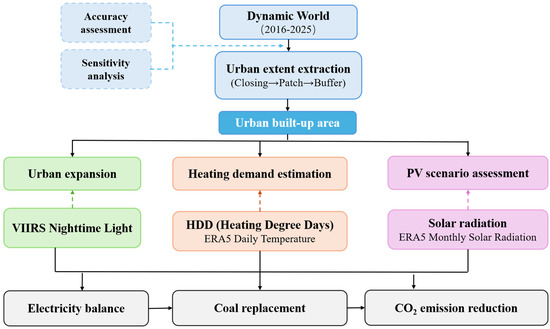
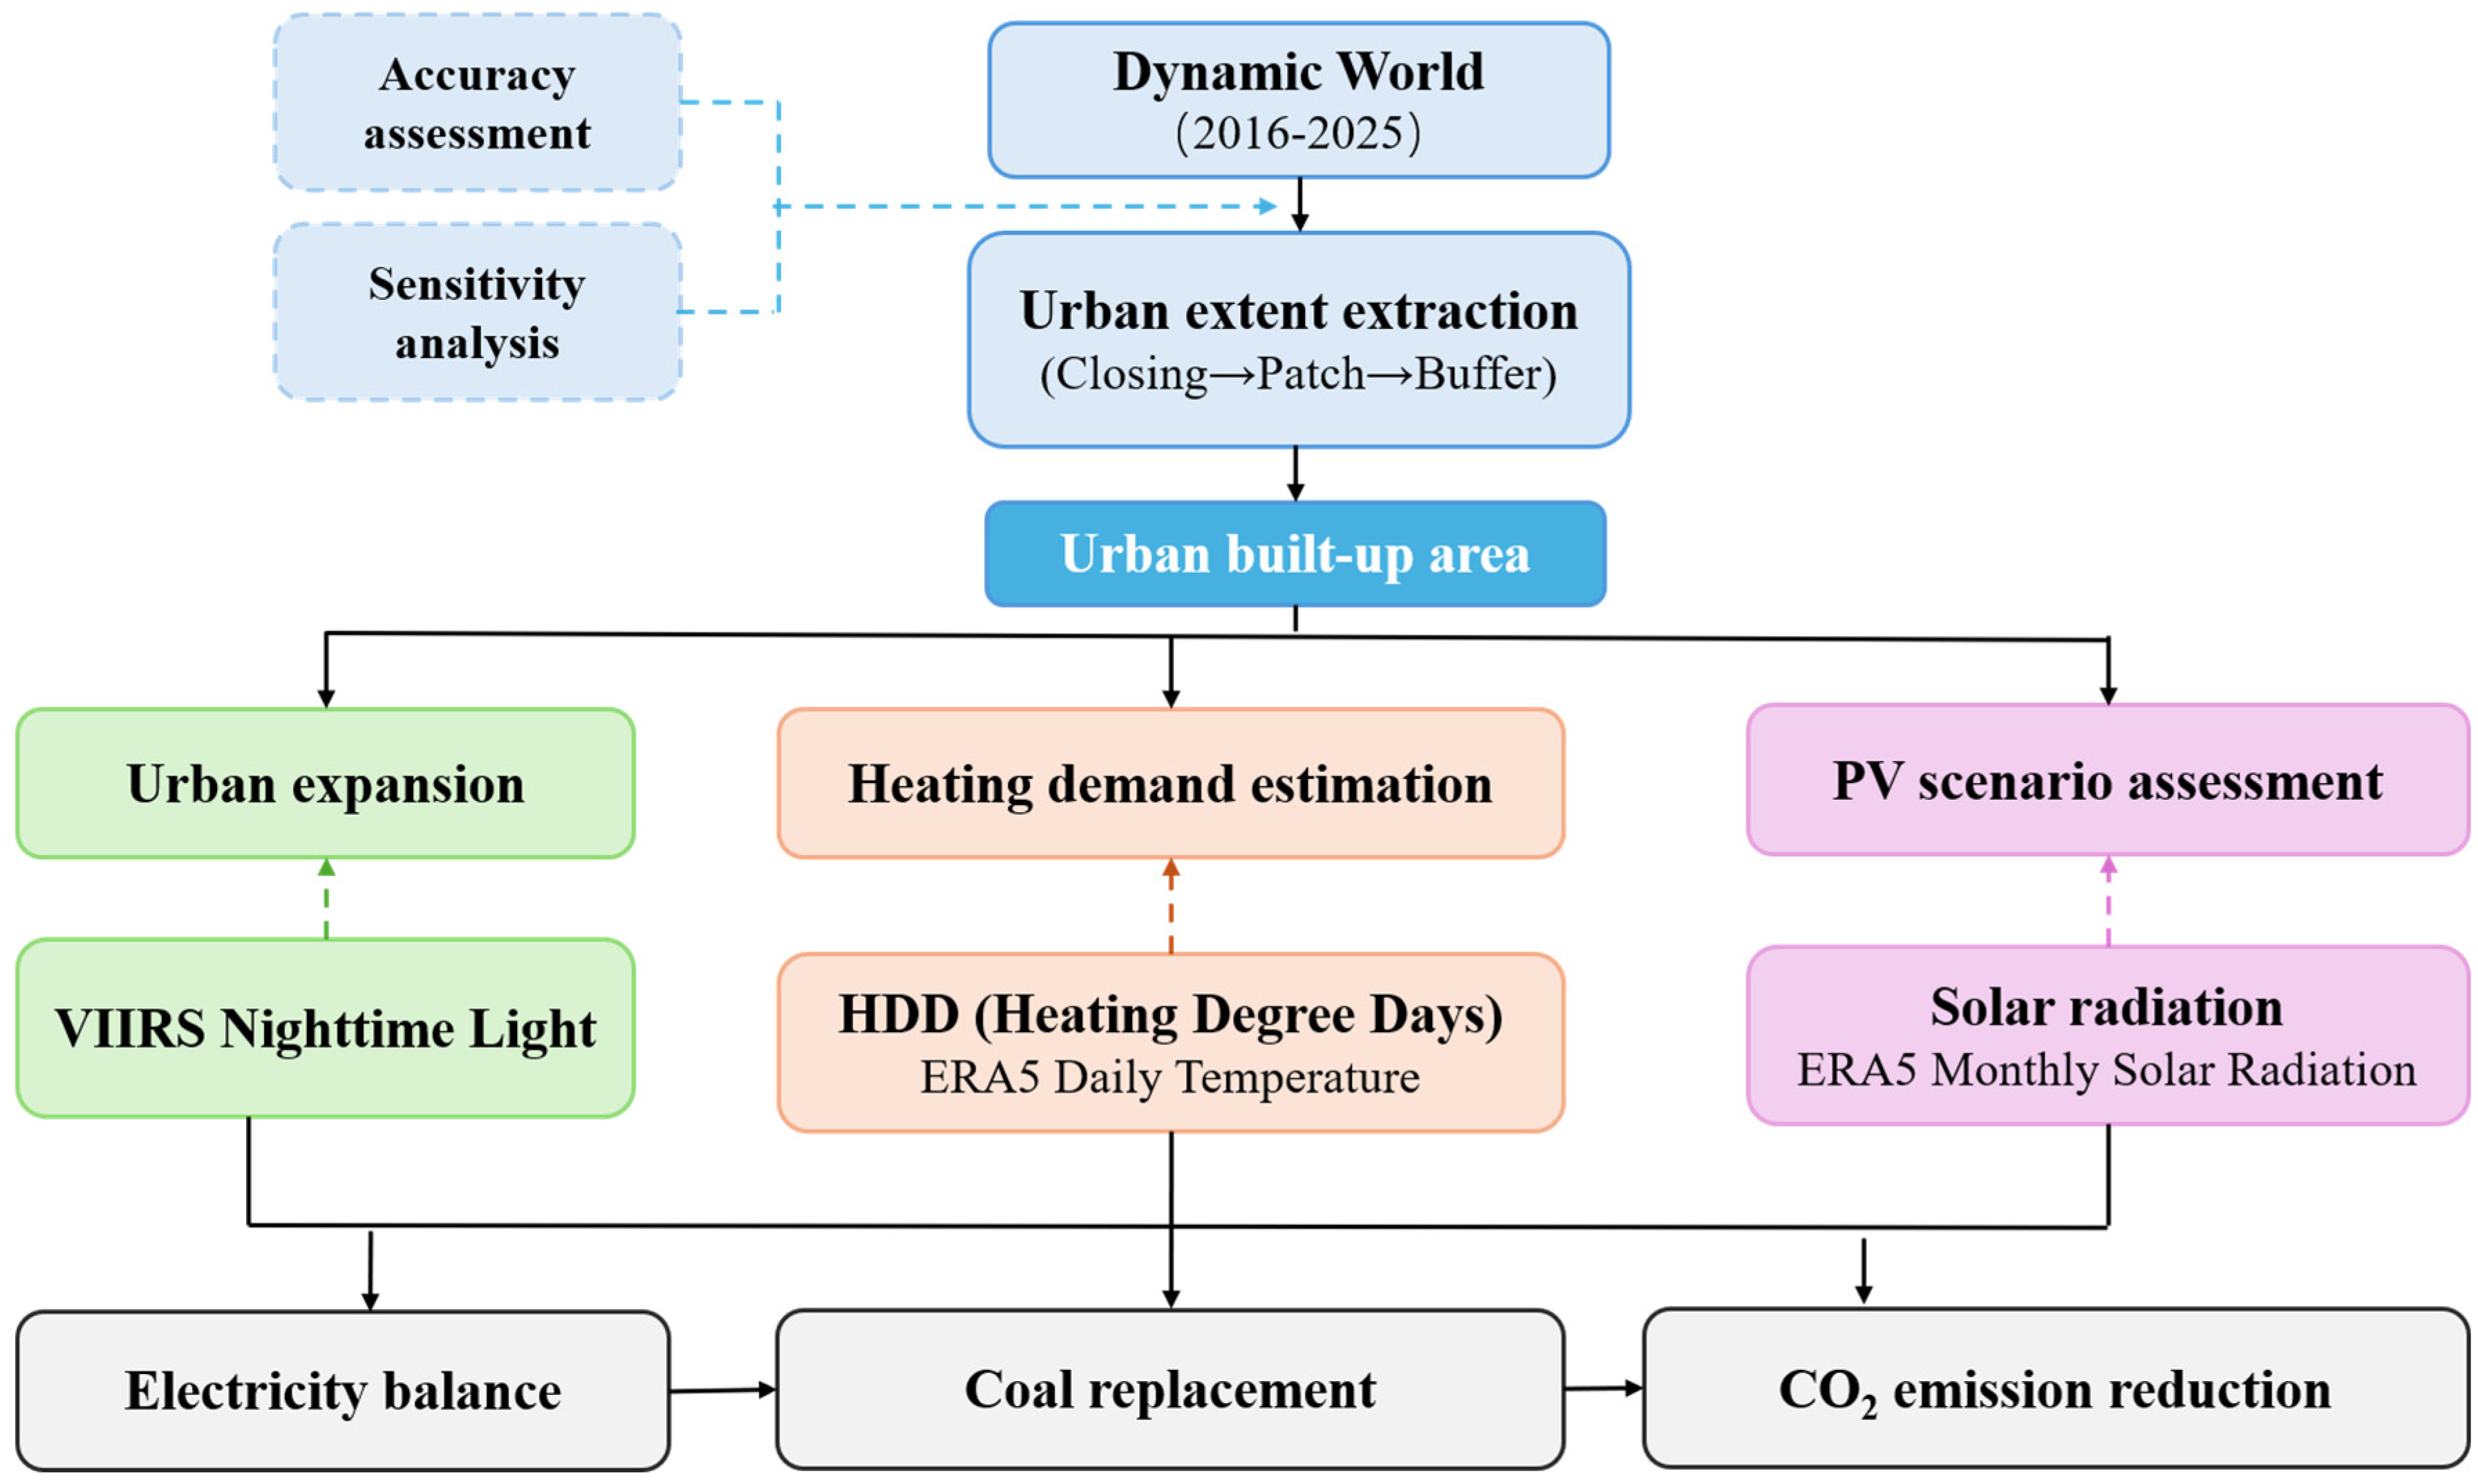
The overall workflow of this study is summarized in Figure 1.
Figure 1.
Overall workflow of the proposed methodology.
2.1. Study Area
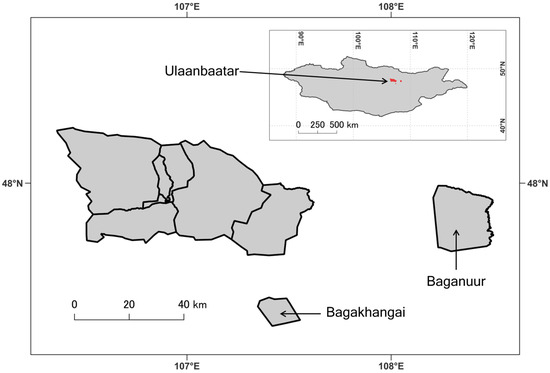
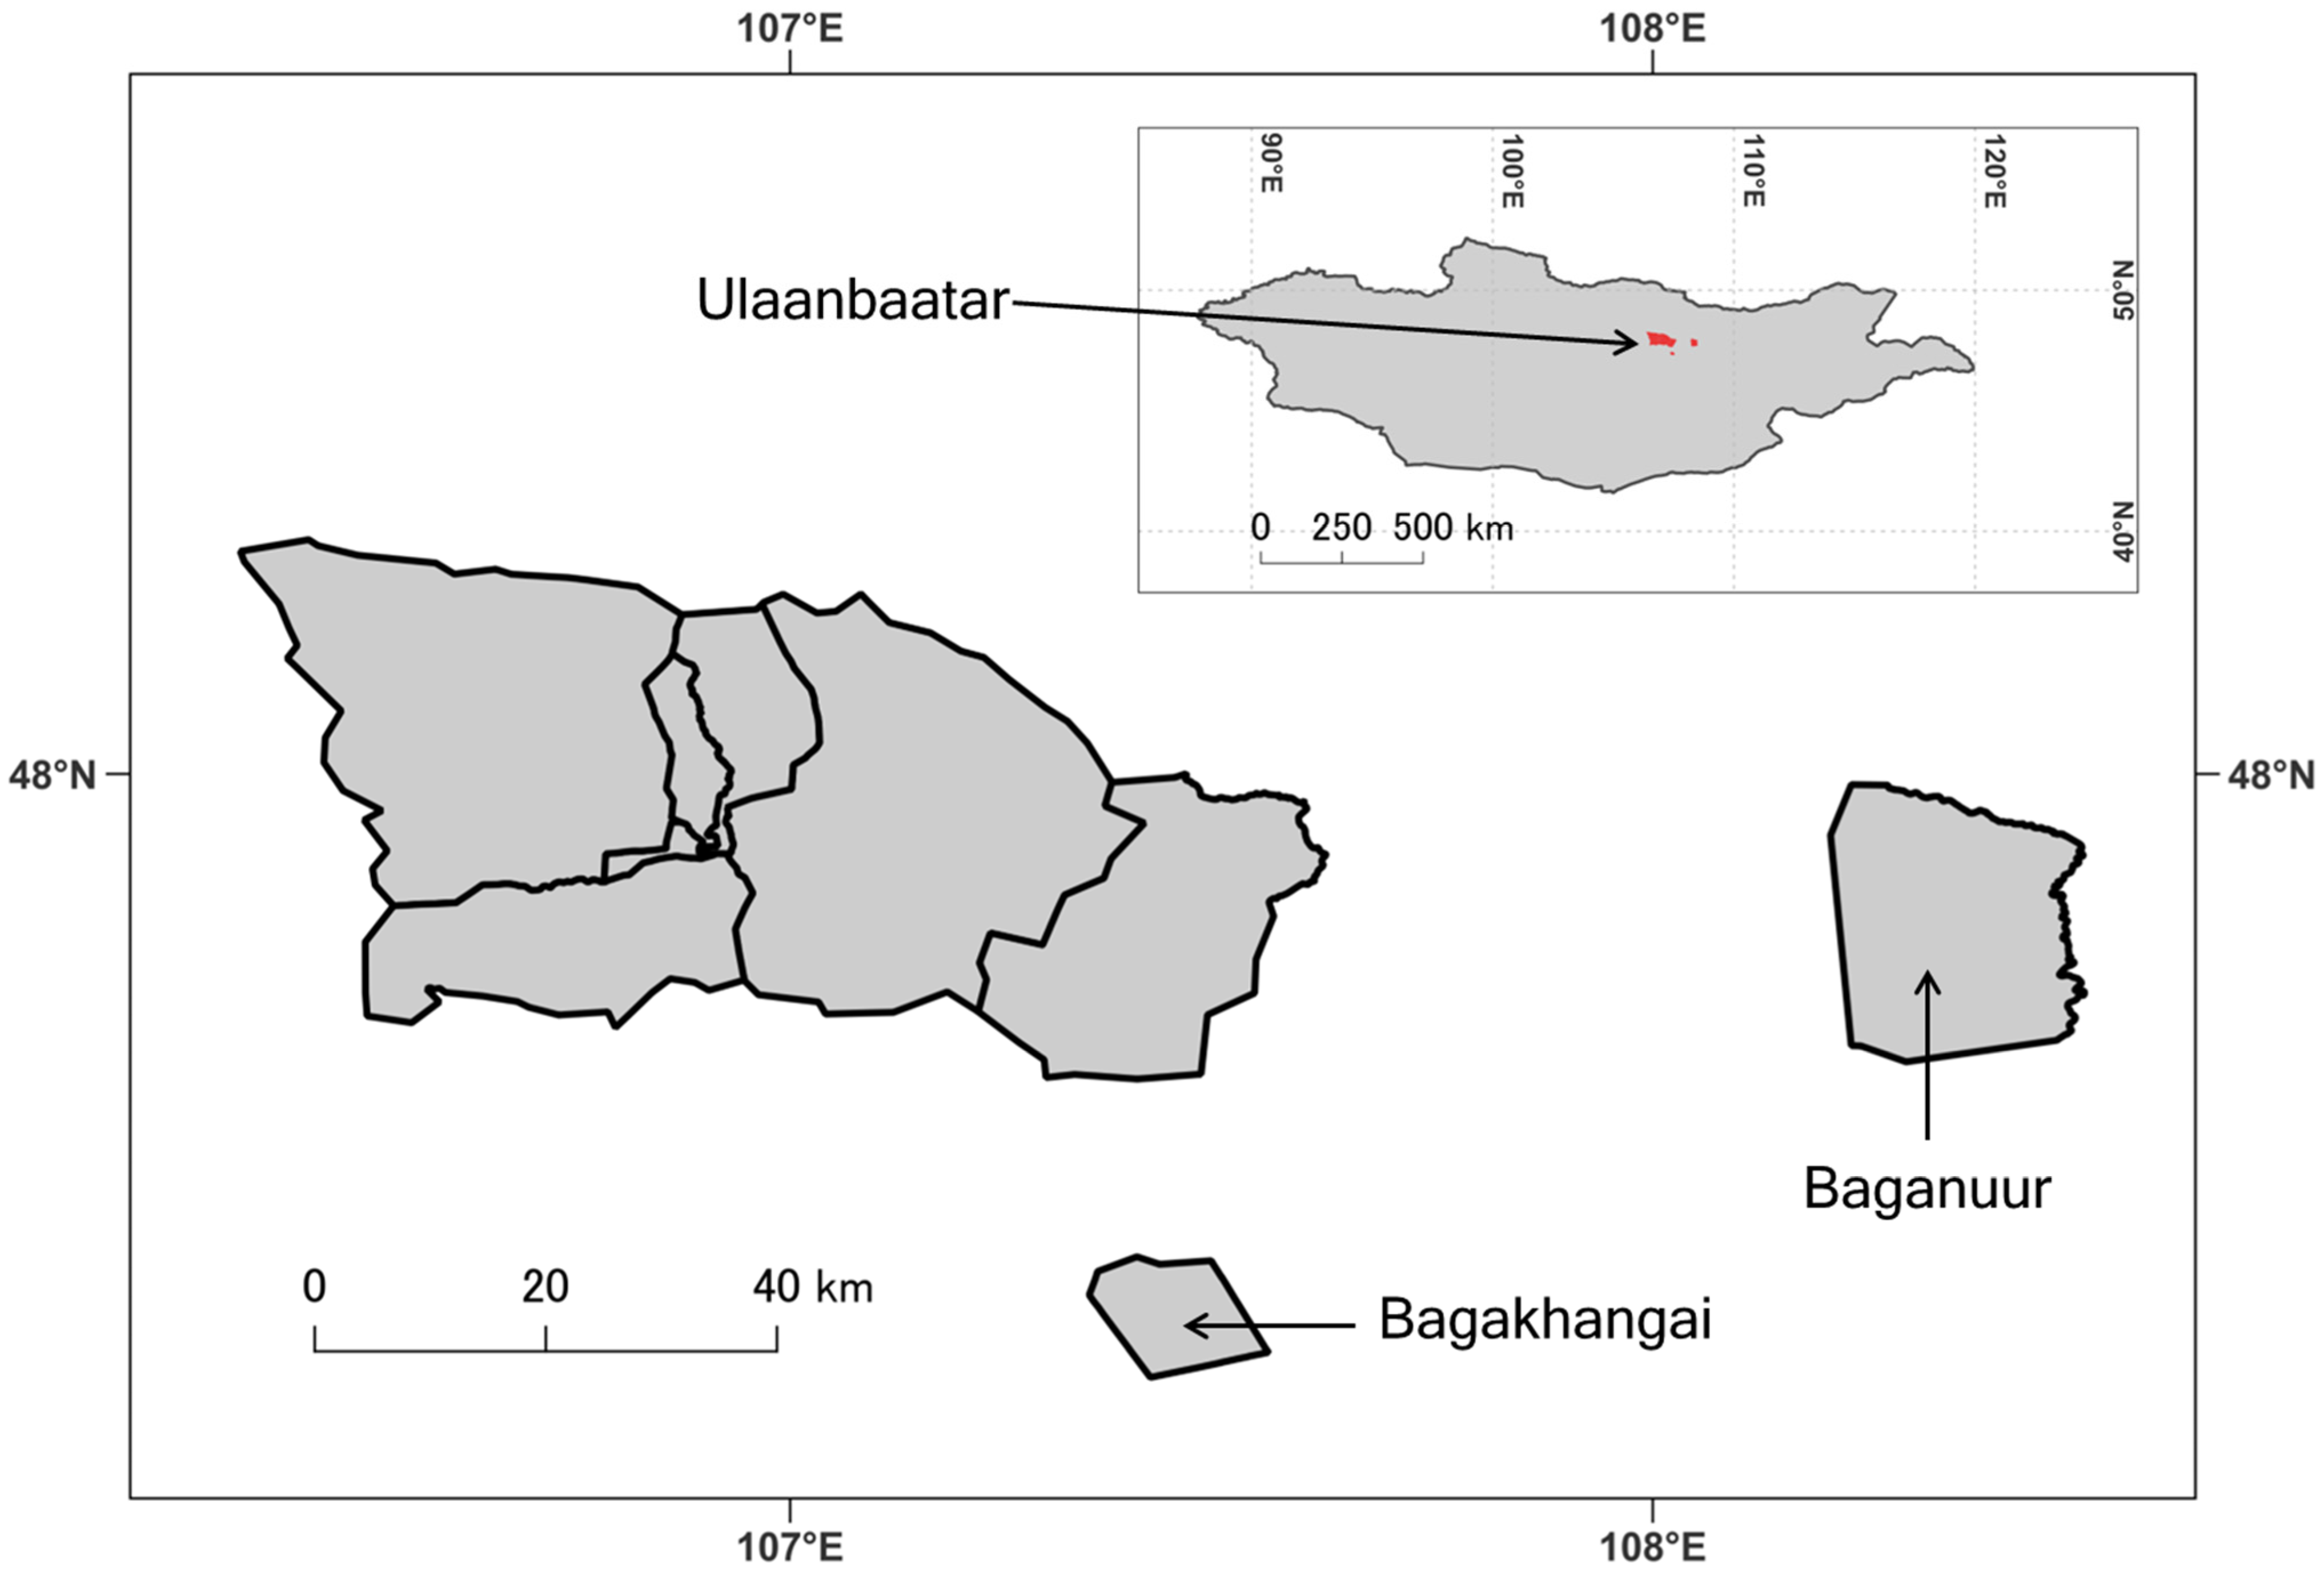
Ulaanbaatar is administratively divided into nine districts (Figure 2). Among these districts, Baganuur and Bagakhangai are spatially separated exclaves and do not represent the continuous urban expansion process of the main urban area of Ulaanbaatar. Therefore, these two districts were excluded from the analysis. The largest contiguous region was retained as the study area to focus on the spatial expansion characteristics of central Ulaanbaatar.
Figure 2.
Location of the study area and administrative districts of Ulaanbaatar, Mongolia. Baganuur and Bagakhangai, which are spatially separated exclave districts, were excluded to focus on the contiguous urban expansion of the main urban area.
2.2. Data Sources
Remote sensing data processing and analysis were conducted using Google Earth Engine. The study period covered 2016–2025.
2.2.1. Built-Up Area
Built-up area data were derived from the Dynamic World dataset, which was developed by Google and the World Resources Institute based on Sentinel-2 imagery, with a spatial resolution of 10 m. The Dynamic World dataset includes per-pixel land cover classification results (label band) and corresponding class probability information, including nine land cover classes: water, trees, grass, flooded vegetation, crops, shrub and scrub, built area, bare ground, and snow and ice. In this study, the pixels classified as the built area class were selected, and built-up area was used as a remote sensing proxy for urban extent. Ger areas were also included in the built-up category.
2.2.2. Nighttime Light Intensity
Nighttime light intensity data were obtained from the stray-light-corrected VIIRS (Visible Infrared Imaging Radiometer Suite) Day/Night Band monthly product (VCMSLCFG) provided by the National Oceanic and Atmospheric Administration (NOAA) (NOAA/VIIRS/DNB/MONTHLY_V1/VCMSLCFG). The avg_rad band was used to represent nighttime radiance intensity. Monthly nighttime light observations were aggregated into annual mean values for each year from 2016 to 2025 to analyze temporal changes in human activity intensity.
2.2.3. Heating Degree Days
Heating degree days (HDD) data were used to represent climate-driven heating demand. Air temperature data were obtained from the ECMWF ERA5-Land daily aggregated dataset (ECMWF/ERA5_LAND/DAILY_AGGR). The 2m air temperature variable (temperature_2m) was used and converted from Kelvin to degrees Celsius. In this study, HDD was calculated using 15 °C as the base temperature. For each day, HDD was defined as the positive difference between the base temperature and the daily 2 m air temperature. Daily HDD values were then summed to obtain annual HDD values:
where Tdaily represents daily 2 m air temperature in degrees Celsius.
2.2.4. Solar Radiation
Solar radiation data were obtained from the ECMWF ERA5-Land monthly aggregated reanalysis dataset (ECMWF/ERA5_LAND/MONTHLY_AGGR). The surface solar radiation downwards sum variable (surface_solar_radiation_downwards_sum) was selected. This variable represents the total downward solar radiation received at the surface (J/m2). Monthly solar radiation values for the 2024 cold season (November 2024 to March 2025) were accumulated and converted from J/m2 to MJ/m2 to obtain total cold-season solar radiation. Total solar energy within built-up areas was then calculated to evaluate the solar energy potential of rooftop photovoltaic systems for urban heating under cold-climate conditions.
2.3. Built-Up Area Extraction and Processing
2.3.1. Built-Up Area Extraction
Built-up area extraction was based on the land use classification results of the Dynamic World dataset. To reduce the influence of snow cover and seasonal variability on classification accuracy, only images acquired from May to October were used for analysis. This period corresponds to relatively snow-free conditions in Ulaanbaatar and therefore provides stability for built-up area detection. For each year, the occurrence frequency of pixels classified as built area throughout the time series was calculated. This approach is based on the principle of temporal consistency: pixels classified as built area more frequently during the observation period are more likely to represent as built-up area. Subsequently, the annual occurrence frequency was converted into binary built-up masks using a threshold of 0.5. To evaluate the sensitivity of the extraction results to this threshold, two adjacent thresholds, 0.4 and 0.6, were additionally tested.
2.3.2. Accuracy Assessment
A stratified random sampling approach was used to evaluate the accuracy of the built-up area classification, thereby assessing the applicability of the proposed Dynamic World-based built-up area extraction method in Ulaanbaatar. The accuracy assessment was conducted using the original threshold-based built-up classification results for three representative years (2016, 2021, and 2025). No post-processing procedures, such as morphological operations, small patch removal, or main urban area extraction, were applied, in order to avoid their influence on the evaluation of classification accuracy. In each year, a total of 300 validation points were generated, with equal proportions of built-up and non-built-up samples to ensure balanced class representation and improve evaluation reliability. Reference data were obtained through visual interpretation of high-resolution historical imagery in Google Earth Pro, using imagery acquired in July or August whenever available. Each validation point was manually classified as built-up or non-built-up based on image characteristics. Mean built-up User’s Accuracy, built-up Producer’s Accuracy, Overall Accuracy and the Kappa coefficient of three years were calculated.
2.3.3. Delineation of the Continuous Urban Extent
To delineate the continuous urban extent used for subsequent analyses, the extracted built-up masks were further processed. First, morphological closing (dilation followed by erosion) was applied to fill small gaps within built-up areas and connect adjacent built-up patches. Second, small, isolated patches were removed. Built-up patches smaller than 0.2 km2 were regarded as noise based on visual inspection of the extracted built-up patterns and excluded from subsequent analysis. The robustness of this parameter was further evaluated through a sensitivity analysis using alternative minimum patch sizes (0, 0.1, 0.2, 0.3, and 0.4 km2). Connected component analysis was performed to identify contiguous built-up regions, and only the largest connected patch was retained as the main urban area. To preserve spatially related expansion areas surrounding the main urban region, a 5 km buffer, selected based on visual inspection of the spatial relationship between the largest urban patch and surrounding built-up patches, was generated around the largest connected patch, and built-up patches intersecting this buffer were also retained (Code S5). The selected distance was intended to retain peripheral built-up patches spatially associated with the main urban area while excluding more distant isolated settlements. This refinement procedure removed scattered rural settlements and isolated infrastructure, thereby improving the representation of the continuous built-up expansion of the main urban area. The robustness of this parameter was evaluated through sensitivity analysis using alternative buffer distances of 3 and 7 km.
2.4. Urban Expansion and Energy-Related Indicators
2.4.1. Urban Expansion Metrics
Annual built-up area (km2) was calculated by summing the area of all built-up pixels for each year. The annual growth rate of the built-up area was calculated as:
where Areat represents the built-up area in year t.
Based on the annual built-up masks, temporal changes and spatial expansion patterns of built-up area were further analyzed.
2.4.2. Nighttime Light Analysis
Annual mean nighttime light intensity was calculated separately for built-up and non-built-up areas using VIIRS data to evaluate temporal changes in human activity intensity associated with built-up expansion. In addition, linear regression analysis was conducted to evaluate the relationship between annual built-up area and nighttime light intensity.
2.4.3. Electricity-Equivalent Heating Demand Estimation
Cold season (November–following year March) electricity-equivalent heating demand was estimated to evaluate temporal changes in heating demand associated with urban expansion from 2016 to 2025. The cold season electricity-equivalent heating demand was estimated as:
where E is the electricity-equivalent heating demand, HDD is the cold-season heating degree days calculated using a base temperature of 15 °C, 24 converts daily heat demand to hourly energy demand, B is the built-up area derived from Dynamic World; FAR is the floor area ratio; HLC is the heat loss coefficient; and COP is the coefficient of performance of the heating system. FAR was used to convert built-up area into estimated floor area.
Because approximately 60% of Ulaanbaatar’s urban population lives in low-density ger districts, a relatively low FAR value of 0.6 was adopted in the main scenario. HLC represents the amount of heat loss per unit floor area under a 1 °C indoor–outdoor temperature difference. Due to the cold climate and generally poor insulation conditions in ger districts, a relatively high HLC value of 1.5 W/m2/°C was used. COP represents heating system efficiency. A conservative COP value of 1.0 was adopted to estimate electricity-equivalent heating demand rather than actual heat pump electricity consumption.
To account for uncertainties in urban morphology, insulation conditions, and heating system efficiency, sensitivity ranges for FAR, HLC, and COP were also considered in the analysis. The parameter ranges adopted in this study are summarized in Table S1.
2.5. Solar Energy Potential
2.5.1. Urban-Scale Solar PV Potential
Solar radiation analysis and PV potential assessment were conducted for the 2024 cold season. To translate this urban-scale spatial extent into an estimate of PV installation potential, we adopted an urban-scale PV scenario approach. Rather than assuming that all built-up surface is suitable for PV installation, a fraction of the total built-up area was assumed to represent realistically deployable PV surface.
For the main analysis, 10% of the total built-up area was used as the primary scenario, corresponding to a PV installation capacity of approximately 4.44 GW. To evaluate sensitivity to this assumption, three additional scenarios are assessed, including a conservative scenario at 5%, an optimistic scenario at 20%, and a lower scenario at 2.5%. The 2.5% scenario was included to identify the minimum deployment threshold.
The PV capacity for each scenario was derived as:
where fPV is the assumed fraction of built-up area suitable for PV installation (0.025, 0.05, 0.10, or 0.20), and 7 m2/kW is a standard area-to-capacity conversion factor [27,28]. The PV deployment scenarios were considered at capacities of 1.11, 2.22, 4.44, and 8.89 GW for the 2.5%, 5%, 10%, and 20%, respectively. Each of these four deployment scenarios was subsequently evaluated under two policy conditions, with and without the current FIT.
The potential contribution of surplus PV electricity to coal-based heating displacement was evaluated through three sequential calculations derived from the System Advisor Model (SAM; version 2020.2.29 r3, [29]) simulation outputs.
First, hourly positive surplus electricity was calculated by comparing hourly PV generation with concurrent hourly electricity demand over the November–March heating season:
where EPV(t) and Edemand(t) are the hourly PV generation and hourly electricity demand (kWh) obtained from the SAM simulation over the heating season. Only hours in which generation exceeded demand contribute to the total, while deficit hours are excluded rather than netted against surplus hours, since offsetting a deficit at one hour against a surplus at another would implicitly assume storage or grid balancing capacity that was not modeled in this study.
Second, the coal offset ratio was calculated as the proportion of coal-based heating energy that could theoretically be displaced if all surplus PV electricity were directed toward replacing coal-based heating during the 120-day heating season:
where Ecoal is the total coal-based heating energy consumed during the heating season (kWh), estimated at 28.69 TWh based on coal consumption statistics and the coal energy conversion factor [30]. This ratio assumes direct one-to-one energy conversion of surplus electricity to delivered heat (equivalent to a coefficient of performance, COP, of 1), consistent with the electricity-equivalent basis on which Ecoal is defined. It therefore represents a conservative estimate with respect to conversion technology, and displacement efficiency would be higher if surplus electricity were delivered through heat pumps rather than resistive electric heating, as discussed in Section 4.2.
Third, the avoided CO2 emissions from coal displacement were estimated by applying the coal emission factor to the surplus electricity:
where EFcoal is the coal CO2 emission factor of 0.00036 tCO2/kWh [30], and ΔCO2 is expressed in MtCO2/year. This factor reflects direct CO2 emissions from coal combustion per unit of thermal energy equivalent and is distinct from the grid electricity emission factor (0.001046 tCO2/kWh), which was used to evaluate emissions from electricity generation.
2.5.2. Techno-Economic Assessment
Rooftop PV capacity estimates and solar radiation data derived from the remote sensing and geospatial analyses were used as primary inputs for a scenario-based techno-economic assessment using the SAM. This analysis constitutes an applied extension of the remote sensing results, by examining whether the satellite-quantified rooftop solar resource can realistically contribute to electricity supply and CO2 emission reduction under current and potential future policy conditions.
Two policy scenarios were evaluated. Scenario A assumed no feed-in tariff, and Scenario B applied the current Mongolian solar feed-in tariff of 0.15 USD/kWh. For each scenario, SAM’s parametric function was used to identify the optimal PV capacity yielding the maximum net present value (NPV), simulated across 200 incremental runs decreasing from the maximum rooftop PV capacity of 43.0 GW to near zero in steps of approximately 215 MW per run. NPV was calculated over a 25-year project lifetime at a 3% discount rate. Performance indicators including self-consumption, self-sufficiency, energy sufficiency, cost saving, and CO2 emission reduction were calculated for each scenario.
Input parameters for the SAM analysis are described in Tables S4–S6 and the electricity demand and tariff data described below. The hourly electricity demand profile was estimated using SAM’s Building Energy Load Profile Estimator, constrained by monthly electricity consumption data for Ulaanbaatar [31]. The weighted electricity tariff of 0.07 USD/kWh was derived from the three-tier household tariff structure established by Mongolia’s Energy Regulatory Commission (ERC) in November 2024 [32]. The tariff was converted using an exchange rate of 1 MNT = 0.000280 USD (as of 2 May 2025).
The primary financial metric used to evaluate project viability was Net Present Value (NPV), calculated over a 25-year project lifetime with a 3% discount rate, expressed as:
where a is the PV capacity, N is the project period, n is the project year, t is the first year of the project, and Rd is the discount rate.
The optimal PV capacity yielding the maximum NPV was identified for each scenario using SAM’s “Parametric” function.
3. Results
3.1. Accuracy Assessment and Sensitivity Analysis
The mean accuracy assessment results for the three years showed that all three tested occurrence thresholds achieved high classification accuracy, demonstrating the applicability of the Dynamic World-based method for built-up area extraction in Ulaanbaatar (Table 1). Since the 0.5 threshold showed the highest Overall Accuracy, Producer’s Accuracy, and Kappa coefficient, it was adopted for subsequent analyses.
Table 1.
Mean accuracy assessment results for built-up area classification at different thresholds across the three representative years (2016, 2021, and 2025).
Across all tested minimum patch-size thresholds (0–0.4 km2), annual differences in the estimated built-up area remained below 5%, with a consistent temporal expansion pattern (Table S2). Similarly, annual differences across the tested buffer distances (3–7 km) also remained below 5%, indicating that the delineation results were not sensitive to reasonable parameter variations (Table S3).
3.2. Urban Expansion and Energy-Related Impacts
3.2.1. Spatiotemporal Expansion of Built-Up Area
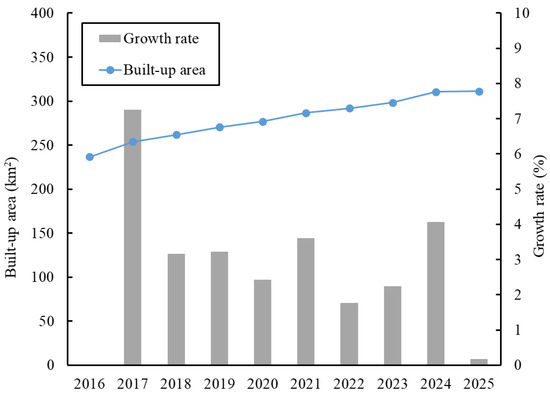
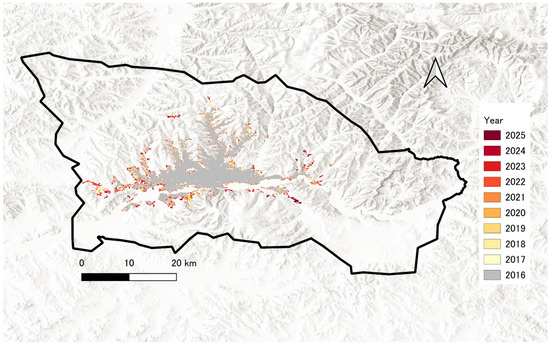
Temporal changes in built-up area and annual growth rate from 2016 to 2025 are shown in Figure 3. The total built-up area increased continuously during the study period, from approximately 237 km2 in 2016 to 311 km2 in 2025. Although annual growth rates fluctuated among years, the overall trend reflected continuous built-up expansion. Spatial expansion patterns are presented in Figure 4. The built-up expansion mainly occurred in low-relief areas, whereas expansion into surrounding mountainous regions was relatively limited.
Figure 3.
Temporal changes in built-up area and annual growth rate from 2016 to 2025.
Figure 4.
Built-up area distribution and annual expansion in the study area from 2016 to 2025. The 2016 built-up area represents the baseline extent, and subsequent years indicate newly developed built-up areas. The hillshade background represents surrounding topographic conditions.
3.2.2. Changes in Human Activity Intensity
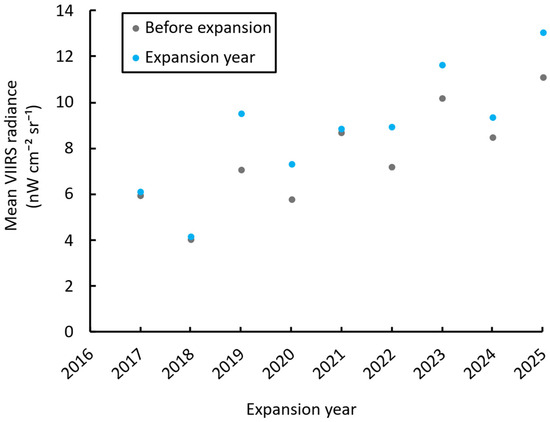
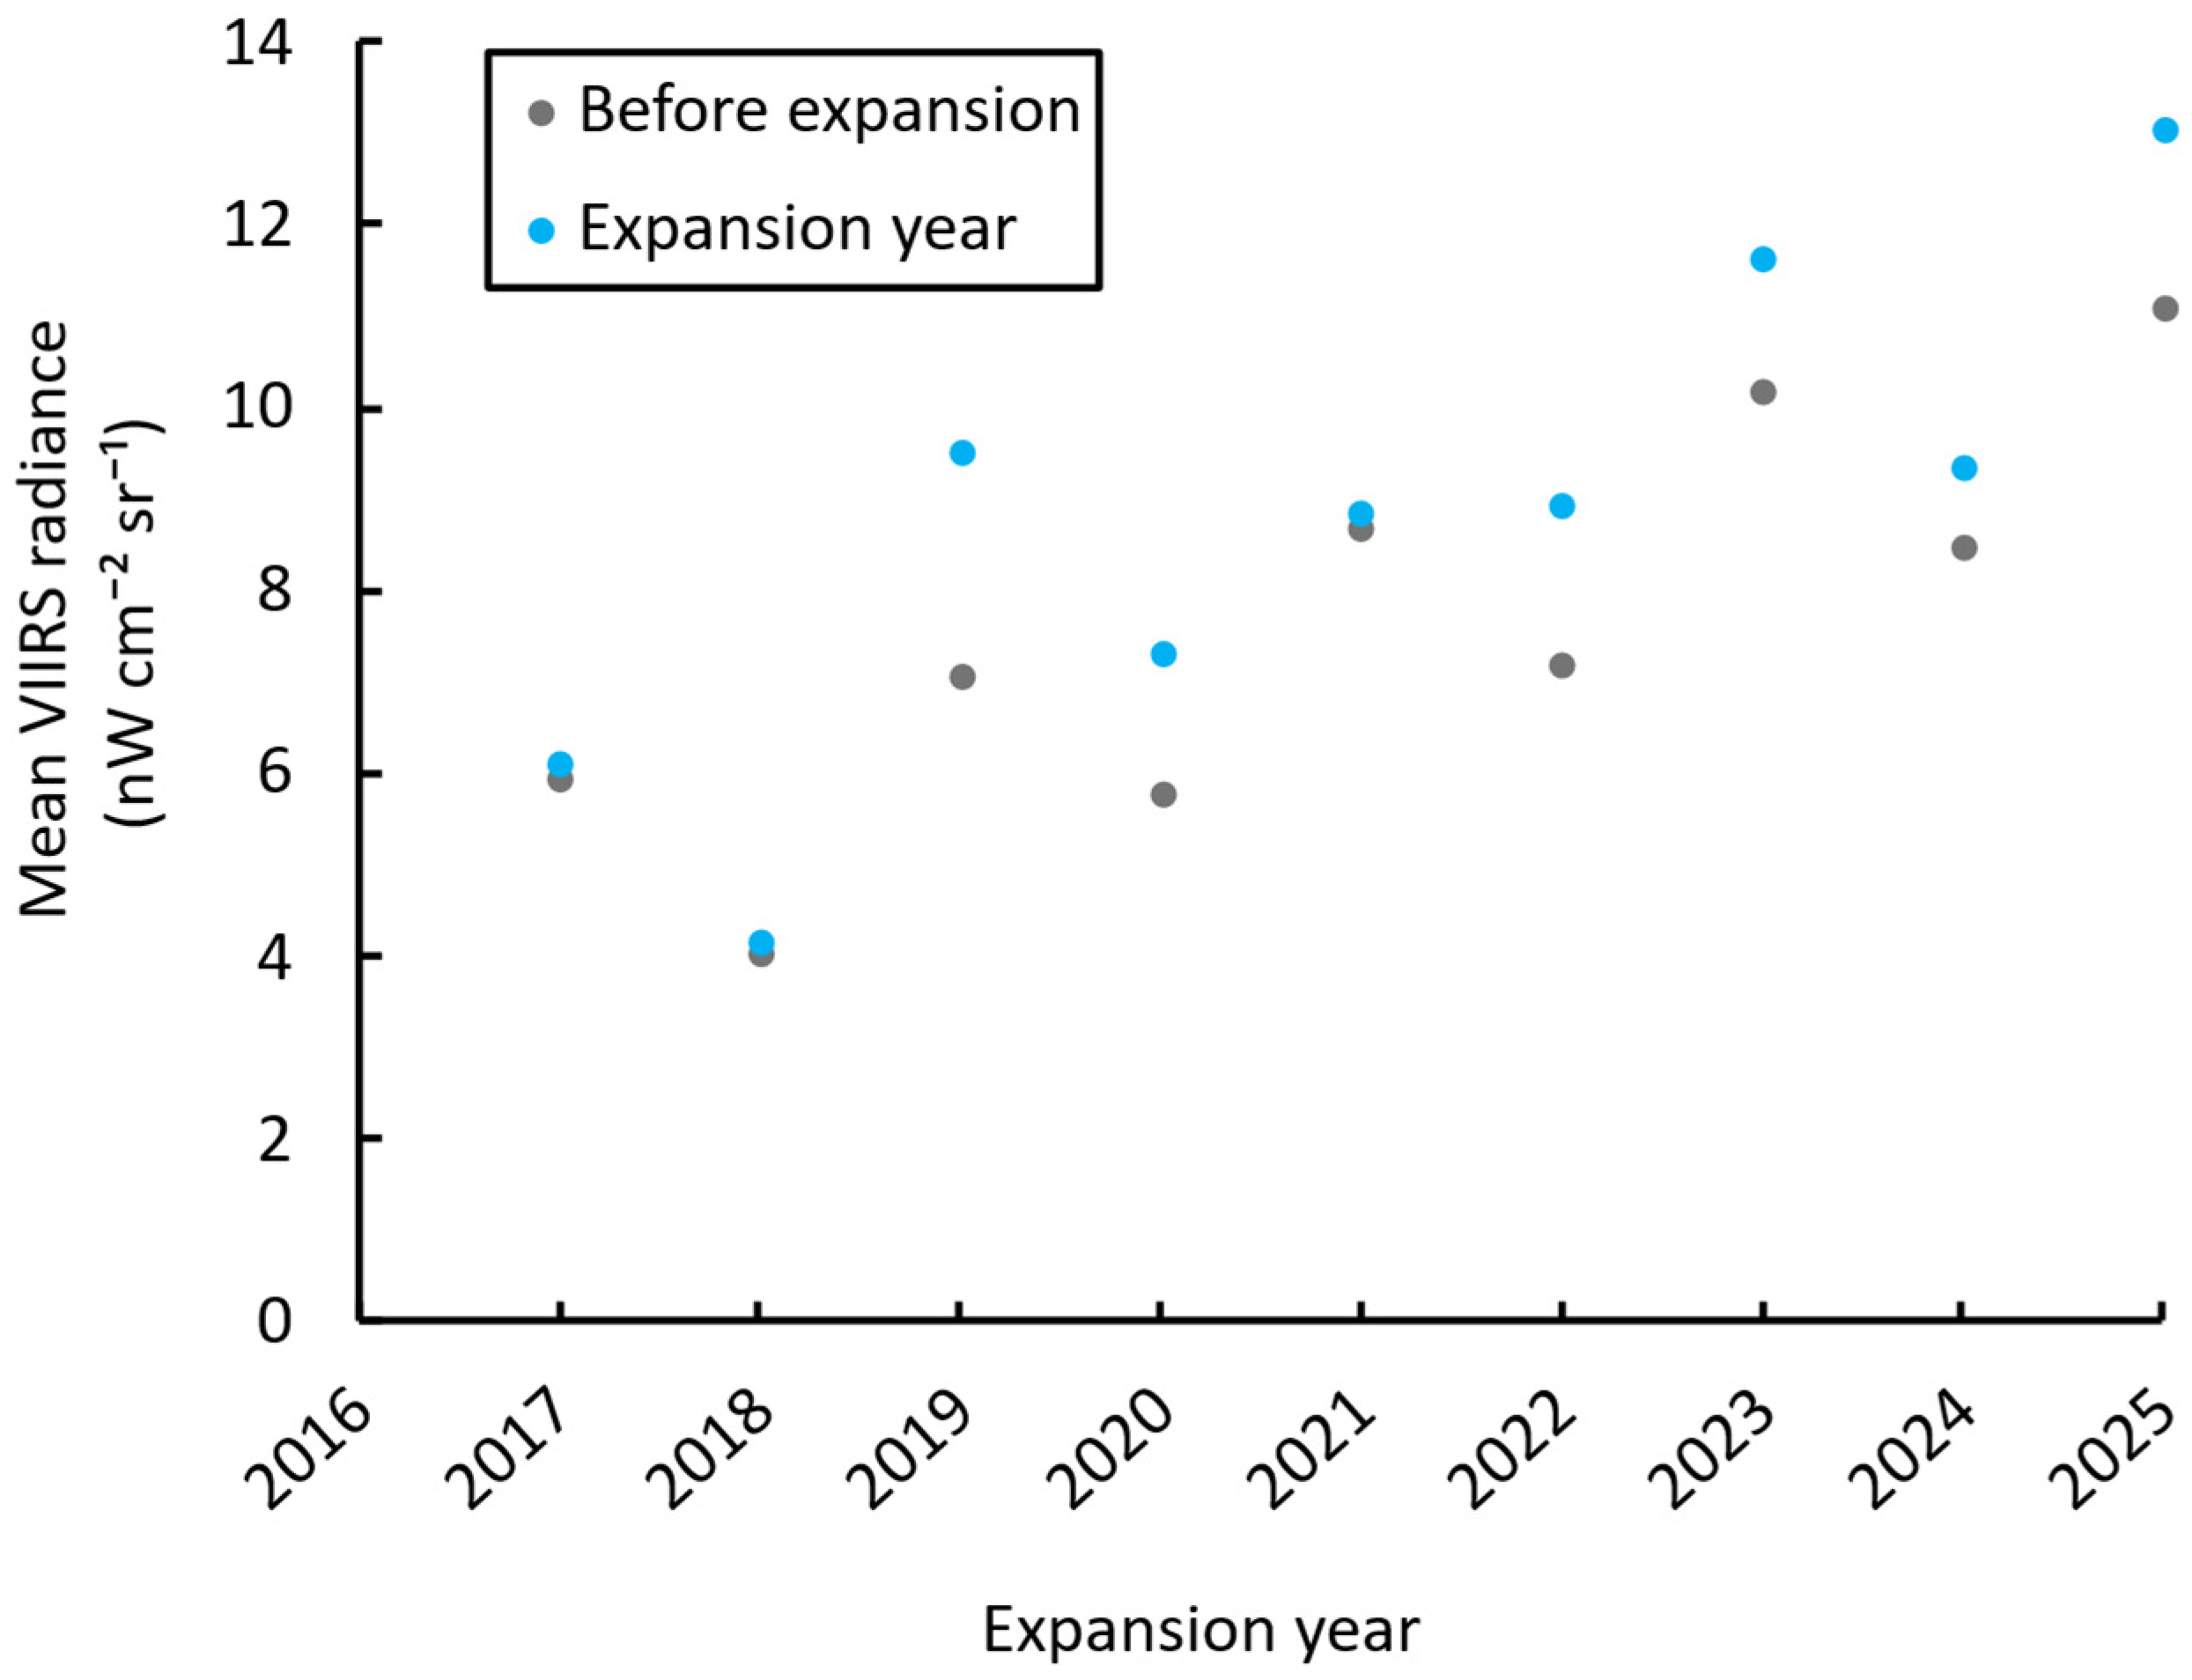
To examine whether the detected built-up expansion was accompanied by enhanced human activities, nighttime-light intensity was compared between the year preceding urban expansion and the expansion year within newly developed built-up areas. As shown in Figure 5, mean nighttime-light intensity was consistently higher during the expansion year than in the preceding year for all expansion years from 2017 to 2025. Although the magnitude of increase varied among years, all paired comparisons showed positive changes.
Figure 5.
Comparison of the mean VIIRS (Visible Infrared Imaging Radiometer Suite) nighttime light intensity in newly developed built-up areas between the year before expansion and the expansion year from 2017 to 2025.
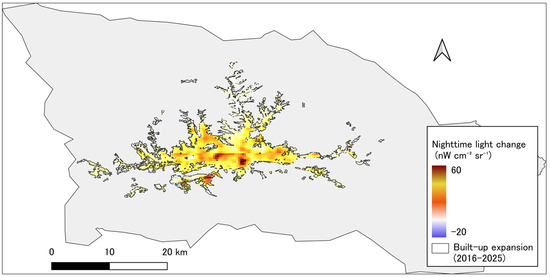
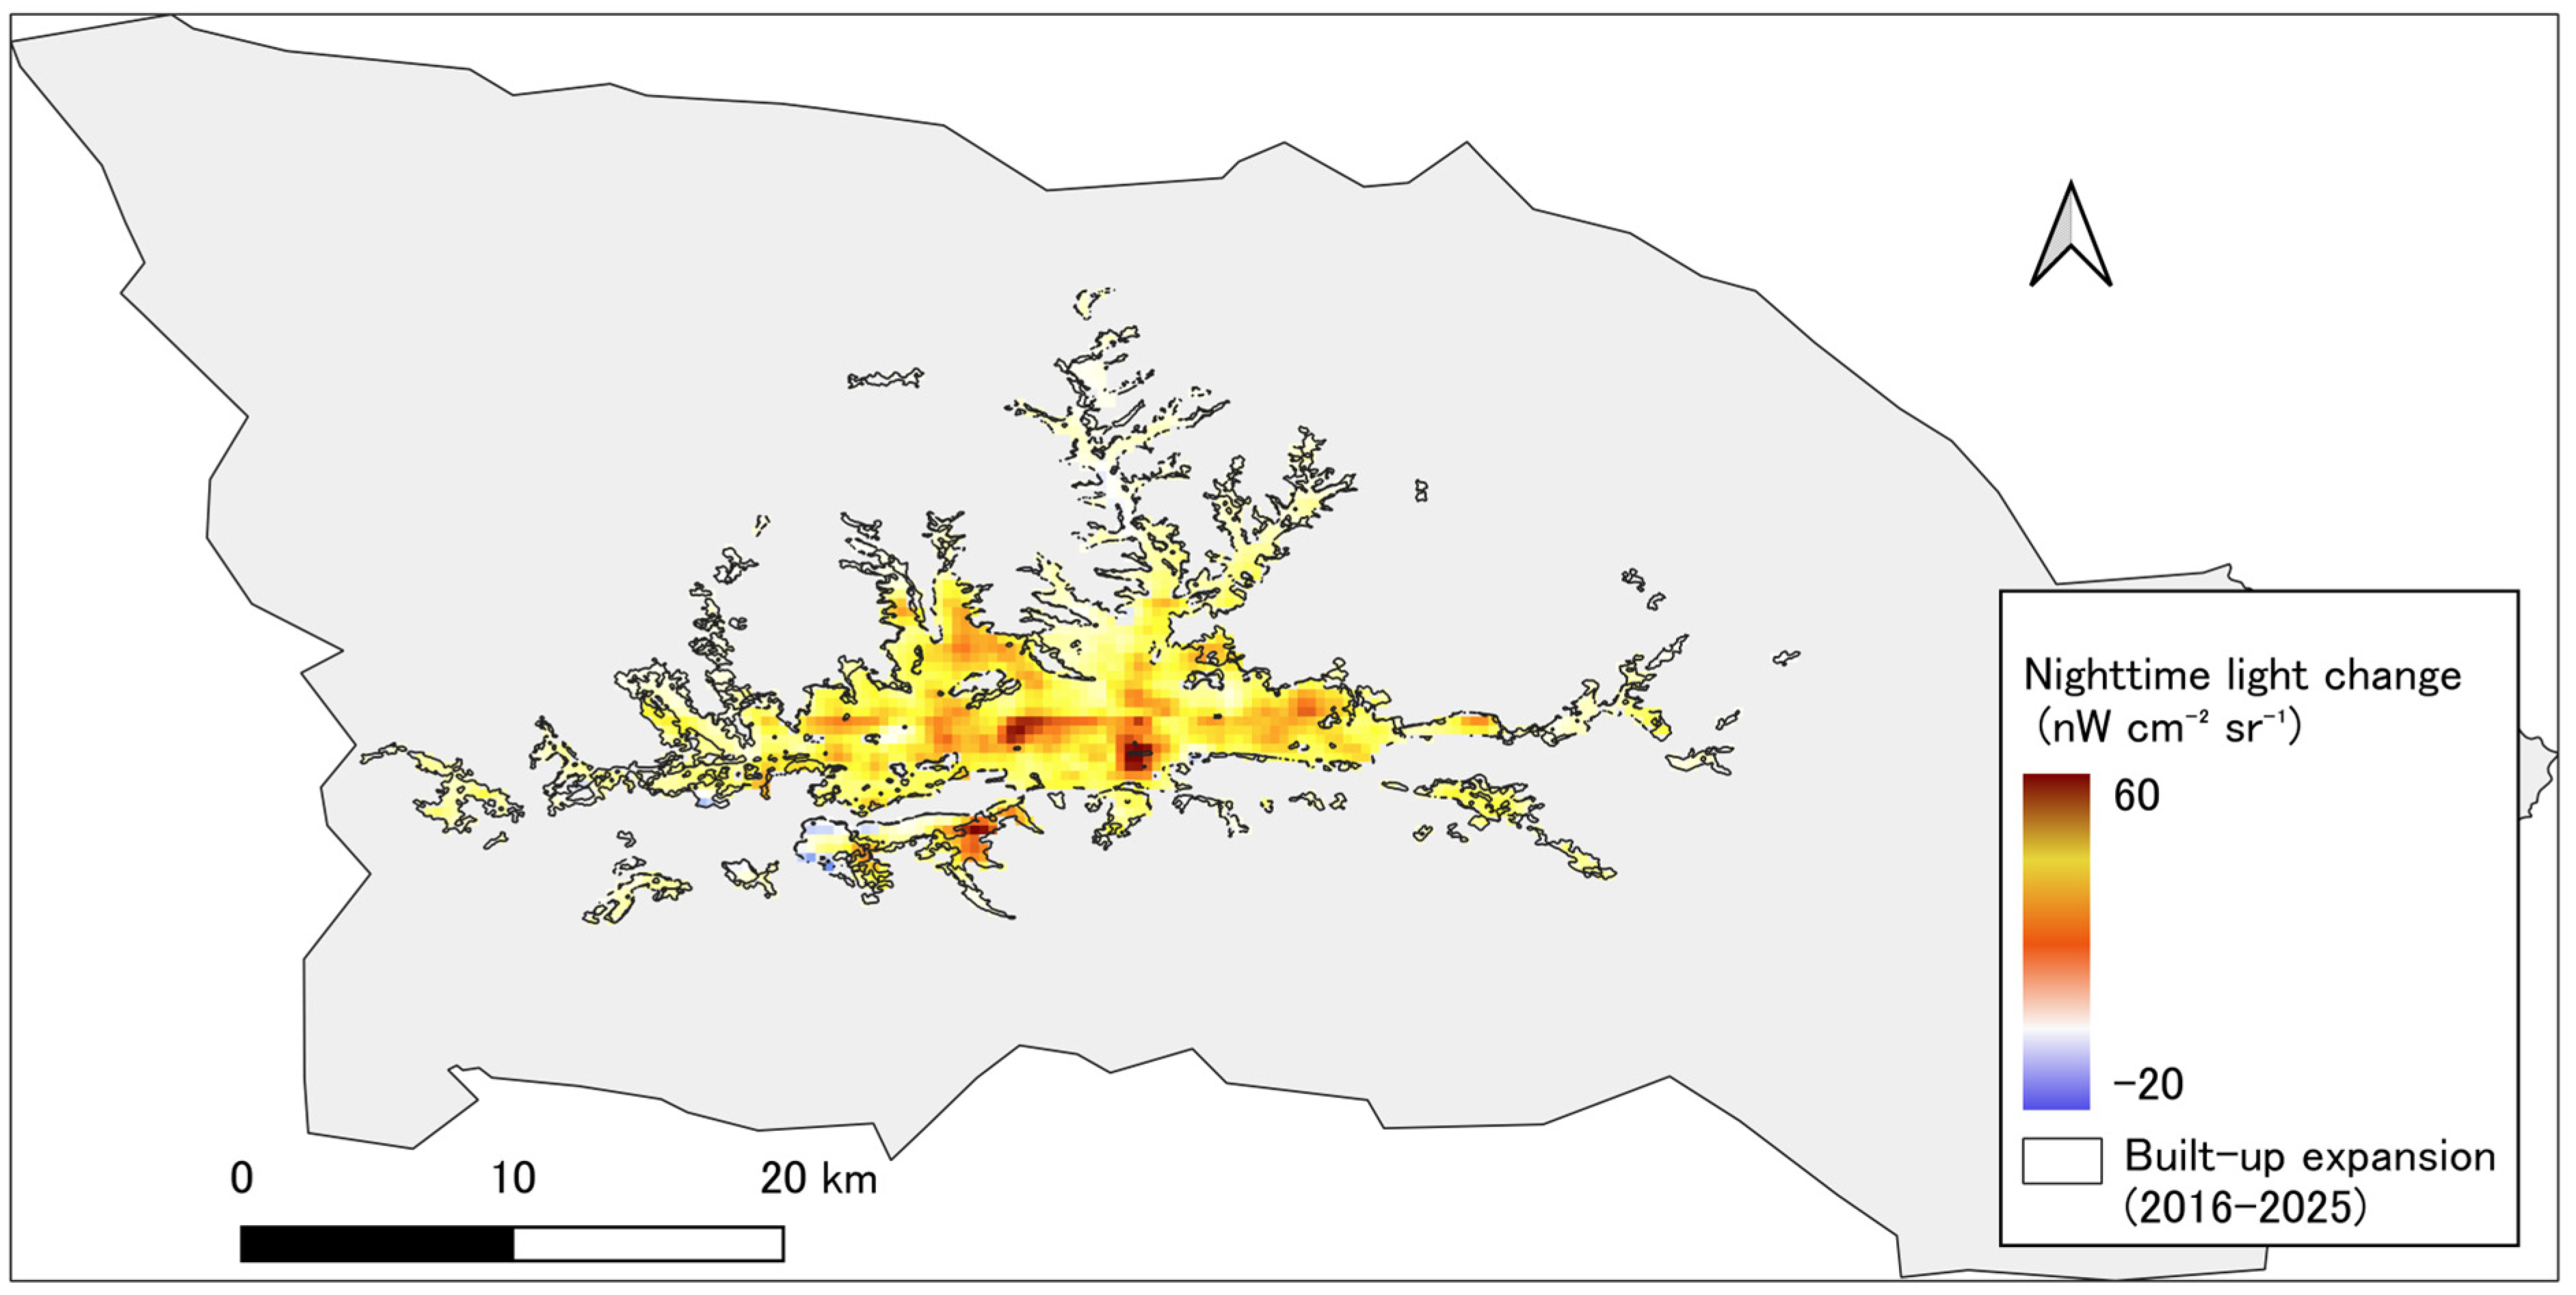
Figure 6 provides complementary spatial evidence by comparing the cumulative nighttime-light change between 2016 and 2025 with the spatial distribution of built-up expansion. Areas exhibiting relatively large increases in nighttime-light intensity were mainly located within the urban core and many newly developed built-up areas. Although the magnitude of nighttime-light change varied spatially, the overall spatial pattern of nighttime-light enhancement broadly corresponded to the distribution of built-up expansion, further supporting that the detected urban expansion was associated with increased human activities.
Figure 6.
Spatial distribution of VIIRS (Visible Infrared Imaging Radiometer Suite) nighttime light intensity changes between 2016 and 2025 and the corresponding built-up expansion. Black outlines indicate newly developed built-up areas identified during 2016–2025.
3.2.3. Electricity-Equivalent Heating Demand Estimation
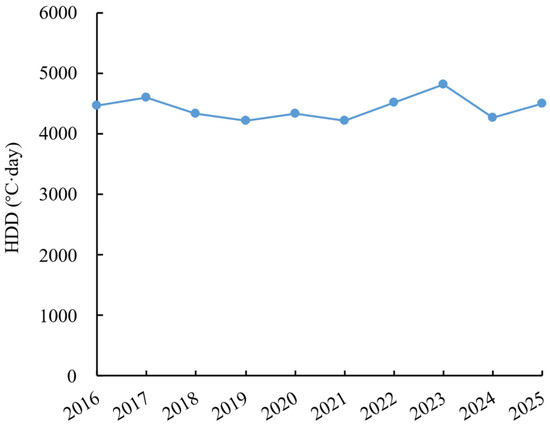
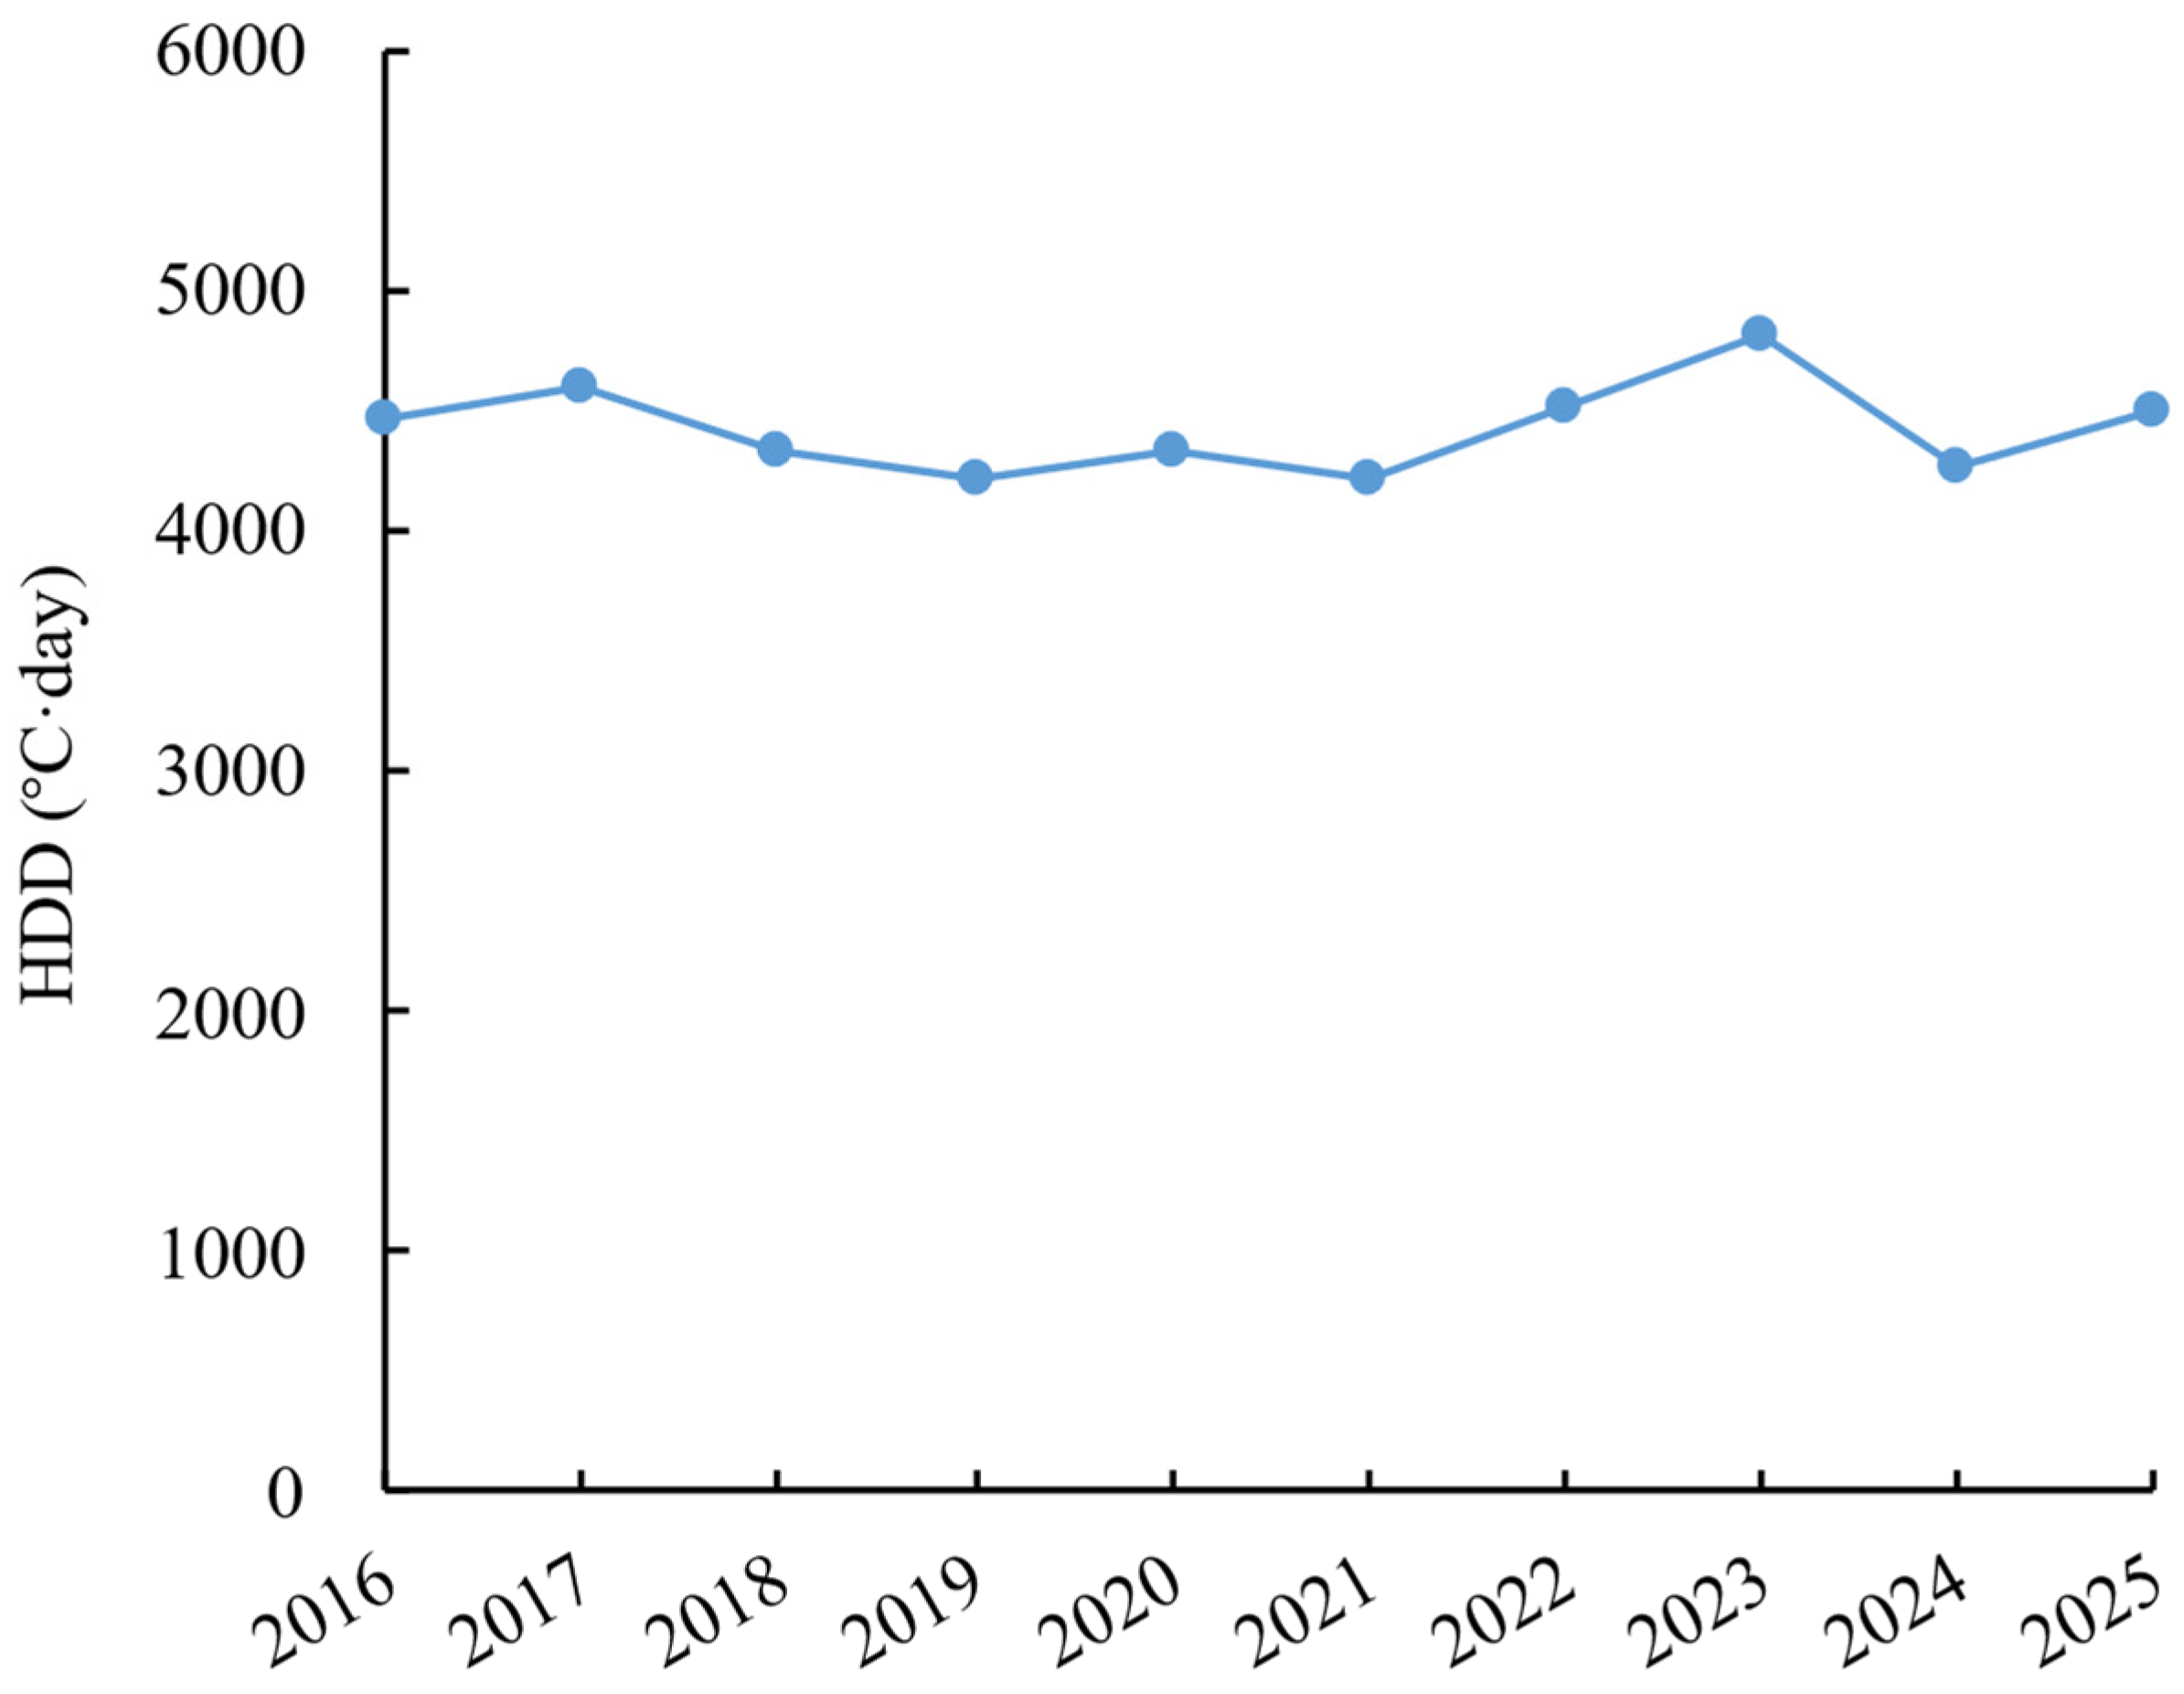
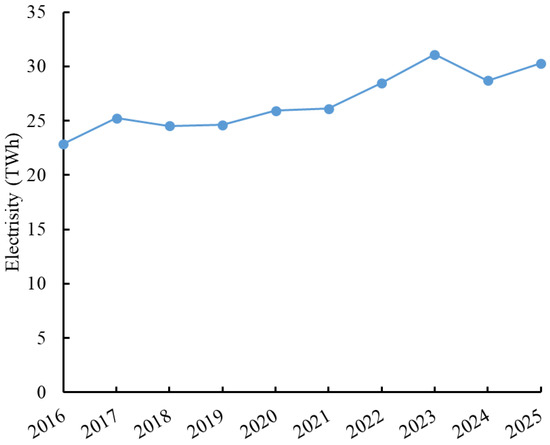
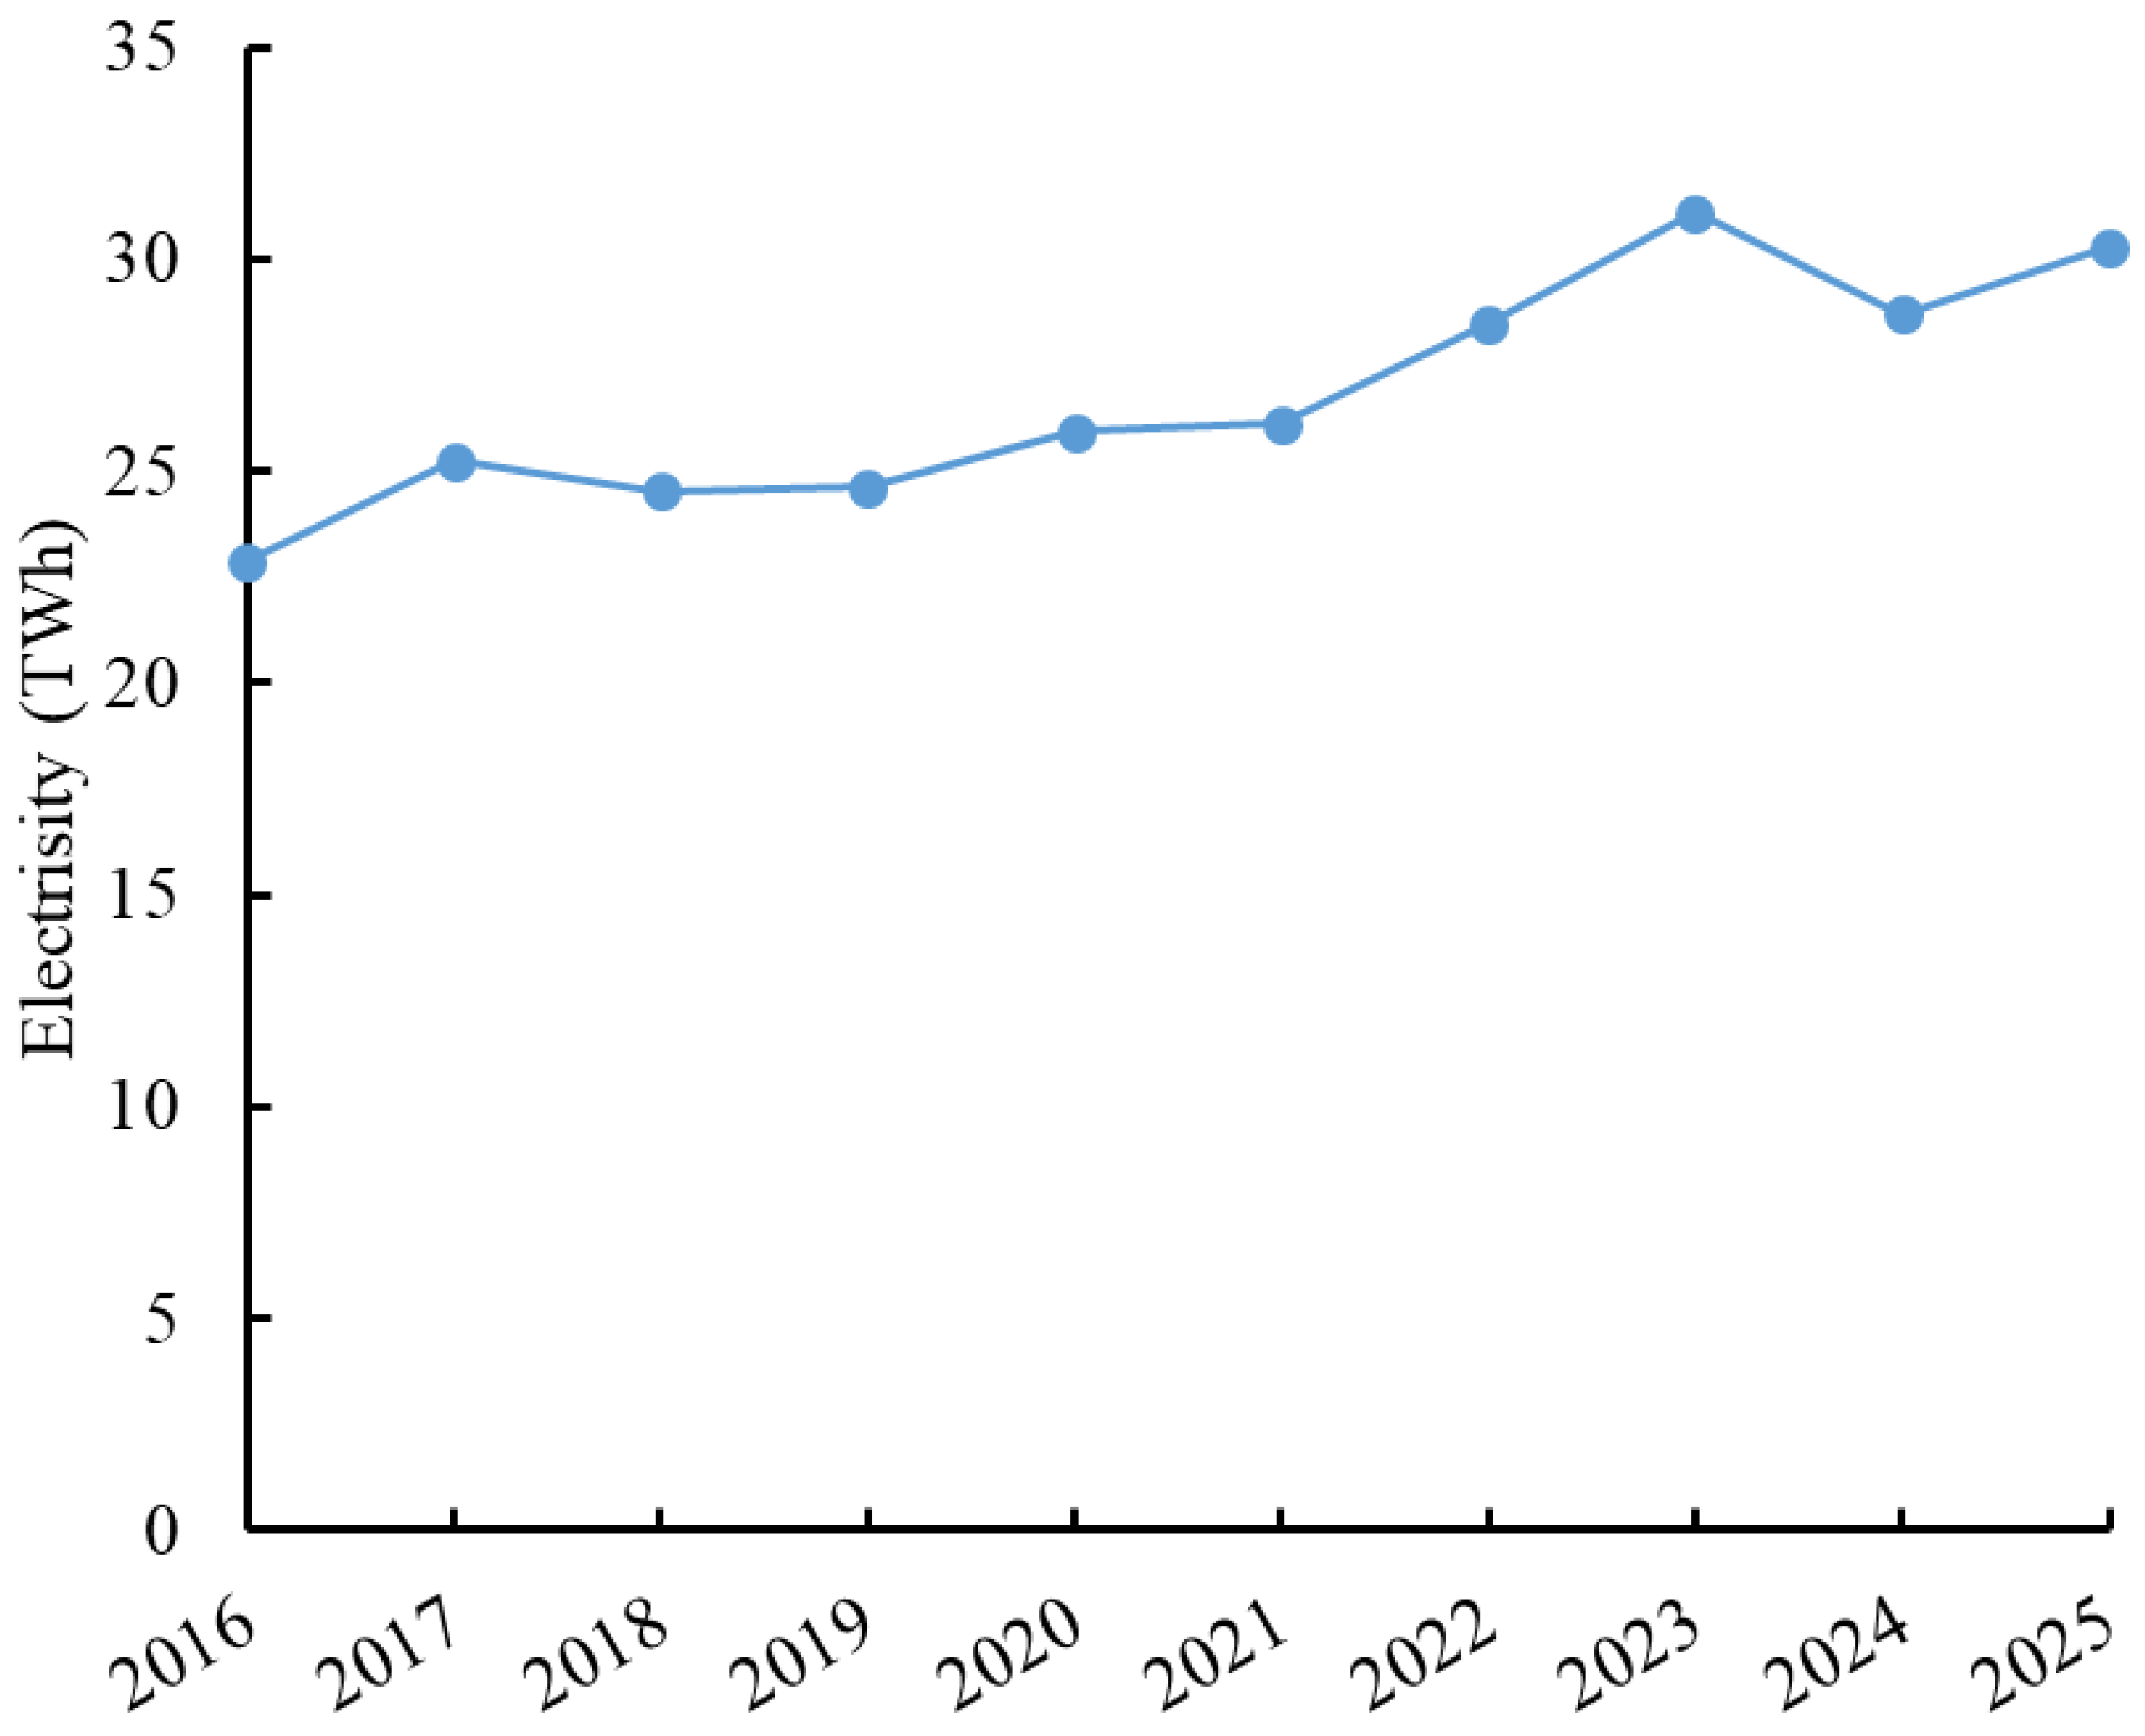
Cold-season HDD values within built-up area showed relatively limited interannual variability during 2016–2025 (Figure 7). In contrast, cold-season electricity-equivalent heating demand of built-up area increased substantially with the expansion of built-up areas during 2016–2025 (Figure 8), increasing from approximately 23 TWh in 2016 to 30 TWh in 2025.
Figure 7.
Cold season HDD (heating degree days) within built-up areas from 2016 to 2025.
Figure 8.
Electricity-equivalent heating demand during the cold season from 2016 to 2025. The cold season was defined as November of each year to March of the following year.
3.3. Theoretical Urban-Scale Solar PV Potential and Electricity Demand
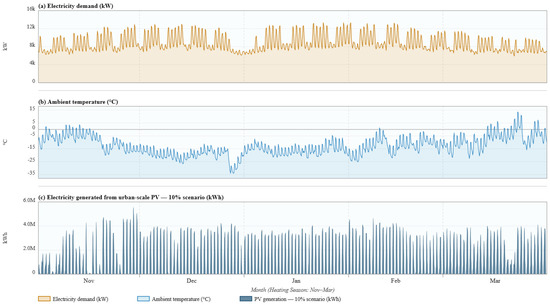
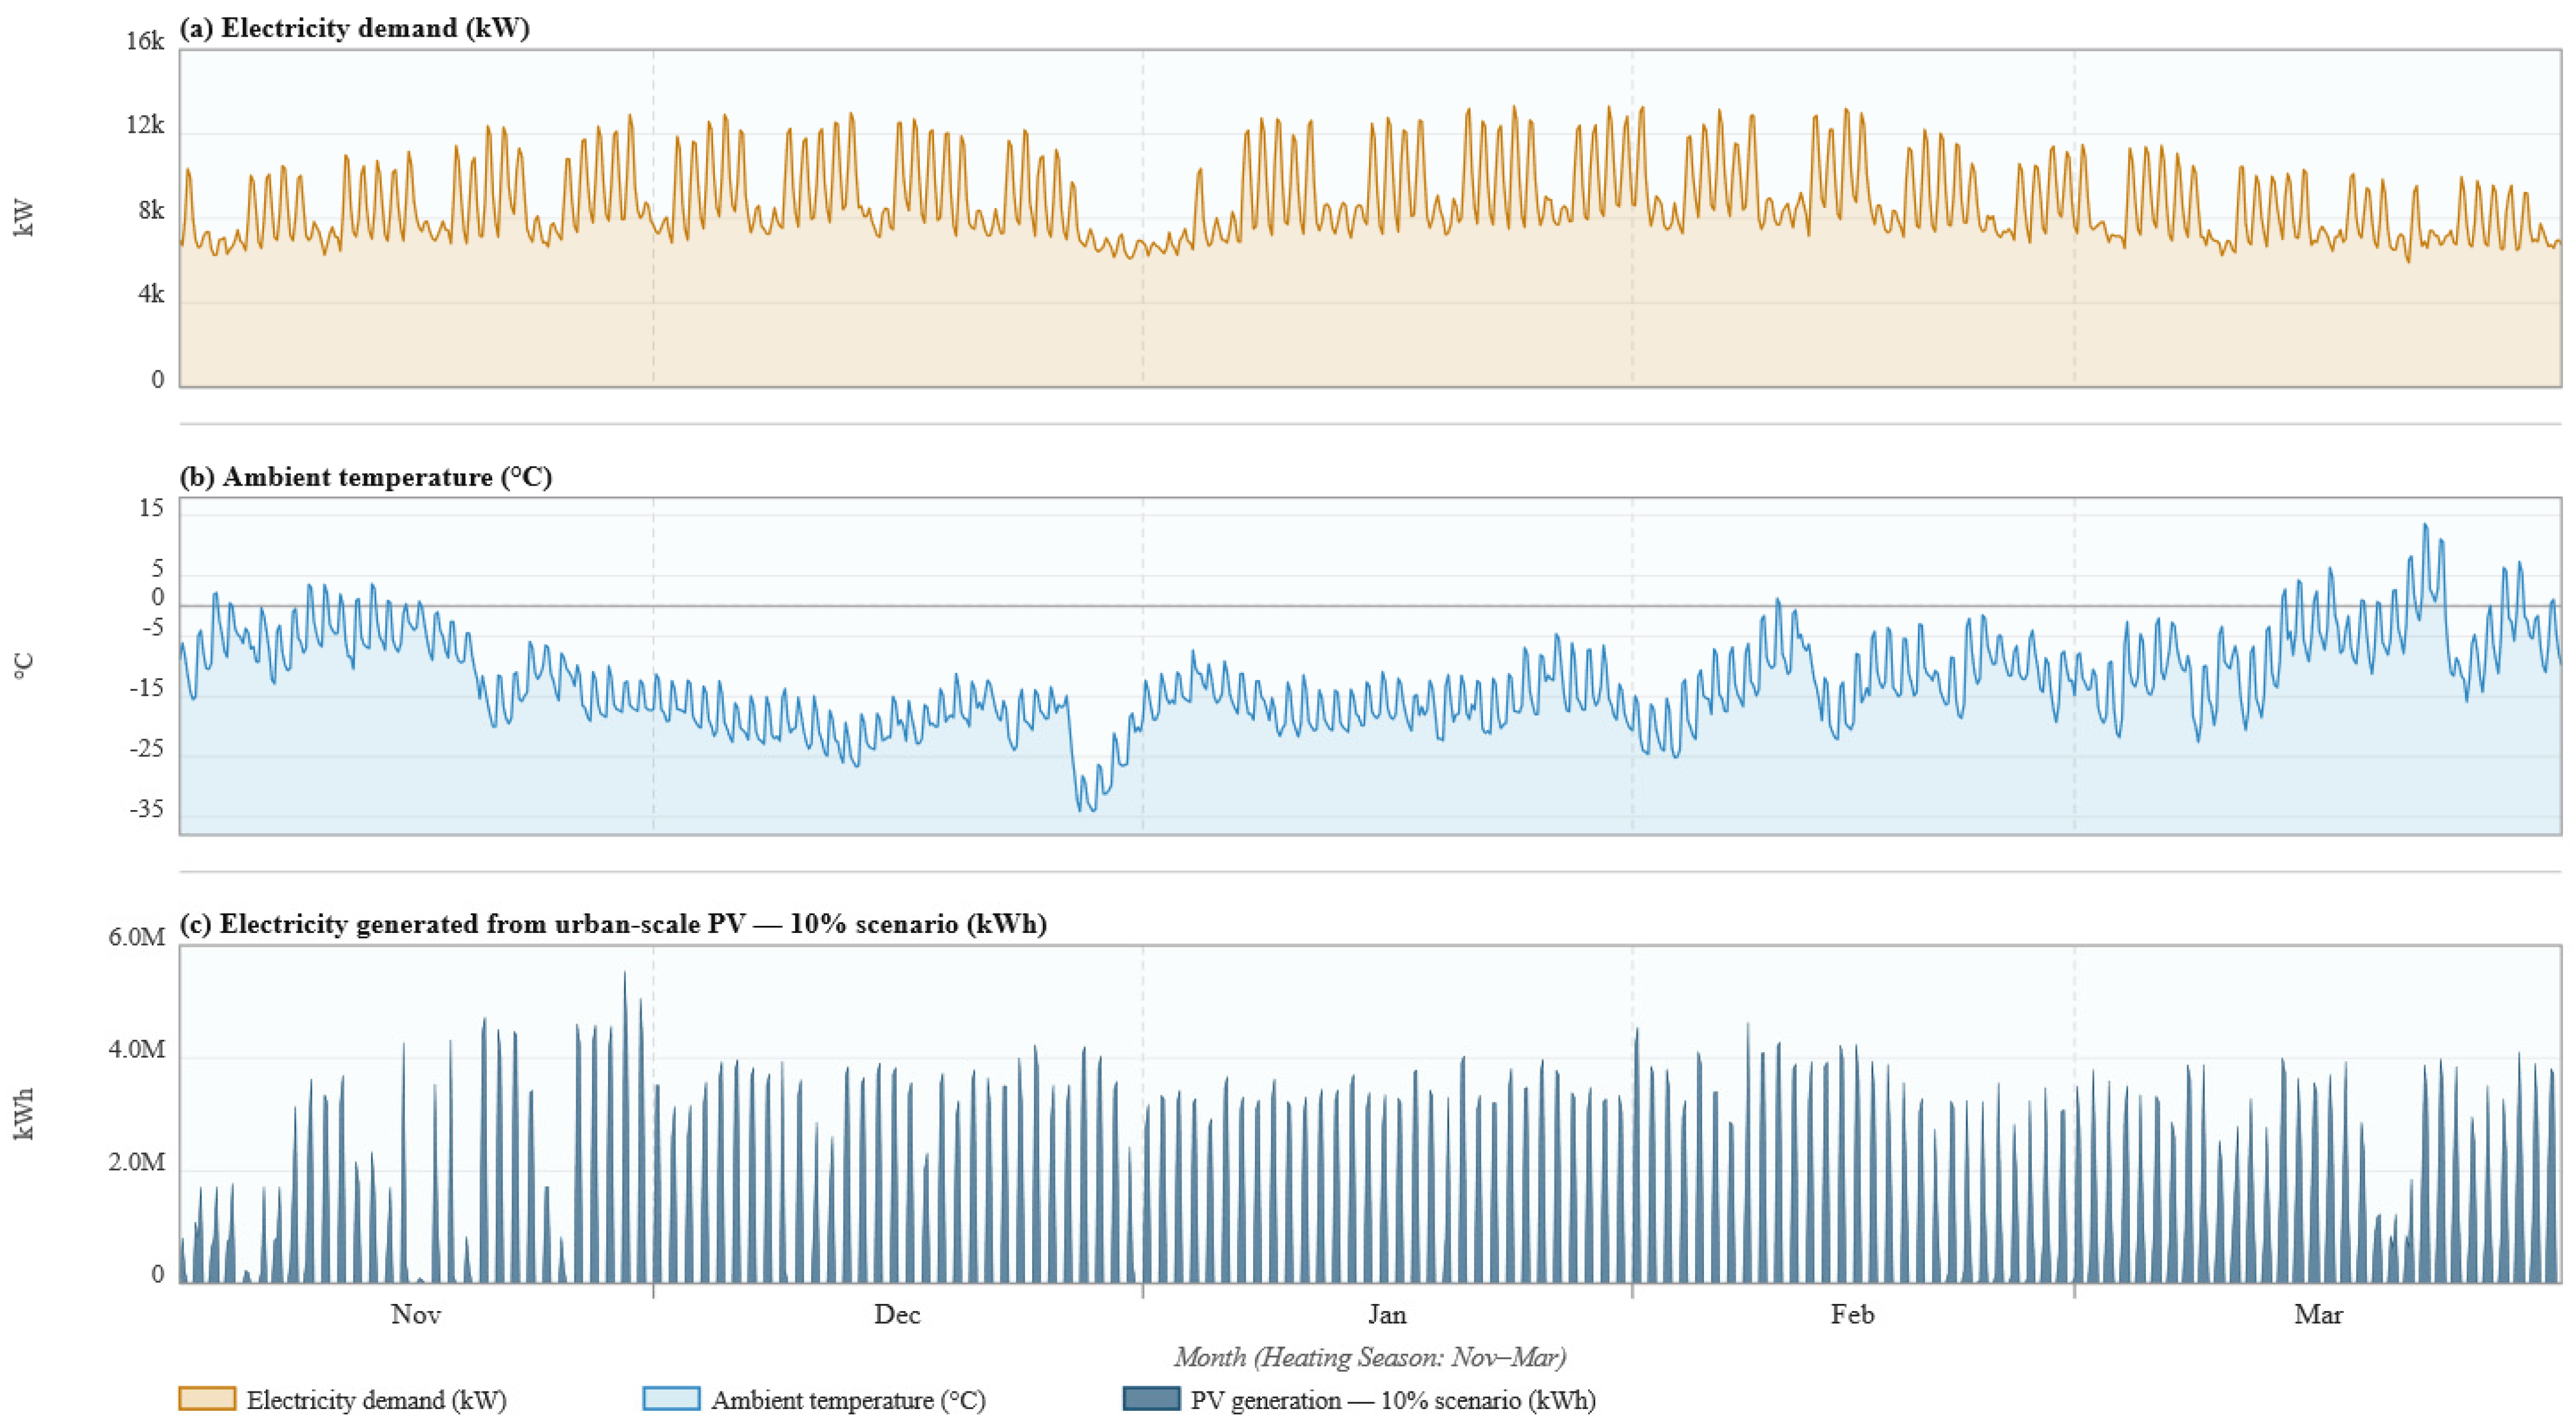
The total built-up area of Ulaanbaatar in 2025 was estimated to be 310.58 km2, serving as the spatial foundation for the four urban-scale PV deployment scenarios (2.5%, 5%, 10%, and 20%), corresponding to PV capacities of 1.11, 2.22, 4.44, and 8.89 GW, respectively. The hourly electricity demand and ambient temperature profiles reconstructed through SAM are presented in Figure 9, alongside the PV generation profile for the 10% main scenario. These profiles establish the environmental-energy context for the heating season analysis that follows.
Figure 9.
Hourly profiles of (a) electricity load (kW), (b) ambient temperature (°C), and (c) rooftop PV generation (kWh) for Ulaanbaatar over a representative year (November to March). Electricity demand is derived from government monthly consumption statistics disaggregated using SAM Building Energy Load Profile Estimator. Temperature corresponds to the PVGIS typical meteorological year (TMY) weather file. PV generation corresponds to Scenario when PV capacity of 10% is utilized.
The electricity load profile (Figure 9a) reflects the city’s strong thermal seasonality. The heating season electricity consumption of Ulaanbaatar was 0.968 TWh, with electricity load consistently elevated during the cold season. Mean hourly loads are highest in February (9251 kW) and January (9107 kW), with December also elevated at 8911 kW. The seasonal minimum occurs in May (7425 kW mean). The ambient temperature profile confirms Ulaanbaatar’s extreme continental climate, with December being the coldest month, with a minimum temperature of −34.1 °C and a mean temperature of −19.9 °C. January and February follow closely, with minima of −22.3 °C and −25.3 °C, respectively. Summer temperatures reach a maximum of 33.8 °C in July, producing an annual thermal amplitude of approximately 68 °C. Mean monthly temperatures remain negative from October (−1.7 °C mean) through March (−6.9 °C mean), with the five coldest months, November through March, defining the heating season during which coal combustion in combined heat and power (CHP) plants and ger district stoves is at its peak. The PV generation profile (Figure 9c), shown for the 10% main scenario (4.44 GW), reveals a seasonality specific to Ulaanbaatar’s cold, clear-sky climate. Generation is highest in January–March (807–855 GWh/month), benefiting from abundant clear-sky days and high surface albedo from snow cover despite low sun angles. A secondary elevated period occurs in November–December (605–771 GWh/month) as the heating season begins and skies remain clear.
The critical observation from these three profiles is that PV generation is not weakest when heating demand is highest. The November–March heating season coincides with moderate-to-strong PV generation (605–855 GWh/month at 10% deployment). This means that surplus PV electricity, generation exceeding the city’s own electricity demand, occurs during the period of greatest coal dependence, creating a physical basis for PV to contribute indirectly to coal displacement. The heating season PV generation at 10% deployment is 3.454 TWh, approximately 3.6 times the city’s cold season electricity consumption of 0.968 TWh, meaning that surplus electricity above city demand exists during the heating season and could theoretically be directed toward displacing coal-based heating energy.
3.4. Urban-Scale PV Scenario Analysis
3.4.1. Coal Baseline and the Heating Season Framework
To evaluate urban-scale PV potential within Ulaanbaatar’s actual energy context, it is necessary to establish the dominant baseline energy burden. Ulaanbaatar’s heating system relies overwhelmingly on coal combustion through its CHP plants and ger district stoves. Coal-based heating energy during the 120-day heating season (November–March) was estimated at 28.69 TWh, with associated CO2 emissions of 10.34 MtCO2/year, accounting for 91.1% of the city’s total energy-related CO2 emissions. Heating season coal expenditure is estimated at USD 424.24 million [29].
By comparison, the city’s heating season electricity consumption is 0.968 TWh, with CO2 emissions of 1.01 MtCO2/year and electricity expense of USD 67.76 million. The combined baseline energy expenditure is therefore approximately USD 492.00 million/year. The scale asymmetry between these two figures, coal heating at 28.69 TWh versus electricity at 0.968 TWh, a ratio of approximately 30:1, establishes coal heating as the dominant environmental-energy problem in Ulaanbaatar, and the primary benchmark against which PV-generated surplus electricity is evaluated. The analysis examines four urban-scale PV deployment scenarios (2.5%, 5%, 10%, and 20% of total built-up area), each assessed under two policy conditions, with the current FIT of 0.15 USD/kWh and without FIT, during the heating season. The scenarios correspond to PV capacities of 1.11, 2.22, 4.44, and 8.89 GW, respectively, out of a theoretical maximum of 44.45 GW.
3.4.2. PV Generation and Surplus Electricity Potential
A central question of this analysis is whether surplus PV generation, electricity produced in excess of the city’s own demand, could theoretically offset a portion of Ulaanbaatar’s coal heating energy burden. Heating season PV generation, hourly matched surplus electricity, and implied coal offset potential across the four scenarios are summarized in Table 2. Because surplus was determined by hour-by-hour matching rather than by subtracting season totals, a scenario may yield usable surplus during high-generation hours even when its heating-season net balance is negative.
Table 2.
Urban-scale PV generation and coal heating offset potential across four deployment scenarios.
The 2.5% scenario (1.11 GW) generates 0.864 TWh over the heating season, below the city’s heating-season electricity demand of 0.968 TWh, giving a net balance of −0.104 TWh. Hour-by-hour matching nonetheless identifies 0.554 TWh of coincident surplus arising during daylight hours when generation exceeds instantaneous demand, sufficient to offset 1.9% of coal heating energy and avoid 0.199 MtCO2/year. At 5% deployment (2.22 GW), generation reaches 1.727 TWh with 1.407 TWh of coincident surplus, offsetting 4.9% of coal heating energy and avoiding 0.506 MtCO2/year. The 10% main scenario (4.44 GW) generates 3.454 TWh with 3.131 TWh of surplus, offsetting 10.9% of coal heating energy and avoiding 1.126 MtCO2/year. At the maximum deployment of 20% (8.89 GW), generation reaches 6.908 TWh with 6.594 TWh of surplus, representing a potential coal offset of 23.0% and 2.374 MtCO2/year in avoided emissions.
These results demonstrate that, even at the largest scenario analyzed, rooftop PV surplus can offset less than one quarter of Ulaanbaatar’s coal heating energy under direct electric substitution, underscoring that the scale of the coal heating burden (28.69 TWh) fundamentally exceeds what urban PV deployment can address through electricity generation alone.
3.4.3. Techno-Economic Assessment
The economic viability of each scenario differs substantially between the FIT and no-FIT conditions, as summarized in Table 3. Under the FIT (0.15 USD/kWh), all four scenarios are economically viable with strongly positive NPVs and short payback periods of 2.1–2.5 years (simple) and 2.1–2.6 years (discounted). NPV scales approximately linearly with PV capacity, from USD 3.31 billion at 2.5% to USD 33.06 billion at 20%, driven by the FIT rate being 2.14 times the retail electricity tariff of 0.07 USD/kWh. Capital costs range from USD 589 million (2.5%) to USD 4712 million (20%). The heating-season annualized NPV contribution ranges from USD 43.5 million (2.5%) to USD 434.8 million (20%), reflecting the disproportionate financial value of the FIT export premium concentrated in the heating season when PV generation remains strong. Without FIT, the economic picture is fundamentally different. Only the 2.5% scenario achieves a positive NPV, USD 79 million over the 25-year project period, with a simple payback of 15.3 years and a discounted payback of 20.0 years. This places the 2.5% scenario at the margin of financial viability under the current tariff structure, with the discounted payback approaching the 25-year system lifetime and the heating-season annualized NPV contribution of only USD 1.0 million. All larger scenarios (5%, 10%, 20%) produce negative NPVs without FIT support which are −USD 624 million, −USD 2,110 million, and −USD 5,142 million respectively, confirming that the retail tariff of 0.07 USD/kWh alone is insufficient to justify urban-scale PV deployment beyond approximately 1.1 GW in Ulaanbaatar.
Table 3.
Techno-economic results for four urban-scale PV scenarios under FIT and no-FIT conditions.
This creates a critical policy dilemma that connects the economic and environmental dimensions of the analysis. The 2.5% scenario is the only deployment level financially self-sustaining without FIT policy support. Although it has a negative heating-season net electricity balance of −0.104 TWh, hourly matching identifies 0.554 TWh of positive daytime surplus that could theoretically contribute to coal-heating displacement. However, the larger scenarios provide substantially greater displacement potential and remain dependent on FIT support for economic viability. The implication is that coal displacement through urban PV in Ulaanbaatar is structurally dependent on policy intervention; it cannot emerge from market forces alone under current tariff conditions.
4. Discussion
This study analyzed the spatiotemporal expansion of built-up area and heating demand change in Ulaanbaatar from 2016 to 2025 using remote sensing datasets within the Google Earth Engine platform. In addition, solar radiation potential was evaluated to assess the potential contribution of renewable energy to future urban development. The results showed continuous expansion of built-up area during the study period, accompanied by increasing nighttime light intensity and increasing electricity-equivalent heating demand. Furthermore, the hourly matching analysis showed that the 10% main scenario generated 3.131 TWh of positive surplus during the heating season. This surplus could theoretically offset 10.9% of coal-heating energy and avoid 1.126 MtCO2 yr−1 under resistance heating. Under the heat-pump scenario with COP = 1.86, the corresponding values increased to 20.3% and 2.094 MtCO2 yr−1.
4.1. Urban Expansion and Energy-Related Indicators
Although annual growth rates varied across years, the built-up area showed continuous expansion from 2016 to 2025, which is consistent with previous studies [33,34]. This indicates that urban development in Ulaanbaatar remained active throughout the study period, providing a basis for subsequent increases in human activity intensity and potential heating demand. Spatially, surrounding mountainous terrain constrained the direction of urban growth. This may be because the urban fringe of Ulaanbaatar is largely occupied by ger areas [35], which are commonly distributed in relatively flat and low-relief peripheral areas.
Nighttime light data are closely associated with urbanization processes, population concentration, and anthropogenic activities [17,18]. Nighttime light intensity showed that newly developed built-up areas consistently exhibited higher nighttime-light intensity during the expansion year than in the preceding year, while the spatial distribution of nighttime-light enhancement broadly corresponded to the pattern of built-up expansion. These results suggest that urban expansion in Ulaanbaatar was accompanied by intensified human activity rather than inactive land conversion, supporting the analysis of expansion-driven heating demand.
Although many previous studies have reported decreasing heating demand under global warming conditions [7], cold season HDD values in built-up area remained relatively stable during the study period. Electricity-equivalent heating demand increased continuously from 2016 to 2025 due to the expansion of built-up area, indicating that urban expansion may increase city-scale heating demand. The results suggest that, under the adopted assumptions, modeled heating demand may continue to increase as urban areas expand, even under warming climatic conditions.
4.2. Urban-Scale PV and Coal Displacement: The Potential and Structural Limits
The results demonstrate that urban-scale PV holds real but structurally bounded potential for contributing to Ulaanbaatar’s coal heating problem. The fundamental challenge is one of scale: coal-based heating consumes 28.69 TWh over heating season, approximately 30 times the city’s annual electricity consumption of 0.968 TWh. Even the most optimistic scenario analyzed, 20% of built-up area (8.89 GW), generates 6.908 TWh over the heating season, of which surplus of 6.594 TWh is coincident surplus above hourly electricity demand. This surplus could theoretically offset 23% of coal heating energy and avoid 2.374 MtCO2/year, which is more than twice the city’s entire electricity-sector CO2 baseline of 1.01 MtCO2. While this represents a meaningful environmental contribution, it also illustrates that PV generation alone cannot address the dominant coal heating burden without fundamental transformation of the heating system itself.
These findings differ in character from comparable studies in lower-latitude cities. In Bangkok, rooftop PV integrated with EVs achieved CO2 emission reductions of up to 73% from electricity and vehicle usage [23,25]. The contrast is not simply one of solar resource quality; Ulaanbaatar’s clear-sky winter climate actually produces moderate PV generation during the heating season (605–855 GWh/month at 10% deployment), but of the energy system structure. In Bangkok, electricity is the primary energy vector, and PV can directly substitute for it. In Ulaanbaatar, the dominant energy burden is thermal, delivered through coal combustion in CHP plants and ger district stoves, and electricity-based PV can only reach it indirectly through surplus generation. This distinction has important implications for how remote-sensing-based urban PV assessments should be framed for cold-climate cities: the relevant benchmark is not electricity decarbonization but coal displacement, and the relevant spatial data are not just rooftop area, but the full built-up area exposed to extreme HDD. A further structural constraint is that self-sufficiency remains low across all scenarios, ranging from only 23.7% to 27.7%, despite very large differences in installed capacity (1.11 to 8.89 GW). This ceiling reflects that scaling PV capacity alone cannot resolve the supply-demand timing problem.
The offset ratios reported in Table 2 assume direct one-to-one conversion of surplus electricity to heat (COP = 1), consistent with the electricity-equivalent basis used to define coal-based heating demand (Section 2.4). This is a conservative assumption: if surplus PV electricity were instead directed through heat pumps rather than resistance heaters, a larger share of coal heating could be displaced from the same surplus generation. Field measurements of two-stage air-to-air heat pumps piloted in Ulaanbaatar itself found an average COP of 1.86 even on the coldest days, when temperatures fell to −39 °C [34], meaningfully higher than the COP = 1 resistance-heating baseline, despite being measured under near-worst-case winter conditions. Applying this factor to the hourly matched surplus values in Table 2 nearly doubles the effective coal-displacement potential at each deployment scenario: from 1.9% to 3.6% at 2.5% PV deployment, 4.9% to 9.1% at 5%, 10.9% to 20.3% at 10%, and 23.0% to 42.7% at the maximum 20% scenario. This distinction matters for policy design: the technology used to convert surplus electricity into heat is as consequential as the scale of PV deployment itself, and a coal-to-electric heating transition that pairs PV expansion with heat-pump adoption, rather than resistance heating or unmanaged grid export, would substantially increase the realizable coal-displacement benefit without requiring additional PV capacity. It should be noted that 1.86 reflects performance under the coldest observed conditions. COP typically improves on milder heating-season days. Therefore, this figure likely understates average season performance, and the offset gains above should be read as conservative.
4.3. Incentive Design and Fiscal Sustainability
4.3.1. The Structural–Fiscal Imbalance
The current FIT rate for solar PV in Mongolia (0.15 USD/kWh) is approximately 2.14 times the weighted retail electricity tariff (0.07 USD/kWh). This premium is clearly effective at stimulating adoption. Under FIT, all four scenarios achieve strongly positive NPVs with payback periods of only 2.1–2.6 years, and NPV scales from USD 3.31 billion (2.5%) to USD 33.06 billion (20%). However, the same mechanism that makes PV financially attractive for individuals creates a structural fiscal problem for the government as the grid off taker. At the 20% scenario, the coincident surplus of 6.594 TWh exported to the grid at the FIT premium above the retail tariff implies an annual government subsidy obligation of approximately USD 0.53 billion per year. The self-consumption rate of only 3.9% at this scale illustrates that the system operates almost entirely as a grid export mechanism rather than a local energy solution, with urban PV adopters effectively monetizing the FIT premium rather than reducing their own heating costs.
4.3.2. Mongolia’s Utility-Scale Experience
The fiscal risk identified here at the rooftop scale is not without historical precedent in Mongolia itself. At the utility scale, Mongolia’s original solar FIT of USD 0.15–0.18/kWh, established under the 2007 Renewable Energy Law and amended in 2015, similarly incentivized investment so aggressively that it led to capacity oversubscription [34]. As global solar prices fell sharply, reaching an estimated benchmark of USD 0.06–0.08/kWh by 2018, the contracted FIT rates became increasingly misaligned with market realities. In 2019, the government abandoned the high FIT structure and capped the rate at USD 0.08/kWh [36]. The present study suggests that analogous dynamics may emerge at the rooftop scale if the current FIT of 0.15 USD/kWh is applied without capacity constraints. The parallel is notable: in both cases, a well-intentioned incentive designed to overcome the high upfront cost barrier of solar PV risks generating fiscal overexposure once adoption accelerates beyond projections.
4.3.3. Toward a Quota-Based or Degressive FIT Mechanism
The contrast between the two scenarios analyzed in this study effectively brackets the policy design problem. Without FIT, the discounted payback period of 20 years approaches the 25-year project lifetime, rendering rooftop PV economically unattractive for most households and businesses. With FIT at 0.15 USD/kWh, the payback shortens dramatically to 2.6 years but creates unsustainable fiscal exposure. The socially optimal FIT therefore lies somewhere between these bounds, sufficiently above the retail tariff to generate a positive NPV and a payback period acceptable to investors, but low enough to prevent runaway over-generation and government subsidy burden.
Based on these findings, we suggest that the Mongolian government consider a quota-based or degressive FIT mechanism, under which the premium rate applies only up to a defined installed capacity cap, after which the rate steps down progressively or reverts to net metering at the retail tariff. This approach, which has been successfully deployed in Japan, South Korea, and Thailand [23,25], balances adoption incentives with long-term fiscal sustainability. In practice, the current FIT scheme in Ulaanbaatar may already function implicitly as a first-come, first-served quota, given that the government’s fiscal capacity to sustain purchases at 0.15 USD/kWh across the full rooftop area (33.81 GW, USD 45.64 billion capital cost) is limited. Making such a cap explicit and transparent would provide greater certainty for investors and city planners alike, enabling more orderly deployment of rooftop PV capacity.
4.4. Grid Absorption Capacity and Infrastructure Requirements
Even at the 10% main scenario, annual PV generation of 3.454 TWh is approximately 3.6 times the city’s electricity demand. At 20%, this ratio rises to 7.1 times. While surplus generation is financially profitable for urban PV adopters under the current FIT, it raises serious questions about the physical capacity of Mongolia’s existing power grid to absorb such volumes of distributed generation. Mongolia’s Central Energy System (CES), which supplies Ulaanbaatar, currently relies predominantly on coal-fired CHP plants with limited grid flexibility and balancing infrastructure [18]. High penetration of variable urban PV would introduce significant challenges for grid frequency regulation, voltage stability, and dispatch management, particularly during spring months when generation peaks coincide with the lowest demand periods.
Furthermore, Mongolia currently imports a portion of its electricity from Russia and China during peak winter demand [37]. The paradox of a city potentially exporting several times its own electricity demand through summer PV while still importing electricity in winter underscores the inadequacy of generation capacity alone as a metric for energy security in cold-climate contexts. Realizing the full environmental benefit of urban PV in Ulaanbaatar will therefore require parallel investments in grid modernization, smart metering, demand-side management, and cross-seasonal storage, commitments that extend well beyond the scope of FIT policy alone.
4.5. Limitations of This Study
Several limitations of this study should be acknowledged. First, the heating demand analysis was based on simplified HDD-derived electricity-equivalent estimates rather than detailed building-level energy consumption data. Although this approach is suitable for evaluating long-term urban-scale trends, actual heating demand may vary depending on building characteristics, insulation conditions, and heating technologies. Second, the techno-economic assessment adopted generalized PV system cost assumptions because Mongolia-specific rooftop PV installation cost data remain limited. Third, the analysis assumed static electricity tariffs and feed-in tariff (FIT) rates throughout the project lifetime, whereas future policy adjustments may affect economic performance. Finally, grid absorption capacity, storage systems, and curtailment risks were not explicitly modeled. Future studies integrating detailed energy system modeling and socioeconomic datasets would further improve understanding of renewable energy transition potential in rapidly expanding cold-climate cities.
5. Conclusions
Built-up area in Ulaanbaatar continuously expanded from 2016 to 2025, resulting in increasing heating demand under the adopted assumptions. The solar energy analysis revealed that Ulaanbaatar’s climate supports moderate to strong PV generation throughout the heating season. At the 20% deployment level, hourly matched positive surplus could theoretically offset 23.0% of coal-heating energy through resistance heating and 42.7% through heat pumps with COP = 1.86. Although the economically self-sustaining 2.5% scenario retained a negative net electricity balance over the heating season, it still generated positive daytime surplus that could contribute to limited coal displacement, revealing that environmental outcomes are structurally dependent on policy design. A quota-based or degressive FIT mechanism is recommended to balance deployment incentives with fiscal sustainability.
Supplementary Materials
The following supporting information can be downloaded at https://www.mdpi.com/article/10.3390/rs18162675/s1, Table S1. Parameter ranges used for electricity-equivalent heating demand estimation; Table S2. Sensitivity of the estimated built-up area to different minimum patch sizes.; Table S3. Sensitivity of the estimated built-up area to different buffer distances; Table S4. Electricity Demand and Tariffs; Table S5. PV system parameters. Table S6. Emissions parameters; Figure S1. Relationship between rooftop PV deployment capacity and net present value (NPV) under two policy scenarios. (a) Scenario A without feed-in tariff, where NPV is positive only at very small PV capacity and becomes negative as capacity increases. (b) Scenario B with a feed-in tariff of 0.15 USD/kWh, where NPV increases monotonically with PV capacity and reaches its maximum at full rooftop deployment. The contrasting trends indicate that, without FIT, rooftop PV is financially limited to small-scale self-consumption, whereas FIT strongly incentivizes maximum capacity installation and grid export; Code S1. Annual built-up area, nighttime light, and heating degree day analysis; Code S2. Estimation of rooftop solar radiation within annual built-up areas; Code S3. Dynamic World built-up classification accuracy assessment; Code S4. Sensitivity analysis of built-up area extraction parameters; Code S5. Patch-distance analysis for buffer-distance selection in built-up area refinement; Code S6. Nighttime light analysis for newly expanded built-up areas; Code S7. Generation of VIIRS nighttime light maps within the 2025 built-up area.
Author Contributions
Conceptualization, R.Y. and R.T.; methodology, R.Y. and T.J.; software, R.Y., T.J. and M.Y.; validation, R.Y. and T.J.; formal analysis, R.Y. and T.J.; investigation, R.Y. and T.J.; resources, R.Y., T.J. and Y.Y.; data curation, R.Y., T.J., Y.Y., M.Y. and Q.R.; writing—original draft preparation, R.Y. and T.J.; writing—review and editing, R.T.; visualization, R.Y. and T.J.; supervision, R.T.; project administration, R.T. All authors have read and agreed to the published version of the manuscript.
Funding
This research received no external funding.
Data Availability Statement
The datasets analyzed during this study were obtained from publicly available sources through the Google Earth Engine platform (https://earthengine.google.com/) (Last accessed on 3 August 2026). The derived datasets and the code used for data processing and analysis are available from the corresponding author upon reasonable request.
Acknowledgments
During the preparation of this study, the authors used ChatGPT (OpenAI, GPT-5 series) to assist with programming tasks, including the development and debugging of code for data processing. The authors reviewed, verified, and refined all generated codes and took full responsibility for the accuracy, integrity, and content of this publication.
Conflicts of Interest
The authors declare no conflicts of interest.
Abbreviations
| PV | Photovoltaic |
| FIT | Feed-in tariff |
| HDD | Heating degree days |
| SAM | System Advisor Model |
| NPV | Net present value |
| USD | United States Dollar (Currency) |
| MNT | Mongolian Tögrög (Currency) |
| FAR | Floor area ratio |
| HLC | Heat loss coefficient |
| COP | Coefficient of performance |
| CHP | Combined heat and power |
References
- Karthe, D.; Lee, H.; Ganbat, G. Fragmented Infrastructure Systems in Ulaanbaatar, Mongolia: Assessment from an Environmental Resource Nexus and Public Health Perspective. In Urban Infrastructuring: Reconfigurations, Transformations and Sustainability in the Global South; Springer Nature: Singapore, 2022; pp. 15–34. [Google Scholar]
- Nakao, M.; Yamauchi, K.; Ishihara, Y.; Omori, H.; Ichinnorov, D.; Solongo, B. Effects of air pollution and seasons on health-related quality of life of Mongolian adults living in Ulaanbaatar: Cross-sectional studies. BMC Public Health 2017, 17, 594. [Google Scholar] [CrossRef] [Scilit] [PubMed]
- Badarch, J.; Harding, J.; Dickinson-Craig, E.; Azen, C.; Ong, H.; Hunter, S.; Pannaraj, P.S.; Szepesi, B.; Sereenendorj, T.; Davaa, S.; et al. Winter air pollution from domestic coal fired heating in Ulaanbaatar, Mongolia, is strongly associated with a major seasonal cyclic decrease in successful fecundity. Int. J. Environ. Res. Public Health 2021, 18, 2750. [Google Scholar] [CrossRef] [Scilit] [PubMed]
- Balgansuren, O.; Arunotai, N. Insights on energy, poverty, and gender nexus in urban ger district households: A case study from Ulaanbaatar, Mongolia. Glob. Transit. 2025, 7, 189–198. [Google Scholar] [CrossRef] [Scilit]
- Batmunkh, T.; Kim, Y.J.; Jung, J.S.; Park, K.; Tumendemberel, B. Chemical characteristics of fine particulate matters measured during severe winter haze events in Ulaanbaatar, Mongolia. J. Air Waste Manag. Assoc. 2013, 63, 659–670. [Google Scholar] [CrossRef] [Scilit] [PubMed]
- Ariunsaikhan, A.; Batbold, C.; Chonokhuu, S.; Gil-Alana, L.A. Atmospheric pollution in Ulaanbaatar: Persistence and long-run trends. PLoS ONE 2025, 20, e0322991. [Google Scholar] [CrossRef] [Scilit] [PubMed]
- Ziemele, J.; Gendelis, S.; Dace, E. Impact of global warming and building renovation on the heat demand and district heating capacity: Case of the city of Riga. Energy 2023, 276, 127567. [Google Scholar] [CrossRef] [Scilit]
- Spinoni, J.; Vogt, J.V.; Barbosa, P.; Dosio, A.; McCormick, N.; Bigano, A.; Füssel, H.-M. Changes of heating and cooling degree-days in Europe from 1981 to 2100. Int. J. Climatol. 2018, 38, e191–e208. [Google Scholar] [CrossRef] [Scilit]
- Zhang, L.; Ma, X.; Zhang, S. District Heating Energy Consumption of the Building Sector in the Jing-Jin-Ji urban Agglomeration: Decomposition and Decoupling Analysis. Sustainability 2020, 12, 2555. [Google Scholar] [CrossRef] [Scilit]
- Korytnyi, L.M.; Bashalkhanova, L.B.; Belozertseva, I.A.; Gagarinova, O.V.; Bogdanov, V.N.; Vorobyov, A.N.; Vorobyov, N.V.; Emelyanova, N.V.; Maksyutova, E.V.; Enkh-Amgalan, S. Geographic conditions of sustainable development of the city of Ulaanbaatar. Geogr. Nat. Resour. 2023, 44, S59–S67. [Google Scholar] [CrossRef] [Scilit]
- Bayandelger, B.-E.; Ueda, Y.; Adiyabat, A. Experimental Investigation and Energy Performance Simulation of Mongolian Ger with ETS Heater and Solar PV in Ulaanbaatar City. Energies 2020, 13, 5840. [Google Scholar] [CrossRef] [Scilit]
- Viana, C.M.; Girão, I.; Rocha, J. Long-term satellite image time-series for land use/land cover change detection using refined open source data in a rural region. Remote Sens. 2019, 11, 1104. [Google Scholar] [CrossRef] [Scilit]
- Decuyper, M.; Chávez, R.O.; Lohbeck, M.; Lastra, J.A.; Tsendbazar, N.; Hackländer, J.; Herold, M.; Vågen, T.-G. Continuous monitoring of forest change dynamics with satellite time series. Remote Sens. Environ. 2022, 269, 112829. [Google Scholar] [CrossRef] [Scilit]
- Li, Z.-L.; Wu, H.; Duan, S.; Zhao, W.; Ren, H.; Liu, X.; Leng, P.; Tang, R.; Ye, X.; Zhu, J.; et al. Satellite remote sensing of global land surface temperature: Definition, methods, products, and applications. Rev. Geophys. 2023, 61, e2022RG000777. [Google Scholar] [CrossRef] [Scilit]
- Ma, T.; Yin, Z.; Zhou, A. Delineating spatial patterns in human settlements using VIIRS nighttime light data: A watershed-based partition approach. Remote Sens. 2018, 10, 465. [Google Scholar] [CrossRef] [Scilit]
- García-Ontiyuelo, M.; Acuña-Alonso, C.; Vasilakos, C.; Álvarez, X. Strategies for detecting land-use change on the River Tea SCI ecological corridor via satellite images. Sci. Total Environ. 2024, 957, 177507. [Google Scholar] [CrossRef] [Scilit] [PubMed]
- Ma, T.; Zhou, C.; Pei, T.; Haynie, S.; Fan, J. Responses of Suomi-NPP VIIRS-derived nighttime lights to socioeconomic activity in China’s cities. Remote Sens. Lett. 2014, 5, 165–174. [Google Scholar] [CrossRef] [Scilit]
- Levin, N.; Zhang, Q. A global analysis of factors controlling VIIRS nighttime light levels from densely populated areas. Remote Sens. Environ. 2017, 190, 366–382. [Google Scholar] [CrossRef] [Scilit]
- Anucharn, T.; Hongpradit, P.; Iamchuen, N.; Puttinaovarat, S. Spatial Analysis of Urban Expansion and Energy Consumption Using Nighttime Light Data: A Comparative Study of Google Earth Engine and Traditional Methods for Improved Living Spaces. ISPRS Int. J. Geo-Inf. 2025, 14, 178. [Google Scholar] [CrossRef] [Scilit]
- Farzaneh, H.; Dashti, M.; Zusman, E.; Lee, S.-Y.; Dagvadorj, D.; Nie, Z. Assessing the environmental-health-economic co-benefits from solar electricity and thermal heating in Ulaanbaatar, Mongolia. Int. J. Environ. Res. Public Health 2022, 19, 6931. [Google Scholar] [CrossRef] [Scilit] [PubMed]
- Nergui, O.; Park, S.; Cho, K.-W. Comparative Policy Analysis of Renewable Energy Expansion in Mongolia and Other Relevant Countries. Energies 2024, 17, 5131. [Google Scholar] [CrossRef] [Scilit]
- Yao, H.; Zhou, Q. Research status and application of rooftop photovoltaic Generation Systems. Clean. Energy Syst. 2023, 5, 100065. [Google Scholar] [CrossRef] [Scilit]
- Kobashi, T.; Yoshida, T.; Yamagata, Y.; Naito, K.; Pfenninger, S.; Say, K.; Takeda, Y.; Ahl, A.; Yarime, M.; Hara, K. On the potential of “Photovoltaics + Electric vehicles” for deep decarbonization of Kyoto’s power systems: Techno-economic-social considerations. Appl. Energy 2020, 275, 115419. [Google Scholar] [CrossRef] [Scilit]
- Gagnon, P.; Margolis, R.; Melius, J.; Phillips, C.; Elmore, R. Rooftop Solar Photovoltaic Technical Potential in the United States: A Detailed Assessment; National Renewable Energy Lab.: Golden, CO, USA, 2016.
- Jittayasotorn, T.; Sadidah, M.; Yoshida, T.; Kobashi, T. On the adoption of rooftop photovoltaics integrated with electric vehicles toward sustainable Bangkok City, Thailand. Energies 2023, 16, 3011. [Google Scholar] [CrossRef] [Scilit]
- Bódis, K.; Kougias, I.; Jäger-Waldau, A.; Taylor, N.; Szabó, S. A high-resolution geospatial assessment of the rooftop solar photovoltaic potential in the European Union. Renew. Sustain. Energy Rev. 2019, 114, 109309. [Google Scholar] [CrossRef] [Scilit]
- NREL. System Advisor Model; Version 2020.2.29 r3; National Renewable Energy Laboratory: Golden, CO, USA, 2020. Available online: https://sam.nlr.gov/ (accessed on 20 April 2025).
- IEA. World Energy Balances; Licence: Terms of Use for Non-CC Material; IEA: Paris, France, 2026; Available online: https://www.iea.org/data-and-statistics/data-product/world-energy-balances (accessed on 15 May 2026).
- Stryi-Hipp, G.; Triebel, M.-A.; Eggers, J.-B.; Jantsch, M.; Taani, R.; Behrens, J. Energy Master Plan for Ulaanbaatar (Mongolia): Final Report; Implemented by Deutsche Gesellschaft für Internationale Zusammenarbeit (GIZ) GmbH; Fraunhofer Institute for Solar Energy Systems ISE: Freiburg, Germany, 2018. [Google Scholar]
- Energy Regulatory Commission of Mongolia (ERC). Revision of Electricity Tariffs. 15 November 2024. Available online: http://erc.gov.mn/en/news/1033 (accessed on 12 May 2026).
- Lkhamjav, O.; Ganbaatar, U.; Tsai, F. Modeling Long-Term LULC Changes and Future Urban Growth: A Case Study of Ulaanbaatar Using CA-Based Machine Learning. Remote Sens. 2026, 18, 1228. [Google Scholar] [CrossRef] [Scilit]
- Batsuuri, B.; Fürst, C.; Myagmarsuren, B. Estimating the impact of urban planning concepts on reducing the urban sprawl of ulaanbaatar city using certain spatial indicators. Land 2020, 9, 495. [Google Scholar] [CrossRef] [Scilit]
- Yang, J.; Lee, S.; Park, S.; Lee, M.; Cha, M. AI-based Ger detection reveals post-pandemic delay in informal housing progress in Mongolia. npj Urban Sustain. 2025, 5, 78. [Google Scholar] [CrossRef] [Scilit]
- Pillarisetti, A.; Ma, R.; Buyan, M.; Nanzad, B.; Argo, Y.; Yang, X.; Smith, K.R. Advanced household heat pumps for air pollution control: A pilot field study in Ulaanbaatar, the coldest capital city in the world. Environ. Res. 2019, 176, 108381. [Google Scholar] [CrossRef] [Scilit] [PubMed]
- IEA. Mongolia—Renewable Energy Feed-In Tariff. International Energy Agency, Paris. Available online: https://www.iea.org/policies/6469-mongolia-renewable-energy-feed-in-tariff (accessed on 12 May 2026).
- World Bank & ESMAP (Energy Sector Management Assistance Program). Support Mongolia with Solar Energy Price Setting: Final Report; World Bank: Washington, DC, USA, 2018. [Google Scholar]
- JICA. Data Collection Survey for Low Carbonization/de-Carbonization and Stabilization of Power System in Mongolia: Final Report; Tokyo Electric Power Services Co., Ltd.: Tokyo, Japan; Tokyo Electric Power Company Holdings, Inc.: Tokyo, Japan, 2022. [Google Scholar]

Disclaimer/Publisher’s Note: The statements, opinions and data contained in all publications are solely those of the individual author(s) and contributor(s) and not of MDPI and/or the editor(s). MDPI and/or the editor(s) disclaim responsibility for any injury to people or property resulting from any ideas, methods, instructions or products referred to in the content. |
© 2026 by the authors. Licensee MDPI, Basel, Switzerland. This article is an open access article distributed under the terms and conditions of the Creative Commons Attribution (CC BY) license.