Next Issue
Volume 12, June-2
Previous Issue
Volume 12, May-2
 
 
remotesensing-logo

Journal Browser

Journal Browser

Remote Sens., Volume 12, Issue 11 (June-1 2020) – 208 articles

Cover Story (view full-size image): 
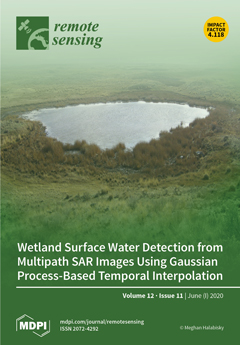
Wetland ecosystem services, such as water storage and food sources, are largely dependent on hydrological dynamics. Constant monitoring of the spatial extent of water surfaces and the duration of flooding of a wetland is necessary to understand the impact of drought on the ecosystem services a wetland provides. Synthetic aperture radar (SAR) has the potential to reveal wetland dynamics. This paper proposes a Gaussian process-based temporal interpolation (GPTI) method that enables the synergistic use of SAR images taken from multiple paths. The proposed model is applied to a series of Sentinel-1 images capturing wetlands in Washington State, USA. Our experimental analysis demonstrates that the multiple path analysis based on the proposed method can extract seasonal changes more accurately than a single path analysis. View this paper
  • Issues are regarded as officially published after their release is announced to the table of contents alert mailing list.
  • You may sign up for e-mail alerts to receive table of contents of newly released issues.
  • PDF is the official format for papers published in both, html and pdf forms. To view the papers in pdf format, click on the "PDF Full-text" link, and use the free Adobe Reader to open them.
Order results
Result details
Section
Select all
Export citation of selected articles as:
10 pages, 2217 KiB  
Letter
Insect Mass Estimation Based on Radar Cross Section Parameters and Support Vector Regression Algorithm
by Cheng Hu, Shaoyang Kong, Rui Wang, Fan Zhang and Lianjun Wang
Remote Sens. 2020, 12(11), 1903; https://doi.org/10.3390/rs12111903 - 11 Jun 2020
Cited by 10 | Viewed by 2399
Abstract
Radar cross section (RCS) parameters of insect targets contain information related to their morphological parameters, which are helpful for the identification of migratory insects. Several morphological parameter estimation methods have been presented. However, most of these estimations are performed based on polynomial fitting [...] Read more.
Radar cross section (RCS) parameters of insect targets contain information related to their morphological parameters, which are helpful for the identification of migratory insects. Several morphological parameter estimation methods have been presented. However, most of these estimations are performed based on polynomial fitting methods, using only one or two parameters, which may limit the estimation accuracy. In this paper, a new insect mass estimation method is proposed based on support vector regression (SVR). Several RCS parameters were extracted for the estimation of insect mass. Support vector regression based on recursive feature elimination (SVRRFE) was used to obtain the optimal feature subset. Specifically, a dataset including 367 specimens was included to evaluate the performance of the proposed method. Fifteen features were extracted and ranked. The optimal feature subset contained six features and the optimal mass estimation accuracy was 78%. Additionally, traditional insect mass estimation methods were analyzed for comparison. The results prove that the proposed method is more effective and accurate for insect mass estimation. It needs to be emphasized that the poor number of experimental insects available may limit the further improvement of estimation accuracy. Full article
(This article belongs to the Section Atmospheric Remote Sensing)
Show Figures

Graphical abstract

13 pages, 6344 KiB  
Letter
Assessing Cloud Segmentation in the Chromacity Diagram of All-Sky Images
by Lukáš Krauz, Petr Janout, Martin Blažek and Petr Páta
Remote Sens. 2020, 12(11), 1902; https://doi.org/10.3390/rs12111902 - 11 Jun 2020
Cited by 8 | Viewed by 3247
Abstract
All-sky imaging systems are currently very popular. They are used in ground-based meteorological stations and as a crucial part of the weather monitors for autonomous robotic telescopes. Data from all-sky imaging cameras provide important information for controlling meteorological stations and telescopes, and they [...] Read more.
All-sky imaging systems are currently very popular. They are used in ground-based meteorological stations and as a crucial part of the weather monitors for autonomous robotic telescopes. Data from all-sky imaging cameras provide important information for controlling meteorological stations and telescopes, and they have specific characteristics different from widely-used imaging systems. A particularly promising and useful application of all-sky cameras is for remote sensing of cloud cover. Post-processing of the image data obtained from all-sky imaging cameras for automatic cloud detection and for cloud classification is a very demanding task. Accurate and rapid cloud detection can provide a good way to forecast weather events such as torrential rainfalls. However, the algorithms that are used must be specifically calibrated on data from the all-sky camera in order to set up an automatic cloud detection system. This paper presents an assessment of a modified k-means++ color-based segmentation algorithm specifically adjusted to the WILLIAM (WIde-field aLL-sky Image Analyzing Monitoring system) ground-based remote all-sky imaging system for cloud detection. The segmentation method is assessed in two different color-spaces (L*a*b and XYZ). Moreover, the proposed algorithm is tested on our public WMD database (WILLIAM Meteo Database) of annotated all-sky image data, which was created specifically for testing purposes. The WMD database is available for public use. In this paper, we present a comparison of selected color-spaces and assess their suitability for the cloud color segmentation based on all-sky images. In addition, we investigate the distribution of the segmented cloud phenomena present on the all-sky images based on the color-spaces channels. In the last part of this work, we propose and discuss the possible exploitation of the color-based k-means++ segmentation method as a preprocessing step towards cloud classification in all-sky images. Full article
(This article belongs to the Special Issue Remote Sensing of Clouds)
Show Figures

Graphical abstract

13 pages, 3315 KiB  
Article
Detecting Long Time Changes in Benthic Macroalgal Cover Using Landsat Image Archive
by Laura Lõugas, Tiit Kutser, Jonne Kotta and Ele Vahtmäe
Remote Sens. 2020, 12(11), 1901; https://doi.org/10.3390/rs12111901 - 11 Jun 2020
Cited by 9 | Viewed by 2390
Abstract
Coastal macroalgae worldwide provide multiple ecological functions and support vital ecosystem services. Thereby, it is important to monitor changes in the extent of benthic macroalgal cover. However, as in situ sampling is costly and time-consuming, areal estimates of macroalgal species cover are often [...] Read more.
Coastal macroalgae worldwide provide multiple ecological functions and support vital ecosystem services. Thereby, it is important to monitor changes in the extent of benthic macroalgal cover. However, as in situ sampling is costly and time-consuming, areal estimates of macroalgal species cover are often based only on a limited number of samples. This low sampling effort likely yields very biased estimates, as macroalgal communities are often characterized by large spatial variability at multiple spatial scales. Moreover, ecological time series are often short-term, making it impossible to assess changes in algal communities over decades and relate this to different human pressures and/or climate change. The Landsat series satellites have operated for 40 years. In the current study, we tested if the Landsat sensors could be used for mapping the cover of shallow water benthic macroalgae. This study was carried out at two sites in the West Estonian Archipelago, in the northeastern Baltic Sea. Our results show that the Landsat imagery accurately reflected both spatial and temporal variability in benthic algal cover. To conclude, the current methodology can be used to improve the existing assessments of areal macroalgal cover, or to estimate the cover values, in areas and times lacking ecological observations. Full article
Show Figures

Figure 1

18 pages, 6375 KiB  
Article
Investigating Lunar Boulders at the Apollo 17 Landing Site Using Photogrammetry and Virtual Reality
by Stéphane Le Mouélic, Pauline Enguehard, Harrison H. Schmitt, Gwénaël Caravaca, Benoît Seignovert, Nicolas Mangold, Jean-Philippe Combe and François Civet
Remote Sens. 2020, 12(11), 1900; https://doi.org/10.3390/rs12111900 - 11 Jun 2020
Cited by 10 | Viewed by 4544
Abstract
The Taurus-Littrow valley on the Moon was the location of intensive geologic fieldwork during three days in December 1972. In situ activities at sampling stations were systematically documented by the astronauts using a series of overlapping images taken with their Hasselblad cameras. We [...] Read more.
The Taurus-Littrow valley on the Moon was the location of intensive geologic fieldwork during three days in December 1972. In situ activities at sampling stations were systematically documented by the astronauts using a series of overlapping images taken with their Hasselblad cameras. We investigated how this Apollo image archive can be used to perform 3-D reconstructions of several boulders of interest using close-range photogrammetry. We specifically focused on seven different boulders located at Stations 2, 6, and 7, at the foot of South and North Massifs, respectively. These boulders represent samples from highland materials, which rolled down the slopes of the surrounding hills. We used the Agisoft Metashape software to compute 3-D reconstructions of these boulders, using 173 scanned images as input. We then used either a web-based platform or a game engine to render the models in virtual reality. This allowed the users to walk around the boulders and to investigate in detail their morphology, fractures, vesicles, color variations, and sampling spots, as if standing directly in front of them with the astronauts. This work suggests that many features can be reconstructed in other sites of the Apollo missions, so as other robotic landing sites. Virtual reality techniques coupled to photogrammetry is thus opening a new era of exploration, both for past and future landing sites. Full article
Show Figures

Graphical abstract

22 pages, 23122 KiB  
Article
Assessing Forest/Non-Forest Separability Using Sentinel-1 C-Band Synthetic Aperture Radar
by Johannes N. Hansen, Edward T. A. Mitchard and Stuart King
Remote Sens. 2020, 12(11), 1899; https://doi.org/10.3390/rs12111899 - 11 Jun 2020
Cited by 21 | Viewed by 6351
Abstract
Synthetic Aperture Radar has a unique potential for continuous forest mapping as it is not affected by cloud cover. While longer wavelengths, such as L-band, are commonly used for forest applications, in this paper we assess the aptitude of C-band Sentinel-1 data for [...] Read more.
Synthetic Aperture Radar has a unique potential for continuous forest mapping as it is not affected by cloud cover. While longer wavelengths, such as L-band, are commonly used for forest applications, in this paper we assess the aptitude of C-band Sentinel-1 data for this purpose, for which there is much interest due to its high temporal resolution (five days) and “free, full, and open” data policy. We tested its ability to distinguish forest from non-forest in six study sites, located in Alaska, Colombia, Finland, Florida, Indonesia, and the UK. Using the time series for a full year significantly increases the classification accuracy compared to a single scene (a mean of 85 % compared to 77 % across the study sites for the best classifier). Our results show that we can further improve the mean accuracy to 87 % when only considering the annual mean and standard deviation of co-polarized (VV) and cross-polarized (VH) backscatter. In this case, separation accuracies of up to 93 % (in Finland) are possible, though in the worst case (Alaska), the highest possible accuracy using these variables was 80 % . The best overall performance was observed when using a Support Vector Machine classifier, outperforming random forest, k-Nearest-Neighbors, and Quadratic Discriminant Analysis. We further show that the small information content we found in the phase data is an artifact of terrain slope orientation and has a negligible impact on classifier performance. We conclude that for the purposes of forest mapping the smaller file size and easier to process GRD products are sufficient, unless the SLC products are used to compute the temporal coherence which was not tested in this study. Full article
(This article belongs to the Section Forest Remote Sensing)
Show Figures

Graphical abstract

22 pages, 6420 KiB  
Article
Data Reconstruction for Remotely Sensed Chlorophyll-a Concentration in the Ross Sea Using Ensemble-Based Machine Learning
by Jinku Park, Hyun-Cheol Kim, Dukwon Bae and Young-Heon Jo
Remote Sens. 2020, 12(11), 1898; https://doi.org/10.3390/rs12111898 - 11 Jun 2020
Cited by 13 | Viewed by 2959
Abstract
Polar regions are too harsh to be continuously observed using ocean color (OC) sensors because of various limitations due to low solar elevations, ice effects, peculiar phytoplankton photosynthetic parameters, optical complexity of seawater and persistence of clouds and fog. Therefore, the OC data [...] Read more.
Polar regions are too harsh to be continuously observed using ocean color (OC) sensors because of various limitations due to low solar elevations, ice effects, peculiar phytoplankton photosynthetic parameters, optical complexity of seawater and persistence of clouds and fog. Therefore, the OC data undergo a quality-control process, eventually accompanied by considerable data loss. We attempted to reconstruct these missing values for chlorophyll-a concentration (CHL) data using a machine-learning technique based on multiple datasets (satellite and reanalysis datasets) in the Ross Sea, Antarctica. This technique—based on an ensemble tree called random forest (RF)—was used for the reconstruction. The performance of the RF model was robust, and the reconstructed CHL data were consistent with satellite measurements. The reconstructed CHL data allowed a high intrinsic resolution of OC to be used without specific techniques (e.g., spatial average). Therefore, we believe that it is possible to study multiple characteristics of phytoplankton dynamics more quantitatively, such as bloom initiation/termination timings and peaks, as well as the variability in time scales of phytoplankton growth. In addition, because the reconstructed CHL showed relatively higher accuracy than satellite observations compared with the in situ data, our product may enable more accurate planktonic research. Full article
(This article belongs to the Section Ocean Remote Sensing)
Show Figures

Graphical abstract

19 pages, 11611 KiB  
Article
The Estimation of Surface Albedo from DSCOVR EPIC
by Qiuyue Tian, Qiang Liu, Jie Guang, Leiku Yang, Hanwei Zhang, Cheng Fan, Yahui Che and Zhengqiang Li
Remote Sens. 2020, 12(11), 1897; https://doi.org/10.3390/rs12111897 - 11 Jun 2020
Cited by 3 | Viewed by 2846
Abstract
Surface albedo is an important parameter in climate models. The main way to obtain continuous surface albedo for large areas is satellite remote sensing. However, the existing albedo products rarely meet daily-scale requirements, which has a large impact on climate change research and [...] Read more.
Surface albedo is an important parameter in climate models. The main way to obtain continuous surface albedo for large areas is satellite remote sensing. However, the existing albedo products rarely meet daily-scale requirements, which has a large impact on climate change research and rapid dynamic changes of surface analysis. The Earth Polychromatic Imaging Camera (EPIC) on the Deep Space Climate Observatory (DSCOVR) platform, which was launched into the Sun–Earth’s first Lagrange Point (L1) orbit, can provide spectral images of the entire sunlit face of Earth with 10 narrow channels (from 317 to 780 nm). As EPIC can provide high-temporal resolution data, it is beneficial to explore the feasibility of EPIC to estimate high-temporal resolution surface albedo. In this study, hourly surface albedo was calculated based on EPIC observation data. Then, the estimated albedo results were validated by ground-based observations of different land cover types. The results show that the EPIC albedo is basically consistent with the trend of the ground-based observations in the whole time series variation. The diurnal variation of the surface albedo from the hourly EPIC albedo exhibits a “U” shape curve, which has the same trend as the ground-based observations. Therefore, EPIC is helpful to enhance the temporal resolution of surface albedo to diurnal. Surfaces with a three-dimensional structure that casts shadows display the hotspot effect, producing a reflectance peak in the retro-solar direction and lower reflectance at viewing angles away from the solar direction. DSCOVR observes the entire sunlit face of the Earth, which is helpful to make up for the deficiency in the observations of traditional satellites in the hotspot direction in bidirectional reflectance distribution function (BRDF) research, and can help to improve the underestimation of albedo in the direction of hotspot observation. Full article
Show Figures

Graphical abstract

17 pages, 1894 KiB  
Article
Medium-Resolution Multispectral Data from Sentinel-2 to Assess the Damage and the Recovery Time of Late Frost on Vineyards
by Alessia Cogato, Franco Meggio, Cassandra Collins and Francesco Marinello
Remote Sens. 2020, 12(11), 1896; https://doi.org/10.3390/rs12111896 - 11 Jun 2020
Cited by 23 | Viewed by 4110
Abstract
In a climate-change context, the advancement of phenological stages may endanger viticultural areas in the event of a late frost. This study evaluated the potential of satellite-based remote sensing to assess the damage and the recovery time after a late frost event in [...] Read more.
In a climate-change context, the advancement of phenological stages may endanger viticultural areas in the event of a late frost. This study evaluated the potential of satellite-based remote sensing to assess the damage and the recovery time after a late frost event in 2017 in northern Italian vineyards. Several vegetation indices (VIs) normalized on a two-year dataset (2018–2019) were compared over a frost-affected area (F) and a control area (NF) using unpaired two-sample t-test. Furthermore, the must quality data (total acidity, sugar content and pH) of F and NF were analyzed. The VIs most sensitive in the detection of frost damage were Chlorophyll Absorption Ratio Index (CARI), Enhanced Vegetation Index (EVI), and Modified Triangular Vegetation Index 1 (MTVI1) (−5.26%, −16.59%, and −5.77% compared to NF, respectively). The spectral bands Near-Infrared (NIR) and Red Edge 7 were able to identify the frost damage (−16.55 and −16.67% compared to NF, respectively). Moreover, CARI, EVI, MTVI1, NIR, Red Edge 7, the Normalized Difference Vegetation Index (NDVI) and the Modified Simple Ratio (MSR) provided precise information on the full recovery time (+17.7%, +22.42%, +29.67%, +5.89%, +5.91%, +16.48%, and +8.73% compared to NF, respectively) approximately 40 days after the frost event. The must analysis showed that total acidity was higher (+5.98%), and pH was lower (−2.47%) in F compared to NF. These results suggest that medium-resolution multispectral data from Sentinel-2 constellation may represent a cost-effective tool for frost damage assessment and recovery management. Full article
(This article belongs to the Special Issue Remote Sensing in Viticulture)
Show Figures

Graphical abstract

26 pages, 7993 KiB  
Article
KDA3D: Key-Point Densification and Multi-Attention Guidance for 3D Object Detection
by Jiarong Wang, Ming Zhu, Bo Wang, Deyao Sun, Hua Wei, Changji Liu and Haitao Nie
Remote Sens. 2020, 12(11), 1895; https://doi.org/10.3390/rs12111895 - 11 Jun 2020
Cited by 21 | Viewed by 4778
Abstract
In this paper, we propose a novel 3D object detector KDA3D, which achieves high-precision and robust classification, segmentation, and localization with the help of key-point densification and multi-attention guidance. The proposed end-to-end neural network architecture takes LIDAR point clouds as the main inputs [...] Read more.
In this paper, we propose a novel 3D object detector KDA3D, which achieves high-precision and robust classification, segmentation, and localization with the help of key-point densification and multi-attention guidance. The proposed end-to-end neural network architecture takes LIDAR point clouds as the main inputs that can be optionally complemented by RGB images. It consists of three parts: part-1 segments 3D foreground points and generates reliable proposals; part-2 (optional) enhances point cloud density and reconstructs the more compact full-point feature map; part-3 refines 3D bounding boxes and adds semantic segmentation as extra supervision. Our designed lightweight point-wise and channel-wise attention modules can adaptively strengthen the “skeleton” and “distinctiveness” point-features to help feature learning networks capture more representative or finer patterns. The proposed key-point densification component can generate pseudo-point clouds containing target information from monocular images through the distance preference strategy and K-means clustering so as to balance the density distribution and enrich sparse features. Extensive experiments on the KITTI and nuScenes 3D object detection benchmarks show that our KDA3D produces state-of-the-art results while running in near real-time with a low memory footprint. Full article
(This article belongs to the Section AI Remote Sensing)
Show Figures

Graphical abstract

14 pages, 10937 KiB  
Article
Identifying Ecosystem Function Shifts in Africa Using Breakpoint Analysis of Long-Term NDVI and RUE Data
by Thomas P. Higginbottom and Elias Symeonakis
Remote Sens. 2020, 12(11), 1894; https://doi.org/10.3390/rs12111894 - 11 Jun 2020
Cited by 19 | Viewed by 4228
Abstract
Time-series of vegetation greenness data, derived from Earth-observation imagery, have become a key source of information for studying large-scale environmental change. The ever increasing length of such series allows for a range of indicators to be derived and for increasingly complex analyses to [...] Read more.
Time-series of vegetation greenness data, derived from Earth-observation imagery, have become a key source of information for studying large-scale environmental change. The ever increasing length of such series allows for a range of indicators to be derived and for increasingly complex analyses to be applied. This study presents an analysis of trends in vegetation productivity—measured using the Global Inventory Monitoring and Modelling System third generation (GIMMS3g) Normalised Difference Vegetation Index (NDVI) data—for African savannahs, over the 1982–2015 period. Two annual metrics were derived from the 34 year dataset: the monthly, smoothed NDVI (the aggregated growth season NDVI) and the associated Rain Use Efficiency (growth season NDVI divided by annual rainfall). These indicators were then used in a BFAST-based change-point analysis, allowing the direction of change over time to change and the detection of one major break in the time-series. We also analysed the role of land cover type and climate zone as associations of the observed changes. Both methods agree that vegetation greening was pervasive across African savannahs, although RUE displayed less significant changes than NDVI. Monotonically increasing trends were the most common trend type for both indicators. The continental scale of the greening may suggest global processes as key drivers, such as carbon fertilization. That NDVI trends were more dynamic than RUE suggests that a large component of vegetation trends is driven by precipitation variability. Areas of negative trends were conspicuous by their minimalism. However, some patterns were apparent. In the southern Sahel and West Africa, declining NDVI and RUE overlapped with intensive population and agricultural regions. Dynamic trend reversals, in RUE and NDVI, located in Angola, Zambia and Tanzania, coincide with areas where a long-term trend of forest degradation and agricultural expansion has recently given way to increases in woody biomass. Meanwhile in southern Africa, monotonic increases in RUE with varying NDVI trend types may be indicative of shrub encroachment. However, all these processes are small-scale relative to the GIMMS NDVI data, and reconciling these conflicting drivers is not a trivial task. Our study highlights the importance of considering multiple options when undertaking trend analyses, as different inputs and methods can reveal divergent patterns. Full article
Show Figures

Figure 1

25 pages, 8440 KiB  
Article
A Novel Privacy Approach of Digital Aerial Images Based on Mersenne Twister Method with DNA Genetic Encoding and Chaos
by Fawad Masood, Wadii Boulila, Jawad Ahmad, Arshad, Syam Sankar, Saeed Rubaiee and William J. Buchanan
Remote Sens. 2020, 12(11), 1893; https://doi.org/10.3390/rs12111893 - 11 Jun 2020
Cited by 40 | Viewed by 3718
Abstract
Aerial photography involves capturing images from aircraft and other flying objects, including Unmanned Aerial Vehicles (UAV). Aerial images are used in many fields and can contain sensitive information that requires secure processing. We proposed an innovative new cryptosystem for the processing of aerial [...] Read more.
Aerial photography involves capturing images from aircraft and other flying objects, including Unmanned Aerial Vehicles (UAV). Aerial images are used in many fields and can contain sensitive information that requires secure processing. We proposed an innovative new cryptosystem for the processing of aerial images utilizing a chaos-based private key block cipher method so that the images are secure even on untrusted cloud servers. The proposed cryptosystem is based on a hybrid technique combining the Mersenne Twister (MT), Deoxyribonucleic Acid (DNA), and Chaotic Dynamical Rossler System (MT-DNA-Chaos) methods. The combination of MT with the four nucleotides and chaos sequencing creates an enhanced level of security for the proposed algorithm. The system is tested at three separate phases. The combined effects of the three levels improve the overall efficiency of the randomness of data. The proposed method is computationally agile, and offered more security than existing cryptosystems. To assess, this new system is examined against different statistical tests such as adjacent pixels correlation analysis, histogram consistency analyses and its variance, visual strength analysis, information randomness and uncertainty analysis, pixel inconsistency analysis, pixels similitude analyses, average difference, and maximum difference. These tests confirmed its validity for real-time communication purposes. Full article
(This article belongs to the Special Issue Advances and Innovative Applications of Unmanned Aerial Vehicles)
Show Figures

Graphical abstract

28 pages, 24757 KiB  
Article
remotIO: A Sentinel-1 Multi-Temporal InSAR Infrastructure Monitoring Service with Automatic Updates and Data Mining Capabilities
by Matus Bakon, Richard Czikhardt, Juraj Papco, Jan Barlak, Martin Rovnak, Peter Adamisin and Daniele Perissin
Remote Sens. 2020, 12(11), 1892; https://doi.org/10.3390/rs12111892 - 11 Jun 2020
Cited by 22 | Viewed by 6575
Abstract
Multi-temporal synthetic aperture radar interferometry (MT-InSAR) is nowadays a well-developed remote sensing technique for monitoring of Earth’s surface deformation. The availability of regular and open Copernicus Sentinel-1 satellite data with enhanced spatiotemporal coverage has recently stimulated several initiatives for development of new monitoring [...] Read more.
Multi-temporal synthetic aperture radar interferometry (MT-InSAR) is nowadays a well-developed remote sensing technique for monitoring of Earth’s surface deformation. The availability of regular and open Copernicus Sentinel-1 satellite data with enhanced spatiotemporal coverage has recently stimulated several initiatives for development of new monitoring services which can help to respond to emergencies faster and apply resilience measures more accurately as compared to conventional ground-based techniques. In this paper, the alpha version of the remotIO (Retrieval of Motions and Potential Deformation Threats) system is presented. It is currently able to provide continuous and autonomous updates of MT-InSAR results and post-processing methodology over sites with active deformation hazards to ease the interpretation and facilitate decision-supporting tools for on-time situational awareness. Our post-processing approach implemented in remotIO’s web application has proven to be useful in filtering the resultant deformation maps and in pinpointing problematic zones with potential ground deformation threats also over low-coherent areas. Full article
Show Figures

Graphical abstract

18 pages, 331 KiB  
Review
Remote Sensing Support for the Gain-Loss Approach for Greenhouse Gas Inventories
by Ronald E. McRoberts, Erik Næsset, Christophe Sannier, Stephen V. Stehman and Erkki O. Tomppo
Remote Sens. 2020, 12(11), 1891; https://doi.org/10.3390/rs12111891 - 11 Jun 2020
Cited by 11 | Viewed by 3470
Abstract
For tropical countries that do not have extensive ground sampling programs such as national forest inventories, the gain-loss approach for greenhouse gas inventories is often used. With the gain-loss approach, emissions and removals are estimated as the product of activity data defined as [...] Read more.
For tropical countries that do not have extensive ground sampling programs such as national forest inventories, the gain-loss approach for greenhouse gas inventories is often used. With the gain-loss approach, emissions and removals are estimated as the product of activity data defined as the areas of human-caused emissions and removals and emissions factors defined as the per unit area responses of carbon stocks for those activities. Remotely sensed imagery and remote sensing-based land use and land use change maps have emerged as crucial information sources for facilitating the statistically rigorous estimation of activity data. Similarly, remote sensing-based biomass maps have been used as sources of auxiliary data for enhancing estimates of emissions and removals factors and as sources of biomass data for remote and inaccessible regions. The current status of statistically rigorous methods for combining ground and remotely sensed data that comply with the good practice guidelines for greenhouse gas inventories of the Intergovernmental Panel on Climate Change is reviewed. Full article
(This article belongs to the Special Issue Advances in Remote Sensing for Global Forest Monitoring)
Show Figures

Graphical abstract

30 pages, 7383 KiB  
Article
Novel Ensemble Approaches of Machine Learning Techniques in Modeling the Gully Erosion Susceptibility
by Alireza Arabameri, Omid Asadi Nalivan, Sunil Saha, Jagabandhu Roy, Biswajeet Pradhan, John P. Tiefenbacher and Phuong Thao Thi Ngo
Remote Sens. 2020, 12(11), 1890; https://doi.org/10.3390/rs12111890 - 11 Jun 2020
Cited by 40 | Viewed by 4783
Abstract
Gully erosion has become one of the major environmental issues, due to the severity of its impact in many parts of the world. Gully erosion directly and indirectly affects agriculture and infrastructural development. The Golestan Dam basin, where soil erosion and degradation are [...] Read more.
Gully erosion has become one of the major environmental issues, due to the severity of its impact in many parts of the world. Gully erosion directly and indirectly affects agriculture and infrastructural development. The Golestan Dam basin, where soil erosion and degradation are very severe problems, was selected as the study area. This research maps gully erosion susceptibility (GES) by integrating four models: maximum entropy (MaxEnt), artificial neural network (ANN), support vector machine (SVM), and general linear model (GLM). Of 1042 gully locations, 729 (70%) and 313 (30%) gully locations were used for modeling and validation purposes, respectively. Fourteen effective gully erosion conditioning factors (GECFs) were selected for spatial gully erosion modeling. Tolerance and variance inflation factors (VIFs) were used to examine the collinearity among the GECFs. The random forest (RF) model was used to assess factors’ effectiveness and significance in gully erosion modeling. An ensemble of techniques can provide more accurate results than can single, standalone models. Therefore, we compared two-, three-, and four-model ensembles (ANN-SVM, GLM-ANN, GLM-MaxEnt, GLM-SVM, MaxEnt-ANN, MaxEnt-SVM, ANN-SVM-GLM, GLM-MaxEnt-ANN, GLM-MaxEnt-SVM, MaxEnt-ANN-SVM and GLM-ANN-SVM-MaxEnt) for GES modeling. The susceptibility zones of the GESMs were classified as very-low, low, medium, high, and very-high using Jenks’ natural break classification method (NBM). Subsequently, the receiver operating characteristics (ROC) curve and the seed cell area index (SCAI) methods measured the reliability of the models. The success rate curve (SRC) and predication rate curve (PRC) and their area under the curve (AUC) values were obtained from the GES maps. The results show that the ANN model combined with two and three models are more accurate than the other combinations, but the ANN-SVM model had the highest accuracy. The rank of the others from best to worst accuracy is GLM, MaxEnt, SVM, GLM-ANN, GLM-MaxEnt, GLM-SVM, MaxEnt-ANN, MaxEnt-SVM, GLM-ANN-SVM-MaxEnt, GLM-MaxEnt-ANN, GLM-MaxEnt-SVM and MaxEnt-ANN-SVM. The resulting gully erosion susceptibility models (GESMs) are efficient and powerful and could be used to improve soil and water conservation and management. Full article
Show Figures

Figure 1

15 pages, 11175 KiB  
Article
RTK GNSS-Assisted Terrestrial SfM Photogrammetry without GCP: Application to Coastal Morphodynamics Monitoring
by Marion Jaud, Stéphane Bertin, Mickaël Beauverger, Emmanuel Augereau and Christophe Delacourt
Remote Sens. 2020, 12(11), 1889; https://doi.org/10.3390/rs12111889 - 11 Jun 2020
Cited by 39 | Viewed by 4951
Abstract
The present article describes a new and efficient method of Real Time Kinematic (RTK) Global Navigation Satellite System (GNSS) assisted terrestrial Structure-from-Motion (SfM) photogrammetry without the need for Ground Control Points (GCPs). The system only requires a simple frame that mechanically connects a [...] Read more.
The present article describes a new and efficient method of Real Time Kinematic (RTK) Global Navigation Satellite System (GNSS) assisted terrestrial Structure-from-Motion (SfM) photogrammetry without the need for Ground Control Points (GCPs). The system only requires a simple frame that mechanically connects a RTK GNSS antenna to the camera. The system is low cost, easy to transport, and offers high autonomy. Furthermore, not requiring GCPs enables saving time during the in situ acquisition and during data processing. The method is tested for coastal cliff monitoring, using both a Reflex camera and a Smartphone camera. The quality of the reconstructions is assessed by comparison to a synchronous Terrestrial Laser Scanner (TLS) acquisition. The results are highly satisfying with a mean error of 0.3 cm and a standard deviation of 4.7 cm obtained with the Nikon D800 Reflex camera and, respectively, a mean error of 0.2 cm and a standard deviation of 3.8 cm obtained with the Huawei Y5 Smartphone camera. This method will be particularly interesting when simplicity, portability, and autonomy are desirable. In the future, it would be transposable to participatory science programs, while using an open RTK GNSS network. Full article
Show Figures

Graphical abstract

37 pages, 16549 KiB  
Article
Evaluation of Two Global Land Surface Albedo Datasets Distributed by the Copernicus Climate Change Service and the EUMETSAT LSA-SAF
by Gabriel Lellouch, Dominique Carrer, Chloé Vincent, Mickael Pardé, Sandra C. Frietas and Isabel F. Trigo
Remote Sens. 2020, 12(11), 1888; https://doi.org/10.3390/rs12111888 - 10 Jun 2020
Cited by 9 | Viewed by 3651
Abstract
The present paper is devoted to the quality assessment of two global land surface albedo products developed by Meteo France in the frame of the Copernicus Climate Change Service (C3S) and the LSA-SAF (Satellite Application Facility on Land Surface Analysis), herein called, respectively, [...] Read more.
The present paper is devoted to the quality assessment of two global land surface albedo products developed by Meteo France in the frame of the Copernicus Climate Change Service (C3S) and the LSA-SAF (Satellite Application Facility on Land Surface Analysis), herein called, respectively, VGT (VeGeTation) (the C3Sv1 dataset, derived from VGT sensors onboard Satellites for the Observation of the Earth, also called SPOT) and ETAL (European polar system Ten-day surface ALbedo, derived from Advanced Very High Resolution Radiometers (AVHRR) onboard METeorological OPerational (METOP) satellites). The evaluation study inter-compared these products with measurements at 33 ground stations and two independent operational products, MTAL-R/NRT (Meteosat second generation Ten-day ALbedo Reprocessed/Near Real-Time) and MODIS (MODerate resolution Imaging Spectroradiometer), over two distinct four-year periods. In accordance with the prescription from the Land Product Validation group of the joint Committee on Earth Observation Satellites (LPV/CEOS), the evaluation was addressed per land cover; furthermore, two albedo regimes were considered throughout the evaluation to distinguish between high (over 0.15) and low (below 0.15) surface albedo behaviors. First, we show that both VGT and ETAL products agree well with the measurements and the other satellite products at the ground stations. Second, when inter-compared with MODIS, the results are noteworthy for ETAL as opposed to VGT, with 11 out of 13 land cover types passing the Global Climate Observing System (GCOS) requirements for more than 80% of the sites for albedo values less than 0.15 (compared with none for VGT) and 10 out of 14 land cover types passing the GCOS requirements for more than 50% of the sites for albedo values greater than 0.15 (compared with 5 for VGT). Finally, a pixel-by-pixel analysis reveals that VGT overestimates the surface albedo as compared with MODIS by about 0.02 in absolute value for albedo values less than 0.15 and by about 22% in relative value for albedo values greater than 0.15. The root-mean-square-deviation (RMSD) in absolute value is about 0.015 for albedo values less than 0.15 and 51.5% in relative value for albedo values greater than 0.15. In contrast, the bias for ETAL when compared with MODIS remains very small. Over the four-year period, ETAL overestimates the surface albedo as compared with MODIS by 0.001 in absolute value for the regime of surface albedo less than 0.15 and by about 5.8% in relative value for albedo values greater than 0.15. The RMSD in absolute value is about 0.014 for albedo values less than 0.15 and 19.4% in relative value for albedo values greater than 0.15. Assuming that the MODIS product is a good reference, a relative bias of around 6% can be judged satisfactory for ETAL surface albedo. The lower performance of the VGT (C3Sv1) product is currently the subject of investigation. Work is ongoing to upgrade it further towards the final C3S product. Full article
(This article belongs to the Special Issue Recent Advances in Satellite Derived Global Land Product Validation)
Show Figures

Figure 1

19 pages, 5456 KiB  
Article
Residual Dense Network Based on Channel-Spatial Attention for the Scene Classification of a High-Resolution Remote Sensing Image
by Xiaolei Zhao, Jing Zhang, Jimiao Tian, Li Zhuo and Jie Zhang
Remote Sens. 2020, 12(11), 1887; https://doi.org/10.3390/rs12111887 - 10 Jun 2020
Cited by 33 | Viewed by 4003
Abstract
The scene classification of a remote sensing image has been widely used in various fields as an important task of understanding the content of a remote sensing image. Specially, a high-resolution remote sensing scene contains rich information and complex content. Considering that the [...] Read more.
The scene classification of a remote sensing image has been widely used in various fields as an important task of understanding the content of a remote sensing image. Specially, a high-resolution remote sensing scene contains rich information and complex content. Considering that the scene content in a remote sensing image is very tight to the spatial relationship characteristics, how to design an effective feature extraction network directly decides the quality of classification by fully mining the spatial information in a high-resolution remote sensing image. In recent years, convolutional neural networks (CNNs) have achieved excellent performance in remote sensing image classification, especially the residual dense network (RDN) as one of the representative networks of CNN, which shows a stronger feature learning ability as it fully utilizes all the convolutional layer information. Therefore, we design an RDN based on channel-spatial attention for scene classification of a high-resolution remote sensing image. First, multi-layer convolutional features are fused with residual dense blocks. Then, a channel-spatial attention module is added to obtain more effective feature representation. Finally, softmax classifier is applied to classify the scene after adopting data augmentation strategy for meeting the training requirements of the network parameters. Five experiments are conducted on the UC Merced Land-Use Dataset (UCM) and Aerial Image Dataset (AID), and the competitive results demonstrate that our method can extract more effective features and is more conducive to classifying a scene. Full article
(This article belongs to the Special Issue Computer Vision and Deep Learning for Remote Sensing Applications)
Show Figures

Graphical abstract

18 pages, 9823 KiB  
Article
Reservoir Induced Deformation Analysis for Several Filling and Operational Scenarios at the Grand Ethiopian Renaissance Dam Impoundment
by Austin Madson and Yongwei Sheng
Remote Sens. 2020, 12(11), 1886; https://doi.org/10.3390/rs12111886 - 10 Jun 2020
Cited by 8 | Viewed by 4197
Abstract
Addressing seasonal water uncertainties and increased power generation demand has sparked a global rise in large-scale hydropower projects. To this end, the Blue Nile impoundment behind the Grand Ethiopian Renaissance Dam (GERD) will encompass an areal extent of ~1763.3 km2 and hold [...] Read more.
Addressing seasonal water uncertainties and increased power generation demand has sparked a global rise in large-scale hydropower projects. To this end, the Blue Nile impoundment behind the Grand Ethiopian Renaissance Dam (GERD) will encompass an areal extent of ~1763.3 km2 and hold ~67.37 Gt (km3) of water with maximum seasonal load changes of ~27.93 (41% of total)—~36.46 Gt (54% of total) during projected operational scenarios. Five different digital surface models (DSMs) are compared to spatially overlapping spaceborne altimeter products and hydrologic loads for the GERD are derived from the DSM with the least absolute elevation difference. The elastic responses to several filling and operational strategies for the GERD are modeled using a spherically symmetric, non-rotating, elastic, and isotropic (SNREI) Earth model. The maximum vertical and horizontal flexural responses from the full GERD impoundment are estimated to be 11.99 and 1.99 cm, regardless of the full impoundment period length. The vertical and horizontal displacements from the highest amplitude seasonal reservoir operational scenarios are 38–55% and 34–48% of the full deformation, respectively. The timing and rate of reservoir inflow and outflow affects the hydrologic load density on the Earth’s surface, and, as such, affects not only the total elastic response but also the distance that the deformation extends from the reservoir’s body. The magnitudes of the hydrologic-induced deformation are directly related to the size and timing of reservoir fluxes, and an increased knowledge of the extent and magnitude of this deformation provides meaningful information to stakeholders to better understand the effects from many different impoundment and operational strategies. Full article
Show Figures

Graphical abstract

28 pages, 28517 KiB  
Article
The Implications of M3C2 Projection Diameter on 3D Semi-Automated Rockfall Extraction from Sequential Terrestrial Laser Scanning Point Clouds
by Paul-Mark DiFrancesco, David Bonneau and D. Jean Hutchinson
Remote Sens. 2020, 12(11), 1885; https://doi.org/10.3390/rs12111885 - 10 Jun 2020
Cited by 52 | Viewed by 9002
Abstract
Rockfall inventories are essential to quantify a rockfall activity and characterize the hazard. Terrestrial laser scanning and advancements in processing algorithms have resulted in three-dimensional (3D) semi-automatic extraction of rockfall events, permitting detailed observations of evolving rock masses. Currently, multiscale model-to-model cloud comparison [...] Read more.
Rockfall inventories are essential to quantify a rockfall activity and characterize the hazard. Terrestrial laser scanning and advancements in processing algorithms have resulted in three-dimensional (3D) semi-automatic extraction of rockfall events, permitting detailed observations of evolving rock masses. Currently, multiscale model-to-model cloud comparison (M3C2) is the most widely used distance computation method used in the geosciences to evaluate 3D changing features, considering the time-sequential spatial information contained in point clouds. M3C2 operates by computing distances using points that are captured within a projected search cylinder, which is locally oriented. In this work, we evaluated the effect of M3C2 projection diameter on the extraction of 3D rockfalls and the resulting implications on rockfall volume and shape. Six rockfall inventories were developed for a highly active rock slope, each utilizing a different projection diameter which ranged from two to ten times the point spacing. The results indicate that the greatest amount of change is extracted using an M3C2 projection diameter equal to, or slightly larger than, the point spacing, depending on the variation in point spacing. When the M3C2 projection diameter becomes larger than the changing area on the rock slope, the change cannot be identified and extracted. Inventory summaries and illustrations depict the influence of spatial averaging on the semi-automated rockfall extraction, and suggestions are made for selecting the optimal projection diameter. Recommendations are made to improve the methods used to semi-automatically extract rockfall from sequential point clouds. Full article
(This article belongs to the Special Issue Remote Sensing in Engineering Geology)
Show Figures

Graphical abstract

24 pages, 5706 KiB  
Article
A Modified KNN Method for Mapping the Leaf Area Index in Arid and Semi-Arid Areas of China
by Fugen Jiang, Andrew R. Smith, Mykola Kutia, Guangxing Wang, Hua Liu and Hua Sun
Remote Sens. 2020, 12(11), 1884; https://doi.org/10.3390/rs12111884 - 10 Jun 2020
Cited by 27 | Viewed by 4008
Abstract
As an important vegetation canopy parameter, the leaf area index (LAI) plays a critical role in forest growth modeling and vegetation health assessment. Estimating LAI is helpful for understanding vegetation growth and global ecological processes. Machine learning methods such as k-nearest neighbors (kNN) [...] Read more.
As an important vegetation canopy parameter, the leaf area index (LAI) plays a critical role in forest growth modeling and vegetation health assessment. Estimating LAI is helpful for understanding vegetation growth and global ecological processes. Machine learning methods such as k-nearest neighbors (kNN) and random forest (RF) with remote sensing images have been widely used for mapping LAI. However, the accuracy of mapping LAI in arid and semi-arid areas using these methods is limited due to remote and large areas, the high cost of collecting field data, and the great spatial variability of the vegetation canopy. Here, a novel and modified kNN method was presented for mapping LAI in arid and semi-arid areas of China using Sentinel-2 and Landsat 8 images with field data collected in Ganzhou and Kangbao of China. The modified kNN was developed by integrating the traditional kNN estimation and RF classification. The results were compared with those from kNN and RF regression alone using three sets of input predictors: (i) spectral reflectance bands (input 1); (ii) vegetation indices (input 2); and (iii) a combination of spectral reflectance bands and vegetation indices (input 3). Our analysis showed that in Ganzhou, the red-edge bands of the Sentinel-2 image had a high correlation with LAI. Using the red-edge band-derived vegetation indices increased the accuracy of mapping LAI compared with using other spectral variables. Among the three sets of input predictors, input 3 resulted in the highest prediction accuracy. Based on the combination, the values of RMSE obtained by the traditional kNN, RF, and modified kNN were 0.526, 0.523, and 0.372, respectively, and the modified kNN significantly improved the accuracy of LAI prediction by 29.3% and 28.9% compared with the kNN and RF alone, respectively. A similar improvement was achieved for input 1 and input 2. In Kangbao, the improvement of the prediction accuracy obtained by the modified kNN was 31.4% compared with both the kNN and RF. Therefore, this study implied that the modified kNN provided the potential to improve the accuracy of mapping LAI in arid and semi-arid regions using the images. Full article
(This article belongs to the Section Forest Remote Sensing)
Show Figures

Graphical abstract

20 pages, 9907 KiB  
Article
Identification of the Roles of Climate Factors, Engineering Construction, and Agricultural Practices in Vegetation Dynamics in the Lhasa River Basin, Tibetan Plateau
by Dan Li, Hongying Luo, Tiesong Hu, Dongguo Shao, Yuanlai Cui, Shahbaz Khan and Yufeng Luo
Remote Sens. 2020, 12(11), 1883; https://doi.org/10.3390/rs12111883 - 10 Jun 2020
Cited by 14 | Viewed by 2415
Abstract
Understanding vegetation dynamics is necessary to address potential ecological threats and develop sustainable ecosystem management at high altitudes. In this study, we revealed the spatiotemporal characteristics of vegetation growth in the Lhasa River Basin using net primary productivity (NPP) and normalized difference vegetation [...] Read more.
Understanding vegetation dynamics is necessary to address potential ecological threats and develop sustainable ecosystem management at high altitudes. In this study, we revealed the spatiotemporal characteristics of vegetation growth in the Lhasa River Basin using net primary productivity (NPP) and normalized difference vegetation index (NDVI) during the period of 2000–2005. The roles of climatic factors and specific anthropogenic activities in vegetation dynamics were also identified, including positive or negative effects and the degree of impact. The results indicated that the interannual series of NPP and NDVI in the whole basin both had a continuous increasing trend from 102 to 128 gC m−2 yr−1 and from 0.417 to 0.489 (p < 0.05), respectively. The strongest advanced trends (>2 gC m−2 yr−1 or >0.005 yr−1) were detected in mainly the southeastern and northeastern regions. Vegetation dynamics were not detected in 10% of the basin. Only 20% of vegetation dynamics were driven by climatic conditions, and precipitation was the controlling climatic factor determining vegetation growth. Accordingly, anthropogenic activities made a great difference in vegetation coverage, accounting for about 70%. The construction of urbanization and reservoir led to vegetation degradation, but the farmland practices contributed the vegetation growth. Reservoir construction had an adverse impact on vegetation within 6 km of the river, and the direct damage to vegetation was within 1 km. The impacts of urbanization were more serious than that of reservoir construction. Urban sprawl had an adverse impact on vegetation within a 6 km distance from the surrounding river and resulted in the degradation of vegetation, especially within a 3 km range. Intensive fertilization and guaranteed irrigation improved the cropland ecosystem conditions, creating a favorable effect on the accumulation of crop organic matter in a range of 5 km, with an NPP trend value of 1.2 gC m−2 yr−1. The highly intensive grazing activity forced ecological environmental pressures such that the correlation between livestock numbers and vegetation growth trend was significantly linear negative. Full article
Show Figures

Graphical abstract

41 pages, 7220 KiB  
Review
Meta-Analysis of Wetland Classification Using Remote Sensing: A Systematic Review of a 40-Year Trend in North America
by Masoud Mahdianpari, Jean Elizabeth Granger, Fariba Mohammadimanesh, Bahram Salehi, Brian Brisco, Saeid Homayouni, Eric Gill, Brian Huberty and Megan Lang
Remote Sens. 2020, 12(11), 1882; https://doi.org/10.3390/rs12111882 - 10 Jun 2020
Cited by 57 | Viewed by 8062
Abstract
North America is covered in 2.5 million km2 of wetlands, which is the remainder of an estimated 56% of wetlands lost since the 1700s. This loss has resulted in a decrease in important habitat and services of great ecological, economic, and recreational [...] Read more.
North America is covered in 2.5 million km2 of wetlands, which is the remainder of an estimated 56% of wetlands lost since the 1700s. This loss has resulted in a decrease in important habitat and services of great ecological, economic, and recreational benefits to humankind. To better manage these ecosystems, since the 1970s, wetlands in North America have been classified with increasing regularity using remote sensing technology. Since then, optimal methods for wetland classification by numerous researchers have been examined, assessed, modified, and established. Over the past several decades, a large number of studies have investigated the effects of different remote sensing factors, such as data type, spatial resolution, feature selection, classification methods, and other parameters of interest on wetland classification in North America. However, the results of these studies have not yet been synthesized to determine best practices and to establish avenues for future research. This paper reviews the last 40 years of research and development on North American wetland classification through remote sensing methods. A meta-analysis of 157 relevant articles published since 1980 summarizes trends in 23 parameters, including publication, year, study location, application of specific sensors, and classification methods. This paper also examines is the relationship between several remote sensing parameters (e.g., spatial resolution and type of data) and resulting overall accuracies. Finally, this paper discusses the future of remote sensing of wetlands in North America with regard to upcoming technologies and sensors. Given the increasing importance and vulnerability of wetland ecosystems under the climate change influences, this paper aims to provide a comprehensive review in support of the continued, improved, and novel applications of remote sensing for wetland mapping across North America and to provide a fundamental knowledge base for future studies in this field. Full article
(This article belongs to the Section Environmental Remote Sensing)
Show Figures

Graphical abstract

21 pages, 12562 KiB  
Article
GIS Data as a Valuable Source of Information for Increasing Resolution of the WRF Model for Warsaw
by Jolanta Siewert and Krzysztof Kroszczynski
Remote Sens. 2020, 12(11), 1881; https://doi.org/10.3390/rs12111881 - 10 Jun 2020
Cited by 10 | Viewed by 4222
Abstract
The Weather Research and Forecasting (WRF) model is commonly associated with meteorological data, but its algorithms may also use geographical data. The objective of this paper is to evaluate the impact of the high resolution CORINE Land Cover (CLC) data and the SRTM [...] Read more.
The Weather Research and Forecasting (WRF) model is commonly associated with meteorological data, but its algorithms may also use geographical data. The objective of this paper is to evaluate the impact of the high resolution CORINE Land Cover (CLC) data and the SRTM topography on the estimation accuracy of the weather model parameters in the WRF microscale simulations (200 × 200 m) for Warsaw. In the presented studies, the authors propose their own method of attaching the CLC data to the WRF microscale modeling for the CLC border areas, where first calculational domains reach beyond areas of CLC coverage. As a part of the research, the adaptation of the proposed method was examined by the assessment of the WRF microscale modeling simulations for Warsaw. The modified IGBP MODIS land use/land cover (LULC) and USGS GMTED2010 terrain elevation geographical data (30 arc seconds) was applied for the WRF simulations as default. As higher resolution geographical data (100 m), the LULC from CORINE Land Cover (CLC) 2018 data, and the SRTM topography were adopted. In this study the forecasts of air temperature and relative humidity at 2 m, and wind (speed and direction) at 10 m above ground level obtained using the WRF model for particular simulations were evaluated against measurements made at the Warsaw airports: Chopin (EPWA) and Babice (EPBC). The research has indicated that for microscale calculation fields there are noticeable changes in the meteorological parameter values when the CLC and the SRTM data are integrated into the WRF model, which in most cases yielded more accurate values of temperature and relative humidity at 2 m. This has also proved the correctness of the proposed methodology of the CLC data adoption. The improvement in the forecasted meteorological parameters is different for the particular locations and depends on the degree of the LULC and topography data change after higher resolution data adoption. Full article
Show Figures

Graphical abstract

21 pages, 14190 KiB  
Article
A Cost-Effective Method to Reproduce the Morphology of the Nearshore and Intertidal Zone in Microtidal Environments
by Stefano Furlani, Valeria Vaccher, Vanja Macovaz and Stefano Devoto
Remote Sens. 2020, 12(11), 1880; https://doi.org/10.3390/rs12111880 - 10 Jun 2020
Cited by 3 | Viewed by 3627
Abstract
The photogrammetric method is widely used in coastal areas and in submerged environments. Time-lapse images collected with unmanned aerial vehicles are used to reproduce the emerged areas, while images taken by divers are used to reproduce submerged ones. Conversely, 3D models of natural [...] Read more.
The photogrammetric method is widely used in coastal areas and in submerged environments. Time-lapse images collected with unmanned aerial vehicles are used to reproduce the emerged areas, while images taken by divers are used to reproduce submerged ones. Conversely, 3D models of natural or human-made objects lying at the water level are severely affected by the difference in refractive index between air and seawater. For this reason, the matching of 3D models of emergent and submerged coasts has been very rarely tested and never used in Earth Sciences. The availability of a large number of time-lapse images, collected at the intertidal zone during previous snorkel surveys, encouraged us to test the merging of 3D models of emerged and submerged environments. Considering the rapid and effective nature of the aforementioned program of swim surveys, photogrammetric targets were not used during image acquisition. This forced us to test the matching of the independent models by recognizing prominent landforms along the waterline. Here we present the approach used to test the method, the instrumentation used for the field tests, and the setting of cameras fixed to a specially built aluminum support console and discuss both its advantages and its limits compared to UAVs. 3D models of sea cliffs were generated by applying structure-from-motion (SfM) photogrammetry. Horizontal time-lapse images, collected with action cameras while swimming parallel to the coastline at nearly constant velocity, were used for the tests. Subsequently, prominent coastal landforms were used to couple the independent models obtained from the emergent and submerged cliffs. The method was pilot tested in two coastal sites in the north-eastern Adriatic (part of the Mediterranean basin). The first site was a 25 m sea wall of sandstone set within a small harbor, while the second site was a 150 m route below plunging limestone cliffs. The data show that inexpensive action cameras provide a sufficient resolution to support and integrate geomorphological field surveys along rocky coastlines. Full article
(This article belongs to the Special Issue Coastal Environments and Coastal Hazards)
Show Figures

Graphical abstract

17 pages, 8067 KiB  
Article
GPR and ERT Investigations in Urban Areas: the Case-Study of Matera (Southern Italy)
by Jessica Bellanova, Giuseppe Calamita, Ilaria Catapano, Alessandro Ciucci, Carmela Cornacchia, Gianluca Gennarelli, Alessandro Giocoli, Federico Fisangher, Giovanni Ludeno, Gianfranco Morelli, Angela Perrone, Sabatino Piscitelli, Francesco Soldovieri and Vincenzo Lapenna
Remote Sens. 2020, 12(11), 1879; https://doi.org/10.3390/rs12111879 - 10 Jun 2020
Cited by 12 | Viewed by 4422
Abstract
This paper deals with a geophysical survey carried out in some critical urban areas of the historical city of Matera (Southern Italy). Matera has a very complex shallower stratigraphy characterized by both anthropic and natural “targets” and is affected by geological instability. Therefore, [...] Read more.
This paper deals with a geophysical survey carried out in some critical urban areas of the historical city of Matera (Southern Italy). Matera has a very complex shallower stratigraphy characterized by both anthropic and natural “targets” and is affected by geological instability. Therefore, Matera represents an ideal and very challenging outdoor laboratory for testing novel approaches for near-surface explorations in urban areas. Here, we present the results of a near-surface survey carried out by jointly applying Ground Penetrating Radar (GPR) and Electrical Resistivity Tomography (ERT) methods. The survey was implemented in three different critical zones within the urban area of Matera (Piazza Duomo, Piazza San Giovanni, Villa dell’Unità d’Italia). These test sites are of great interest for archaeological and architectonical studies and are affected by ground instability phenomena due to the presence of voids, cavities and other anthropic structures. The effectiveness of the survey was enhanced by the exploitation of advanced 3D tomographic approaches, which allowed to achieve 3D representation of the investigated underground and obtain information in terms of both the location and the geometry of buried objects and structures and the characterization of shallow geological layers. The results of the surveys are now under study (or have attracted the interest) of the Municipality in order to support smart cities programs and activities for a better management of the underground space. Full article
Show Figures

Graphical abstract

27 pages, 6372 KiB  
Technical Note
Comparison of the Lunar Models Using the Hyper-Spectral Imager Observations in Lijiang, China
by Yang Wang, Xiuqing Hu, Lin Chen, Yu Huang, Zhanfeng Li, Shurong Wang, Peng Zhang, Ronghua Wu, Lu Zhang and Wei Wang
Remote Sens. 2020, 12(11), 1878; https://doi.org/10.3390/rs12111878 - 10 Jun 2020
Cited by 5 | Viewed by 2994
Abstract
A lunar observation campaign was conducted using a hyper-spectral imaging spectrometer in Lijiang, China from December 2015 to February 2016. The lunar hyper-spectral images in the visible to near-infrared region (VNIR) have been obtained in different lunar phases with absolute scale established by [...] Read more.
A lunar observation campaign was conducted using a hyper-spectral imaging spectrometer in Lijiang, China from December 2015 to February 2016. The lunar hyper-spectral images in the visible to near-infrared region (VNIR) have been obtained in different lunar phases with absolute scale established by the National Institute of Metrology (NIM), China using the lamp–plate calibration system. At the same time, the aerosol optical depth (AOD) is measured regularly by a lidar and a lunar CE318U for atmospheric characterization to provide nightly atmosphere extinction correction of lunar observations. This paper addressed the complicated data processing procedure in detail from raw images of the spectrometer into the spectral lunar irradiance in different lunar phases. The result of measurement shows that the imaging spectrometer can provide lunar irradiance with uncertainties less than 3.30% except for absorption bands. Except for strong atmosphere absorption region, the mean spectral irradiance difference between the measured irradiance and the ROLO (Robotic Lunar Observatory) model is 8.6 ± 2% over the course of the lunar observation mission. The ROLO model performs more reliable to clarify absolute and relative accuracy of lunar irradiance than that of the MT2009 model in different Sun–Moon–Earth geometry. The spectral ratio analysis of lunar irradiance shows that band-to-band variability in the ROLO model is consistent within 2%, and the consistency of the models in the lunar phase and spectrum is well analyzed and evaluated from phase dependence and phase reddening analysis respectively. Full article
Show Figures

Graphical abstract

7 pages, 580 KiB  
Letter
Global Airborne Laser Scanning Data Providers Database (GlobALS)—A New Tool for Monitoring Ecosystems and Biodiversity
by Krzysztof Stereńczak, Gaia Vaglio Laurin, Gherardo Chirici, David A. Coomes, Michele Dalponte, Hooman Latifi and Nicola Puletti
Remote Sens. 2020, 12(11), 1877; https://doi.org/10.3390/rs12111877 - 09 Jun 2020
Cited by 17 | Viewed by 4553
Abstract
Protection and recovery of natural resource and biodiversity requires accurate monitoring at multiple scales. Airborne Laser Scanning (ALS) provides high-resolution imagery that is valuable for monitoring structural changes to vegetation, providing a reliable reference for ecological analyses and comparison purposes, especially if used [...] Read more.
Protection and recovery of natural resource and biodiversity requires accurate monitoring at multiple scales. Airborne Laser Scanning (ALS) provides high-resolution imagery that is valuable for monitoring structural changes to vegetation, providing a reliable reference for ecological analyses and comparison purposes, especially if used in conjunction with other remote-sensing and field products. However, the potential of ALS data has not been fully exploited, due to limits in data availability and validation. To bridge this gap, the global network for airborne laser scanner data (GlobALS) has been established as a worldwide network of ALS data providers that aims at linking those interested in research and applications related to natural resources and biodiversity monitoring. The network does not collect data itself but collects metadata and facilitates networking and collaborative research amongst the end-users and data providers. This letter describes this facility, with the aim of broadening participation in GlobALS. Full article
(This article belongs to the Special Issue Remote Sensing for Biodiversity Mapping and Monitoring)
Show Figures

Graphical abstract

15 pages, 5464 KiB  
Article
Comparison of Multi-Temporal PlanetScope Data with Landsat 8 and Sentinel-2 Data for Estimating Airborne LiDAR Derived Canopy Height in Temperate Forests
by Katsuto Shimizu, Tetsuji Ota, Nobuya Mizoue and Hideki Saito
Remote Sens. 2020, 12(11), 1876; https://doi.org/10.3390/rs12111876 - 09 Jun 2020
Cited by 11 | Viewed by 4745
Abstract
Developing accurate methods for estimating forest structures is essential for efficient forest management. The high spatial and temporal resolution data acquired by CubeSat satellites have desirable characteristics for mapping large-scale forest structural attributes. However, most studies have used a median composite or single [...] Read more.
Developing accurate methods for estimating forest structures is essential for efficient forest management. The high spatial and temporal resolution data acquired by CubeSat satellites have desirable characteristics for mapping large-scale forest structural attributes. However, most studies have used a median composite or single image for analyses. The multi-temporal use of CubeSat data may improve prediction accuracy. This study evaluates the capabilities of PlanetScope CubeSat data to estimate canopy height derived from airborne Light Detection and Ranging (LiDAR) by comparing estimates using Sentinel-2 and Landsat 8 data. Random forest (RF) models using a single composite, multi-seasonal composites, and time-series data were investigated at different spatial resolutions of 3, 10, 20, and 30 m. The highest prediction accuracy was obtained by the PlanetScope multi-seasonal composites at 3 m (relative root mean squared error: 51.3%) and Sentinel-2 multi-seasonal composites at the other spatial resolutions (40.5%, 35.2%, and 34.2% for 10, 20, and 30 m, respectively). The results show that RF models using multi-seasonal composites are 1.4% more accurate than those using harmonic metrics from time-series data in the median. PlanetScope is recommended for canopy height mapping at finer spatial resolutions. However, the unique characteristics of PlanetScope data in a spatial and temporal context should be further investigated for operational forest monitoring. Full article
Show Figures

Graphical abstract

18 pages, 28481 KiB  
Article
TUM-MLS-2016: An Annotated Mobile LiDAR Dataset of the TUM City Campus for Semantic Point Cloud Interpretation in Urban Areas
by Jingwei Zhu, Joachim Gehrung, Rong Huang, Björn Borgmann, Zhenghao Sun, Ludwig Hoegner, Marcus Hebel, Yusheng Xu and Uwe Stilla
Remote Sens. 2020, 12(11), 1875; https://doi.org/10.3390/rs12111875 - 09 Jun 2020
Cited by 40 | Viewed by 5322
Abstract
In the past decade, a vast amount of strategies, methods, and algorithms have been developed to explore the semantic interpretation of 3D point clouds for extracting desirable information. To assess the performance of the developed algorithms or methods, public standard benchmark datasets should [...] Read more.
In the past decade, a vast amount of strategies, methods, and algorithms have been developed to explore the semantic interpretation of 3D point clouds for extracting desirable information. To assess the performance of the developed algorithms or methods, public standard benchmark datasets should invariably be introduced and used, which serve as an indicator and ruler in the evaluation and comparison. In this work, we introduce and present large-scale Mobile LiDAR point clouds acquired at the city campus of the Technical University of Munich, which have been manually annotated and can be used for the evaluation of related algorithms and methods for semantic point cloud interpretation. We created three datasets from a measurement campaign conducted in April 2016, including a benchmark dataset for semantic labeling, test data for instance segmentation, and test data for annotated single 360 ° laser scans. These datasets cover an urban area of approximately 1 km long roadways and include more than 40 million annotated points with eight classes of objects labeled. Moreover, experiments were carried out with results from several baseline methods compared and analyzed, revealing the quality of this dataset and its effectiveness when using it for performance evaluation. Full article
(This article belongs to the Special Issue Laser Scanning and Point Cloud Processing)
Show Figures

Figure 1

14 pages, 797 KiB  
Article
Boosting Memory with a Persistent Memory Mechanism for Remote Sensing Image Captioning
by Kun Fu, Yang Li, Wenkai Zhang, Hongfeng Yu and Xian Sun
Remote Sens. 2020, 12(11), 1874; https://doi.org/10.3390/rs12111874 - 09 Jun 2020
Cited by 7 | Viewed by 2347
Abstract
The encoder–decoder framework has been widely used in the remote sensing image captioning task. When we need to extract remote sensing images containing specific characteristics from the described sentences for research, rich sentences can improve the final extraction results. However, the Long Short-Term [...] Read more.
The encoder–decoder framework has been widely used in the remote sensing image captioning task. When we need to extract remote sensing images containing specific characteristics from the described sentences for research, rich sentences can improve the final extraction results. However, the Long Short-Term Memory (LSTM) network used in decoders still loses some information in the picture over time when the generated caption is long. In this paper, we present a new model component named the Persistent Memory Mechanism (PMM), which can expand the information storage capacity of LSTM with an external memory. The external memory is a memory matrix with a predetermined size. It can store all the hidden layer vectors of LSTM before the current time step. Thus, our method can effectively solve the above problem. At each time step, the PMM searches previous information related to the input information at the current time from the external memory. Then the PMM will process the captured long-term information and predict the next word with the current information. In addition, it updates its memory with the input information. This method can pick up the long-term information missed from the LSTM but useful to the caption generation. By applying this method to image captioning, our CIDEr scores on datasets UCM-Captions, Sydney-Captions, and RSICD increased by 3%, 5%, and 7%, respectively. Full article
Show Figures

Graphical abstract

Previous Issue
Next Issue
Back to TopTop