Technical Note

Comparison of the Lunar Models Using the Hyper-Spectral Imager Observations in Lijiang, China

1
Key Laboratory of Infrared System Detection and Imaging Technology, Shanghai Institute of Technical Physics, Chinese Academy of Sciences, Shanghai 200083, China
2
National Satellite Meteorological Center, Beijing 100081, China
3
State Key Laboratory of Applied Optics, Changchun Institute of Optics, Fine Mechanics and Physics, Chinese Academy of Sciences, Changchun 130033, China
*
Author to whom correspondence should be addressed.
Remote Sens. 2020, 12(11), 1878; https://doi.org/10.3390/rs12111878
Submission received: 29 April 2020 / Revised: 3 June 2020 / Accepted: 4 June 2020 / Published: 10 June 2020

Abstract

:
A lunar observation campaign was conducted using a hyper-spectral imaging spectrometer in Lijiang, China from December 2015 to February 2016. The lunar hyper-spectral images in the visible to near-infrared region (VNIR) have been obtained in different lunar phases with absolute scale established by the National Institute of Metrology (NIM), China using the lamp–plate calibration system. At the same time, the aerosol optical depth (AOD) is measured regularly by a lidar and a lunar CE318U for atmospheric characterization to provide nightly atmosphere extinction correction of lunar observations. This paper addressed the complicated data processing procedure in detail from raw images of the spectrometer into the spectral lunar irradiance in different lunar phases. The result of measurement shows that the imaging spectrometer can provide lunar irradiance with uncertainties less than 3.30% except for absorption bands. Except for strong atmosphere absorption region, the mean spectral irradiance difference between the measured irradiance and the ROLO (Robotic Lunar Observatory) model is 8.6 ± 2% over the course of the lunar observation mission. The ROLO model performs more reliable to clarify absolute and relative accuracy of lunar irradiance than that of the MT2009 model in different Sun–Moon–Earth geometry. The spectral ratio analysis of lunar irradiance shows that band-to-band variability in the ROLO model is consistent within 2%, and the consistency of the models in the lunar phase and spectrum is well analyzed and evaluated from phase dependence and phase reddening analysis respectively.

Graphical Abstract

1. Introduction

A standard reference source using the Moon is established to provide on-orbit stable and accurate radiometric calibration in solar reflective wavelength range (350–2500 nm) [1], and detect against small systematic drifts in the radiometric response of instruments over many years [2,3]. The lunar brightness has a dynamic range for most Earth-view spacecraft instruments, and the Moon can be useful as a common calibration source between spacecrafts. Due to the intrinsic photometric stability of the lunar surface [1], lunar calibration can be applied to any spacecraft observations made at any time, including in the past for space-based hyper/multi-band imagers, and it is very complementary to other current vicarious calibration methods [4].
A long-term set of lunar observations and cross calibration [5] are put forward by future missions such as CLARREO and TRUTHS [6], and the Moon has gradually become the first choice of an absolute celestial target for multiple sensors [7]. Therefore, for lunar calibration, it is necessary that there is a precise photometric model which characterizes the variation and scale of lunar brightness. The lunar models also have been used to advance research in nighttime environments including calibrated nighttime low-light measurements [8], sky background estimation, and atmospheric aerosol monitoring [9].
The most careful radiometric study of the Moon to date is reported by the Robotic Lunar Observatory (ROLO) project, and this lunar model [10]—based on the extensive database of radiance images—has been developed to support radiometric calibration of Earth-view spacecraft instruments. However, the absolute scale of this model against SI (Système international) radiometric units is deemed to have an uncertainty of 5–10% [10]. The comparison in different space-borne instruments indicates the stability of the ROLO irradiance model in the similar phase angle currently is better than 1% [10]. For the current ROLO model, there is the relative difference of approximately 3% in the phase angle from half-moon to full moon, which is associated with the phase angle dependence [11,12,13].
For the ROLO model, the Moon is not currently useful as an absolute celestial target because of the current estimated uncertainties and being not traceable to the SI [10]. As a relative on-orbit target, the tendency of the lunar model with lunar phase cannot satisfy current requirements for cross calibration between different phase angles [11]. For weather and climate remote sensing instruments, typical uncertainty requirements of radiometric calibration are 0.5%. The relative response trending with precision approaching 0.1% needs to meet the long-term stability requirement for measuring global climate change from space [14]. For future missions like CLARREO [15,16], the uncertainty requirements are even up to 0.3% in the reflected solar region.
Motivated by the possibility of using a better-calibrated Moon to validate the current lunar models, we have performed hyper-spectral photometric observations of the Moon near Lijiang Observatory (Yunnan, China) for three months [17]. The photometric observation system and lunar measurement are simply described in Section 2, and the calibration and atmospheric extinction correction are respectively described in this section. Section 3 describes data processing in detail to provide top-of-the-atmosphere radiance and irradiance, and a detailed uncertainty analysis of the lunar ground-based measurements is discussed. In Section 3, the outputs from the ground-based measurements are compared with the irradiances calculated from current lunar models in absolute scale, radiometric inconsistency, band-to-band stability, phase dependence, and phase reddening.

2. Instrumentation and Dataset

2.1. Instrumentation

The ground-based observation system is illustrated schematically in Figure 1, including an imaging spectrometer, an equatorial mount, and an imaging monitor. The imaging spectrometer is defined as a lunar ground-based push-broom imager, and one prism is used as the dispersion element of the spectrometer. The light is dispersed onto 273 selectable spectral pixels over the wavelength range from 400 to 1000 nm, with 231 spatial pixels across the track. Due to the prism material, it has a spectral resolution of 2–10 nm in the dispersion direction. The VNIR optics gives each pixel a field of view of 0.00303° in the cross-track swath, and the instantaneous field of view (IFOV) is 0.0056° in the track direction. The size of the Moon is approximately 0.5° from Lijiang city which fits nicely within the field of regard (FOV = 0.7°). The SNR at brightness level from first (last) quarter to full Moon is more than 200 over most wavelengths of interest.
The equatorial telescope is used as the tracking turntable of the ground-based observation system. The Paramount MX+ robotic mount is controlled with the Sky-X Pro commercial software, and a fine centering can be performed for the mount using a lot of stars in the sky. The equatorial coordinates of a celestial object for the mount remain the same regardless of from where the object is viewed on Earth. During the night observation, the spectral shift of the spectrometer is monitored by the external mercury lamp. The imaging monitor coupled to the imaging spectrometer that is rigidly fixed on the equatorial mount with a tripod automatically provides measurements of the integrated lunar disk. The imaging monitor is boresighted to the spectrometer so that both instruments can simultaneously observe the Moon for checking push-broom imaging and helping post-processing.
The spectrometer is currently mounted on the versa-plate of the mount to ensure that the spectrometer slit is perpendicular to the movement trail of the Moon, and the apparent orientation of the spectrometer is controlled by the astronomy software of the mount. However, a challenge for ground-based photometric observation systems is pointing to the Moon and including the entire Moon in the narrow scan due to the bias of optical axis parallelism between the spectrometer and imaging monitor. Therefore, the initial pointing of the moon imaging needs to be adjusted to capture the entire Moon.
The initial pointing is determined by using the sharp edge and symmetry of the Moon in Figure 2. The imaging monitor is used to help the imaging spectrometer to determine the scanning position of the Moon. There is always a symmetrical edge of the Moon in the moving direction, therefore the center in the spatial dimension is calibrated by a symmetrical edge (position 1). When the slit spectrometer moves to the sharp edge of the Moon (position 1), there is a small signal in the slit image (IFOV angle = 0.0056°) in Figure 2, then the position 1 in the track direction is calibrated by the edge. When the slit spectrometer slews to position 2 in the scanning dimension by rotating the right ascension axis (approximately 0.1°), one entire Moon can be captured within 3 min. By using the right ascension and declination control, the master computer initializes the pointing registration of the mount via the lunar image of imaging monitor and slit image. Therefore, auto-centering of the Moon for the spectrometer is done by the mount.

2.2. Lunar Observation

The ground-based photometric observations of the Moon are organized by the National Satellite Meteorological Center (NSMC), China and joined from several other organizations—including Changchun Institute of Optics, Fine Mechanics and Physics, Chinese Academy of Sciences, and Beijing Institute of Remote Sensing Technology. A detailed description of the observing scheme is published in previous paired paper [17]. Beginning in December 2015, a time-series of lunar observations near Lijiang Observatory, Yunnan (lat.26°45′40 00 N, long.100°02′33 00 E, alt.3175 m) has been obtained automatically covering the VNIR. In Figure 1, the observation site has a stable, low aerosol loading atmospheric condition (see Section 2.4.1) that maximizes the fraction of nights with high quality data. The Moon was observed for the 2-week period each month between first and last quarter phases when it was within less than 60°of the zenith. In the text, the lunar phase is defined as the angle between the Sun (S) and the Earth (E) with respect to the Moon (M), the angle before the full Moon is the minus value, and the angle after the full Moon is the positive value. For lunar observations, the lunar angle and libration coverage are shown in Figure 3. The lunar phase range is from −83° to 87°, and the phase angle near the full angle is 9.7°.
The imaging spectrometer captures a dispersion image of the slit, including the spectral and spatial information dimensions. When the mount slews to the Moon, the imaging spectrometer will be pitched ahead of the moving moon with a long slit oriented perpendicular to the track for moon imaging [17], and the instrument can create one whole lunar image. The ground-based observation control system could accomplish the observing process automatically by adopting orbit prediction of the moving Moon and time offset. One frame image can be synchronously taken for the imaging monitor and imaging spectrometer. The instrument operates in an equatorial coordinate system, and the automated program generates a lunar ephemeris using the Solar and Moon Position Algorithm (SAMPA) distributed by the National Renewable Energy Laboratory. When the time of morning twilight approaches, the program stops observing sky objects. In order to accommodate the brightness difference of the Moon imagined with VNIR bands and phase angles, an observing effort was made in the design phase to automate the observing with high SNR as far as possible.
The entire Moon can be obtained with a single exposure, and exposure times are computed based upon uniform spatial resolution, predicted atmospheric extinction and change rate of the lunar brightness from photometric model. The ephemeris calculations are based on the middle time of one lunar disk. The Moon is observed with 3 min, and slew rate (angular velocity of the Moon) is (6.6~7.2) ×10−5 rad/s. For the imaging spectrometer, the scans of the Moon pass from limb to limb at 0.9–1.7 s intervals, and the exposure time is from 0.4 to 1.7 s with respect to the lunar phase. For these lunar observations, the algorithms of operating the observing are programed into the software. For lunar measurements, this image can also be considered a scene that includes the Moon. There are approximately 100 scan lines of the Moon in the along-track direction, and the number of scan lines depends on the angular velocity, lunar brightness, and SNR [17]. The array of sensors consists of 231 pixels covering an angle of 0.7° in the spatial dimension. The ground-based observations have been performed to allow the imaging spectrometer to observe the Moon at different lunar phase angles. In Figure 4, the top panel shows eight lunar observations from different phase angles at λ = 550 nm. Due to a large dynamic range of lunar brightness, an oversampling factor from 0.75 to 1.45 occurs along the track direction, which produces an elongated lunar image.
Lunar observations can support cross-comparison of different instruments, using the Moon as a common target. The imaging spectrometer and lunar CE-318U simultaneously observe the Moon in the same atmospheric path and time, and the inter-comparison of CE-318U and imaging spectrometer is made in Figure 5. The curves show a good agreement for normalized disk-integrated signals in both the wavelength and time.
The normalized specific value D between the disk-integrated signal of the spectrometer and CE318 signal is expressed as
D k = ( ( D N ) n , k s p e c t r o m e t e r D N n , k C E 318 U ) / m e a n ( ( D N ) n , k s p e c t r o m e t e r D N n , k C E 318 U ) ,
where ( D N ) n , k s p e c t r o m e t e r is the disk-integrated signal of the spectrometer in the k band for the nth observation, and D N n , k C E 318 U is the output signal of the CE318U. The coefficient of variation of the normalized specific value D is defined as
C V = S ( D ) M ( D ) ,
where S is the standard deviation, M is the mean value, and the coefficient CV of variation is the standard deviation scaled by the mean value.
In Figure 6, there are the normalized specific values near the zenith for different observational days. The coefficients of variation from Equation (2) for the four bands (440, 500, 677, and 870 nm) are less than 1%, and the results show a good agreement with phase angle between the spectrometer and CE318U for normalized specific value D. For the data from Figure 6, the normalized specific values and coefficients of variation are shown in Table 1. It is assumed that the CE-318U data are valid, accurate, and stable, and it indicates that the instrument stability has been achieved during the lunar observations and the observational data in different phase angles is highly reliable. However, the difference between the normalized specific values in different phase angles or different bands is mainly derived from the instrument performance, data reduction, and instrument status for respective instruments.

2.3. Instrument Calibration and Characterization

2.3.1. Laboratory Spectral Calibration

The relative spectral response (RSR) functions for the spectrometer bands have been measured by the Anhui institute of optics and fine mechanics, China, under laboratory ambient conditions, using a narrow-band scanning with laser-based methods [18], and a uniform and quasi-lambertian area light source from the integrating sphere fed by tunable lasers is generated to provide wavelength coverage from 400 to 1000 nm. For the imaging spectrometer, the shape of the RSR function at 494.4, 599.35, 720.15, and 849.9 nm is shown in Figure 7, and the measurement values have been filtered with a bandwidth of 3.50, 4.80, 6.58, and 8.50 nm, respectively. For a prism dispersion instrument with a slit, the bandwidth of the spectrometer RSRs is measured from 2 to 10 nm, and the bandwidth in the long wavelength is larger than that in the short wavelength. Therefore, there are four wavelengths to be representative for all the wavelength bands in Figure 7.

2.3.2. Wavelength Drift Correction

Since the ground-based observation system has not a temperature control device, the entire spectrum in the spectral dimension varies with the environment temperature. To monitor the spectral shift of the prism spectrometer for all bands, some characteristic spectrum lines of the mercury lamp at different temperatures are used to record the position variation (pixel) in the detector, as seen in Figure 8.
For eight mercury spectrum lines from Figure 8, pixel positions in the spectrum dimension are calculated using Gaussian fitting, the results at three ambient temperature spots are shown in Table 2. For some characteristic spectrum lines, the difference between two temperature spots is shown in Table 2, and the result indicates that eight spectrum lines have almost the same value Δ of wavelength drift (mean value ± 0.1 pixel) in the same conditions. In Table 2, the difference of the values Δ between two different spectrum lines is mainly derived from the weak signal (such as A) or non-Gaussian distribution (such as F, G). Therefore, we expect that the shape between the wavelength and pixel position is deemed to be invariant, and moves with temperature in the detector.
In the field, the instrument includes an external and built-in spectroscopic monitoring system that can detect spectral line shifts within the instrument. During lunar measurements, the real-time temperature monitoring system provided the temperature of four positions within the instrument. For the prism instrument, the temperature of four positions in three ambient temperatures (see in Table 2) is shown in Table 3. In the laboratory, the relationship between spectrum and temperature was effectively measured. The temperature in the field is lower than that in the laboratory; therefore, the relationship from the laboratory cannot be used for spectrum correction. In the field measurement, the mercury lamp tests with a filter paper were done three times each night, and some characteristic spectrum lines achieved with the mercury lamp were used to recalibrate the wavelengths of the prism spectrometer for the wavelength drift caused by temperature. The method using some molecular absorption lines (water vapor, oxygen, etc.) is similar to that using the mercury lamp. In the post-processing, these three methods are used to correct the spectrum shift to match the spectral calibration in the laboratory together. For 3-month observations, the result of mercury lamp monitoring shows the entire pixel translation ranges from −2 to 2 pixels in the spectral dimension, and the relative variation of spectral shift is estimated to be less than 1 pixel in one night. For the purpose of reducing error, the spectrum shift correction is operated value in Section 3.1.

2.3.3. Radiometric Calibration

The accuracy of lunar spectral irradiance depends critically on an accurate specification of the instrument calibration. For a dispersion slit image, the original project design used the light source from an integrating sphere only to generate flat-fielding images. The lunar radiance scale which is currently applied to observational data is derived from near-field diffusing screen with a calibrated lamp at Nation Institute of Metrology, China. The instrument calibration setup is shown schematically in Figure 9a. The NIM calibration of the imaging spectrometer was performed with 1000 W quartz-tungsten halogen (QTH) lamps of known output values. The standard lamp was calibrated against blackbody sources at wavelengths ranging from the visible to the near-infrared. The calibrated QTH lamp which was performed at a distance of 0.5 m, illuminated a 25 × 28 cm flat Spectralon plate (or diffusing screen) at 0° incidence, and the spectrometer viewed the center of the diffusing screen from 0.4 m at an emergence angle of 45°.
To obtain an accurate specification of the instrument calibration, the following three conditions need to be considered to design the calibration scheme.
  • Since the apparent angular diameter of the Moon with respect to the observation site is approximately 0.5° and the radiance of the background surrounding the Moon is virtually zero, the low stray light level is obtained for lunar measurements. To meet the requirements of small field of view (FOV) during the absolute calibration, the field angle with respect to the spectrometer should be close to 0.5°as far as possible.
  • For radiometric calibration, it is necessary that the light from the lamp–plate system is utilized to fill the field of view of the spectrometer.
  • To ensure the property of Lambertian source with respect to the instrument, the size of the light source is large enough to avoid the pointing error of the spectrometer.
In fact, the diffusing screen leaves too much room for the FOV of the spectrometer, and there is a high intensity of the light from the large field of view. In order to simulate a surrounding region of black space as far as possible, a diaphragm (3) on the diffusing screen played an important role in the suppression of light outside the field of view of the telescope in Figure 9a. In order to point to the center of the diaphragm (3) as far as possible in Figure 9a,b, the area of the diaphragm (gray area) on the diffusing screen was slightly larger than the effective area with respect to the FOV. The light from the effective area (green area in Figure 9b) could be propagated throughout the telescope of the spectrometer.
In the left panel, there was also one baffle placed between the standard lamp and radiometer to minimize the influence of light from the lamp. In this way, we can increase the obstruction of the light out of the optical module to calibrate the instrument in the moon view during the absolute calibration.
During the instrument calibration, the exposure time at the brightness level of the full Moon is 0.65 s for this setup, although the spectral responsivity of the lamp is slightly different from that of the Moon. To accommodate the difference in light level between this setup and the Moon, the linearity of the instrument is measured by the integrating sphere with two lamps for the dynamic range of lunar brightness. After the dark current and smear effects correction (see Section 3.1), the spectral radiance responsivity is shown in Figure 9c. A dedicated effort is currently underway to tie the spectrometer response to the radiometric scale of the NIM.

2.4. Atmospheric Correction

The development of low-uncertainty atmospheric extinction correction is an important part for research effort of TOA lunar irradiance observations. Their effect on atmospheric extinction depends on many factors—such as humidity, particle size distribution, and concentration—which in turn vary with weather, altitude, and geography. Atmosphere extinction is a combination of a mass of gaseous absorption lines, Mie scattering by aerosols, and Rayleigh scattering by all molecules [19,20]. Some atmosphere auxiliary instruments for atmospheric extinction correction were used to help with the acquisition of atmosphere model parameters.

2.4.1. Aerosol Optical Depth

The nocturnal aerosols are known to impact the atmospheric extinction, but they still represent one of the largest uncertainties in the atmospheric extinction correction of the lunar observations. The Atmosphere Multiwave Raman Polarization Lidar Equipment (AMPLE) operated in full-time continuous mode to detect qualitatively the atmospheric aerosol content and its vertical distribution. The LIDAR system could be used to characterize the aerosol back scattering throughout the night, and the backscattered signal is registered in 3-s integration time and with a vertical resolution of 3.75 m in three bands (355, 532, and 1064 nm). The lidar system was implemented in site (see Figure 1), and the vertical profile of extinction coefficients at 532 nm is shown in Figure 10.
Using CE318 observations of the Moon and the Sun with a separate correction for the Langley plot [21] and lunar Langley methods [22] can provide aerosol information for the lunar observations at different zenith angles, and the collection of the observational data is developed in nine bands (412, 443, 490, 510, 555, 670, 765, and 865 nm). The automation of the devices affords continuous aerosol profiles in the daytime and nighttime. The lunar-photometer CE318U and sun-photometer CE318 observations are used as the complement and checkout of aerosol information.
The LIDAR system can provide a measurement of atmospheric homogeneity and variability with other atmospheric characterization tools. The collocated lidar backscatter and CE318U data indicate that relatively stable, cloud-free sky conditions existed for aerosol analysis throughout the night. In Figure 11, the air of the observation site is essentially free of aerosols, and the atmosphere condition in the night is excellent with less than 0.1 of the AOD at 550 nm in the most of observational days.

2.4.2. Atmospheric Profiles

Atmospheric transmittance spectra for these components were calculated with radiative transfer programs such as MODTRAN, version 4.3, and the total extinction correction can be derived from the known curves of profile growth for the absorption bands. Radiosonde balloons and atmospheric sounders were used to help us to obtain the temperature, pressure, and water vapor altitude profiles taken within 1 day of our measurement. Business data of radiosonde balloons at 11:00 and 23:00 UTC and VISALA were respectively obtained in Lijiang meteorological station which is about 10 km away from observation site. Ozone, nitrous oxide, methane, carbon monoxide altitude profile, and carbon dioxide (mixing ratio: 360 ppmv) are obtained by using mid-latitude winter conditions. Other gases profiles adopt the 1976 US standard atmosphere; however, the atmosphere extinction of trace gases is negligible.

2.4.3. Atmospheric Transmittance

For the lunar observation, transmission spectra are assumed to be the same within acquisition time of one full disk. Lunar zenith calculations were performed with the double-precision ephemeris DE421 SPICE toolkit, and the transmission spectra based on the given air-mass coverage are computed by convolving the MODTRAN transmission spectra with the SRFs
T E k a t m = λ 1 λ 2 T E m a t m ( λ ) S R F k ( λ ) d λ λ 1 λ 2 S R F k ( λ ) d λ ,
where T E m a t m is the MODTRAN transmission spectrum of a uniform atmosphere in m band, S R F k is the spectral response function in the k band for the imaging spectrometer.
To minimize the magnitude of the atmospheric corrections, the instrument was deployed to make frequent observations from high-altitude mountain tops near Lijiang observatory where the Moon is more readily observable. At our site, this represents the minimum extinction expected at a zenith angle of 10° generated using MODTRAN 4.3 from 3.175 to 100 km altitude for rural aerosol model, the 1976 US standard atmosphere, and mid-latitude winter conditions (see in Figure 12), which exceeds 80 % over most wavelengths of interest. The expected Rayleigh scattering is calculated from the MODTRAN’s model. It is necessary to make explicit corrections for aerosols, and we use data from radiosonde data to correct molecular absorption near 770 and 940 nm.

3. Comparison with Lunar Models

3.1. Data Reduction

The spectrometer has observed the Moon nearly 1500 times through three months, and the observation system has produced over 2 T of raw data. For lunar observations, we disregard data for nights, which the extinction residuals are excessive and erratic. To accurately obtain the lunar radiance and irradiance, these hyper-spectral image cubes are processed through the several steps as following.

3.1.1. DN Signal Preprocessing

For raw data, the effects of CCD readout smear and dark signal on images are inherent when using the frame-transfer type sensor for sequence acquisition. To eliminate the above effects, these effects are subtracted from all slit image frames
D N 0 ( λ k ) = D N r a w ( λ k ) D N d a r k ( λ k ) , D N ( i ) = D N 0 ( i ) D N s m e a r ( i ) ,
where D N is the pixel value of the raw image, D N s m e a r is pixel value introduced by the smear effect, related to the transfer process (i-th pixel), D N d a r k is the average ‘dark’ digital number related to wavelength λ k . These raw images keep the shadowed area of CCD-array, which can be used for correction of bias levels.
In normal operation, the spatially and spectrally resolved lines are obtained on the detector arrays. In the spectral dimension, the spectrum shift correction is operated to match the minimum integer value, which has been detectable by the external system, with the result of spectral calibration. The rounding value between the results of measuring and spectral calibration is
V a l u e   ( λ i ) = r o u n d   ( P m e a s u r e ( λ i ) P c a l i b r a t i o n ( λ i ) ) ,
where P m e a s u r e is the pixel position using the Gaussian fitting method for some characteristic spectrum lines, P c a l i b r a t i o n is the pixel position of the spectral calibration for the corresponding wavelength. In the CCD detector, the pixel position P ( λ ) after the spectrum correction is
P ( λ ) = P c a l i b r a t i o n ( λ ) + V a l u e ,
The effective region of each slit image is obtained under spectral and spatial selection, and the ensemble of these one-dimensional slit images constitutes a two-dimensional image. Full-disk operational images having a rectangular field of regard which includes the deep space in the margins and corners are recorded.

3.1.2. Radiometric Calibration and Atmosphere Correction

The CCD correction has been implemented in the lunar imaging application. For lunar measurements, the spectrometer can provide the integral time ranging from 80 to 5000 ms, and it is a good linear relationship between the radiance response and integral time. The DN of each pixel in one slit image is reduced to the top-of-atmosphere radiance R i , k T O A at the wavelength λ k
R i , k T O A = D N i , k C i , k T int × 1 T E k a t m ,
where C i , k is the radiometric response of each detector element in radiance per data-number in k band, and T int is the integration time.

3.1.3. Over-Sampling Correction

The scan rate of the instrument in the along-track direction causes an elongated lunar image, in other words, the Moon is oversampled during the measurement. However, the lunar irradiance measurement from a radiance image requires accurate knowledge of the oversampling factor across the Moon [23]. The oversampling factor normally presumed to be the same for all the bands
f o v e r s a m p l e = p moon v t r a c k T s c a n = ψ instantaneous ω × 1 T int + T shift ,
where p m o o n is the pixel size of the detector on the lunar surface, T s c a n is the time of one scan, and v t r a c k is the projection of the velocity of the detector on the lunar surface along the track direction. ψ instantaneous is the instantaneous field of view in the scanning dimension, ω is the apparent angular velocity of the ground, T int is the integration time, and T shift is the CCD frame transfer time. During lunar measurements, the program computes the oversampling factor. For a constant angular velocity of the Moon, the oversampling factor depends upon the scan time T s c a n . In the scanning dimension, the oversampling correction for lunar radiances has the form of
R i , j , k r e a l = R i , j , k T O A f o v e r s a m p l e ,
where R i , j , k T O A is an individual radiance measurement (i.e., pixel) in one lunar disk, and R i , j , k r e a l is an individual radiance measurement (i.e., pixel) after oversampling correction, which is output in radiance units, W/m2nm1sr1. The oversampling factor is applied to these radiance images to remove this noninstrumental effect made by Equations (8) and (9), as best as possible.

3.1.4. Radiance to Irradiance

These images include both the elliptical lunar region and a surrounding region of black space. The sky background brightness was only measured radially away from the Moon, and the level of which has zero average radiance. When the oversample factor is known, the irradiance derived from the integration of lunar radiance image is
I i n s t r u m e n t T O A ( λ k ) = Ω i = 0 N t r a c k j = 0 N c r o s s R i , j , k r e a l ,
where N t r a c k is the pixel numbers along the track direction, N c r o s s is the pixel numbers in the spatial dimension, and the solid angle Ω of one pixel in the raw image is
Ω = ψ c r o s s t r a c k × ψ instantaneous ,
where ψ cross track is the nominal angular size of a pixel in spatial dimension, ψ cross track = 0.00303 ° .
After the above processing, the lunar spectral irradiances in different phase angles are shown in Figure 13. Values near 760 and 940 nm show anomalous deviations due to atmosphere correction, spectrum shift, and bandwidth for strong atmosphere molecular absorption.

3.2. Uncertainty Assessments

To improve the accuracy of the measurements and ensure the information reliability, the scientific analysis of the major contributors to uncertainty derived from the development approaches includes absolute calibration, atmospheric extinction, oversampling factor, and spectrum shift as follows.
Derived from the algorithm in Section 3, the lunar disk is reduced to the TOA spectral irradiance I i n s t r u m e n t T O A ( λ k ) at the wavelength λ k
I i n s t r u m e n t T O A ( λ k ) = Ω ( i = 0 i = N c r o s s 1 j = 0 j = N t r a c k 1 D N i , j , k ) C T int f o v e r s a m p l i n g T E k a t m = ψ c r o s s t r a c k ω ( T int + T s h i f t ) T int × i = 0 i = N c r o s s 1 j = 0 j = N t r a c k 1 D N i , j , k C i , k T E k a t m ,
where D N i , j , k is a pixel value corrected for dark current, and smear for one lunar disk in k band.

3.2.1. Scan Mode

The scan mode of the imaging spectrometer is well-suited to lunar observations, and it gives the simplest presentation of the measurements and introduces a few complications to the data processing. Within one lunar disk, the variation in angular velocity is 0.01% [17], and the linear goodness of fit of moon trajectory almost is more than 99.8% in all the observed zenith angles [17]. Therefore, the uncertainty in the moon trajectory can be negligible. When the spectrometer slit is perpendicular to the moon movement trail, the push-broom instrument in the instrument coordinate system can be modeled as a pinhole camera moving along a linear trajectory in space with a constant velocity and a fixed orientation within one lunar disk. The lunar apparent angular velocity ω of the ground is calculated by the Solar and Moon Position Algorithm, the uncertainty in the angular velocity is estimated to 0.8% by using the lunar images of the imaging monitor. Due to the polar alignment adjustment of the mount and optical system alignment, the spectrometer slit is not completely perpendicular to the movement direction of the Moon. The Moon’s movement can result in the image tilt (less than 4°), and the maximum 0.24 % (= 1 − sin (96°)) of variance error is introduced in the angular velocity, which is used for oversampling factor calculation [24].

3.2.2. Absolute Scale

For the lamp–plate system, the uncertainty associated with hemispherical reflectivity and Lambertian characterization is 1.0%. The uncertainty of the QTH lamp, which is measured by high temperature blackbody, is approximately 1.0%. For the absolute calibration, we neglect the small value in the distance between the diffusing screen and calibration source. Therefore, the uncertainty in the NIM-based radiometric calibration can be held to better than 1.5%. The spectrometer is in the linear zone of the CCD detector in normal operation. The linearity of the CCD detector is measured in the laboratory, and the maximum 0.5% contribution to the uncertainty which is independent of wavelength is introduced. The radiometric stability of the spectrometer is better than 0.5%. For the imaging spectrometer, the uncertainty in stray light sets an upper limit on our knowledge of 1.5%. In this section, the various uncertainties are provided by the instrument manufacturer.

3.2.3. Spectrum Shift Correction

The SRFs have been measured through the full optical system using the integrating sphere fed by tunable lasers. Due to the environment temperature, spectrum shift can continually change throughout a given night for the prism spectrometer. Normally, the drift-magnitude is estimated to be less than 1 pixel in the wavelength scale using a mercury lamp to monitor the spectrum lines. A minimum integer value is shifted to match the lunar spectrum with the result of the spectral calibration, and the spectrum shift correction shows the estimate of the residual error is less than 0.5 pixels. The difference between TOA irradiances when value = X and value = X + 1 from Equation (6) is obtained to estimate the shift-related uncertainty, and the uncertainty is approximately 0.9% in the absolute irradiation measurements for all bands, except absorption bands. The sub-pixel correction for spectrum shift will be made in the future processing. Preliminary results show wavelength shifts of up to several nanometers from the spectrum lines, providing a check on the wavelength shift method.

3.2.4. Atmospheric Correction

In order to achieve the required accuracy for ground-based lunar measurements, we must ensure the atmospheric effects are well quantified with validated low uncertainties. Excellent seeing was obtained in site by the imaging monitor using the stars, and could be as good as 1”. The observations using LIDAR system and other atmospheric characterization tools have quantified atmospheric variability and homogeneity, and separate analysis of the nightly extinction calculations has been shown in Figure 11. The AOD is an important factor for atmospheric correction, and the atmosphere condition in the night was excellent in site for the most of observational days. The maximum zenith angles are from 8.6° to 31.4° for all the observational days. For the uncertainty in the atmospheric correction, we can empirically estimate the effect of an error in its assumed value. For the Lidar, when the AOD is 0.05 at 550 nm and its variation is equal to 0.012, this term contributes 0.6–1.7% to the whole transmission spectra at 10° zenith angle generated by MODTRAN 4.3 for all bands, except absorption bands. For barometric pressure and temperature, we estimate a 0.8% contribution to the uncertainty using MODTRAN and data of radiosonde balloons and atmospheric sounders. The uncertainty associated with transmission spectra generated by MODTRAN software is 1% [25].

3.2.5. Irradiance

In Equation (10), the uncertainty in the summation to irradiance is derived from the cumulative errors in determining the detector counts with respect to the observation—including detector artifact corrections and sky background subtraction—and the uncertainty of these effects is estimated to less than 0.2% for all bands. For the lunar irradiance, accurate knowledge of pixel solid angle is required. In Equation (12), the IFOV ψ instantaneous in the solid angle and oversampling factor cancels out each other, so the lunar irradiance measurements only rely on the ψ cross - track . To determine the ψ cross - track of the spectrometer, the imaging size of line pair of the porro board imaged on the CCD detector was measured by using the collimator in the optical system, and the uncertainty in ψ cross - track is estimated to 0.3%, derived from the instrument manufacturer. For the frame frequency, we estimate a 0.4% contribution to the systematic uncertainty using time interval and frame number of data. The oversampling factor is a wavelength-independent correction factor that accounts for the lunar irradiance, which is related to angular velocity (see Section 3.3.1), frame frequency and ψ cross - track , and this term contributes 1.0 % for all bands in Equations (8) and (9). The composite uncertainty of file record time misalignments and instrument operation is estimated to approximately 0.2%.
In Figure 13, the bottom panel shows the stability of the measurement with the wavelength is approximately less than 0.4% in the VNIR (not absorption bands). The stability of the ROLO model in the same condition is 0.18% near phase angle −11°. The actual stability of measurement, which is not related with intensity of the observed target and atmospheric homogeneity and variability within 30 min, is better than the 0.4%.
The uncertainty sources are generated at all stages of the data reduction from raw images. The Table 4 lists the uncertainty sources in the determination of lunar irradiance, with uncertainty values averaged over all the bands, except absorption bands, given as percent relative. Assuming all sources of errors to be independent, the overall uncertainty from all errors in the lunar irradiance is estimated to be approximately 3.33% by adding them in quadrature. The dominant sources of uncertainty are derived from atmosphere extinction, absolute calibration, sampling, and instrument performance. In order for the lunar observations to be a useful calibration dataset, a thorough understanding of the uncertainties is critical.

3.3. Model Comparison

The most frequently used photometric model is reported by the Robotic Lunar Observatory (ROLO) project [10,26], and this lunar model is based on an extensive database of radiance images acquired by the United States Geological Survey. The comparison in different space-borne instruments indicates that the stability of the ROLO irradiance model in the primary geometric variables is currently better than 1% [10]. The absolute scale of this model against SI radiometric units is deemed to have an uncertainty of 5–10% [10,27]. Since the reflectance spectral features of the Moon are broad and shallow, the wavelength interpolation derived from the lunar model is calculated in reflectance spectrum, using a linear interpolation between the ROLO wavelengths, with an additional factor that maintains the detailed shape of the Apollo reference spectrum. The variation in total solar irradiance over time is negligible (approximately 0.2%), and the disk reflectance of this lunar model is reduced to the measured irradiance at the actual distances (Sun–Moon and viewer–Moon distance). The comparison requires that the instrument–Moon and Moon–Sun distances, phase angles, and zenith angles are calculated from the double-precision ephemeris SPICE toolkit for lunar observations.
In the interest of enabling quantitative nighttime multispectral applications, Miller–Turner [28] has developed a lunar irradiance model (MT2009) by incorporating solar source observations from Solar Radiation and Climate Experiment, lunar spectral albedo data, and phase functions derived from Lane and Irvine [29]. The model accounts for the time-varying celestial geometry and lunar phase, and 1-nm resolution irradiance spectra ranging from 0.3 um to 2.8 um are produced at a given time. For the MT2009 model, the scattering property on the surface of the Moon is assumed to be Lambertian, and the uncertainty is estimated to be 7–17% [28].
Three-month observations in Lijiang were used to evaluate the current lunar radiometric model at the same geometry and effective wavelength. Before comprised with spectrometer bands, the lunar model is convoluted with the spectrometer RSRs to yield sensor-specific TOA irradiance to the effective wavelength for a nominal lunar spectrum.
I m o d e l , k = λ 1 λ 2 I M ( λ ) R S R k ( λ ) d λ λ 1 λ 2 R S R k ( λ ) d λ ,
where I M ( λ ) is the spectral irradiance of the lunar model for the band λ , and I mod e l ( λ k ) is effective spectral irradiance of the lunar model.
The results of the comparison between the measured irradiance and lunar model are given as the difference in percent,
P k = ( I i n s t r u m e n t , k T O A I m o d e l , k 1 ) × 100 ,

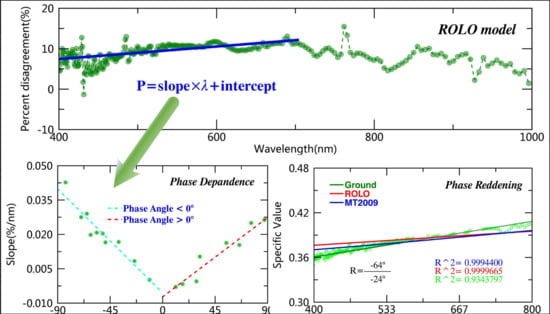
3.3.1. Difference from ROLO Model

The inherent stability of the lunar surface reflectance is estimated at better than 10−8 per year [1]. With this level of stability, the lunar measurement/model comparison based on the imaging spectrometer can validate the relative precision of the ROLO model under the same observational conditions. The lunar disk measurements around the maximum zenith angle in different night are primarily focused and analyzed for the next comparison. For different wavelengths, the specific values with phase angle between measured irradiance and ROLO model are also shown in Figure 14. There is a little scatter in the data with respect to the fitting curves, with relative standard deviations of approximately 1–3% in the VNIR from the bottom panel in Figure 15. The pattern in this scatter is nearly the same for each band. Values near 760 and 940 nm show anomalous deviations due to strong atmosphere molecular absorption. The relative standard deviations (or coefficients of variation) of the specific values ranging from 450 to 900 nm are less than the other wavelengths. Despite the variation in lunar irradiance of nearly an order of magnitude between half-moon and near full Moon, it shows the 18-day measurements from the bottom panel in Figure 15 appeared to contain a relative difference of 2 % over most wavelengths of interest, and may be associated with the atmospheric correction, spectrum shift, or ROLO model error.
In the upper panel from Figure 15, the mean discrepancy between the measured lunar irradiance and ROLO model is up to about 8.6% in the whole spectrum, as derived from different methods in absolute calibration. The results are similar to comparison between most of the space-borne instruments and the ROLO model which show the instrument irradiance to be approximately 8% higher than the ROLO model from 400 to 1000 nm [10,30]. According to Velikodsky et al. [31], the percent disagreement between earth-based instrument and the ROLO model is up to approximately 13% in 603 nm. Large discrepancies in some other spectral regions of the lunar spectrum are mainly due to strong atmosphere molecular absorption (oxygen and water vapor) in the atmospheric path. The percent disagreement at 700 nm is the maximum (approximately 11.2%) within 400 to 860 nm. The maximum position and spectral shape of the percent disagreement are similar to that of most spacecraft-reported observations [30]. It shows very good agreement in the whole spectral region from comparison between the instrument and ROLO model.

3.3.2. Band to Band Stability

Lunar band ratio (LBR) [32,33] is calculated as a ratio between lunar observations of different spectral bands during the same scan. Comparison between lunar measurement and ROLO model is made by using the LBR method, and the results of both are normally consistent. Therefore, the method is used to reveal band to band stability of the ROLO model. The LBR of the lunar model between two bands is characterized by lunar irradiances with phase angle. For all the observational phase angles, we select lunar spectral irradiances at a wavelength λ 0 , to be the standard values, and the LBR of the lunar irradiances between the wavelength λ and wavelength λ 0 , is defined as
L B R i n s t r u m e n t ( θ , λ | λ 0 ) = I i n s t r u m e n t T O A ( θ , λ ) I i n s t r u m e n t T O A ( θ , λ 0 ) ,
L B R m o d e l ( θ , λ | λ 0 ) = I mod e l ( θ , λ ) I mod e l ( θ , λ 0 ) ,
where θ is the phase angle, λ 0 = 700 n m , L B R i n s t r u m e n t is the ratio of the lunar irradiance I i n s t r u m e n t T O A ( θ , λ ) to I i n s t r u m e n t T O A ( θ , λ 0 ) , and L B R m o d e l is the ratio of the lunar irradiance I mod e l ( θ , λ ) to I mod e l ( θ , λ 0 ) . The lunar irradiances for all the bands are scaled to absolute photometry at the wavelength λ 0 , respectively for the ground-based measurements and lunar model. The specific value R ( θ , λ | λ 0 ) between L B R i n s t r u m e n t with L B R i n s t r u m e n t is expressed as
R ( θ , λ | λ 0 ) = L B R i n s t r u m e n t L B R m o d e l ,
In Figure 16, the top panel shows the specific values R ( θ , λ | λ 0 ) , which suggest a fundamental in consistency in the LBR of the lunar model input from lunar measurements. For the specific value R ( θ , λ | λ 0 ) , there are minor differences which appear to be related to the wavelength. For each band, the bottom panel gives the mean values and coefficients of variation of the LBR comparison distributions (top panel). In the bottom panel, there is a linear trend with wavelength in the mean values of the specific value R ( θ , λ | λ 0 ) before and after 700 nm, except absorption bands. From Figure 15 and Figure 16, we find the mean values of R ( θ , λ | λ 0 ) and P k have the same spectral shape. The shape of the mean values of the specific value R ( θ , λ | λ 0 ) is almost invariable with the standard wavelength λ 0 . For the 18-day observations, there is a similar trend for coefficients of variation in Figure 15 and Figure 16. However, the coefficients of variation from the specific value R ( θ , λ | λ 0 ) are closely related to the standard wavelength λ 0 , and they become larger with | λ λ 0 | .
The LBR analysis reveals that the agreement in the R ( θ , λ | λ 0 ) with respect to the standard wavelength λ 0 is less than 2% over most wavelengths in the VNIR, even though coefficients of variation are associated with atmospheric correction, spectrum shift and ROLO model error. For one reference band, the LBR trending of ROLO model agrees well with that of ground-based lunar measurements. It indicates that these are the same tendency of the change rate between two bands with phase angle for the ROLO model and measurement. The LBR analysis indicates this method can be used to reveal the band to band stability of the lunar model.

3.3.3. Phase Angle Dependence

From SeaWiFS and PLEIADES data sets, a phase-dependent difference between the lunar measurements and the ROLO model was observed with the spectrum. For each observation, there is a similar shape of the percent disagreement with the upper curve from the bottom panel in Figure 11. The percent disagreement is gradually increasing with wavelength before 700 nm and decreasing with wavelength after 700 nm except absorption bands. Therefore, the linear regression P f i t 1 of the scatters before 700 nm is expressed as
P f i t 1 ( λ , θ ) = a ( θ ) λ + b ( θ ) { 400   nm < λ < 700   nm 90 ° < θ < 90 ° ,
where the slope a ( θ ) at phase angle θ has units of percent per 1 nm, and b ( θ ) is the intercept of the linear regression at phase angle θ .
Figure 17 shows the slopes from Equation (18) over the 18 days of measurements. The slopes of the percent disagreement with phase angle are irrelevant to the calibration coefficient. It does not appear to be associated with the atmospheric extinction correction, because the AOD is independent of the lunar phase in different days. Therefore, the consistency of the ROLO model is relevant to the lunar phase. There is a significant linear trend in the slope with phase angle (negative and positive) for all the lunar observations, so the linear regression of the scatters is expressed as
a f i t ( θ ) = { A 1 θ + B 1 0 > θ > 90 ° A 2 θ + B 2 0 < θ < 90 ° ,
where θ is lunar phase angle, A 1 , A 2 are the slope of a ( θ ) with phase angle, and B 1 , B 2 are the intercept of a ( θ ) with phase angle.
There is a significant linear trend in the intercept with phase angle (negative and positive) for all the lunar observations, therefore the linear regression of the scatters is expressed as
b f i t ( θ ) = { C 1 θ + D 1 0 > θ > 90 ° C 2 θ + D 2 0 < θ < 90 ° ,
where C 1 , C 2 are the slope of b ( θ ) with phase angle, and D 1 , D 2 are the intercept of b ( θ ) with phase angle.
Based on Equations (18)–(20), the fitting percent disagreement P f i t 2 between measurements and ROLO model is expressed as
P f i t 2 ( λ , θ ) = a f i t ( θ ) λ + b f i t ( θ ) { 400   nm < λ < 700   nm 90 ° < θ < 90 ° ,
From the slope a ( θ ) with phase angle, the variation of the slopes a ( θ ) during the waxing Moon is more than that during the waning moon. For the 400–700 nm, the slope is close to zero near full moon, and the agreement of the ROLO lunar irradiance model near full moon is better than that at the other lunar phase. It is not a good linear trend for the percent disagreement from 700 to 1000 nm, but there is the same shape of the slope similar with that in Figure 17.
Therefore, the tilt of the whole spectral shape of the percent disagreement increases with phase angle (absolute value). The specific values between measured irradiance and lunar model show a significant reddening as the phase angle (absolute value) increases from 10° to 90°. In other words, the consistency between the ROLO model and measured data is related to the lunar phase. The fitting difference from Equations (18) and (21) at 700 nm is shown in Figure 17c, respectively, and it result shows that the ROLO model has the phase angle dependence from the comparison with the measured data. Percent disagreement in one wavelength with lunar phase is shown in Figure 17c, and the phase angle dependence in different spectrum can be simply expressed by Equation (21).

3.3.4. Comparison between Lunar Models

In Figure 18, results of absolute scale comparisons of measured irradiance with ROLO/MT2009 model are shown in different lunar phase and wavelength. Measurement/model differences in 600 nm with lunar phase angle are shown in the upper plot. The result indicates the ROLO model is more stable than MT2009 in a wavelength consistency of radiometric scales. Compared with the ROLO model, the MT2009 model derived from many data sources does not account for the libration effect on the lunar irradiance [28], which may result in the difference of irradiances in between waxing and waning lunar phases. Therefore, lunar calibration using the ROLO model can provide sensor temporal response trending/correction for spacecraft instruments.

3.3.5. Phase Reddening

The reflectance properties predicted by the lunar model and ground-based data is the change of color with lunar phase [22,29,34,35], and the Moon appears redder away from the full Moon [29]. The ‘reddening’ of the Moon is an effect that produces an increase of the spectral slope and variations as the phase angle increases [35]. In Figure 19a, there is a linear trend with wavelength in the specific value between irradiances at the phase angle θ and reference phase angle θ0, therefore the specific value between irradiances I (θ, λ) and I (θ0, λ) is expressed as
K i ( θ | θ 0 , λ ) = I i ( θ , λ ) I i ( θ 0 , λ ) = a i ( θ | θ 0 ) λ + b i ( θ | θ 0 ) R θ i 2 > 99.995 %   ( ROLO )
where θ is the phase angle, θ 0 is the reference phase angle, λ is the wavelength range from 400–1000 nm, a i is the slope and b i is the intercept, i is equal to 1 for imaging spectrometer, i is equal to 2 for ROLO model, i is equal to 3 for MT2009 model, and R2 is the R-square of the linear fitting.
In Equation (22), this is clearly shown by computing model irradiance spectra at various phase angles and normalizing to a spectrum at 24° phase angle. For the 18-day observations, the fitting R-squareds of the specific values with the luanr phase are shown in Figure 19b, and the slope and intercept of the specific value at the phase angle θ are shown in Figure 20a,b, respectively. For the ROLO model, the linearity of fit of the specific value is more than 99.995% in phase angle from −90° to 90°, and it is more than 99.93% for the MT2009 model, which is related with the lunar phase. Values at 760 nm and near 940 nm show anomalous deviations, and we expect the true lunar behavior to be smooth with wavelength.
In Figure 20a, the phase color effect is stronger for the waning Moon at shorter wavelengths and stronger for the waxing Moon at longer wavelengths, which the slopes vary with lunar phase. In Figure 20a,b, the result shows the slope and intercept of lunar models with the phase angle are consistent with that of measured irradiances in the same conditions. Compared with MT2009 model, the result (see Figure 20b) of the ROLO model is well consistent with that of lunar measurements in the phase reddening analysis.
In Figure 20a, difference of the slopes between ROLO model and ground-based measurement is derived from the phase dependence of the lunar model, atmospheric correction and spectrum shift, and the phase dependence is the prime reason. Meygret et al. (2017) [13] reported the phase dependence in waxing lunar phases is more than that in the waning lunar phases, which is the difference between measured irradiance and ROLO model in different phase angle. The phenomenon also appears in Figure 20a, which the difference of the slope in waxing lunar phases is more than that in waning lunar phases.
Lunar models, ROLO model in particular, are compared with lunar measurements in absolute scale, relative difference, model comparison, phase angle dependence, and phase reddening, and these results confirm the results of previous comparisons [10,13,29] between measured lunar irradiances and models. For the analysis of lunar measurements, the absolute difference derives from the respective approaches to the atmosphere correction and radiometric response calibration. The ROLO model is tied to the photometric star Vega for absolute scale, and a set of standard stars is observed regularly to provide atmospheric extinction correction [10]. The measured irradiance is based on a laboratory lamp–plate calibration system and atmospheric characterization tools.

4. Conclusions

To validate the current lunar models, a 3-month observing campaign spanning a wide range of lunar phase has been performed from Lijiang observatory in the VNIR. Much of the observing time and atmospheric characterization tools were assigned to the AOD measurements to determine atmospheric spectral extinction. The raw image is reduced to lunar irradiance and radiance with absolute scale established using a NIM-calibrated lamp as a transfer standard. Compared with the lunar models in absolute and relative accuracy, the ROLO model is better than the MT2009 model, and our measurements are in agreement with independent lunar measurements by most spacecrafts and ground-based instruments. LBR method also provides a useful monitoring tool to verify the relative radiometric stability of bands for the lunar model. For the ROLO model, the consistency of phase angle dependence is well analyzed in the spectrum, and the results indicate the relationship between phase dependence of the model and spectrum. For spectral radiance properties of the Moon, the phase reddening effect of lunar models is analyzed and evaluated in the lunar phase by measurements.
So far, the mission of lunar measurements still continues in the winter and spring in Lijiang, China. As observational data accumulates, the improved radiance scale and atmospheric extinction will be implemented in future versions of the radiance data set, and the understanding of the measurements also continues to develop an improved model of lunar irradiance with continuous spectral coverage, low uncertainty, and traceability to the SI.

Author Contributions

Conceptualization, X.H., P.Z., and S.W.; Data curation, Y.W., Z.L., L.Z., and W.W.; Formal analysis, Y.W., X.H., L.C., Y.H., Z.L., and L.Z.; Funding acquisition, R.W., X.H., P.Z., and Y.H.; Investigation, R.W., Y.W., W.W., and L.C.; Methodology, R.W., X.H., Y.W., and L.C.; Resources, X.H. and Y.H.; Project administration, X.H. and L.C.; Software, Y.W. and L.Z.; Supervision, X.H. and P.Z.; Validation, Y.W., X.H., L.C., L.Z., and P.Z.; Visualization, Y.W.; Writing—review and editing, Y.W. and X.H.; All authors have read and agreed to the published version of the manuscript.

Funding

This paper was supported by the National Key R & D Program of China (grant nos. 2018YFB0504900, 2018YFB0504901), and the National Natural Science Foundation of China (41871249, 41471302).

Acknowledgments

The authors thank Qingsheng Xue and Weiping Wu of the Changchun Institute of Optics, Fine Mechanics and Physics, Chinese Academy of Sciences for help in development of the Optical design of the imaging spectrometer and operational procedures of the ground-based observation system. The imaging spectrometer was characterized and calibrated by the Anhui Institute of Optics and Fine Mechanics, China, and National Institute of Metrology, China. LIDAR is manufactured by the Beijing Research Institute of Telemetry.

Conflicts of Interest

The authors declare no conflict of interest.

References

  1. Kieffer, H.H. Photometric stability of the lunar surface. Icarus 1997, 130, 323–327. [Google Scholar] [CrossRef]
  2. Ohring, G.; Tansock, J.; Emery, W.; Butler, J.; Flynn, L.; Weng, F.; Germain, K.S.; Wielicki, B.; Cao, C.; Goldberg, M.; et al. Achieving satellite instrument calibration for monitoring global climate change. Eos Trans. Am. Geophys. Union 2007, 88, 136. [Google Scholar] [CrossRef]
  3. Stone, T.C.; Rossow, W.B.; Ferrier, J.; Hinkelman, L.M. Evaluation of isccp multisatellite radiance calibration for geostationary imager visible channels using the moon. IEEE Trans. Geosci. Remote Sens. 2013, 51, 1255–1266. [Google Scholar] [CrossRef]
  4. Chander, G.; Hewison, T.J.; Fox, N.; Wu, X. Overview of intercalibration of satellite instruments. IEEE Trans. Geosci. Remote Sens. 2013, 51, 1056–1080. [Google Scholar] [CrossRef]
  5. Xiong, X.; Angal, A.; Butler, J.; Cao, C.; Doelling, D.; Wu, A.; Wu, X. Global space-based inter-calibration system reflective solar calibration reference: From aqua modis to S-NPP VIIRS. In Proceedings of the SPIE Asia-Pacific Remote Sensing, New Delhi, India, 4–7 April 2016; p. 98811D. [Google Scholar]
  6. Angal, A.; Mccorkel, J.; Thome, K. Results from source-based and detector-based calibrations of a clarreo calibration demonstration system. In Proceedings of the SPIE Optical Engineering + Applications, San Diego, CA, USA, 28 August–1 September 2016; p. 997206. [Google Scholar]
  7. Lachérade, S. A summary of the joint GSICS—CEOS/IVOS lunar calibration workshop: Moving towards intercalibration using the moon as a transfer target. In Proceedings of the SPIE Remote Sensing, Toulouse, France, 21–24 September 2015; p. 96390Z. [Google Scholar]
  8. Miller, S.D.; Turner, R.E. A lunar spectral flux database for quantitative viirs day/night band environmental applications. In Proceedings of the 4th Symposium on Future National Operational Environmental Satellites, New Orleans, LA, USA, 20–24 January 2008. [Google Scholar]
  9. Barreto, Á.; Román, R.; Cuevas, E.; Berjón, A.J.; Almansa, A.F.; Toledano, C.; González, R.; Hernández, Y.; Blarel, L.; Goloub, P. Assessment of nocturnal aerosol optical depth from lunar photometry at izaña high mountain observatory. Atmos. Meas. Tech. 2017, 10, 3007–3019. [Google Scholar] [CrossRef] [Green Version]
  10. Kieffer, H.H.; Stone, T.C. The spectral irradiance of the moon. Astron. J. 2005, 129, 2887. [Google Scholar] [CrossRef] [Green Version]
  11. Aznay, O.; Fougnie, B.; Lebègue, L. POLO: A unique dataset to derive the phase angle dependence of the moon irradiance. In Proceedings of the SPIE Remote Sensing, Amsterdam, The Netherlands, 22–25 September 2014; p. 924112. [Google Scholar]
  12. Lacherade, S.; Viticchié, B.; Stone, T.; Lebègue, L.; Wagner, S.; Hewison, T. On the phase-angle dependence of the moon calibration results. GSICS Quat Lunar Calibration 2013, 7, 6–7. [Google Scholar]
  13. Meygret, A.; Grosscolzy, L. Improving ROLO lunar albedo model using PLEIADES-HR satellites extra-terrestrial observations. In Proceedings of the SPIE Optical Engineering + Applications, San Diego, CA, USA, 6–10 August 2017. [Google Scholar]
  14. Ohring, G.; Wielicki, B.; Spencer, R.; Emery, B.; Datla, R. Satellite instrument calibration for measuring global climate change: Report of a workshop. Bull. Am. Meteorol. Soc. 2005, 86, 1303–1313. [Google Scholar] [CrossRef]
  15. Moreau, L.; Bourque, H.; Taylor, J.; Veilleux, J.; Grandmont, F.; Girard, F.; Larouche, M. Instrument demonstration effort for the clarreo mission. In Proceedings of the International Conference on Space Optics, Rhodes Island, Greece, 4–8 October 2010; p. 19. [Google Scholar]
  16. Cutter, M.; Fox, N.; Green, P.; Brindley, H.; Russell, J.; Smith, D.; Lobb, D.; Barnes, A. Traceable radiometry underpinning terrestrial and heliostudies (truths): A bencmark mission for climate. In Proceedings of the International Conference on Space Optics, Tenerife, Canary Islands, Spain, 6–10 October 2014; p. 160. [Google Scholar]
  17. Wang, Y.; Huang, Y.; Wang, S.; Li, Z.; Zhang, Z.; Hu, X.; Zhang, P. Ground-based observation system development for the moon hyper-spectral imaging. Publ. Astron. Soc. Pacific 2017, 129, 055002. [Google Scholar] [CrossRef]
  18. Xu, Q.; Zheng, X.; Zhang, W.; Li, J. Radiometric characteristics test of integrating sphere source using wavelength-tunable laser. Acta Optica Sin. 2009, 29, 1310–1314. [Google Scholar]
  19. Young, A.T. Rayleigh scattering. Phys. Today 1982, 35, 42–48. [Google Scholar] [CrossRef]
  20. Lockwood, G.W.; Thompson, D.T. Atmospheric extinction—The ordinary and volcanically induced variations, 1972–1985. Astron. J. 1986, 92, 976–985. [Google Scholar] [CrossRef]
  21. Langley, S.P. The bolometer and radiant energy. In Proceedings of the American Academy of Arts and Sciences; American Academy of Arts & Sciences: Cambridge, MA, USA, 1880; pp. 342–358. [Google Scholar]
  22. Barreto, A.; Cuevas, E.; Damiri, B.; Guirado, C.; Berkoff, T.; Berjón, A.J.; Hernández, Y.; Almansa, F.; Gil, M. A new method for nocturnal aerosol measurements with a lunar photometer prototype. Atmos. Meas. Tech. 2013, 6, 585–598. [Google Scholar] [CrossRef] [Green Version]
  23. Barnes, W.L.; Eplee, J.R.E.; Butler, J.J.; Barnes, R.A.; Patt, F.S.; Meister, G.; McClain, C.R. Seawifs lunar calibration methodology after six years on orbit. In Proceedings of the Optical Science and Technology, SPIE 49th Annual Meeting, Denver, CO, USA, 2–6 August 2004; Volume 5542, p. 1. [Google Scholar]
  24. Lee, S.; Meister, G.; Patt, F.S.; Eplee, R.E. Estimating residual uncertainties for lunar irradiance measurements due to imaging acquisition parameters. J. Appl. Remote Sens. 2019, 13, 014508. [Google Scholar] [CrossRef]
  25. Dai, C.; Wei, H.; Chen, X. Validation of the precision of atmospheric molecular absorption and thermal radiance calculated by combined atmospheric radiative transfer (c10art) code. Infrared Laser Eng. 2013, 42, 174–180. [Google Scholar]
  26. Anderson, J.M.; Becker, K.J.; Kieffer, H.H.; Dodd, D.N. Real-time control of the robotic lunar observatory telescope. Publ. Astron. Soc. Pacific 1999, 111, 737. [Google Scholar] [CrossRef]
  27. Eplee, R.E.; Meister, G.; Patt, F.S.; Franz, B.A. A synthesis of viirs solar and lunar calibrations. Proceedings of SPIE—The International Society for Optical Engineering, San Diego, CA, USA, 25–29 August 2013; Volume 8866. [Google Scholar]
  28. Miller, S.D.; Turner, R.E. A dynamic lunar spectral irradiance data set for NPOESS/VIIRS day/night band nighttime environmental applications. IEEE Trans. Geosci. Remote Sens. 2009, 47, 2316–2329. [Google Scholar] [CrossRef]
  29. Lane, A.P.; Irvine, W.M. Monochromatic phase curves and albedos for the lunar disk. Astron. J. 1973, 5, 293. [Google Scholar] [CrossRef]
  30. Stone, T.C.; Kieffer, H.H. Use of the moon to support on-orbit sensor calibration for climate change measurements. In Proceedings of the SPIE Optics + Photonics, San Diego, CA, USA, 13–17 August 2006; Volume 62969, p. 62960Y. [Google Scholar]
  31. Velikodsky, Y.I.; Opanasenko, N.V.; Akimov, L.A.; Korokhin, V.V.; Shkuratov, Y.G.; Kaydash, V.G.; Videen, G.; Ehgamberdiev, S.A.; Berdalieva, N.E. New earth-based absolute photometry of the moon. Icarus 2011, 214, 30–45. [Google Scholar] [CrossRef]
  32. Cao, C.; Vermote, E.; Xiong, X. Using avhrr lunar observations for ndvi long-term climate change detection. J. Geophys. Res. 2009, 114. [Google Scholar] [CrossRef] [Green Version]
  33. Shao, X.; Choi, T.; Cao, C.; Blonski, S.; Wang, W.; Ban, Y. Trending of suomi-NPP VIIRS radiometric performance with lunar band ratio. In Proceedings of the SPIE Asia Pacific Remote Sensing, Beijing, China, 13–16 October 2014; Volume 92610, p. 92640K. [Google Scholar]
  34. Hapke, B. Theory of Reflectance and Emittance Spectroscopy; Cambridge University Press: Cambridge, UK, 2012. [Google Scholar]
  35. Sanchez, J.A.; Reddy, V.; Nathues, A.; Cloutis, E.A.; Mann, P.; Hiesinger, H. Phase reddening on near-earth asteroids: Implications for mineralogical analysis, space weathering and taxonomic classification. Icarus 2012, 220, 36–50. [Google Scholar] [CrossRef] [Green Version]
Figure 1. Observation site, atmospheric characterization tools and structure chart of the ground-based observation system. (13) are used for extinction correction, and the observation system composed of (46) is used to obtain the imaging photometric observations of the Moon.
Remotesensing 12 01878 g001
Figure 2. Accurate pointing setting of the imaging spectrometer. (1) Calibration point of the optical axis parallelism; (2) Initial point of the moon imaging.
Remotesensing 12 01878 g002
Figure 3. Lunar phase and libration coverage.
Remotesensing 12 01878 g003
Figure 4. Lunar images at 550 nm in different lunar phases.
Remotesensing 12 01878 g004
Figure 5. Lunar cross-comparison of CE-318U and imaging spectrometer. (a) Lunar cross-comparison in different wavelengths on December 24, 2015. (b) Lunar cross-comparison in the different days at 500 nm. The phase angle in (b) near the zenith is −51°, −24°, 17°, and 61°, respectively. The ordinate is the normalized disk-integrated signal.
Remotesensing 12 01878 g005
Figure 6. Normalized specific value of the CE-318U and imaging spectrometer with lunar phase. The ordinate is the normalized specific value D.
Remotesensing 12 01878 g006
Figure 7. Spectral response of the imaging spectrometer at some bands, normalized to 1.0 maximum. The ordinate is the normalized value of the spectral response.
Remotesensing 12 01878 g007
Figure 8. Spectrum shift monitoring using a mercury lamp for the prism spectrometer. The x-axis is the array number in spectrum dimension for the bottom panel, and the x-axis is the wavelength for the upper plot. There is the same y-axis (intensity) for two figures, the data of which (green lines) derives from the same test. The mercury measurements at two temperature spots are respectively plotted in green and red lines, and the spectrum drift Δ is shown between two tests, the value of which is only amplified to illustrate the phenomenon. The eight characteristic spectrum lines (A, B, C, D, E, F, G, H, I), which are labelled in the bottom panel, are evenly distributed across the wavelength range from 400 to 1000 nm. The light from the lamp passes through the parchment paper, and the lens of fore-telescope system is fully filled with light. The specific values between intensity from the different spectrum lines are different in different test conditions.
Remotesensing 12 01878 g008
Figure 9. Radiometric calibration of the imaging spectrometer. (a) Schematic diagram of lamp–plate calibration system; (b) aperture slot setting; (c) spectral radiance responsivity. The aperture slot (3) is fixed onto the diffusing screen from (a,b), and the light from the effective area (green area in (b)) is able to be put into the spectrometer.
Remotesensing 12 01878 g009
Figure 10. Spatial and temporal evolution of the lidar in the night. The color bar represents the extinction coefficient, and its unit is m−1.
Remotesensing 12 01878 g010
Figure 11. Aerosol optical depth (AOD) of lunar-photometer CE-318U, Sun-photometer CE-318 and AMPLE for lunar observations in Lijiang city. The combined lidar, sun-photometer, and lunar-photometer system was implemented in site and checked to derive the nighttime aerosol backscatter and extinction data products.
Remotesensing 12 01878 g011
Figure 12. Spectra of the components of atmospheric extinction. Total transmission spectra resulting from the minimal atmospheric extinction (AOD = 0.03) and our radiosonde profiles are shown as a blue solid line. Water vapor, ozone, and molecular scattering are shown as the green, cyan, and lime solid lines, respectively. The total transmission from Equation (3) is shown as the red dash-dotted line.
Remotesensing 12 01878 g012
Figure 13. TOA spectral irradiance and stability of the measurement. The upper panel shows the lunar irradiance in different phase angles. The bottom panel shows the stability of the measurement with the wavelength in different phase angles, which is coefficient of variation of 11 measurements (TOA irradiance) within 30 min.
Remotesensing 12 01878 g013
Figure 14. Comparison of lunar irradiances with the USGS model in different wavelengths. The vertical coordinate is dimensionless, and it shows the specific value between the measured irradiance and lunar model. Over the 3-month course of the mission, the imaging spectrometer has made observations at phase angles from 6° to 85°, and the plot symbols represent 465.39, 486.67, 544.17, 553.02, 664.81, 692.85, 702.81, 746.01, 773.83, 864.66, 874.69, and 884.89 nm for a lunar spectrum in the spectrometer bands, which are similar to the ROLO bands.
Remotesensing 12 01878 g014
Figure 15. Lunar irradiance comparison of the measurements with the ROLO model. In the upper panel, the plot ordinate is the mean discrepancy between the measured lunar irradiance and lunar model output and expressed as a percentage difference from unity. The fitting line from 400 to 700 nm is a red-dotted line. In the bottom panel, the plot ordinate is the coefficients of variation of percent disagreement.
Remotesensing 12 01878 g015
Figure 16. Comparison of the measurements with ROLO lunar model in the lunar band ratio. For the top panel, lunar spectral irradiance is normalized to 700 nm, and the bands are 465.39, 486.67, 544.17, 553.02, 664.81, 692.85, 702.81, 746.01, 773.83, 864.66, 874.69, and 884.89 nm. For the bottom panel, the upper curve is mean values (circle dashed line) of the scatter (top panel) for all the bands, and the lower curve is the coefficient of variation (triangular dashed line) of the scatter.
Remotesensing 12 01878 g016
Figure 17. Linear trend of the percent disagreement with phase angle. (a) Intercept of the percent disagreement. (b) Slope of the percent disagreement. (c) Percent disagreement from linear trends. For each observation, the slopes a ( θ ) and b ( θ ) of the percent disagreement ranging from 400 to 700 nm are shown in green scatter, respectively. The fitting lines before and after full moon respectively are cyan and red dashed lines. In Figure 17c, the fitting difference from Equation (18) between measurement and ROLO model is in green scatter, and the fitting difference from Equation (21) at 700 nm is indicated via the red line.
Remotesensing 12 01878 g017
Figure 18. Comparisons of the measurements with the ROLO and MT2009 model. The upper panel shows the percent difference with lunar phase at 600 nm, and the bottom panel shows the percent difference with wavelength at phase angle = −24°. For the ROLO model, the fitting line for the 400–700 nm is a blue-dashed line.
Remotesensing 12 01878 g018
Figure 19. Change of lunar color with phase angle. (a) phase reddening effect between different irradiances. The red line is the ROLO model, the green line is the MT2009 model and light green circles are the ground-based data. (b) fitting R-squared of the specific value with the luanr phase. Values are derived from multiple observations of the Moon in Lijiang city.
Remotesensing 12 01878 g019
Figure 20. Comparison between measurements and models in phase reddening. (a) Intercept of the specific values as a function of lunar angle θ , and (b) slope of the specific values as a function of lunar angle θ . Three color symbols represent ROLO model, MT2009 model, and ground-based measurement.
Remotesensing 12 01878 g020
Table 1. Normalized specific value and coefficients of variation.
Wavelength (nm)Lunar Phase (degree)Coefficients of Variation (CV)
−51.3−37.8−24.1−11.217.1
4400.99201.00431.00760.99750.99870.61%
5001.00251.00731.00150.99960.98920.67%
6771.00201.00191.00510.99950.99150.51%
8700.99990.99971.00640.99980.99420.43%
Table 2. Spectrum shift monitoring using a mercury lamp.
Line Position
(In Figure 8)
Measurement: Gauss Fit
(Pixel)
Drift Distance Δ(Pixel)
T0T1T2T1-T0T2-T0
A668.80668.05667.65−0.76−0.40
B707.23706.41706.00−0.82−0.41
C794.11793.22792.81−0.89−0.42
D855.96855.08854.61−0.89−0.46
E874.41873.61873.09−0.79−0.52
F885.33884.50883.91−0.83−0.59
H892.08891.16890.65−0.92−0.51
I905.90904.98904.52−0.92−0.46
Table 3. Temperature of difference parts for the prism instrument.
Temperature (°)T0T1T2
CCD detector6.46.46.3
Mechanical framework7.4−1.2−2.3
Prism assembly7.6−1.3−2.4
Focal plane assembly6.3−1.0−2.1
Table 4. Uncertainties tracked during data processing.
Uncertainty SourcesPercent (%)
Oversampling factorAngular velocity 0.8
Orientation of the slit0.24
frame frequency0.4
Angular size ψ cross-track 0.3
Radiometric calibrationStability of the instrument0.5
Linearity of CDD detector0.5
Hemispherical reflectivity and Lambertian characterization1.0
QTH lamp1.0
Stray light\1.5
Spectrum shift\0.9
Atmospheric correction
(not absorption bands)
Variation in AOD 1.7
Barometric pressure and temperature0.8
Software calculation1.0
OthersCumulative errors, wind, file record time misalignments and instrument operation, etc.0.28
Root sum square (of all above)\3.33

