Article

Identifying Ecosystem Function Shifts in Africa Using Breakpoint Analysis of Long-Term NDVI and RUE Data

by
Thomas P. Higginbottom
1,* and
Elias Symeonakis
2
1
School of Mechanical, Aerospace, and Civil Engineering, University of Manchester, Sackville Street, Manchester M13 9PL, UK
2
Department of Natural Sciences, Manchester Metropolitan University, Chester Street, Manchester M15 6BH, UK
*
Author to whom correspondence should be addressed.
Remote Sens. 2020, 12(11), 1894; https://doi.org/10.3390/rs12111894
Submission received: 14 April 2020 / Revised: 3 June 2020 / Accepted: 4 June 2020 / Published: 11 June 2020

Abstract

:
Time-series of vegetation greenness data, derived from Earth-observation imagery, have become a key source of information for studying large-scale environmental change. The ever increasing length of such series allows for a range of indicators to be derived and for increasingly complex analyses to be applied. This study presents an analysis of trends in vegetation productivity—measured using the Global Inventory Monitoring and Modelling System third generation (GIMMS3g) Normalised Difference Vegetation Index (NDVI) data—for African savannahs, over the 1982–2015 period. Two annual metrics were derived from the 34 year dataset: the monthly, smoothed NDVI (the aggregated growth season NDVI) and the associated Rain Use Efficiency (growth season NDVI divided by annual rainfall). These indicators were then used in a BFAST-based change-point analysis, allowing the direction of change over time to change and the detection of one major break in the time-series. We also analysed the role of land cover type and climate zone as associations of the observed changes. Both methods agree that vegetation greening was pervasive across African savannahs, although RUE displayed less significant changes than NDVI. Monotonically increasing trends were the most common trend type for both indicators. The continental scale of the greening may suggest global processes as key drivers, such as carbon fertilization. That NDVI trends were more dynamic than RUE suggests that a large component of vegetation trends is driven by precipitation variability. Areas of negative trends were conspicuous by their minimalism. However, some patterns were apparent. In the southern Sahel and West Africa, declining NDVI and RUE overlapped with intensive population and agricultural regions. Dynamic trend reversals, in RUE and NDVI, located in Angola, Zambia and Tanzania, coincide with areas where a long-term trend of forest degradation and agricultural expansion has recently given way to increases in woody biomass. Meanwhile in southern Africa, monotonic increases in RUE with varying NDVI trend types may be indicative of shrub encroachment. However, all these processes are small-scale relative to the GIMMS NDVI data, and reconciling these conflicting drivers is not a trivial task. Our study highlights the importance of considering multiple options when undertaking trend analyses, as different inputs and methods can reveal divergent patterns.

1. Introduction

The grasslands and savannahs of Africa are hot-spots of contemporary environmental change. Rainfall across the continent varies on decadal time scales, with prolonged droughts impeding vegetation in water-limited regions [1]. In addition, the population of Africa has grown by roughly 850 million people since 1980, transforming the intensity and distribution of land use activities, such as, fuelwood harvesting, animal husbandry and farming [2,3,4]. How savannah ecosystems respond to these climatic and anthropogenic pressures has major implications for livelihoods, biodiversity, and biogeochemical cycling. One of the most ubiquitous tools for monitoring continental-scale ecosystem function is temporal trends in vegetation index data, and in particular, the Global Inventory Monitoring and Modelling System (GIMMS) Normalised Difference Vegetation Index (NDVI) dataset, derived from imagery acquired by the Advanced Very High Resolution Radiometer (AVHRR) sensor [5,6,7]. Compared to contemporary data records, such as the Moderate Resolution Imaging Spectroradiometer (MODIS) or Landsat collections, AVHRR-derived datasets appear somewhat basic, with broad spectral channels, coarse resolution pixels, and limited options for atmospheric correction [8]. However, for regional to continental scale studies, AVHRR offers unparalleled temporal and spatial coverage, providing the only globally consistent satellite data record extending into the early 1980s.
NDVI is sensitive to changes in the Net Primary Productivity (NPP) of savannahs and grasslands, as they do not feature the dense forest canopies that saturate optical imagery signals [9,10]. This sensitivity, combined with the limited historical coverage of other Earth-observation archives, has made AVHRR-NDVI data a key indicator of environmental change in Africa. In the 1970s and 1980s, the Sahel region experienced one of the most prolonged and intense droughts of the 20th century, with annual rainfall decreasing by 50% [1,11]. Ecological changes caused by this drought fuelled a narrative of anthropogenic-driven desertification, focussed on the southwards expansion of the Sahara desert as a consequence of poor land management [12,13]. When the dry period began to abate in the early 1990s, satellite observations of vegetation greening provided regional-scale evidence of the close coupling between climate and vegetation, refuting the anthropogenic desertification theory [6,14,15].
Temporal changes in vegetation indices can be quantified using linear regression models, either by aggregating NDVI to a single annual value or by incorporating a seasonality parameter [7,15]. Alternatively, non-parametric methods can be applied, which have fewer assumptions, and are more suited for noisy time-series than parametric models [16,17]. These methods produce a monotonic trend coefficient for the full time period; however, representing a 35-year series with a single trend is often overly simplistic, as the direction of change may reverse multiple times within this period [18,19]. Accordingly, models that allow the direction of change to shift or reverse have become more prevalent, with the type and timings of breakpoints allowing a more rigorous interrogation of ecological change processes, and potential links to anthropogenic factors [20,21].
In rainfall limited ecosystems, interpreting vegetation dynamics requires decoupling NDVI from rainfall variability. This can be achieved using the Rain Use Efficiency (RUE): the NPP per unit of rainfall [22,23,24,25]. The basis of this measure is that if vegetation declines in synchrony with rainfall, then the RUE will remain constant—indicating stable ecosystem condition. Alternatively, if NPP declines under constant rainfall, the RUE would decline—indicating deteriorating ecosystem condition. Trends in RUE have been used to assess broad level ecosystem condition, while shifts in RUE have been related to the linkages of human and climatic drivers on ecosystem function [20,23,25].
Understanding the changes occurring in African savannah ecosystems is crucial, given their role in providing ecosystem services and livelihoods to millions of people, and their significant contribution to global biogeochemical cycles. In this study, we investigate the ecosystem function of African savannahs using two measures of ecosystem productivity: the growth season NDVI, and the corresponding RUE. Our overarching aim is to understand how vegetation function has evolved during the 1982–2015 period. Towards this aim, we use a trend break analysis to identify the type and timing of shifts in ecosystem function metrics. The shifts are grouped according to their land cover and climate zone in order to identify potential drivers of the observed changes. The results are then discussed in the wider context of environmental and climatic changes occurring in African savannahs.

2. Materials and Methods

2.1. NDVI Data

We used the GIMMS3g NDVI dataset for the period 1982–2015, which is derived from the AVHRR sensors carried on-board the seven National Oceanic and Atmospheric Administration (NOAA) satellites. NDVI is calculated using the standard equation:
N D V I = ( ρ N I R ρ R e d ) ( ρ N I R + ρ R e d ) ,
where, ρ N I R is reflectance in the near infrared range, and ρ R e d is reflectance in the visible red part of the electromagnetic spectrum [26].
The GIMMS3g dataset is generated from AVHRR imagery. The raw daily 1 km pixels are binned into optimum 15-day, 8 km composites. The pre-processing routines include empirical mode decomposition and Bayesian methods to remove non-vegetation related artefacts, such as orbital drift, solar zenith angle effects, and sensor transitions. A radiative transfer model is used to correct for the volcanic aerosol loading caused by El Chichón and Mount Pinatubo eruptions [27].

Productivity Indicators

We processed the raw 15-day GIMMS data into maximum monthly value composites and discarded the months for the incomplete 1981 year, resulting in a 34-year (408 months) time-series. We interpolated missing months and smoothed the series using a Savitzky-Golay filter (parameters: order = 1, length = 3, scaling factor = 30). We then generated an annual aggregation of the NDVI values within the growing season (i.e., the small integral). If a pixel contained two growth seasons, mainly areas in East Africa with bimodal rainfall, both seasons were included.
RUE was calculated as the ratio of growth season NDVI over total annual rainfall, using the Climate Hazards Group InfraRed Precipitation with Station data (CHIRPS) dataset [28]. The CHIRPS data was resampled to match the resolution of the GIMMS NDVI layers using nearest neighbour resampling.
To spatially refine our area of analysis to savannah regions, we calculated the median NDVI using the full monthly time-series and masked pixels with a median NDVI < 0.15 or > 0.8 from further analysis. This removed areas with very low vegetation cover (e.g., the Sahara and Namib deserts) and dense forests (e.g., the Congo and Guinean forests), and is in line with thresholds used in other studies [20].

2.2. Time-Series Analyses

To detect shifts in the productivity indicators we used the Breaks For Additive Season and Trend (BFAST) process [19]. BFAST is a time-series decomposition technique, modelling a time-series using parameters quantifying the within-season fluctuations, the underlying trend, and residual noise. When applied to annually aggregated series, as in this case, the model contains only the trend and residual components. Potential non-linear changes in the decomposed parameters are represented by incorporating piecewise linear model segments. Where a series is better represented by multiple linear segments, opposed to a single monotonic trend, a breakpoint is established and dated using structural change tests.
We used the BFAST01 implementation of BFAST, which produces a model containing either one or zero breakpoints, for both of our productivity indicators [29]. The rationale for limiting analysis to a single breakpoint is that one (significant) break is likely to represent the most ecologically relevant shift in a time-series [20]. We limit break detection to include segments of seven years or longer. Trend changes were identified by four structural change tests: the Bayesian information criterion (BIC), the Lagrange multiplier (SupLM), moving sum of residuals (OLS-MOSUM), and the F-test (supF). A change point was set if any single test identified a significant break ( p < 0.05 ). Breakpoints detected by this process are similar but not synonymous with the concept of ecological tipping points which are generally considered irrecoverable [30]. Here, we use the term ‘ecosystem function shift’ to indicate a significant development in large-scale ecological function, but make no inference on the reversibility of these processes.
Breakpoints identified by the BFAST01 process were classified into change types, based on direction and significance of the constituent linear models and any identified breakpoint. Our classification scheme was largely based on de Jong [29]. As we analyse RUE trends, we do not refer to increasing or decreasing trends as greening or browning, as patterns may be due to rainfall changes, not vegetation condition. We identified the following six change types:
  • Monotonic: increase (a significant increase with no significant break detected);
  • Monotonic: decrease (a significant decrease with no significant break detected);
  • Interruption: increase with negative break (a significant increase with a significant break followed by a significant increase);
  • Interruption: decrease with positive break (a significant decrease with a significant break followed by a significant decrease);
  • Reversal: increase to decrease (a significant increase with a significant break followed by a significant decrease);
  • Reversal: decrease to increase (a significant decrease with a significant break followed by a significant increase).
We applied BFAST01 models on both growth season NDVI and RUE time-series. All analyses were conducted in the R statistical environment [31]. The raster and rgdal packages provided spatial data handling functionality [32,33]. The GIMMS3g data were downloaded and processed using the gimms package [34].Trends were calculated in the bfast package [19]. Finally, generic data handling and plotting functions were provided by the tidyverse and ggplot2 packages [35].

Interpretation of Classified Trends

To analyse the classified trends, we incorporated land cover and climatic zone data to test for broad-scale patterns in the trend types. A land cover map was obtained from the European Space Agency’s Climate Change Initiative (ESA CCI) product. This is series of multi-sensor derived 300 m spatial resolution land cover maps for 1992–2015, designed to be consistent with the United Nations’ Land Cover Classification System [36]. We used a map for the year 2000, as this is broadly central in our time-period. The raw data were reclassified into a simplified typology of five types: grassland, shrubland, croplands, woodlands, and mosaic (heterogeneous mixture of different types). Smaller classes covering urban and wetland areas were discarded. The 300 m layer was resampled to match the NDVI-derived layers using nearest neighbour resampling (Figure 1a).
Climate zone classifications were extracted from the United Nations’ Food and Agriculture Organization (FAO) Global Agro-Ecological Zone (AEZ) database. The AEZ is a broad-scale climatic classification based on the Climate Research Unit (CRU) precipitation and temperature datasets [37]. The derived zones are designed to be indicative of the climatic factors that limit vegetation growth. The raw data were resampled to match the NDVI-derived layers using nearest neighbour resampling (Figure 1b).

3. Results and Discussion

3.1. General Patterns

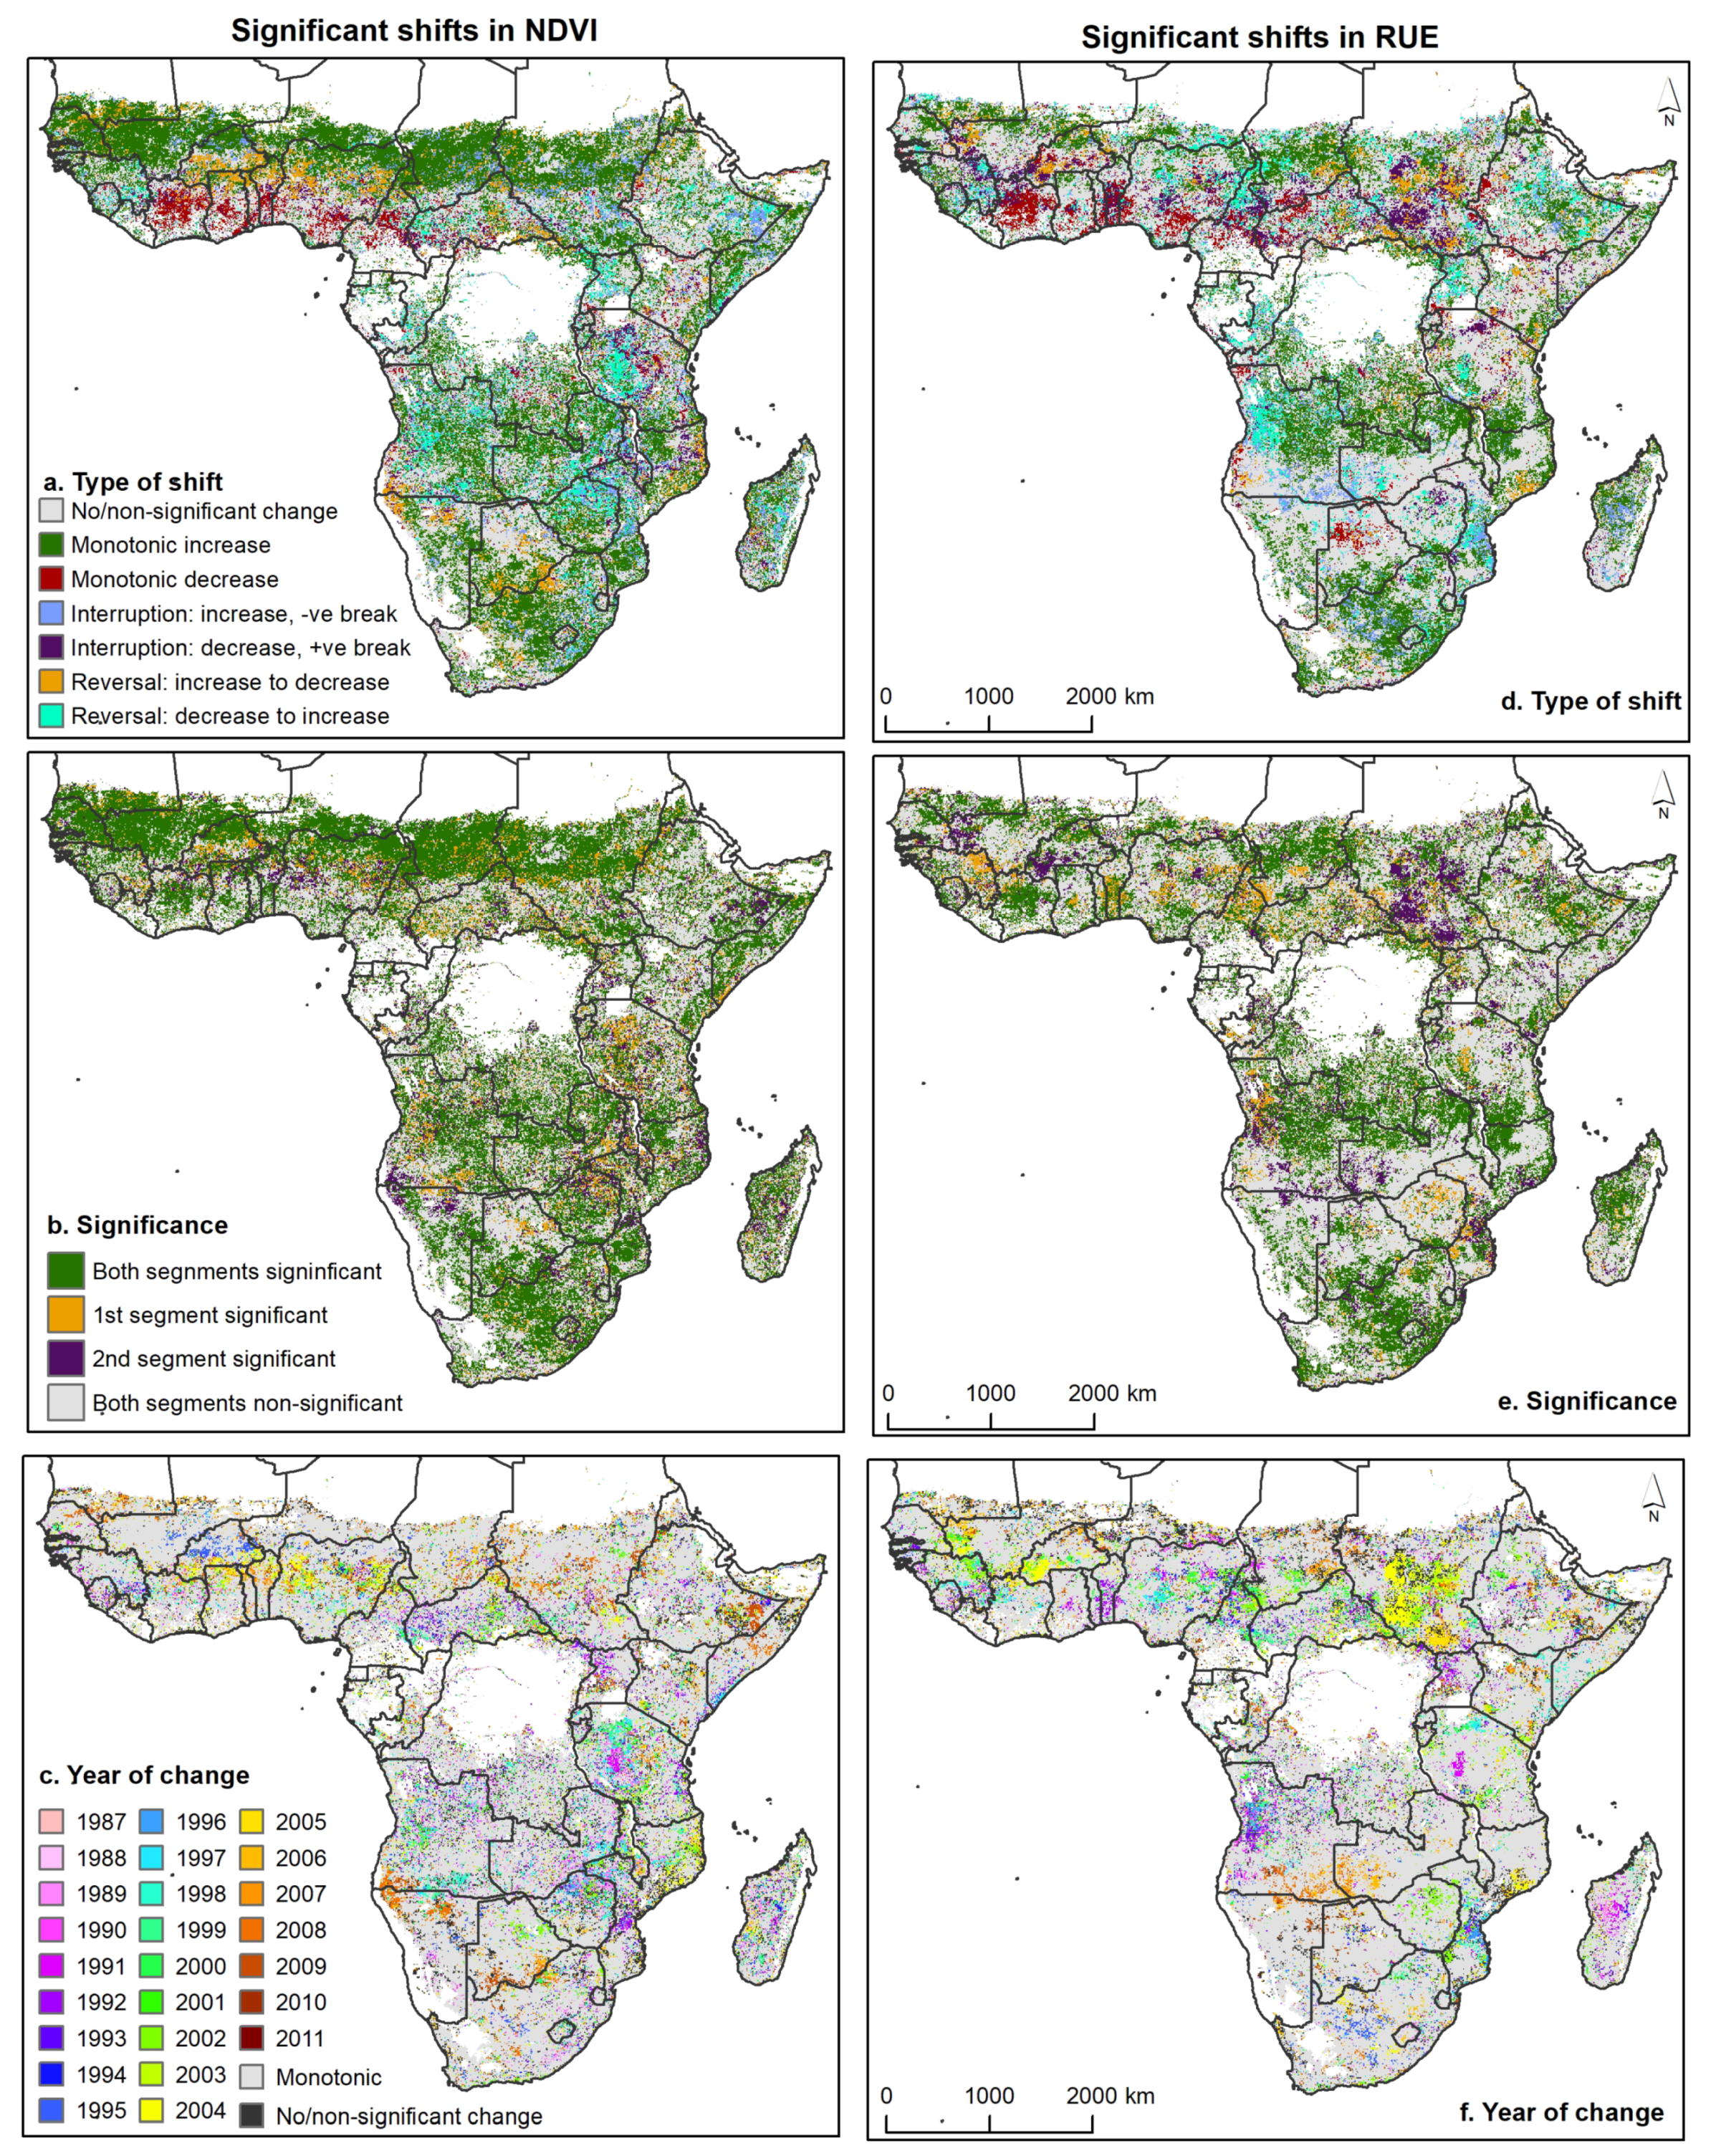
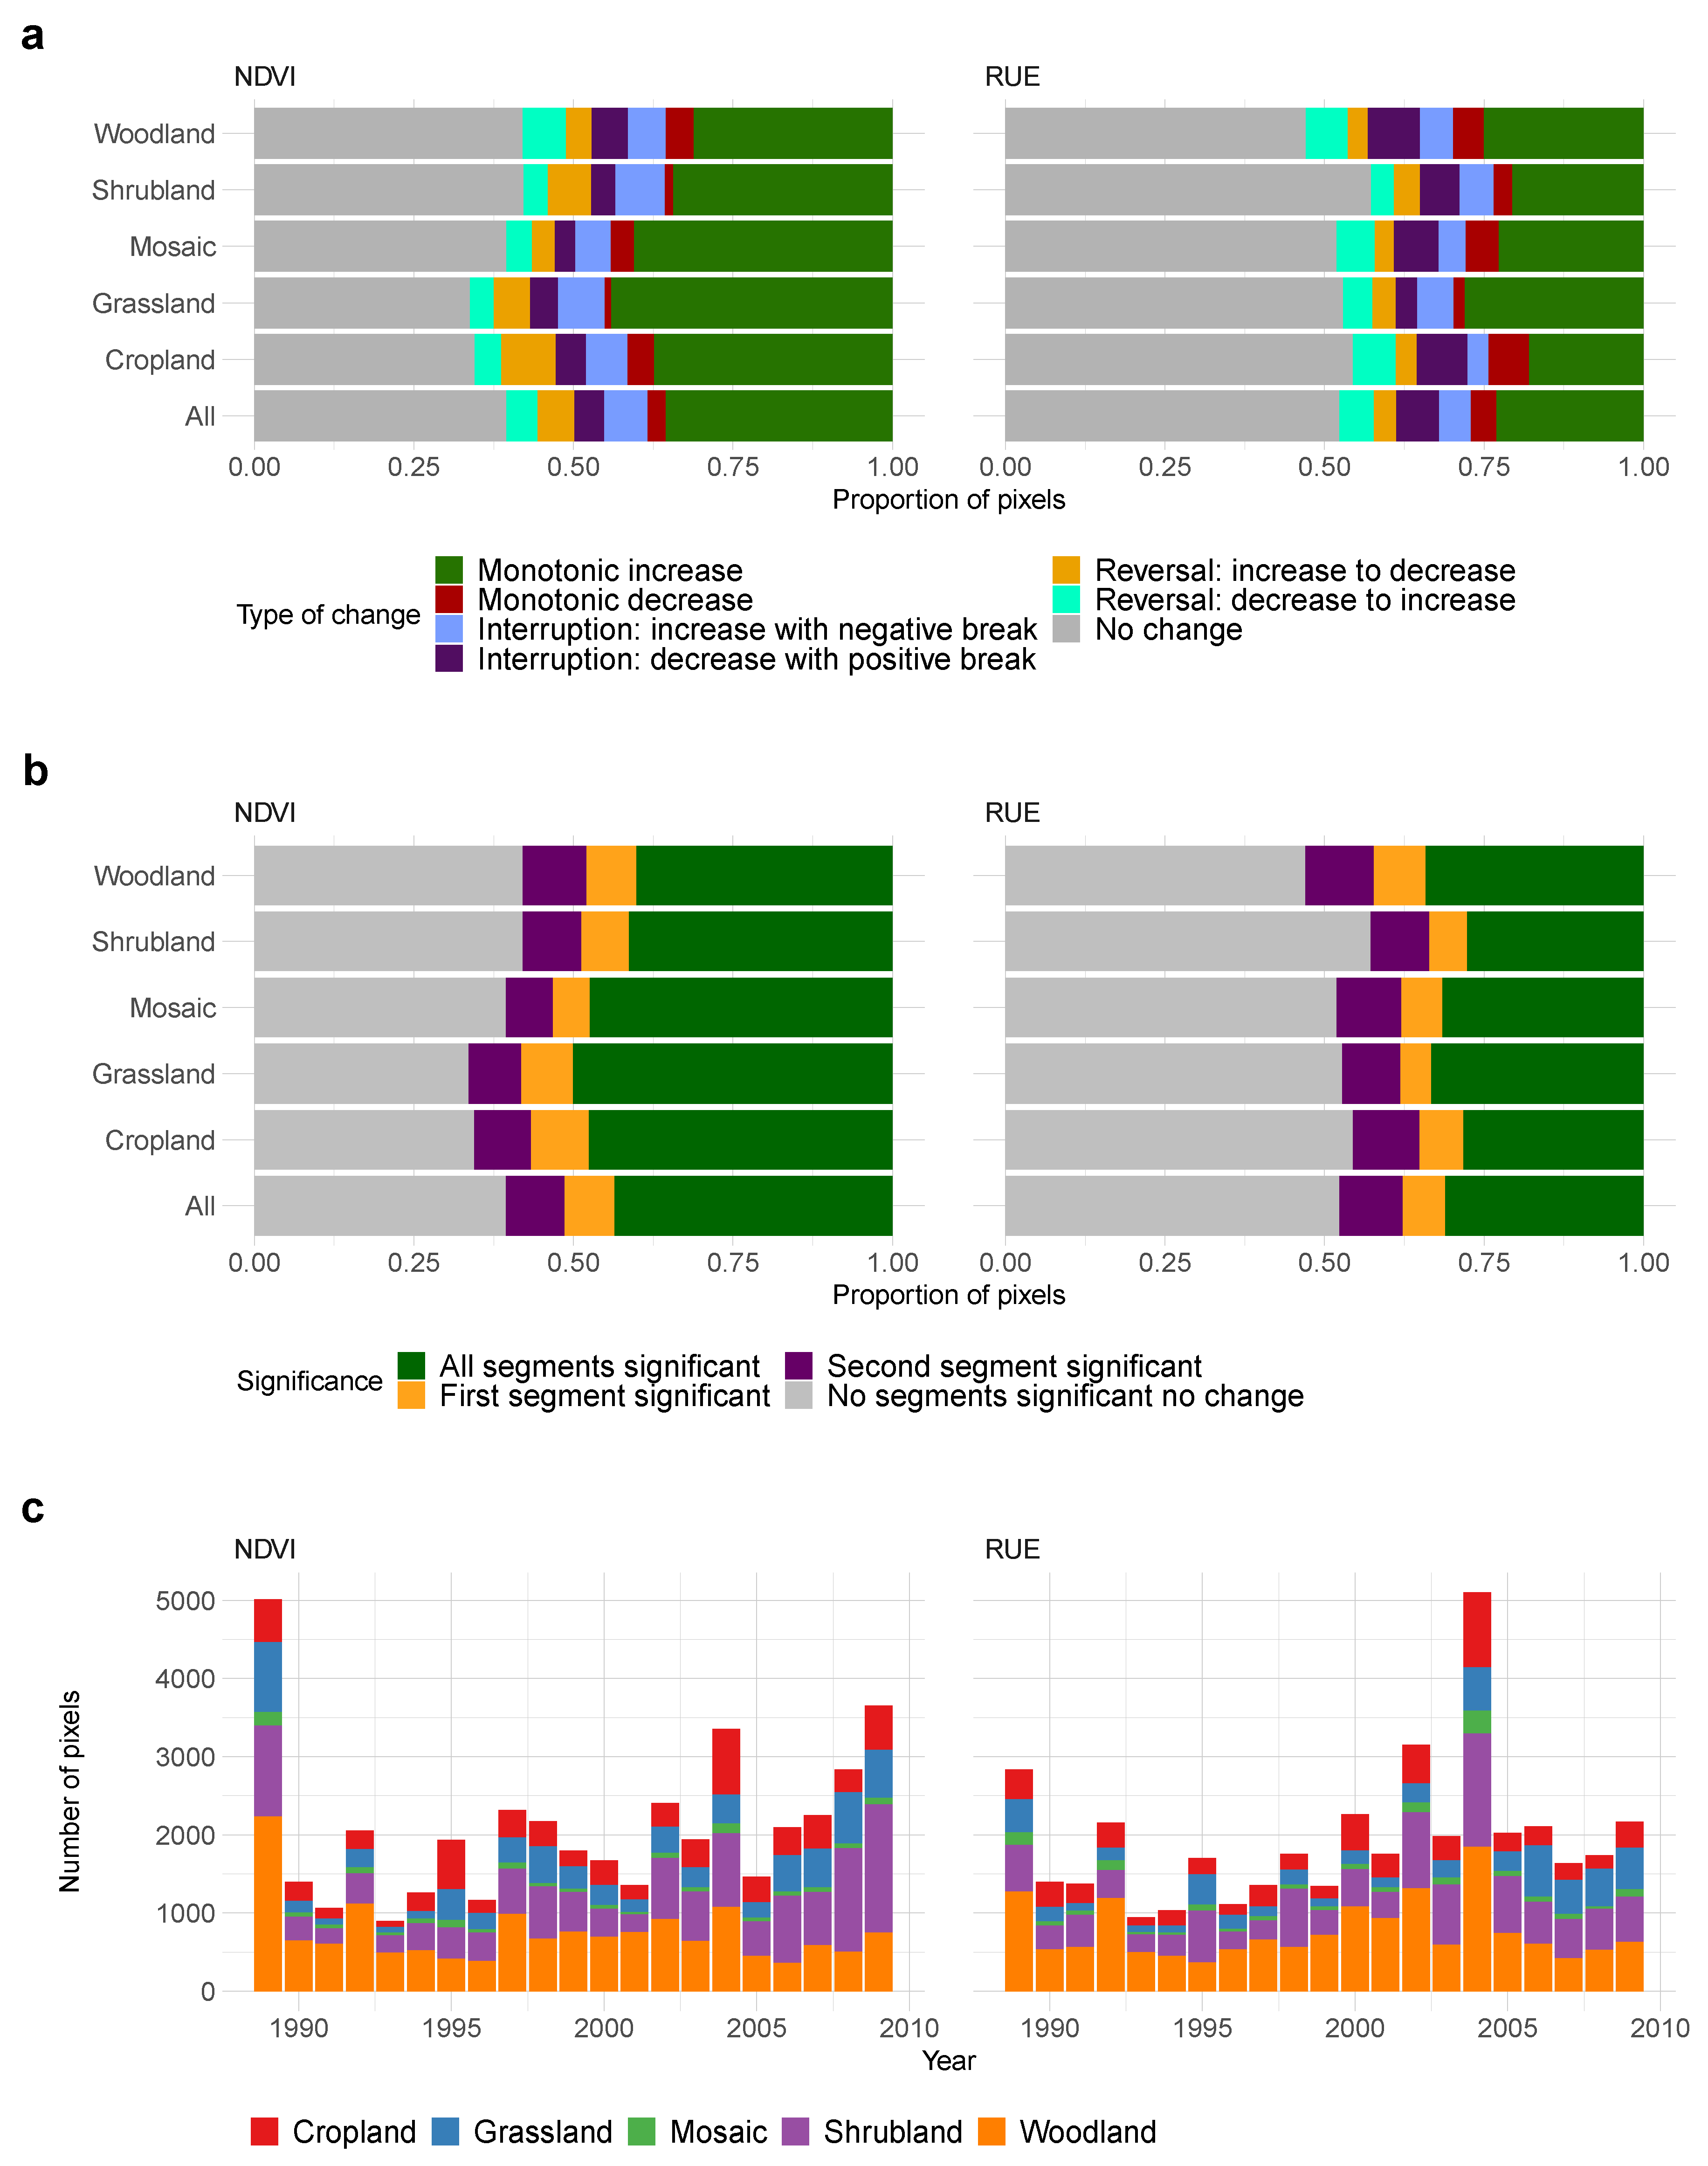
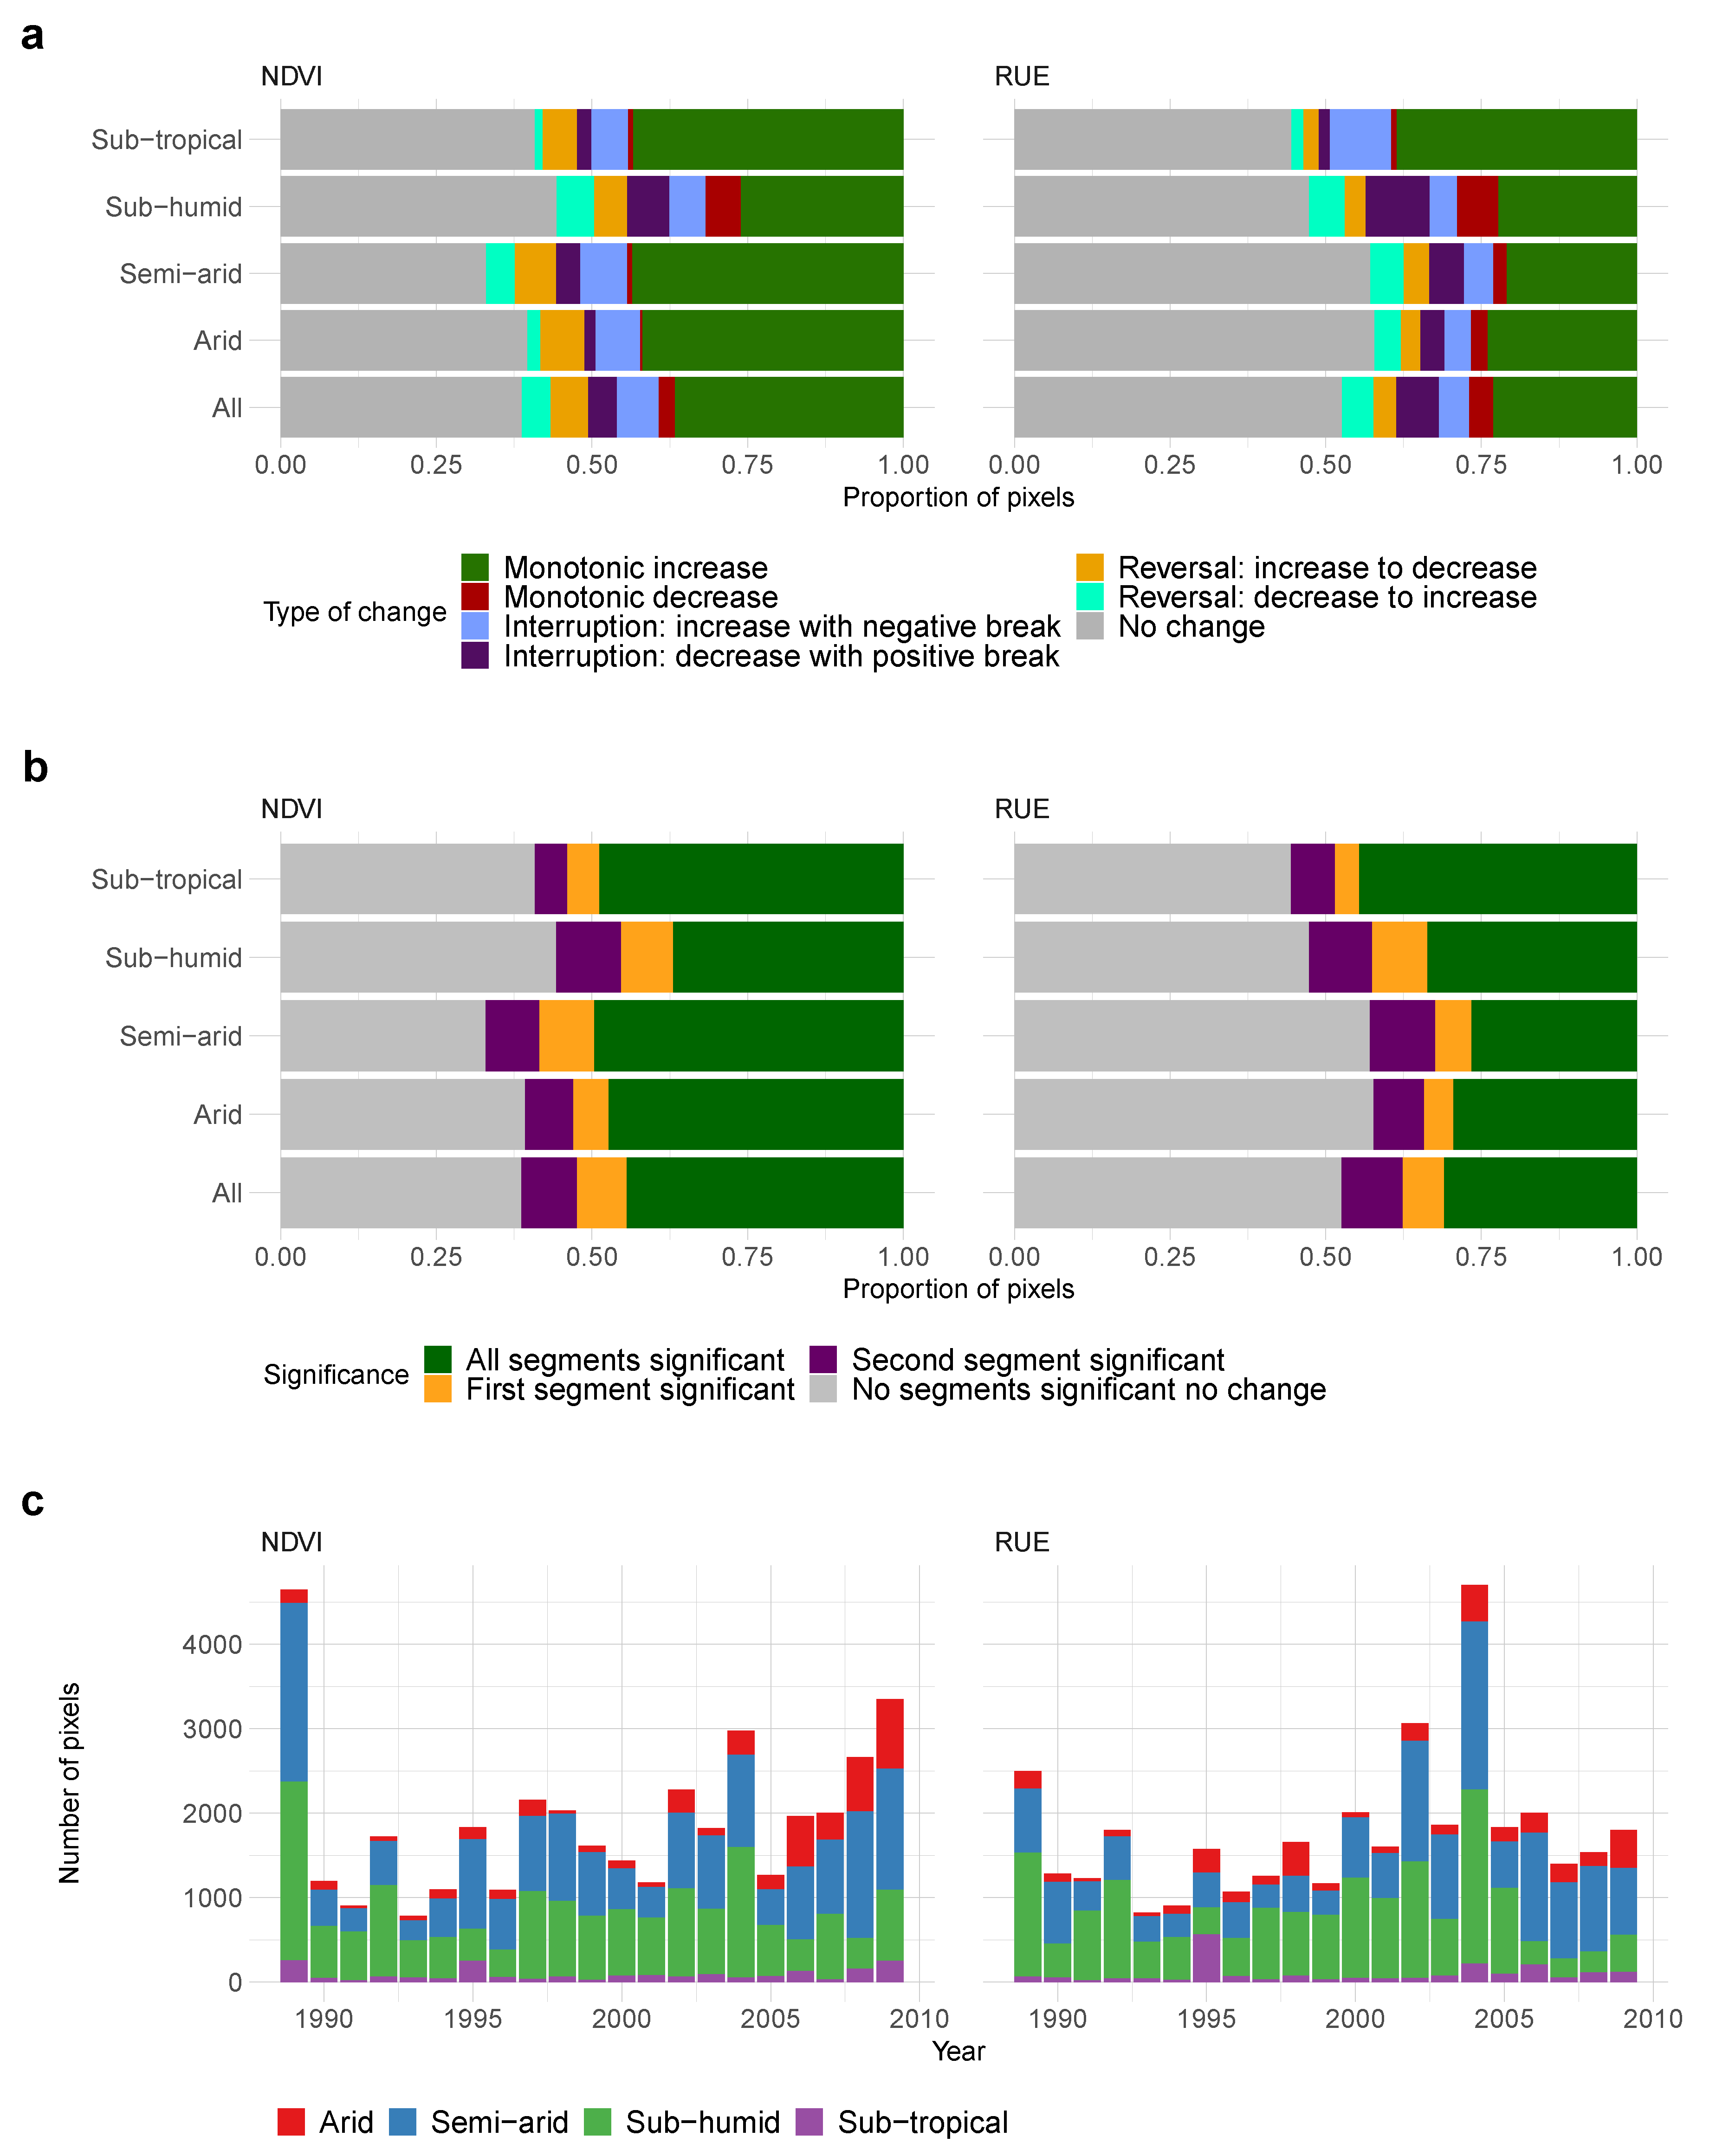
In this study we apply a trend break time-series analysis on two complimentary indicators of ecosystem productivity—the growth season integrated NDVI and the corresponding RUE for African savannah and grassland regions. By comparing the spatio-temporal distribution of trends, and changes in the trend direction, shifts in ecosystem function can be inferred [20,29]. The spatial distribution of the trend types, their significance, and the year in which any breakpoint occurred for NDVI and RUE, are shown in Figure 2. Figure 3 and Figure 4 show these layers stratified according to the land cover types and agro-ecological zones of Figure 1.
Our most notable observation is that both NDVI and RUE are highly dynamic, with 38% and 52% of pixels having a statistically significant trend, respectively (Figure 2a,d). This approximately corresponds to an area of 7 million km2 for NDVI and 5.5 million km2 for RUE. Monotonic increases form a majority of significant trends for both indicators, constituting 60% of NDVI and 49% of RUE pixels with a trend (37% and 23% of all pixels, for NDVI and RUE, Figure 2d–f). The spatial distribution of RUE trends were more homogenous than for NDVI, with more contiguous areas of distinct trend types occurring at specific years (Figure 2d).
The number of trend breaks identified in the growth season NDVI increased in the late 1990s (Figure 3c and Figure 4c). This increase was initially concentrated in semi-arid and sub-humid agro-ecological zones, with arid zones featuring a later increase, around 2006 (Figure 4c). This spike in change points was not reflected in the RUE time-series, which remained relatively stable throughout the study period, with the exception of a spike in 2004. Relative stability in RUE and a prominence in water-limited semi-arid zones indicates that the increase in trends breaks around the millennium is precipitation driven. By the late 1990s the Sahel had recovered from the earlier drought, and certain areas were either stabilising or transitioning into a decreasing trend (Figure 2a). A large cluster of NDVI trend breaks (decrease with positive break type) occurred in western Tanzania around 1998, coinciding with the onset of a prolonged drought following a wet El Niño year [38,39]. Again, this cluster does not significantly overlap with RUE trends. Controversially, Zhao and Running [40] postulated a general increase in negative vegetation trajectories since the millennium, driven by increasing drought and temperature in the southern Hemisphere [18,41]. Although we observe an increase in trend change points, these do not appear to relate to ecosystem state shifts, as the corresponding RUE is relativity stable—implying precipitation driven changes. Furthermore, there was no continental (or hemispheric) shift towards negative trends in either RUE or NDVI and the overall trend continues to be of vegetation greening.
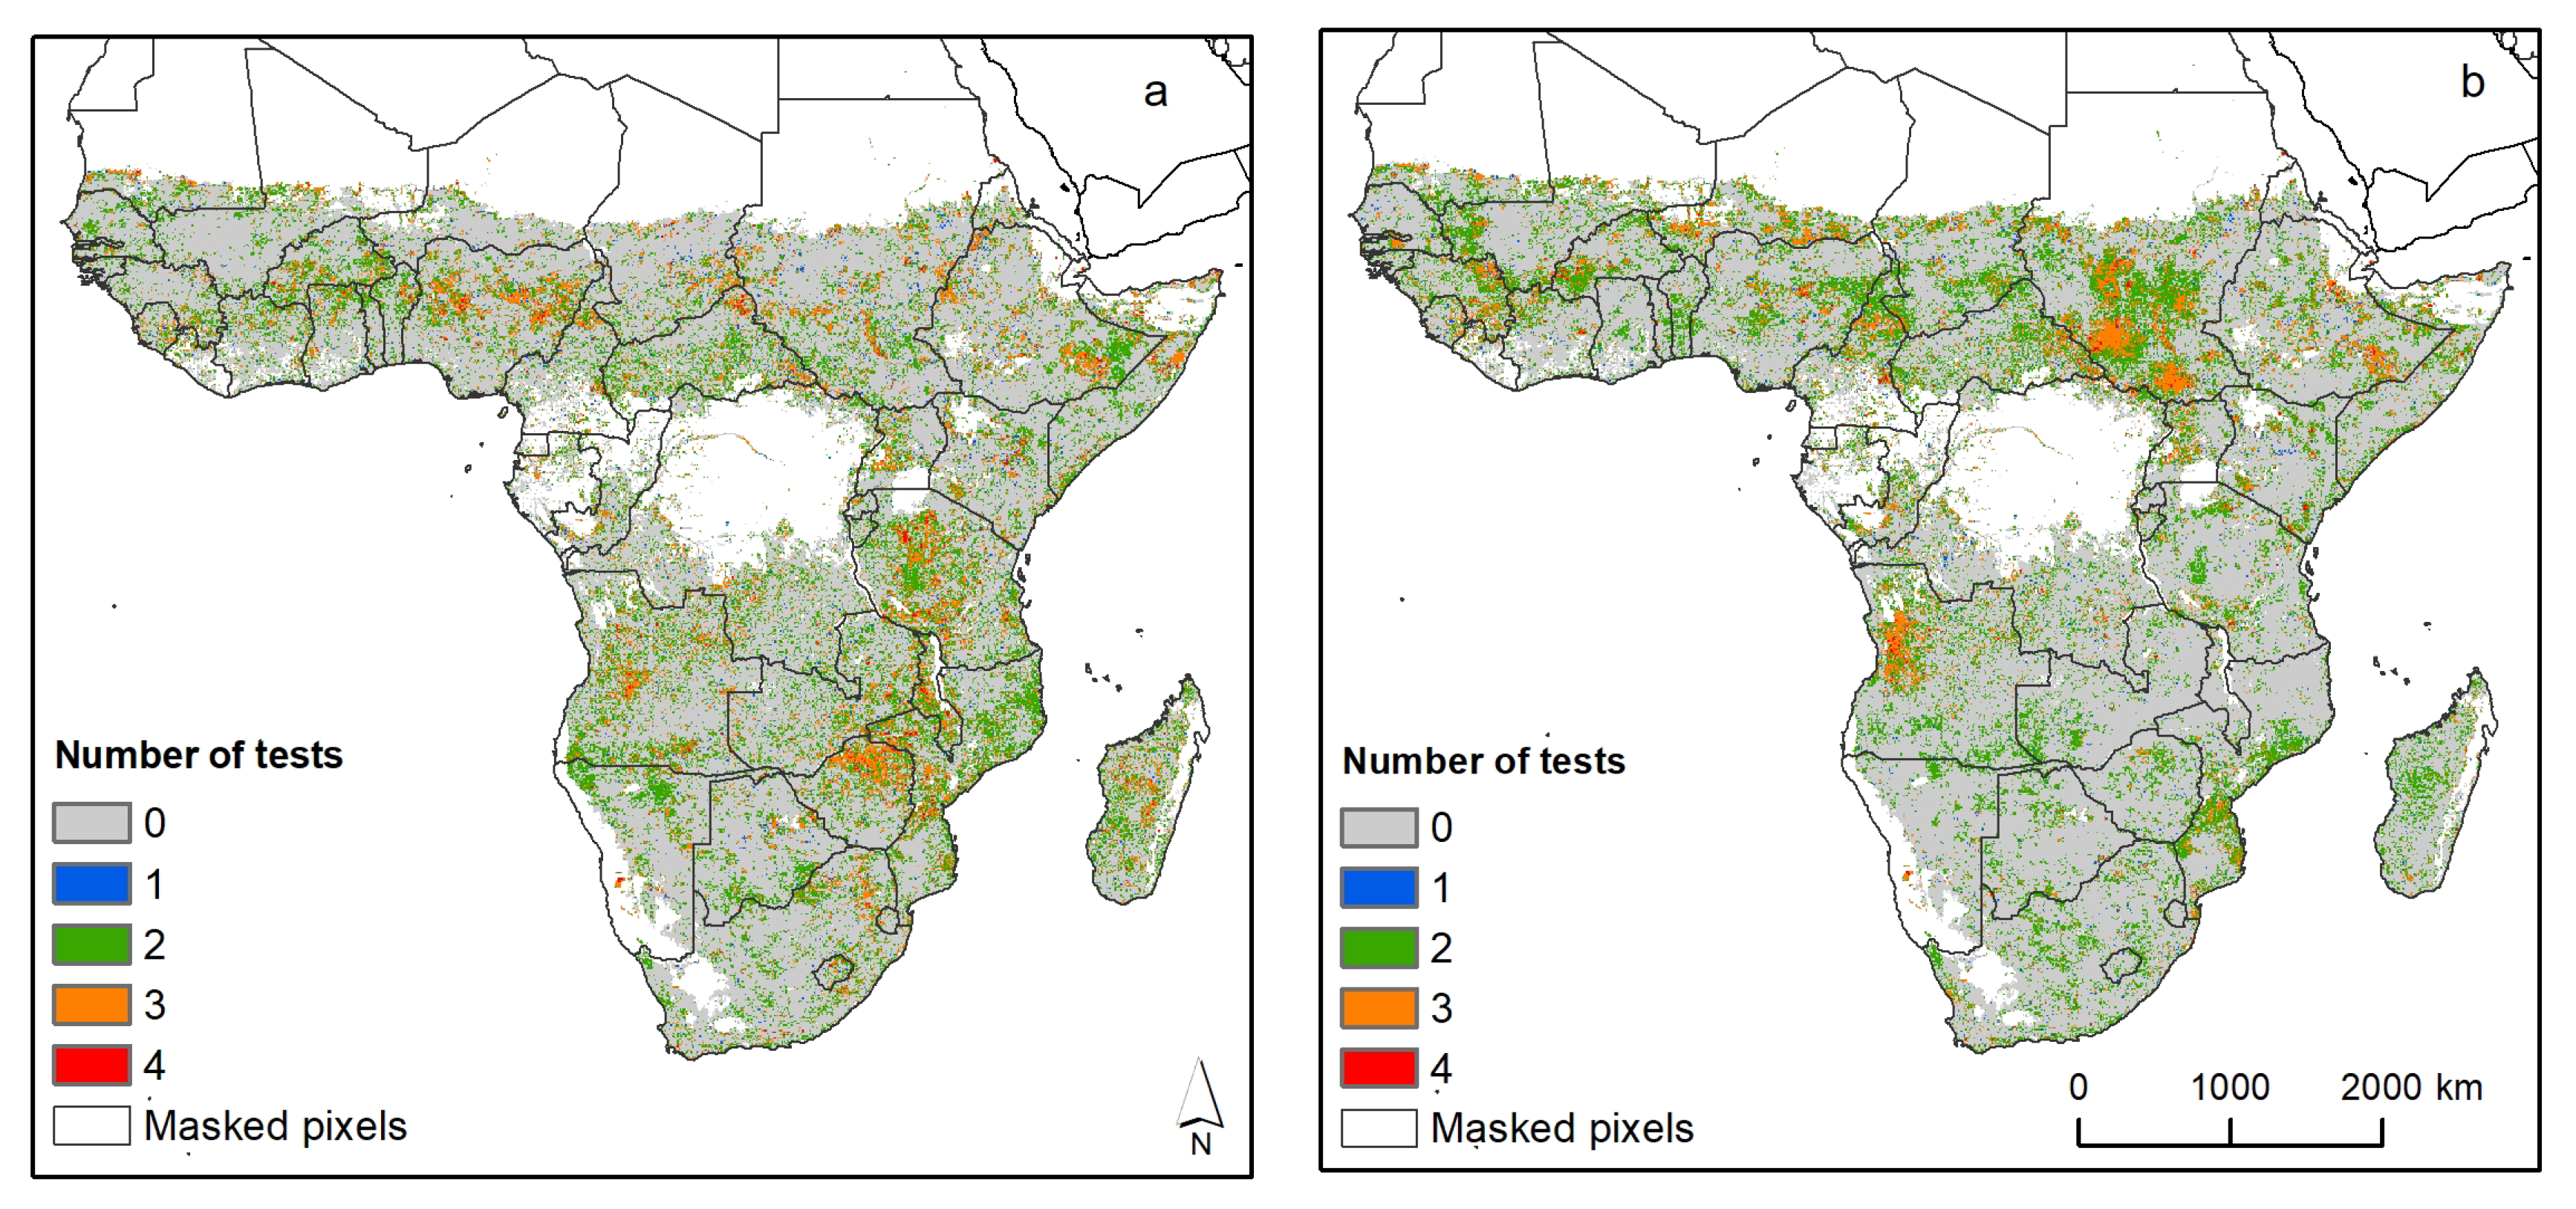
Many of the detected change points were only identified by one or two structural change tests, out of a possible four, increasing the likelihood that detected change points include false positives (Figure 5). There was little overlap between areas of multiple positive tests for NDVI and RUE. For NDVI clusters of multiple break identification occurred in central and East Africa, participially Zimbabwe and Tanzania; for RUE western Angola and Sudan were notable hotspots.
On a continental scale, trend breaks in NDVI increased around the millennium, in line with earlier studies [29]. However, there was no noticeable up-tick during the major El Niño/La Niña events in 1997 and 2002, respectively. These events produce well documented regional anomalies in vegetation, but do not appear to initiate a functional shift [38]. Furthermore, the eruption of Mount Pinatubo in 1991 did not produce a spike of change points. The increased aerosol load from this eruption caused a temporary decline in tropical forest photosynthesis [42], which would not be expected to occur in our study region. Nevertheless, the absence of an apparent effect indicates the competence of the GIMMS pre-processing routines, as uncorrected aerosols would be expected to reduce NDVI values.
The dominant trend dynamic for both NDVI and RUE was monotonic increases (Figure 2a,d). This is in agreement with other studies using both NDVI-derived indicators and ecosystem models [6,43,44]. As increases occur almost pan-continentally, large-scale drivers should be considered as contributing factors for globally observed trends [44]. Over the past 40 years, biogeochemical changes have occurred, such as increases in reactive nitrogen deposition and elevated atmospheric CO2, which increase the maximum potential vegetation production [44,45,46]. Furthermore, the climatic constraints on plant growth have weakened, as rainfall has generally increased, whilst air temperature changes have been relatively minor [47,48]. Combined, these factors would lead to an assumption of increasing vegetation turnover and production, especially for semi-arid regions, where constrains on plant growth are higher [49]. That RUE is increasing in synchrony with NDVI supports non-climatic causation, as RUE trends are adjusted for changes in rainfall limitations.

3.2. Regional Patterns

Southern Africa, and especially South Africa, featured predominantly monotonic increases in RUE, interspersed mainly with some interrupted increase break type or a decrease to increase reversal. These increases coincide with a variety of NDVI trend types, including: monotonic increases, increase to decrease as well as decrease to increase reversals. That RUE is unaffected by the underlying trend in NDVI suggests an ecological transition: for southern Africa, most likely, shrub encroachment [50,51]. Increase in shrub cover, at the expense of grasses, increases RUE, as woody plants are more effective at exploiting residual soil moisture [52]. Pixels with changing trend directions in NDVI show a strong spatial alignment with areas of increasing maximum foliage coverage that [46] mapped and attributed to CO2 fertilisation. Shrub encroachment may produce a variety of NDVI trends, as shrublands have a less pronounced seasonal peak, due to maintaining canopy cover longer than the more ephemeral grasslands. Increases in shrub cover is considered a land degradation process in southern Africa, highlighting the need for caution in interpreting indicators of vegetation productivity without consideration of the local ecological context.
Central Africa, covering Angola, Zambia and northern Mozambique, was a highly dynamic region, featuring extensive decrease to increase trend reversals, for both NDVI and RUE (Figure 2a,d). Ecologically, this zone marks a transition from southern African savannah to semi-tropical woodland. This region is notable for the range and dynamism of land use/land cover changes. The end of the 1975 to 2002 Angolan civil war, facilitated an increase in agriculture, which materialised through intensification of cropping frequency within shifting cultivation [2,53]. Further agricultural expansion has occurred in Zambia, as part of an up-serge in soybean plantations [54]. These changes have driven declines in NPP and forest cover, as identified by References [55,56,57]. Yet, in recent years, woody biomass has increased, due to rapid regrowth and shrub expansion [3,58]. Reconciling these dynamic processes within 8 km-resolution pixels, is a challenging endeavour. Over the long-term (1980-present), it is plausible that forest degradation, through agricultural expansion and charcoal harvesting, has driven negative trends, with recent regrowth reversing this process. RUE reversals in this region are clustered around the late 2000s, corresponding to a period of increasing biomass mapped by McNicol et al. [3].
The Sahel and West Africa displayed a gradient in NDVI trends, with the northern Sahel a contiguous band of monotonic increase, the southern Sahel predominantly increasing to decreasing reversals, and the Guinean coast monotonically decreasing (Figure 2a). The trend reversals occurred around the early 2000s (Figure 2c), coinciding with early reports of a slowdown in vegetation gains around the millennium [29]. ‘Increasing’ pixels in the North are in the more arid regions, which have seen the largest increases in rainfall in the post-drought years, leading to increases in woody plant cover [59]. ‘Decreasing’ pixels show an alignment with regions of high and rapidly increasing human population. Population growth was identified by Brandt et al. [4] as a localised constraint on continental-scale woody cover increases between 1992–2011. The mechanism for this decrease was postulated as increasing demand for fuelwood and agricultural land, driving the degradation of woodlands and clearing of savannahs. As these decreases in NDVI align with decreasing RUE, changes in vegetation—not rainfall—are supported. Pixels featuring trend reversals align with intensive agricultural zones, where greening processes are modulated by underlying soil types [60].
Multiple trend reversals and interruptions were identified in both indicators over East Africa, in particular, Tanzania, but also Kenya and Ethiopia. Analysis in this area may be complicated by the bimodal rainfall regimes. The wider eastern African region, as noted by Vrieling et al. [61], is experiencing significant decreases in the length of the growing season(s), with vegetation senescence occurring up to one month earlier by 2010 than in the early 1980s. The most pronounced declines in growth season length in western Tanzania, show a strong geographic alignment with monotonically decreasing NDVI pixels [61]. Trend reversals may also be driven by a rapid shift from the wet El Niño year of 1997 into a multi-year drought [38,39].

3.3. Limitations

This study, as with all GIMMS NDVI studies, has a number of limitations. Firstly, reconciling coarse resolution pixels with on-the-ground studies and observations is non-trivial, as very few, if any, field studies cover the area of even a single 64 km2 pixel. Secondly, the use of temporal trends in NDVI is based on the assumption that changes in vegetation will be captured by the trend statistic(s). This is not always the case: simulations have shown that in some contexts, major reductions in NDVI are required to produce negative significant trends [17]. Finally, many detected breaks were not identified by multiple structural change statistics, increasing the likelihood for false positives in the trend change layers.

4. Conclusions

We analysed long-term NDVI data, processed into two complementary indicators of ecosystem productivity, for the 1982–2015 period—the aggregated growth season NDVI and associated RUE. To detect ecosystem functional shifts, we employed a trend breaks approach. Our main observations are as follows: (1) for both NDVI and RUE, monotonic increase was the most common trend type observed; (2) RUE was less dynamic than NDVI, indicating that a large component of NDVI variability is driven by rainfall variability; and (3) areas where trends reverse or are interrupted align with known ecological shifts, including a host of human ecosystem modification processes. These results highlight the benefit, and necessity, of considering multiple approaches to trend analysis of vegetation index data. A reliance on a any single indicator or analysis, may miss important processes, and comparisons of different approaches can produce meaningful information.

Author Contributions

Conceptualization: T.P.H. and E.S.; data analysis and software: T.P.H.; paper writing: T.P.H. and E.S. All authors have read and agreed to the published version of the manuscript.

Funding

TH was supported by an MMU post-graduate fellowship. ES was supported by an EU Marie Currie Career Integration Grant (PCIG12-GA-2012-3374327). We are grateful to NASA and the USGS for the NDVI data.

Conflicts of Interest

The authors declare no conflict of interest.

References

  1. Hulme, M. Climatic perspectives on Sahelian desiccation: 1973–1998. Glob. Environ. Chang. 2001, 11, 19–29. [Google Scholar] [CrossRef] [Green Version]
  2. Schneibel, A.; Stellmes, M.; Röder, A.; Frantz, D.; Kowalski, B.; Haß, E.; Hill, J. Assessment of spatio-temporal changes of smallholder cultivation patterns in the Angolan Miombo belt using segmentation of Landsat time series. Remote Sens. Environ. 2017, 195, 118–129. [Google Scholar] [CrossRef] [Green Version]
  3. McNicol, I.M.; Ryan, C.M.; Mitchard, E.T. Carbon losses from deforestation and widespread degradation offset by extensive growth in African woodlands. Nat. Commun. 2018, 9, 3045. [Google Scholar] [CrossRef]
  4. Brandt, M.; Rasmussen, K.; Peñuelas, J.; Tian, F.; Schurgers, G.; Verger, A.; Mertz, O.; Palmer, J.R.; Fensholt, R. Human population growth offsets climate-driven increase in woody vegetation in sub-Saharan Africa. Nat. Ecol. Evol. 2017, 1, 0081. [Google Scholar] [CrossRef] [PubMed] [Green Version]
  5. Bai, Z.G.; Dent, D.L.; Olsson, L.; Schaepman, M.E. Proxy global assessment of land degradation. Soil Use Manag. 2008, 24, 223–234. [Google Scholar] [CrossRef]
  6. Fensholt, R.; Langanke, T.; Rasmussen, K.; Reenberg, A.; Prince, S.D.; Tucker, C.; Scholes, R.J.; Le, Q.B.; Bondeau, A.; Eastman, R.; et al. Greenness in semi-arid areas across the globe 1981–2007—An Earth Observing Satellite based analysis of trends and drivers. Remote Sens. Environ. 2012, 121, 144–158. [Google Scholar] [CrossRef]
  7. Higginbottom, T.P.; Symeonakis, E. Assessing land degradation and desertification using vegetation index data: Current frameworks and future directions. Remote Sens. 2014, 6, 9552–9575. [Google Scholar] [CrossRef] [Green Version]
  8. Cracknell, A.P. The exciting and totally unanticipated success of the AVHRR in applications for which it was never intended. Adv. Space Res. 2001, 28, 233–240. [Google Scholar] [CrossRef]
  9. Eisfelder, C.; Kuenzer, C.; Dech, S. Derivation of biomass information for semi-arid areas using remote-sensing data. Int. J. Remote Sens. 2012, 33, 2937–2984. [Google Scholar] [CrossRef]
  10. Prince, S.; Tucker, C. Satellite remote sensing of rangelands in Botswana II. NOAA AVHRR and herbaceous vegetation. Int. J. Remote Sens. 1986, 7, 1555–1570. [Google Scholar] [CrossRef]
  11. Nicholson, S.E. The nature of rainfall variability over Africa on time scales of decades to millenia. Glob. Planet. Chang. 2000, 26, 137–158. [Google Scholar] [CrossRef]
  12. Charney, J. Dynamics of deserts and drought in the Sahel. Q. J. R. Meteorol. Soc. 1975, 101, 193–202. [Google Scholar] [CrossRef]
  13. Nicholson, S.E.; Tucker, C.J.; Ba, M. Desertification, drought, and surface vegetation: An example from the West African Sahel. Bull. Am. Meteorol. Soc. 1998, 79, 815–829. [Google Scholar] [CrossRef]
  14. Tucker, C.; Dregne, H.; Newcomb, W. Expansion and contraction of the Sahara desert from 1980 to 1990. Science 1991, 253, 299–301. [Google Scholar] [CrossRef] [PubMed]
  15. Herrmann, S.; Anyamba, A.; Tucker, C. Recent trends in vegetation dynamics in the African Sahel and their relationship to climate. Glob. Environ. Chang. 2005, 15, 394–404. [Google Scholar] [CrossRef]
  16. De Beurs, K.; Henebry, G. A statistical framework for the analysis of long image time series. Int. J. Remote Sens. 2005, 26, 1551–1573. [Google Scholar] [CrossRef]
  17. Wessels, K.; Van Den Bergh, F.; Scholes, R. Limits to detectability of land degradation by trend analysis of vegetation index data. Remote Sens. Environ. 2012, 125, 10–22. [Google Scholar] [CrossRef]
  18. De Jong, R.; Verbesselt, J.; Schaepman, M.E.; Bruin, S. Trend changes in global greening and browning: Contribution of short-term trends to longer-term change. Glob. Chang. Biol. 2012, 18, 642–655. [Google Scholar] [CrossRef]
  19. Verbesselt, J.; Hyndman, R.; Newnham, G.; Culvenor, D. Detecting trend and seasonal changes in satellite image time series. Remote Sens. Environ. 2010, 114, 106–115. [Google Scholar] [CrossRef]
  20. Horion, S.; Prishchepov, A.V.; Verbesselt, J.; de Beurs, K.; Tagesson, T.; Fensholt, R. Revealing turning points in ecosystem functioning over the Northern Eurasian agricultural frontier. Glob. Chang. Biol. 2016, 22, 2801–2817. [Google Scholar] [CrossRef]
  21. Forkel, M.; Carvalhais, N.; Verbesselt, J.; Mahecha, M.D.; Neigh, C.S.; Reichstein, M. Trend change detection in NDVI time series: Effects of inter-annual variability and methodology. Remote Sens. 2013, 5, 2113–2144. [Google Scholar] [CrossRef] [Green Version]
  22. Symeonakis, E.; Drake, N. Monitoring desertification and land degradation over sub-Saharan Africa. Int. J. Remote Sens. 2004, 25, 573–592. [Google Scholar] [CrossRef]
  23. Fensholt, R.; Horion, S.; Tagesson, T.; Ehammer, A.; Ivits, E.; Rasmussen, K. Global-scale mapping of changes in ecosystem functioning from earth observation-based trends in total and recurrent vegetation. Glob. Ecol. Biogeogr. 2015, 24, 1003–1017. [Google Scholar] [CrossRef] [Green Version]
  24. Fensholt, R.; Rasmussen, K. Analysis of trends in the Sahelian ‘rain-use efficiency’using GIMMS NDVI, RFE and GPCP rainfall data. Remote Sens. Environ. 2011, 115, 438–451. [Google Scholar] [CrossRef]
  25. Bernardino, P.N.; De Keersmaecker, W.; Fensholt, R.; Verbesselt, J.; Somers, B.; Horion, S. Global-scale characterization of turning points in arid and semi-arid ecosystem functioning. Glob. Ecol. Biogeogr. 2020. [Google Scholar] [CrossRef] [Green Version]
  26. Tucker, C.J. Red and photographic infrared linear combinations for monitoring vegetation. Remote Sens. Environ. 1979, 8, 127–150. [Google Scholar] [CrossRef] [Green Version]
  27. Pinzon, J.; Tucker, C. A non-stationary 1981–2012 AVHRR NDVI3g time series. Remote Sens. 2014, 6, 6929–6960. [Google Scholar] [CrossRef] [Green Version]
  28. Funk, C.; Peterson, P.; Landsfeld, M.; Pedreros, D.; Verdin, J.; Shukla, S.; Husak, G.; Rowland, J.; Harrison, L.; Hoell, A.; et al. The climate hazards infrared precipitation with stations—A new environmental record for monitoring extremes. Sci. Data 2015, 2, 1–21. [Google Scholar] [CrossRef] [PubMed] [Green Version]
  29. de Jong, R.; Verbesselt, J.; Zeileis, A.; Schaepman, M.E. Shifts in global vegetation activity trends. Remote Sens. 2013, 5, 1117–1133. [Google Scholar] [CrossRef] [Green Version]
  30. Rockström, J.; Steffen, W.; Noone, K.; Persson, Å.; Chapin, F.S.; Lambin, E.F.; Lenton, T.M.; Scheffer, M.; Folke, C.; Schellnhuber, H.J.; et al. A safe operating space for humanity. Nature 2009, 461, 472–475. [Google Scholar] [CrossRef] [PubMed]
  31. R Core Team. R: A Language and Environment for Statistical Computing; R Foundation for Statistical Computing: Vienna, Austria, 2017. [Google Scholar]
  32. Bivand, R.; Keitt, T.; Rowlingson, B. Rgdal: Bindings for the ‘Geospatial’ Data Abstraction Library; R Package Version 1.3-1; R Foundation for Statistical Computing: Vienna, Austria, 2018. [Google Scholar]
  33. Hijmans, R.J.; van Etten, J.; Mattiuzzi, M.; Sumner, M.; Greenberg, J.A.; Lamigueiro, O.P.; Bevan, A.; Racine, E.B.; Shortridge, A.; Hijmans, M.R.J. Raster: Geographic Data Analysis and Modeling; R Package Version 2.3-40; R Foundation for Statistical Computing: Vienna, Austria, 2015. [Google Scholar]
  34. Detsch, F. Gimms: Download and Process GIMMS NDVI3g Data; R Package Version 1.1.0; R Foundation for Statistical Computing: Vienna, Austria, 2018. [Google Scholar]
  35. Wickham, H.; Averick, M.; Bryan, J.; Chang, W.; McGowan, L.D.; François, R.; Grolemund, G.; Hayes, A.; Henry, L.; Hester, J.; et al. Welcome to the tidyverse. J. Open Source Softw. 2019, 4, 1686. [Google Scholar] [CrossRef]
  36. ESA. Land Cover CCI Product User Guide; Version 2; ESA: Paris, France, 2017. [Google Scholar]
  37. Fischer, G.; Nachtergaele, F.O.; Prieler, S.; Teixeira, E.; Tóth, G.; Van Velthuizen, H.; Verelst, L.; Wiberg, D. Global Agro-Ecological Zones (GAEZ v3. 0)-Model Documentation; FAO: Rome, Italy, 2012. [Google Scholar]
  38. Brown, M.E.; de Beurs, K.; Vrieling, A. The response of African land surface phenology to large scale climate oscillations. Remote Sens. Environ. 2010, 114, 2286–2296. [Google Scholar] [CrossRef] [Green Version]
  39. Kijazi, A.L.; Reason, C. Analysis of the 1998 to 2005 drought over the northeastern highlands of Tanzania. Clim. Res. 2009, 38, 209–223. [Google Scholar] [CrossRef] [Green Version]
  40. Zhao, M.; Running, S.W. Drought-induced reduction in global terrestrial net primary production from 2000 through 2009. Science 2010, 329, 940–943. [Google Scholar] [CrossRef] [PubMed] [Green Version]
  41. Zhao, M.; Running, S.W. Comment on Drought-Induced Reduction in Global Terrestrial Net Primary Production from 2000 Through 2009. Science 2010, 333, 1093. [Google Scholar] [CrossRef] [Green Version]
  42. Kogan, F.; Sullivan, J.; Carey, R.; Tarpley, D. Post-Pinatubo vegetation index in central Africa. Geocarto Int. 1994, 9, 63–66. [Google Scholar] [CrossRef]
  43. Hickler, T.; Eklundh, L.; Seaquist, J.; Smith, B.; Ardo, J.; Olsson, L.; Sykes, M.; Sjostrom, M. Precipitation controls Sahel greening trend. Geophys. Res. Lett. 2005, 32, 1–4. [Google Scholar] [CrossRef]
  44. Zhu, Z.; Piao, S.; Myneni, R.B.; Huang, M.; Zeng, Z.; Canadell, J.G.; Ciais, P.; Sitch, S.; Friedlingstein, P.; Arneth, A.; et al. Greening of the Earth and its drivers. Nat. Clim. Chang. 2016, 6, 791–795. [Google Scholar] [CrossRef]
  45. Los, S. Analysis of trends in fused AVHRR and MODIS NDVI data for 1982–2006: Indication for a CO2 fertilization effect in global vegetation. Glob. Biogeochem. Cycles 2013, 27, 318–330. [Google Scholar] [CrossRef]
  46. Donohue, R.J.; Roderick, M.L.; McVicar, T.R.; Farquhar, G.D. Impact of CO2 fertilization on maximum foliage cover across the globe’s warm, arid environments. Geophys. Res. Lett. 2013, 40, 3031–3035. [Google Scholar] [CrossRef] [Green Version]
  47. De Jong, R.; Schaepman, M.E.; Furrer, R.; Bruin, S.; Verburg, P.H. Spatial relationship between climatologies and changes in global vegetation activity. Glob. Chang. Biol. 2013, 19, 1953–1964. [Google Scholar] [CrossRef] [PubMed]
  48. Myneni, R.B.; Keeling, C.; Tucker, C.J.; Asrar, G.; Nemani, R.R. Increased plant growth in the northern high latitudes from 1981 to 1991. Nature 1997, 386, 698. [Google Scholar] [CrossRef]
  49. Poulter, B.; Frank, D.; Ciais, P.; Myneni, R.B.; Andela, N.; Bi, J.; Broquet, G.; Canadell, J.G.; Chevallier, F.; Liu, Y.Y. Contribution of semi-arid ecosystems to interannual variability of the global carbon cycle. Nature 2014, 509, 600–603. [Google Scholar] [CrossRef] [PubMed] [Green Version]
  50. Stevens, N.; Erasmus, B.; Archibald, S.; Bond, W. Woody encroachment over 70 years in South African savannahs: Overgrazing, global change or extinction aftershock? Philos. Trans. R. Soc. B 2016, 371, 20150437. [Google Scholar] [CrossRef] [PubMed] [Green Version]
  51. Bond, W.J.; Midgley, G.F. A proposed CO2-controlled mechanism of woody plant invasion in grasslands and savannas. Glob. Chang. Biol. 2000, 6, 865–869. [Google Scholar] [CrossRef]
  52. Eldridge, D.J.; Bowker, M.A.; Maestre, F.T.; Roger, E.; Reynolds, J.F.; Whitford, W.G. Impacts of shrub encroachment on ecosystem structure and functioning: Towards a global synthesis. Ecol. Lett. 2011, 14, 709–722. [Google Scholar] [CrossRef] [PubMed]
  53. Schneibel, A.; Frantz, D.; Röder, A.; Stellmes, M.; Fischer, K.; Hill, J. Using annual landsat time series for the detection of dry forest degradation processes in south-central Angola. Remote Sens. 2017, 9, 905. [Google Scholar] [CrossRef] [Green Version]
  54. Gasparri, N.I.; Kuemmerle, T.; Meyfroidt, P.; le Polain de Waroux, Y.; Kreft, H. The emerging soybean production frontier in Southern Africa: Conservation challenges and the role of south-south telecouplings. Conserv. Lett. 2016, 9, 21–31. [Google Scholar] [CrossRef]
  55. Zhu, L.; Southworth, J. Disentangling the relationships between net primary production and precipitation in southern Africa savannas using satellite observations from 1982 to 2010. Remote Sens. 2013, 5, 3803–3825. [Google Scholar] [CrossRef] [Green Version]
  56. Brink, A.B.; Eva, H.D. Monitoring 25 years of land cover change dynamics in Africa: A sample based remote sensing approach. Appl. Geogr. 2009, 29, 501–512. [Google Scholar] [CrossRef]
  57. Hansen, M.C.; Potapov, P.V.; Moore, R.; Hancher, M.; Turubanova, S.; Tyukavina, A.; Thau, D.; Stehman, S.; Goetz, S.; Loveland, T.; et al. High-resolution global maps of 21st-century forest cover change. Science 2013, 342, 850–853. [Google Scholar] [CrossRef] [PubMed] [Green Version]
  58. Tian, F.; Brandt, M.; Liu, Y.Y.; Rasmussen, K.; Fensholt, R. Mapping gains and losses in woody vegetation across global tropical drylands. Glob. Chang. Biol. 2017, 23, 1748–1760. [Google Scholar] [CrossRef]
  59. Anchang, J.Y.; Prihodko, L.; Kaptué, A.T.; Ross, C.W.; Ji, W.; Kumar, S.S.; Lind, B.; Sarr, M.A.; Diouf, A.A.; Hanan, N.P. Trends in Woody and Herbaceous Vegetation in the Savannas of West Africa. Remote Sens. 2019, 11, 576. [Google Scholar] [CrossRef] [Green Version]
  60. Dardel, C.; Kergoat, L.; Hiernaux, P.; Mougin, E.; Grippa, M.; Tucker, C. Re-greening Sahel: 30 years of remote sensing data and field observations (Mali, Niger). Remote Sens. Environ. 2014, 140, 350–364. [Google Scholar] [CrossRef]
  61. Vrieling, A.; De Leeuw, J.; Said, M.Y. Length of growing period over Africa: Variability and trends from 30 years of NDVI time series. Remote Sens. 2013, 5, 982–1000. [Google Scholar] [CrossRef] [Green Version]
Figure 1. (a) Land cover map for the year 2000 derived from the European Space Agency’s Climate Change Initiative (ESA CCI) product; (b) The agro-ecological climatic zones of the United Nations’ Food and Agriculture Organization (FAO).
Remotesensing 12 01894 g001
Figure 2. (a) Trend type, (b) significance of trend(s), and (c) date of trend shift for Normalised Difference Vegetation Index (NDVI); (df) is the same for RUE. Only pixels with a significant ( p < 0.05 ) change are shown.
Remotesensing 12 01894 g002
Figure 3. Trend breaks stratified by land cover: (a) trend type; (b) trend significance; (c) year of breakpoint.
Remotesensing 12 01894 g003
Figure 4. Trend breaks stratified by agro-ecological zone: (a) trend type, (b) trend significance; (c) year of breakpoint.
Remotesensing 12 01894 g004
Figure 5. Number of structural change tests that identified a significant ( p < 0.05 ) breakpoint for: (a) NDVI, and (b) RUE.
Remotesensing 12 01894 g005