


Abstract
Rapid urbanization in the Yellow River Basin intensifies the conflict between urban expansion and the thermal environment, threatening ecological security and sustainable development. Utilizing multi-source data (2000–2023) including nighttime light (NTL) and land surface temperature (LST), this study applies spatial analysis and Geographically Weighted Regression (GWR) to explore the spatial associations between urban development and LST and its drivers across core cities. The results indicate significant spatiotemporal differentiation: mid-downstream cities exhibited contiguous urban expansion, whereas upstream growth remained constrained by local topography, with heat islands consistently concentrating in built-up areas. The warming rate decreased gradually from downstream (0.29–0.40 °C/year) to upstream (0.20–0.30 °C/year). The LST-NTL correlation strengthened notably in mid-downstream regions but remained moderate upstream. GWR analysis revealed that urban development intensity, represented by NTL, is the primary driver of LST increase downstream, while natural factors predominantly mitigate warming upstream. This long-term, multi-city comparison provides a scientific basis for precise urban heat island management and sustainable planning in the basin.
1. Introduction
Against the backdrop of the synergistic advancement of global sustainable development agendas and regional strategies, the implementation paths of UN SDG 11 (Sustainable Cities and Communities) and SDG 13 (Climate Action) [1], together with China’s national strategy for ecological preservation and high-quality development in the Yellow River Basin [2], collectively impose urgent requirements for the regulation of urban thermal environments and the construction of ecological security patterns. The rapid pace of global urbanization has led to increased LST and heat island effects, which pose significant ecological challenges to regional sustainable development [3]. LST serves as a crucial indicator of the thermal environment, demonstrating spatiotemporal variations that are fundamentally associated with the intensity of urban development, land surface characteristics, and natural conditions [4,5,6]. These variations significantly influence ecological functions [7,8], human comfort [9], and climate regulation [10,11]. Thus, revealing the spatial interaction mechanisms between LST and heat island effects has become a significant research focus in geography and urban ecology, offering a scientific foundation for urban development strategies that achieve the coexistence of human and natural systems.
International research commenced in the 19th century with the initial observation that metropolitan temperatures surpass those in suburban areas [12]. During the 20th century, it increasingly depended on Landsat satellite thermal infrared data for the quantitative inversion of LST [13,14]. Previous studies predominantly relied on single-dimensional metrics, such as developed land or impermeable surfaces, to quantify urban expansion [15,16,17]. However, the full impacts of urban development are not captured by this narrow perspective. Consequently, since the start of the twenty-first century, the utilization of NTL data has transcended these limitations. Because NTL data strongly correlates with human activity, it enables a multidimensional quantification of urbanization, encompassing economic, demographic [18,19,20], and land intensities [21,22,23]. Rather than merely tracking the physical footprint of built-up areas, this approach captures the true multifaceted essence of urban growth. In China, early thermal environment studies relied predominantly on isolated meteorological stations [24,25]. Since then, the discipline has broadened to encompass urban agglomeration scales by utilizing multi-source remote sensing data [26,27,28], incorporating methodologies such as GWR to clarify spatial heterogeneity [29,30,31]. Contemporary research now concentrates on examining the spatial response patterns and driving mechanisms of LST. Despite growing interest, the existing body of research on the core cities of the Yellow River Basin exhibits considerable limitations. Studies frequently focus exclusively on the immediate thermal conditions of specific cities in isolation [32] or merely treat LST as an auxiliary factor in ecological assessments [33,34]. To understand the full spatial dynamics of the region, these cities must be compared collectively. As the principal political and economic centers of the basin, they share common watershed ecological constraints and exhibit significant geographical and ecological interdependence along the river network. Furthermore, the national strategy for ecological preservation and high-quality development in the Yellow River Basin strongly emphasizes their coordinated governance and sustainable urban growth [3]. Comparing these primary administrative hubs along the basin gradient provides a necessary and unified scientific foundation for regional thermal environment management under these shared ecological and policy frameworks.
Urban development is fundamentally a multifaceted process encompassing population aggregation, economic concentration, and land transformation. Because a single metric cannot comprehensively capture these dynamic spatial changes, early research relying on singular indicators faced significant constraints: impervious surfaces only reflect physical land alteration, population statistics suffer from unit discrepancies, and economic data are difficult to spatialize. To overcome this, satellite-derived NTL data has emerged as a superior proxy, capable of comprehensively representing urban vitality at the grid scale [35,36]. Its pixel values have substantial connections with metrics like economic density, population density, and urban development levels [18,22]. While researchers have widely utilized NTL data to investigate urban development and LST correlations at various administrative levels, a critical gap remains. The existing literature has rarely examined the comparative heterogeneity of these connections across core cities in the upper, middle, and lower reaches of the Yellow River over an extended period from 2000 to 2023. Neglecting this watershed-scale gradient obscures the distinctive associative qualities of different river segments. Therefore, this study amalgamates NTL and land use data to quantify long-term urban development processes, establishing a robust platform for further LST correlation analysis and mechanism interpretation.
The current study has established a core framework that includes data collection, indicator measurement, connection analysis, and mechanism interpretation to evaluate the interactions between urban development and Land Surface Temperature (LST) in the Yellow River Basin from 2000 to 2023. Within this framework, we utilized three primary methods: First, the Sen + Mann–Kendall (MK) test [31,37] identifies long-term temporal trends and critical shifts in the thermal environment. Second, the Standard Deviation Ellipse (SDE) [38] is applied to track the spatial dynamics of urban development and the thermal environment. By analyzing the distribution centers and dominant expansion directions of NTL and LST, this method visually demonstrates whether their spatial evolutions are synchronous and coordinated. Finally, a Geographically Weighted Regression (GWR) model [39] incorporates NTL and Digital Elevation Model (DEM) data to quantify the spatial heterogeneity and localized driving forces of LST. By seamlessly integrating these techniques, this approach offers robust support for tackling critical inquiries: “How does urban development affect LST? What are the distinguishing factors among different categories of core cities?” This methodology ensures the accuracy and methodical quality of the study findings.
To address the aforementioned limitations, this study selects the core cities of the Yellow River Basin as the research area. The specific research objectives are: (1) to clarify the spatiotemporal correlation characteristics between urban development and LST from 2000 to 2023; (2) to identify the spatial drivers of urban development and LST within the basin; and (3) to develop gradient-based optimization strategies for thermal environment management. By achieving these objectives, this study provides a vital scientific foundation for understanding urban–thermal environment interactions in temperate semi-arid and semi-humid watersheds. More importantly, it directly supports China’s national strategy, the “Outline of Ecological Conservation and High-Quality Development in the Yellow River Basin” [40], by offering precise, watershed-specific guidance for reconciling rapid urban expansion with regional ecological security.
2. Materials and Methods
2.1. Introduction to the Study Area
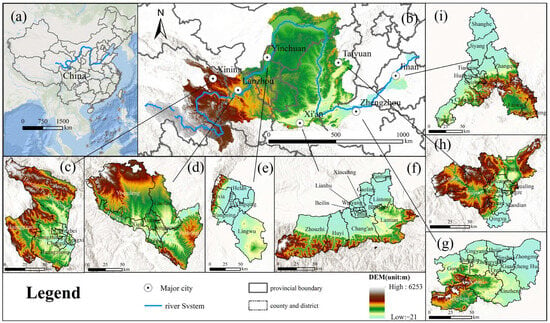
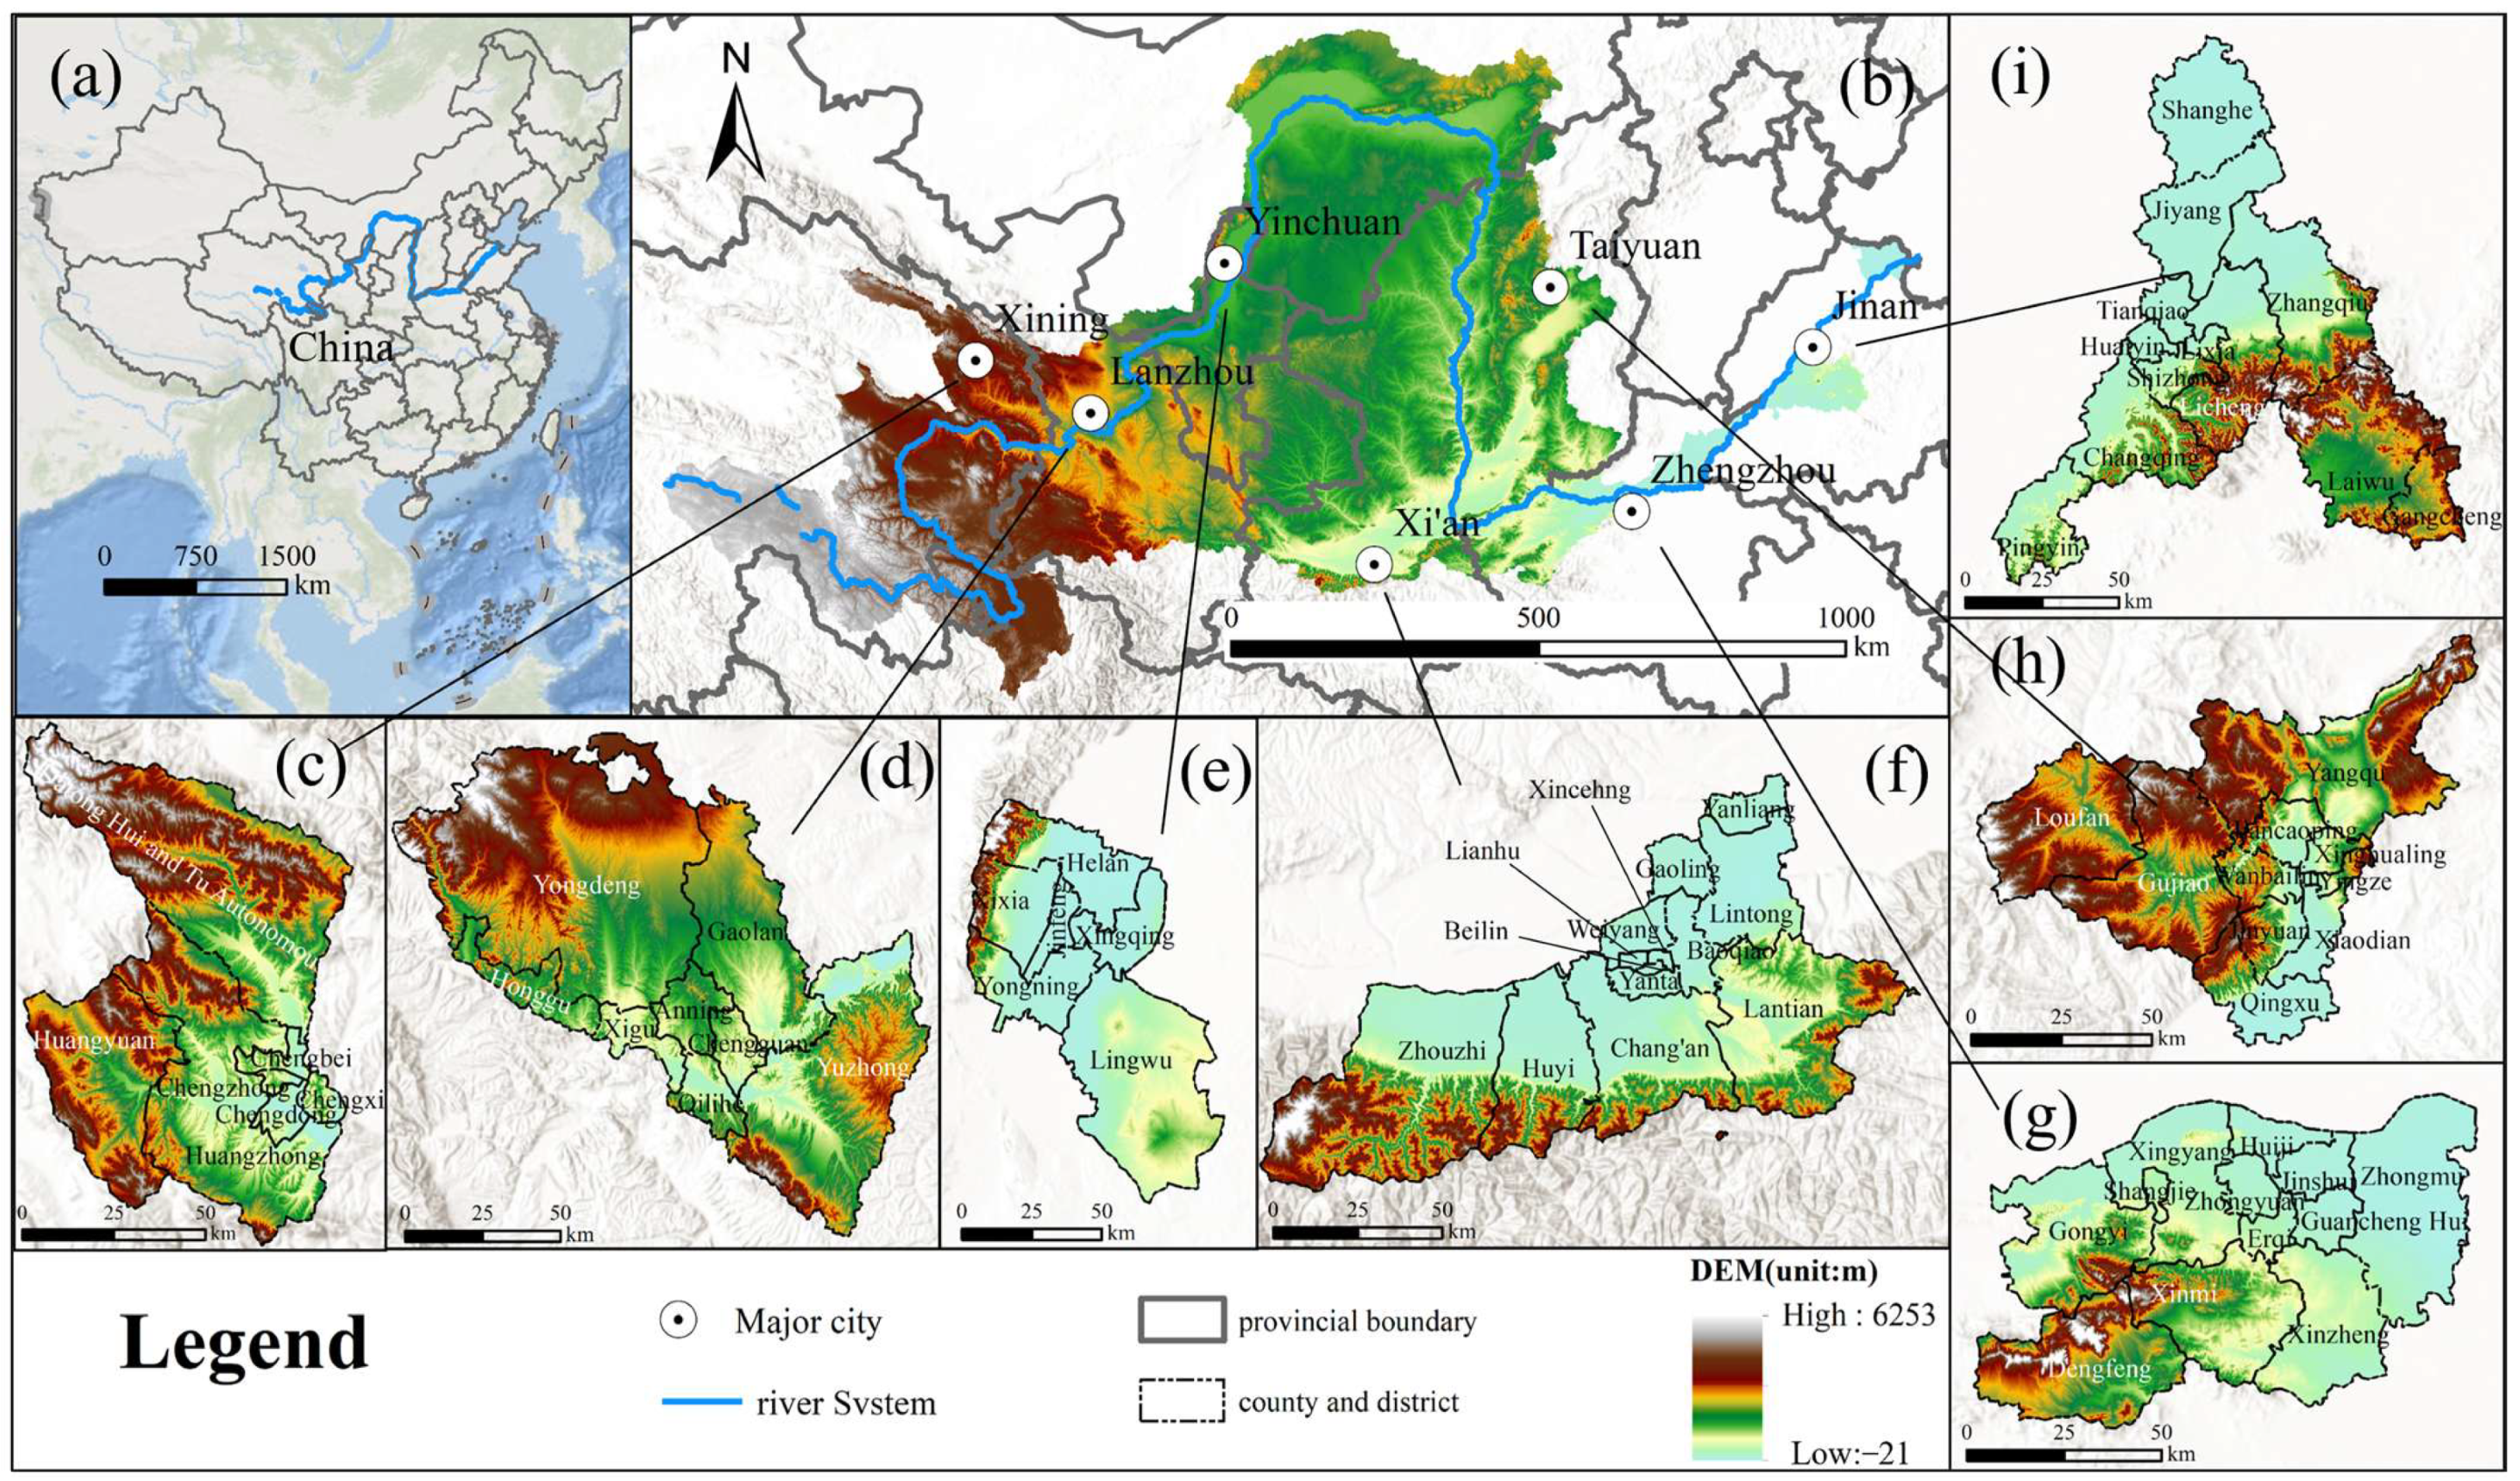
The core cities of the Yellow River Basin consist of seven urban centers: Jinan in Shandong Province and Zhengzhou in Henan Province in the lower reaches; Taiyuan in Shanxi Province and Xi’an in Shaanxi Province in the middle reaches; and Lanzhou in Gansu Province, Yinchuan in Ningxia Hui Autonomous Region, and Xining in Qinghai Province in the upper reaches (Figure 1). Geographically, they are strategically distributed across all flow sections, perfectly capturing the complete spatial gradient and diverse topographical conditions of the entire watershed.
Figure 1.
Overview of the study area (seven core cities in the Yellow River Basin). (a) location of the Yellow River Basin in China; (b) elevation of the Yellow River Basin; (c) Xining; (d) Lanzhou; (e) Yinchuan; (f) Xi’an; (g) Zhengzhou; (h) Taiyuan; (i) Jinan. Note: This map is drawn based on the standard map of the Map Technology Review Center of the Ministry of Natural Resources (Map Review No.: GS (2023)2767). The boundary of the base map remains unchanged, and the same applies hereinafter).
These seven cities were defined and selected as the core cities primarily due to their critical administrative levels, immense economic contributions, and substantial population sizes. As provincial or regional capitals, they function as the principal implementation areas for the national strategy of ecological conservation and high-quality development in the Yellow River Basin [40], serving as its absolute political, economic, and cultural centers. They act as crucial hubs linking industrial, demographic, and resource components throughout eastern, central, and western China. As of 2023, these cities collectively concentrate a permanent population of over 50.79 million and generate a total Gross Regional Product exceeding 5 trillion yuan, representing the most significant demographic and economic concentration within the basin.
2.2. Data Sources
- (1)
- For summer LST, the 8-day LST product (MOD11A2, Collection 6.1) from the MODIS sensor on the Terra satellite was selected. The research was conducted from 2000 to 2023 to ensure data stability, with summer defined as June to August. For the calculation of the summer mean LST, 11 to 12 eight-day composite images were integrated per year; specifically, 11 images were used for the year 2001, and 12 images for all other years. Data processing was performed on the Google Earth Engine (GEE) platform https://earthengine.google.com (accessed on 6 January 2026). To ensure high data quality, the Quality Control (QC) bands—namely, QC_Day and QC_Night—were strictly utilized. By extracting Bits 0–1, which serve as the Mandatory QA flags, pixels affected by cloud contamination or categorized as poor quality were masked out. Following this QA filtering, a valid physical threshold mask between −50 °C and 70 °C was applied to eliminate any remaining extreme outliers. Furthermore, to address data gaps often observed in glacial or persistent cloud-covered areas, a 3 × 3 pixel focal mean interpolation was implemented for spatial completion before computing the final summer average LST.
- (2)
- Land use data were acquired from the 30 m spatial resolution dataset supplied by the Resource and Environment Science and Data Center of the Chinese Academy of Sciences. The national categorization framework’s basic system was employed to classify land use types in the research region into cropland, woodland, grassland, water bodies, built-up land, and unused land.
- (3)
- NTL statistics were obtained from the United States National Geophysical Data Center (NGDC) and the Earth Observation Group (EOG), spanning from 2000 to 2023. A systematic preparation workflow was initially executed on the raw data. This entailed fusion-based denoising to eliminate artifacts from moonlight, cloud shadows, and incidental light sources; spatial clipping utilizing the study area’s vector boundary; and radiometric correction to standardize the data. Integrating DMSP–OLS and NPP–VIIRS datasets presents two primary challenges: the intrinsic pixel saturation of DMSP-OLS in metropolitan centers, and the systematic scale gap between the dimensionless DMSP–OLS data and the radiometrically calibrated NPP–VIIRS data.
To address the first challenge, this study utilizes current research [41,42] and implements the Vegetation-Adjusted NTL Index (VANUI) to desaturate DMSP/OLS data from 2000 to 2013 for successful data integration. The particular formula is as follows:
In the formula, NDVI signifies the Normalized Difference Vegetation Index; denotes the normalized DMSP/OLS NTL pixel values; and VANUI indicates the desaturated NTL index value.
Furthermore, to address the second challenge and achieve seamless longitudinal integration between the two different sensors, a rigorous cross-sensor calibration was conducted on the GEE platform. Concurrent observation samples were extracted across the study area by pairing the 2013 VANUI-corrected DMSP–OLS with the initial 2014 NPP–VIIRS data. A second-degree polynomial regression model was established (R2 = 0.7086) to translate the NPP–VIIRS radiance values into the simulated DMSP–OLS scale. The derived calibration formula is expressed as:
By applying this robust calibration model to the 2015 and 2023 NPP–VIIRS data, a highly consistent and comparable long-term NTL time-series dataset (2000–2023) was successfully synthesized. To ensure data continuity, temporal consistency tests were conducted across consecutive study periods. The correlation coefficients for the paired datasets all surpass 0.84, with each connection being statistically significant at the 0.01 level (Table 1). Furthermore, a first-order autoregressive (AR(1)) test confirmed the temporal stability of the integrated series, with lag-1 coefficients for all seven core cities ranging from 0.844 to 0.883 (p < 0.01). The aforementioned results demonstrate that the combined desaturation and cross-calibration processing successfully eradicated saturation bias and scale discrepancies, rendering the dataset appropriate for long-term time series research.
Table 1.
Temporal consistency verification of NTL data across consecutive study nodes (2000–2023).
- (4)
- Socio-economic data, including the permanent resident population, urbanization rate, and Gross Domestic Product (GDP) for the core cities in the Yellow River Basin, were employed in this study. All data were obtained from officially published local statistical yearbooks (e.g., Jinan Statistical Yearbook 2024, Xining Statistical Yearbook 2024, Gansu Statistical Yearbook 2024) compiled by the respective administrative units and released by China Statistics Press. These official statistics are characterized by high completeness and reliability. To quantitatively validate the effectiveness of NTL as a proxy for urban development intensity in this specific basin, a Pearson correlation analysis was conducted, and the highly significant positive correlations between total NTL and these socio-economic metrics are detailed in Appendix A (Table A1).
2.3. Research Methods
2.3.1. Data Preprocessing and Classification of Land Surface Temperature Levels
To address inconsistencies in spatial resolution and units across multi-source raster data and uphold the scientific rigor and consistency of subsequent spatial analyses, thorough preprocessing was conducted on the core data used in the study. Taking into account the size attributes of the Yellow River Basin and the study aim regarding urban–thermal environment interactions, a target resolution of 1 km × 1 km was established, ensuring a balance between data preservation and computing performance. All raster data were standardized with the resampling tool in ArcGIS 10.8 to achieve a consistent scale. Bilinear interpolation was utilized for upscaling NTL data to preserve the numerical continuity of NTL values and appropriately represent the gradual fluctuations in human activity intensity. The mean resampling approach was utilized for LST data to reduce the impact of individual outliers on regional temperature attributes. Mean resampling was utilized to downscale both digital elevation models and land use data. This method harmonized terrain detail with the retention of surface information while attaining congruence with the desired resolution. After resampling, spatial consistency tests were performed to ensure that the data accuracy satisfied the criteria for further analysis.
We adopted the “grid sampling–multi–value extraction” approach from previous studies to generate standardized spatial analysis units. Utilizing administrative boundary vector data from seven cities within the Yellow River watershed, we produced a 1 km × 1 km regular grid employing the grid generation feature of ArcGIS 10.8. The grid vertices were subsequently transformed into sample points. Thereafter, the pixel values of the resampled NTL, LST, DEM, and land use raster data were spatially linked to their corresponding grid sampling points, creating a one-to-one sample dataset. This offers a cohesive fundamental sample unit for future analysis, including Sen + MK trend tests, bivariate spatial autocorrelation, and GWR.
The substantial variations in core variable dimensions, together with inconsistencies from multi-source sensors and multi-phase climatic changes, diminish data comparability and undermine the credibility of multivariate modeling or spatiotemporal dynamic analyses.
In the formula, v denotes any data point in the original dataset (radiation values for NTL or temperature values for LST); signifies the minimum value in the original dataset; indicates the maximum value in the original dataset; represents the normalized result, with a value range of [0, 1].
2.3.2. The Classification of Land Surface Temperature Levels
The research region was categorized into five thermal zones based on LST using the mean-standard deviation method [43]: high-temperature zone, sub-high-temperature zone, medium-temperature zone, sub-low-temperature zone, and low-temperature zone [37]. The high-temperature and sub-high-temperature areas were designated as heat island zones. Table 2 presents the specific categorization criteria.
Table 2.
LST classification criteria and value interval.
2.3.3. Theil–Sen Median Trend Analysis and Mann–Kendall Test
The Sen + MK trend test is a non-parametric statistical technique employed to identify trend alterations [44] in time series data. This work employs this approach to examine LST trends in the Yellow River watershed from 2000 to 2023, thereby enabling the detection of long-term alterations in urban development and LST.
Employing Sen’s slope analysis to assess LST changes in the Yellow River watershed during the last twenty years:
In the formula, using LST as an example, xi and xi denote the sequence values for indices I and j, respectively, where 2000 ≤ i < j ≤ 2023. A positive β signifies an elevation in LST, whereas a negative β denotes a reduction. This approach has benefits over parametric statistics since it accommodates missing values in time series data and does not necessitate adherence to any particular distribution. The Mann–Kendall (MK) test assesses the importance of trends in variation. The computation can be articulated as follows: For a series of numbers xi = (x1, x2, …, xn), the statistic S is computed as
In the formula, xi and c represent the sequence values of I and j, respectively. When n ≥ 10, the statistical value S approximates a normal distribution, and the Z-value can be used for trend testing:
In the formula, n denotes the quantity of data points in the series, whereas the statistical value Z varies from (−∞, +∞). At a certain significance level α, when , it signifies that the sequence demonstrates substantial variance at the α level. This study utilized α = 0.05 and α = 0.01. According to trend analysis and statistical test outcomes, the variations in each variable are categorized into three levels: (1) Significant Decrease (Slope < 0, p < 0.05); (2) Non-Significant Change (Slope < 0 and Slope > 0, p > 0.05); (3) Significant Increase (Slope > 0, 0.01 < p < 0.05).
2.3.4. Standard Deviation Ellipse
The standard deviation ellipse (SDE) is a technique employed to delineate geographical distribution patterns. Calculating parameters such as the ellipse’s center, major axis, minor axis, and azimuth elucidates characteristics like the geographical distribution center, range, and directional trends of elements [37]. This study creates a two-dimensional scatter plot utilizing the grid pixels of NTL on the x-axis and LST on the y-axis. Employing standard deviation ellipses to delineate substantially grouped scatter zones, thoroughly elucidating the association between NTL and LST.
In the formula, P signifies the center coordinates of the standard deviation ellipse; and denote the coordinates of the NTL and LST two-dimensional scatter points I, respectively; n represents the total number of scatter points; R indicates the direction angle of the standard deviation ellipse, illustrating the predominant direction of the two-dimensional scatter distribution. The sensitivity of LST to NTL response is evident: a lower value corresponds to a steeper slope in the scatter distribution, signifying that a one-unit increase in NTL leads to a more substantial rise in LST. D serves as the indicator of directionality; a greater value signifies a more pronounced directionality in the distribution of the scatter plot. S serves as the dispersion indicator; a larger value signifies an increased degree of dispersion in the scatter plot.
2.3.5. Bivariate Spatial Autocorrelation
Bivariate spatial autocorrelation analyzes geographical correlations between two variables, including both global and local spatial autocorrelation [45]. The global bivariate Moran’s I index evaluates the spatial correlation between two variables over the whole research region. The Local Index of Spatial Autocorrelation (LISA) identifies spatial connection patterns between two variables in localized areas, including high–high clustering, low–low clustering, high–low clustering, and low–high clustering. This work utilizes GeoDa (version 1.22.0.21) to compute the bivariate spatial autocorrelation indices between urban development and LST in the Yellow River Basin, with the objective of examining their geographical correlation features.
In the formula, I signifies the bivariate global spatial autocorrelation index, indicating the overall spatial correlation between variables x and y; n represents the total number of spatial units; is the spatial weight matrix formulated via the K-nearest neighbor method; and denote the observed values of the independent and dependent variables in spatial units I and j, respectively; S2 is the variance of all samples.
The calculation method for the Bivariate Local Moran’s I is as follows:
In the formula, denotes the local spatial connection between the independent and dependent variables in spatial unit i; and indicate the variance-standardized values of the observed data in spatial units i and j, respectively. Four clustering patterns may be inferred from . The LISA (Local Indications of Spatial Association) distribution map graphically represents the clustering and differentiation characteristics of independent and dependent variables in localized regions. Clustering patterns can be classified into four categories: HH (High–High) clustering, where spatial unit i displays a high value of the independent variable and neighboring unit j shows a high value of the dependent variable; LL (Low–Low) clustering, where spatial unit i exhibits a low value of the independent variable and neighboring unit j also exhibits a low value of the dependent variable; LH (Low–High) clustering, where spatial unit i has a low value of the independent variable while neighboring unit j has a high value of the dependent variable; and HL (High–Low) clustering, where spatial unit i possesses a high value of the independent variable while neighboring unit j has a low value of the dependent variable.
2.3.6. Geographically Weighted Regression Model
Geographically Weighted Regression (GWR) is a localized spatial analytic technique aimed at accurately identifying diverse attributes within spatial data connections [46]. GWR enhances conventional global regression methods by including geographic location data into the regression framework, yielding localized parameter estimates for specific spatial units. The formula for calculation is as follows:
In the formula, represents the longitude of the sample point, signifies the latitude of the sample point, indicates the kth independent variable at among n independent variables; and represent the intercept term and the regression coefficient of , respectively; and denote the observed value and the random error term at , respectively. A GIS-based spatial regression analysis addressing geographical heterogeneity was employed, utilizing the GWR model with a fixed kernel function and AICc-optimized bandwidth.
Nighttime light, Digital Elevation Model, and Slope were selected as explanatory variables to capture the interaction between anthropogenic drivers and natural constraints. Nighttime light quantifies socioeconomic intensity and human-induced heat emissions [47]. Digital Elevation Model and Slope represent fundamental topographical constraints that govern local atmospheric diffusion and dictate urban expansion patterns [48].
3. Results
3.1. Analysis of the Spatiotemporal Characteristics of Urban Development and Land Surface Temperature
3.1.1. Spatial and Temporal Distribution Patterns of Urban Development and Thermal Environment
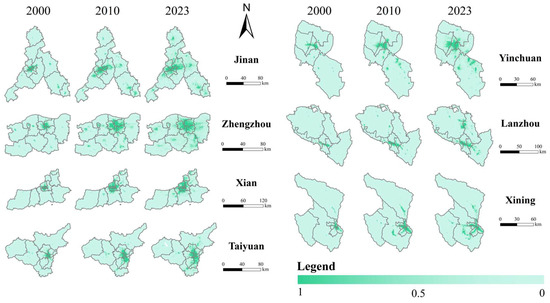
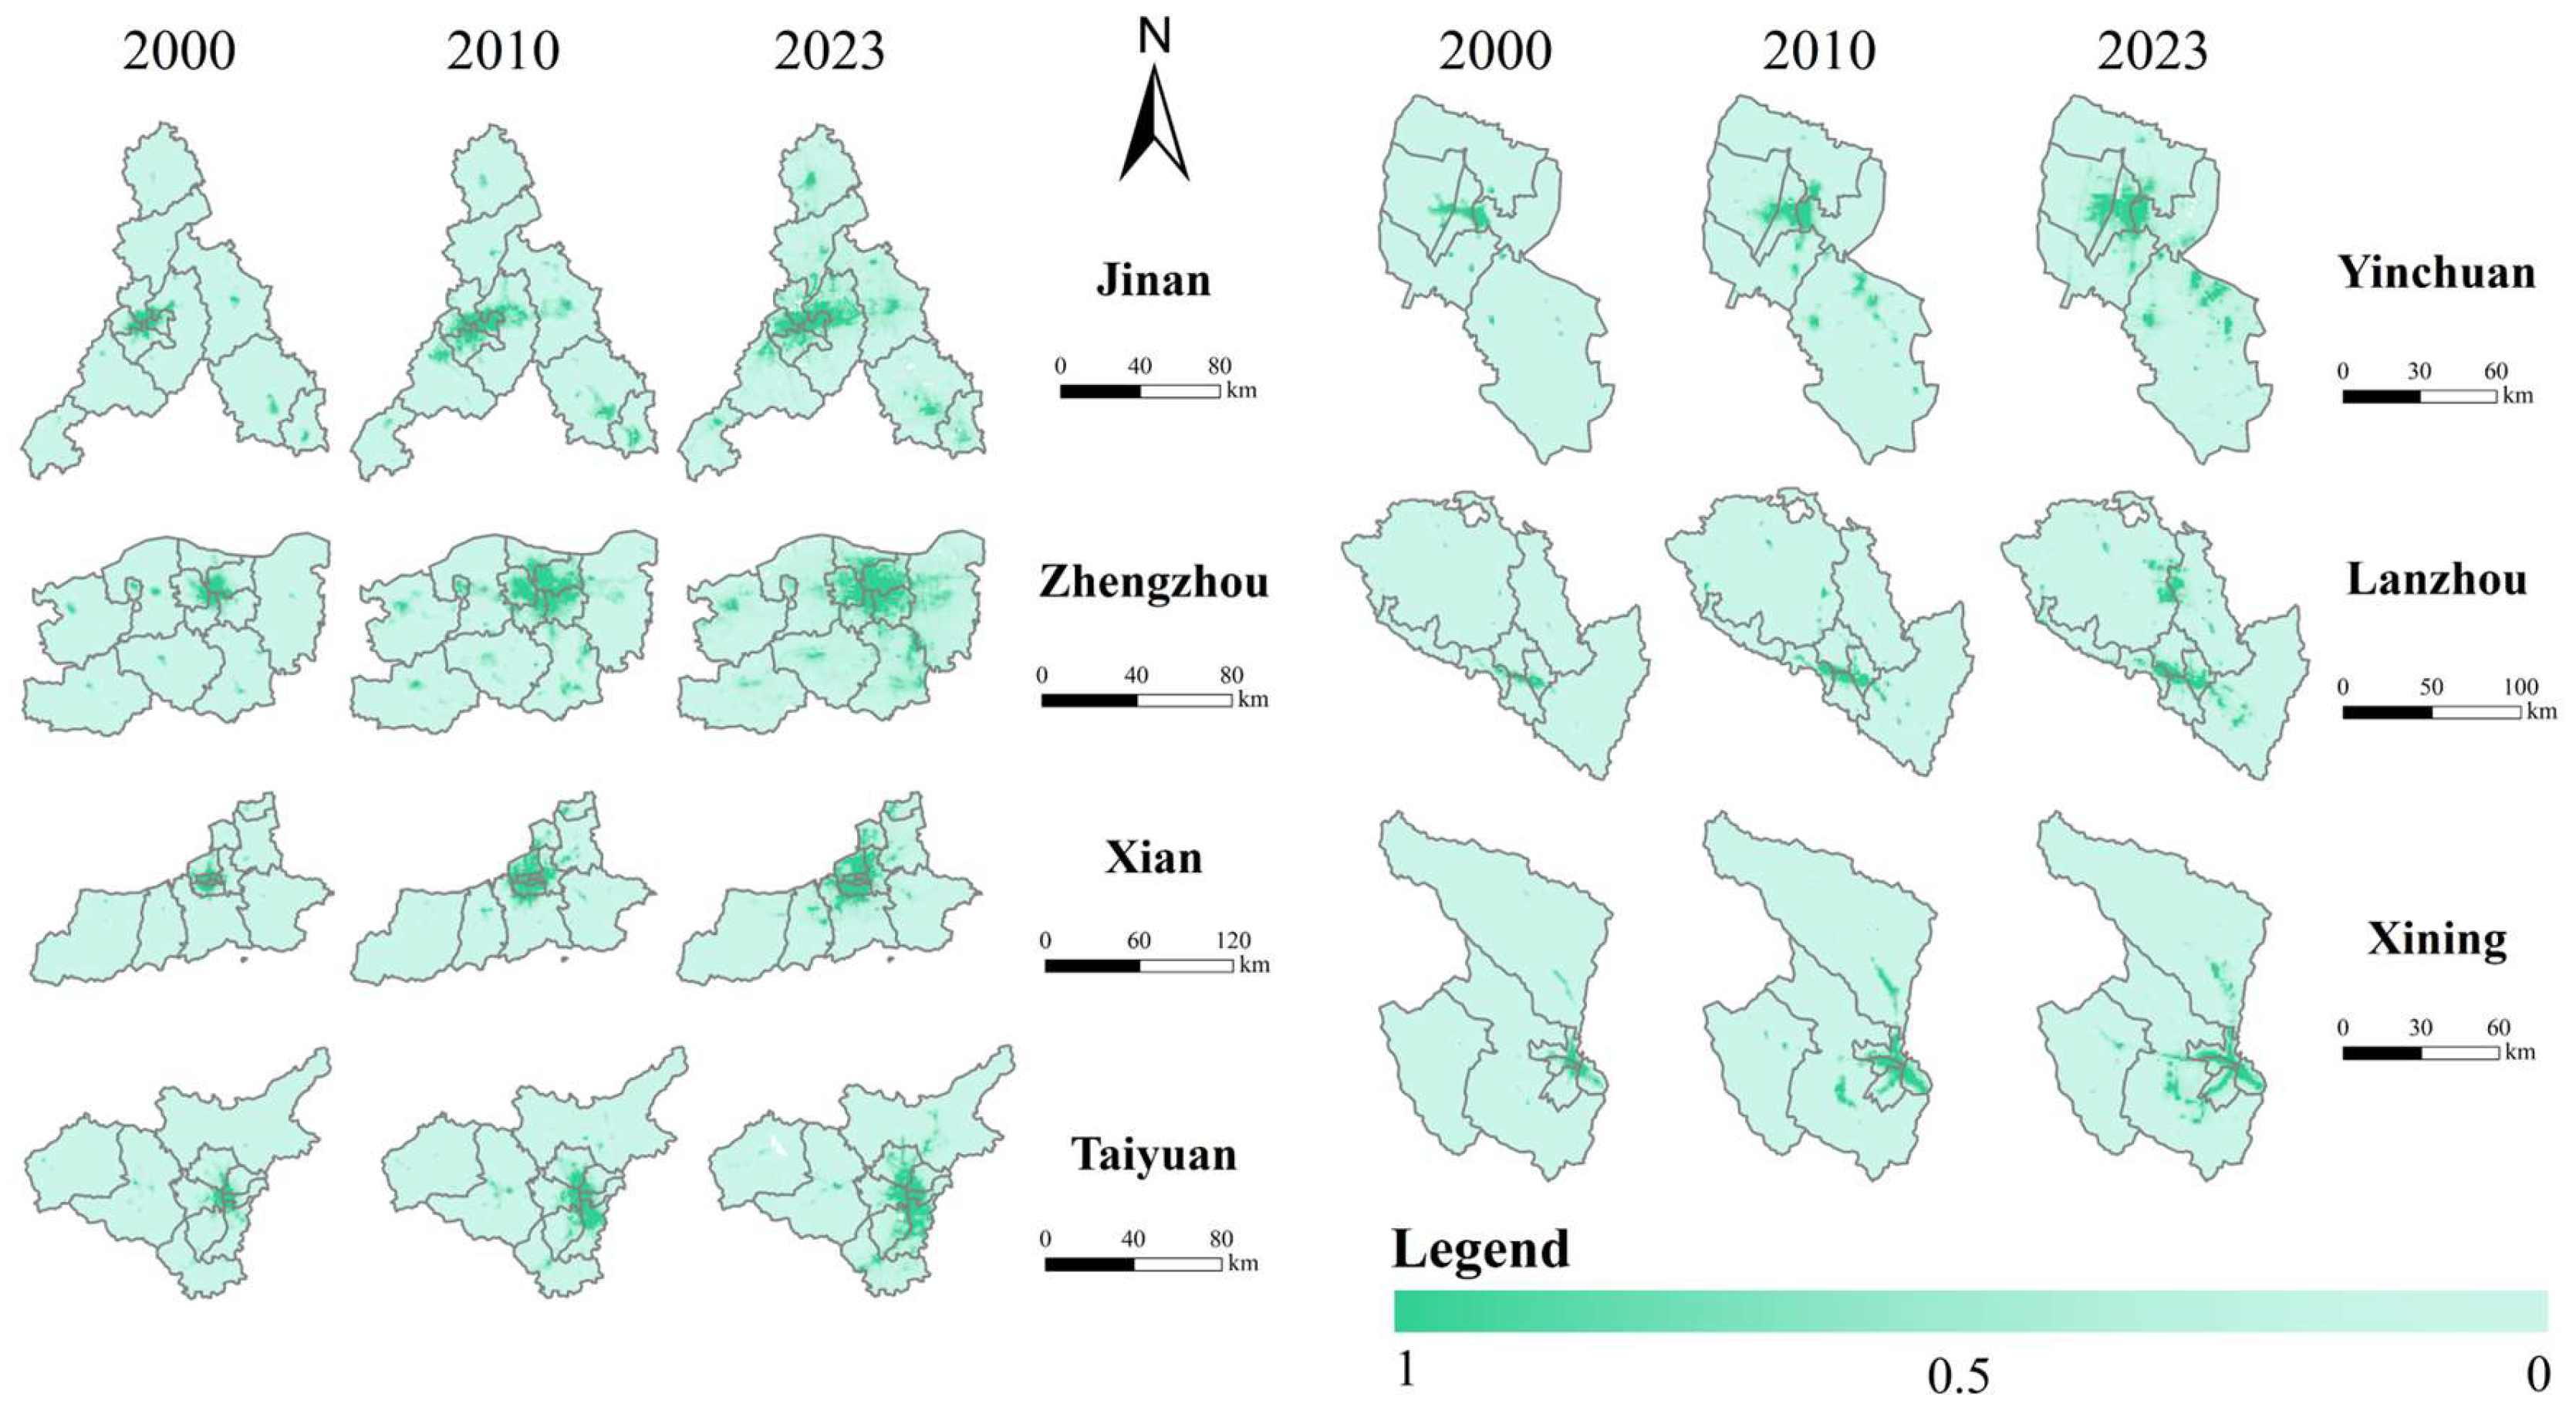
Between 2000 and 2023, high-NTL-value zones in the Yellow River Basin experienced significant expansion, accompanied by remarkable urban development (Figure 2). The high-NTL-value zones in the middle and lower reaches progressively transformed from isolated patches into continuous expanses, demonstrating substantial expansion. At the higher elevations, Lanzhou’s NTL created a slender, elongated corridor along the river valley. The NTL expansion in Yinchuan was constrained, but Xining’s NTL saw growth, albeit in a rather scattered manner. This illustrates the geographical variation in urban development along the high, middle, and lower segments of the Yellow River Basin.
Figure 2.
NTL maps of the seven core cities in the Yellow River Basin (2000–2023).
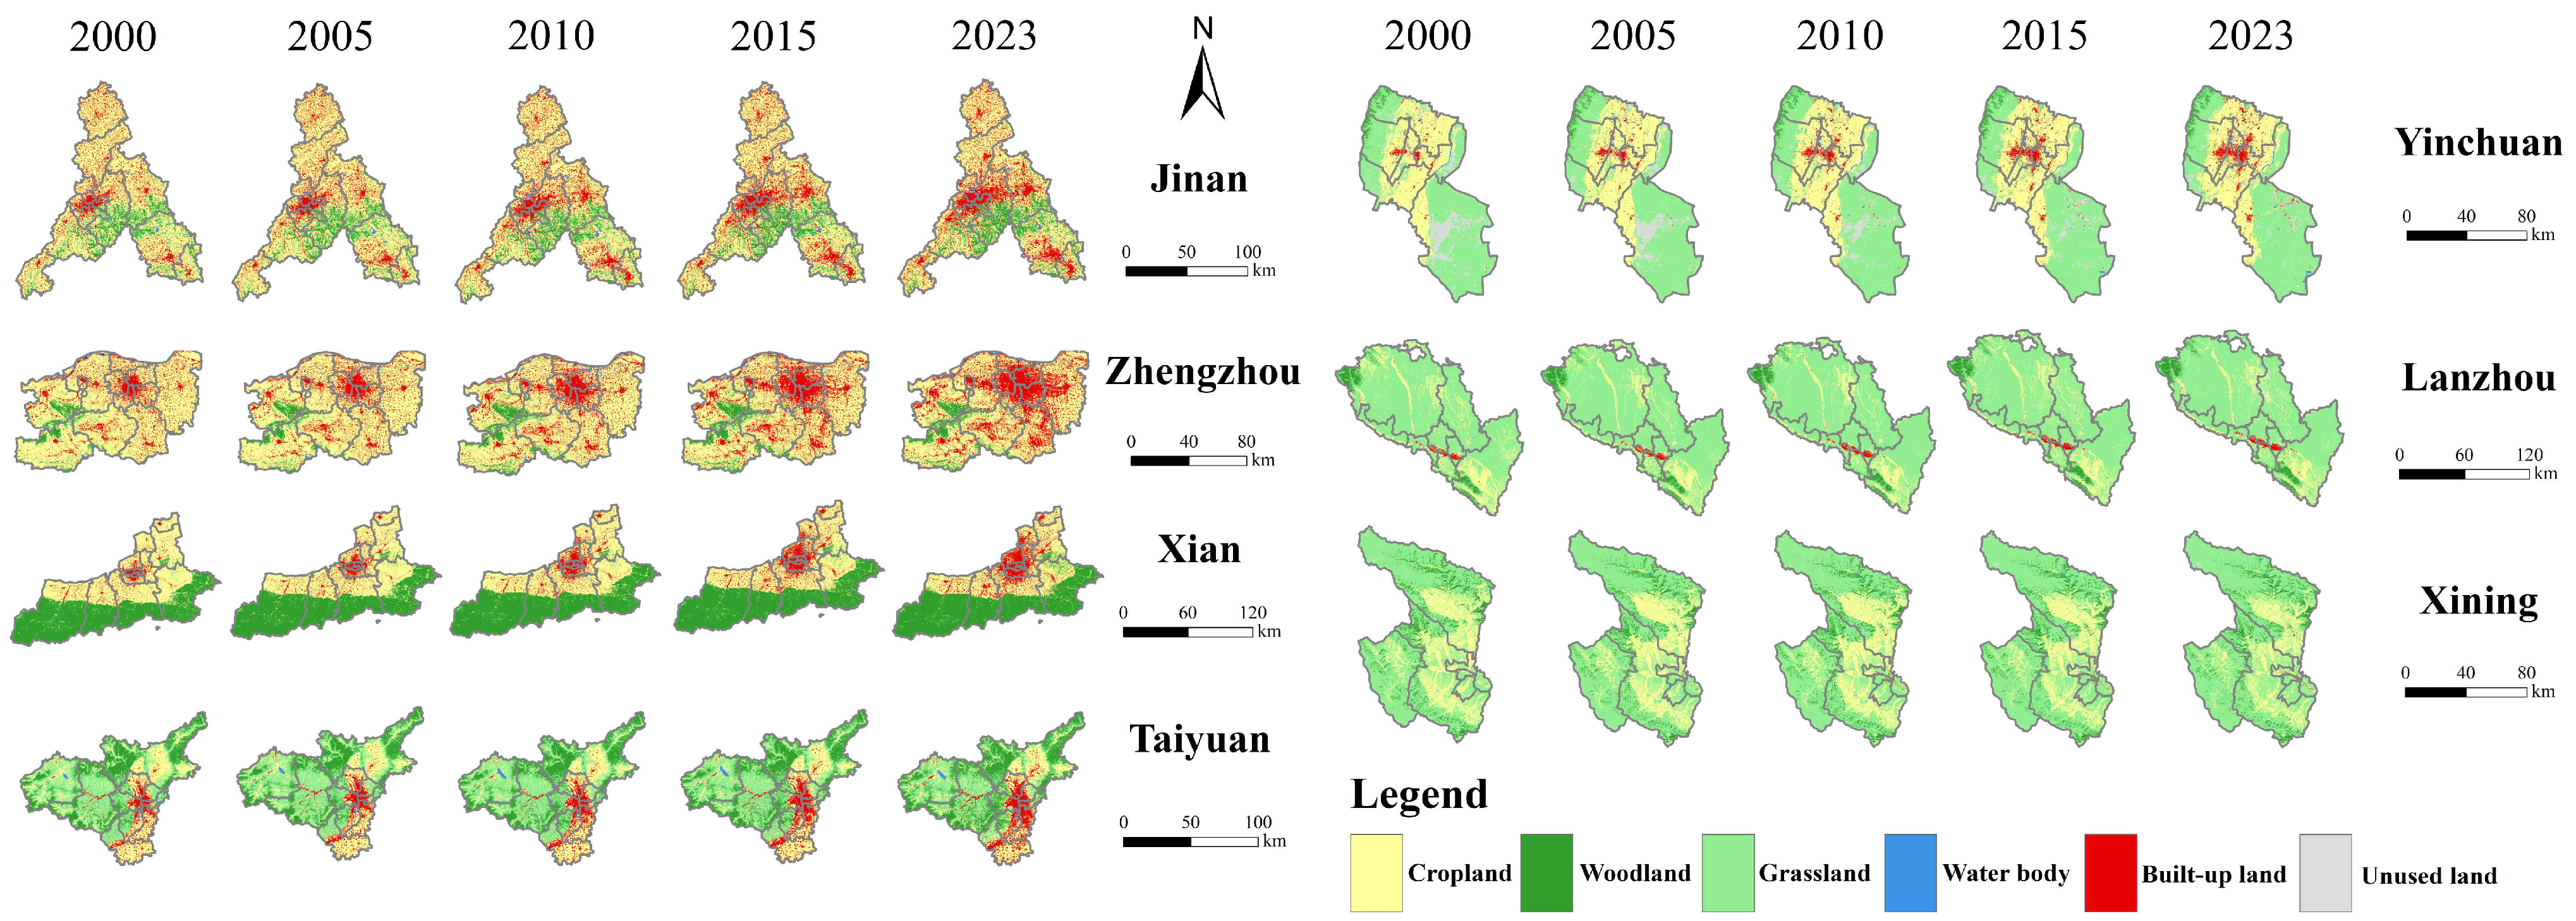
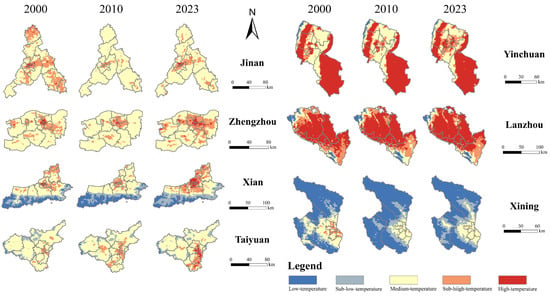
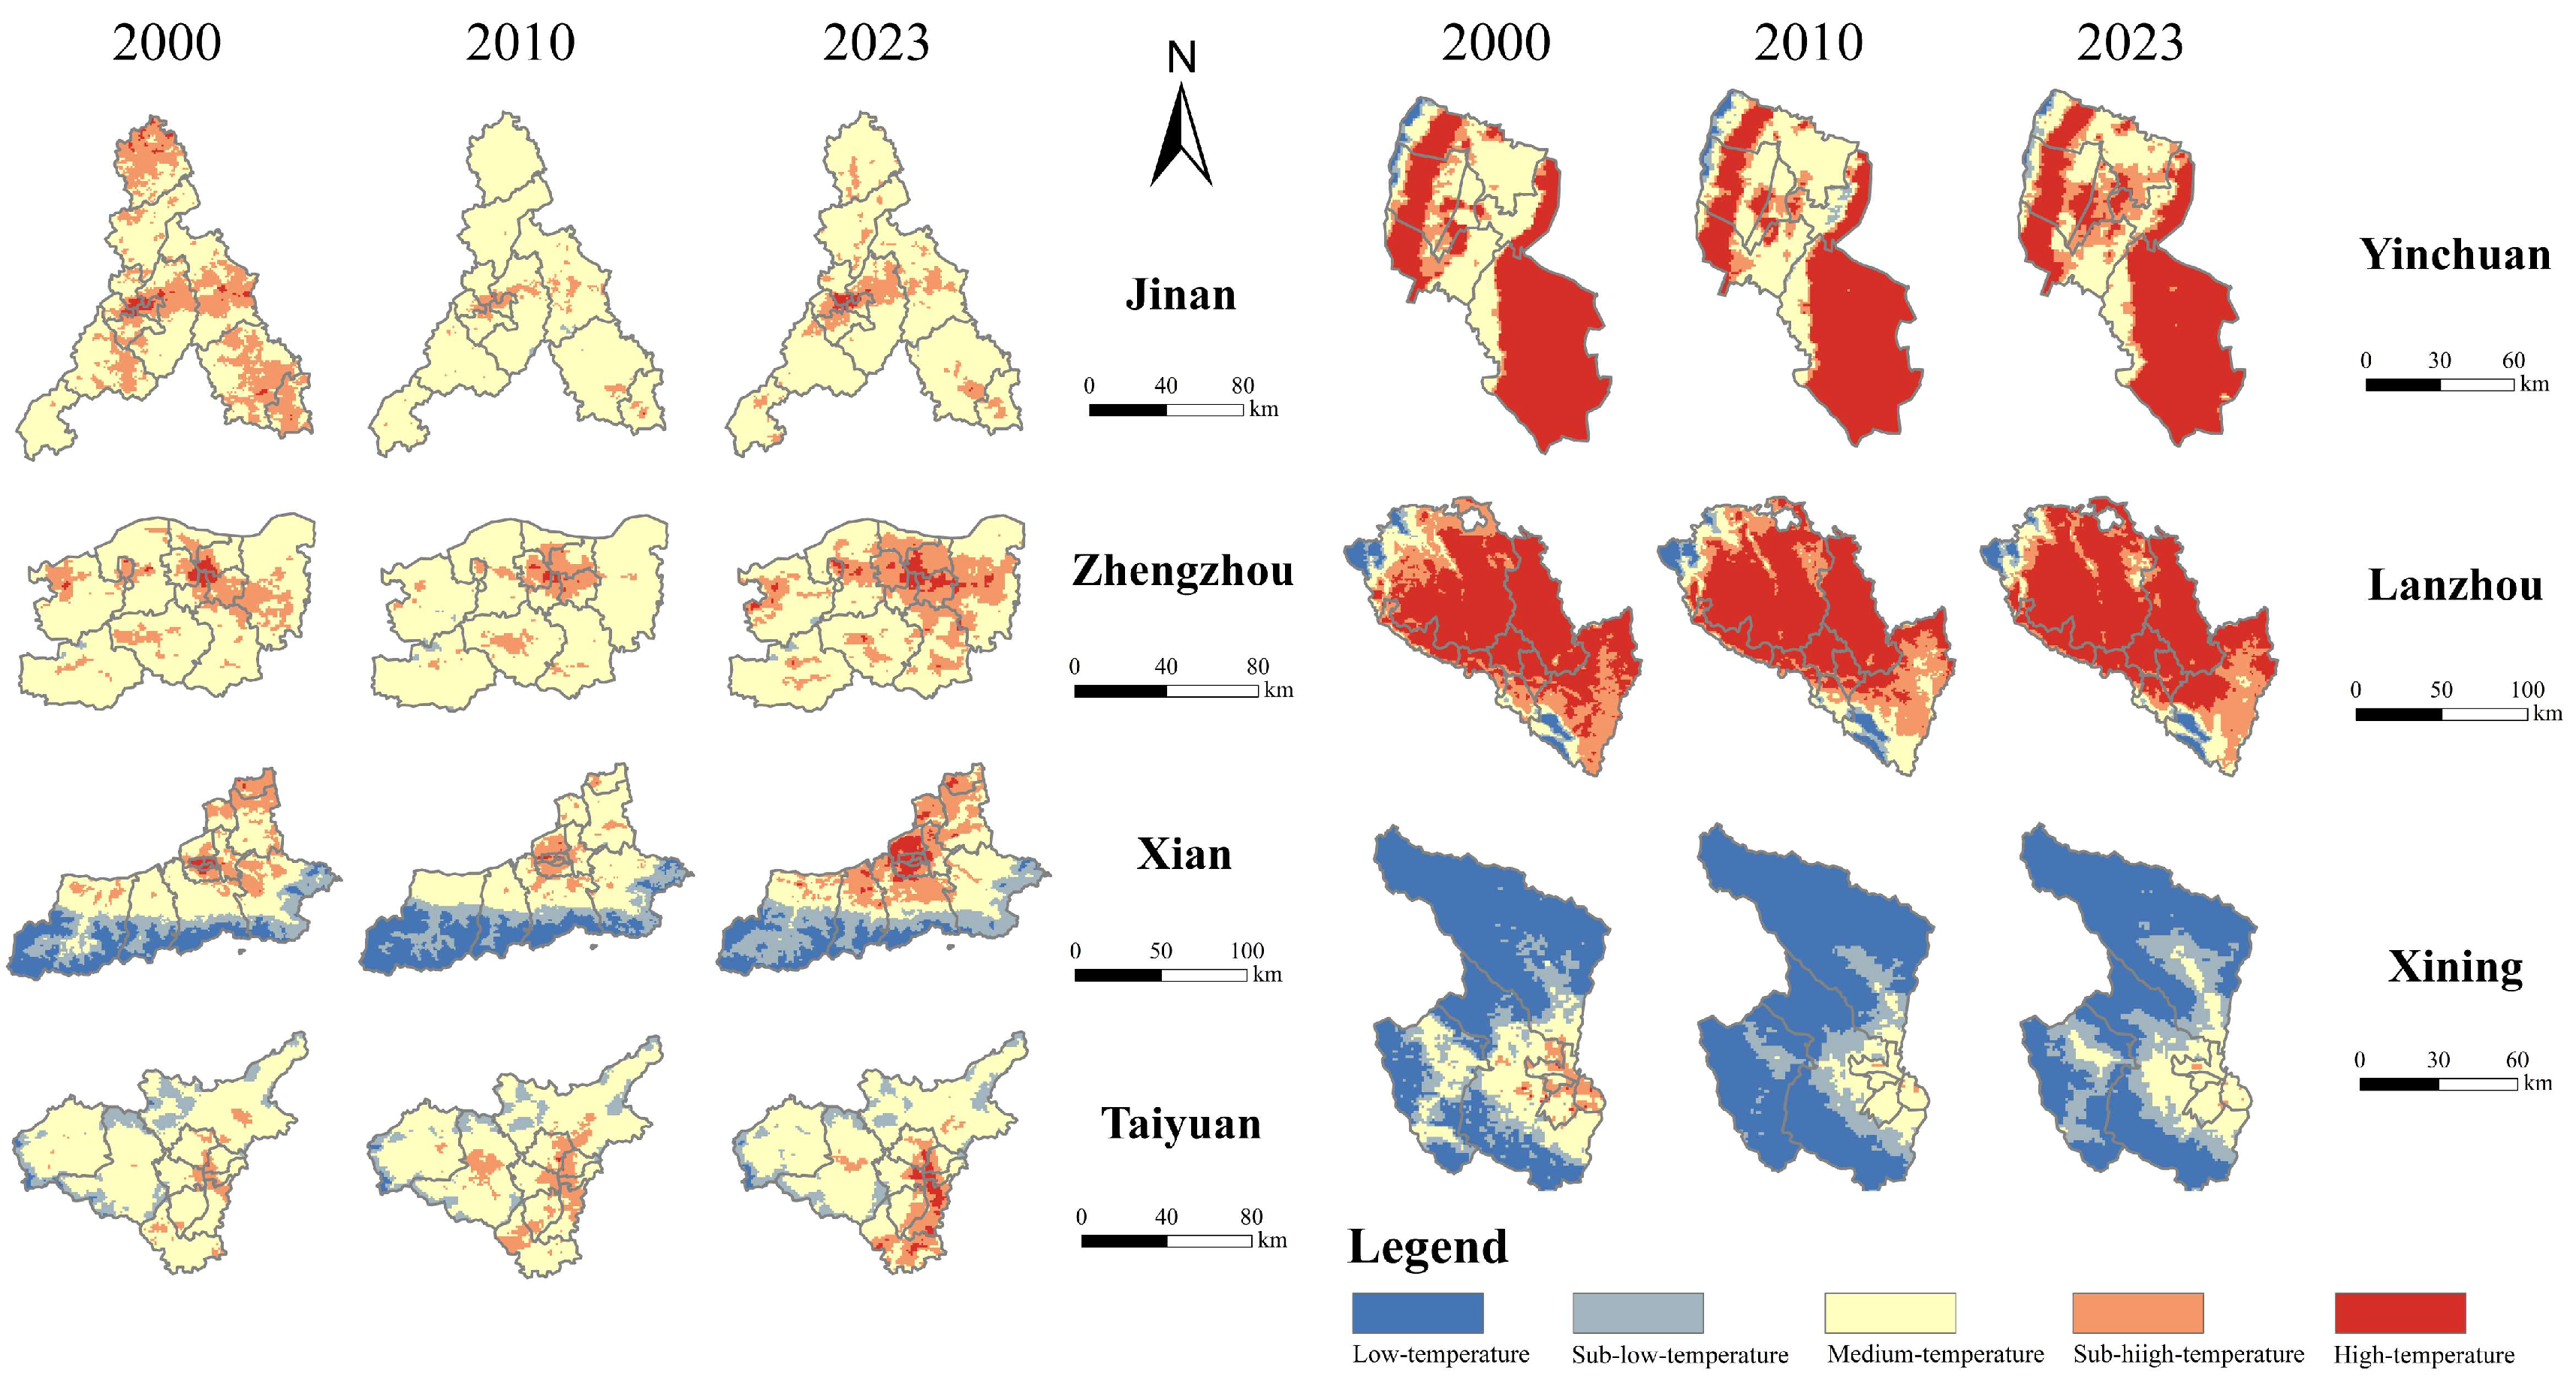
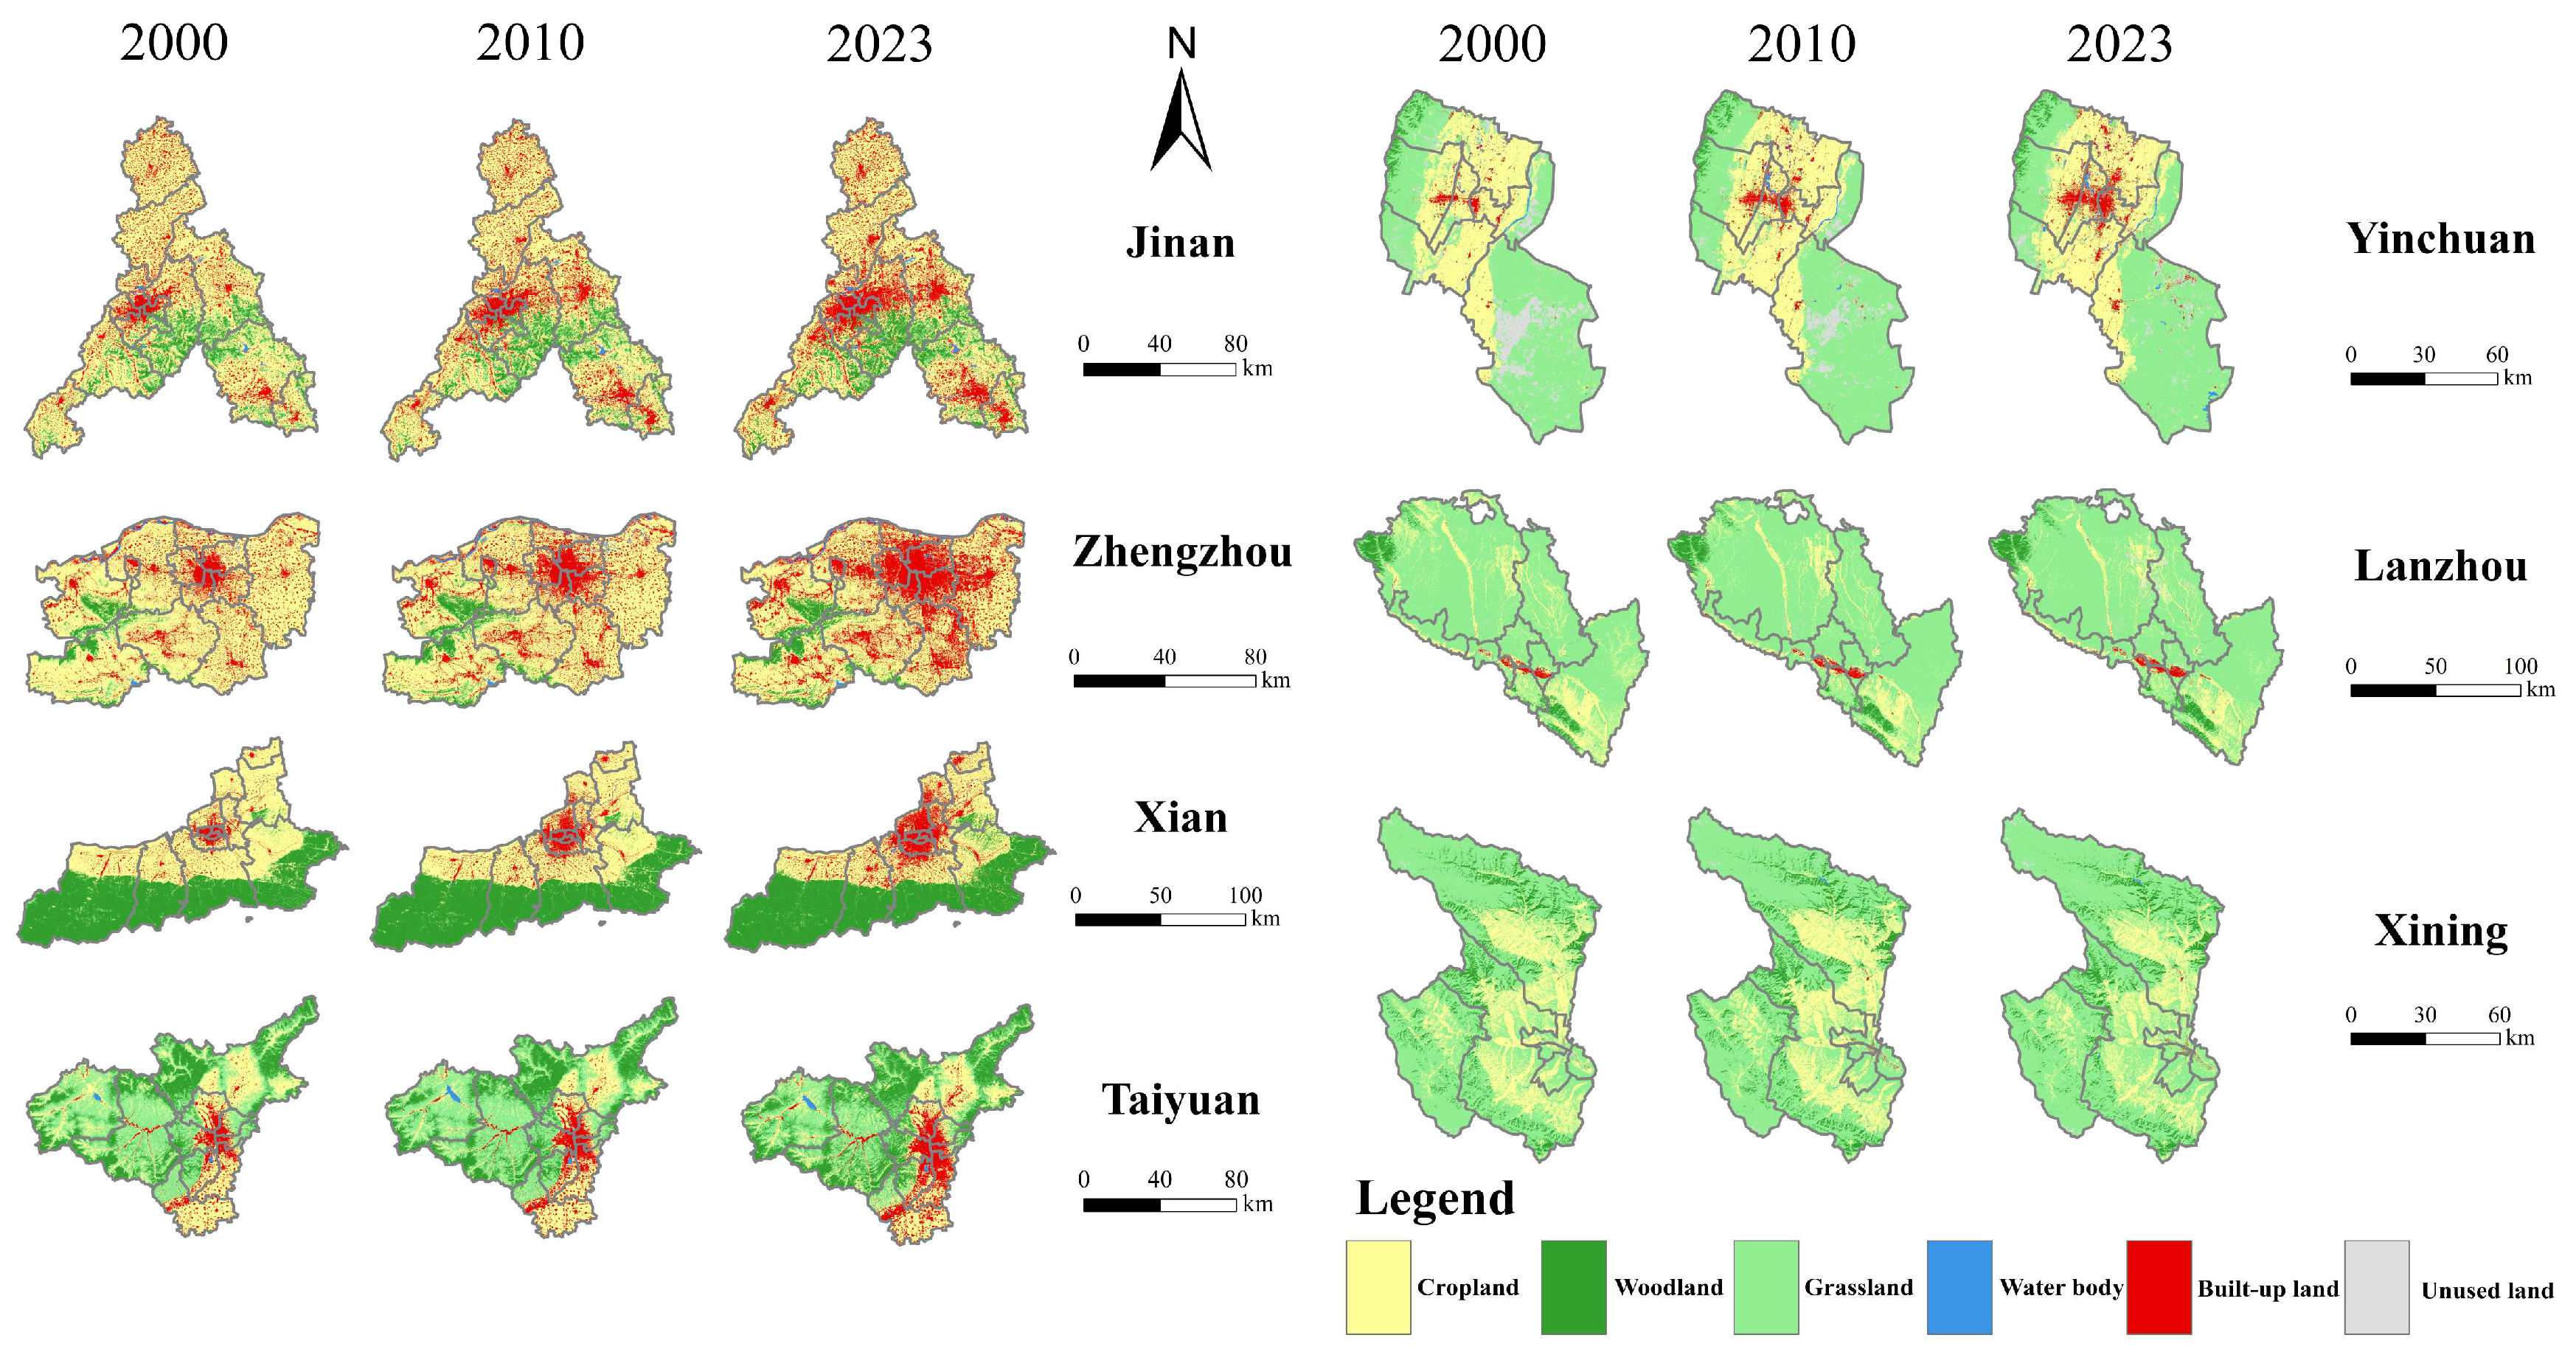
From 2000 to 2023, the urban heat island zones of core cities in the Yellow River Basin transitioned from exposed surfaces to urban areas, a spatiotemporal pattern reflected by the thermal level distribution of LST (Figure 3) and supported by the land use classification map (Figure 4). Detailed five-year-interval classification maps are provided in Appendix A. Between 2000 and 2005, urban development was minimal, leading to a diminished urban heat island impact. High-temperature areas were mostly located in agricultural or uncultivated regions. The exposed surface caused these places to heat quickly under solar radiation, resulting in elevated LST readings. Between 2010 and 2023, the expansion of metropolitan areas exacerbated the urban–rural differential in LST, with heat island zones encroaching toward urban peripheries. In contrast, extensive continuous regions of agricultural land and green spaces, despite increasing LST values, demonstrated a reduction in thermal intensity, shifting to moderate-temperature or sub-high-temperature zones. This phenomenon is especially evident in Zhengzhou. In 2000, elevated temperature zones were dispersed over agricultural land. By 2023, these zones increasingly overlapped with built areas, whereas the thermal intensity of adjacent farms fell markedly. Lanzhou’s built-up land is arranged in an east–west strip centered on the Yellow River valley; nevertheless, the urban heat island effect transcends the limits of these developed regions, creating a high-temperature zone throughout the region, with the river valley at its nucleus. Between 2000 and 2023, the expansion of new development land along river valleys and adjacent regions exacerbated heat buildup. High-temperature zones persisted in their intensification, with heat intensity becoming increasingly noticeable relative to other cities.
Figure 3.
Distribution maps of thermal levels in the seven core cities of the Yellow River Basin (2000–2023).
Figure 4.
Land use classification of the seven core cities in the Yellow River Basin (2000–2023).
Considering the diverse topography of the Yellow River Basin and the correlations between LST distribution, urban development patterns, and terrain, Jinan and Zhengzhou are situated in the lower reaches on plains with extensive landscapes that facilitate large-scale urban development. Taiyuan is situated in the river valley zone of the Loess Plateau’s middle reaches, where urban areas emerge along the valley. Xi’an is situated in a plain area that offers sufficient potential for urban expansion. Lanzhou is confined by the northern and southern mountains bordering the Yellow River Basin, leading to a compact, linear urban layout. Yinchuan is surrounded by vast deserts, while Xining is situated in a river valley on a plateau. Topographical variances result in unique urban development patterns, thereby affecting LST distribution. Urban development occurs rapidly in plains and river valleys, where human activity is concentrated. Impervious surfaces replace natural surfaces, thereby leading to strong heat emission and retention effects that drive the increase in LST. Conversely, urban expansion is limited in mountainous and desert peripheries, where LST is more profoundly affected by natural surfaces, and the influence of urban areas on LST is comparatively diminished.
3.1.2. Time Series Analysis of Land Surface Temperature
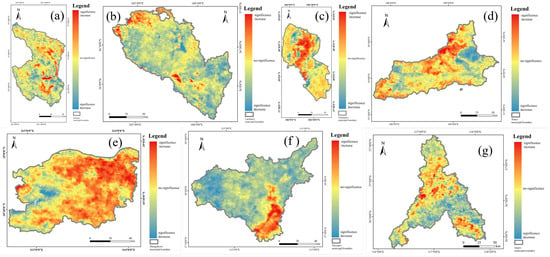
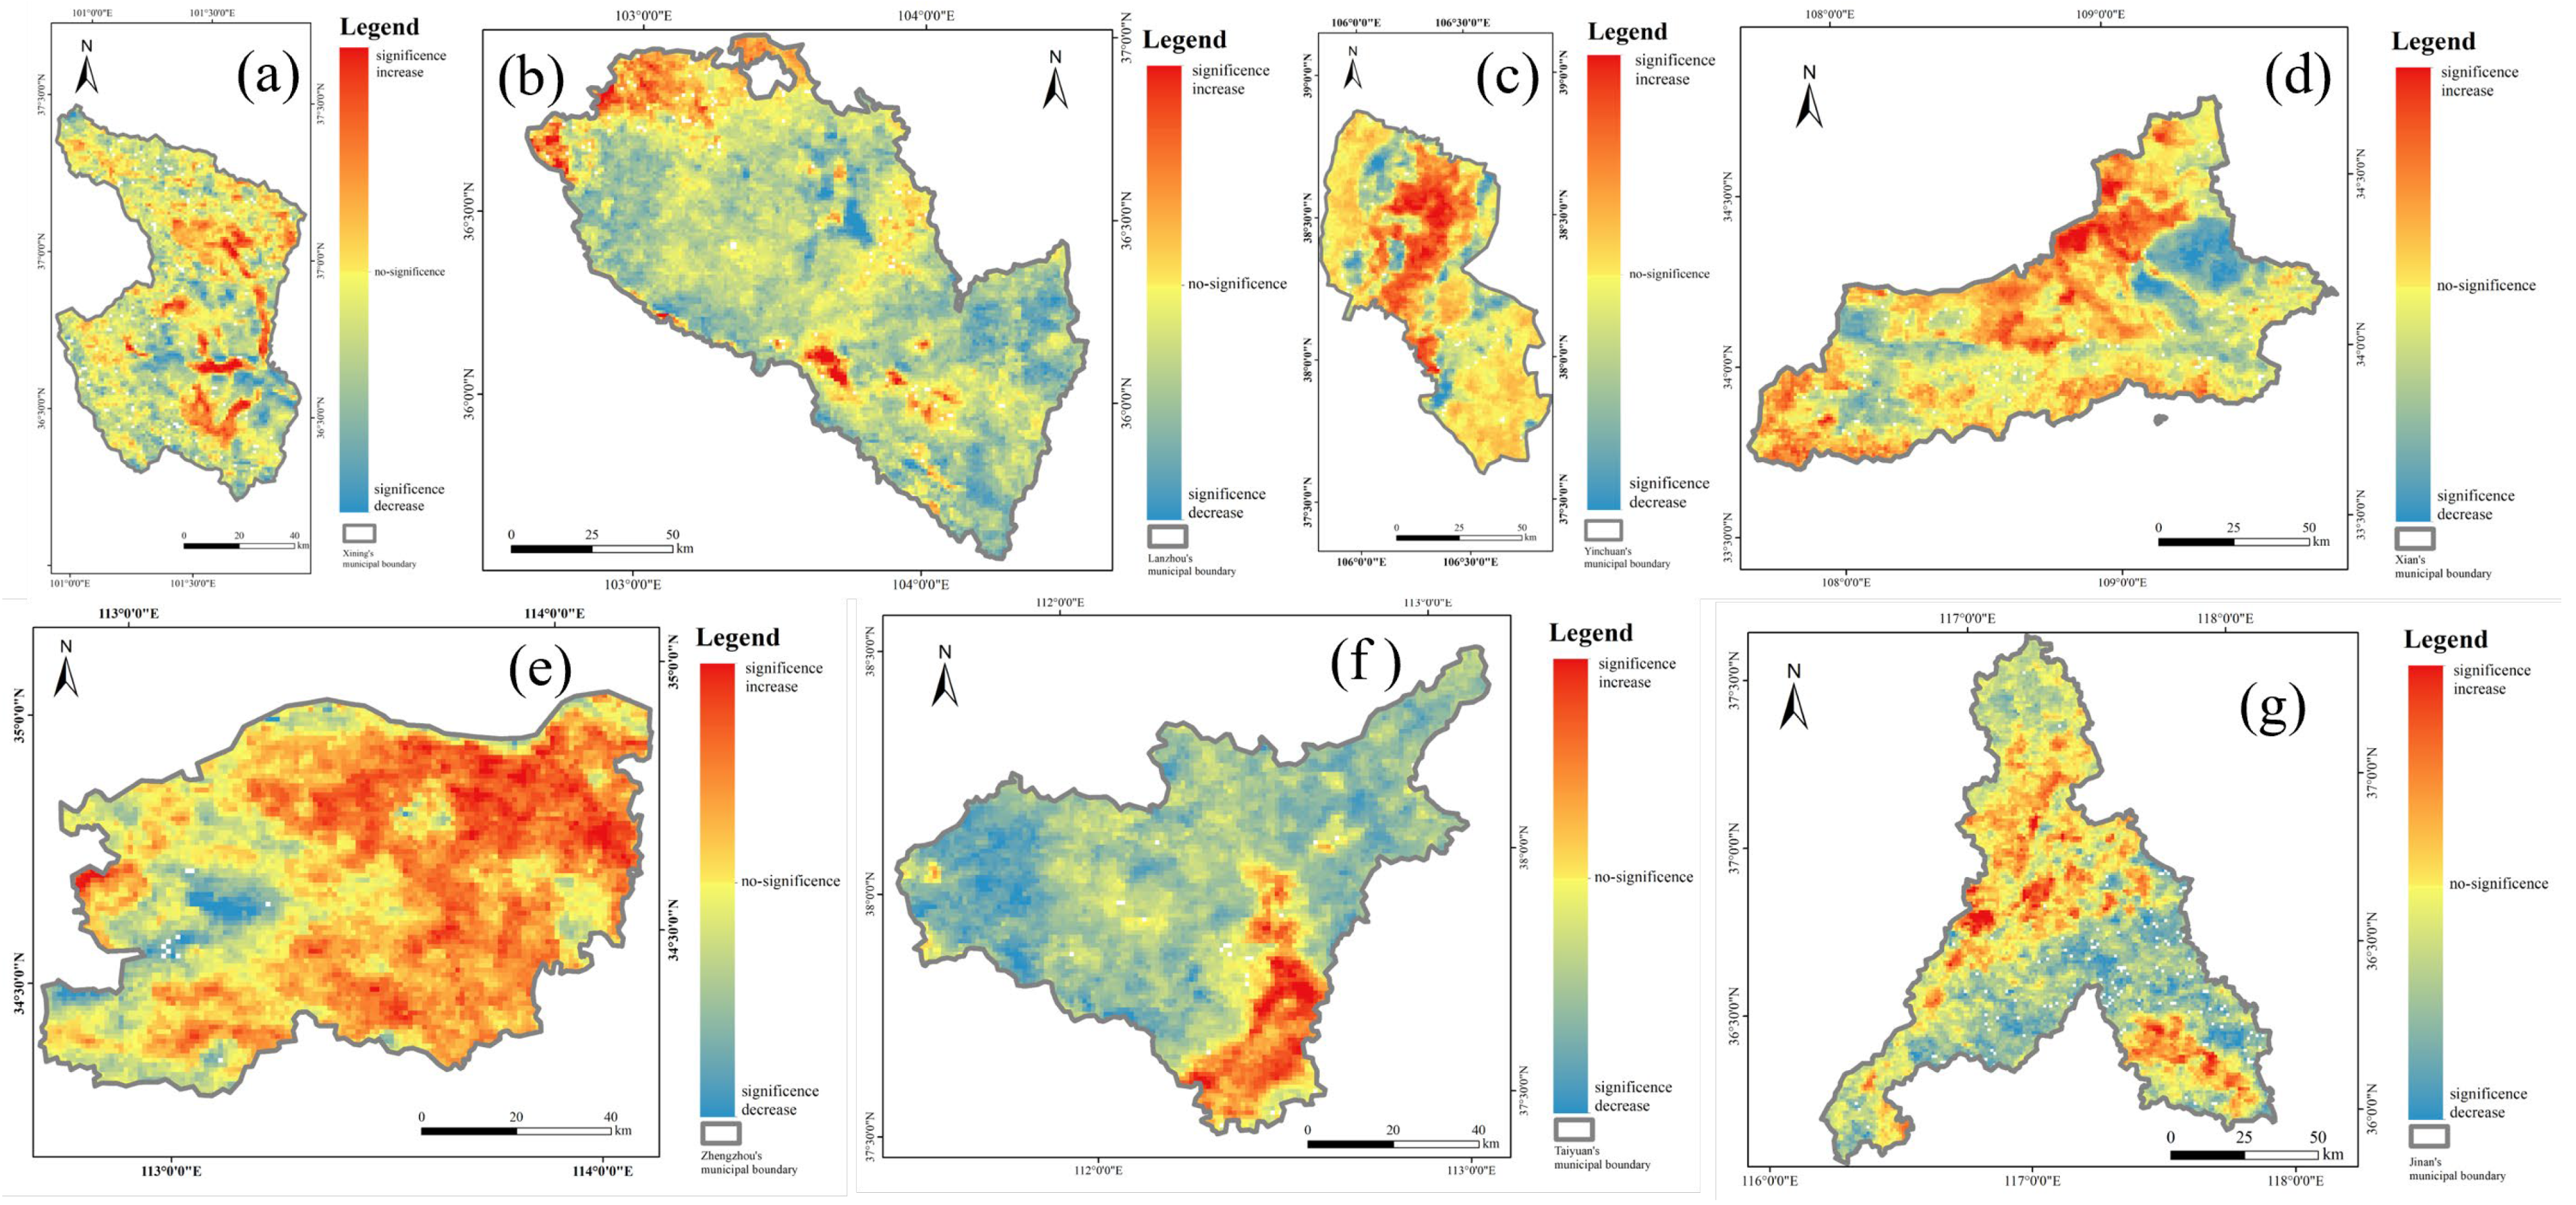
Analysis of summer LST trends in the core cities of the Yellow River Basin from 2000 to 2023 indicates, based on MK test results (Figure 5), that notable temperature increases are concentrated in the primary urban areas of each city. Urban centers typically demonstrated either extremely significant or significant warming, directly associated with concentrated human-generated heat emissions stemming from land use expansion, population growth, and industrial clustering during urban development. The more pronounced warming signals in the middle-lower reaches (Jinan, Zhengzhou) relative to the upper-middle reaches indicate a correlation between the intensity of urban development and the increase in LST.
Figure 5.
LST M-K non-parametric test for summer (2000–2023): (a) Xining; (b) Lanzhou; (c) Yinchuan; (d) Xi’an; (e) Zhengzhou; (f) Taiyuan; (g) Jinan.
Conversely, regions adjacent to the urban centers of the seven cities, primarily consisting of agricultural land and natural surfaces, demonstrated no notable LST signals owing to the diminished impact of urban development activities. This pattern creates a thermal environment marked by significant warming in urban centers and stable conditions in adjacent natural areas.
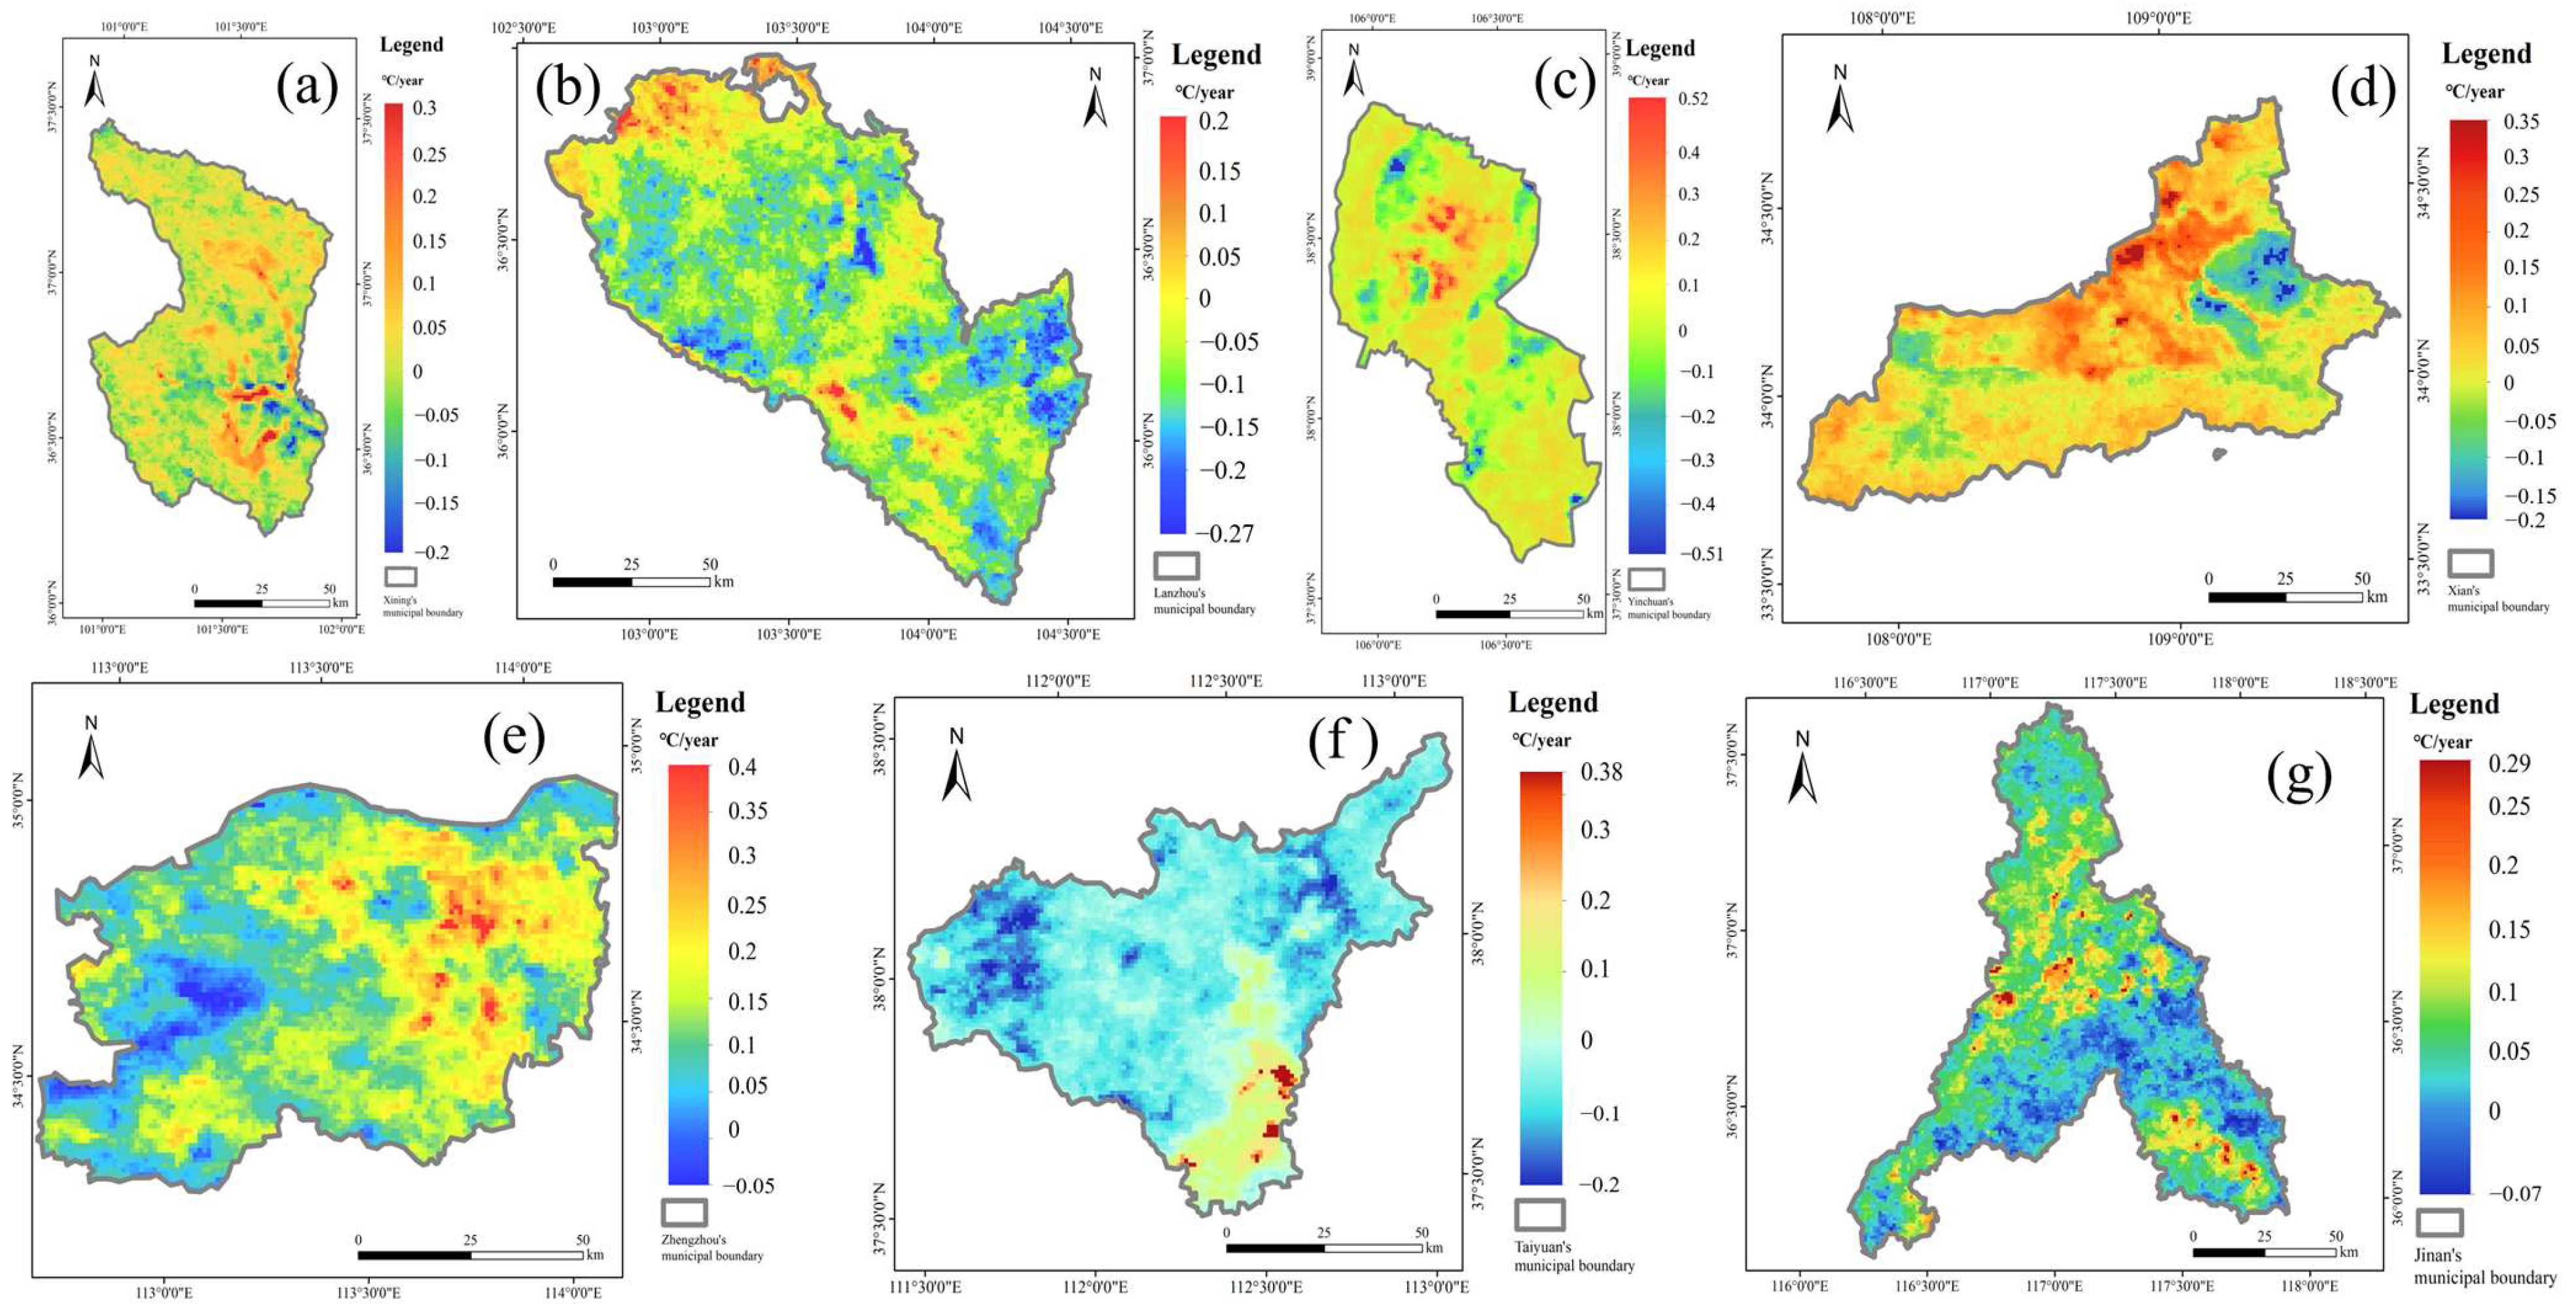
Sen’s slope study results (Figure 6) reveal increased warming rates in core urban areas, with the urban districts of Zhengzhou and Jinan displaying slopes of 0.29–0.4 °C/year. Xi’an and Taiyuan see temperature increases of 0.35–0.38 °C/year, attributed to continuous urban expansion that facilitates heat storage. Lanzhou and Xining demonstrate temperature increases of 0.2–0.3 °C/year, attributed to slower urbanization and less growth intensity, leading to a more gradual pace of change. Yinchuan exhibits localized warming exclusively inside its built metropolitan center. Regions characterized by natural surfaces, including uncultivated terrain and agricultural fields, have slopes nearing zero, with certain areas reflecting marginally negative values.
Figure 6.
Summer LST slope trend (2003—2020): (a) Xining; (b) Lanzhou; (c) Yinchuan; (d) Xi’an; (e) Zhengzhou; (f) Taiyuan; (g) Jinan.
Overall, LST alterations in core cities are intricately associated with urban development; major urban regions characterized by concentrated development demonstrate elevated Sen slopes and strong upward trends in Mann–Kendall tests. Peripheral natural areas, less affected by development, demonstrate slopes toward zero, with certain locations displaying marginal cooling tendencies, indicating the impact of urban development intensity on LST. The prominent patterns in MK tests predominantly correspond with the extent of Sen slope variations.
3.2. The Influence Mechanism of Urban Development on Land Surface Temperature
3.2.1. The Correlation Between Urban Development and Land Surface Temperature
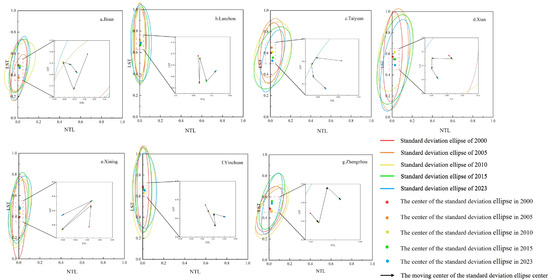
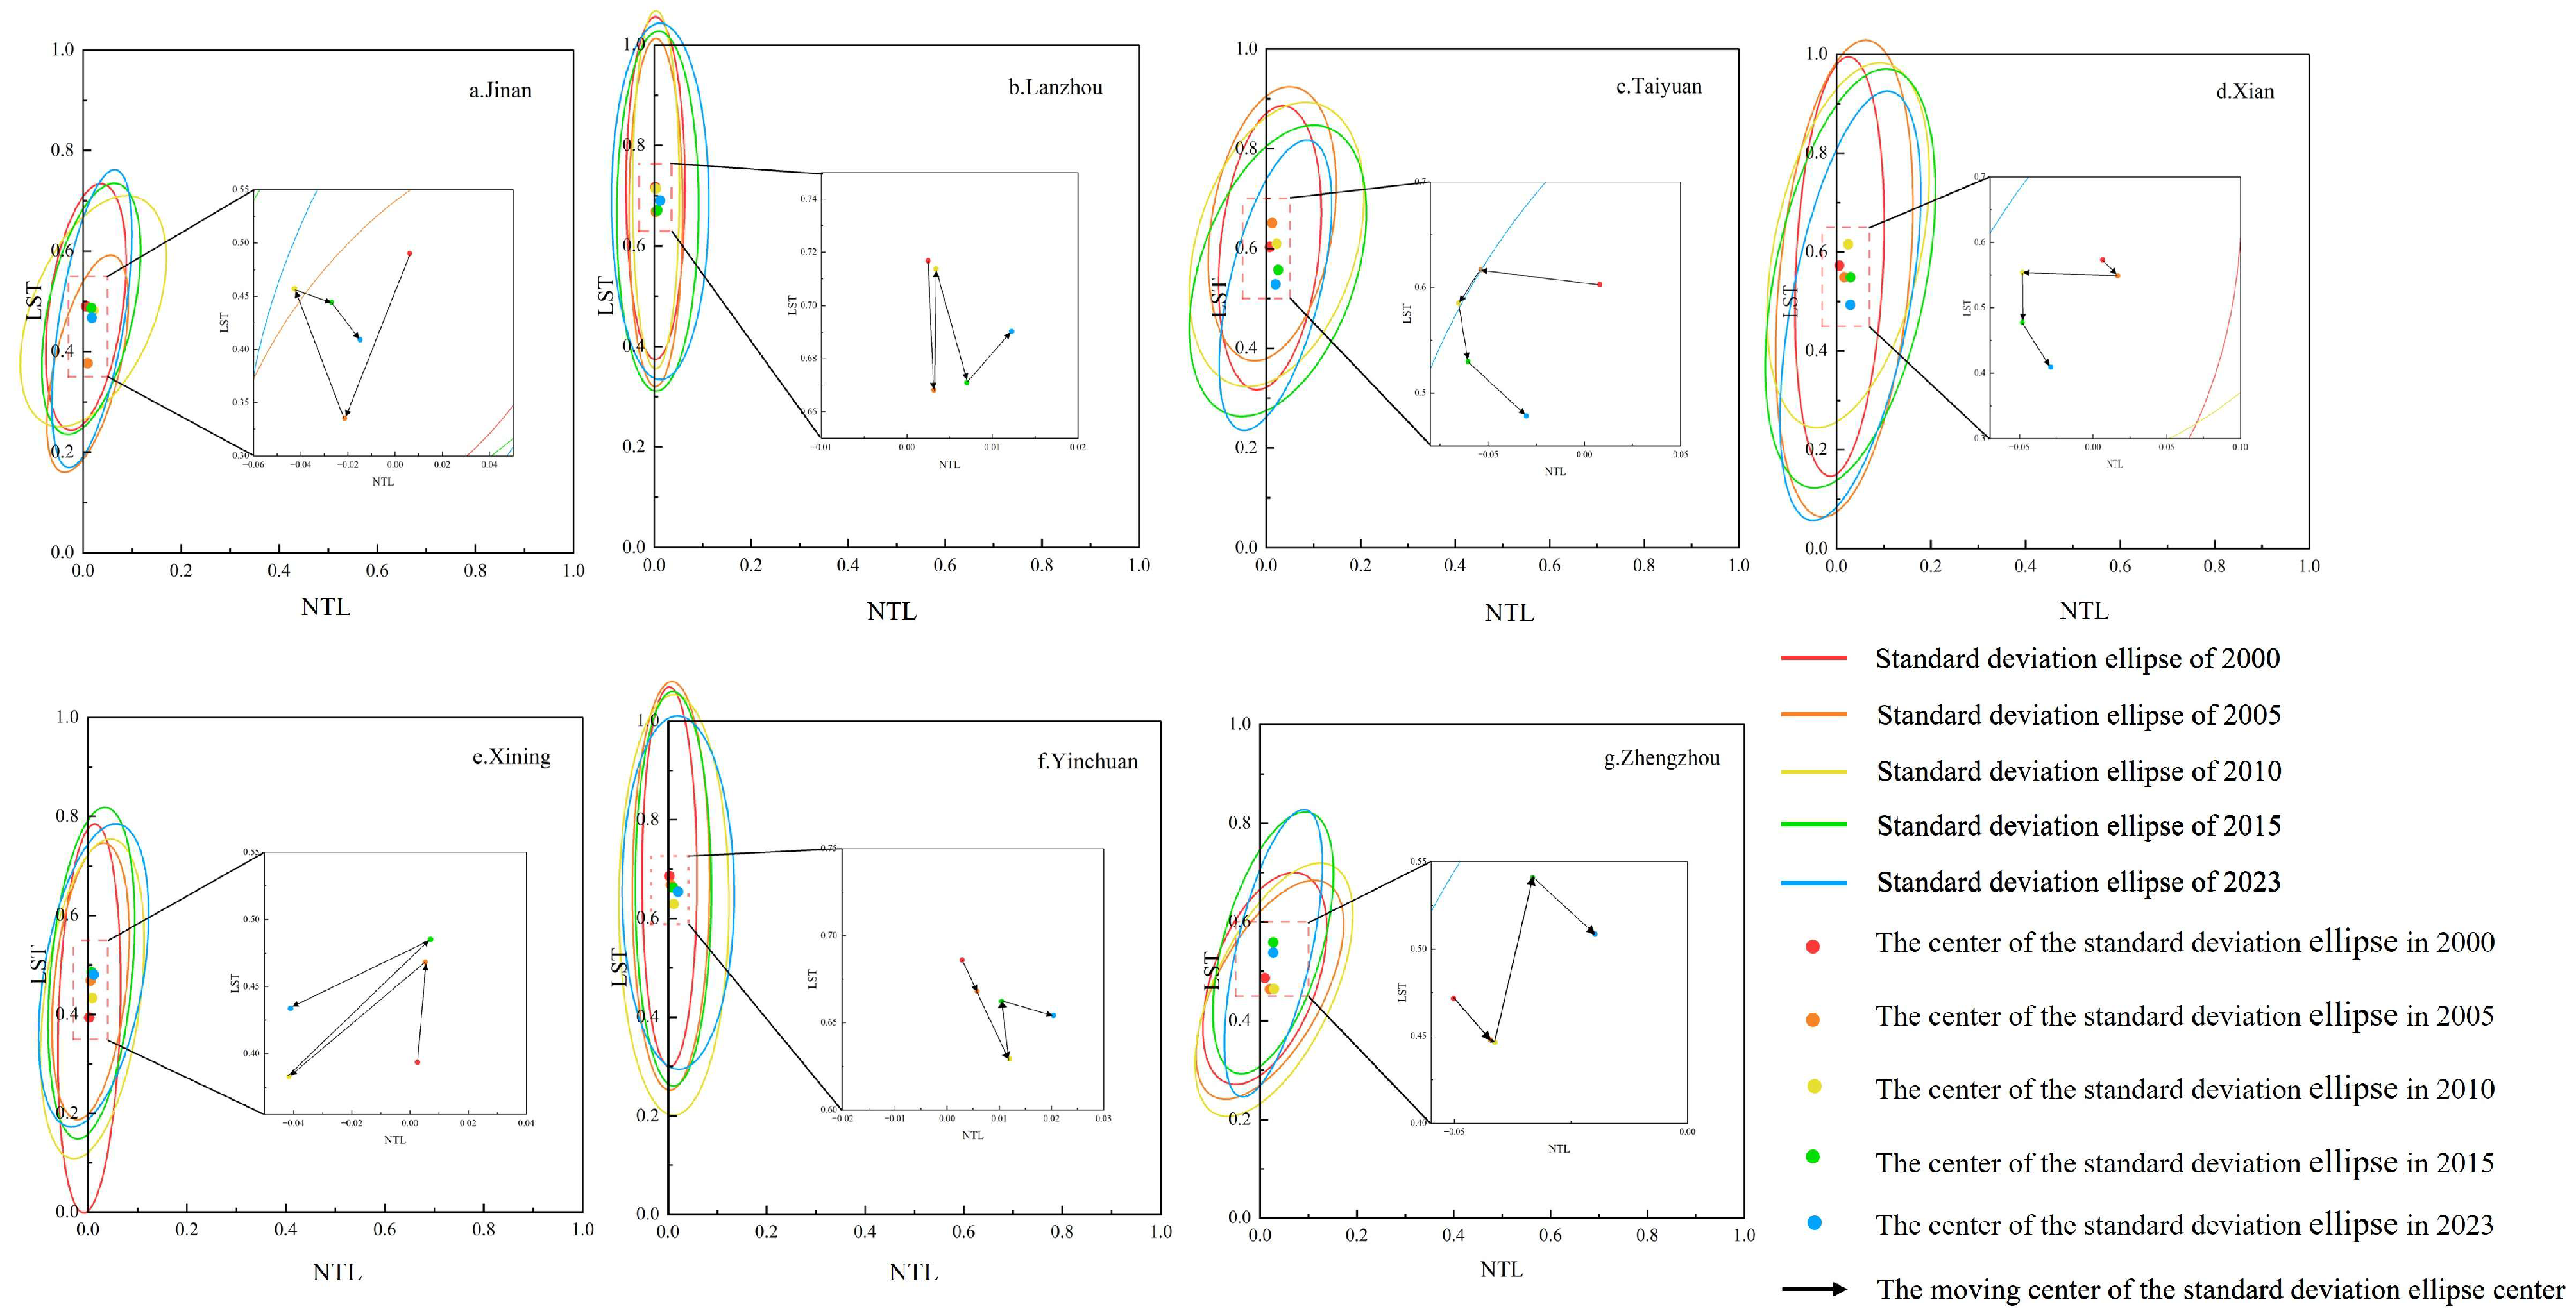
The correlation coefficient between NTL and LST and the spatial characteristics of the two-dimensional scatter plot were obtained through analysis (Figure 7, Table 3). The analysis is as follows:
Figure 7.
Spatial characteristics of standard deviational ellipses for NTL and LST in the seven core cities of the Yellow River Basin (2003–2020).
Table 3.
Relevant parameters of NTL and LST in the seven core cities of the Yellow River Basin (2003–2020).
Between 2000 and 2023, the association between NTL and LST in the Yellow River Basin demonstrated notable geographical gradient variations throughout its upper, middle, and lower reaches: The middle and lower reaches exhibited a robust positive association between NTL and LST, with the correlation strength progressively intensifying. Conversely, the higher reaches had very weak connections, with Lanzhou and Yinchuan showing moderate negative correlations and exceedingly low positive correlations. This illustrates the basin-specific differential pattern between levels of urban development and thermal environments. From a watershed-scale temporal perspective, the correlation coefficients between NTL and LST in the downstream cities of Jinan and Zhengzhou, as well as the midstream cities of Taiyuan and Xi’an, demonstrate a significant upward tendency. This illustrates the more robust beneficial influence of urban expansion on LST over time. Although the correlation coefficient in upstream Xining exhibits an increase, its magnitude remains constrained. Conversely, Lanzhou and Yinchuan have highly stable correlation features, with their coefficients continually remaining at low levels.
Geometrically, the SDE parameters provide an intuitive measure of the spatial coupling between NTL and LST. The Azimuth (R) indicates the primary trajectory of warming relative to urban growth. Directionality (D) reflects the dominance of this linear trend. Crucially, Dispersion (S) measures the degree of data scattering; a lower S value signifies a tighter, more synchronous coupling between urbanization and temperature increases, with fewer spatial deviations. Applying these metrics reveals distinct watershed-level patterns directly associated with the phases of urban development. In the downstream cities of Jinan and Zhengzhou, D progressively intensifies while S diminishes, with R converging to the 76–81° range. This indicates that continuous urban expansion, population and industrial clustering, and the proliferation of impervious surfaces drive a highly synchronous, positive increase in LST. Similarly, the midstream cities of Taiyuan and Xi’an show rising D and dropping S, with azimuths converging between 75° and 79°. Here, rapid urban development and the incremental amalgamation of metropolitan areas reinforce a strong, linear NTL-LST relationship.
Conversely, upstream cities exhibit weaker and more constrained coupling. Xining shows reduced D and rising S, reflecting a growing but scattered thermal response to expedited late-stage urbanization. Meanwhile, Lanzhou and Yinchuan display low D, considerable S, and stable azimuths near 90°. Their scatter plots lack a discernible linear trend because their urban thermal responses are largely constrained by natural factors, specifically the river valley topography in Lanzhou and desert surface characteristics in Yinchuan. This clear watershed-level distinction offers a scientific foundation for the tailored management of urban thermal environments in the Yellow River Basin.
3.2.2. Global Spatial Association Between Urban Development and Land Surface Temperature
We employed the GeoDa (version 1.22.0.21) to compute the bivariate global Moran’s I for LST and NTL in the core cities of the Yellow River Basin. The results (Table 4) indicate substantial positive geographical correlations between LST and NTL in the majority of cities, but weaker connections are seen in few instances. Jinan, Taiyuan, Xi’an, Xining, and Zhengzhou regularly demonstrate positive Moran’s I value over all years, with p-values under 0.001 and typically elevated Z-values, signifying robust geographic correlations between LST and NTL in these urban areas. Elevated NTL in specific places results in increased LST in adjacent regions. This occurs due to thermal exchange between regions with varying LST levels: an increase in NTL in a localized area initially elevates LST within that region, and the heat is subsequently disseminated to adjacent areas via atmospheric circulation and other mechanisms, ultimately resulting in a rise in LST in those surrounding areas as well. Between 2000 and 2023, the bivariate Moran’s I value for these substantially associated cities exhibited a generally increasing trend, signifying a persistent enhancement of NTL’s favorable impact on adjacent LST values.
Table 4.
Bivariate Moran’s I statistical values of LST and NTL in the seven core cities of the Yellow River Basin (2003–2020).
In the case of Taiyuan, the Moran’s I index was 0.259 in 2000 and increased to 0.5463 in 2023, indicating a substantial rise. Zhengzhou has constantly achieved a high level, increasing from 0.4369 in 2000 to 0.6042 in 2023, firmly securing the top position among the seven cities. This is due to the ongoing expansion of urban size during the urbanization process, where spatial distribution has progressively transitioned from dispersed to continuous and concentrated. As a result, the urban heat island effect in these cities has strengthened, having a more significant warming impact on the surrounding environment. Furthermore, the growth and densification of urban built environments have intensified the localized effects of urban development on LST, hence accentuating the “spillover effect” of urban regions on adjacent thermal environments [49]. This has resulted in a progressively robust regional link between LST and NTL. The dual-variable Moran’s I and its variant exhibit substantial differences among the seven cities. Zhengzhou and Jinan consistently exhibited elevated levels, with Moran’s I attaining 0.6042 and 0.5439, respectively, in 2023; Taiyuan and Xi’an closely trailed, recording values of 0.5463 and 0.5207, respectively, demonstrating significant growth; Xining, despite commencing from a low baseline of 0.178 in 2000, progressively rose to 0.3931 by 2023.
The fundamental cause is that the disparities in spatial association between LST and NTL are intricately associated with urban development patterns and natural geographical characteristics. From 2000 to 2023, core cities in the Yellow River Basin demonstrated substantial disparities in their urban development paradigms. Throughout the urbanization process in the middle and upper parts of the Yellow River Basin, urban development was centered on adjacent regions, resulting in the swift and ongoing growth of built-up land. Zhengzhou and Xi’an had gains in building land of 86.57% and 127.14%, respectively, but Taiyuan and Jinan recorded rises of 61.41% and 50.92%. The urban heat island effect has a clear “agglomeration–diffusion” process spatially. The spatial distribution of NTL closely correlates with variations in LST, resulting in a consistent rise in Moran’s I. Taking into account urban development characteristics, the thermal environmental effects of urban expansion in these cities demonstrate distinct spatial transmissibility, whereby localized urban sprawl significantly influences adjacent LST alterations. Conversely, Lanzhou’s positioning in the Yellow River valley, flanked by mountains to the north and south, restricts lateral urban development. The metropolis displays a constricted, elongated distribution with inadequate spatial continuity, obstructing the development of concentrated heat transfer “spillover effects.” As a result, the geographic connection between NTL and LST is minimal. Despite Yinchuan’s comparatively elevated urbanization rate, its urban development is marked by challenges like fragmented industrial configurations and the conflation of built environments with natural zones. As a result, the geographical distribution of NTL exhibits a weak correlation with the heat island effect, leading to LST consistently demonstrating little effects from NTL. The regional disparities in urban development resulted in notable divergence in the dual-variable Moran’s I values for LST and NTL across the seven cities.
3.2.3. Local Correlation Between Urban Development and Land Surface Temperature
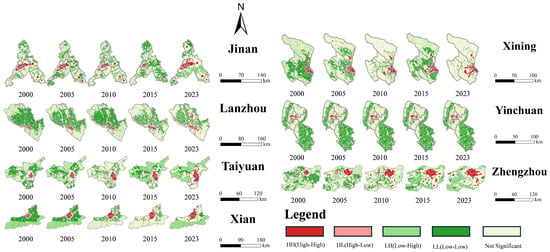
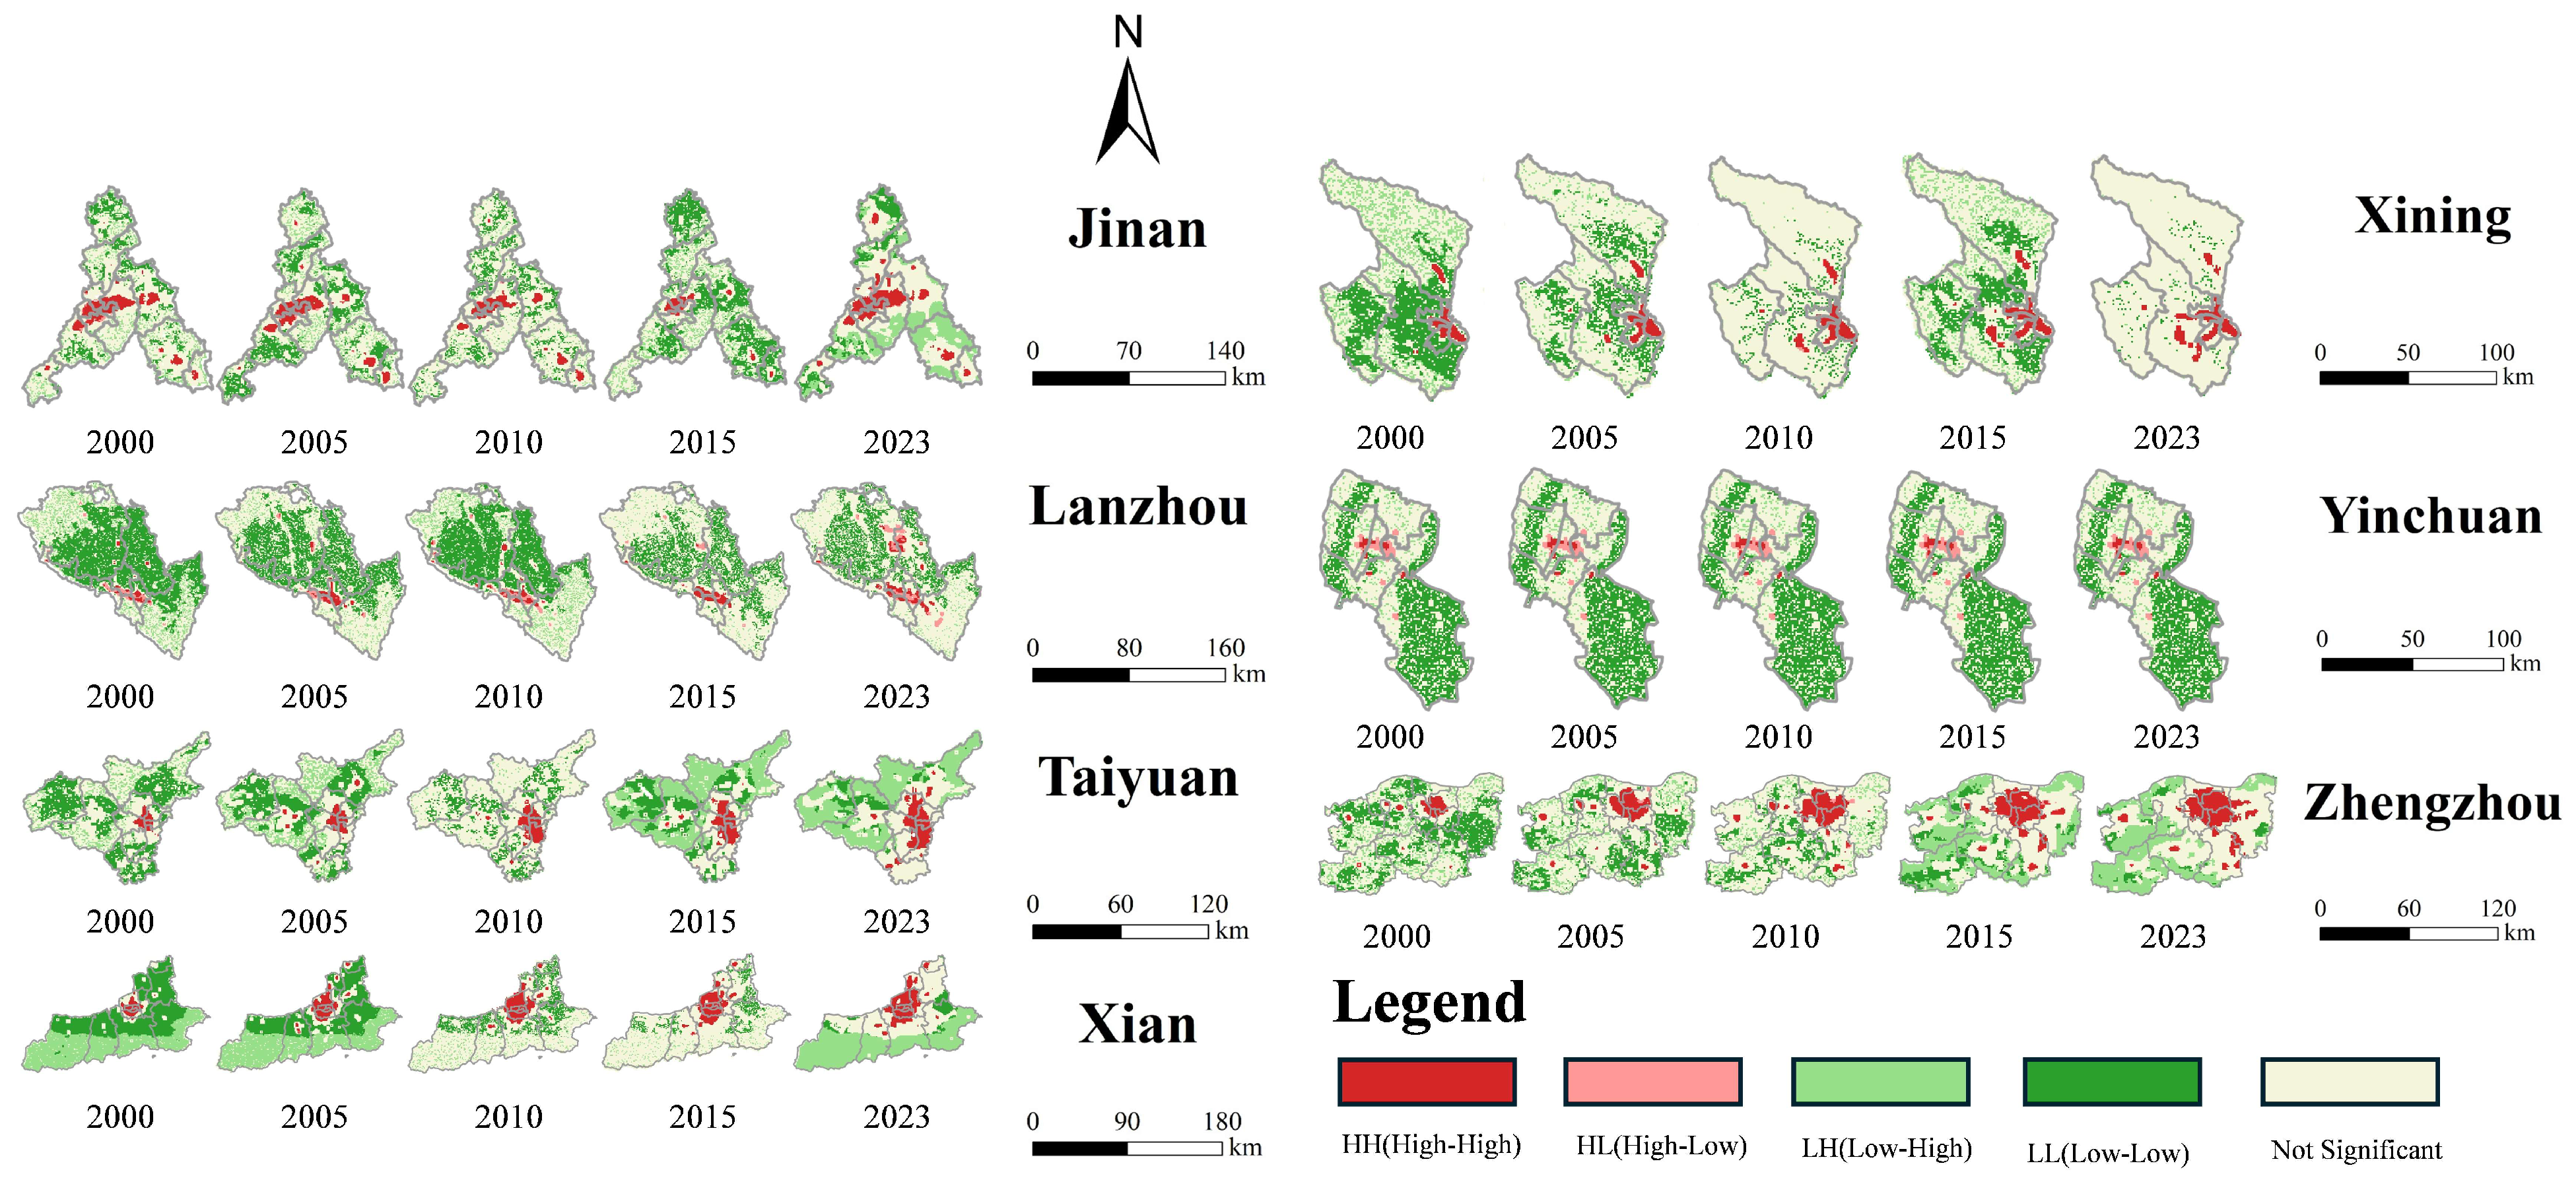
Bivariate local spatial autocorrelation and GWR analyses were performed on NTL and LST in the core cities of the Yellow River Basin, producing LISA cluster maps (Figure 8), local explanatory power maps derived from the GWR model (Figure 9) and spatial heterogeneity maps of influencing variables (Figure 10), respectively. Owing to disparities in natural circumstances and urban development patterns, their geographic distributions exhibit significant variability while adhering to some fundamental principles. The bivariate LISA analysis revealed distinct spatiotemporal evolutionary patterns for the four types of local spatial clusters across the basin gradient. H-H clusters, predominantly located in continuous built-up areas, exhibited an outward expansion, particularly in midstream and downstream plains. In contrast, L-L clusters maintained long-term spatial stability within upstream natural ecological zones. L-H clusters consistently characterized the urban-rural transition zones at administrative boundaries, while H-L clusters, initially scattered around urban green spaces and water bodies, significantly shrank over the study period. These spatiotemporal dynamics and inter-city differences are deeply intertwined with local physical drivers, as further elucidated by the GWR analysis below.
Figure 8.
Distribution maps of bivariate LISA for LST and NTL in the seven core cities of the Yellow River Basin (2003—2020).
Figure 9.
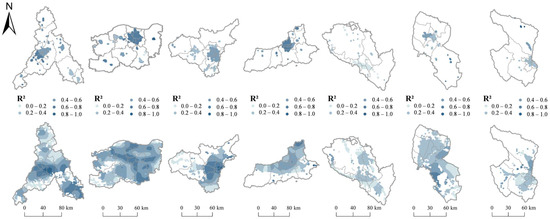
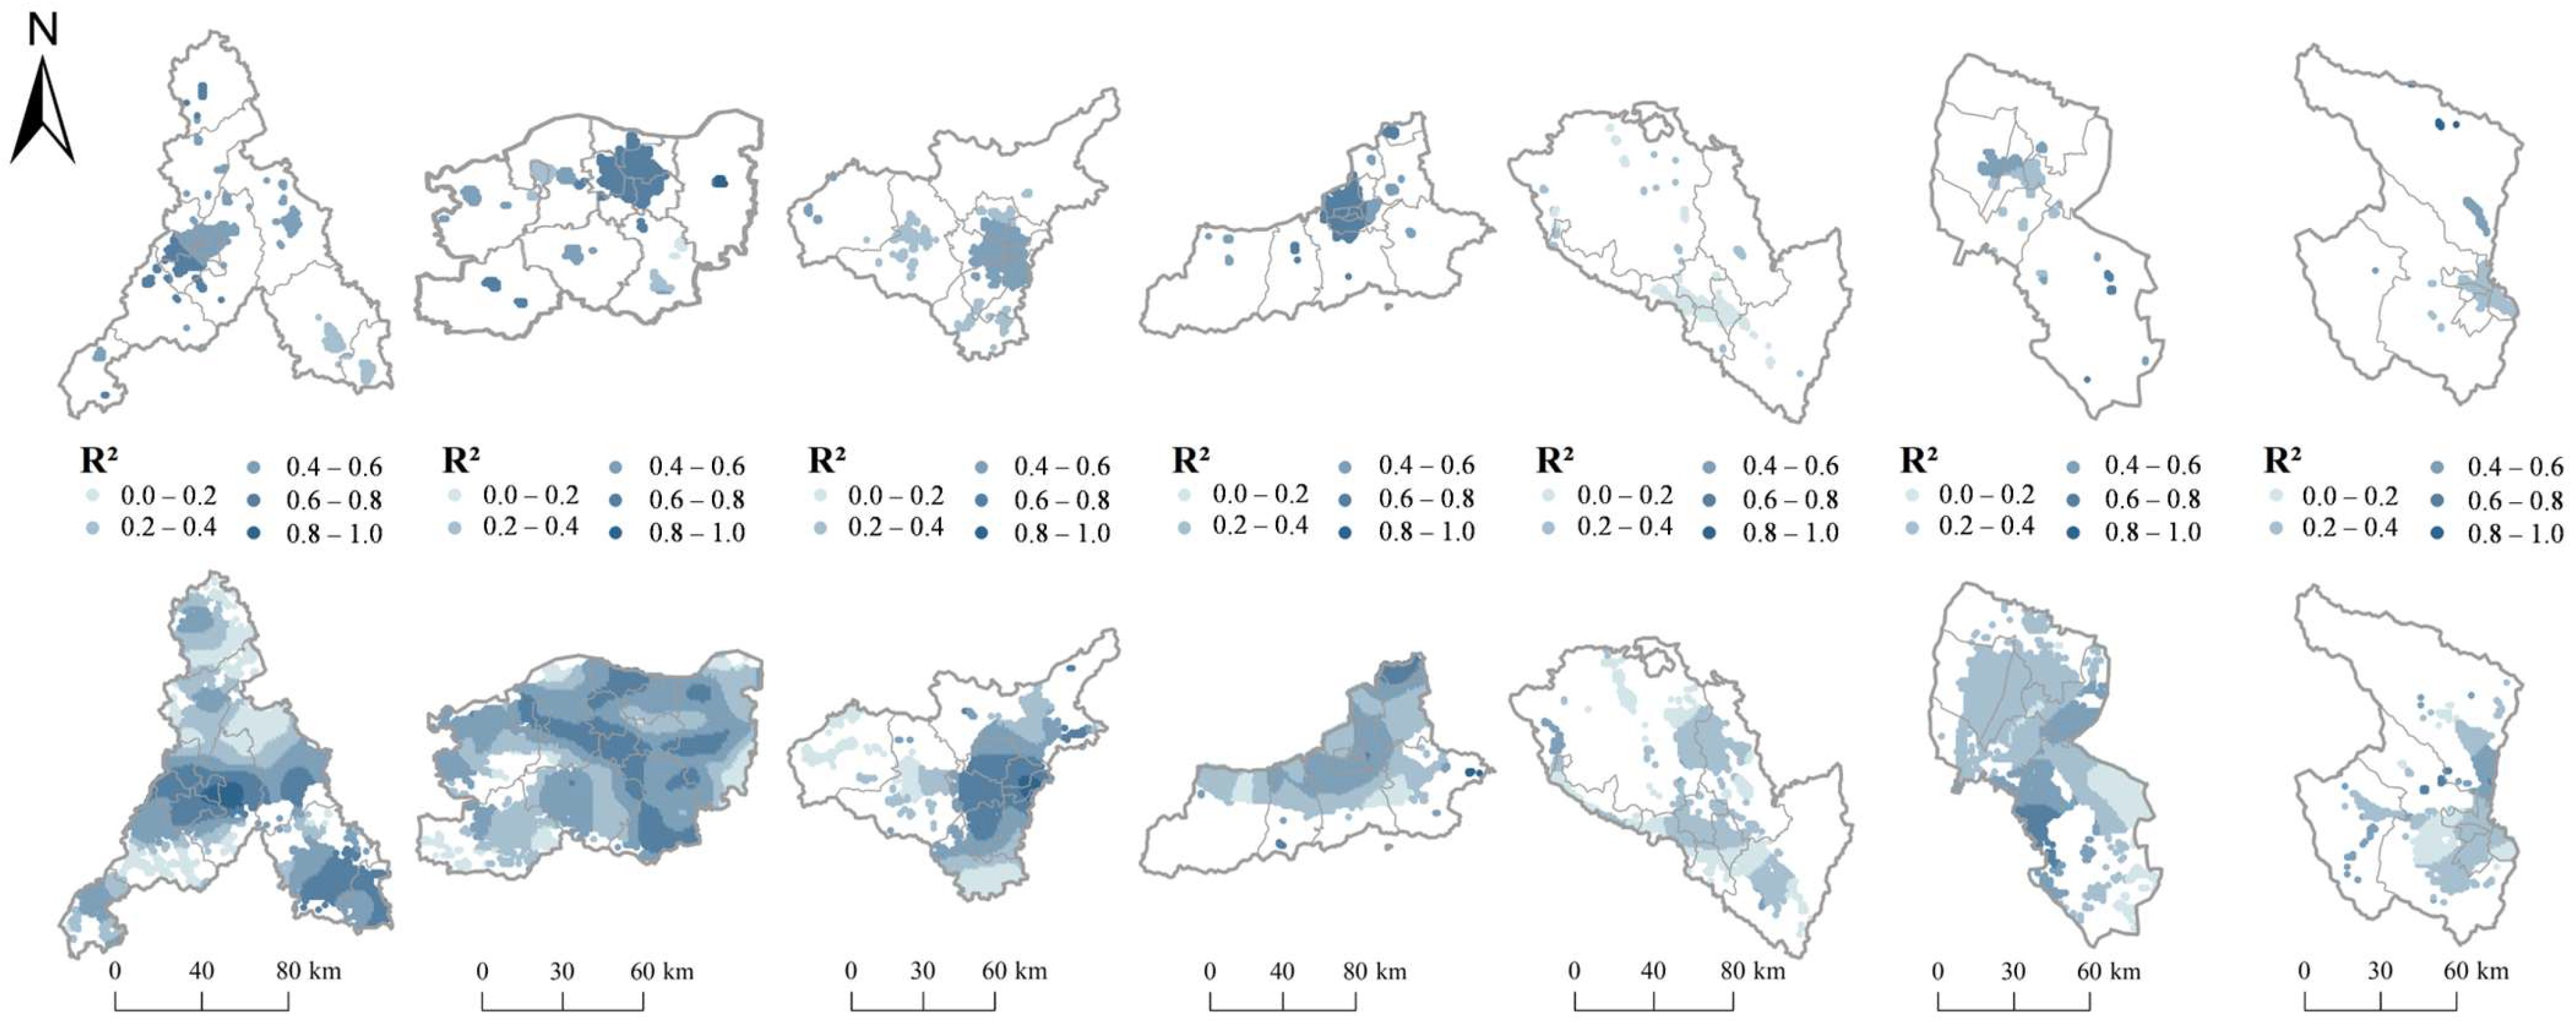
Spatial distribution of Local values derived from the GWR model (2000 and 2023). Note: Darker shades indicate higher local explanatory power of the variables for Land Surface Temperature (LST).
Figure 10.
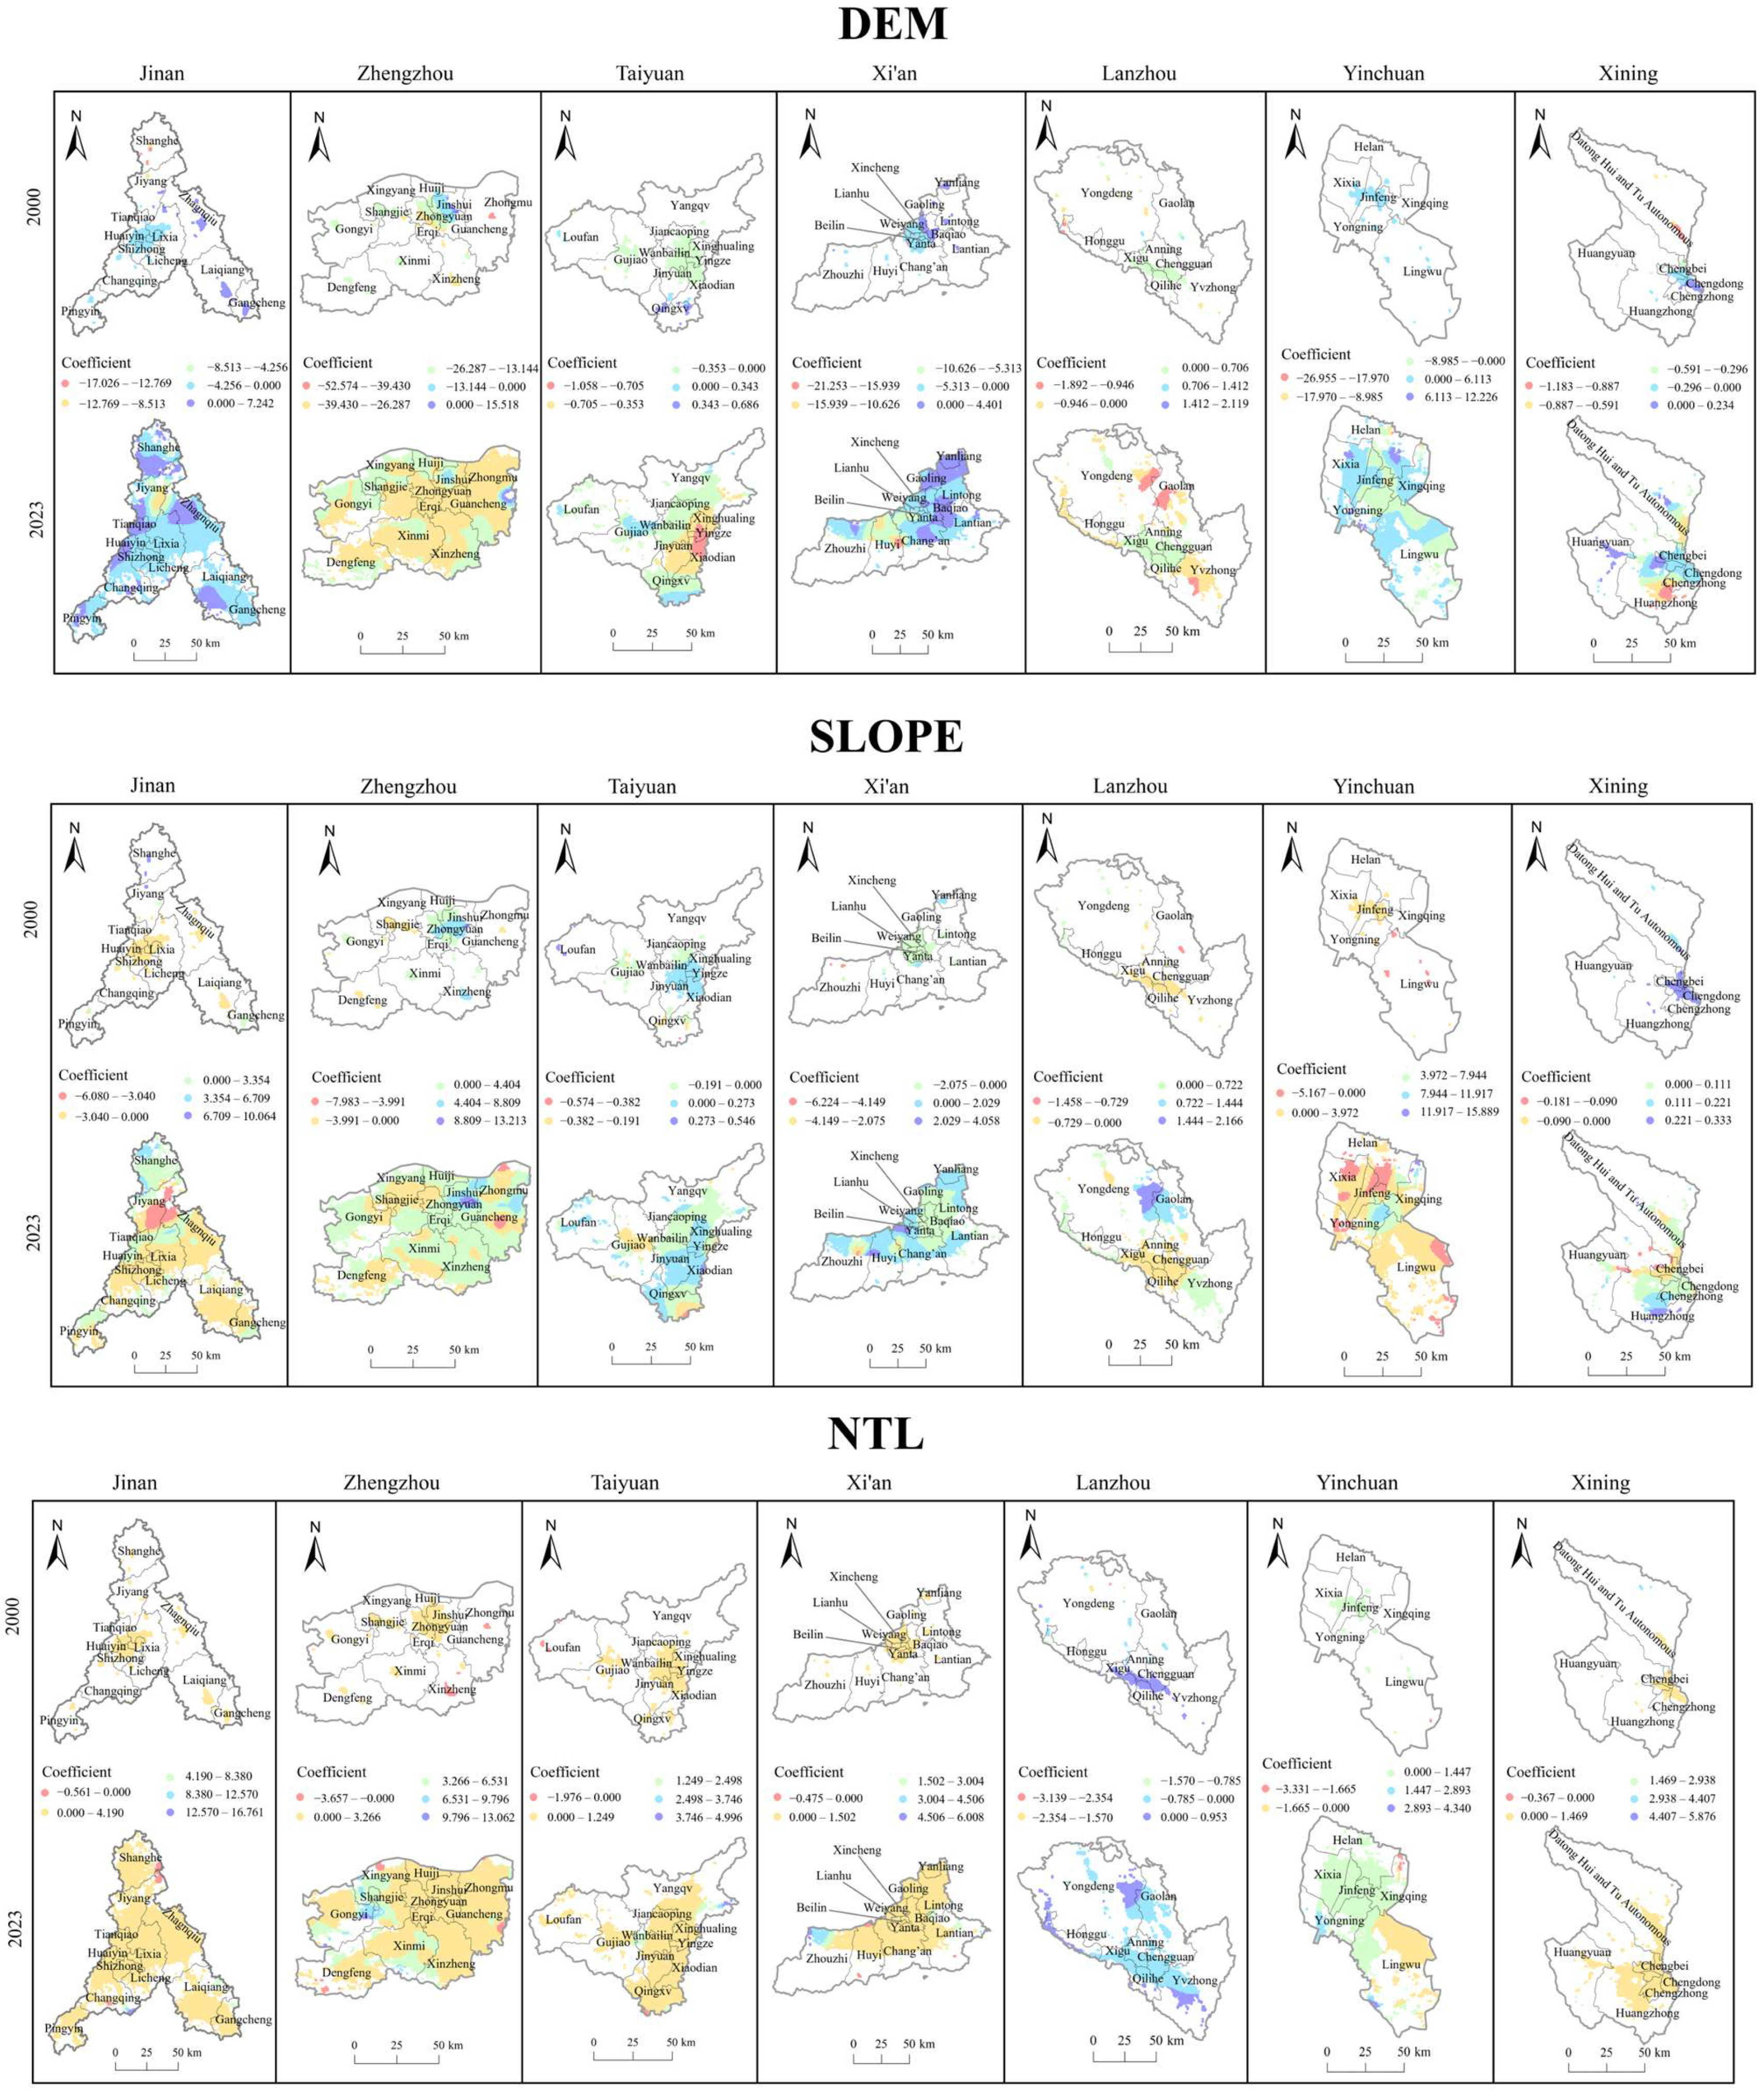
Spatial distribution of Geographically Weighted Regression (GWR) local coefficients in the core cities of the Yellow River Basin (2000 and 2023).
The GWR study indicates that the substantial quantity of zero values in the NTL dataset, which pertains to underdeveloped or places with less human activity, may result in distortions during model fitting. Consequently, this segment of the data was omitted to preserve the scientific integrity of the research. Multicollinearity assessments indicated that the variance inflation factors (VIF) for all independent variables varied from 1.6 to 3.2, with an average of 2.3, significantly within the conventional threshold of 10. The conditional indices varied from 8.5 to 21.7, with an average of 14.8, far below the conventional criterion of 30. The model satisfies the modeling criteria, and the outcomes are dependable. To further evaluate the localized performance and explanatory power of the GWR model, the spatial distribution of the Local R2 values for the core cities was mapped (Figure 9). The Local R2 values demonstrate the robust explanatory power of the model, particularly in contiguous urban expansion areas. By 2023, the Local R2 values in the built-up areas of downstream and midstream cities exceeded 0.6, confirming that the selected variables (NTL, DEM, and SLOPE) effectively capture the localized driving mechanisms of the urban thermal environment. Building on this robust model performance, the subsequent interpretation of LISA cluster features is derived from the local heterogeneity maps of impact factors for the years 2000 and 2023 (Figure 10). For the spatial visualization of these GWR results, the local coefficients were strictly partitioned by a zero-value boundary to accurately distinguish between positive and negative localized impacts, followed by a sub-classification utilizing the Natural Breaks (Jenks) optimization method.
Between 2000 and 2023, the NTL coefficient in upstream cities consistently exhibited low values with very slight increases. The terrain limitations indicated by the DEM and SLOPE coefficients were consistent and significant. The H-H agglomeration area grew gradually due to its low NTL coefficient and considerable topographical limitations, in conjunction with ecological protection policy regulations. L-L clusters, situated within natural functioning zones, demonstrate little human involvement. They exhibit significant spatial uniformity between low NTL and low LST, with no spatiotemporal fluctuation. L-H clusters were prevalent in transition zones of administrative boundaries, where localized variations in DEM and SLOPE coefficients indicated intricate surface conditions. Their low NTL coefficients demonstrated a geographic discrepancy with elevated LST in bare land and dryland agriculture. H-L clusters are intermittently located around natural cold islands such as river valley wetlands. The DEM and SLOPE coefficients offered topographic reinforcement for the persistence of cold islands, maintaining their cooling impact and averting total extinction.
As early as 2000, the NTL coefficient in midstream cities had attained a notably elevated level. In regions with mild topography such as Xi’an and Taiyuan, the topographical limitations indicated by the DEM and SLOPE coefficients were comparatively minimal, and H-H clusters had started to display first continuous traits. Between 2000 and 2023, the NTL coefficient had markedly risen, while terrain limitations, as seen by the DEM and SLOPE coefficients, had further diminished. Urbanization propelled the extension of urban development peripheries, and H-H clusters had a significant tendency for ongoing contiguous expansion. L-L clusters demonstrated significant magnitude in 2000. In 2023, urban development intensified, evidenced by a consistent increase in the NTL ratio concurrent with the growth of building land. The underlying surface type changed from agricultural and green areas to developed land, resulting in substantial modifications to the DEM and SLOPE coefficients. As a result, L-L clusters consistently diminished and were supplanted by H-H clusters. L-H clusters are consistently dispersed throughout overlapping zones of administrative boundaries. Local differences in DEM and SLOPE coefficients created urban-rural transition zones, preserving consistent low NTL and elevated LST attributes. These locations exhibited no substantial difference from H-H clusters. H-L clusters represented a minor overall share. In 2000, they were dispersed sporadically in urban green spaces and around water bodies. By 2023, the increased NTL coefficient induced urban heat island spillover effects, resulting in a significant contraction of H-L clusters.
By 2000, the NTL coefficient in downstream cities had attained a significant level over the whole basin. The DEM and SLOPE coefficients demonstrated mild topography, promoting urban development, whereas H-H clusters are swiftly proliferating. By 2023, the NTL coefficient had risen markedly, with H-H clusters demonstrating very continuous distribution patterns. The period from 2000 to 2023 saw L-L clusters, once extensive in suburban ecological areas, completely give way to H-H clusters following substantial built-up expansion and changes in NTL and terrain coefficients. In contrast, L-H clusters exhibited stability, maintaining a consistent presence at administrative boundaries. L-H clusters demonstrated a temporal pattern oscillating between distinct patches and connected clusters, since these borders frequently exist across urban-rural transition zones or ecological–urban interstices. DEM and SLOPE coefficients provide topographic limitations via isolated undulations, with minimal human interference. Subsurface attributes sustain heightened LST, exemplifying a quintessential spatial discrepancy. H-L clusters, limited in 2000 to areas near artificial water bodies and urban greenspaces, were nearly eradicated by 2023 under combined NTL increases and heat island expansion.
In summary, from 2000 to 2023, the upper, middle, and lower sections of the Yellow River demonstrated patterns of H-H cluster growth and an enhanced beneficial effect of NTL on LST. In the upstream region, multiple restrictions from biological and topographical considerations provide long-term stability in L-L agglomeration. The H-H agglomeration is confined to specific topographical contours, whereas NTL has a minimal impact on LST. In the midstream transitional zone between mountains and plains, intricate terrain leads to concurrent fluctuations in H-H and L-H agglomerations with urban development, resulting in spatially varied NTL effects. Downstream plains facilitate developmental opportunities via topographical characteristics, resulting in continuous human habitation agglomerations where non-tariff barriers exert significant dominance.
4. Discussion and Conclusions
4.1. Discussion
This study examines the geographical correlation between nocturnal illumination and land surface temperature, elucidating distinct link mechanisms between urban development and the thermal environment across the Yellow River Basin. The downstream cities of Jinan and Zhengzhou demonstrate improved positive correlations, whereas the midstream cities of Taiyuan and Xi’an display variable increases. The upstream cities of Lanzhou and Yinchuan show minor relationships. The driving mechanism demonstrates a clear basin gradient pattern. Downstream areas are primarily driven by urban development intensity as quantified by NTL, midstream regions display terrain driven synergies, and upstream zones experience natural regulation. Prior research has established that geography influences the spread of urban heat islands [48,50]. Downstream plain cities exhibit heat island impacts owing to continuous growth, corroborating the conclusion that urban agglomeration intensity positively correlates with heat island extent [51,52].
To explain the enhanced correlation in the middle and lower reaches, we hypothesize a synergistic mechanism where unconstrained topography facilitates contiguous urban expansion, thereby intensifying thermal spillover effects. The unconstrained plains in the downstream and broad valleys in the midstream facilitated a transition of urban development from dispersed patches to contiguous expanses. This shift is quantitatively reflected by gains in building land, including 86.57% and 127.14% increases in Zhengzhou and Xi’an, respectively. This continuous proliferation of impervious surfaces limits localized thermal diffusion and triggers thermal spillover effects [47,53]. Our bivariate spatial autocorrelation results support this macroscopic pattern, where the Moran’s I index for Zhengzhou increased from 0.4369 in 2000 to 0.6042 in 2023 alongside the formation of continuous clustering patterns. Consequently, land surface temperatures become sensitive to incremental increases in urban intensity, leading to the enhancement of their linear correlation. Conversely, to examine the natural background dilution effect observed in upstream cities, we hypothesize that this regulation is context specific. While our spatial models quantified topographical constraints, distinct local natural factors likely further regulate these thermal environments; for instance, the combination of high altitude topography and sparse vegetation evapotranspiration restricts thermal accumulation in Xining [54]. In Lanzhou, strict valley topography tightly constrains the urban configuration and fundamentally alters local atmospheric diffusion conditions [55]. Furthermore, surface albedo and minimal soil moisture from surrounding arid deserts influence Yinchuan [56]. These unquantified natural backdrops and topographical constraints force a fragmented urban configuration that fundamentally dilutes localized anthropogenic heat.
This study quantifies the geographical variability of urban development and land surface temperature at the watershed scale, offering an analytical foundation for analogous research in temperate semi-arid and semi-humid watersheds. Furthermore, it facilitates the execution of ecological conservation policies in the Yellow River Basin by providing clear direction for thermal environment management. A collaborative thermal environment management system based on watershed gradient zoning should be implemented. Instead of a uniform approach, interventions must be context-specific for local urban planners. For the downstream plain cities of Zhengzhou and Jinan, policies should limit horizontal urban sprawl by promoting vertical development and mandating green infrastructure such as green roofs and cool pavements in new developments. In the midstream cities of Xi’an and Taiyuan, terrain-adaptive planning should be prioritized. This involves preserving ecological ventilation corridors along river valleys and mountain passes to prevent dense building clusters from blocking natural wind paths. For the upstream regions of Xining, Lanzhou, and Yinchuan, spatial planning should focus on ecological boundaries and maintaining natural land cover ratios such as regional wetlands and sparse vegetation to sustain their natural background dilution capacities against anthropogenic heat [57]. This framework provides spatial planning guidelines for thermal environment management across the basin.
Nonetheless, this study presents several limitations that warrant further investigation. First, the study relies on nighttime light as a holistic proxy for urban development. While effective macroscopically, it lacks direct physical indices such as the Normalized Difference Vegetation Index for green space ratios or building indices for building density. Second, the temporal scope is limited to summer land surface temperature. Thermal environment drivers exhibit significant seasonal variations since winter patterns are heavily influenced by anthropogenic heating demands and snow albedo effects. Therefore, our NTL-derived findings are constrained to the summer urban heat island effect. Third, despite rigorous cross-sensor calibration using the Vegetation-Adjusted Nighttime Light Index, residual uncertainties may remain when fusing different satellite datasets. Especially in upstream cities with weaker initial lighting signals, this could introduce biases into long-term trend analyses. Future research must address these gaps by incorporating seasonal comparative analyses and multi-source high resolution physical datasets to refine urban thermal environmental models.
4.2. Conclusions
This study systematically quantifies the spatiotemporal correlation between urban development and land surface temperature across the core cities of the Yellow River Basin from 2000 to 2023. Our primary finding reveals a significant downstream to upstream gradient in both warming rates and the spatial correlation between nighttime light and land surface temperature. This gradient is fundamentally driven by contiguous urban expansion downstream, terrain and urban synergies midstream, and strong natural background regulation upstream.
These findings are significant because they shift the research paradigm from isolated and single-city thermal assessments to a holistic watershed-scale perspective. By explicitly demonstrating how varied topographical and ecological constraints interact with urbanization, this research provides vital scientific support and actionable spatial planning strategies. It helps regional planners to balance rapid urban growth with critical ecological conservation under national watershed strategies.
Finally, while this study provides robust insights, it shares certain weak points. It is primarily limited by its exclusive focus on summer land surface temperature, the absence of direct micro-physical land cover indices like the Normalized Difference Vegetation Index or three-dimensional building density in the spatial regression models, and minor residual uncertainties from the cross-sensor calibration of long-term nighttime light data. Future research must address these limitations by integrating seasonal comparative analyses, particularly winter heating effects, and high-resolution physical drivers to further advance the accurate modeling and management of urban thermal environments.
Author Contributions
Conceptualization, F.G.; methodology, F.G.; software, F.G.; validation, K.Z. and L.H.; formal analysis, F.G. and G.M.; investigation, F.G. and P.G.; resources, K.Z.; data curation, F.G., P.G., G.M. and L.H.; writing—original draft preparation, F.G.; writing—review and editing, K.Z.; visualization, P.G.; supervision, K.Z. All authors have read and agreed to the published version of the manuscript.
Funding
This research was supported by the National Natural Science Foundation of China (No. 42401079); the Shandong Provincial Natural Science Foundation (No. ZR2024QD029); the Shandong Provincial Social Science Planning Research Project “Research on Coordinated and Symbiotic Development of Urbanization and Ecological Environment in the Yellow River Basin” (No. 21DJJJ08); the Tianchi Talent Program of Xinjiang (No. 5105250180F); the Qingdao Natural Science Foundation (No. 24-4-4-zrjj-45-jch); and the Xinjiang Talent Development Fund (No. XJRC-2025-KJ-YJ-CXPT-039).
Institutional Review Board Statement
Not applicable.
Informed Consent Statement
Not applicable.
Data Availability Statement
The data presented in this study were obtained from third-party sources. The MODIS MOD11A2 Land Surface Temperature data were obtained from the Google Earth Engine (GEE) platform and are available at https://earthengine.google.com (accessed on 6 January 2026). The 30 m land use data were obtained from the Resource and Environment Science and Data Center of the Chinese Academy of Sciences and are available at https://www.resdc.cn (accessed on 4 January 2026). The DMSP–OLS and NPP–VIIRS nighttime light data were obtained from the U.S. National Geophysical Data Center (NGDC) and are available at https://www.ngdc.noaa.gov/eog (accessed on 9 January 2026). The socio-economic data (population, urbanization rate, and GDP) were obtained from officially published local statistical yearbooks (e.g., Jinan Statistical Yearbook, Gansu Statistical Yearbook) released by China Statistics Press.
Acknowledgments
The authors would like to thank the NASA EOSDIS Land Processes Distributed Active Archive Center (LP DAAC) for providing the MODIS land surface temperature products. We also express our gratitude to the U.S. National Geophysical Data Center (NGDC) for making the nighttime light data publicly available. Special thanks are given to the Google Earth Engine platform for its powerful computing support, and to the local statistical bureaus for providing the socio-economic data.
Conflicts of Interest
The authors declare no conflicts of interest.
Abbreviations
The following abbreviations are used in this manuscript:
| LST | Land Surface Temperature |
| NTL | Nighttime Light |
| GWR | Geographically Weighted Regression |
| SDE | Standard Deviation Ellipse |
| LISA | Local Index of Spatial Autocorrelation |
Appendix A
Table A1.
Pearson correlation coefficients between total Nighttime Light (NTL) and socio-economic indicators in the seven core cities (2000–2023).
Figure A1.
Detailed five-year-interval Nighttime Light (NTL) classification maps of the seven core cities in the Yellow River Basin.
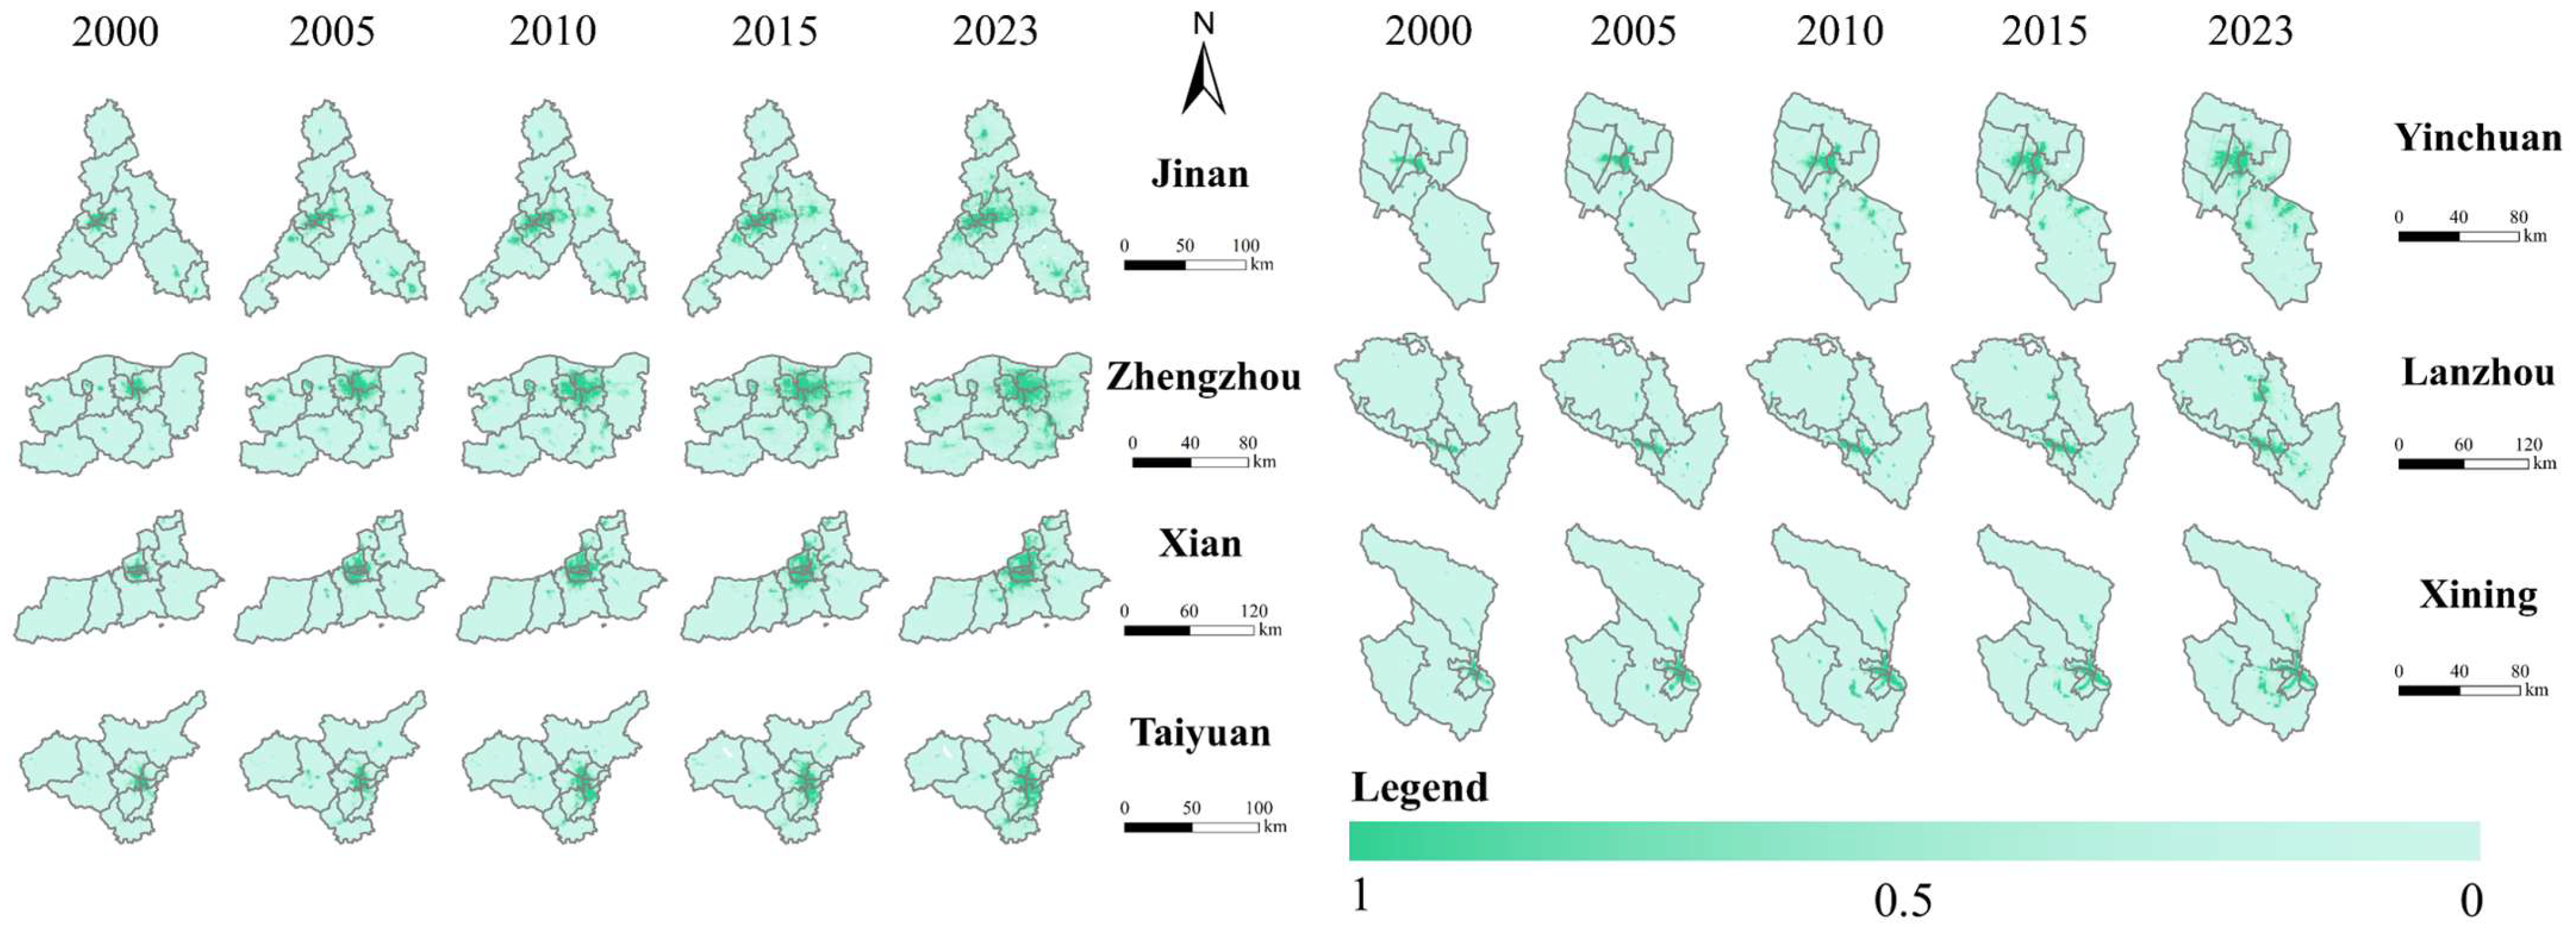
Figure A2.
Detailed five-year-interval distribution maps of thermal levels in the seven core cities of the Yellow River Basin.
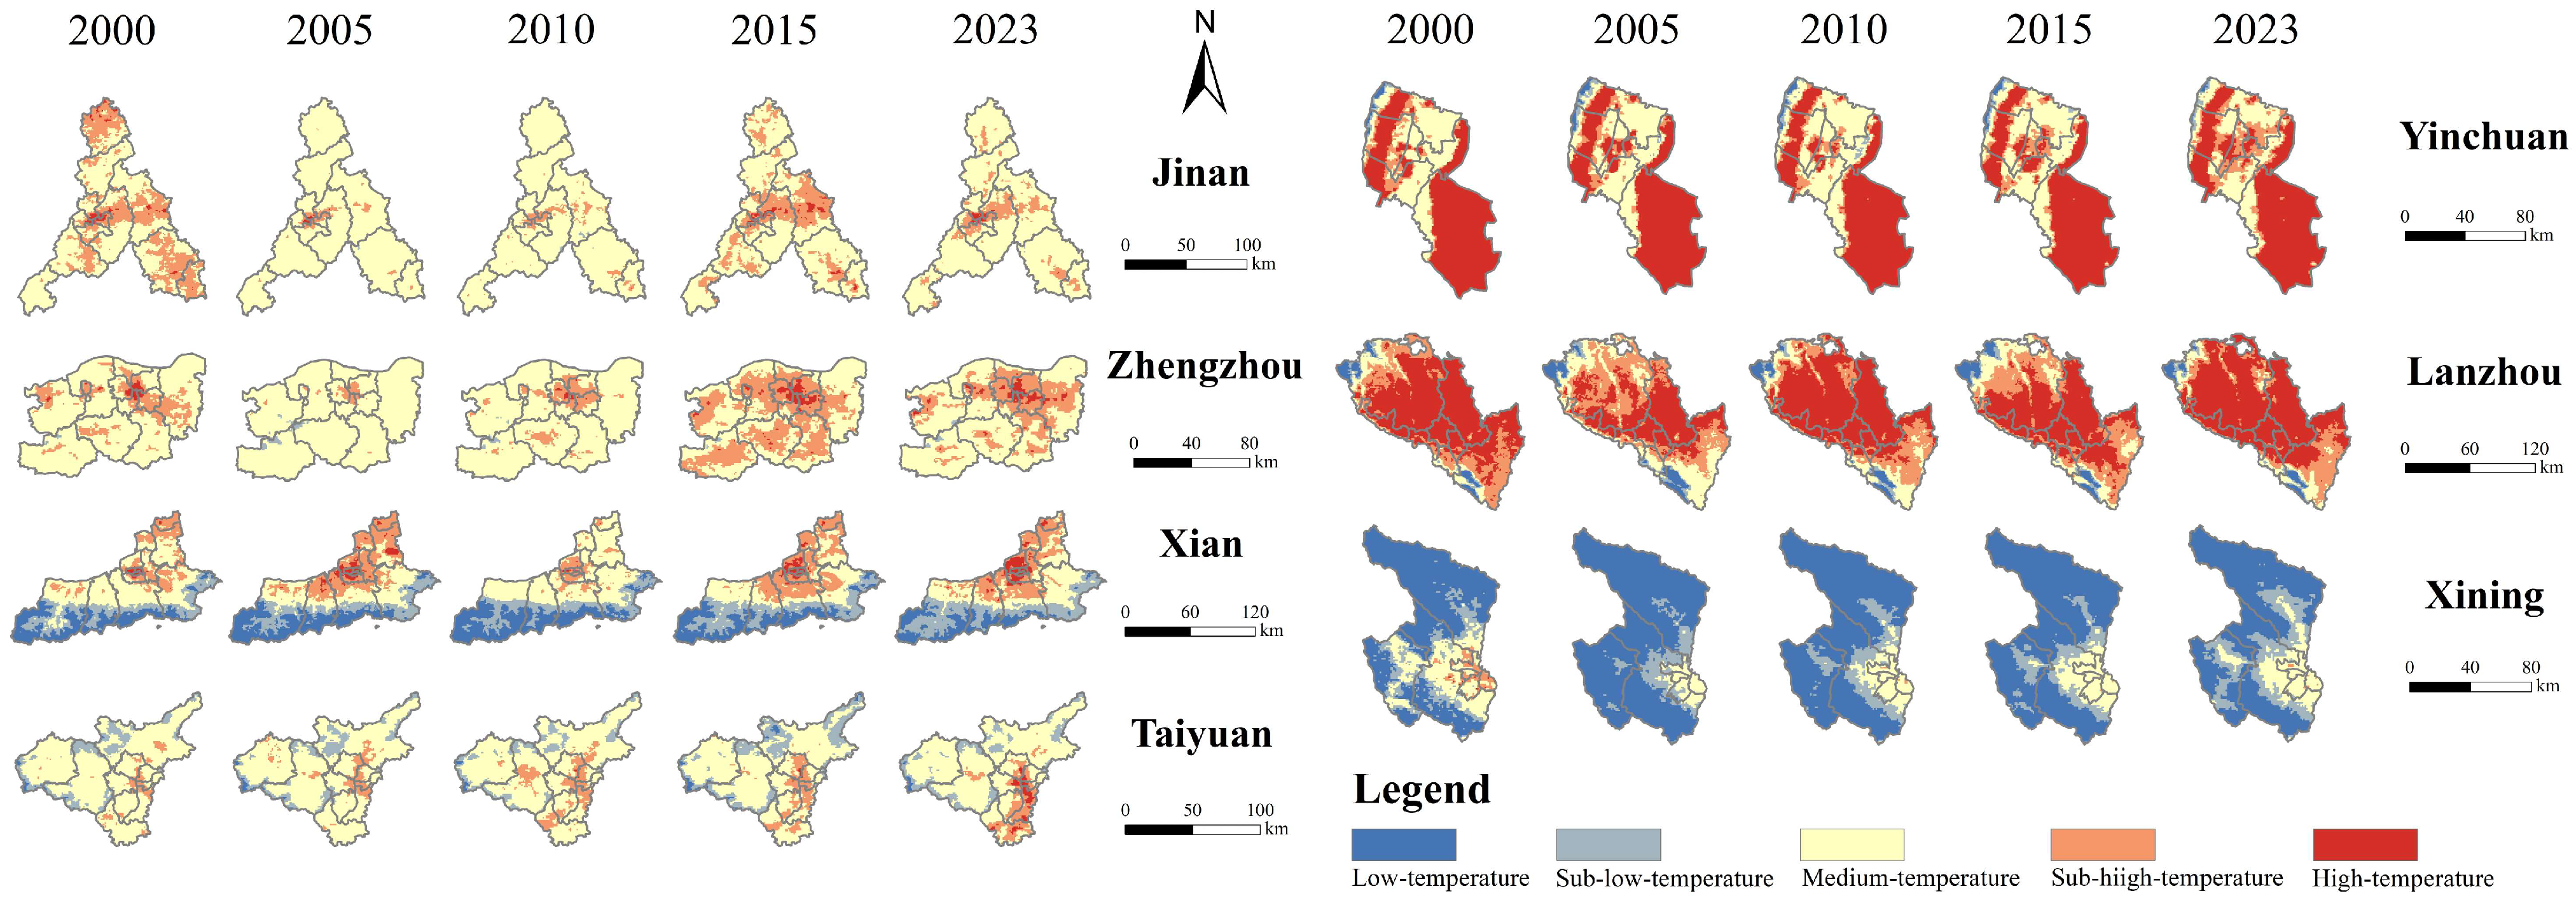
Figure A3.
Detailed five-year-interval land use classification maps of the seven core cities in the Yellow River Basin.
References
- Pradhan, P.; Costa, L.; Rybski, D.; Lucht, W.; Kropp, J.P. A Systematic Study of Sustainable Development Goal (SDG) Interactions. Earths Future 2017, 5, 1169–1179. [Google Scholar] [CrossRef] [Scilit]
- Xu, H.; Shi, N.; Wu, L.; Zhang, D. High-Quality Development Level and Its Spatiotemporal Changes in the Yellow River Basin. Resour. Sci. 2020, 42, 115–126. [Google Scholar] [CrossRef] [Scilit]
- Zhang, L.; Fang, C.; Zhu, C. Coupling Coordination and Decoupling Effects: Measuring the Interaction between Urban Agglomeration Ecosystems and Urbanization. Cities 2026, 171, 106788. [Google Scholar] [CrossRef] [Scilit]
- Shen, Z.; Zhao, Y. Effect of Spatial Morphology on Land Surface Temperature and Their Interaction:A Case Study of Main Urban Area of Jinan City. J. Arid Land Resour. Environ. 2024, 38, 65–74. [Google Scholar] [CrossRef]
- Tian, H.; Liu, L.; Zhang, Z.; Chen, H.; Zhang, X.; Wang, T.; Kang, Z. Spatiotemporal Diversity and Attribution Analysis of Land Surface Temperature in China from 2001 to 2020. Acta Geogr. Sin. 2022, 77, 1713–1729. [Google Scholar] [CrossRef]
- Zhang, Y.; Wang, X.; Feng, Z.; Yuan, J.; Yu, M. Spatiotemporal Pattern and Influencing Factors of Thermal Environment Based on SEM Model: A Case Study in Xi’an Metropolitan Area. Environ. Sci. 2024, 45, 3734–3745. [Google Scholar]
- Yan, D.; Zhang, Y.; Song, P.; Zhang, X.; Wang, Y.; Zhu, W.; Du, Q. Integrating Spatial Autocorrelation and Greenest Images for Dynamic Analysis Urban Heat Islands Based on Google Earth Engine. Sustainability 2025, 17, 7155. [Google Scholar] [CrossRef] [Scilit]
- Li, L.; Zhan, W.; Hu, L.; Chakraborty, T.C.; Wang, Z.; Fu, P.; Wang, D.; Liao, W.; Huang, F.; Fu, H. Divergent Urbanization-Induced Impacts on Global Surface Urban Heat Island Trends since 1980s. Remote Sens. Environ. 2023, 295, 113650. [Google Scholar] [CrossRef] [Scilit]
- Lehnert, M.; Savic, S.; Milosevic, D.; Dunjic, J.; Geletic, J. Mapping Local Climate Zones and Their Applications in European Urban Environments: A Systematic Literature Review and Future Development Trends. Isprs Int. J. Geo-Inf. 2021, 10, 260. [Google Scholar] [CrossRef] [Scilit]
- Zimmermann, B.; Kruber, S.; Nendel, C.; Munack, H.; Hildmann, C. Assessing the Cooling Potential of Climate Change Adaptation Measures in Rural Areas. J. Environ. Manag. 2024, 366, 121595. [Google Scholar] [CrossRef] [Scilit]
- Wang, Z.; Peng, Y.; Li, Y.; Zhou, X.; Xie, Y. Exploration of Influencing Factors of Land Surface Temperature in Cities Within the Beijing–Tianjin–Hebei Region Based on Local Climate Zone Scheme. IEEE J. Sel. Top. Appl. Earth Obs. Remote Sens. 2024, 17, 9728–9744. [Google Scholar] [CrossRef] [Scilit]
- Howard, L. The Climate of London: Deduced from Meteorological Observations; Cambridge University Press: Cambridge, UK, 2013. [Google Scholar]
- Wan, Z.; Dozier, J. A Generalized Split-Window Algorithm for Retrieving Land-Surface Temperature from Space. IEEE Trans. Geosci. Remote Sens. 1996, 34, 892–905. [Google Scholar] [CrossRef] [Scilit]
- Wan, Z.; Li, Z.-L. A Physics-Based Algorithm for Retrieving Land-Surface Emissivity and Temperature from EOS/MODIS Data. IEEE Trans. Geosci. Remote Sens. 1997, 35, 980–996. [Google Scholar] [CrossRef] [Scilit]
- Ramyar, R.; Ramyar, A.; Kialashaki, Y.; Bryant, M.; Ramyar, H. Exploring reconfiguration scenarios of high-density urban neighborhoods on urban temperature-The case of Tehran (Iran). Urban For. Urban Green. 2019, 44, 126398. [Google Scholar] [CrossRef] [Scilit]
- Shao, Z.; Ahmad, M.N.; Javed, A.; Islam, F.; Jahangir, Z.; Ahmad, I. Expansion of Urban Impervious Surfaces in Lahore (1993–2022) Based on GEE and Remote Sensing Data. Photogramm. Eng. Remote Sens. 2023, 89, 479–486. [Google Scholar] [CrossRef] [Scilit]
- Seto, K.C.; Güneralp, B.; Hutyra, L.R. Global Forecasts of Urban Expansion to 2030 and Direct Impacts on Biodiversity and Carbon Pools. Proc. Natl. Acad. Sci. USA 2012, 109, 16083–16088. [Google Scholar] [CrossRef] [Scilit]
- Bi, Y.; Zheng, L.; Wang, Y.; Li, J.; Yang, H.; Zhang, B. Coupling Relationship between Urbanization and Water-Related Ecosystem Services in China’s Yangtze River Economic Belt and Its Socio-Ecological Driving Forces: A County-Level Perspective. Ecol. Indic. 2023, 146, 109871. [Google Scholar] [CrossRef] [Scilit]
- Yang, C.; Yu, B.; Chen, Z.; Song, W.; Zhou, Y.; Li, X.; Wu, J. A Spatial-Socioeconomic Urban Development Status Curve from NPP-VIIRS Nighttime Light Data. Remote Sens. 2019, 11, 2398. [Google Scholar] [CrossRef] [Scilit]
- Yang, Z.; Chen, Y.; Guo, G.; Zheng, Z.; Wu, Z. Using Nighttime Light Data to Identify the Structure of Polycentric Cities and Evaluate Urban Centers. Sci. Total Environ. 2021, 780, 146586. [Google Scholar] [CrossRef] [Scilit]
- Yang, J.; Wang, Y.; Xiu, C.; Xiao, X.; Xia, J.; Jin, C. Optimizing Local Climate Zones to Mitigate Urban Heat Island Effect in Human Settlements. J. Clean. Prod. 2020, 275, 123767. [Google Scholar] [CrossRef] [Scilit]
- Zheng, Y.; He, Y.; Zhou, Q.; Wang, H. Quantitative Evaluation of Urban Expansion Using NPP-VIIRS Nighttime Light and Landsat Spectral Data. Sustain. Cities Soc. 2022, 76, 103338. [Google Scholar] [CrossRef] [Scilit]
- Zhu, E.; Qi, Q.; Chen, L.; Wu, X. The Spatial-Temporal Patterns and Multiple Driving Mechanisms of Carbon Emissions in the Process of Urbanization: A Case Study in Zhejiang, China. J. Clean. Prod. 2022, 358, 131954. [Google Scholar] [CrossRef] [Scilit]
- Liu, X.D.; Chen, B.D. Climatic Warming in the Tibetan Plateau during Recent Decades. Int. J. Climatol. 2000, 20, 1729–1742. [Google Scholar] [CrossRef] [Scilit]
- Yin, Z.Y.; Lin, Z.Y.; Zhao, X.Y. Temperature Anomalies in Central and Eastern Tibetan Plateau in Relation to General Circulation Patterns during 1951–1993. Int. J. Climatol. 2000, 20, 1431–1449. [Google Scholar] [CrossRef] [Scilit]
- Peng, J.; Liu, Q.; Xu, Z.; Lyu, D.; Du, Y.; Qiao, R.; Wu, J. How to Effectively Mitigate Urban Heat Island Effect? A Perspective of Waterbody Patch Size Threshold. Landsc. Urban Plan. 2020, 202, 103873. [Google Scholar] [CrossRef] [Scilit]
- Peng, J.; Ma, J.; Liu, Q.; Liu, Y.; Hu, Y.; Li, Y.; Yue, Y. Spatial-Temporal Change of Land Surface Temperature across 285 Cities in China: An Urban-Rural Contrast Perspective. Sci. Total Environ. 2018, 635, 487–497. [Google Scholar] [CrossRef] [Scilit] [PubMed]
- Qin, M.; Ouyang, H.; Jiang, H.; Luo, T.; Zhou, Y.; Liu, Y. Spatiotemporal Evolution Characteristics and Driving Factors of Heat Island Effect Based on Territorial Perspective: A Case Study of Beibu Gulf Urban Agglomeration, China. Ecol. Indic. 2024, 166, 112197. [Google Scholar] [CrossRef] [Scilit]
- Wang, J.; Qian, Y.-G.; Han, L.-J.; Zhou, W.-Q. Relationship between Land Surface Temperature and Land Cover Types Based on GWR Model: A Case of Beijing-Tianjin-Tangshan Urban Agglomeration, China. Yingyong Shengtai Xuebao 2016, 27, 2128–2136. [Google Scholar] [CrossRef]
- Yu, C.; Xu, D.; Peng, Y.; Zhou, S.; Lu, D. Analysis of Land Surface Temperature Drivers and Marginal Effect on the Yangtze River Delta Urban Agglomeration. Ecol. Indic. 2025, 178, 114123. [Google Scholar] [CrossRef] [Scilit]
- Alimujiang, K.; Zhang, X.; Liang, H. The Spatial Relationship between Seasonal Surface Temperature and Landscape Pattern of the Urban Agglomeration on the Northern Slope of the Tianshan Mountains. Geogr. Res. 2024, 43, 1267–1287. [Google Scholar] [CrossRef]
- Dong, L.; Pan, J.; Wang, W.; Feng, Y. Spatiotemporal Pattern of Summer Thermal Field and Its Relationship with Land Cover in Lanzhou Based on RS and GWR. Soils 2018, 50, 404–413. [Google Scholar] [CrossRef]
- Airiken, M.; Zhang, F.; Chan, N.W.; Kung, H.-T. Assessment of Spatial and Temporal Ecological Environment Quality under Land Use Change of Urban Agglomeration in the North Slope of Tianshan, China. Environ. Sci. Pollut. Res. 2022, 29, 12282–12299. [Google Scholar] [CrossRef] [Scilit] [PubMed]
- Wang, X.; Meng, Q.; Zhang, L.; Hu, D. Evaluation of Urban Green Space in Terms of Thermal Environmental Benefits Using Geographical Detector Analysis. Int. J. Appl. Earth Obs. Geoinf. 2021, 105, 102610. [Google Scholar] [CrossRef] [Scilit]
- Cong, K.; Dong, C.; Bo, X.; Han, J. Evolution Analysis of Urban Spatio-Temporal Pattern in Shandong Province by Nighttime Light Remote Sensing. J. Geomat. 2021, 46, 78–82. [Google Scholar] [CrossRef]
- Chen, Y.; Zheng, Z.; Wu, Z.; Qian, Q. Review and Prospect of Application of Nighttime Light Remote Sensing Data. Prog. Geogr. 2019, 38, 205–223. [Google Scholar] [CrossRef] [Scilit]
- Shen, Z.; Zeng, J. Spatial Relationship of Urban Development to Land Surface Temperature in Three Cities of Southern Fujian. Acta Geogr. Sin. 2021, 76, 566–583. [Google Scholar] [CrossRef]
- Halefom, A.; He, Y.; Nemoto, T.; Feng, L.; Li, R.; Raghavan, V.; Jing, G.; Song, X.; Duan, Z. The Impact of Urbanization-Induced Land Use Change on Land Surface Temperature. Remote Sens. 2024, 16, 4502. [Google Scholar] [CrossRef] [Scilit]
- Sulekan, A.; Syed Jamaludin, S.S. Review on Geographically Weighted Regression (GWR) Approach in Spatial Analysis. Malays. J. Fundam. Appl. Sci. 2020, 16, 173–177. [Google Scholar] [CrossRef] [Scilit]
- The Central Committee of the Communist Party of China and the State Council. Outline of Ecological Conservation and High-Quality Development in the Yellow River Basin; The State Council of the People’s Republic of China: Beijing, China, 2021. [Google Scholar]
- Chen, S.; Hu, D.; Wong, M.S.; Ren, H.; Cao, S.; Yu, C.; Ho, H.C. Characterizing Spatiotemporal Dynamics of Anthropogenic Heat Fluxes: A 20-Year Case Study in Beijing–Tianjin–Hebei Region in China. Environ. Pollut. 2019, 249, 923–931. [Google Scholar] [CrossRef] [Scilit]
- Zhang, Y.; Luo, F. How Are Green Spaces Associated with Chronic Disease Incidence in Australia? Direct Health Benefits and Interactive Effects with Socioeconomic Status Based on Multiple Green Space Indicators. Sustain. Cities Soc. 2025, 121, 106229. [Google Scholar] [CrossRef] [Scilit]
- Han, B.; Luo, Z.; Liu, Y.; Zhang, T.; Yang, L. Using Local Climate Zones to Investigate Spatio-Temporal Evolution of Thermal Environment at the Urban Regional Level: A Case Study in Xi’an, China. Sustain. Cities Soc. 2022, 76, 103495. [Google Scholar] [CrossRef] [Scilit]
- Li, K.; Li, C.; Hu, Y.; Xiong, Z.; Wang, Y. Quantitative Estimation of the PM2.5 Removal Capacity and Influencing Factors of Urban Green Infrastructure. Sci. Total Environ. 2023, 867, 161476. [Google Scholar] [CrossRef] [Scilit]
- Wang, Y.X.; Li, X.S.; Zhang, C.; He, W.K. Influence of Spatiotemporal Changes of Impervious Surface on the Urban Thermal Environment: A Case of Huai’an Central Urban Area. Sustain. Cities Soc. 2022, 79, 103710. [Google Scholar] [CrossRef] [Scilit]
- Luo, F.; Zhang, Y.; Kong, Z.; Dai, Y. Which Green Is More Equitable? A Multi-Indicator Urban Green Space Assessment across Vulnerable Population Groups from an Environmental Justice Perspective. Ecol. Indic. 2025, 178, 113948. [Google Scholar] [CrossRef] [Scilit]
- Wang, X.; Zhang, Y.; Yu, D. Exploring the Relationships between Land Surface Temperature and Its Influencing Factors Using Multisource Spatial Big Data: A Case Study in Beijing, China. Remote Sens. 2023, 15, 1783. [Google Scholar] [CrossRef] [Scilit]
- Dong, C.; Shi, H.; Gao, Y.; Zheng, C.; Wu, Y.; Zhang, Y. The Buffering Effect of Topography Induced Microhabitat on Regional Temperature Change. Acta Ecol. Sin. 2023, 43, 5137–5149. [Google Scholar] [CrossRef] [Scilit]
- Lin, Y.; Jim, C.Y.; Deng, J.; Wang, Z. Urbanization Effect on Spatiotemporal Thermal Patterns and Changes in Hangzhou (China). Build. Environ. 2018, 145, 166–176. [Google Scholar] [CrossRef] [Scilit]
- Jia, Y.; Hao, C.; Niu, C.; Qiu, Y.; Du, J.; Xu, F.; Liu, H. Spatio-Temporal Variations of Precipitation and Runoff and Analyses of Water-Heat-Human-Land Matching Characteristics in Typical Mountainous Areas of China. Acta Geogr. Sin. 2019, 74, 2288–2302. [Google Scholar] [CrossRef]
- Kim, Y.; Yu, S.; Li, D.; Gatson, S.N.; Brown, R.D. Linking Landscape Spatial Heterogeneity to Urban Heat Island and Outdoor Human Thermal Comfort in Tokyo: Application of the Outdoor Thermal Comfort Index. Sustain. Cities Soc. 2022, 87, 104262. [Google Scholar] [CrossRef] [Scilit]
- Wang, C.; Li, Y.; Myint, S.; Zhao, Q.; Wentz, E. Impacts of Spatial Clustering of Urban Land Cover on Land Surface Temperature across Köppen Climate Zones in the Contiguous United States. Landsc. Urban Plan. 2019, 192, 103668. [Google Scholar] [CrossRef] [Scilit]
- Liu, M.; Ma, H.; Bai, Y. Understanding the Drivers of Land Surface Temperature Based on Multisource Data: A Spatial Econometric Perspective. IEEE J. Sel. Top. Appl. Earth Obs. Remote Sens. 2021, 14, 12263–12272. [Google Scholar] [CrossRef] [Scilit]
- Chen, G.; Lu, X.; Li, Q.; Zhang, S.; Tysa, S.K. Divergent Urban Canopy Heat Island Responses to Heatwave Type over the Tibetan Plateau: A Case Study of Xining. Land 2025, 14, 2033. [Google Scholar] [CrossRef] [Scilit]
- Chai, J.; Zhang, Z.; Chen, L.; Ma, X.; Wu, Z. Analysis of the Spatial and Temporal Evolution Characteristics and Driving Forces of the Surface Thermal Environment in Lanzhou City. Sustainability 2023, 15, 7700. [Google Scholar] [CrossRef] [Scilit]
- Wang, J.; Lu, L.; Zhou, X.; Huang, G.; Chen, Z. Spatio-Temporal Patterns and Drivers of the Urban Heat Island Effect in Arid and Semi-Arid Regions of Northern China. Remote Sens. 2025, 17, 1339. [Google Scholar] [CrossRef] [Scilit]
- Zhang, L.; Fang, C.; Zhu, C.; Gao, Q. Ecosystem Service Trade-Offs and Identification of Eco-Optimal Regions in Urban Agglomerations in Arid Regions of China. J. Clean. Prod. 2022, 373, 133823. [Google Scholar] [CrossRef] [Scilit]

Disclaimer/Publisher’s Note: The statements, opinions and data contained in all publications are solely those of the individual author(s) and contributor(s) and not of MDPI and/or the editor(s). MDPI and/or the editor(s) disclaim responsibility for any injury to people or property resulting from any ideas, methods, instructions or products referred to in the content. |
© 2026 by the authors. Licensee MDPI, Basel, Switzerland. This article is an open access article distributed under the terms and conditions of the Creative Commons Attribution (CC BY) license.