


Abstract
Gulf Cooperation Council (GCC) states have pledged to achieve net-zero emissions between 2050 and 2060, yet their cities remain among the world’s most carbon-intensive, shaped by extreme heat, near-continuous cooling, desalinated water, car-dependent urban form and hydrocarbon-financed development. This Perspective argues that conventional sectoral decarbonisation strategies, while necessary, are insufficient because building performance, urban morphology, cooling demand, electricity generation, water infrastructure, transport, construction materials and waste management are interdependent. A simplified Net Zero City Equation, adapted from established whole-life carbon accounting principles, provides a conceptual framework for examining these interdependencies. Three structural paradoxes (hydrocarbon dependence versus decarbonisation, cooling demand versus energy and water decarbonisation, and net-zero ambition versus fragmented accounting and governance) help explain the challenges of transition. Four coupled intervention pathways identify opportunities for coordinated action: climate-responsive urban form and buildings; integrated energy, cooling and water systems; low-carbon mobility and circular material flows; and coordinated governance, measurement and finance. Implementation depends less on the availability of technology than on consistent accounting, economic incentives and institutional coordination. This approach is relevant to other hot-arid regions, provided it is adapted to local climatic, urban and institutional conditions.
1. Introduction: Why Net-Zero Gulf Cities Require a Coupled Systems Approach
In November 2021, the United Arab Emirates legislated the Gulf’s first net-zero target. By the time it hosted COP28 in 2023, which produced a Global Stocktake pledge to triple renewables to 11 TW by 2030 [1], all six GCC states had announced climate goals: Saudi Arabia, Kuwait and Bahrain by 2060; Oman and the UAE by 2050; and Qatar through a 25 per cent reduction against business-as-usual by 2030 [2,3]. These commitments arrive in cities built on assumptions that are now turned into liabilities. Hydrocarbon revenues funded extraordinary infrastructure; subsidised energy underwrote construction and continuous cooling; and car-dependent form spread across some of the harshest climates on Earth. In 2023, per-capita fossil CO2 emissions were 43.55 t in Qatar and 20.22 t in the UAE, against a global average of 4.86 t [4].
These emissions arise from tightly coupled urban systems. Cooling consumes roughly two-thirds of delivered building energy, against about a third globally [5,6], and accounts for 60–70 per cent of peak electricity demand [7]. The same power systems supply the desalination plants on which the region relies: the GCC holds over 40 per cent of global desalination capacity [8]. Urban form shapes cooling loads and travel distances together, and the materials used to build at speed lock in embodied emissions for decades. Despite exceptional solar resources, renewables reached only 5.6 GW, roughly 3 per cent of installed capacity, in 2022 [5].
Net-zero strategies in the Gulf, as elsewhere, are largely organised sector by sector: green-building codes for buildings, renewable targets for power, efficiency programmes for water and electrification for transport. Such strategies are necessary but insufficient. In hot-arid cities, a gain in one system is limited, displaced or amplified by another: lower cooling loads reduce peak electricity demand and the renewable capacity needed to meet it; decarbonising electricity changes the emissions of desalination and electric transport; and the urban form chosen today fixes cooling demand, travel distances and material intensity at once. Net-zero concepts were formed largely in temperate, post-industrial cities, where these couplings are weaker. What is missing is a framework that keeps the system dependencies of hot-arid cities in view and shows where coordinated interventions could change them.
This Perspective argues that net-zero Gulf cities require a coupled systems approach and uses the Net Zero City Equation as its organising framework. Section 2 sets out the equation as an analytical framework; Section 3 explains the structural challenge through three paradoxes; Section 4 identifies four coupled intervention pathways; and Section 5 and Section 6 address accounting, governance and implementation and draw conclusions. As a Perspective, this paper does not report a systematic review. Evidence was selected purposively from peer-reviewed studies, international agency reports and GCC policy documents, prioritising Gulf-specific and city-scale sources and using national statistics only where urban data are unavailable. Quantitative values are distinguished as observed conditions, adopted policy targets, modelled scenarios or the authors’ proposals.
2. The Net Zero City Equation: A Systems Framework
A whole-city perspective is needed because the emissions of buildings, energy, water, transport and materials are generated by the same urban systems. The Net Zero City Equation expresses this as a single annual carbon balance of emitting terms (carbon debts) and balancing terms (carbon assets), all in tonnes of CO2-equivalent per year (tCO2e yr−1):
where
Net Zero City = EC + OC + WC + TC + WE − RE − CE − CR ≈ 0
Emitting terms (carbon debts)
- EC = embodied carbon: upfront emissions (life-cycle modules A1–A5) of buildings and infrastructure completed in the reporting year;
- OC = operational carbon: energy used by the building stock, including cooling and district cooling (module B6);
- WC = water-cycle emissions: water sourcing, desalination, distribution and wastewater treatment (module B7, at city scale);
- TC = transport emissions: in-boundary transport, including electricity for vehicles and rail (module B8);
- WE = waste emissions: disposal and treatment of solid waste, including landfill methane (module C4, extended to municipal waste).
Balancing terms (carbon assets)
- RE = renewable energy: emissions avoided by renewable energy generated and consumed within the city;
- CE = circular-economy credits: emissions avoided through recycled materials and diverted organics (CEloops), carbon stored in bio-based materials (CEstock) and certified asset longevity (CElifespan);
- CR = verified carbon removals: permanent removals with verified storage of at least 100 years.
The terms are analytically distinguishable but not independent in practice. Urban form and building design influence cooling demand (OC); cooling demand sets much of peak electricity consumption and therefore the renewable capacity, storage and grid infrastructure required (RE); and the carbon intensity of electricity determines the emissions of desalination (WC) and electric transport (TC). The cooling–energy–water relationship illustrates the point. Desalination requires 10–15 kWh m−3 in thermal plants and 3–5 kWh m−3 by reverse osmosis [5], so the grid that serves cooling peaks also produces much of the city’s water. Reducing cooling demand, shifting desalination to renewable-powered reverse osmosis and decarbonising electricity therefore act on several terms at once, and their combined effect differs from the sum of separate sectoral targets.
The equation is a conceptual framework, not a substitute for established greenhouse-gas accounting standards. Its structure draws on life-cycle assessment modules for buildings and infrastructure [9,10,11,12,13], extending these principles from individual assets to the city scale. Emissions data are informed by city inventories, including the Global Protocol for Community-Scale Greenhouse Gas Inventories (GPC), complemented by consumption-based carbon footprints to capture emissions beyond territorial boundaries [14,15]. Its contribution lies in how it groups those data: embodied and operational carbon appear on one annual ledger, water appears as its own term because the GPC subsumes desalination within stationary energy, and abatement is kept separate from removals.
The following conventions keep the balance transparent. First, each saving is counted once: the emitting terms are evaluated at reference emission factors, so RE and CEloops record emissions avoided against those references rather than being deducted from an inventory that already reflects them. Second, actual reductions, avoided emissions, temporary storage and removals are kept apart: CEstock and CElifespan are reversible credits, cancelled if the material is disposed of or the asset is demolished before its certified service life, and only CR represents verified physical removal. Third, each activity belongs to one term: electricity for desalination is counted in WC and electricity for vehicles in TC, never in OC, and exported energy and materials are reported separately rather than credited. Fourth, the boundary is the metropolitan area and the reporting period one year, with gases aggregated using 100-year global warming potentials [16]. The first and third conventions follow established practice. Treating CEstock and CElifespan within an annual city balance, and extending building modules to city-scale water, transport and waste, are proposed conventions built on existing module definitions for infrastructure, biogenic carbon and service life [9,17,18], not established standards. Supplementary Material File S1 sets out the conventions, data requirements and a worked example.
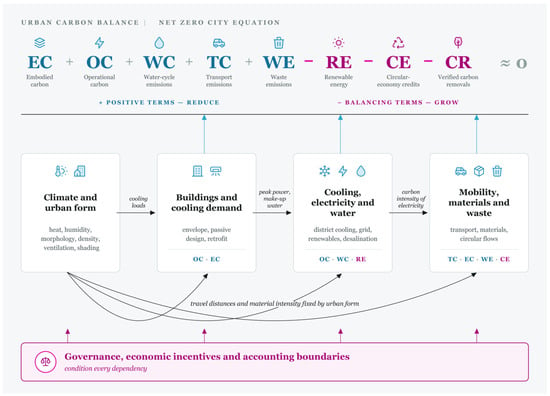
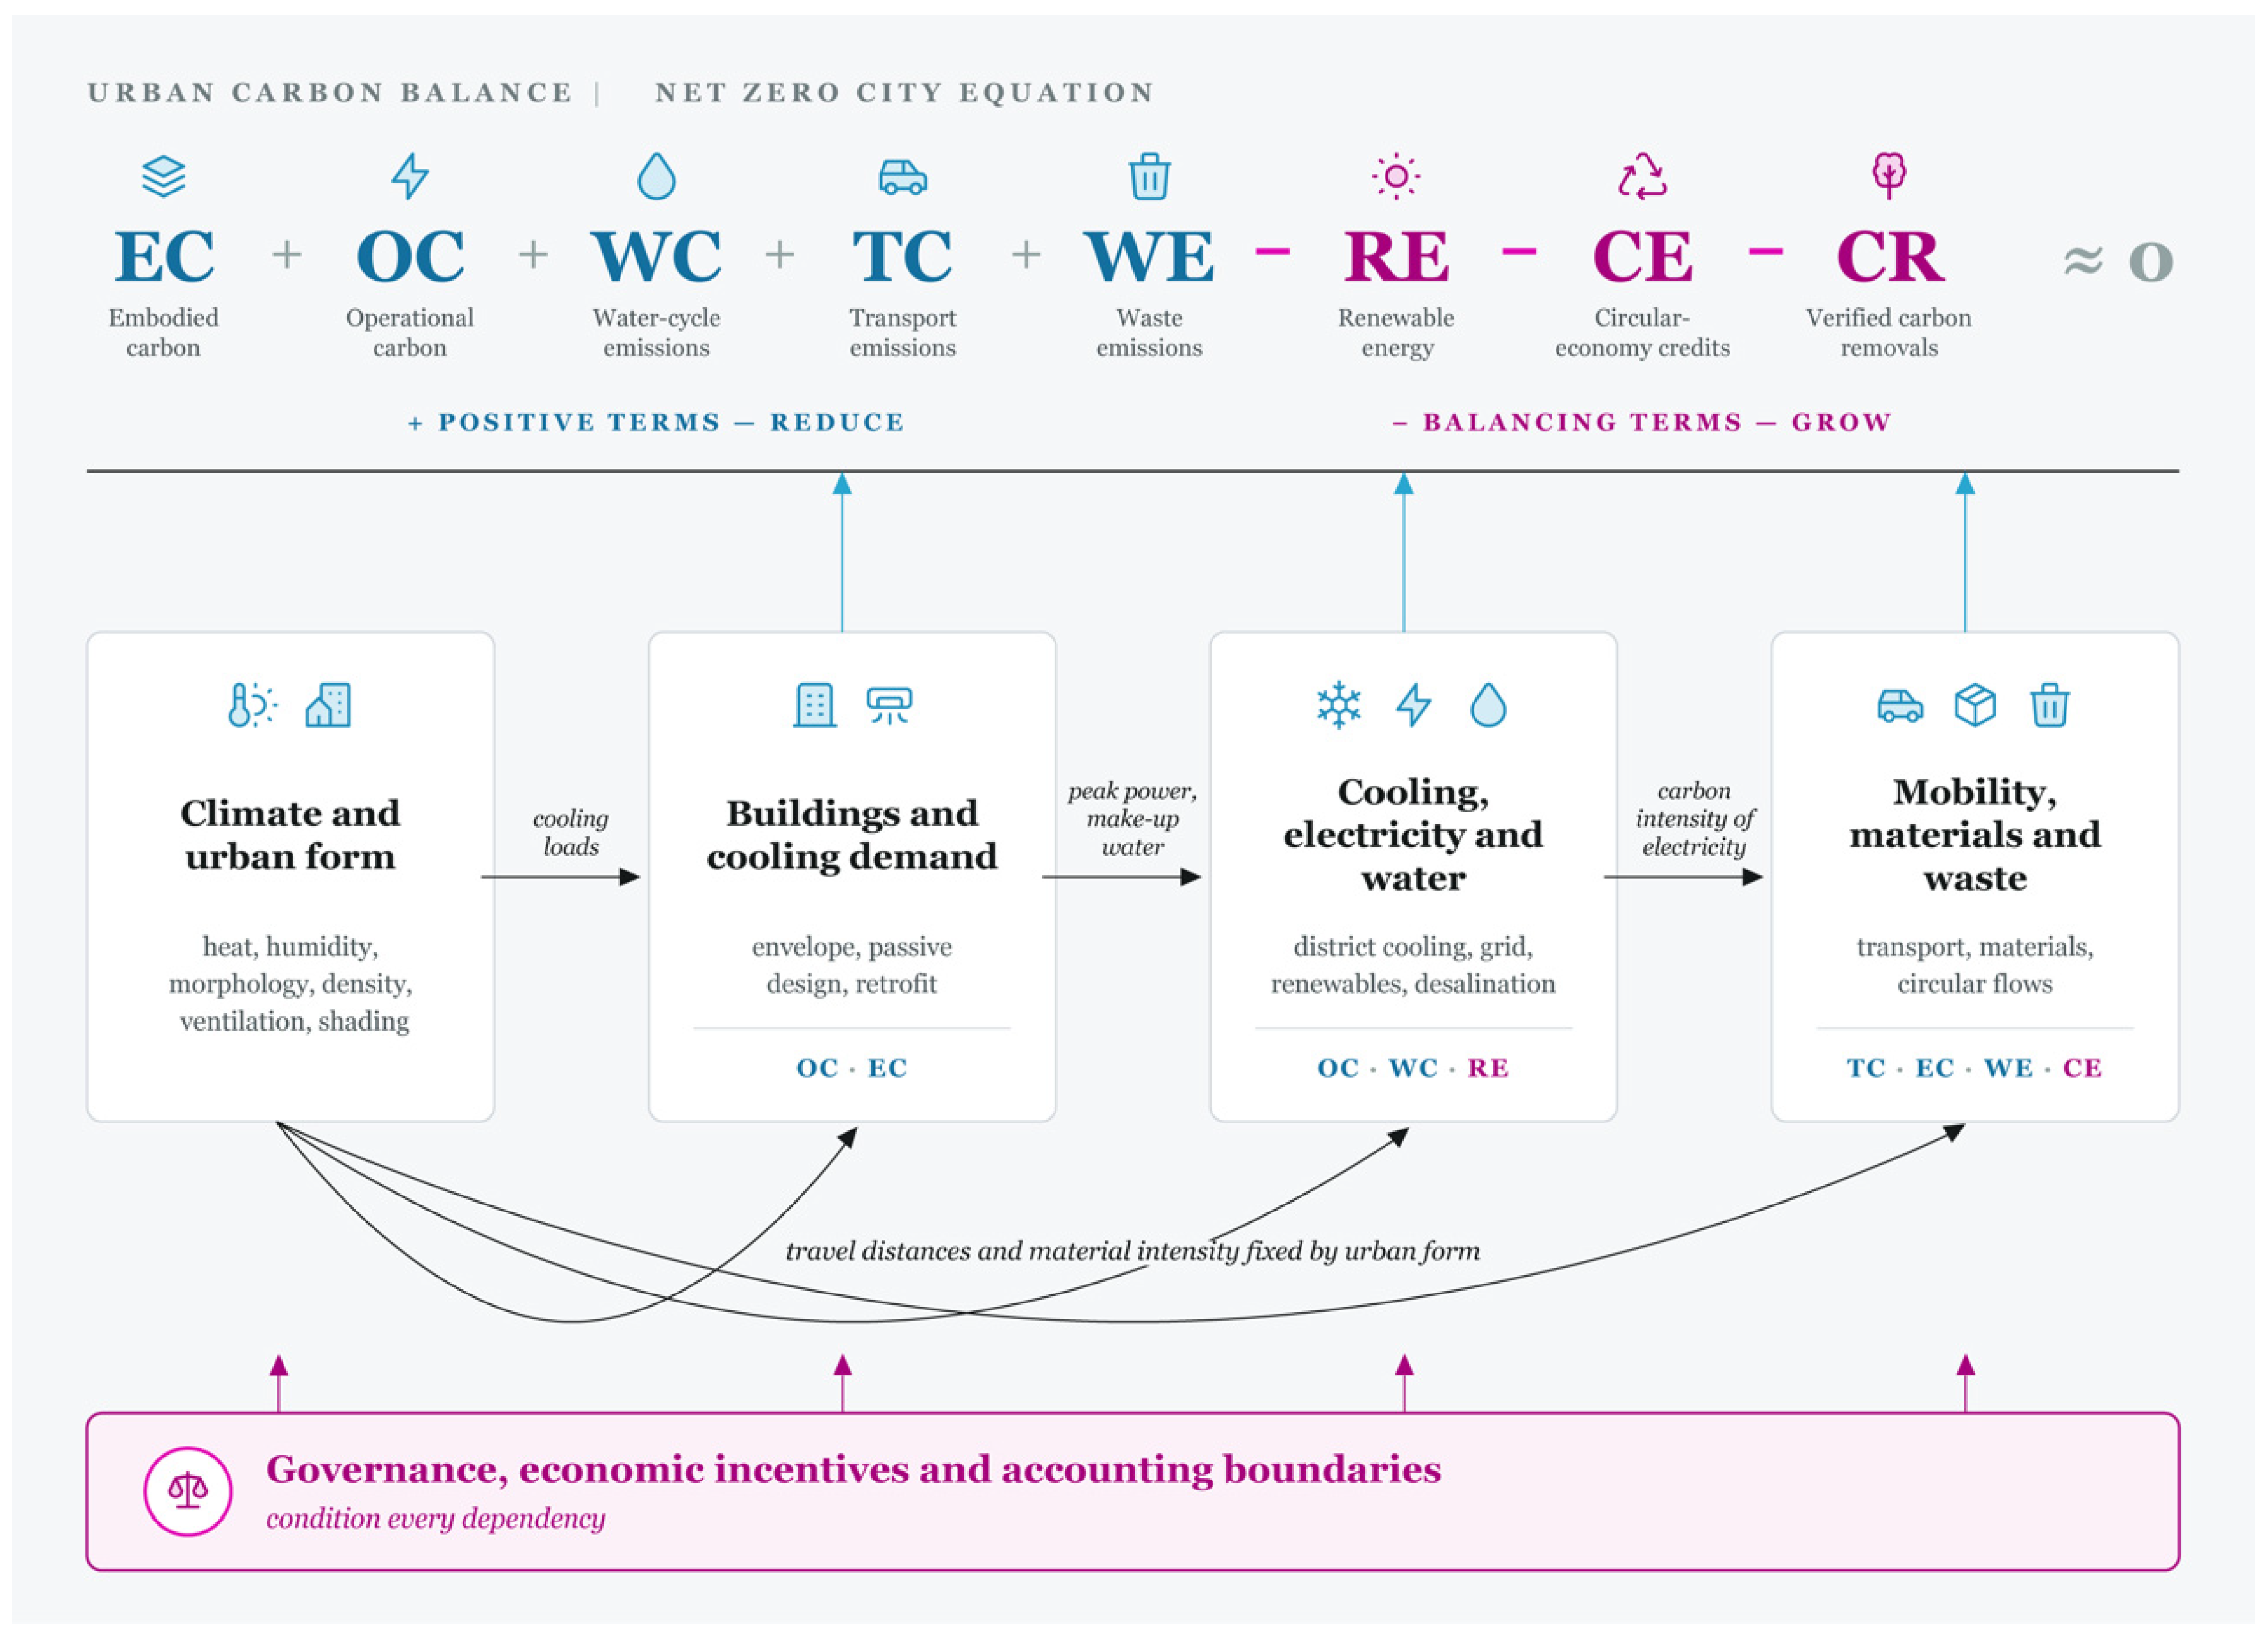
The equation locates cross-sectoral intervention points: measures that change several terms at once, such as climate-responsive urban form (OC, TC and EC), renewable-powered reverse osmosis (WC and RE) or circular construction (EC, WE and CE). Figure 1 summarises the coupled systems that the equation balances and provides the basis for examining the sectoral coupling that shapes the transition to net zero.
Figure 1.
Coupled urban systems framework illustrating the interdependencies between climate, urban form, buildings, energy, water, mobility, materials and waste. Governance, economic incentives and accounting boundaries influence these interdependencies and shape carbon accounting within the Net Zero City Equation.
3. Structural Paradoxes of Gulf Urban Decarbonisation
Three structural paradoxes help explain why interdependencies across urban systems complicate the transition to net zero. Each is examined through four elements: the underlying structural condition, the dependencies it creates, its implications for urban emissions, and the limitations of isolated sectoral interventions.
3.1. Hydrocarbon Dependence Versus Decarbonisation
Gulf states are simultaneously among the world’s largest per-capita emitters, recent and ambitious net-zero declarants, and among the most consequential hydrocarbon exporters, with plans to hold or expand production into the 2030s while global greenhouse gas emissions need to decline by 43% by 2030 relative to 2019 levels in modelled pathways that limit global warming to 1.5 °C [19]. The rentier fiscal model that funds rapid, state-led urban transformation is financed by the export revenues that a transition must eventually strand, and the largest emitters, such as Aramco, ADNOC and Industries Qatar, are also the treasuries underwriting green programmes [20].
This condition runs through the city’s carbon balance. Renewable generation and carbon removals are themselves financed by hydrocarbon revenues. Subsidised energy suppresses the price signals that drive efficiency: a review of 46 barriers to energy efficiency in the GCC built environment ranks low prices, weak regulation and poor enforcement as the most binding [21]. Low prices therefore raise every emitting term while slowing investment in renewables, circularity and removals. The industrial structure adds an accounting dependency: export-oriented petrochemical, aluminium and steel plants located in Gulf cities produce process and energy emissions that are territorial but not consumption-based, so industrial and urban inventories only partially overlap. Because the same institutions finance both the emitting assets and the transition, the paradox is structural rather than transitional, and it cannot be resolved by substituting renewable for fossil electricity alone.
3.2. Cooling Demand Versus Energy and Water Decarbonisation
In the coastal Gulf, temperatures above 48 °C, high humidity, weak night cooling and low wind speeds make substantial cooling and dehumidification a condition of habitability rather than comfort. Net-zero building approaches developed for temperate climates rely on passive design and limited mechanical cooling; here, cooling is unavoidable, but its magnitude is a design variable. Urban microclimates can increase cooling loads by up to 74 per cent, and modelled annual cooling loads for three hot-climate urban blocks range from 206 kWh m−2 yr−1 in Masdar City to 320 kWh m−2 yr−1 in Al Fahidi, differences the study attributes to microclimate, building form factor and materials [22]. A certified Passive House in Dubai requires only 50 kWh m−2 yr−1 for cooling and dehumidification [23], showing that very low operational demand, a precondition for, though not equivalent to, whole-life net zero, is technically achievable.
Cooling demand propagates through the urban system. It drives peak electricity demand and therefore the generation and storage capacity that variable renewable supply must match, and where cooling towers use desalinated make-up water, it also raises water demand. The water system is itself energy-intensive: with the renewable freshwater availability below 500 m3 per person, GCC states rely on energy-intensive desalination, while their per-capita water use is 250–350 litres per day compared with a global average of around 170 litres [8]. Urban form couples cooling to mobility and materials, because the morphology chosen today fixes cooling demand, travel distances and material intensity for decades. The implications for emissions are therefore interactive rather than additive: decarbonising electricity lowers the emissions of cooling, desalination and electric transport together, but a grid sized for cooling peaks requires more renewable capacity and storage, whereas reducing cooling loads lowers both operational carbon and the infrastructure needed to decarbonise it. Building efficiency, grid decarbonisation and water policy pursued separately leave this value unrealised and can shift emissions between terms rather than reducing them.
3.3. Net-Zero Ambition Versus Fragmented Accounting and Governance
The third paradox is not a physical emissions sector but an overarching measurement and governance challenge. Current frameworks often exclude embodied, water-related and consumption-based emissions, allowing partial accounting to be presented as net zero, whereas rigorous frameworks require net-zero greenhouse gas emissions across all scopes through deep reductions and verified removals [15,24]. The IPCC finds that cities counting only territorial and purchased-energy (Scopes 1 and 2) emissions understate their footprint by 1.6–2.0 times, and up to 4 times for high-income service economies, while consumption-based studies reveal substantial emissions displaced into global supply chains [14].
Responsibility for the coupled systems is fragmented. The six GCC states report to the UNFCCC using different boundaries and methods; state-owned enterprises and other major emitters operate under reporting systems outside city governance; and allocation rules are uncertain. Whether desalination electricity counts as building, water or energy emissions, and whether export industry belongs to the city, changes both the baseline and the apparent effect of an intervention. Gulf cities could therefore achieve territorial net zero while large embodied and imported emissions persist, and interventions that act across sectors may go unrecognised because no single agency measures their combined effect. Without consistent whole-life, consumption-based boundaries, net-zero claims cannot be robustly verified, and sectoral targets cannot be added up into a city balance.
If these paradoxes explain why sectoral strategies fall short, which coupled interventions could alter the underlying relationships and enable Gulf cities to move towards net zero?
4. Four Coupled Pathways to Net-Zero Gulf Cities
Four intervention pathways follow from this analysis. Each targets a system dependency rather than a single sector, and the first three depend on the fourth for implementation. Table 1 summarises representative interventions and their effects across systems.
Table 1.
From sectoral action to coupled intervention: representative interventions from the four pathways.
4.1. Climate-Responsive Urban Form and Buildings
The dependency links urban morphology, solar exposure and building envelopes to cooling demand, and through cooling demand, electricity and infrastructure requirements are linked. Vernacular-informed morphologies based on canyon geometry, aspect ratio, sky-view factor and shading reduce cooling demand by 40–70 per cent, and district cooling improves efficiency by about 50 per cent over distributed systems [5,25]. Masdar City’s modelled cooling load is about 35 per cent below that of the vernacular Al Fahidi block, owing to its lower form factor, insulated envelopes and reduced microclimate impacts [22], although Masdar also illustrates the risk of the showcase, having scaled back its original carbon-neutral ambition [2]. Because two-thirds of the 2050 building stock already stands, retrofit is central: it can cut emissions by about 35 per cent and costs by about 45 per cent relative to rebuilding [26], and modelling for Bahrain shows retrofit reducing building energy demand by 62 per cent and peak demand by 55 per cent [21]. Lower cooling loads reduce operational carbon, peak electricity demand and the renewable capacity needed to meet it, while whole-life carbon assessment ensures that efficiency gains are not offset by higher embodied carbon in envelopes and plants. Existing rating systems such as Estidama and GSAS can reduce electricity consumption by approximately 24–38% against GCC energy-use intensities of 150–300 kWh m−2 yr−1 [5,6]. The key implementation priority is to embed mandatory passive-design and whole-life carbon requirements in regulatory frameworks governing both urban planning and individual buildings.
4.2. Integrated Energy, Cooling and Water Systems
Electricity supply, cooling and water production share the same infrastructure and should be planned as one system. The Gulf has exceptional solar resources of 5.5–6.0 kWh m−2 day−1, reflected in record-low solar tariffs below USD 0.02 kWh−1 in Abu Dhabi and Dubai and of USD 0.023 kWh−1 in Saudi Arabia’s first national renewable energy auction [5]. Deployment nevertheless lags: Saudi Arabia’s target of 40 GW of solar by 2030 requires about 5.5 GW a year, more than double the capacity installed by 2023 [5,27], so the constraint is implementation speed rather than resource availability [28]. The coupling lies in load and timing. Cooling peaks must be met by variable renewable supply, which requires storage and demand management; renewable-powered reverse osmosis, the least energy-intensive desalination route (Section 2), reduces water-cycle emissions while drawing on the same solar resource as cooling. Demand-side measures add an immediate layer: raising commercial cooling setpoints to 24 °C can reduce cooling energy demand by 10–15 per cent, and lower water consumption reduces desalination energy. Building retrofit lowers water-cycle emissions only indirectly, where smaller cooling loads reduce cooling-tower make-up water or lower peaks allow desalination to shift to hours of solar supply; otherwise, desalination emissions depend on water volumes and on the energy intensity and emission factor of supply. The implementation requirement is joint planning by power, water and cooling utilities, so that renewable procurement, desalination investment and district-cooling concessions are assessed against their combined effect.
4.3. Low-Carbon Mobility and Circular Material Flows
Urban form also links transport demand with material consumption and waste, highlighting three complementary intervention levers: reducing demand, transforming material flows and decarbonising energy use. By shaping travel distances, transport demand and modal choice, urban form can substantially influence per-capita transport energy use [29]. Across Gulf cities, public transport accounts for less than 15 per cent of trips outside the Dubai and Riyadh metropolitan areas, while large urban blocks, limited shading and long distances exposed to extreme summer heat further constrain walkability and public transport use [30]. Electrification alone is insufficient: Paris-compatible pathways require both fleet electrification and modal shift [31], and modelling shows that private car use must nearly halve to meet the IPCC’s 2030 reduction [32]. Transit-oriented rezoning and covered, climate-controlled active-mobility corridors reduce demand, while electrification moves the remaining transport emissions onto the grid, where they depend on the progress of the second pathway.
Construction materials and waste close the loop. Process emissions from cement, steel and aluminium resist electrification, and the IEA net-zero scenario relies on a large expansion of carbon capture [7], for which the Gulf is well positioned geologically and financially but which remains at pilot scale. Low-carbon binders such as limestone calcined clay cement and geopolymers, the reuse of structural elements and recycled aggregates reduce embodied carbon, and diverting organics from landfill reduces waste methane. Gulf recycling remains below 30–40 per cent against diversion targets of 60–75 per cent, with producer-responsibility systems still emerging. Waste reduction, source separation, composting and anaerobic digestion of organics, and landfill-gas recovery are among the most cost-effective methane measures available [33]; in Qatar, where about 90 per cent of waste is landfilled and organics make up 57 per cent of municipal solid waste, anaerobic digestion could offset 0.7–1.4 per cent of national emissions [34]. Circular construction therefore acts on embodied carbon, waste emissions and circular-economy credits together [35]. The implementation requirement is procurement and disclosure: circular public procurement, extended producer responsibility and mandatory embodied-carbon reporting for major developments.
4.4. Coordinated Governance, Measurement and Finance
Governance is the mechanism that allows the other three pathways to work together. The dependency is institutional: the effects of an intervention fall on terms measured by different agencies. A unified accounting protocol that reports territorial and consumption-based totals side by side on a common inventory basis [36], building on consumption-based frameworks [15,24], would allow interventions to be credited for their combined effect. Economic instruments are the second element. No GCC member operates a comprehensive carbon tax or emissions trading system, but the EU Carbon Border Adjustment Mechanism, effective from 2026, increases pressure on carbon-intensive Gulf exports, and carbon pricing can strengthen incentives for reduction while limiting leakage [37]. Subsidy reform with targeted household protection would restore the price signals that the hydrocarbon paradox suppresses. Third, state-owned enterprises need audited decarbonisation roadmaps aligned with city targets. Regional initiatives show that the design vocabulary and regulatory experiments already exist, for instance, in Qatar’s GORD that extends GSAS (Global Sustainability Assessment System) towards whole-life carbon ahead of any mandate. What is missing is integration that turns exemplary pilots into the regulatory default. The main implementation requirement is a coordinating mandate, at the city or emirate level, with authority over planning, utilities and procurement.
5. Governance, Accounting and Implementation
Applying the framework in practice raises three questions: how cities should establish consistent baselines and accounting boundaries, how decision-makers can evaluate interactions between sectors, and which institutional and financial arrangements can coordinate interventions.
Consistent baselines require a fixed metropolitan boundary, a single reporting year and explicit allocation rules, with the GPC [36] as the common inventory basis and whole-life carbon modules for embodied terms. Few GCC cities publish city-scale inventories, embodied-carbon data are scarce, and national statistics often stand in for urban ones; the results are therefore sensitive to the boundary, the reference emission factors and the treatment of export-oriented industry and must be calibrated to the local electricity and desalination mix, stage of urban development, building typologies and industrial structure. A limited set of indicators can track the coupled system: building energy-use intensity (kWh m−2 yr−1), renewable share of electricity, water-related energy intensity (kWh m−3), transport emissions per resident and upfront embodied carbon (kgCO2e m−2). Table S3 distinguishes, for each indicator, observed regional baselines, targets formally adopted by governments, modelled scenarios and benchmarks proposed by the authors. As proposals rather than established GCC-wide requirements, we suggest benchmarks of ≤350 kgCO2e m−2 upfront embodied carbon and ≤90 kWh m−2 yr−1 operational energy by 2035, tightening to ≤250 kgCO2e m−2 and ≤60 kWh m−2 yr−1 by 2050, informed by international limits [29,38,39], and a 70 per cent renewable share of electricity by 2035, which follows the direction, though not the regional detail, of global pathways in which electricity decarbonises ahead of other sectors [7].
Evaluating interactions requires each intervention to be assessed against all the terms it affects, not only the one it targets. Because each saving is counted once and assigned to the term in which it occurs, the combined effect of coupled measures can be read from the balance. A stylised application to a Gulf city of three million residents (Supplementary Material File S1) illustrates this: with a quarter of electricity from renewables, the balance falls from 20.7 to 16.7 MtCO2e yr−1, and even a fully renewable grid would leave about 7.8 MtCO2e yr−1 from embodied carbon, transport fuels and waste, which only coupled measures on materials, mobility and waste can reduce.
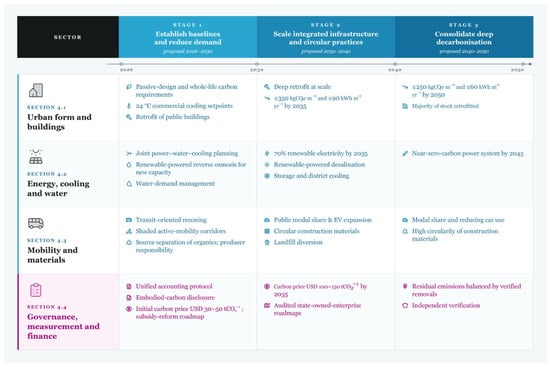
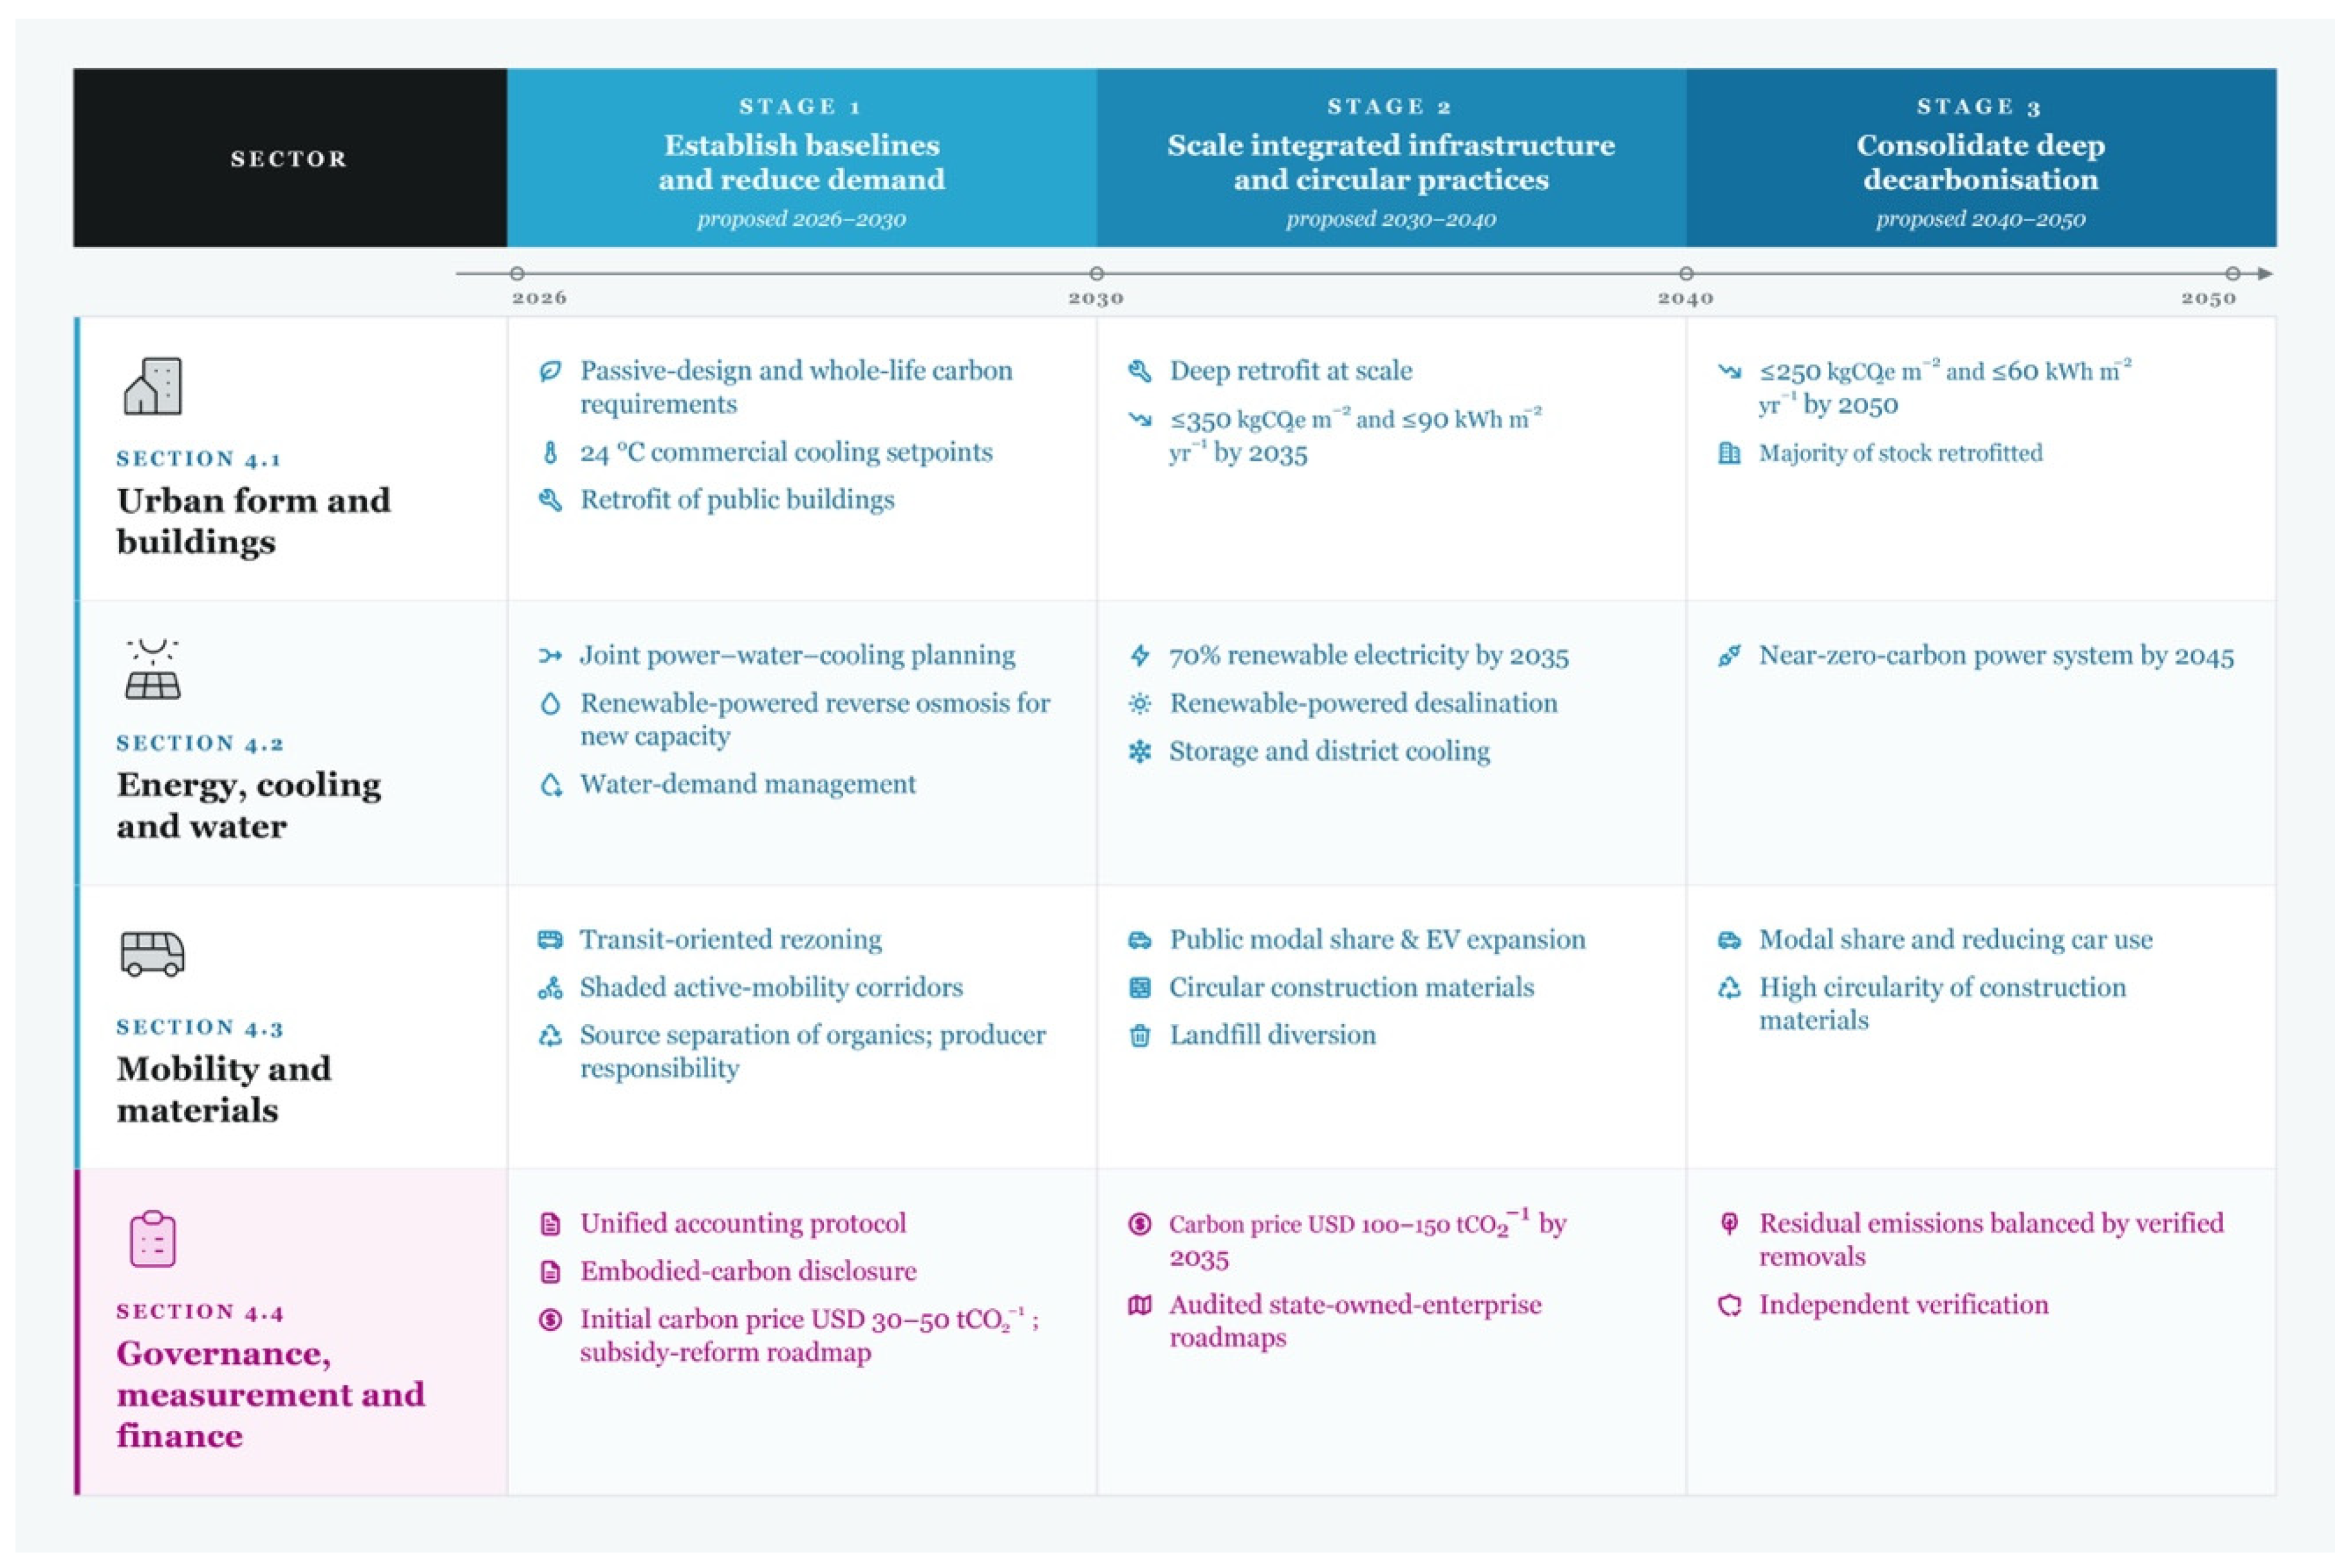
Coordination requires institutions whose remit matches the coupled system, together with financing that rewards combined effects. Figure 2 organises the four pathways into three proposed stages: establishing baselines and reducing demand, scaling integrated infrastructure and circular practices, and consolidating deep decarbonisation. Its timeframes are proposed stages of action, not forecasts or commitments by Gulf governments. Financing follows the same logic: a phased carbon price, proposed here at USD 30–50 tCO2−1 initially and rising to USD 100–150 tCO2−1 by 2035, combined with subsidy reform and household protection, could retain revenues domestically and fund coupled infrastructure.
Figure 2.
Proposed stages of action for the four coupled pathways; see Supplementary Table S3 for status of quantitative values.
6. Discussion and Conclusions: From Sectoral Targets to Systemic Change
Gulf cities require a coupled-systems approach because their climatic conditions, urban form, infrastructure and political economy shape emissions across multiple sectors simultaneously. Cooling drives electricity demand, water scarcity increases reliance on energy-intensive desalination, and long-lived urban form locks in operational and embodied emissions. Hydrocarbon revenues both finance urban development and complicate the transition away from carbon-intensive systems. Vernacular oasis settlements, in which environmental flows were managed across climate, water and resource systems, demonstrate the historical importance of these interdependencies in hot-arid urbanism [40]. These interdependencies help explain why sectoral targets, although necessary, cannot by themselves establish a credible pathway to net-zero urban systems.
The Net Zero City (Carbon Balancing) Equation provides a conceptual framework for making the components of the proposed net-zero balance explicit. By bringing embodied and operational carbon, water, transport and waste emissions together with renewable energy benefits, circular-economy credits and verified removals, it provides a common structure for examining what enters the balance and how different terms are accounted for. It does not replace established greenhouse-gas accounting standards or model the dynamics of urban systems. Its value lies in making the accounting boundary and constituent terms more transparent, providing a basis for examining how interventions affect different parts of the balance. The proposed extensions to city-scale water, transport and waste accounting, as well as the treatment of material stocks and asset longevity, require further methodological development and validation.
Moving from sectoral targets to systemic change is therefore an institutional as well as a technological challenge. The four intervention pathways identified in this Perspective (climate-responsive urban form and buildings; integrated energy, cooling and water systems; low-carbon mobility and circular material flows; and coordinated governance, measurement and finance) provide a basis for translating the coupled-systems analysis into coordinated action. Implementation requires transparent accounting, consistent baselines and governance arrangements capable of aligning planning, infrastructure investment and economic incentives across sectors. The Equation offers a structure for organising the net-zero balance; the coupled-systems approach provides the wider rationale for coordinating the interventions needed to change it.
This approach may also inform decarbonisation in other hot-arid regions, where extreme heat, water scarcity and growing urban demand create related, though not identical, challenges. Drylands already support approximately 2.3 billion people and may encompass up to 5 billion by 2100 under changing climatic and land-use conditions [41]. Applying the approach beyond the Gulf would require recalibrating its accounting terms, system boundaries and intervention priorities to local climatic, urban, economic and institutional conditions. Its broader contribution is to connect the accounting of urban emissions with an understanding of the interdependencies that must be addressed to achieve net-zero urban futures.
Supplementary Materials
The following supporting information can be downloaded at: https://www.mdpi.com/article/10.3390/su182111273/s1, Supplementary Material File S1: Accounting conventions, data inventory and worked example for the Net Zero City Equation; Table S1: Accounting conventions of the Net Zero City Equation (all terms in tCO2e yr−1); Table S2: Data streams and verification references for each term; Table S3: Status of the main quantitative values; Box S1: Stylised carbon balance.
Funding
This research received APC funding from Bond University.
Institutional Review Board Statement
Not applicable.
Informed Consent Statement
Not applicable.
Data Availability Statement
No new data were created or analyzed in this study. Data sharing is not applicable to this article.
Conflicts of Interest
The author declares no conflicts of interest.
References
- UNFCCC. Global Stocktake. Available online: https://unfccc.int/topics/global-stocktake (accessed on 7 July 2026).
- Net Zero Tracker. Available online: https://zerotracker.net/ (accessed on 15 August 2024).
- State of Qatar. Nationally Determined Contribution (NDC) 2021. Available online: https://unfccc.int/sites/default/files/NDC/2022-06/Qatar%20NDC.pdf (accessed on 7 July 2026).
- Crippa, M.; Guizzardi, D.; Pagani, F.; Banja, M.; Muntean, M.; Schaaf, E.; Monforti-Ferrario, F.; Becker, W.E.; Quadrelli, R.; Risquez, M.A.; et al. GHG Emissions of All World Countries. Available online: https://publications.jrc.ec.europa.eu/repository/handle/JRC138862 (accessed on 27 July 2026).
- IRENA. Renewable Energy Markets: GCC 2023. 2023. Available online: https://www.irena.org/-/media/Files/IRENA/Agency/Publication/2023/Dec/IRENA_Rnewable_energy_markets_GCC_2023.pdf (accessed on 7 July 2026).
- Al-Sallal, K.A. Low Energy Low Carbon Architecture: Recent Advances & Future Directions. Available online: https://www.routledge.com/Low-Energy-Low-Carbon-Architecture-Recent-Advances--Future-Directions/Al-Sallal/p/book/9780367574840 (accessed on 7 July 2026).
- IEA. Net Zero Roadmap: A Global Pathway to Keep the 1.5 °C Goal in Reach–Analysis. Available online: https://www.iea.org/reports/net-zero-roadmap-a-global-pathway-to-keep-the-15-c-goal-in-reach (accessed on 20 July 2026).
- World Bank Group. The Role of Desalination in an Increasingly Water-Scarce World. Available online: https://openknowledge.worldbank.org/entities/publication/214476a0-e59d-55f2-a6cd-872cacc30c55 (accessed on 7 July 2026).
- CEN EN 15978:2026; A Harmonized Method to Assess the Environmental Performance of Buildings. European Committee for Standardization: Brussels, Belgium, 2026. Available online: https://www.cencenelec.eu/news-events/news/2026/en-in-the-spotlight/2026-04-17-en-15978-2026/ (accessed on 26 October 2026).
- CEN EN 15804:2012+A2:2019; Core Rules for Construction EPDs. European Committee for Standardization: Brussels, Belgium, 2019. Available online: https://standards.iteh.ai/catalog/standards/cen/c98127b4-8dc2-48a4-9338-3e1366b16669/en-15804-2012a2-2019 (accessed on 26 October 2026).
- ISO 14040:2006; Environmental Management—Life Cycle Assessment—Principles and Framework. International Organization for Standardization: Geneva, Switzerland, 2006. Available online: https://www.iso.org/standard/37456.html (accessed on 26 October 2026).
- ISO 14044:2006; Environmental Management—Life Cycle Assessment—Requirements and Guidelines. International Organization for Standardization: Geneva, Switzerland, 2006. Available online: https://www.iso.org/standard/38498.html (accessed on 26 October 2026).
- RICS. Whole Life Carbon Assessment (WLCA) for the Built Environment, 2nd ed.; RICS: London, UK, 2014; Available online: https://www.rics.org/profession-standards/rics-standards-and-guidance/sector-standards/construction-standards/whole-life-carbon-assessment (accessed on 26 October 2026).
- Moran, D.; Kanemoto, K.; Jiborn, M.; Wood, R.; Többen, J.; Seto, K. Carbon Footprints of 13,000 Cities. Environ. Res. Lett. 2018, 13, 064041. [Google Scholar] [CrossRef] [Scilit]
- Ramaswami, A.; Tong, K.; Canadell, J.; Jackson, R.; Stokes, E.; Dhakal, S.; Finch, M.; Jittrapirom, P.; Singh, N.; Yamagata, Y.; et al. Carbon Analytics for Net-Zero Emissions Sustainable Cities. Nat. Sustain. 2021, 4, 460–463. [Google Scholar] [CrossRef] [Scilit]
- Intergovernmental Panel on Climate Change (IPCC) (Ed.) The Earth’s Energy Budget, Climate Feedbacks and Climate Sensitivity. In Climate Change 2021–The Physical Science Basis: Working Group I Contribution to the Sixth Assessment Report of the Intergovernmental Panel on Climate Change; Cambridge University Press: Cambridge, UK, 2023; pp. 923–1054. [Google Scholar]
- CEN EN 16449:2014; Biogenic Carbon Calculation for Wood Products. European Committee for Standardization: Brussels, Belgium, 2014. Available online: https://standards.iteh.ai/catalog/standards/cen/1b0a9c94-20a6-4e62-a711-6a5fa3570440/en-16449-2014 (accessed on 26 October 2026).
- ISO 15686-1:2011; Buildings and Constructed Assets—Service Life Planning. International Organization for Standardization: Geneva, Switzerland, 2011. Available online: https://www.iso.org/standard/45798.html (accessed on 26 October 2026).
- AR6 Synthesis Report: Climate Change 2023. Available online: https://www.ipcc.ch/report/ar6/syr/ (accessed on 26 October 2026).
- Hanieh, A. Money, Markets, and Monarchies. Available online: https://www.cambridge.org/core/books/money-markets-and-monarchies/BC04CB4102C5394A8C1F3EADEFD6E988 (accessed on 7 July 2026).
- Khan, I.; Bicer, Y.; Asif, M.; Al-Ansari, T.A.; Khan, M.; Kurniawan, T.A.; Al-Ghamdi, S.G. The GCC’s Path to a Sustainable Future: Navigating the Barriers to the Adoption of Energy Efficiency Measures in the Built Environment. Energy Convers. Manag. X 2024, 23, 100636. [Google Scholar] [CrossRef] [Scilit]
- Giurgiu, I.C.; Ottmann, D.A. Relationships Between Urban Form, Microclimate, and Energy Efficiency in Hot Climates. Urban Sci. 2025, 9, 527. [Google Scholar] [CrossRef] [Scilit]
- Passive House Institute. Database: Dubai Cerified Project. Available online: https://passivehouse-database.org/#d_5065 (accessed on 27 July 2026).
- Levin, K.; Fransen, T.; Schumer, C.; Davis, C.; Boehm, S. What Does “Net-Zero Emissions” Mean? 8 Common Questions, Answered; World Resources Institute: Washington, DC, USA, 2023. [Google Scholar]
- Ottmann, D.A. Oasis by the Sea. In Amphibious Concepts at the Edge of the Sea; Baumeister, J.C., Giurgiu, I.A., Ottmann, D., Eds.; Springer Nature: Singapore, 2025; pp. 163–190. [Google Scholar]
- C40 Cities Climate Leadership Group. Energy and Buildings; C40 Cities Climate Leadership Group: London, UK, 2024. [Google Scholar]
- IRENA. Renewable Capacity Statistics 2024. Available online: https://www.irena.org/Publications/2024/Mar/Renewable-capacity-statistics-2024 (accessed on 20 July 2026).
- IRENA. Renewable Capacity Statistics 2025. Available online: https://www.irena.org/Publications/2025/Mar/Renewable-capacity-statistics-2025 (accessed on 27 July 2026).
- IPCC. Chapter 9: Buildings. Available online: https://www.ipcc.ch/report/ar6/wg3/chapter/chapter-9/ (accessed on 9 June 2026).
- PwC. Middle East Smart Mobility: GCC City Future. Available online: https://www.strategyand.pwc.com/m1/en/reports/2019/smart-mobility-gcc-cities.html (accessed on 27 July 2026).
- Institute for Transportation and Development Policy (ITDP); University of California, Davis (UC Davis). Compact Cities Electrified: Egypt; Institute for Transportation and Development Policy: New York, NY, USA, 2022. [Google Scholar]
- Winkler, L.; Pearce, D.; Nelson, J.; Babacan, O. The Effect of Sustainable Mobility Transition Policies on Cumulative Urban Transport Emissions and Energy Demand. Nat. Commun. 2023, 14, 2357. [Google Scholar] [CrossRef] [Scilit]
- UNEP; CCAC. Global Methane Assessment: Benefits and Costs of Mitigating Methane Emissions. Available online: https://wedocs.unep.org/items/4d9774f8-1a9d-42d1-be2c-122408159b15 (accessed on 26 October 2026).
- Ghanimeh, S.; Sangor, F.I.; Alahmad, J.K.; Gomez-Sanabria, A.; AlMomani, F.; Halwani, H.A.; Purohit, S.; Chakrabortty, R. Harnessing Waste for Emission Cuts: The Anaerobic Digestion Potential in Qatar. Earth Syst. Environ. 2025, 9, 1923–1936. [Google Scholar] [CrossRef] [Scilit]
- Ellen MacArthur Foundation. The Circular Economy: A Missing Piece in City Climate Action Plans? Available online: https://www.ellenmacarthurfoundation.org/articles/the-circular-economy-a-missing-piece-in-city-climate-action-plans (accessed on 20 July 2026).
- WRI; C40 Cities Climate Leadership Group. ICLEI Global Protocol for Community-Scale Greenhouse Gas Inventories 1.1|GHG Protocol. Available online: https://ghgprotocol.org/blog/now-published-global-protocol-community-scale-greenhouse-gas-inventories-11%C2%A0?utm_source=chatgpt.com (accessed on 26 October 2026).
- OECD. Pricing Greenhouse Gas Emissions 2024: Gearing Up to Bring Emissions Down. OECD Series on Carbon Pricing and Energy Taxation. 2024. Available online: https://www.oecd.org/en/publications/pricing-greenhouse-gas-emissions-2024_b44c74e6-en.html (accessed on 7 July 2026).
- World Green Building Council. Embodied Carbon; World Green Building Council: London, UK, 2026; Available online: https://worldgbc.org/climate-action/embodied-carbon/ (accessed on 26 October 2026).
- UK Net Zero Carbon Buildings Standard. UK Net Zero Carbon Buildings Standard, Version 1, Revision 1; Net Zero Carbon Buildings Standard Limited: London, UK, 2026; Available online: https://www.nzcbuildings.co.uk/ (accessed on 26 October 2026).
- Ottmann, D.A. Traditional Building Knowledge Oman. Available online: https://storymaps.arcgis.com/stories/4cbb6650aa6342758941ec785f04b40d (accessed on 13 May 2023).
- United Nations Convention to Combat Desertification (UNCCD). Three-Quarters of Earth’s Land Became Permanently Drier in Last Three Decades: UN; United Nations Sustainable Development: New York, NY, USA, 2024; Available online: https://www.un.org/sustainabledevelopment/blog/2024/12/press-release-three-quarters-of-earths-land-became-permanently-drier-in-last-three-decades-un/ (accessed on 26 October 2026).

Disclaimer/Publisher’s Note: The statements, opinions and data contained in all publications are solely those of the individual author(s) and contributor(s) and not of MDPI and/or the editor(s). MDPI and/or the editor(s) disclaim responsibility for any injury to people or property resulting from any ideas, methods, instructions or products referred to in the content. |
© 2026 by the author. Licensee MDPI, Basel, Switzerland. This article is an open access article distributed under the terms and conditions of the Creative Commons Attribution (CC BY) license.