


Abstract
Climate change and urbanization are altering urban flood pressure, raising questions about whether urban adaptive capacity can keep pace with these changes. This study examined flood pressure, adaptive capacity, and their coordination across 14 cities in the core development area of the Central Plains Urban Agglomeration, China, from 2016 to 2023. The entropy weight method, coupling coordination degree model, and four-quadrant classification were integrated to assess spatiotemporal patterns and transitions in pressure–adaptation combinations. The regional flood pressure index increased overall from 0.2549 in 2016 to 0.3028 in 2023, with fluctuations, while the adaptive capacity index rose steadily from 0.2730 to 0.5293. The regional mean coupling coordination degree increased from 0.5917 to 0.7626, and intercity differences narrowed. Pressure–adaptation combinations shifted from a predominance of low-adaptation types toward high-adaptation types: 13 of 14 cities were classified as low-adaptation types in 2016, whereas all 14 were in high-adaptation categories by 2023, including nine high-pressure–high-adaptation and five low-pressure–high-adaptation cities. These findings provide a scientific basis for differentiated urban flood management and adaptive capacity planning.
1. Introduction
With the continuous warming of the global climate and the rapid advancement of urbanization, urban rainstorm and flood disasters have become increasingly frequent [1,2,3]. On 20 July 2021, Zhengzhou, China, experienced an extreme rainstorm event with an hourly rainfall of 201.9 mm, causing severe urban flooding, major casualties, and economic losses [4]. In September 2023, Storm Daniel brought heavy rainfall to northeastern Libya. The city of Derna suffered severe damage due to flooding and the collapse of two dams, resulting in more than 5000 casualties [5]. On 7 March 2025, extreme rainfall triggered severe urban flooding in Bahía Blanca, Argentina, causing at least 15 fatalities and widespread impacts on low-lying urban areas and infrastructure [6]. These events indicate that flood disasters have become an important factor affecting the safe operation of cities and sustainable socioeconomic development [7,8]. For urban agglomerations characterized by high concentrations of population and economic activities, how to simultaneously enhance urban adaptive capacity under continuously changing flood pressure has become an urgent issue in urban climate adaptation and disaster risk governance [9].
Regarding urban flooding, scholars have conducted extensive research on multidimensional comprehensive assessments involving hazard, exposure, vulnerability, adaptive capacity, and resilience. Frameworks such as pressure–state–response (PSR), driving force–pressure–state–impact–response (DPSIR), social–ecological systems, and hazard–exposure–vulnerability–adaptive capacity have been widely applied to urban flood risk and resilience assessment [10,11,12,13,14]. For example, Yuan et al. [14] developed an urban rainstorm flood resilience assessment system for Kunming based on the DPSIR framework and analyzed the dynamic evolution of flood resilience from five dimensions: driving forces, pressures, states, impacts, and responses. Chang et al. [10] developed an urban flood vulnerability assessment framework from the perspective of social–ecological–technological systems (SETSs), incorporating exposure, sensitivity, and adaptive capacity into a unified indicator system to comprehensively assess the spatial differentiation of urban flood vulnerability and the characteristics of multiple overlapping vulnerabilities. Sun et al. [13] constructed an urban waterlogging risk assessment system from three aspects, namely hazard, socioeconomic exposure, and urban adaptive capacity, and conducted a comprehensive assessment of waterlogging risk in 89 cities in eastern China. It can be found from the above literature that existing studies have been able to systematically describe the spatial differences and temporal evolution of flood resilience across different cities or urban agglomerations. However, existing comprehensive assessment studies usually aggregate multiple influencing factors into a single risk or resilience index, or treat adaptive capacity as a component of an integrated risk assessment system. Although these approaches facilitate comprehensive assessments of urban flood systems, comparatively less attention has been devoted to examining the temporal evolution of flood pressure and adaptive capacity as distinct dimensions, as well as the coordination between their changes [10,14,15,16,17].
Recent studies have found that areas with high flood risk do not necessarily have adaptive capacity that matches their risk levels, and a high level of adaptive capacity does not necessarily mean that flood pressure has been effectively controlled [18,19]. Therefore, scholars have gradually shifted from single-system assessment toward examining the coordination, trade-offs, and matching relationships among different subsystems. Wang et al. [20] separately quantified urban flood risk and resilience and found that substantial differences in resilience may still exist under the same level of flood risk. They further classified the study units into four types: high risk–low resilience, high risk–high resilience, low risk–low resilience, and low risk–high resilience. Li et al. [21] constructed an improved coupling coordination degree model and a coordination impact model, incorporated urbanization and flood disasters into a unified analytical framework, and revealed the stage-specific and spatial differentiation characteristics of their coupling coordination relationship. Taking the central urban area of Zhengzhou as an example, Di et al. [22] constructed a flood resilience assessment framework integrating driving force–pressure–state–response (DPSR) and natural–economic–social–hazard (NESH) models, and found that resilience in the pressure dimension continuously decreased with increasing rainfall intensity, while different resilience dimensions showed obvious spatial differentiation characteristics. Liu et al. [23] incorporated urbanization, flood resilience, and social vulnerability into a unified framework to analyze their coupled evolution and found that different regions exhibited differentiated development pathways. These studies provide an important basis for understanding the urban flood composite system. However, existing studies have focused more on the relationships among different subsystems within comprehensive resilience, while research on the coupling coordination relationship between flood pressure and adaptive capacity is still lacking. Therefore, it is difficult to reveal whether increases in adaptive capacity, such as infrastructure construction during urban development, can adapt to changes in urban flood pressure under the background of climate change and urbanization.
Based on this, to deepen the understanding of the coordinated evolution and combination relationship between pressure and adaptive capacity within urban flood systems, and to identify possible adaptive shortcomings and structural differences in pressure–adaptation combinations among different cities, this study takes the core development area of the Central Plains Urban Agglomeration as the study area, establishes quantitative models of urban flood pressure and adaptive capacity, analyzes the spatiotemporal evolution and coupling coordination relationship between flood pressure and adaptive capacity, and uses a four-quadrant model to identify the combination relationships and evolutionary pathways of flood pressure and adaptive capacity in different cities. This integrated framework ensures interannual comparability through a common normalization reference and fixed indicator weights, accounts for the adverse direction of flood pressure in coupling coordination assessment, and reveals structural differences in pressure–adaptation combinations that cannot be fully captured by the overall coordination degree alone. The research methods and results can provide a scientific basis for implementing differentiated flood risk governance, optimizing the priorities of adaptive capacity construction, and improving the coordination of regional urban flood governance in the core development area of the Central Plains Urban Agglomeration.
2. Study Area and Data Sources
2.1. Overview of the Study Area
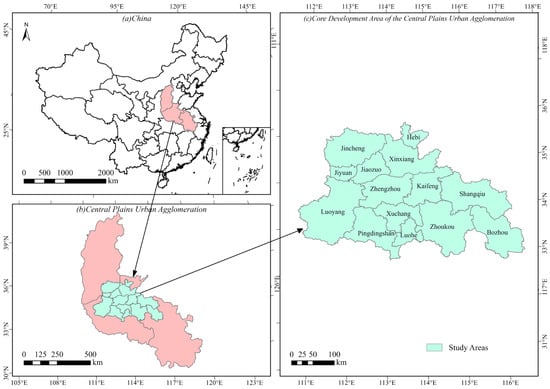
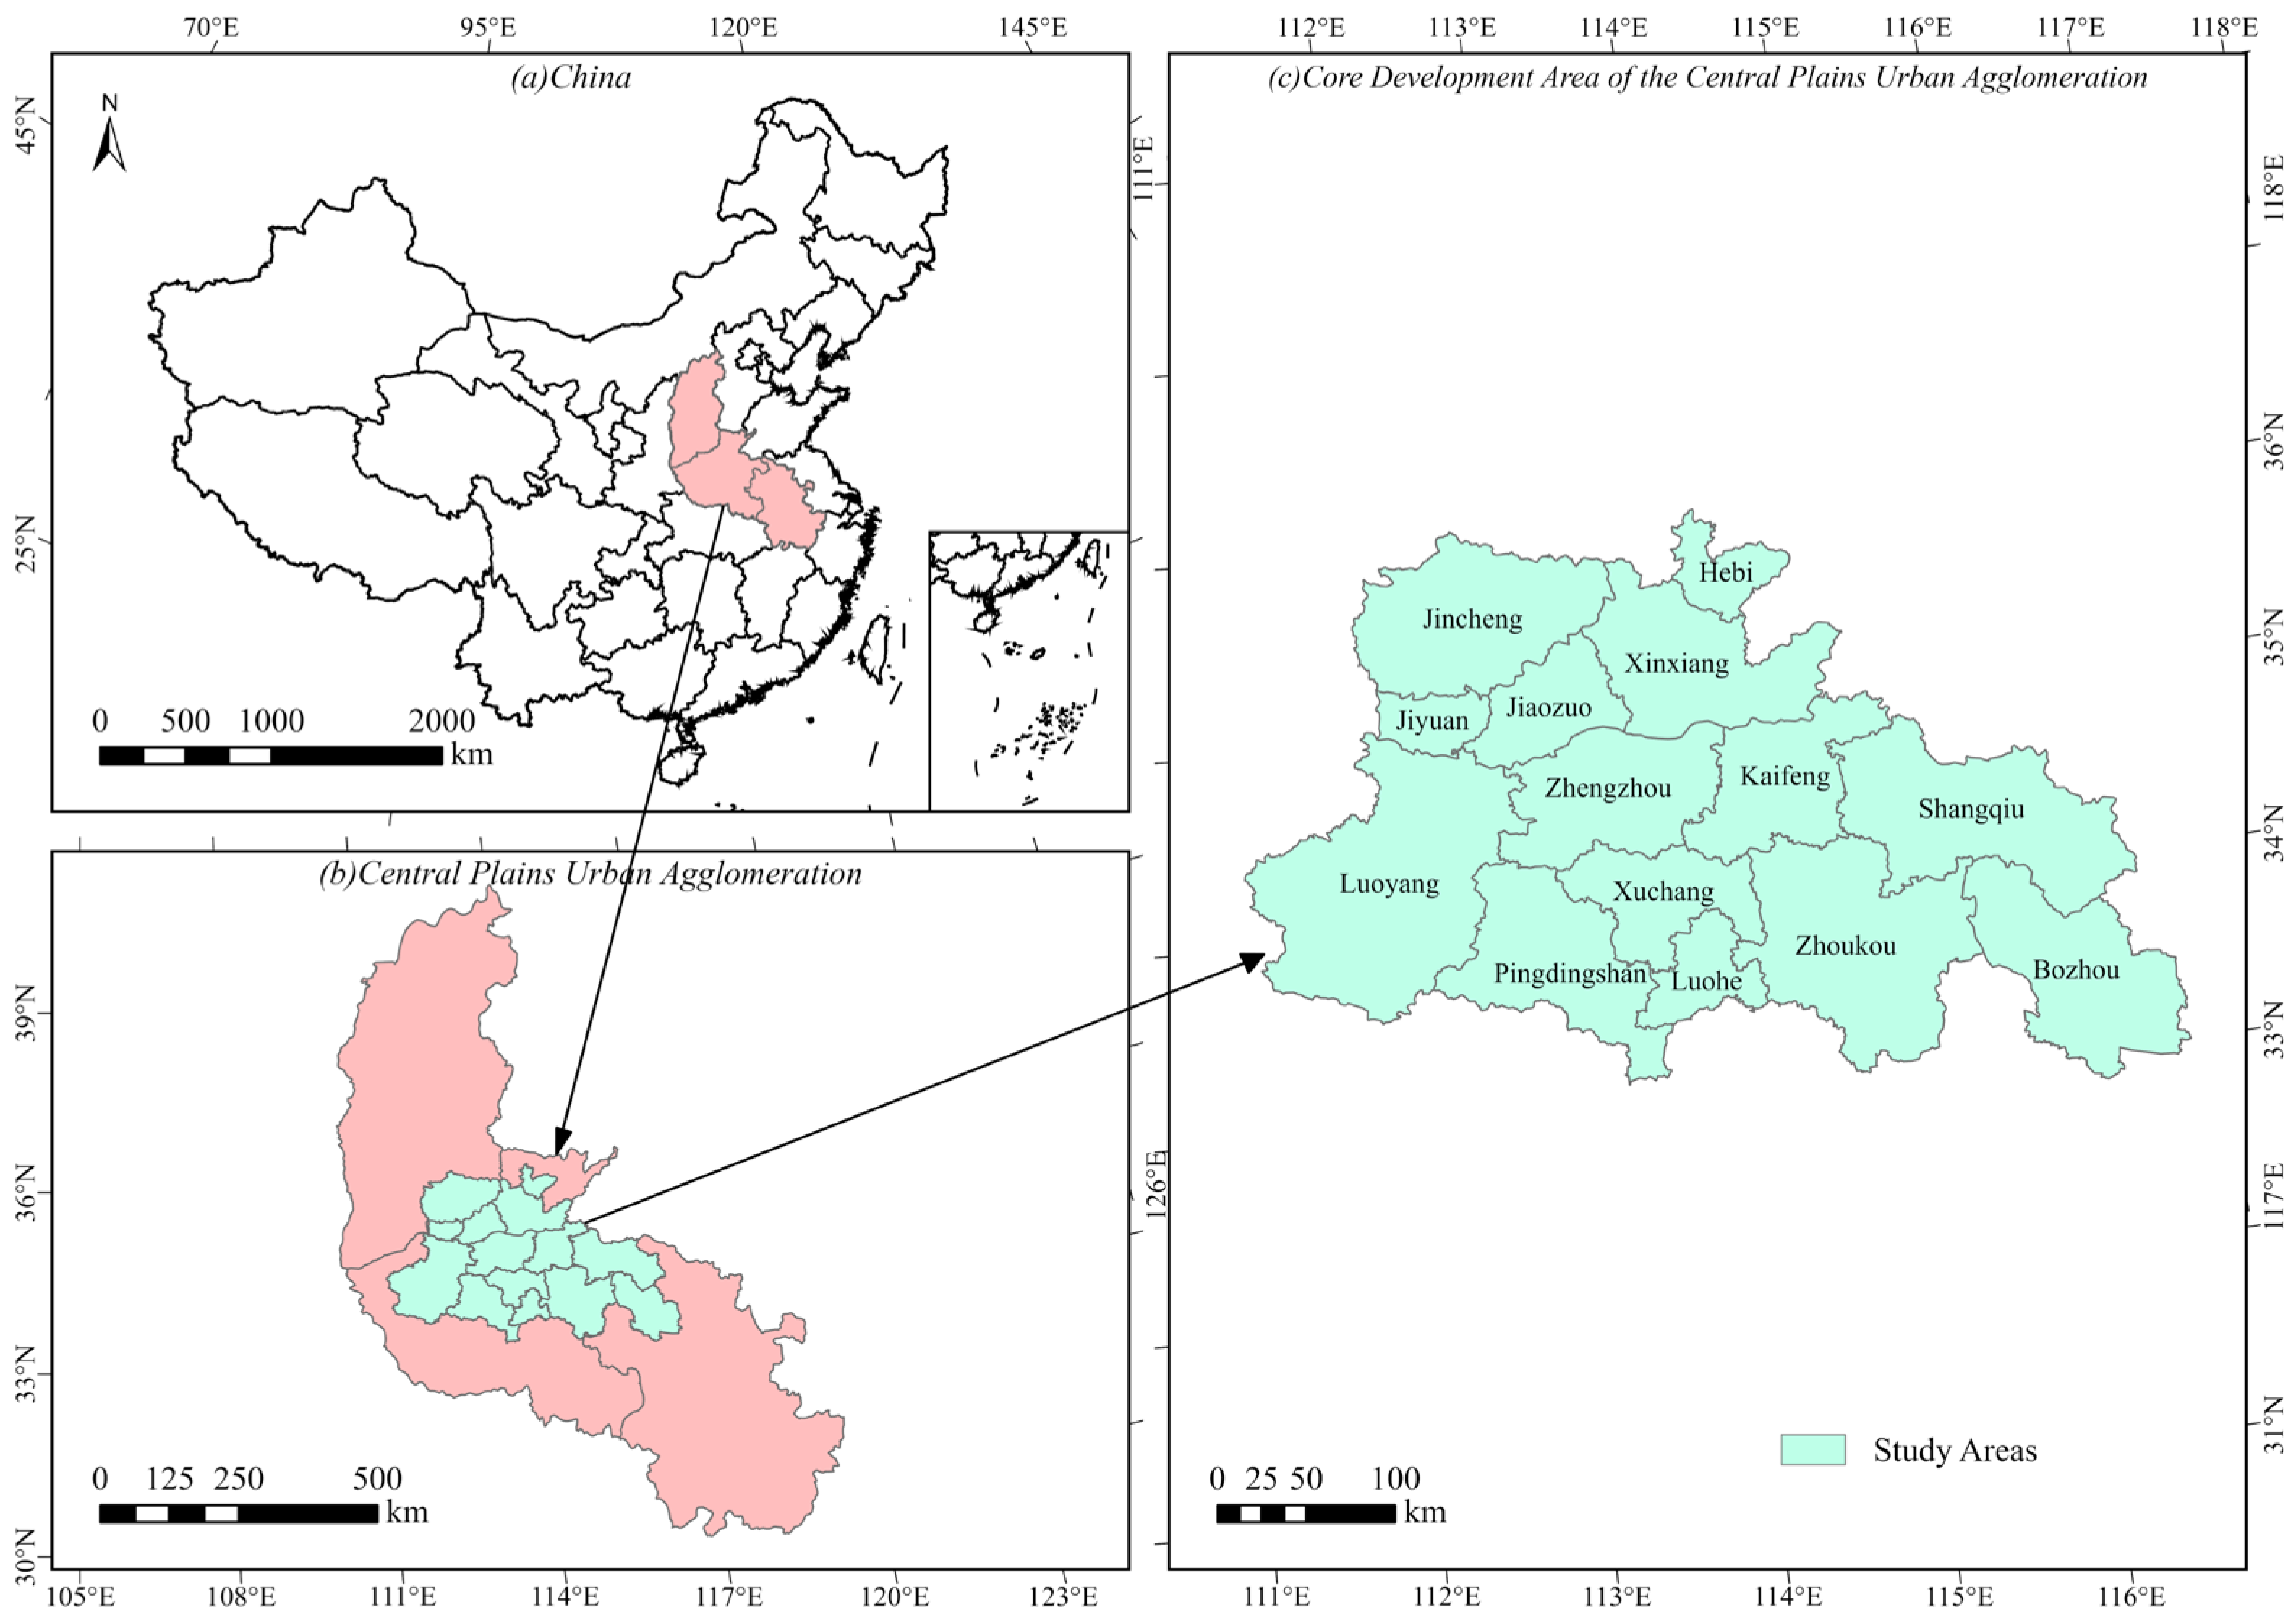
The core development area of the Central Plains Urban Agglomeration in China (including Zhengzhou, Kaifeng, Luoyang, Pingdingshan, Hebi, Xinxiang, Jiaozuo, Xuchang, Luohe, Shangqiu, Zhoukou, Jiyuan, Jincheng, and Bozhou) was selected as the study area. The geographical location of the study area is shown in Figure 1. The region is located in the north-central part of China, and its terrain generally exhibits a spatial pattern of higher elevations in the west and north and relatively low and flat terrain in the central and eastern parts. Affected by the East Asian monsoon, the region is dominated by a warm temperate monsoon climate, characterized by four distinct seasons, concurrent rainfall and high temperatures, and uneven intra-annual distribution of precipitation [24]. As of 2024, the multi-year average annual precipitation in the core area of the Central Plains Urban Agglomeration was 697.04 mm, with rainfall mainly concentrated in summer and autumn. In recent years, under the combined influence of concentrated precipitation during the flood season, differences in topographic relief, and rapid urbanization, the core development area of the Central Plains Urban Agglomeration has experienced diverse types of flood disasters with obvious spatial differences. On 20 July 2021, extreme rainfall caused severe flooding in 11 cities of the Central Plains Urban Agglomeration, resulting in 398 deaths and direct economic losses of USD 20.69 billion [25]. Therefore, it is necessary to investigate the coordination relationship between changes in urban flood pressure and adaptive capacity under the background of increasingly frequent extreme climate events, reveal possible adaptive shortcomings and structural differences in pressure–adaptation combinations among cities, and provide a scientific basis for implementing differentiated flood risk governance and improving regional urban flood governance capacity.
Figure 1.
Geographical location of the study area: (a) location of the Central Plains Urban Agglomeration in China; (b) extent of the Central Plains Urban Agglomeration and its core development area; (c) the 14 cities in the core development area.
2.2. Research Data
The data used in this study include hydrometeorological, socioeconomic, and infrastructure data for each city in the core development area of the Central Plains Urban Agglomeration from 2016 to 2023. Annual precipitation data were obtained from the Henan Provincial Water Resources Bulletin, Jincheng Water Resources Bulletin, and Anhui Provincial Water Resources Bulletin [26,27,28]. Data for the remaining non-meteorological indicators were collected from the Henan Statistical Yearbook, Shanxi Statistical Yearbook, and Anhui Statistical Yearbook [29,30,31]. Daily precipitation data for 2016–2023 were obtained from the China Surface Climate Daily Dataset (V3.0), provided by the National Meteorological Science Data Center (https://data.cma.cn/, accessed on 6 December 2025). For each of the 14 cities, the annual maximum daily precipitation was determined by extracting the maximum daily precipitation value within each calendar year from the corresponding meteorological station records. A total of 14 meteorological stations were used in this study, with one station corresponding to each city. Detailed information on these stations, including their geographical coordinates and elevations, is provided in Appendix A (Table A1). The dataset has undergone rigorous quality control to ensure the reliability and consistency of meteorological observations, providing a reliable basis for characterizing extreme precipitation conditions.
3. Methods
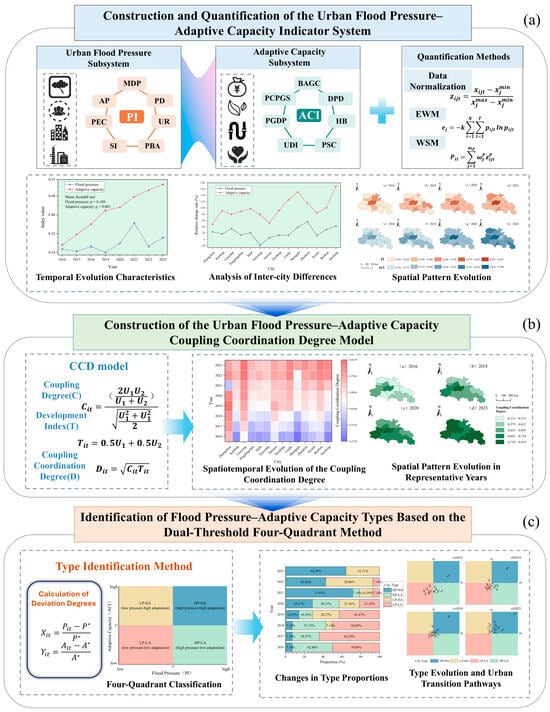
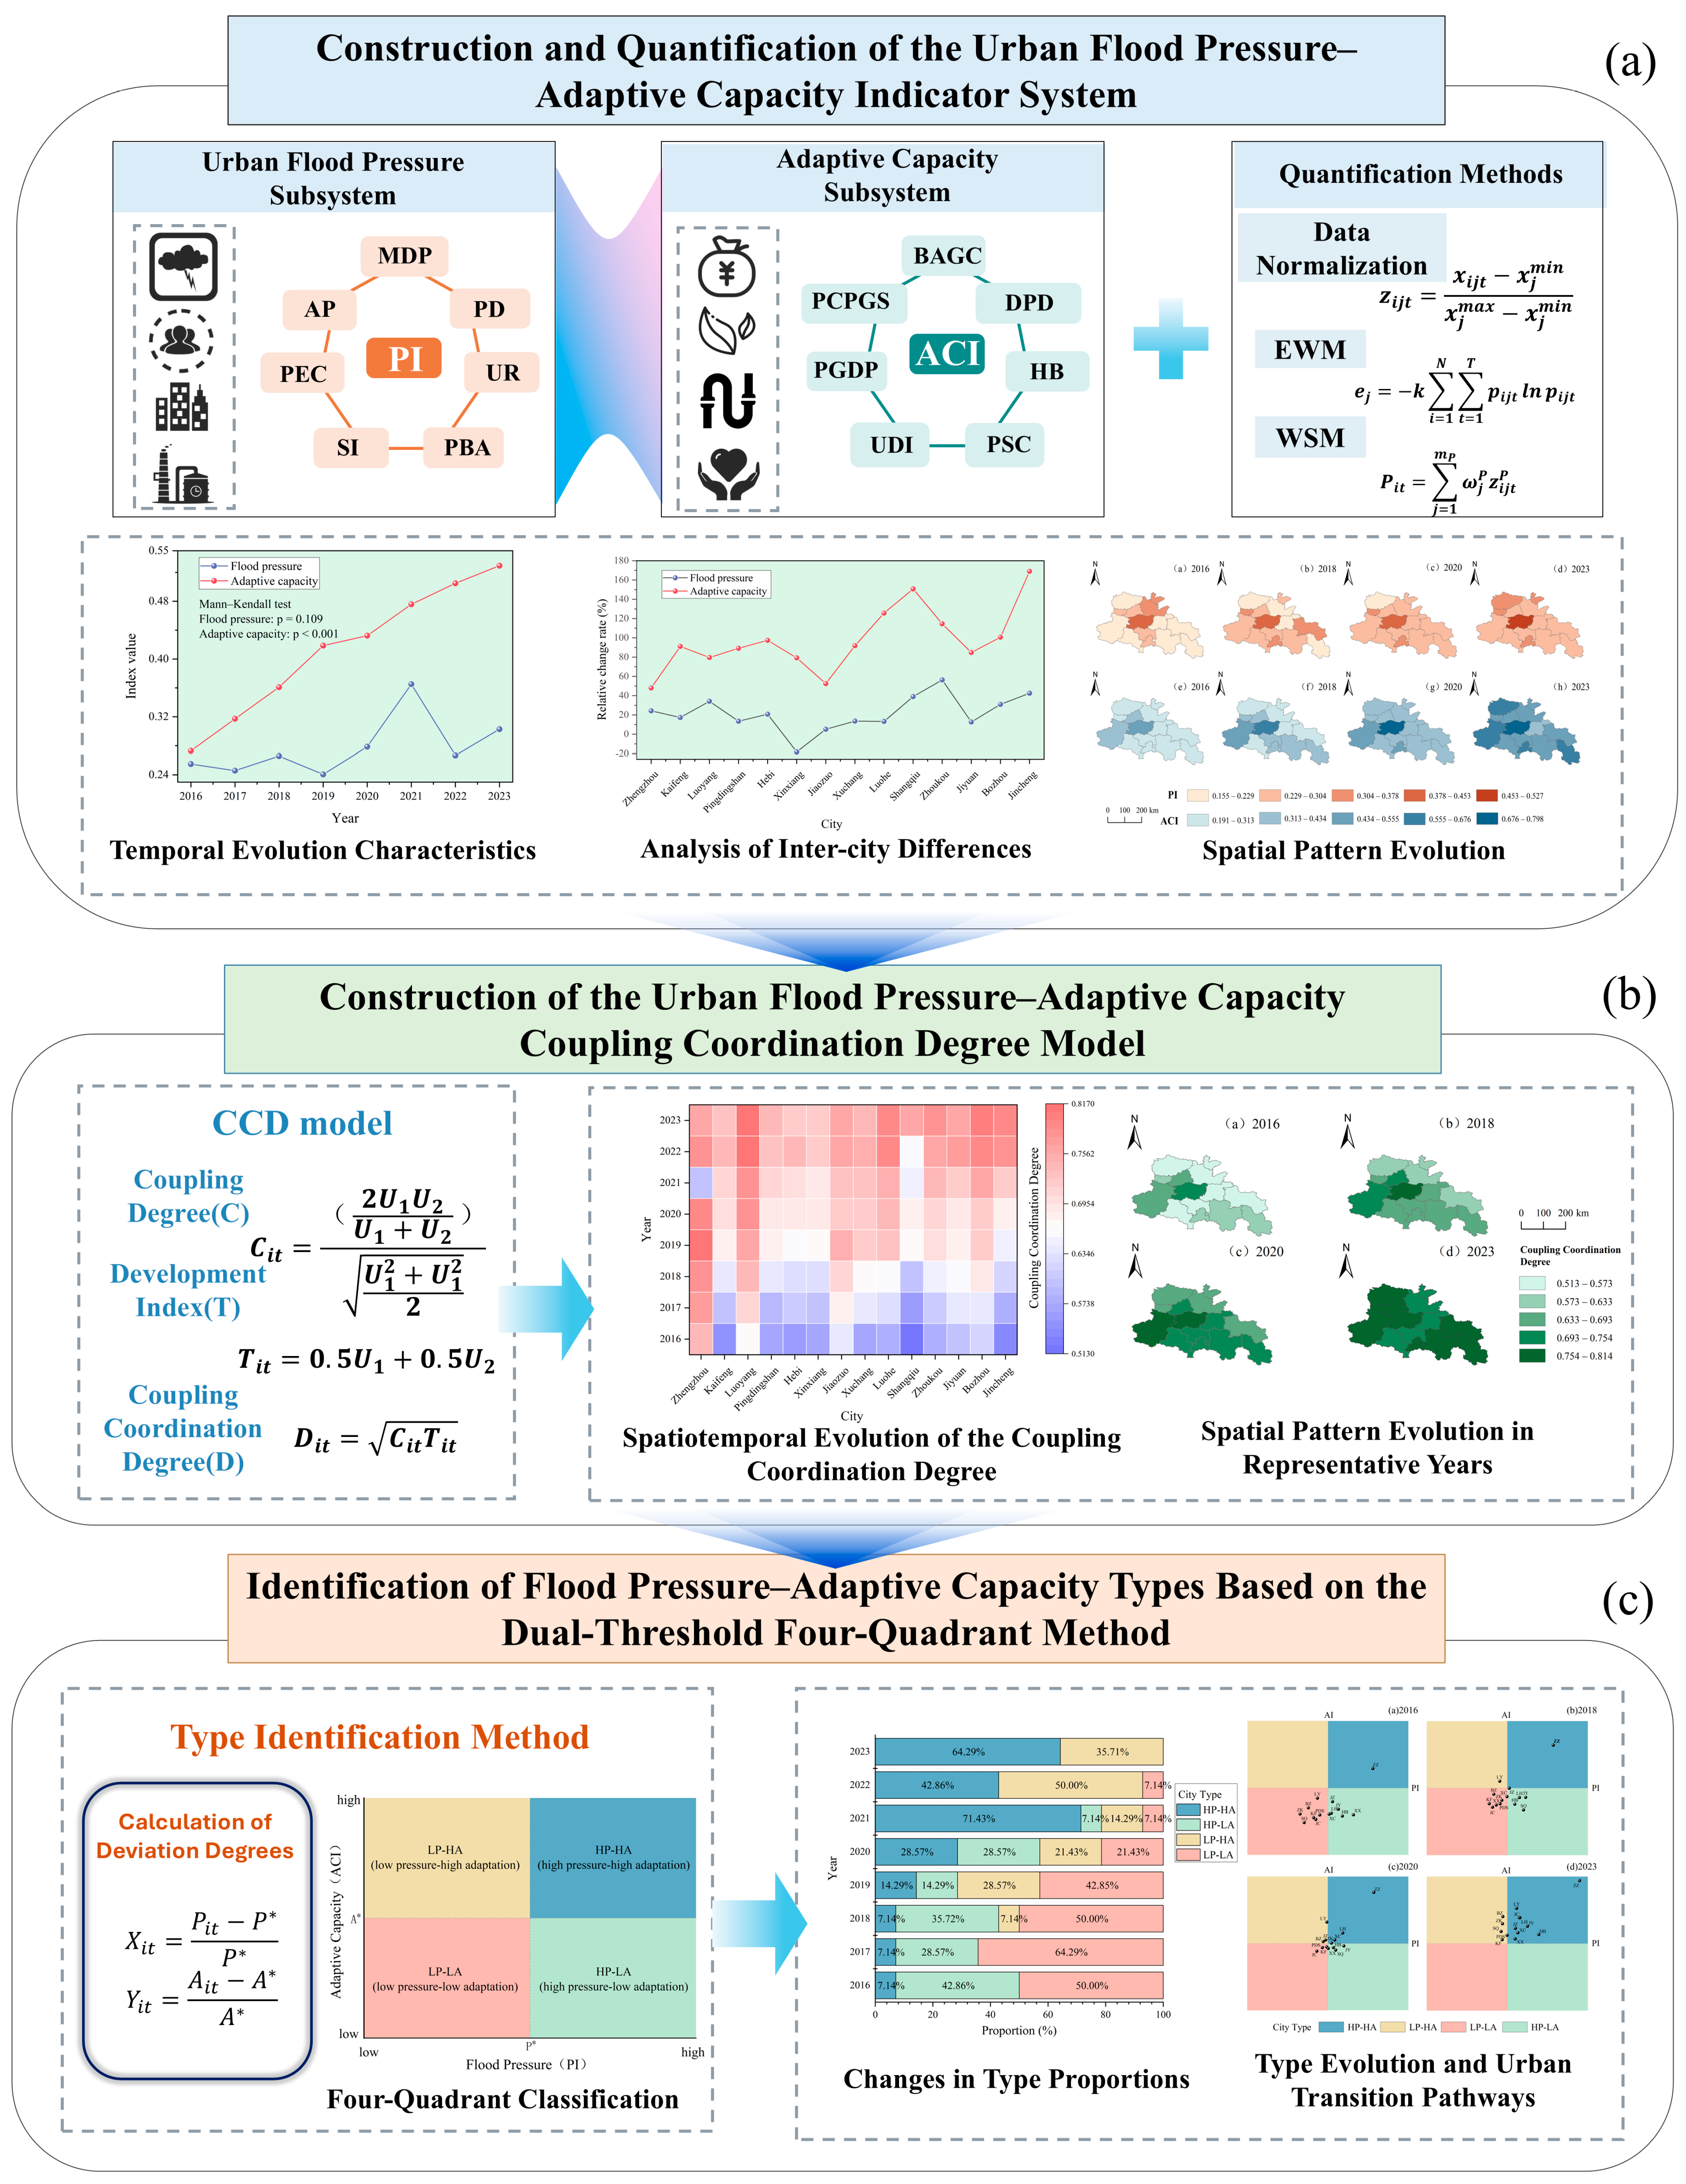
The formation of urban flood risk is not driven by a single factor, but rather reflects the combined effects of external flood pressure and the internal adaptive capacity of urban systems [32,33,34]. On the one hand, the flood pressure faced by cities is influenced by multiple factors such as hydrological and meteorological conditions, population and industrial agglomeration, urbanization development, and changes in the built environment [35]. On the other hand, economic conditions, ecological regulation, engineering infrastructure, and social security systems shape a city’s capacity to cope with and recover from flood impacts [36]. Building on this framework, this study first develops quantitative models for urban flood pressure and adaptive capacity, and subsequently introduces coupling coordination theory to construct a coupling coordination degree model for the urban flood pressure–adaptive capacity system. The model is used to examine the coupling and coordination relationship between the two subsystems and their spatiotemporal evolution. To assess the statistical significance of temporal trends, the two-sided exact Mann–Kendall test was applied to the annual regional mean indices of flood pressure, adaptive capacity, and coupling coordination degree from 2016 to 2023 (n = 8), with a significance level of 0.05. Furthermore, a four-quadrant model is employed to identify the combined states of flood pressure and adaptive capacity across cities and to characterize their evolutionary trajectories. The overall research framework is illustrated in Figure 2.
Figure 2.
The overall research framework: (a) construction and quantification of urban flood pressure and adaptive capacity; (b) coupling coordination analysis; (c) identification of flood pressure–adaptive capacity combination types.
3.1. Construction of the Flood Pressure–Adaptive Capacity Indicator System
3.1.1. Construction of the Flood Pressure Indicator System
Flood pressure refers to the comprehensive pressure exerted on a city over a given period through the combined effects of hazardous meteorological conditions, human activities, and the exposure of elements at risk [37,38]. Drawing on previous pressure-oriented urban flood assessment studies [39,40], this study considered hydroclimatic conditions, population and economic exposure, social sensitivity, and urban development as key dimensions of urban flood pressure. Accordingly, annual precipitation, maximum daily precipitation, population density, urbanization rate, proportion of elderly and children, share of the secondary industry, and proportion of built-up area were selected to construct the regional flood pressure indicator system (Table 1). Annual precipitation and maximum daily precipitation were used to characterize the hydroclimatic pressure faced by cities. The former reflects the overall regional precipitation regime and the sustained pressure imposed on urban drainage systems, whereas the latter captures the short-term impacts of extreme rainfall events on urban drainage infrastructure and stormwater retention systems. Population density and urbanization rate were used to reflect the intensity of urbanization and the degree of population exposure. High population concentrations not only increase the number of people and the scale of socioeconomic activities potentially affected by flooding, but rapid urbanization is also typically accompanied by the expansion of built-up areas and changes in urban surface characteristics, thereby further intensifying stormwater and flood pressure. The share of the secondary industry was used to characterize the potential economic exposure associated with the concentration of industrial activities and fixed assets, while the proportion of elderly people and children reflects the social sensitivity of the population structure to flood impacts. The proportion of built-up area was used to characterize the pressure exerted by urban expansion on the built environment. As impervious surfaces such as roads and buildings continue to expand, the infiltration, storage, and regulation functions of natural surfaces are progressively weakened, thereby increasing surface runoff and placing greater pressure on urban drainage systems.
Table 1.
Urban Flood Pressure Indicator System.
3.1.2. Construction of the Adaptive Capacity Indicator System
Urban flood adaptive capacity refers to a city’s comprehensive ability to absorb, buffer, respond to, and recover from flood impacts by drawing on its economic foundation, ecological spaces, engineering infrastructure, and social security resources before, during, and after flood disturbances [41,42]. Drawing on previous assessments of urban flood adaptive capacity [12,43] and related urban flood resilience studies [44], the indicator system was developed to consider two complementary aspects: the physical capacity for flood regulation and drainage, and the socioeconomic and public-service resources supporting flood response and recovery. Accordingly, seven indicators—green coverage rate of built-up areas, per capita park green space, drainage pipe density, per capita GDP, number of hospital beds per 10,000 people, per capita disposable income of urban residents, and per capita expenditure on social security and employment—were selected to construct the urban flood adaptive capacity indicator system (Table 2). Per capita GDP and per capita disposable income of urban residents were used to characterize economic support and post-disaster recovery capacity at both the city and household levels. Higher levels of economic development can facilitate greater investment in flood-control and drainage infrastructure, improve the allocation of emergency resources, and enhance post-disaster reconstruction capacity. The green coverage rate of built-up areas and per capita park green space were used to reflect urban ecological regulation and stormwater buffering capacity. Higher levels of urban green space can mitigate surface runoff generation and slow runoff concentration by enhancing rainfall interception, infiltration, and temporary storage. Drainage pipe density was used to characterize urban drainage capacity and the carrying capacity of engineering infrastructure, serving as an important indicator of the ability to collect, convey, and discharge stormwater under heavy rainfall conditions. The number of hospital beds per 10,000 people reflects the capacity for medical assistance and public health support following flood disasters, while per capita expenditure on social security and employment was used to characterize the strength of the urban social security system and the capacity for public resource allocation, both of which contribute to protecting vulnerable groups and enhancing post-disaster social recovery. Together, these indicators characterize the resource and infrastructure foundations of urban flood preparedness, providing a basis for comparing cities’ preparedness-related adaptive capacity and its temporal evolution.
Table 2.
Urban Flood Adaptive Capacity Indicator System.
3.2. Quantification of Flood Pressure and Adaptive Capacity
3.2.1. Indicator Standardization
To eliminate differences in measurement units and magnitudes among indicators, min–max normalization was applied to the indicator data of each city from 2016 to 2023 [45,46]. To ensure the comparability of evaluation results across cities and years, the maximum and minimum values of each indicator were determined from the entire dataset of 14 cities over the period 2016–2023, comprising 112 city–year observations, rather than separately for each year. Accordingly, all observations were normalized to the range of 0–1 using a consistent reference scale throughout the study period. Since all indicators of flood pressure and adaptive capacity are positively oriented—that is, higher indicator values represent greater flood pressure or stronger adaptive capacity—positive min–max normalization was applied to each indicator. The calculation is expressed as Equation (1):
where denotes the original value of indicator j for city i in year t; and represent the maximum and minimum values, respectively, of indicator j across all study samples; and denotes the normalized indicator value.
3.2.2. Calculation of Indicator Weights
To reduce the influence of subjective weighting on the evaluation results [47,48], the entropy weight method (EWM) was employed to determine the weights of indicators within the flood pressure and adaptive capacity subsystems separately. Specifically, the entropy weights were calculated using all 112 city–year observations from the 14 cities during 2016–2023, rather than separately for each year. The resulting weights were kept constant throughout the study period to ensure a consistent weighting basis for interannual comparisons. First, the proportion of each observation of indicator for each city and year during the study period was calculated using Equation (2). Subsequently, the information entropy, information utility value, and corresponding weight of each indicator were calculated using Equations (3), (4), and (5), respectively.
The information entropy, information utility value, and corresponding weight of each indicator were further calculated as follows:
where denotes the number of cities, represents the number of study years, and is the number of indicators in the corresponding subsystem. When , . The indicator weights of the flood pressure and adaptive capacity subsystems were normalized separately so that the sum of the indicator weights within each subsystem equals 1.
3.2.3. Calculation of Flood Pressure and Adaptive Capacity Indices
Based on the results of indicator standardization and weight calculation, the weighted summation method (WSM) was employed to calculate the flood pressure index and adaptive capacity index for each city and year. The flood pressure index represents the comprehensive pressure resulting from the combined effects of hydroclimatic conditions, population exposure, social sensitivity, and the built environment, while the adaptive capacity index reflects the overall capacity of a city to cope with and recover from flood impacts by mobilizing economic, ecological, engineering infrastructure, and social security resources. The specific calculation formulas are given in Equations (6) and (7):
where and denote the flood pressure index and adaptive capacity index, respectively, for city in year ; and represent the corresponding indicator weights within the flood pressure and adaptive capacity subsystems, respectively. A higher indicates greater overall flood pressure, whereas a higher indicates stronger comprehensive capacity to cope with and recover from flood impacts.
3.3. Construction of the Coupling Coordination Degree Model for Urban Flood Pressure and Adaptive Capacity
The coupling coordination degree model can be used to characterize the interactions and coordinated development among different subsystems. Specifically, the coupling degree reflects the strength of interconnections and interactions between subsystems, whereas the coordination degree represents the extent to which the subsystems develop synergistically. In recent years, this model has been widely applied to investigate the coordination relationships and spatiotemporal evolution of urban resilience and flood-related coupled systems [49,50,51]. To systematically characterize the interactions between urban flood pressure and adaptive capacity and their coordinated development, a coupling coordination degree model was constructed based on the quantified results of the two subsystems to assess their coupling coordination level and dynamic evolution characteristics. This approach allows the combined coordination status of the two subsystems to be evaluated, particularly when flood pressure and adaptive capacity exhibit different patterns of change. Because flood pressure and adaptive capacity operate in opposite directions—that is, higher flood pressure indicates a more unfavorable urban flood condition, whereas higher adaptive capacity indicates a stronger ability to cope with flood impacts—the flood pressure index was directionally transformed to prevent higher flood pressure from making a positive contribution to the coupling coordination degree (Equation (8)):
where denotes the flood pressure index of city in year , and represents the pressure state index obtained after directional transformation, with a larger value indicating relatively lower urban flood pressure. The flood pressure index is a normalized, dimensionless composite index rather than a probability.
Let and denote the flood pressure state and adaptive capacity level, respectively. Previous studies on urbanization–flood disaster coordination have noted that conventional coupling coefficients may exhibit limited discriminatory ability due to their tendency to concentrate at relatively high values [21,52]. To enhance sensitivity to relative differences between the two subsystem indices, a coupling coefficient ranging from 0 to 1 was adopted following An et al. [53] as the ratio of their harmonic mean to their root-mean-square, as shown in Equation (9). A larger coupling coefficient indicates a more balanced level of development between the two subsystems.
Because the coupling coefficient alone cannot fully reflect the overall development level of the two subsystems, a comprehensive development index and coupling coordination degree were further constructed. Considering that flood pressure mitigation and adaptive capacity enhancement are equally important for urban flood safety, both were assigned a weight of 0.5. The comprehensive development index and coupling coordination degree were then calculated using Equations (10) and (11), respectively. A larger value indicates a higher degree of coordination between the urban flood pressure state and adaptive capacity, whereas a smaller value reflects a more pronounced imbalance between the two subsystems.
where denotes the comprehensive development index, and represents the coupling coordination degree between urban flood pressure and adaptive capacity for city in year , with values ranging from 0 to 1. The coupling coordination degree reflects the combined development level and balance between the flood pressure state and adaptive capacity, rather than directly measuring urban flood risk. An increase in the coupling coordination degree indicates an improvement in the overall coordination status but does not necessarily mean that adaptive capacity is sufficient to cope with changing flood pressure. Therefore, changes in the coupling coordination degree should be interpreted together with the original flood pressure and adaptive capacity indices.
To characterize different levels of coupling coordination, the coupling coordination degree was divided into five levels using the equal-interval classification method, with an interval width of 0.2: severe disorder (0 ≤ D < 0.2), mild disorder (0.2 ≤ D < 0.4), primary coordination (0.4 ≤ D < 0.6), good coordination (0.6 ≤ D < 0.8), and high coordination (0.8 ≤ D ≤ 1.0).
3.4. Identification of Flood Pressure–Adaptive Capacity Combination Types Based on the Four-Quadrant Model
The coupling coordination degree reflects the overall level of coordination between flood pressure and adaptive capacity; however, similar coupling coordination degrees may correspond to different pressure–adaptive capacity combinations, making it difficult to further reveal structural differences within urban flood systems. The four-quadrant model enables the combined classification of research objects based on the relative levels of two dimensions and provides an intuitive means of identifying different combination types [54,55]. Therefore, building on the coupling coordination degree assessment, a four-quadrant model was introduced to identify urban flood pressure–adaptive capacity combination types from the two dimensions of flood pressure and adaptive capacity. To ensure comparability across years, the median values of the flood pressure index and adaptive capacity index for all city–year samples from 2016 to 2023 were adopted as unified reference thresholds, denoted as and , respectively. The flood pressure deviation (Equation (12)) and adaptive capacity deviation (Equation (13)) of each city relative to the overall reference level were then calculated as follows:
where and denote the deviations of flood pressure and adaptive capacity, respectively, for city (i) in year (t) relative to the overall reference levels. When , the city’s flood pressure is higher than the overall level; when , its adaptive capacity is higher than the overall level. Based on the sign combinations of the two deviations, cities were classified into four types: high pressure–high adaptation, high pressure–low adaptation, low pressure–high adaptation, and low pressure–low adaptation. Among these, the high pressure–low adaptation type represents cities characterized by relatively high flood pressure but insufficient adaptive capacity, indicating a pronounced mismatch between pressure and capacity. In contrast, the high pressure–high adaptation type indicates that cities are able to cope with relatively high flood pressure through stronger adaptive capacity. By comparing the quadrant membership and transition directions of cities across different periods, the combined structural characteristics and dynamic transition pathways of flood pressure and adaptive capacity in the core development area of the Central Plains Urban Agglomeration were further revealed.
4. Results
4.1. Spatiotemporal Evolution Characteristics of Flood Pressure and Adaptive Capacity
4.1.1. Temporal Evolution of Flood Pressure and Adaptive Capacity
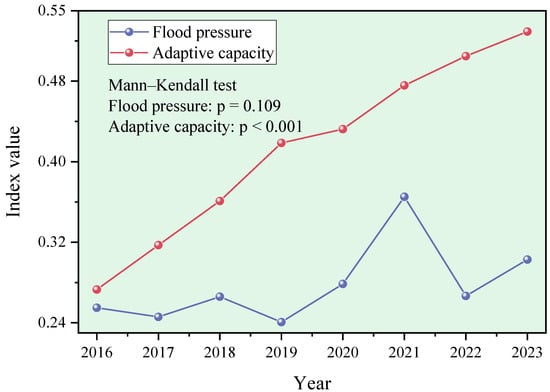
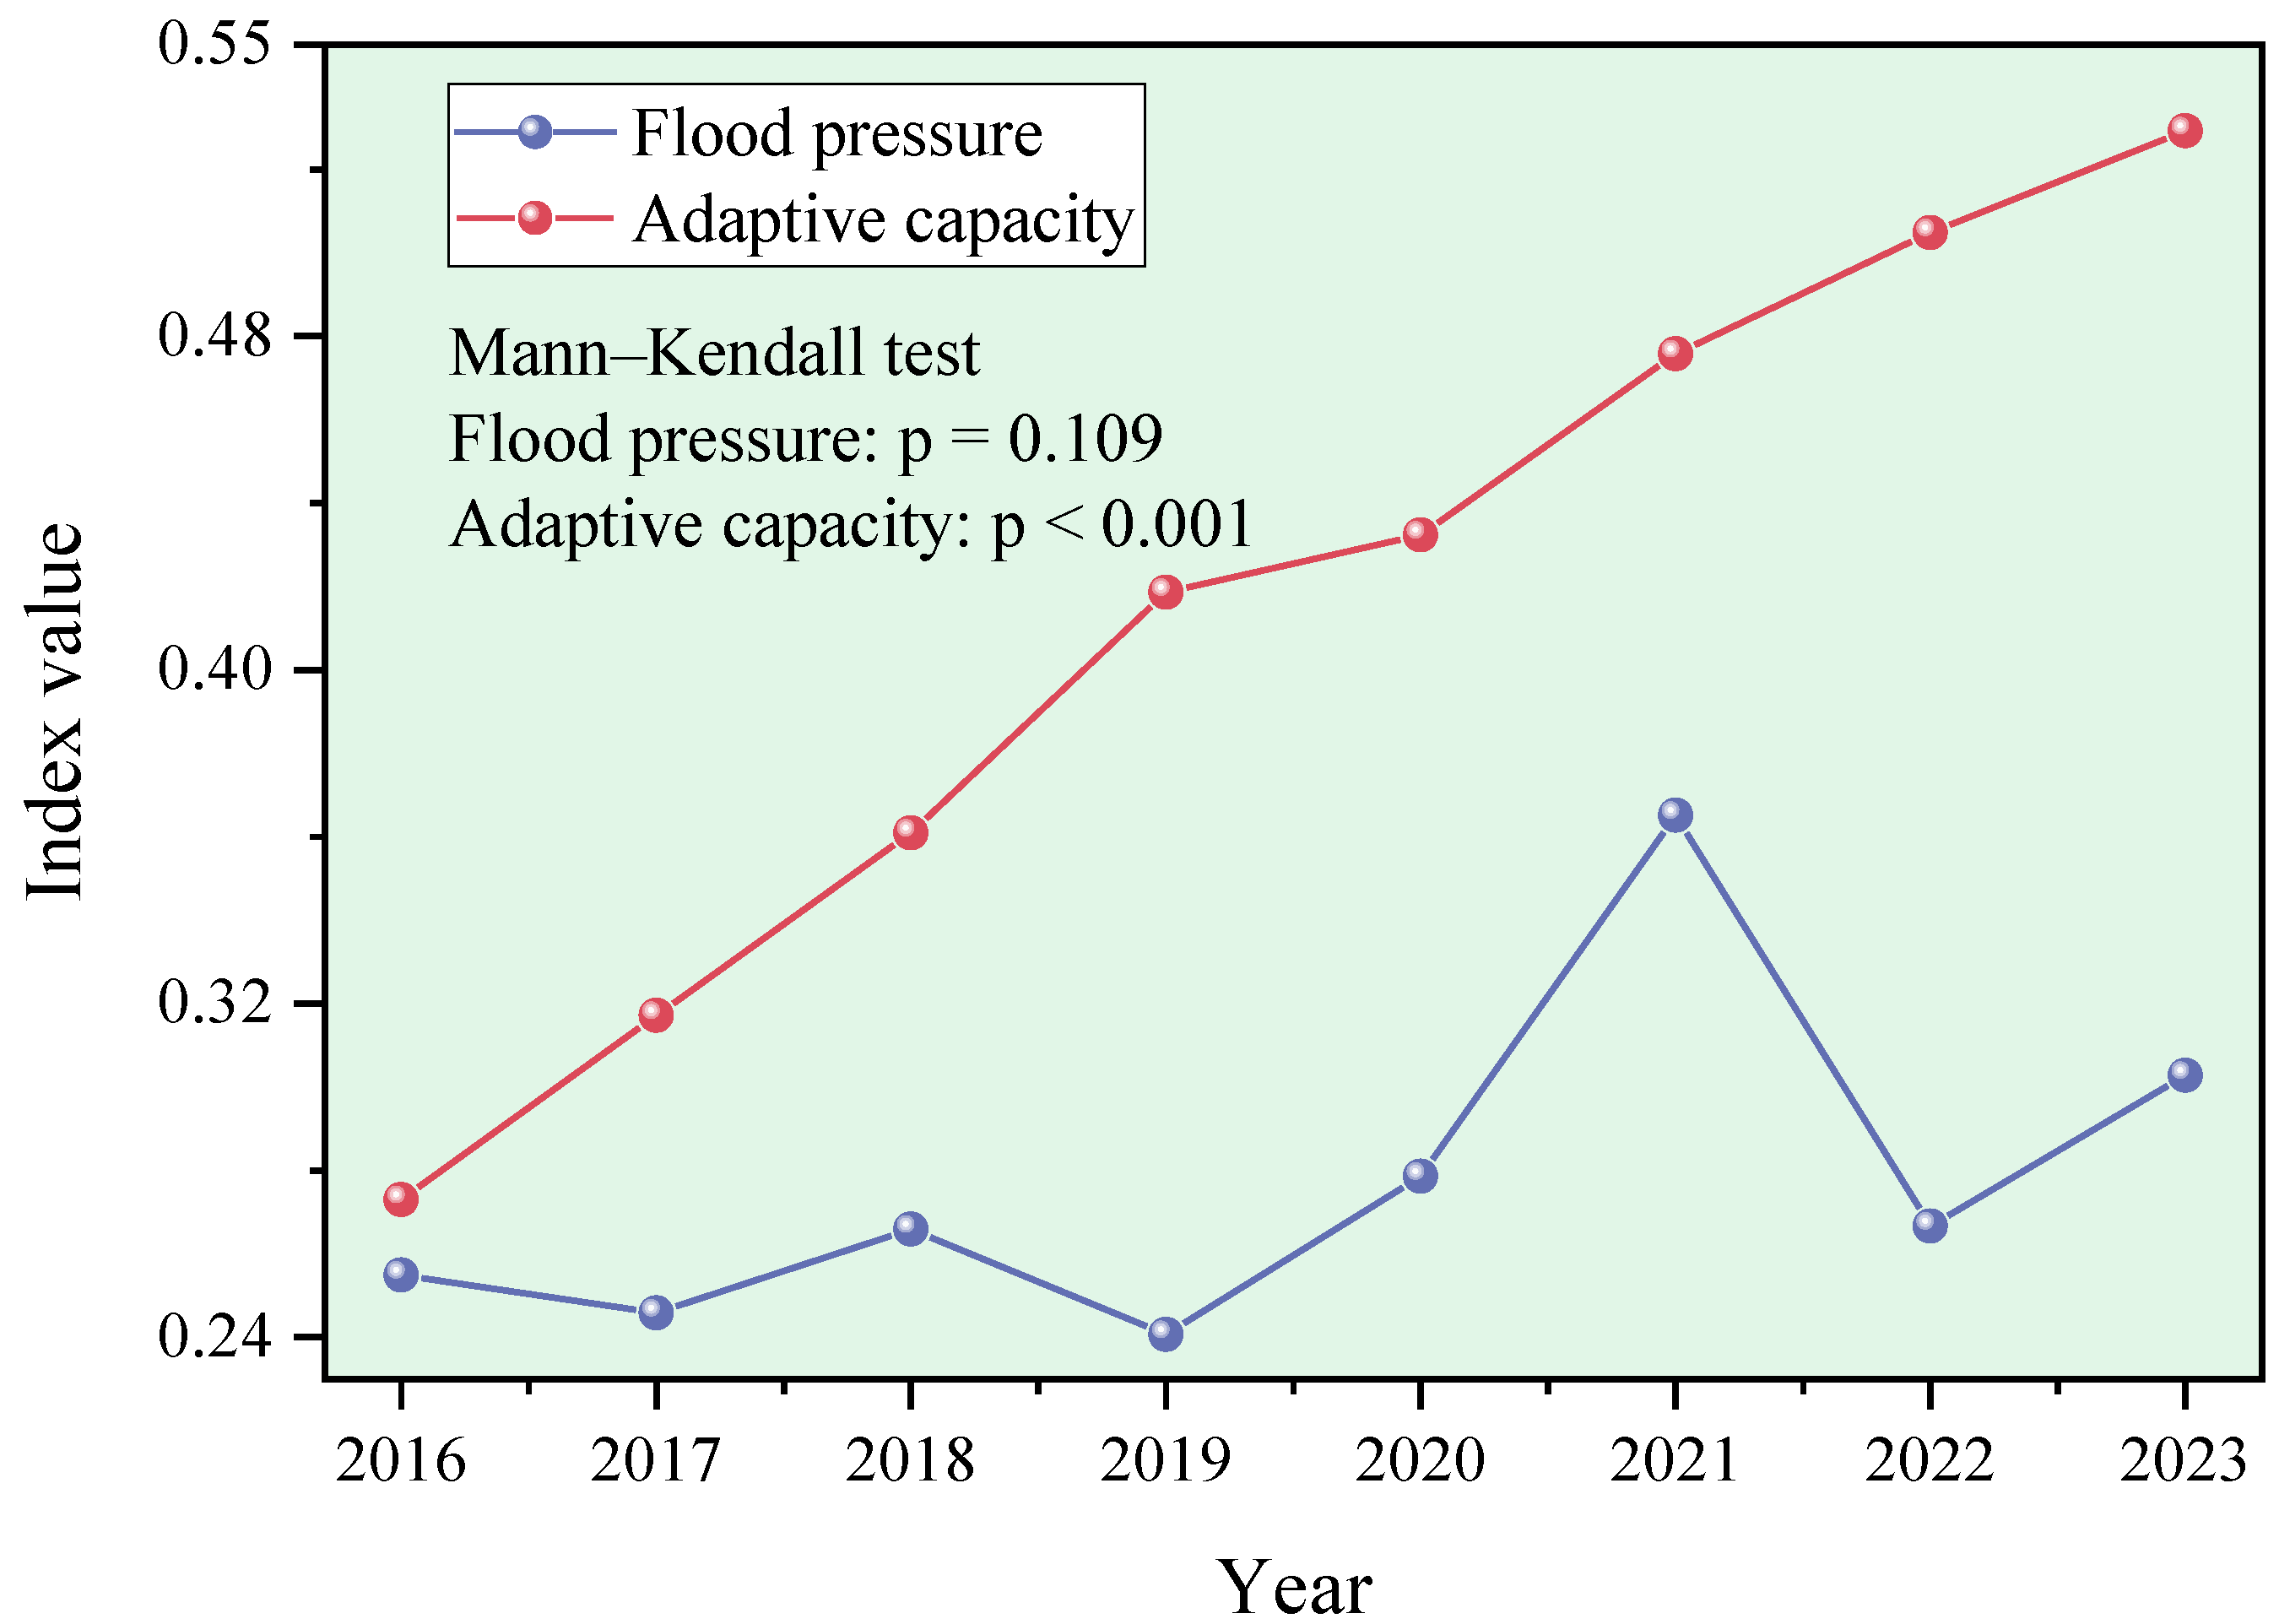
Figure 3 shows the overall variation trends of flood pressure and adaptive capacity in the core development area of the Central Plains Urban Agglomeration. The results indicate that, during the study period, regional flood pressure exhibited an overall fluctuating upward trend, increasing from 0.2549 in 2016 to 0.3028 in 2023. Temporary declines occurred in 2017, 2019, and 2022, but the overall trend remained upward. However, the Mann–Kendall test did not identify a statistically significant monotonic trend in flood pressure (p = 0.109). In contrast, adaptive capacity showed continuous and stable growth, increasing from 0.2730 in 2016 to 0.5293 in 2023, with a cumulative increase significantly higher than that of flood pressure. The upward trend in adaptive capacity was statistically significant (p < 0.001). Overall, flood pressure and adaptive capacity in the core development area of the Central Plains Urban Agglomeration showed obvious nonlinear evolution, characterized by a fluctuating increase in flood pressure and a continuous improvement in adaptive capacity. This indicates that, against the background of persistent and even locally intensified flood pressure, the adaptive capacity of cities in the region has improved markedly.
Figure 3.
Temporal variation characteristics of urban flood pressure and adaptive capacity in the core development area of the Central Plains Urban Agglomeration.
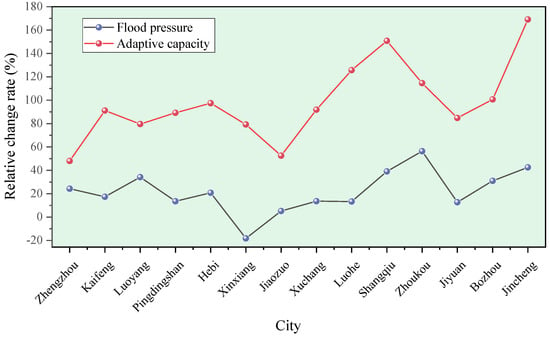
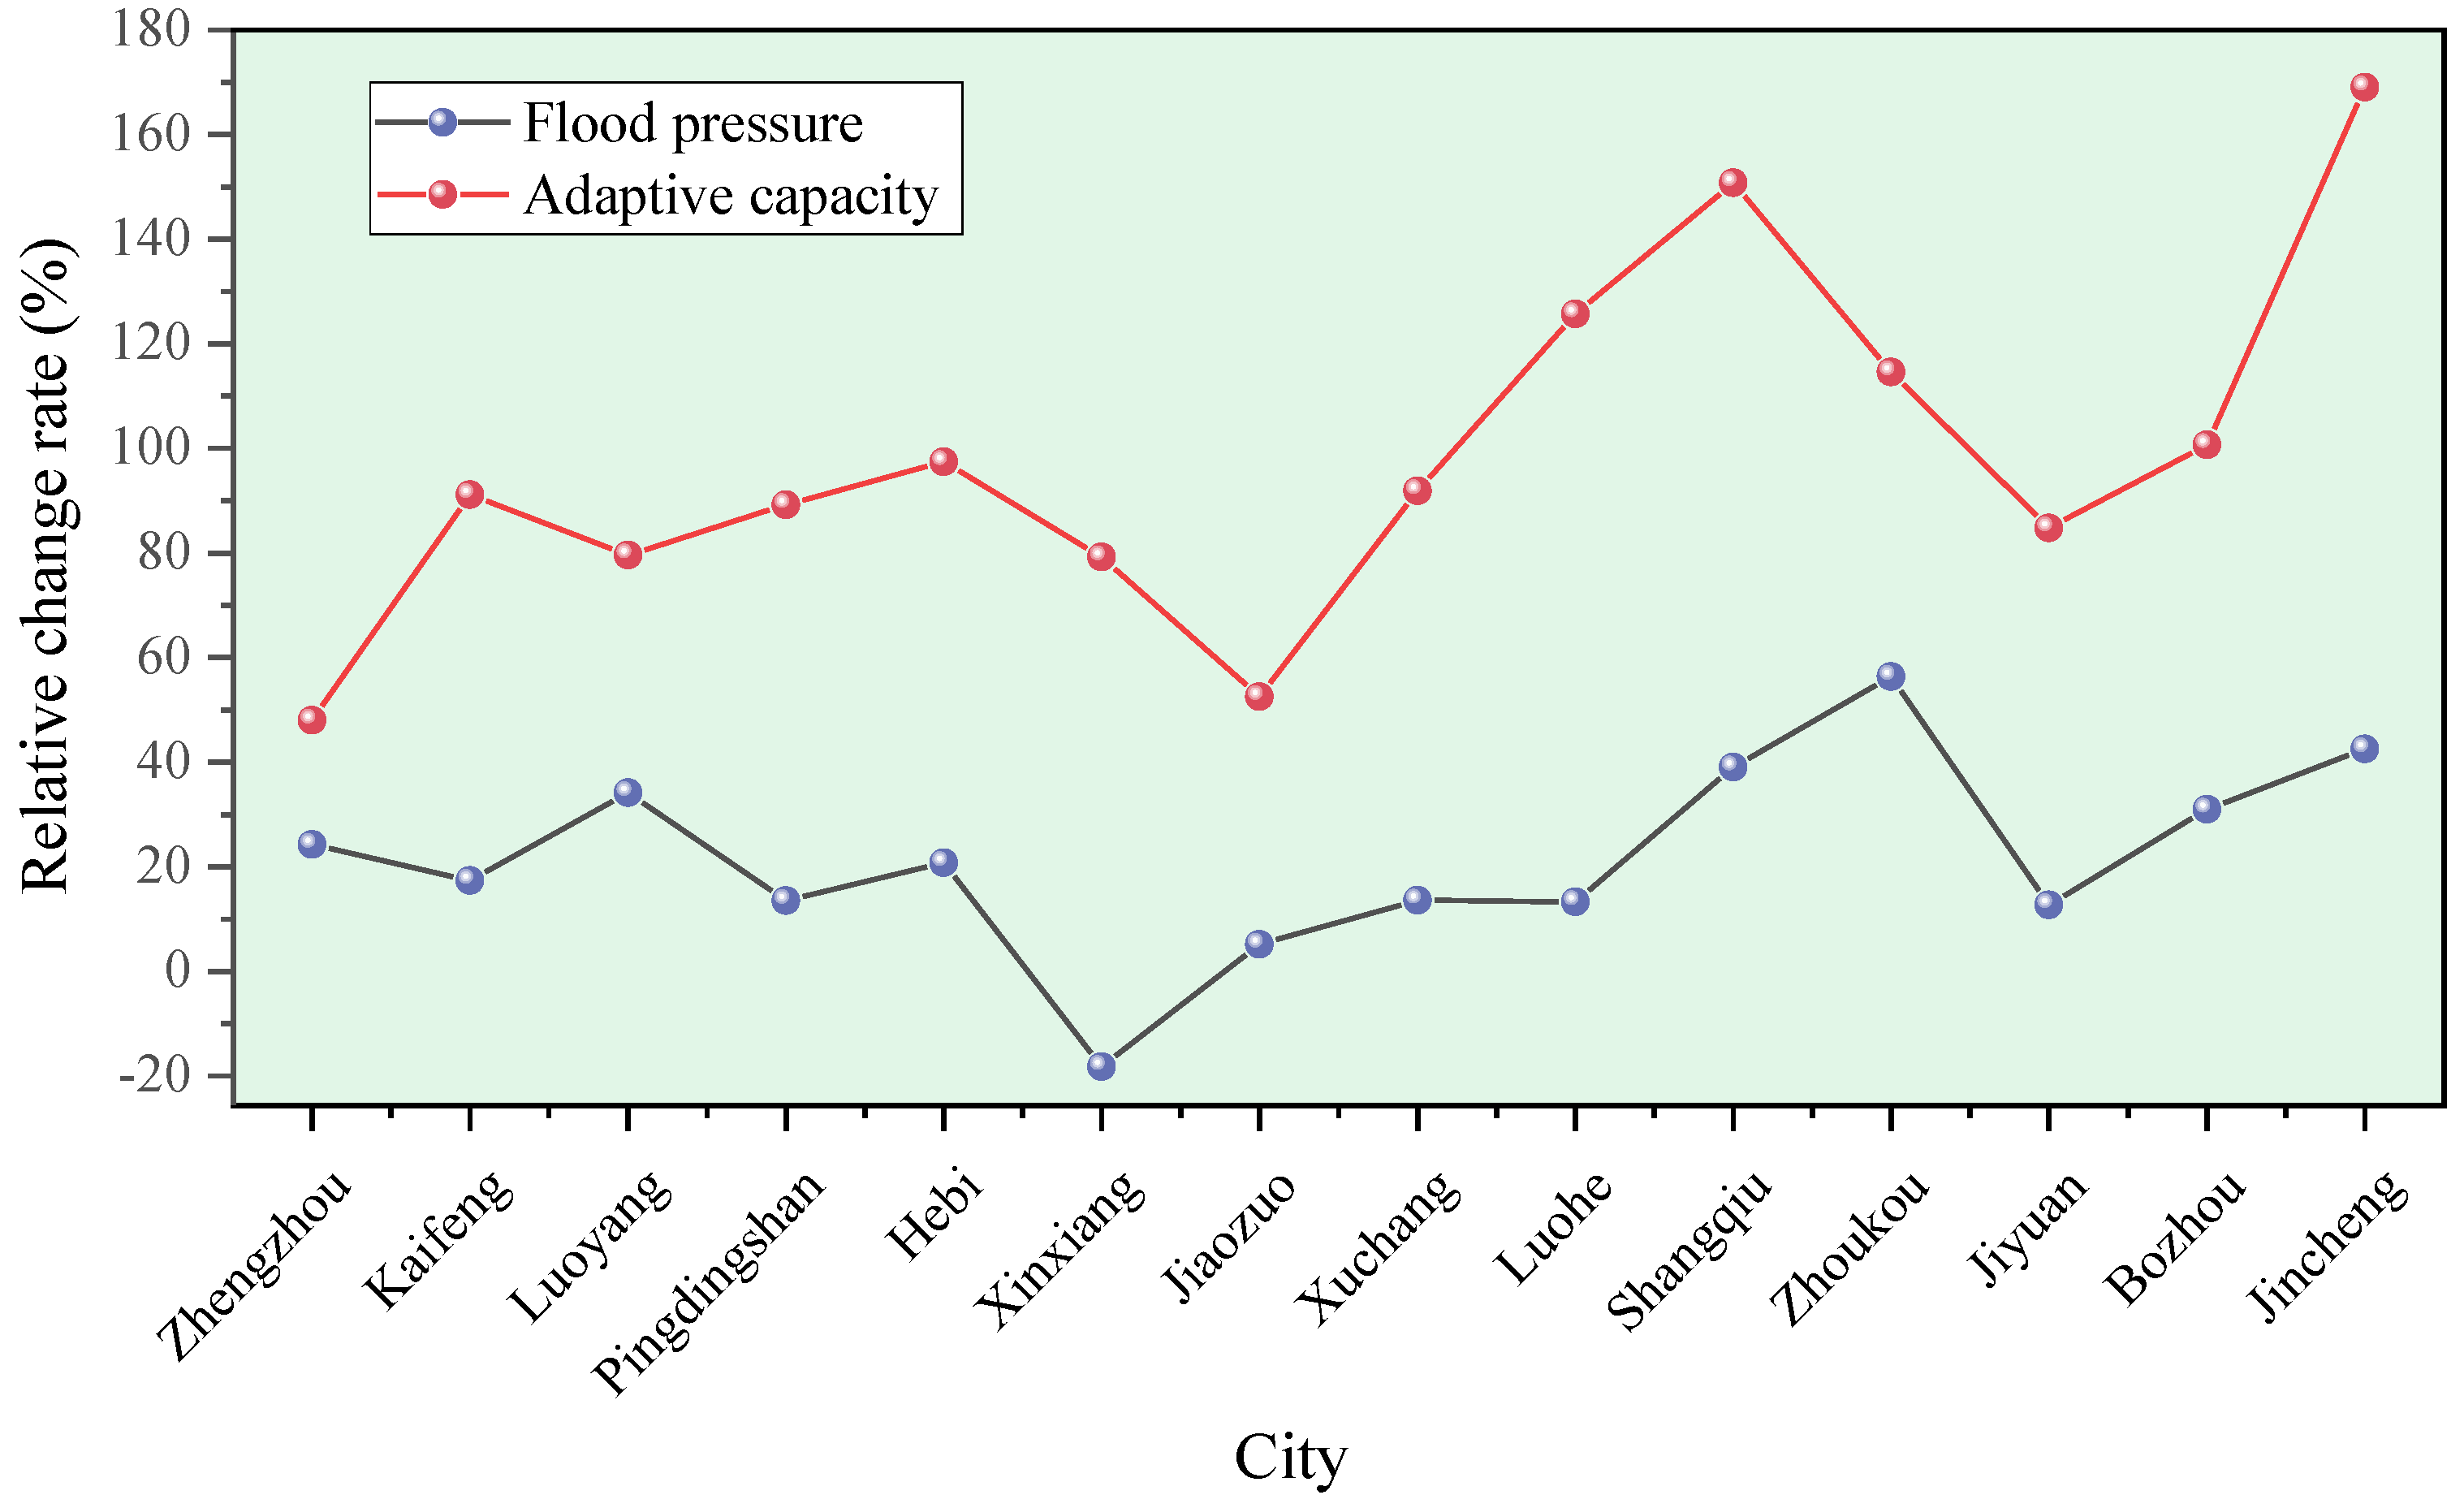
To further compare the differences in changes in flood pressure and adaptive capacity among different cities, 2016 was taken as the base year, and the relative change rates of the flood pressure index and adaptive capacity index of each city in 2023 were calculated (Figure 4). The results show that flood pressure increased to varying degrees in most cities, whereas Xinxiang experienced a decrease of 18.16%, indicating obvious intercity differences in the magnitude and direction of change. Among them, Jincheng, Zhoukou, Luoyang, and Kaifeng showed relatively rapid increases in pressure, whereas Jiaozuo, Xuchang, Luohe, and Hebi showed relatively small increases. In comparison, adaptive capacity increased significantly in all cities, and the magnitude of increase was generally higher than that of flood pressure, particularly in Jincheng, Shangqiu, Luohe, Zhoukou, and Bozhou. It can therefore be seen that, during the study period, while flood pressure increased to some extent in most cities, adaptive capacity generally showed a faster increasing trend. However, obvious differences still existed among cities in terms of pressure growth and capacity improvement.
Figure 4.
Relative changes in urban flood pressure and adaptive capacity in 2023 compared with 2016 in the core development area of the Central Plains Urban Agglomeration.
4.1.2. Spatial Evolution of Flood Pressure and Adaptive Capacity
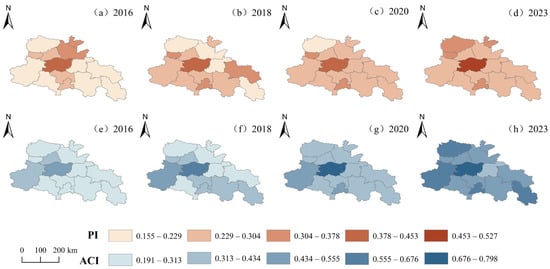
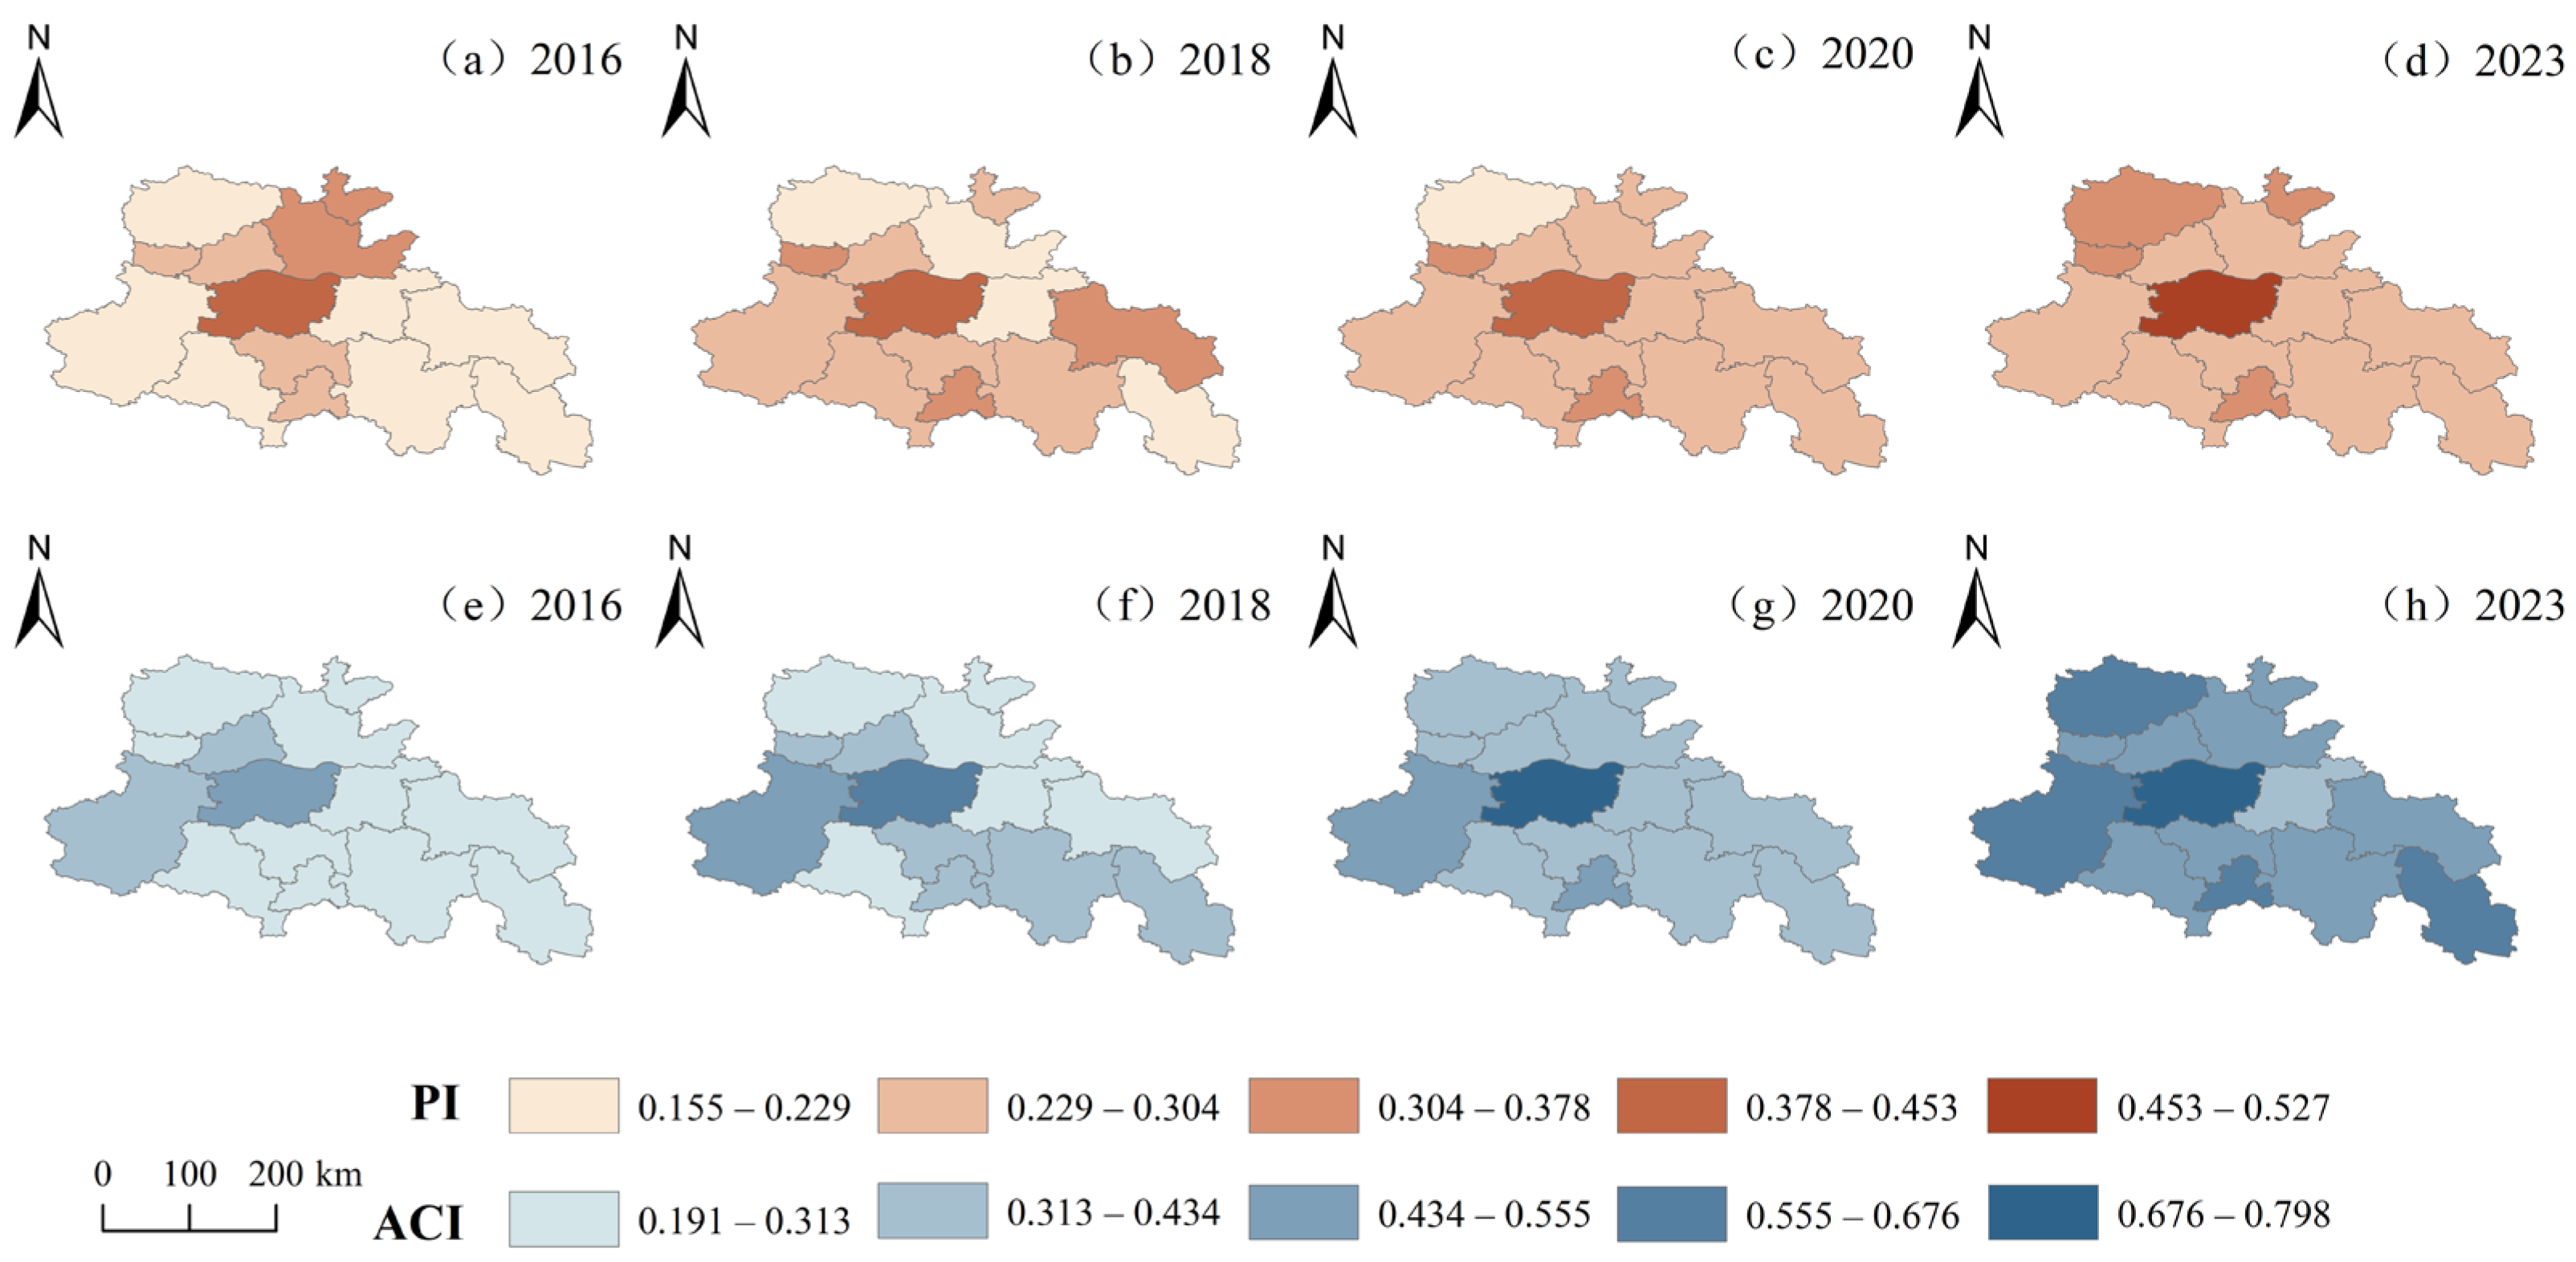
Figure 5 shows the spatial distribution of the flood pressure index and adaptive capacity index in four representative years, namely 2016, 2018, 2020, and 2023, in the core development area of the Central Plains Urban Agglomeration. Overall, both flood pressure and adaptive capacity showed relatively obvious spatial heterogeneity. Areas with high flood pressure were mainly concentrated in Zhengzhou and, in some years, extended to cities such as Jiyuan, Hebi, and Luohe, whereas cities such as Kaifeng, Zhoukou, and Bozhou generally remained at relatively low levels. In terms of adaptive capacity, Zhengzhou consistently remained at the highest level, while cities such as Luoyang, Jincheng, Luohe, and Bozhou gradually formed relatively high adaptive capacity values, showing an overall characteristic of gradual diffusion from core cities to surrounding cities. In general, during the study period, the spatial pattern of flood pressure in the core development area of the Central Plains Urban Agglomeration remained relatively stable, whereas the spatial distribution of adaptive capacity gradually expanded from concentration in a few core cities in the early stage to more cities, indicating that the construction of regional flood adaptive capacity showed a certain trend of diffusion and improvement over time.
Figure 5.
Spatial distributions of urban flood pressure and adaptive capacity in representative years in the core development area of the Central Plains Urban Agglomeration: (a–d) flood pressure index in 2016, 2018, 2020, and 2023, respectively; (e–h) adaptive capacity index in 2016, 2018, 2020, and 2023, respectively. Index abbreviations: flood pressure index (PI); adaptive capacity index (ACI).
4.2. Spatiotemporal Evolution Characteristics of the Coupling Coordination Degree Between Flood Pressure and Adaptive Capacity
4.2.1. Temporal Variation Characteristics of the Regional Average Coupling Coordination Degree
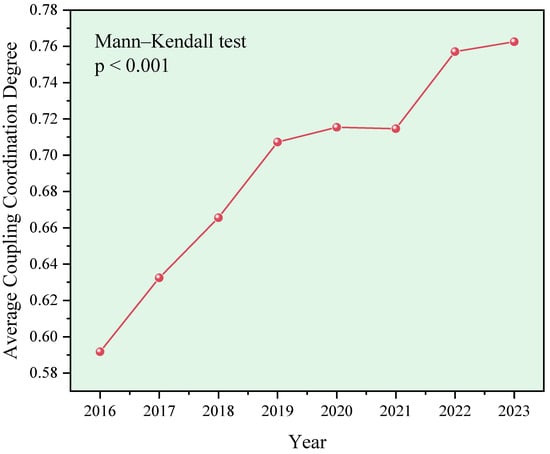
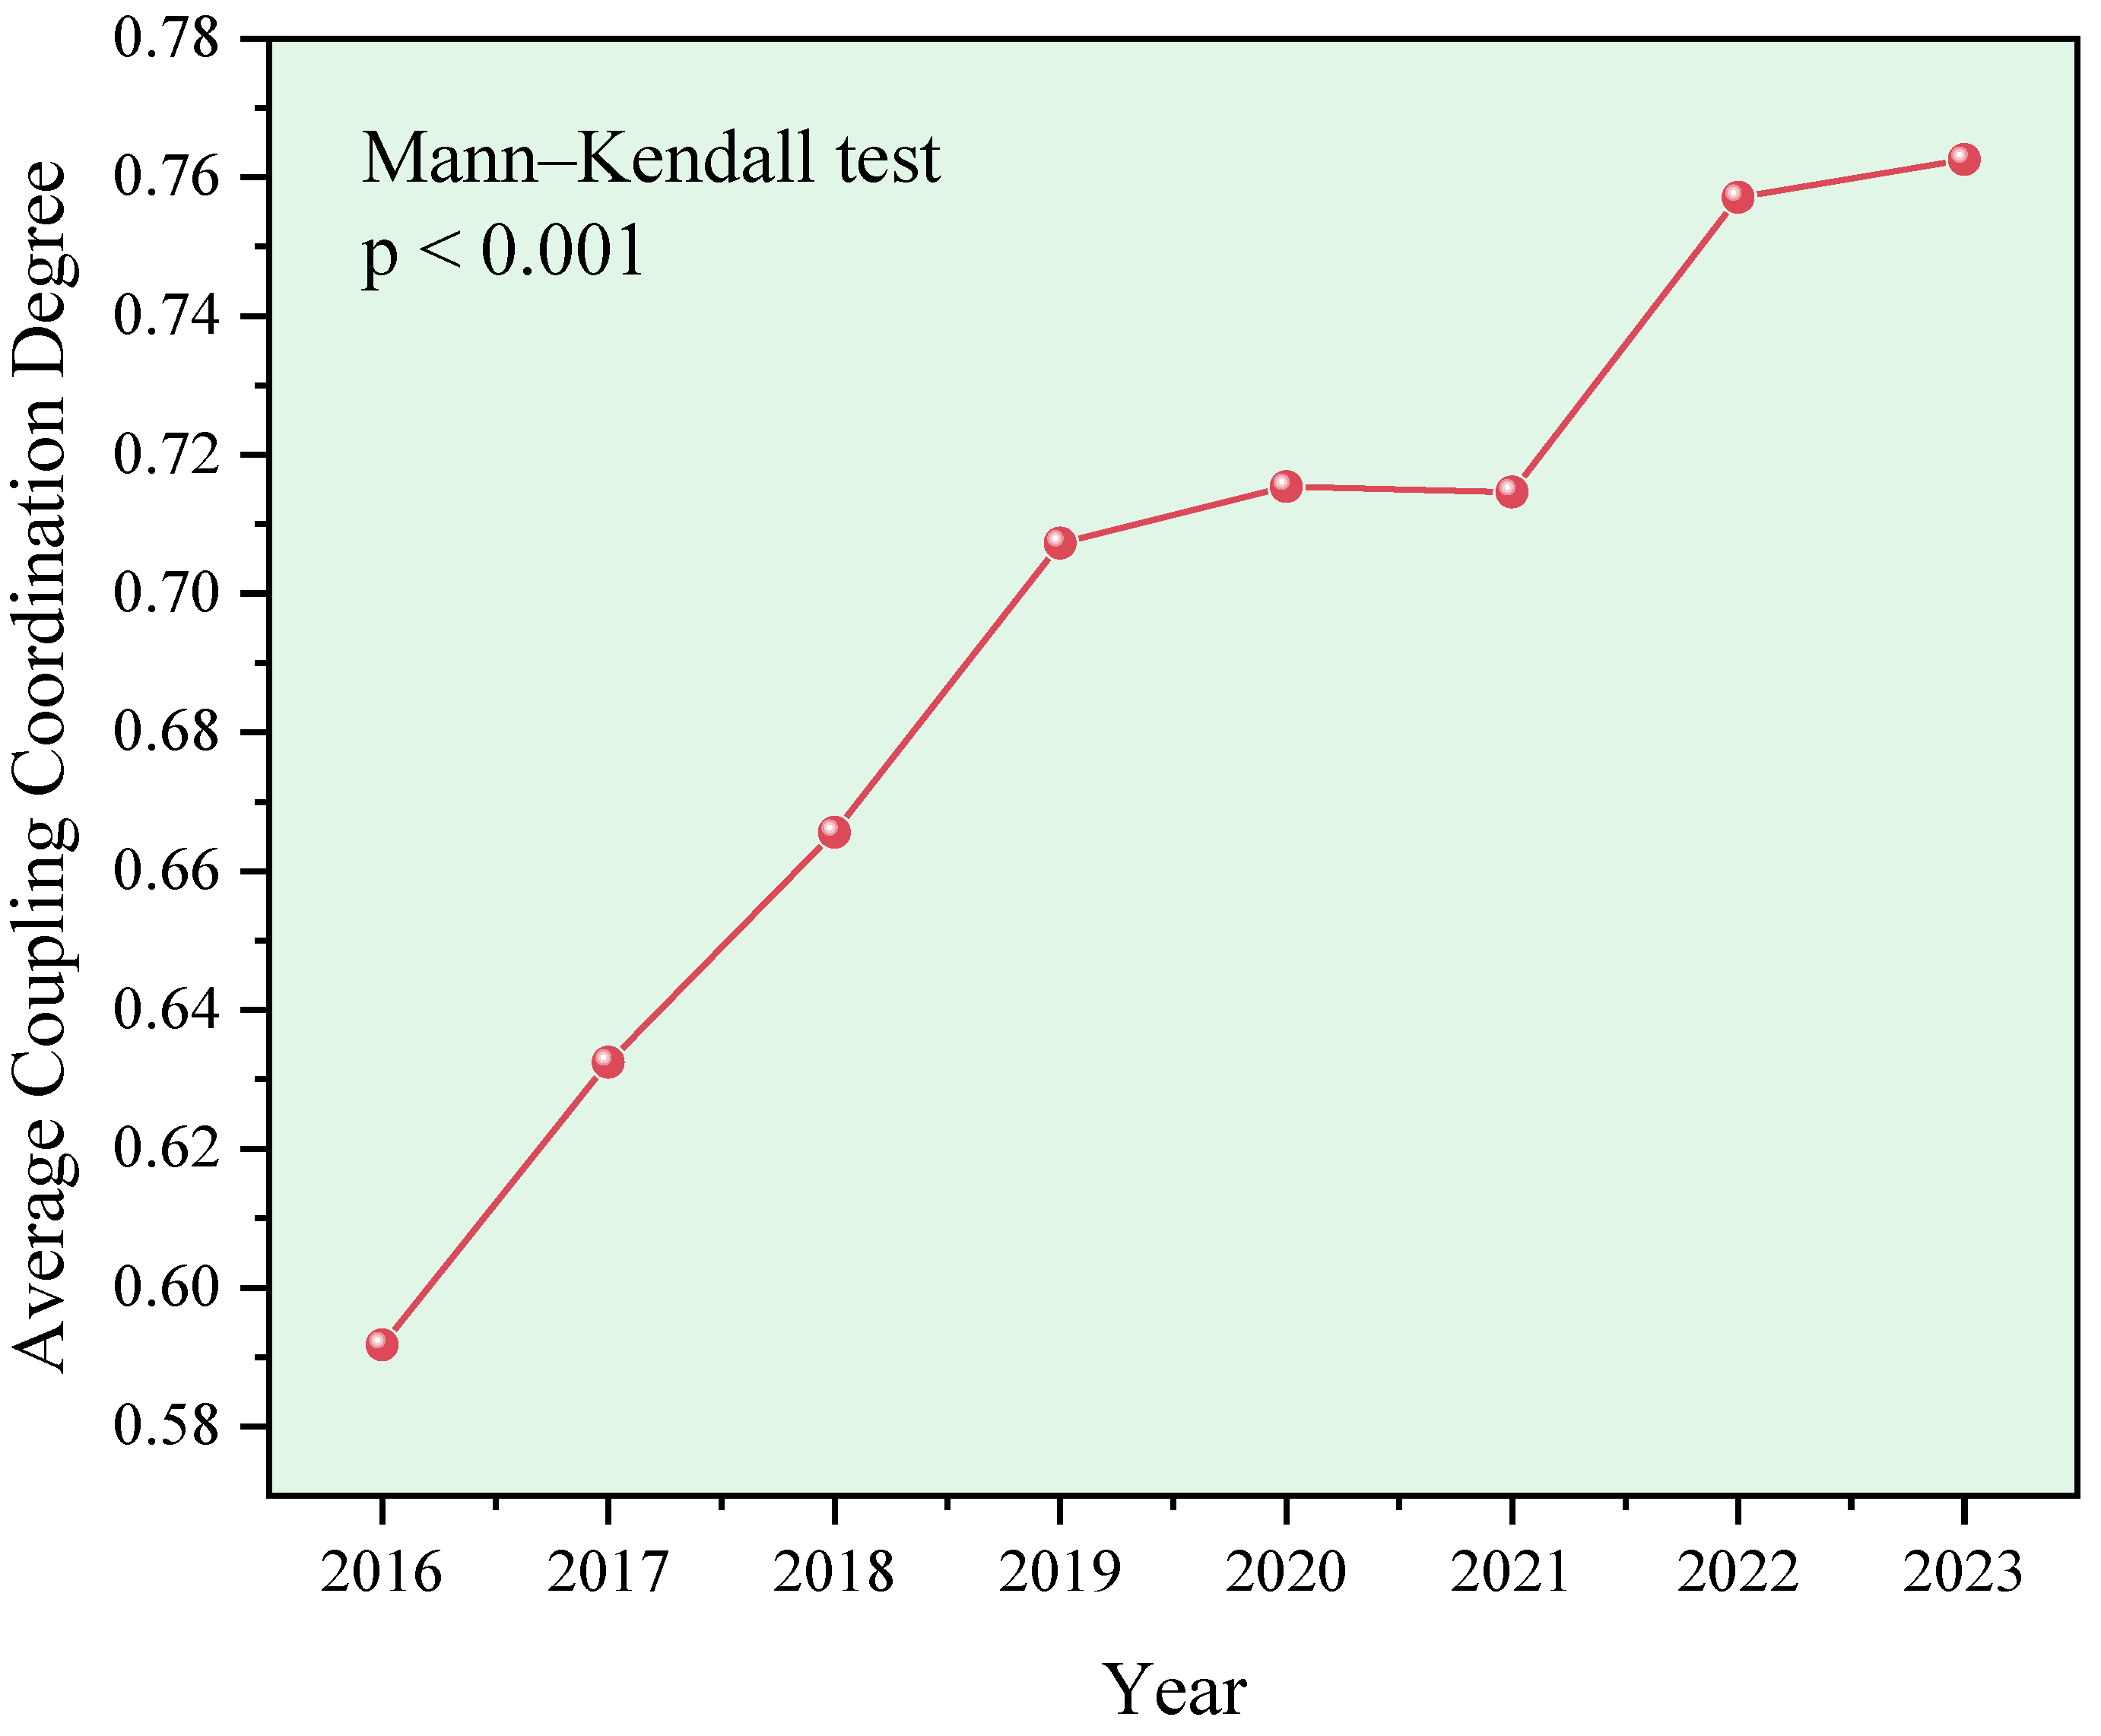
According to the calculation results of the flood pressure–adaptive capacity coupling coordination model, the average coupling coordination degree in the core development area of the Central Plains Urban Agglomeration showed an overall upward trend from 2016 to 2023 (Figure 6), increasing from 0.5917 in 2016 to 0.7626 in 2023, with a cumulative increase of 28.88%, indicating that the coordination relationship between regional flood pressure and adaptive capacity generally improved during the study period. The Mann–Kendall test confirmed a statistically significant upward trend in the regional mean coupling coordination degree (p < 0.001). In terms of stage-specific changes, the coupling coordination degree increased rapidly from 0.5917 in 2016 to 0.7073 in 2019, with an increase of 19.54%; from 2019 to 2021, the growth rate slowed markedly, increasing slightly from 0.7073 to 0.7146; after 2021, the coordination level increased again, reaching 0.7626 in 2023. Overall, although flood pressure showed a fluctuating upward trend during the study period, urban adaptive capacity continued to improve, accompanied by an overall increase in coupling coordination between the flood pressure state and adaptive capacity.
Figure 6.
Variation characteristics of the regional average coupling coordination degree in the core development area of the Central Plains Urban Agglomeration.
4.2.2. Temporal Variation Characteristics of the Coupling Coordination Degree in Different Cities
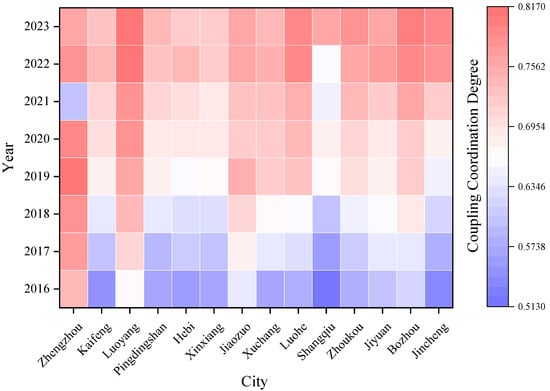
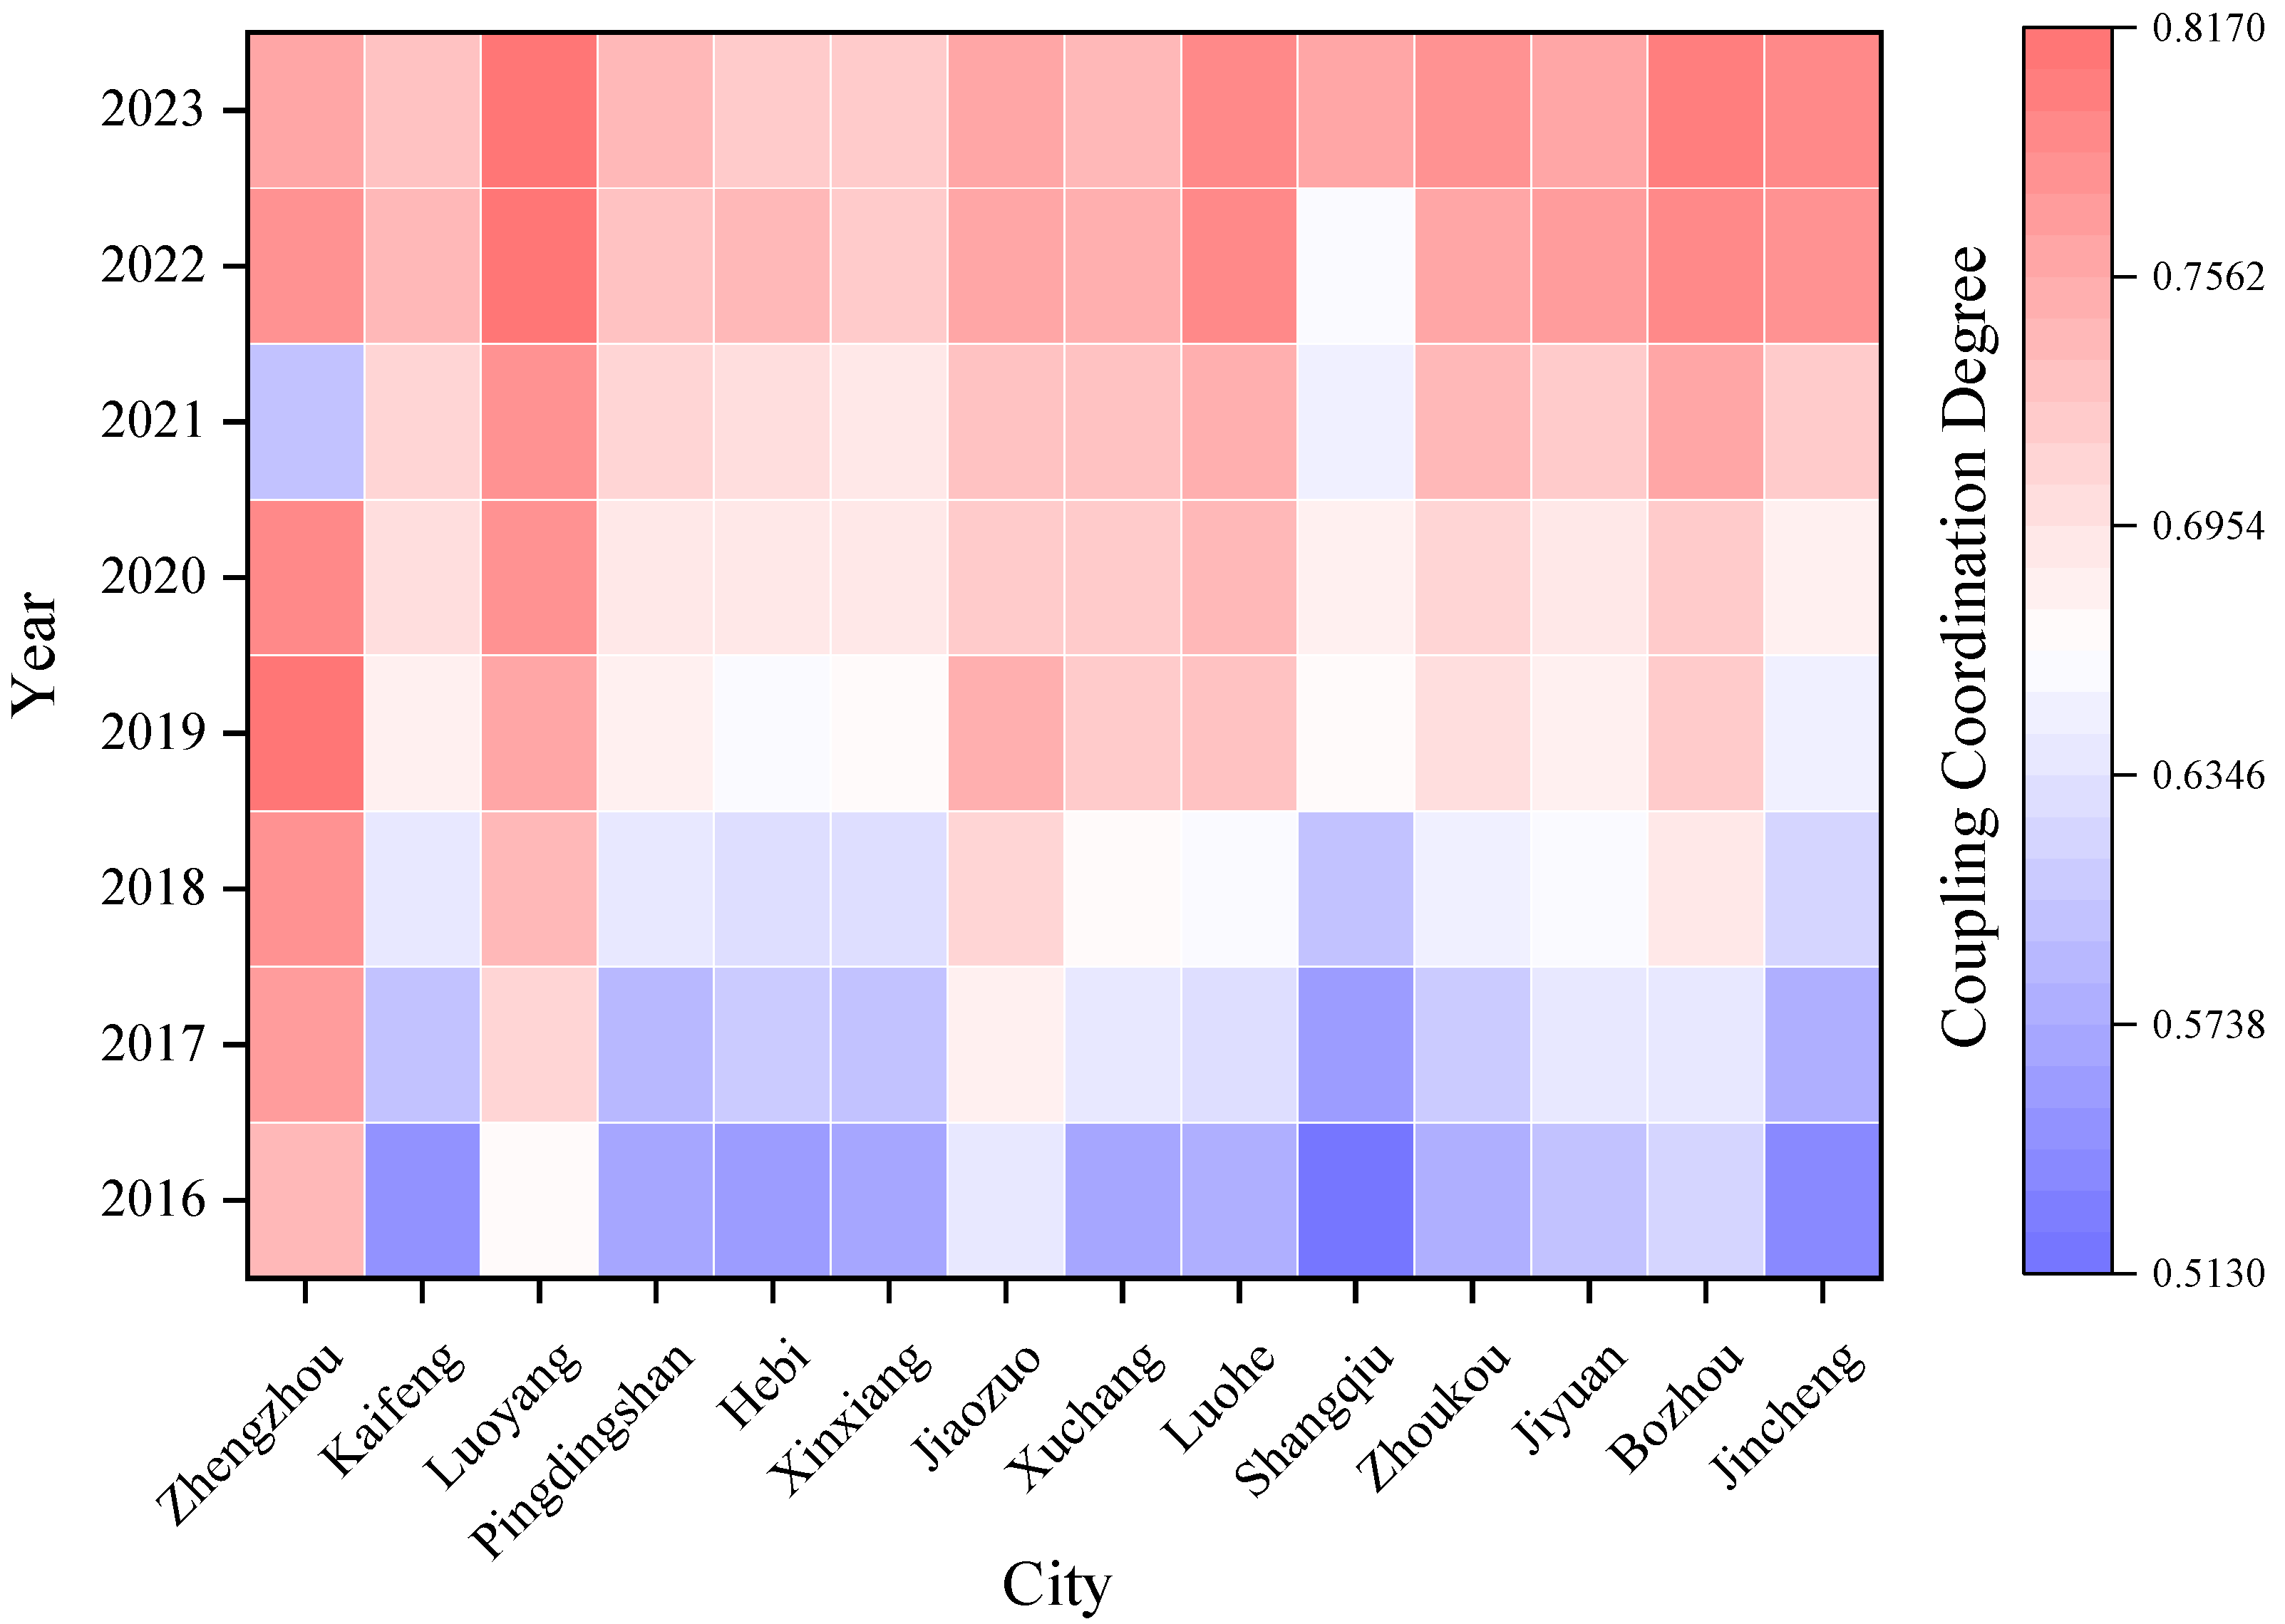
At the city scale, obvious differences existed in the coupling coordination level between flood pressure and adaptive capacity and in its evolutionary path among different cities (Figure 7). The cities with relatively high average coupling coordination degrees during the study period mainly included Luoyang (0.7598), Zhengzhou (0.7561), Bozhou (0.7178), and Jiaozuo (0.7214), whereas Shangqiu (0.6366), Hebi (0.6640), and Xinxiang (0.6605) had relatively low values. However, from the dynamic changes during 2016–2023, most cities showed relatively obvious improvements in coordination level. Among them, the coupling coordination degree of Shangqiu increased from 0.5134 to 0.7586, that of Jincheng increased from 0.5362 to 0.7884, and that of Zhoukou increased from 0.5765 to 0.7832, showing relatively prominent increases. By 2023, Luoyang and Bozhou reached 0.8135 and 0.8041, respectively, remaining at relatively high levels in the region.
Figure 7.
Temporal variation characteristics of the coupling coordination degree in different cities in the core development area of the Central Plains Urban Agglomeration.
It is worth noting that although the average coupling coordination degree of Zhengzhou was relatively high during the study period, its evolutionary path was obviously different from that of most cities with continuous improvement. The coupling coordination degree of Zhengzhou increased from 0.7416 in 2016 to 0.8127 in 2019 and then rapidly declined to 0.5991 in 2021. Although it recovered to 0.7819 in 2022, it decreased again to 0.7583 in 2023, showing relatively obvious fluctuations. Its coupling coordination degree increased by only 2.26% from 2016 to 2023, which was significantly lower than that of most cities. The main reason was that although the adaptive capacity of Zhengzhou continuously increased from 0.5274 to 0.7975, its flood pressure also increased from 0.4244 to 0.5273, indicating that a high level of adaptive capacity does not necessarily correspond to a continuously improving pressure–capacity coordination relationship. More specifically, from 2020 to 2021, Zhengzhou’s flood pressure index increased markedly from 0.4290 to 0.7305, whereas its adaptive capacity index increased only slightly from 0.7244 to 0.7545, accompanied by a decline in the coupling coordination degree from 0.7964 to 0.5991. This change coincided with the extreme rainfall and flood event in July 2021. According to Huang et al. [4], the Zhengzhou meteorological station recorded a cumulative precipitation of 817.3 mm during the storm episode, with a maximum hourly rainfall of 201.9 mm. Guo et al. [25] estimated that 10.29% of Zhengzhou’s total area was inundated and 7.55% of its population was directly exposed to flooding. These findings highlight the pronounced increase in flood pressure relative to the limited improvement in adaptive capacity during 2021, providing real-world context for the marked decline in coordination.
4.2.3. Spatial Variation Characteristics of the Coupling Coordination Degree
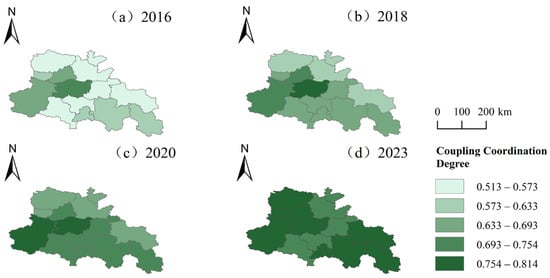
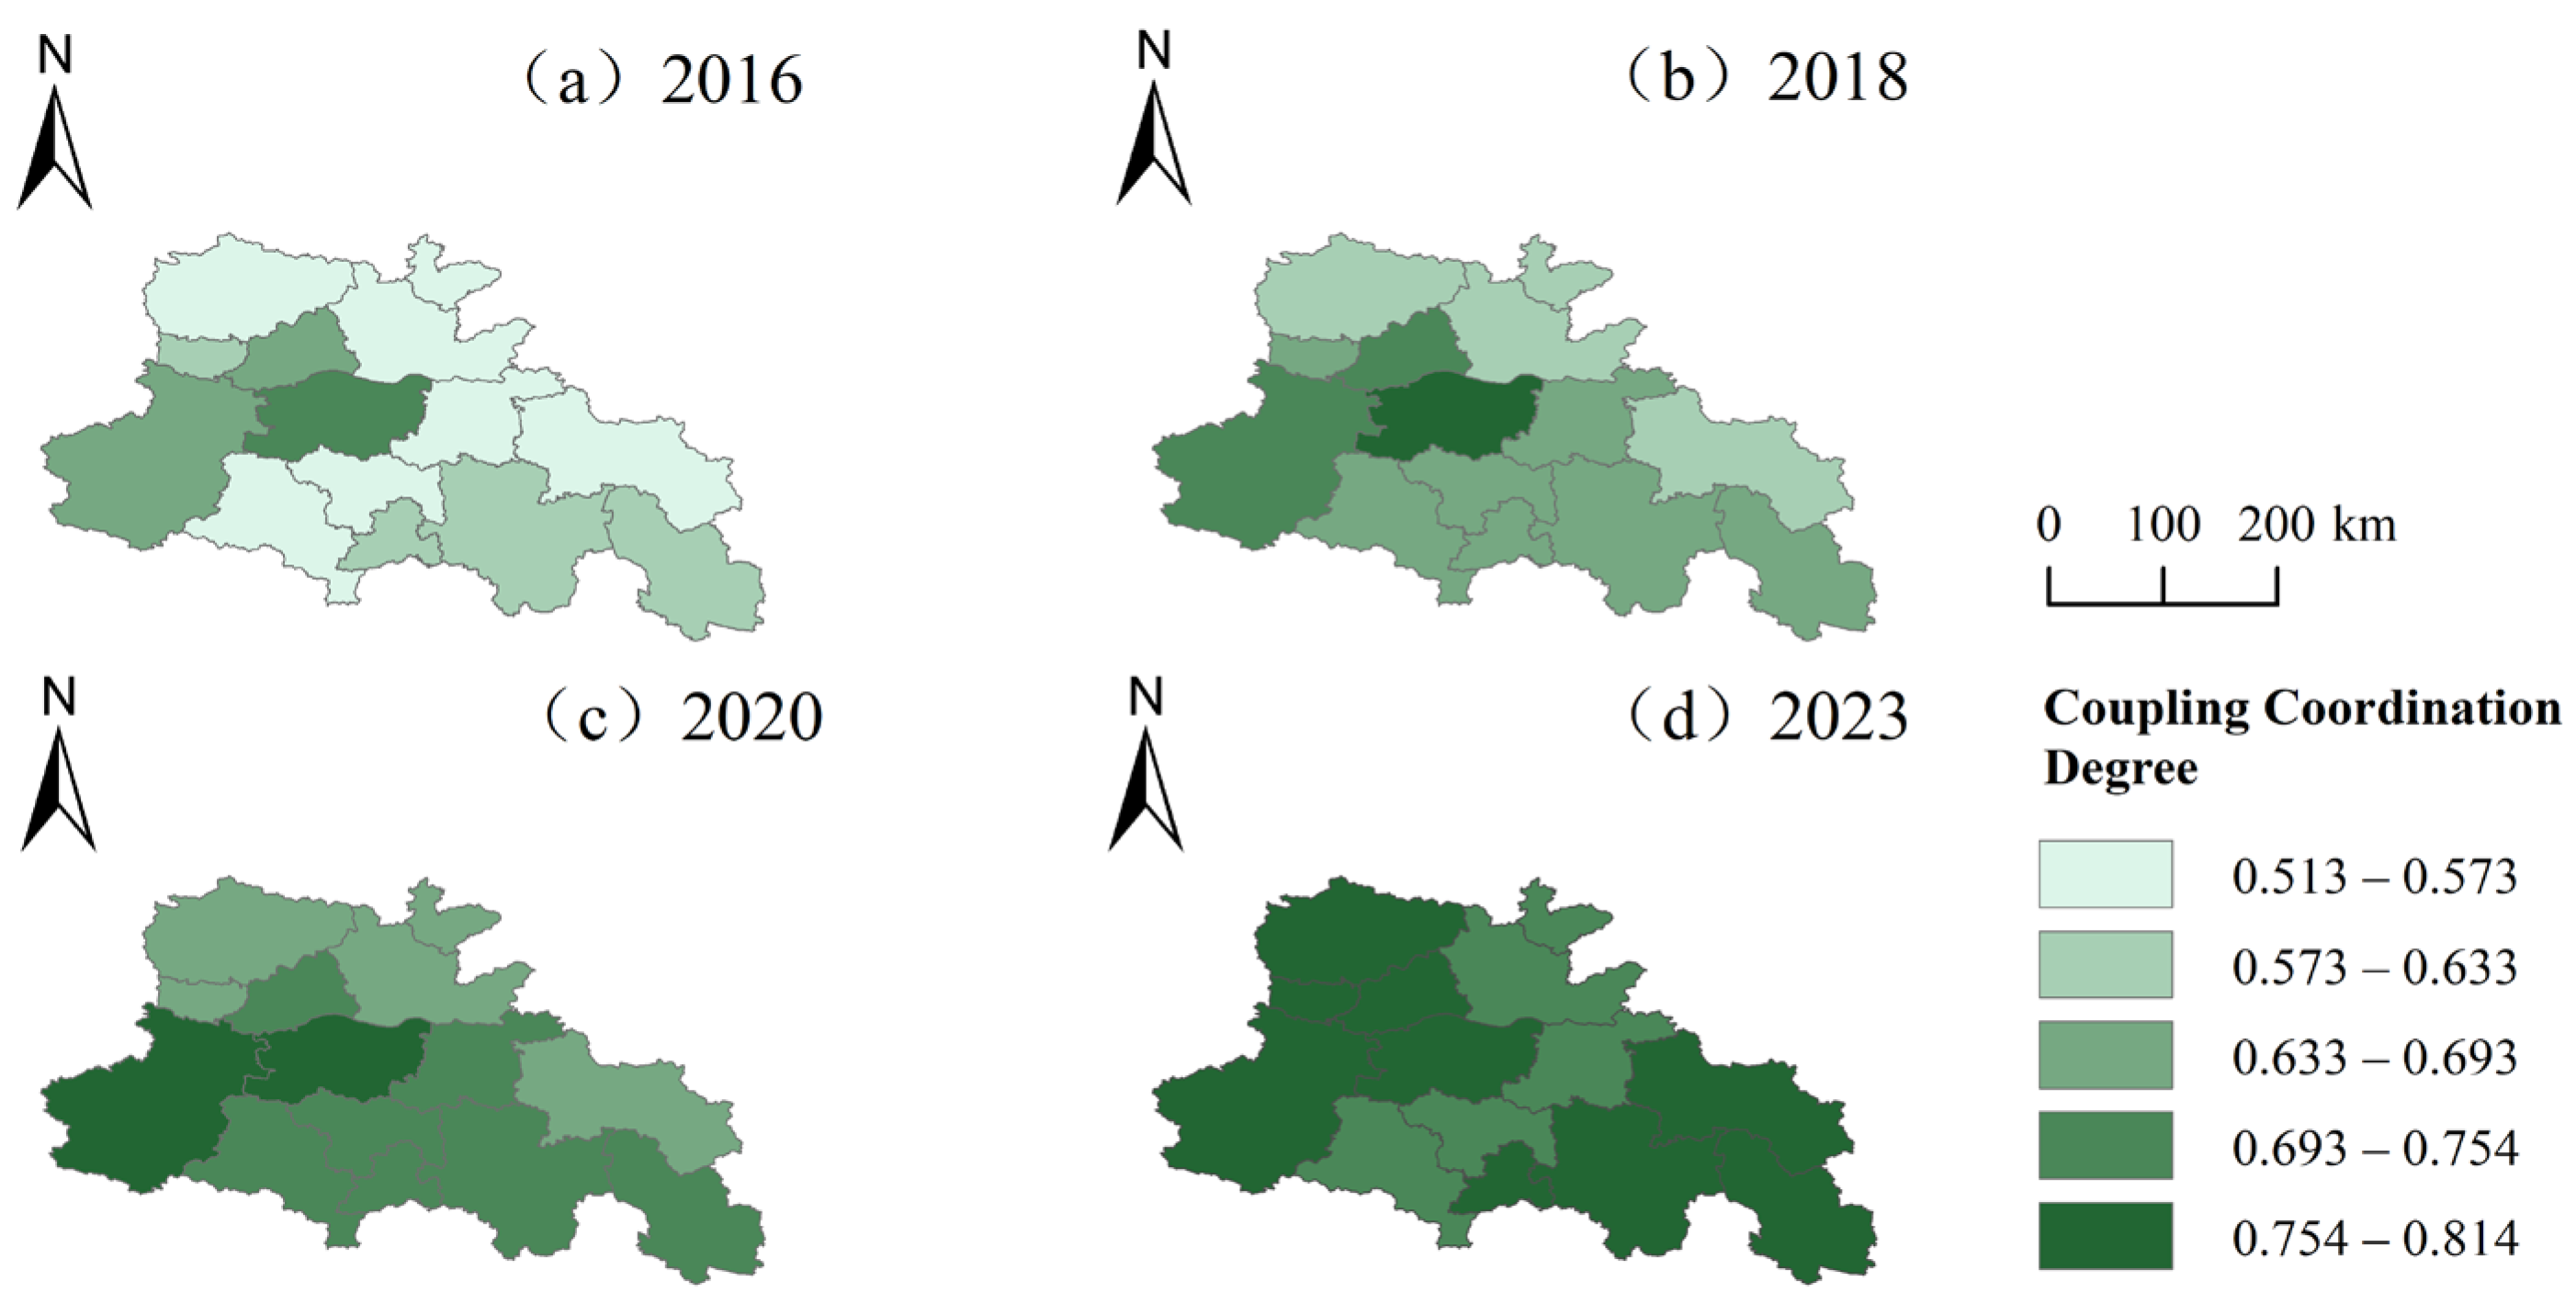
The representative years 2016, 2018, 2020, and 2023 were selected to illustrate the spatiotemporal evolution of the coupling coordination degree (Figure 8). For spatial visualization, the coupling coordination degree was classified into five equal intervals based on the observed data range, with consistent classification thresholds applied across the four representative years. In 2016, the regional spatial differences were relatively obvious. The coupling coordination degrees of Zhengzhou, Luoyang, and Jiaozuo reached 0.7416, 0.6667, and 0.6447, respectively, showing relatively high values, while those of Shangqiu, Jincheng, and Kaifeng were 0.5134, 0.5362, and 0.5501, respectively, showing relatively low values. The difference between the highest and lowest values in that year was 0.2281, and 9 of the 14 cities were still in the primary coordination stage, indicating that at the beginning of the study period, relatively high coordination levels were mainly concentrated in a few cities. By 2018, the regional average coupling coordination degree had increased to 0.6656. Zhengzhou, Luoyang, and Jiaozuo still maintained relatively high levels, and except for Shangqiu, the other 13 cities had all entered the good coordination stage. Meanwhile, the range among cities decreased to 0.1886, and the spatial differences were significantly reduced.
Figure 8.
Spatiotemporal evolution of the coupling coordination degree in representative years in the core development area of the Central Plains Urban Agglomeration: (a) 2016; (b) 2018; (c) 2020; (d) 2023.
In 2020, the coupling coordination levels of all cities further increased, and the regional average reached 0.7154. All 14 cities entered the good coordination stage. Among them, Zhengzhou ranked first with 0.7964, while Luoyang and Luohe reached 0.7860 and 0.7414, respectively. Shangqiu and Jincheng, which had relatively low values, also increased to 0.6780 and 0.6790, respectively. The difference between the highest and lowest values further decreased to 0.1183, indicating that the coordination levels among cities tended to become balanced. By 2023, the regional average coupling coordination degree further increased to 0.7626, and the composition of cities with high spatial values changed significantly. Luoyang and Bozhou entered the high coordination stage with values of 0.8135 and 0.8041, respectively, while Jincheng, Luohe, and Zhoukou reached 0.7884, 0.7877, and 0.7832, respectively. At this time, the range between the highest and lowest values decreased to 0.0888, lower than that in 2020 and substantially lower than that in 2016. Overall, the spatial pattern of coupling coordination in the study area changed from one characterized by a few prominent high-value cities and many low-coordination cities in the early stage to one in which the coordination levels of most cities increased together and multiple cities had relatively high values. The overall differences among cities in the region narrowed, but the evolutionary paths of different cities were not completely consistent.
4.3. Flood Pressure–Adaptive Capacity Combination Types and Evolution Pathways
4.3.1. Overall Evolution of Combination Types
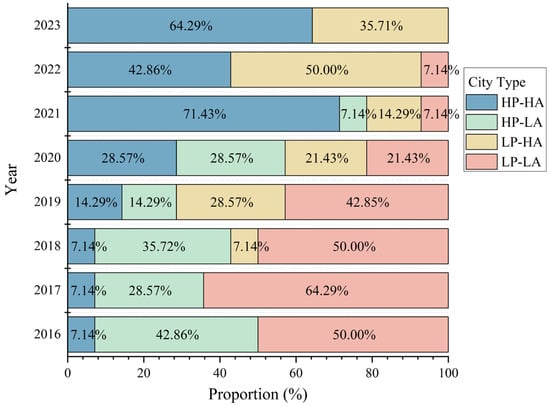
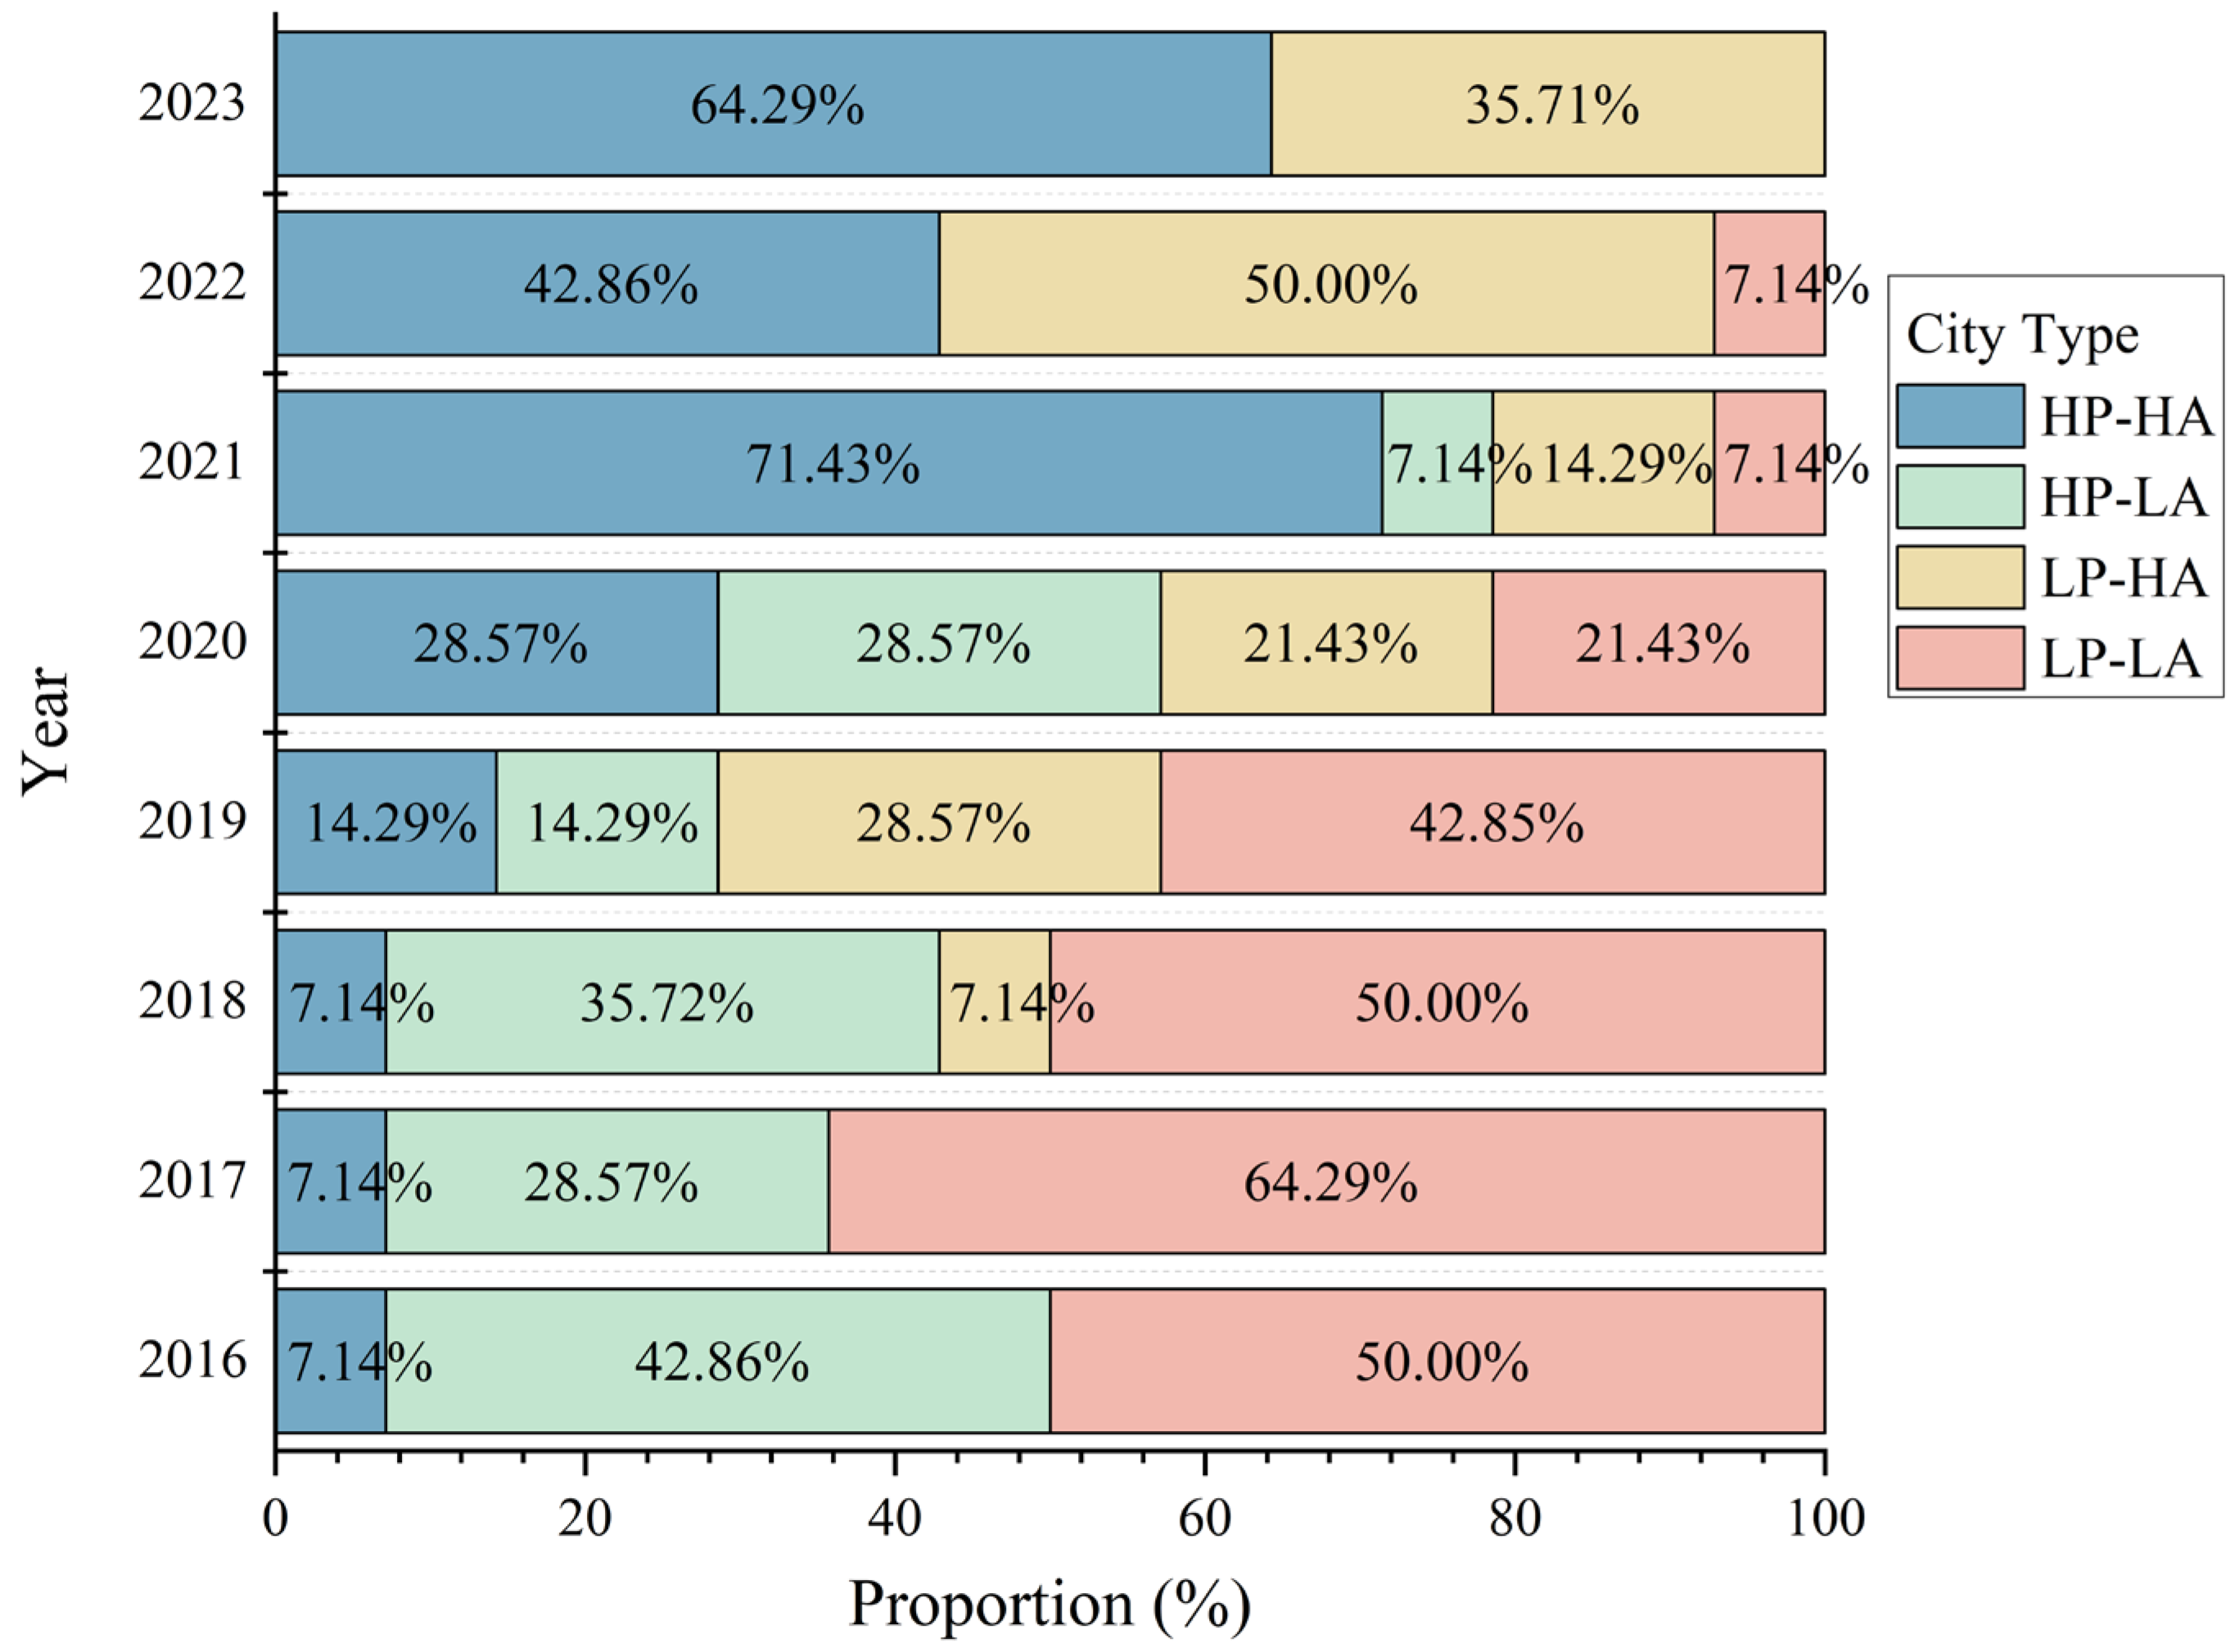
Based on the median flood pressure and adaptive capacity indices of all city–year samples from 2016 to 2023, P* = 0.2586 and A* = 0.4070 were adopted as the unified classification thresholds. Accordingly, cities were classified into four types: high pressure–high adaptation, high pressure–low adaptation, low pressure–high adaptation, and low pressure–low adaptation. Overall, the flood pressure–adaptive capacity pattern in the core development area of the Central Plains Urban Agglomeration exhibited a clear transition from low-adaptation to high-adaptation states (Figure 9). In 2016, the low pressure–low adaptation type was the most prevalent, comprising seven cities (50.00%), followed by six cities (42.86%) classified as high pressure–low adaptation. Zhengzhou was the only city categorized as high pressure–high adaptation, while no cities were classified as low pressure–high adaptation. From 2018 onward, the low pressure–high adaptation type began to emerge, and by 2019–2020 the four categories became increasingly differentiated, indicating that improvements in adaptive capacity were accompanied by a more diversified set of pressure–capacity combinations across cities.
Figure 9.
Evolution of flood pressure–adaptive capacity combination types in the core development area of the Central Plains Urban Agglomeration. Combination types: high-pressure–high-adaptation (HP–HA); high-pressure–low-adaptation (HP–LA); low-pressure–high-adaptation (LP–HA); low-pressure–low-adaptation (LP–LA).
From 2021 onward, urban types showed a pronounced shift toward the high-adaptation categories. In 2021, the number of high pressure–high adaptation cities increased to 10, accounting for 71.43% of the total. In 2022, as regional flood pressure generally declined, the number of low pressure–high adaptation cities increased to seven, while the number of high pressure–high adaptation cities decreased to six. By 2023, the numbers of high pressure–high adaptation and low pressure–high adaptation cities reached nine and five, respectively, with no cities remaining in either the high pressure–low adaptation or low pressure–low adaptation categories. These results indicate that, over the study period, the overall combination structure shifted from low-adaptation toward high-adaptation types. The sustained enhancement of adaptive capacity was therefore the predominant direction of type transitions, whereas flood pressure exhibited stronger interannual fluctuations driven by factors such as precipitation variability and urbanization.
4.3.2. Four-Quadrant Patterns and Urban Transitions in Representative Years
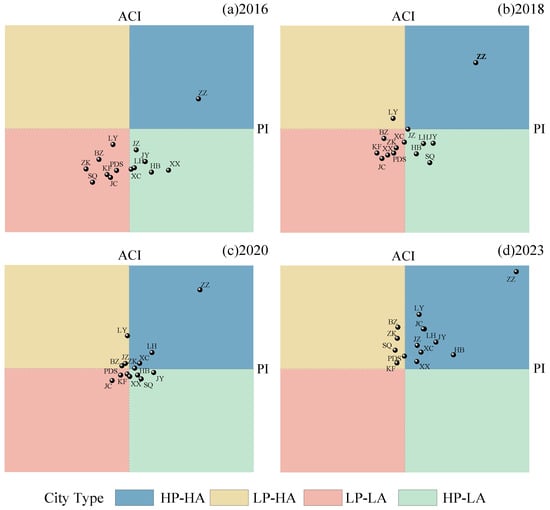
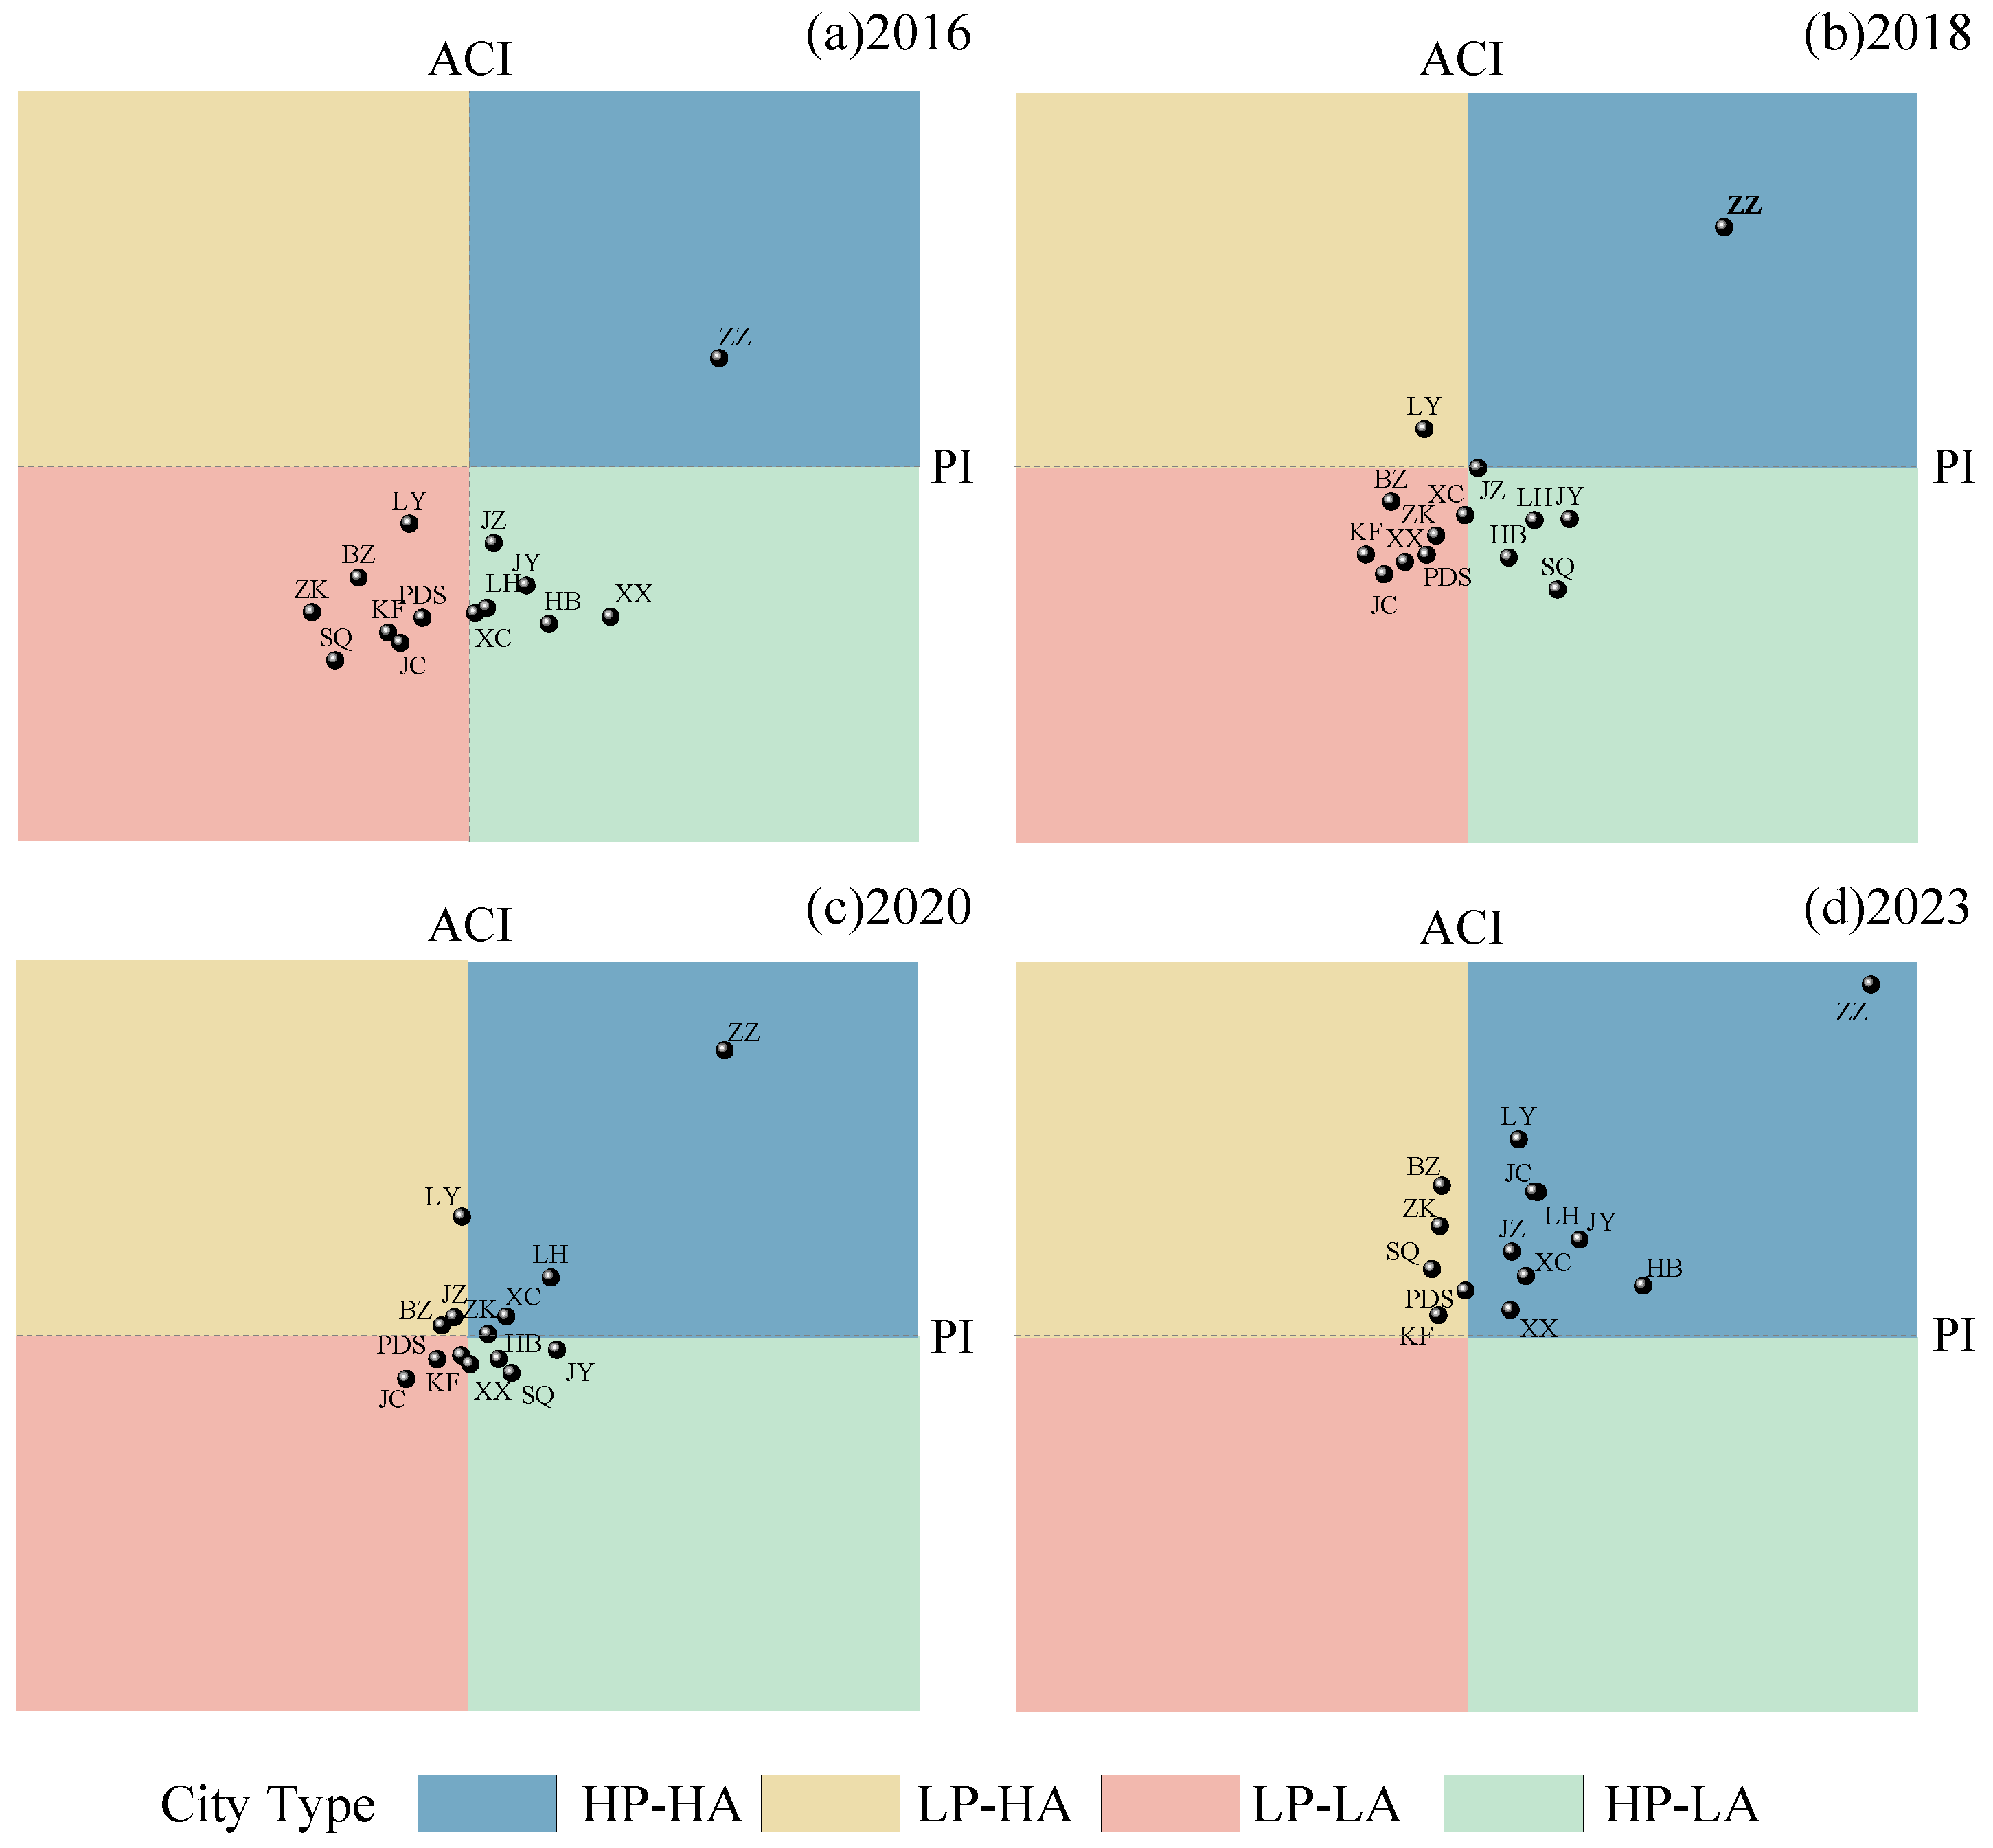
From the positional changes of cities in the two-dimensional flood pressure–adaptive capacity space during representative years, the overall urban pattern generally exhibited an upward transition from the lower quadrants to the upper quadrants (Figure 10). In 2016, Zhengzhou was the only city located in the high pressure–high adaptation quadrant, while Xinxiang, Hebi, Jiaozuo, Xuchang, Luohe, and Jiyuan were situated in the high pressure–low adaptation quadrant, and the remaining seven cities were all classified in the low pressure–low adaptation quadrant, indicating that the region as a whole had relatively insufficient adaptive capacity at the initial stage of the study period. In 2018, the overall pattern changed only slightly, with Luoyang being the first city to enter the low pressure–high adaptation quadrant. By 2020, the numbers of cities classified as high pressure–high adaptation and low pressure–high adaptation had increased markedly, suggesting that improvements in urban adaptive capacity were gradually reshaping the previous low-adaptation pattern. By 2023, all 14 cities had entered the high-adaptation range. Among them, Zhengzhou, Luoyang, Hebi, Xinxiang, Jiaozuo, Xuchang, Luohe, Jiyuan, and Jincheng were classified as high pressure–high adaptation, whereas Kaifeng, Pingdingshan, Shangqiu, Zhoukou, and Bozhou belonged to the low pressure–high adaptation type.
Figure 10.
Four-quadrant distribution of urban flood pressure–adaptive capacity combination types in representative years in the core development area of the Central Plains Urban Agglomeration: (a) 2016; (b) 2018; (c) 2020; (d) 2023. Index abbreviations: flood pressure index (PI); adaptive capacity index (ACI). Combination types: high-pressure–high-adaptation (HP–HA); high-pressure–low-adaptation (HP–LA); low-pressure–high-adaptation (LP–HA); low-pressure–low-adaptation (LP–LA). City abbreviations: Zhengzhou (ZZ); Kaifeng (KF); Luoyang (LY); Pingdingshan (PDS); Hebi (HB); Xinxiang (XX); Jiaozuo (JZ); Xuchang (XC); Luohe (LH); Shangqiu (SQ); Zhoukou (ZK); Jiyuan (JY); Bozhou (BZ); Jincheng (JC).
From the perspective of urban type-transition pathways, Hebi, Xinxiang, Jiaozuo, Xuchang, Luohe, and Jiyuan, which were classified as high pressure–low adaptation in 2016, had all shifted to the high pressure–high adaptation type by 2023. This indicates that these cities experienced relatively rapid improvements in adaptive capacity, while their flood pressure remained comparatively high. The seven cities initially classified as low pressure–low adaptation in 2016 followed two main transition pathways. Luoyang and Jincheng shifted to the high pressure–high adaptation type, suggesting that increases in adaptive capacity were accompanied by rising flood pressure during the process of urban development. In contrast, Kaifeng, Pingdingshan, Shangqiu, Zhoukou, and Bozhou transitioned to the low pressure–high adaptation type, exhibiting a comparatively more favorable pressure–adaptation combination. Zhengzhou remained in the high pressure–high adaptation state throughout the study period, indicating the persistent coexistence of strong adaptive capacity and relatively high flood pressure.
5. Discussion
5.1. Comparison with Existing Studies
To investigate the dynamic relationship between urban flood pressure and adaptive capacity, this study constructed a coupling coordination degree model for urban flood pressure and adaptive capacity to examine the spatiotemporal evolution of flood pressure, adaptive capacity, and their coordination across different cities from 2016 to 2023. A four-quadrant model was further introduced to identify pressure–adaptation combination types and transition pathways among cities. The results showed overall improvements in flood adaptive capacity and coupling coordination in the core development area of the Central Plains Urban Agglomeration during the study period. Flood disasters in the Central Plains Urban Agglomeration have long attracted considerable scholarly attention. Zhang et al. [24] investigated disaster resilience across 30 cities in the region from 2012 to 2022 and reported an overall upward trend, accompanied by pronounced spatial heterogeneity. Similarly, Liu et al. [56] evaluated urban flood resilience in 30 cities from 2012 to 2021 and found that flood resilience improved overall, while considerable disparities remained between core and peripheral cities, with Zhengzhou occupying a prominent position. Although these studies differ from the present study covering 14 cities in their evaluation dimensions and spatial coverage, their findings are broadly consistent with the improvement in adaptive capacity observed in the present study. At a broader spatial scale, Li et al. [57] investigated the interactions between urbanization and flood disasters in China and found that urbanization continued to increase while flood disaster risk exhibited a fluctuating upward trend, accompanied by an overall improvement in coupling coordination. A similar pattern was observed in the present study from the perspective of flood pressure and adaptive capacity. During 2016–2023, the regional average coupling coordination degree increased from 0.5917 to 0.7626, while the flood pressure index also increased overall from 0.2549 to 0.3028, indicating that improvements in coordination can coexist with increasing flood pressure.
However, a closer examination of individual cities reveals pronounced differences in their coupling coordination trajectories. Cities with relatively low initial coordination levels, such as Shangqiu and Jincheng, showed substantial improvements, with their coupling coordination degrees increasing from 0.5134 to 0.7586 and from 0.5362 to 0.7884, respectively. These increases in coupling coordination were closely associated with improvements in healthcare, drainage infrastructure, and socioeconomic resources. During the study period, the number of hospital beds per 10,000 people and drainage pipe density in Shangqiu increased by 79.40% and 73.00%, respectively, while per capita GDP and per capita expenditure on social security and employment in Jincheng increased by 149.69% and 99.84%, respectively, contributing to substantial improvements in urban adaptive capacity. In contrast, Zhengzhou exhibited pronounced interannual fluctuations, with its coupling coordination degree declining from 0.7964 in 2020 to 0.5991 in 2021. This decline was closely associated with the sharp increase in flood pressure during the extreme “7·20” rainstorm event in Zhengzhou in 2021, when the maximum hourly rainfall reached 201.9 mm, breaking the historical record for hourly precipitation in mainland China [58]. Over the same period, the flood pressure index increased sharply from 0.4290 to 0.7305, whereas the adaptive capacity index increased only slightly from 0.7244 to 0.7545, resulting in a marked deterioration in the coordination between the two subsystems. This suggests that when extreme rainfall events cause sharp increases in flood pressure, improvements in urban adaptive capacity may still be insufficient to effectively buffer their impacts.
Overall, compared with existing studies focusing primarily on overall disaster resilience, urban flood resilience, or the interactions between urbanization and flood disasters, this study integrates coupling coordination analysis with four-quadrant classification to examine the overall evolution of the coordination between flood pressure and adaptive capacity and reveal intercity differences in pressure–adaptation combination states, thereby providing a more detailed basis for identifying differentiated pathways for urban flood risk management.
5.2. Research Implications, Limitations, and Future Directions
The main contribution of this study lies in examining flood pressure and adaptive capacity as two distinct but interrelated dimensions of urban flood systems. By integrating the coupling coordination degree model with a four-quadrant classification approach, this study provides insights into both the overall coordination level and the structural differences in pressure–adaptation combinations among cities. Specifically, while the coupling coordination degree characterizes the combined development level and balance between the flood pressure state and adaptive capacity, the four-quadrant model further distinguishes cities with different pressure–adaptation conditions that may exhibit similar coordination levels.
The findings also provide practical implications for differentiated urban flood management. For cities classified as high-pressure–high-adaptation types, maintaining and further strengthening adaptive capacity should be accompanied by continued efforts to manage flood pressure, including improvements in drainage infrastructure, stormwater regulation, and preparedness for extreme rainfall events. For cities classified as low-pressure–high-adaptation types, priority should be given to maintaining existing adaptive capacity and preventing further increases in flood pressure. Furthermore, the variation in pressure–adaptation combinations among cities highlights the importance of targeted resource allocation and coordinated adaptation strategies in regional flood governance. It should be emphasized that a higher coupling coordination degree does not necessarily indicate lower flood risk. This is because the coupling coordination degree primarily reflects the combined development level and balance between the flood pressure state and adaptive capacity, rather than directly measuring flood risk. Furthermore, cities with similar coordination levels may exhibit different pressure–adaptation combinations and face different levels of flood pressure. Therefore, management priorities should be tailored to the specific flood pressure and adaptive capacity conditions of each city rather than the coordination degree alone.
Nevertheless, the long-term evolution of the pressure–adaptation relationship under changing climatic and socioeconomic conditions remains to be explored. The present study focuses on the historical evolution from 2016 to 2023 and does not explicitly consider alternative future climate change and urban development scenarios. Under different greenhouse gas emission pathways, changes in extreme precipitation and urbanization may lead to different trajectories of flood pressure, while it remains uncertain whether improvements in adaptive capacity can keep pace with these changes. Future research could incorporate different emission scenarios, socioeconomic development pathways, and urban adaptation strategies to investigate the dynamic evolution of flood pressure and adaptive capacity. Particular attention should be given to identifying scenarios in which flood pressure may increase faster than adaptive capacity, potentially leading to deterioration in their coordination relationship. This would extend the present historical assessment toward a forward-looking understanding of urban flood systems and provide further support for long-term adaptive flood governance.
6. Conclusions
This study focuses on 14 cities in the core development area of the Central Plains Urban Agglomeration from 2016 to 2023. A quantitative model of urban flood pressure and adaptive capacity was constructed, integrating the entropy weight method, the coupling coordination degree model, and the four-quadrant model to reveal the spatiotemporal evolution of flood pressure, adaptive capacity, and their coordination relationships across different cities during 2016–2023, and to identify the pressure–adaptation combination types and their transition pathways. The main conclusions are as follows:
- (1)
- During the study period, the flood pressure index of the Central Plains Urban Agglomeration increased from 0.2549 to 0.3028, showing an overall fluctuating upward trend, while the adaptive capacity index increased from 0.2730 to 0.5293, indicating continuous improvement. Both exhibited nonlinear evolution and pronounced inter-city differences. Areas with relatively high flood pressure were mainly concentrated in cities such as Zhengzhou, whereas higher adaptive capacity gradually expanded from a small number of core cities to a broader range of cities.
- (2)
- The regional average coupling coordination degree increased from 0.5917 in 2016 to 0.7626 in 2023, while the inter-city range decreased from 0.2281 to 0.0888, indicating an overall improvement in coordination and a narrowing of disparities among cities. However, Zhengzhou showed marked fluctuations in its coordination degree during the study period, suggesting that when flood pressure increased periodically, a relatively high level of adaptive capacity was still insufficient to ensure sustained stability in coordination.
- (3)
- The flood pressure–adaptive capacity combinations of cities gradually shifted from being dominated by low-adaptation types to high-adaptation types. In 2016, all 13 cities except Zhengzhou were classified as low-adaptation types; by 2023, all 14 cities had entered the high-adaptation category, with the high-pressure–high-adaptation type becoming the dominant combination. This indicates that, alongside urban construction and socioeconomic development, urban flood adaptive capacity continued to improve. However, under the combined influence of climate change and urbanization, most cities still faced a structural constraint characterized by the simultaneous increase in flood pressure and adaptive capacity.
Based on socioeconomic, hydro-meteorological, and infrastructure data from 2016 to 2023, this study analyzed the spatiotemporal changes in urban flood pressure, adaptive capacity, and their coupling coordination relationships in the core development area of the Central Plains Urban Agglomeration, and identified the combination types and evolutionary pathways of flood pressure and adaptive capacity across cities. The findings can provide support for optimizing priorities in urban flood adaptation capacity building and for differentiated flood risk governance. However, under the combined effects of climate change and continued urbanization, future extreme precipitation, population and economic concentration, and expansion of the built environment remain highly uncertain, and the matching relationship between urban flood pressure and adaptive capacity may also change accordingly. Future research could further incorporate different climate change scenarios and socioeconomic development scenarios to simulate and predict the future evolution of urban flood pressure, adaptive capacity, and their coupling coordination relationships, identify potential high-pressure and adaptation-deficient areas, and provide a scientific basis for urban spatial development, infrastructure planning, and adaptive flood governance.
Author Contributions
Conceptualization, H.W. and X.Z.; methodology, L.Z.; software, Z.L.; validation, Y.Z., H.W. and X.Z.; formal analysis, L.J.; investigation, Q.C.; resources, B.G.; data curation, H.X.; writing—original draft preparation, H.W. and L.Z.; writing—review and editing, X.Z. and Y.Z.; visualization, H.X.; supervision, Q.C.; project administration, H.W.; funding acquisition, L.J., H.W., Y.Z. and Q.C. All authors have read and agreed to the published version of the manuscript.
Funding
This research was funded by the National Key Research and Development Program of China (2023YFC3006605), Excellent Youth Foundation of Henan Scientific Committee (grant No. 242300421038), Henan Science and Technology Breakthrough Program (262102320068), National Natural Science Foundation of China (52609051), Postdoctoral Fellowship Program of CPSF (GZC20261708), Key Scientific Research Project of Henan Provincial Department of Education (27A570007), Key Scientific Research Projects of Higher Education Institutions in Henan Province (25A570008), and Henan Province Key Technology R&D Projects (252102321117).
Data Availability Statement
The original contributions presented in this study are included in the article. Further inquiries can be directed to the corresponding author.
Acknowledgments
The authors would like to thank the China Institute of Water Resources and Hydropower Research for providing valuable data support for this study. We extend our thanks to the anonymous reviewers whose insightful feedback has been instrumental in elevating the standard of this article.
Conflicts of Interest
The authors declare no conflicts of interest.
Appendix A
Table A1.
Information on the meteorological stations used in this study.
References
- Agonafir, C.; Lakhankar, T.; Khanbilvardi, R.; Krakauer, N.; Radell, D.; Devineni, N. A review of recent advances in urban flood research. Water Secur. 2023, 19, 100141. [Google Scholar] [CrossRef] [Scilit]
- Azizi, K.; Diko, S.K.; Saija, L.; Zamani, M.G.; Meier, C.I. Integrated community-based approaches to urban pluvial flooding research, trends and future directions: A review. Urban Clim. 2022, 44, 101237. [Google Scholar] [CrossRef] [Scilit]
- Esraz-Ul-Zannat, M.; Dedekorkut-Howes, A.; Morgan, E.A. A review of nature-based infrastructures and their effectiveness for urban flood risk mitigation. WIREs Clim. Change 2024, 15, e889. [Google Scholar] [CrossRef] [Scilit]
- Huang, X.W.; Wang, D.S.; Li, L.Z.X.; Li, Q.; Zeng, Z.Z. Modeling Urban Impact on Zhengzhou Storm on July 20, 2021. J. Geophys. Res.-Atmos. 2022, 127, e2022JD037387. [Google Scholar] [CrossRef] [Scilit]
- Armon, M.; Shmilovitz, Y.; Dente, E. Anatomy of a foreseeable disaster: Lessons from the 2023 dam-breaching flood in Derna, Libya. Sci. Adv. 2025, 11, eadu2865. [Google Scholar] [CrossRef] [Scilit]
- Revollo, N.V.; Gil, V.; Couto, F.T. Extreme Precipitation and Low-Lying Urban Flooding in Bahía Blanca, Argentina. Atmosphere 2025, 16, 511. [Google Scholar] [CrossRef] [Scilit]
- Liu, K.L.; Wang, S.G.; Chen, B.; Wang, H. Quantifying the direct and indirect impacts of urban waterlogging using input-output analysis. J. Environ. Manag. 2024, 352, 120068. [Google Scholar] [CrossRef] [Scilit]
- Shu, X.Y.; Xu, Z.X.; Zhang, S.L.; Ye, C.L.; Yu, L. Assessing Pluvial Flooding Risk in Urban Areas with High Spatial Heterogeneity Using a Fused Physically-Based and Data-Driven Framework. Int. J. Disaster Risk Sci. 2026, 17, 644–662. [Google Scholar] [CrossRef] [Scilit]
- Dabrowski, M.; Stead, D.; He, J.H.; Yu, F. Adaptive capacity of the Pearl River Delta cities in the face of the growing flood risk: Institutions, ideas and interests. Urban Stud. 2021, 58, 2683–2702. [Google Scholar] [CrossRef] [Scilit]
- Chang, H.J.; Pallathadka, A.; Sauer, J.; Grimm, N.B.; Zimmerman, R.; Cheng, C.W.; Iwaniec, D.M.; Kim, Y.; Lloyd, R.; McPhearson, T.; et al. Assessment of urban flood vulnerability using the social-ecological-technological systems framework in six US cities. Sustain. Cities Soc. 2021, 68, 102786. [Google Scholar] [CrossRef] [Scilit]
- Liu, Y.; Jiang, Y.X.; Deng, Y.F. A framework for urban flood resilience assessment: Integrating multidimensional indicators and dynamic adaptation strategies. J. Environ. Manag. 2025, 392, 126841. [Google Scholar] [CrossRef] [Scilit]
- Song, S.M.; Park, H.J.; Kim, D.H.; Lee, S.O. Preliminary Study on the Urban Flood Adaptive Capacity Index. Appl. Sci. 2025, 15, 9118. [Google Scholar] [CrossRef] [Scilit]
- Sun, S.; Zhai, J.Q.; Li, Y.; Huang, D.P.; Wang, G.F. Urban waterlogging risk assessment in well-developed region of Eastern China. Phys. Chem. Earth 2020, 115, 102824. [Google Scholar] [CrossRef] [Scilit]
- Yuan, M.M.; Li, W.F.; Li, T.; Zhang, J. Urban Pluvial Flood Resilience Evolution and Dynamic Assessment Based on the DPSIR Model: A Case Study of Kunming City, Southwest China. Water 2025, 17, 2581. [Google Scholar] [CrossRef] [Scilit]
- Long, L.; Junjia, Y.; Jiao, W.; Alias, A.H.; Haron, N.A.; Abu Bakar, N. Urban flood resilience evaluation in China: A systematic review of frameworks, methods, and limitations. Geomat. Nat. Hazards Risk 2025, 16, 2445631. [Google Scholar] [CrossRef] [Scilit]
- Prashar, N.; Lakra, H.S.; Shaw, R.; Kaur, H. Urban Flood Resilience: A comprehensive review of assessment methods, tools, and techniques to manage disaster. Prog. Disaster Sci. 2023, 20, 100299. [Google Scholar] [CrossRef] [Scilit]
- Sun, H.F.; Chen, R.J.; Mao, W.X.; Luo, D. Spatiotemporal evolution and influencing factors of urban flood resilience in the Pearl River Delta urban agglomeration. Sustain. Cities Soc. 2026, 139, 107218. [Google Scholar] [CrossRef] [Scilit]
- Aerts, J.; Bates, P.D.; Botzen, W.J.W.; de Bruijn, J.; Hall, J.W.; van den Hurk, B.; Kreibich, H.; Merz, B.; Muis, S.; Mysiak, J.; et al. Exploring the limits and gaps of flood adaptation. Nat. Water 2024, 2, 719–728. [Google Scholar] [CrossRef] [Scilit]
- Lu, S.R.; Nakhmurina, A. Financial constraints and short-term planning are linked to flood risk adaptation gaps in US cities. Commun. Earth Environ. 2024, 5, 43. [Google Scholar] [CrossRef] [Scilit]
- Wang, Y.T.; Zhang, C.; Chen, A.S.; Wang, G.Q.; Fu, G.T. Exploring the relationship between urban flood risk and resilience at a high- resolution grid cell scale. Sci. Total Environ. 2023, 893, 164852. [Google Scholar] [CrossRef] [Scilit]
- Li, P.F.; Xue, Y.; Liang, J.L.; Tan, S.Z. Research on the coupling and coordination of urbanization and flood disasters based on an improved coupling coordination model: A case study from the pearl river delta in China. Sustain. Cities Soc. 2025, 130, 106564. [Google Scholar] [CrossRef] [Scilit]
- Di, D.Y.; Li, J.; Hu, H.; Zhang, Z.Y.; Jia, H. A process-oriented framework integrating DPSR and NESH for spatially explicit urban flood resilience assessment. Ecol. Indic. 2026, 189, 115075. [Google Scholar] [CrossRef] [Scilit]
- Liu, X.G.; Wu, Y.; Ren, R.; Mahmoud, H.N. Tipping points in urban growth: How urbanization reshapes flood resilience and social vulnerability in China. PNAS Nexus 2026, 5, pgag240. [Google Scholar] [CrossRef] [Scilit]
- Zhang, Y.L.; Cai, Z.J.; Zhou, X.B. Spatial-Temporal Evolution and Obstacle Factors of the Disaster Resilience in the Central Plains Urban Agglomeration, China. Sustainability 2025, 17, 205. [Google Scholar] [CrossRef] [Scilit]
- Guo, X.; Cheng, J.; Yin, C.; Li, Q.; Chen, R.; Fang, J. The extraordinary Zhengzhou flood of 7/20, 2021: How extreme weather and human response compounding to the disaster. Cities 2023, 134, 104168. [Google Scholar] [CrossRef] [Scilit]
- Department of Water Resources of Anhui Province. Anhui Water Resources Bulletin (2016–2023); Department of Water Resources of Anhui Province: Hefei, China, 2024.
- Jincheng Water Affairs Bureau. Jincheng Water Resources Bulletin (2016–2023); Jincheng Water Affairs Bureau: Jincheng, China, 2024.
- Water Resources Department of Henan Province. Henan Water Resources Bulletin (2016–2023); Water Resources Department of Henan Province: Zhengzhou, China, 2024.
- Anhui Provincial Bureau of Statistics. Anhui Statistical Yearbook (2017–2024); China Statistics Press: Beijing, China, 2024.
- Henan Provincial Bureau of Statistics. Henan Statistical Yearbook (2017–2024); China Statistics Press: Beijing, China, 2024.
- Shanxi Provincial Bureau of Statistics. Shanxi Statistical Yearbook (2017–2024); China Statistics Press: Beijing, China, 2024.
- Hossain, M.I.; Biswas, S.; Mondal, M.S. Assessing flood risks in an urbanizing floodplain adjoining the megacity Dhaka in Bangladesh considering land use and socioeconomic changes. Discov. Geosci. 2026, 4, 186. [Google Scholar] [CrossRef] [Scilit]
- Nong, M.N.; Konishi, T.; Kumagae, T.; Amaguchi, H.; Imamura, Y. Dynamic Multi-Factor Flood Risk Assessment in Peri-Urban Areas: Integrating Migration, Exposure, and Community-Level Vulnerability and Capacity. Water 2026, 18, 1152. [Google Scholar] [CrossRef] [Scilit]
- Wang, L.H.; Cui, S.H.; Li, Y.Z.; Huang, H.J.; Manandhar, B.; Nitivattananon, V.; Fang, X.J.; Huang, W. A review of the flood management: From flood control to flood resilience. Heliyon 2022, 8, e11763. [Google Scholar] [CrossRef] [Scilit]
- Berndtsson, R.; Becker, P.; Persson, A.; Aspegren, H.; Haghighatafshar, S.; Jönsson, K.; Larsson, R.; Mobini, S.; Mottaghi, M.; Nilsson, J.; et al. Drivers of changing urban flood risk: A framework for action. J. Environ. Manag. 2019, 240, 47–56. [Google Scholar] [CrossRef] [Scilit]
- Xiao, Y.; Rao, X.; Chang, M.; Chen, L.; Huang, H. Assessment of urban flood resilience and obstacle factors identification: A case study of three major urban agglomerations in China. Ecol. Indic. 2025, 176, 113659. [Google Scholar] [CrossRef] [Scilit]
- Li, G.Y.; Liu, J.H.; Shao, W.W. Urban flood risk assessment under rapid urbanization in Zhengzhou City, China. Reg. Sustain. 2023, 4, 332–348. [Google Scholar] [CrossRef] [Scilit]
- Liu, W.; Feng, Q.; Liang, Y.W.; Cui, Y.Q.; Xu, L.; Engel, B.A. Exploring spatiotemporal dynamics of urban flood socioeconomic exposure risk and driving factors under future precipitation change and urbanization scenarios. J. Environ. Manag. 2025, 395, 127980. [Google Scholar] [CrossRef] [Scilit]
- Ji, J.; Chen, J.F. Urban flood resilience assessment using RAGA-PP and KL-TOPSIS model based on PSR framework: A case study of Jiangsu province, China. Water Sci. Technol. 2022, 86, 3264–3280. [Google Scholar] [CrossRef] [Scilit]
- Tian, R.; Tian, B.; Li, S.; Adhikari, B.R.; Wang, L.; Luo, X.; Xie, W.; Balikuddembe, J.K. Long-Term Assessment of Urban Flood Resilience and Identification of Obstacles: A Case Study of Sichuan, China (2011–2023). Land 2026, 15, 614. [Google Scholar] [CrossRef] [Scilit]
- Liao, R.T.; Xu, Z.X. Urban Pluvial Flood Resilience Under Extreme Rainfall Events: A High-Resolution, Process-Based Assessment Framework. Sustainability 2026, 18, 3732. [Google Scholar] [CrossRef] [Scilit]
- Preisser, M.; Passalacqua, P. Socio-Hydrology Modeling Captures How Inequalities Impact Community Flood Resilience. Water Resour. Res. 2026, 62, e2025WR041393. [Google Scholar] [CrossRef] [Scilit]
- Thanvisitthpon, N.; Shrestha, S.; Pal, I.; Ninsawat, S.; Chaowiwat, W. Assessment of flood adaptive capacity of urban areas in Thailand. Environ. Impact Assess. Rev. 2020, 81, 106363. [Google Scholar] [CrossRef] [Scilit]
- Xu, W.P.; Cai, X.Y.; Yu, Q.M.; Proverbs, D.; Xia, T. Modelling Trends in Urban Flood Resilience towards Improving the Adaptability of Cities. Water 2024, 16, 1614. [Google Scholar] [CrossRef] [Scilit]
- Wang, P.; Zhu, Y.F.; Yu, P. Assessment of Urban Flood Vulnerability Using the Integrated Framework and Process Analysis: A Case from Nanjing, China. Int. J. Environ. Res. Public Health 2022, 19, 16595. [Google Scholar] [CrossRef] [Scilit]
- Zhang, J.; Yuan, J.; Wang, Y. Spatio-temporal evolution and influencing factors of coupling coordination between urban resilience and high-quality development in Yangtze River Delta Area, China. Front. Environ. Sci. 2023, 11, 1174875. [Google Scholar] [CrossRef] [Scilit]
- Sun, N.; Li, C.L.; Guo, B.Y.; Sun, X.K.; Yao, Y.K.; Wang, Y. Urban flooding risk assessment based on FAHP-EWM combination weighting: A case study of Beijing. Geomat. Nat. Hazards Risk 2023, 14, 2240943. [Google Scholar] [CrossRef] [Scilit]
- Yang, C.X.; Jin, Z.G.; Yin, H. Assessment and evolution analysis of urban infrastructure resilience under flood disaster scenarios based on the PSR model and extension catastrophe progression. Sci. Rep. 2025, 15, 36863. [Google Scholar] [CrossRef] [Scilit]
- Han, S.; Wang, B.; Ao, Y.B.; Bahmani, H.; Chai, B.B. The coupling and coordination degree of urban resilience system: A case study of the Chengdu-Chongqing urban agglomeration. Environ. Impact Assess. Rev. 2023, 101, 36863. [Google Scholar] [CrossRef] [Scilit]
- Sun, J.; Zhai, N.N.; Mu, H.R.; Miao, J.C.; Li, W.X.; Li, M.F. Assessment of urban resilience and subsystem coupling coordination in the Beijing-Tianjin-Hebei urban agglomeration. Sustain. Cities Soc. 2024, 100, 105058. [Google Scholar] [CrossRef] [Scilit]
- Zhu, S.Y.; Feng, H.B.; Arashpour, M.; Zhang, F. Enhancing urban flood resilience: A coupling coordinated evaluation and geographical factor analysis under SES-PSR framework. Int. J. Disaster Risk Reduct. 2024, 101, 104243. [Google Scholar] [CrossRef] [Scilit]
- Li, P.F.; Tan, S.Z.; Xue, Y.; Li, W.; Liang, J.L. Multiple driving patterns for the coordinated development of urbanization and flood disasters from a configuration perspective: A dynamic QCA approach. Sustain. Cities Soc. 2026, 148, 107590. [Google Scholar] [CrossRef] [Scilit]
- An, B.; Li, C.; Li, X.; Xu, P. Coupling Coordination Degree and Spatial Evolution Characteristics of New Quality Productive Forces and Economic Resilience. Stat. Decis. 2026, 42, 106–111. [Google Scholar] [CrossRef]
- Zhou, Z.H.; Li, H.T.; Li, J.; Lu, Y.W.; Gao, C.; Yang, D.C. Human-Land Coupling Relationship in Lushan National Park and Its Surrounding Areas: From an Integrated Ecological and Social Perspective. Land 2024, 13, 1240. [Google Scholar] [CrossRef] [Scilit]
- Zhu, X.W.; Ye, J.M.; Zhu, M.M.; Gao, Z.; Li, M.M.; Wang, M.; Li, Y.B. The Evolution Relationship Between Intensive Land Use and Land Ecological Security in the Urban Agglomeration in the Northern Slope of the Tianshan Mountains, Northwest China. Land 2024, 13, 2226. [Google Scholar] [CrossRef] [Scilit]
- Liu, L.; Wang, H.Q.; Li, J.X. Spatiotemporal Variation and Network Correlation Analysis of Flood Resilience in the Central Plains Urban Agglomeration Based on the DRIRA Model. ISPRS Int. J. Geo-Inf. 2025, 14, 394. [Google Scholar] [CrossRef] [Scilit]
- Li, P.F.; Tan, S.Z.; Li, W.; Xue, Y.; Liang, J.L.; Wang, M.X. Multiple driving pathways for the coupled and coordinated development of urbanization and flood disasters: A time differencing qualitative comparative analysis. Urban Clim. 2025, 64, 102673. [Google Scholar] [CrossRef] [Scilit]
- Zhao, K.; Xu, X.; Xue, M.; Tan, Z.-M.; Huang, H.; Zhou, A.; Fan, X.; Liu, Q.; Wang, C.; Fang, J.; et al. The Dynamics and Microphysical Characteristics of the Convection Producing the Record-Breaking Hourly Precipitation on 20 July 2021 in Zhengzhou, China. Remote Sens. 2023, 15, 4511. [Google Scholar] [CrossRef] [Scilit]

Disclaimer/Publisher’s Note: The statements, opinions and data contained in all publications are solely those of the individual author(s) and contributor(s) and not of MDPI and/or the editor(s). MDPI and/or the editor(s) disclaim responsibility for any injury to people or property resulting from any ideas, methods, instructions or products referred to in the content. |
© 2026 by the authors. Licensee MDPI, Basel, Switzerland. This article is an open access article distributed under the terms and conditions of the Creative Commons Attribution (CC BY) license.