


Abstract
Repeated sowing of winter cereals represents one of the adaptive dryland approaches to make more sustainable the rainfed agriculture activities in southern Kazakhstan. This study conducted a multi-year reconstruction of crop transitions using Sentinel-2 imagery for 2018–2025, based on the combined analysis of Normalized Difference Vegetation Index (NDVI) temporal profiles and the Plowed Land Index (PLI), enabling the creation of a field-level harmonized classification set. The transition “spring crop → winter crop” was used as a formal indicator of repeated winter sowing, from which annual repeat layers and an integrated metric, the R-index, were derived. The results revealed a pronounced spatial concentration of repeated sowing in foothill landscapes, where terrain heterogeneity and locally elevated moisture availability promote the recurrent return of winter cereals. Comparison of NDVI composites for the peak spring biomass period (1–20 May) showed a systematic decline in NDVI with increasing R-index, indicating the cumulative effect of repeated soil exploitation and the sensitivity of winter crops to climatic constraints. Precipitation analysis for 2017–2024 confirmed the strong influence of autumn moisture conditions on repetition phases, particularly in years with extreme rainfall anomalies. These findings demonstrate the importance of integrating multi-year satellite observations with climatic indicators for monitoring the resilience of agricultural systems. The identified patterns highlight the necessity of implementing nature-based solutions, including contour–strip land management and the development of protective shelterbelts, to enhance soil moisture retention and improve the stability of regional agricultural landscapes.
1. Introduction
Repeated winter cereal sowing refers to the re-establishment of winter cereals on fields that were occupied by spring crops in the preceding growing season. In rainfed agroecosystems, this practice emerges as a management response to interannual variability in precipitation, soil moisture availability, and timing of field operations, rather than as a predefined component of crop rotation schemes. Depending on environmental and agronomic conditions, repeated winter sowing may contribute either to short-term stabilization of production or to increased pressure on soil resources [1,2].
From an agronomic perspective, repeated winter sowing is associated with several potential consequences. Shortened rotation intervals may lead to soil compaction, reduced soil moisture retention, and increased vulnerability to erosion, particularly under conditions of intensive autumn tillage. At the same time, delayed sowing dates and uneven emergence following spring crops can negatively affect early biomass development and yield formation of winter cereals. These effects are expected to be especially pronounced in foothill environments, where complex relief, shallow soils, and heterogeneous moisture regimes amplify the sensitivity of agroecosystems to repeated soil disturbance [3,4].
Remote sensing data provide a unique opportunity to investigate repeated winter sowing as a spatially explicit and multi-year phenomenon. Sentinel-2 imagery offers an optimal combination of spatial resolution, revisit frequency, and spectral information for reconstructing crop development trajectories at the field scale [5,6]. Time series of the Normalized Difference Vegetation Index (NDVI) enable the characterization of crop phenology, while complementary indicators sensitive to soil surface disturbance, such as the Plowed Land Index (PLI), allow differentiation between autumn and spring tillage practices [7,8,9,10]. Together, these datasets support the construction of consistent multi-year crop classification products suitable for analyzing interannual transitions between crop types [11,12,13,14,15].
Previous studies using Sentinel-2 data in Turkey, Iran, Spain and Central Asia have demonstrated the potential of multi-temporal NDVI and phenology-based approaches for mapping cropping patterns and rotation systems. However, most of these studies focused either on single-year crop mapping or on irrigated and semi-irrigated systems, often relying on statistical or machine-learning classifiers that are sensitive to training data availability and interannual spectral variability. Moreover, limited attention has been given to the explicit identification of transition pathways such as “spring crop → winter cereal,” particularly in rainfed foothill regions characterized by high spatial heterogeneity [16,17,18,19,20,21,22].
In the context of Kazakhstan, existing remote sensing studies have primarily addressed crop distribution, land abandonment, or within-year crop condition assessment. Quantitative analysis of repeated winter cereal sowing, its spatial structure, and its potential implications for land-use sustainability in foothill zones has not been previously conducted. As a result, current methodologies provide limited insight into the long-term pressure exerted by repeated sowing practices on rainfed agro-landscapes [23,24,25].
The Kazygurt district of Turkestan region represents a highly representative foothill–plain agricultural system for southern Kazakhstan. The district ranks second in the region in terms of winter cereal cultivation area (approximately 45,826 ha), accounting for nearly one-fifth of the total winter cereal area of Turkestan region. Unlike many other districts, where winter cereals are confined mainly to either plains or mountainous areas, Kazygurt exhibits a balanced distribution of winter crops across both plain and foothill landscapes. This combination of substantial agricultural importance and pronounced environmental heterogeneity makes the district particularly suitable for analyzing interannual crop transitions and repeated winter cereal sowing under rainfed conditions [26].
In this study, repeated winter cereal sowing is examined as a land-use phenomenon rather than being assumed a priori as beneficial or detrimental. Using a multi-year (2018–2025) Sentinel-2–based classification dataset, interannual transitions from spring crops to winter cereals were reconstructed at the field level. An integrated indicator (R-index) was developed to quantify the frequency of repeated winter sowing, enabling analysis of its temporal dynamics, spatial distribution, and relationship with spring vegetation condition. By explicitly linking crop transitions with NDVI-based indicators and landscape context, this study addresses key limitations of previous approaches and provides a framework for evaluating repeated sowing practices in rainfed foothill agroecosystems.
2. Materials and Methods
2.1. Study Area
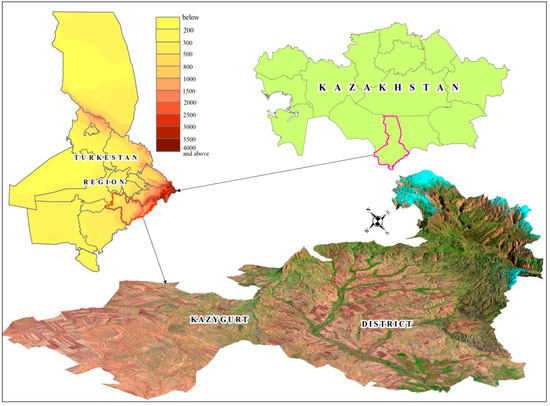
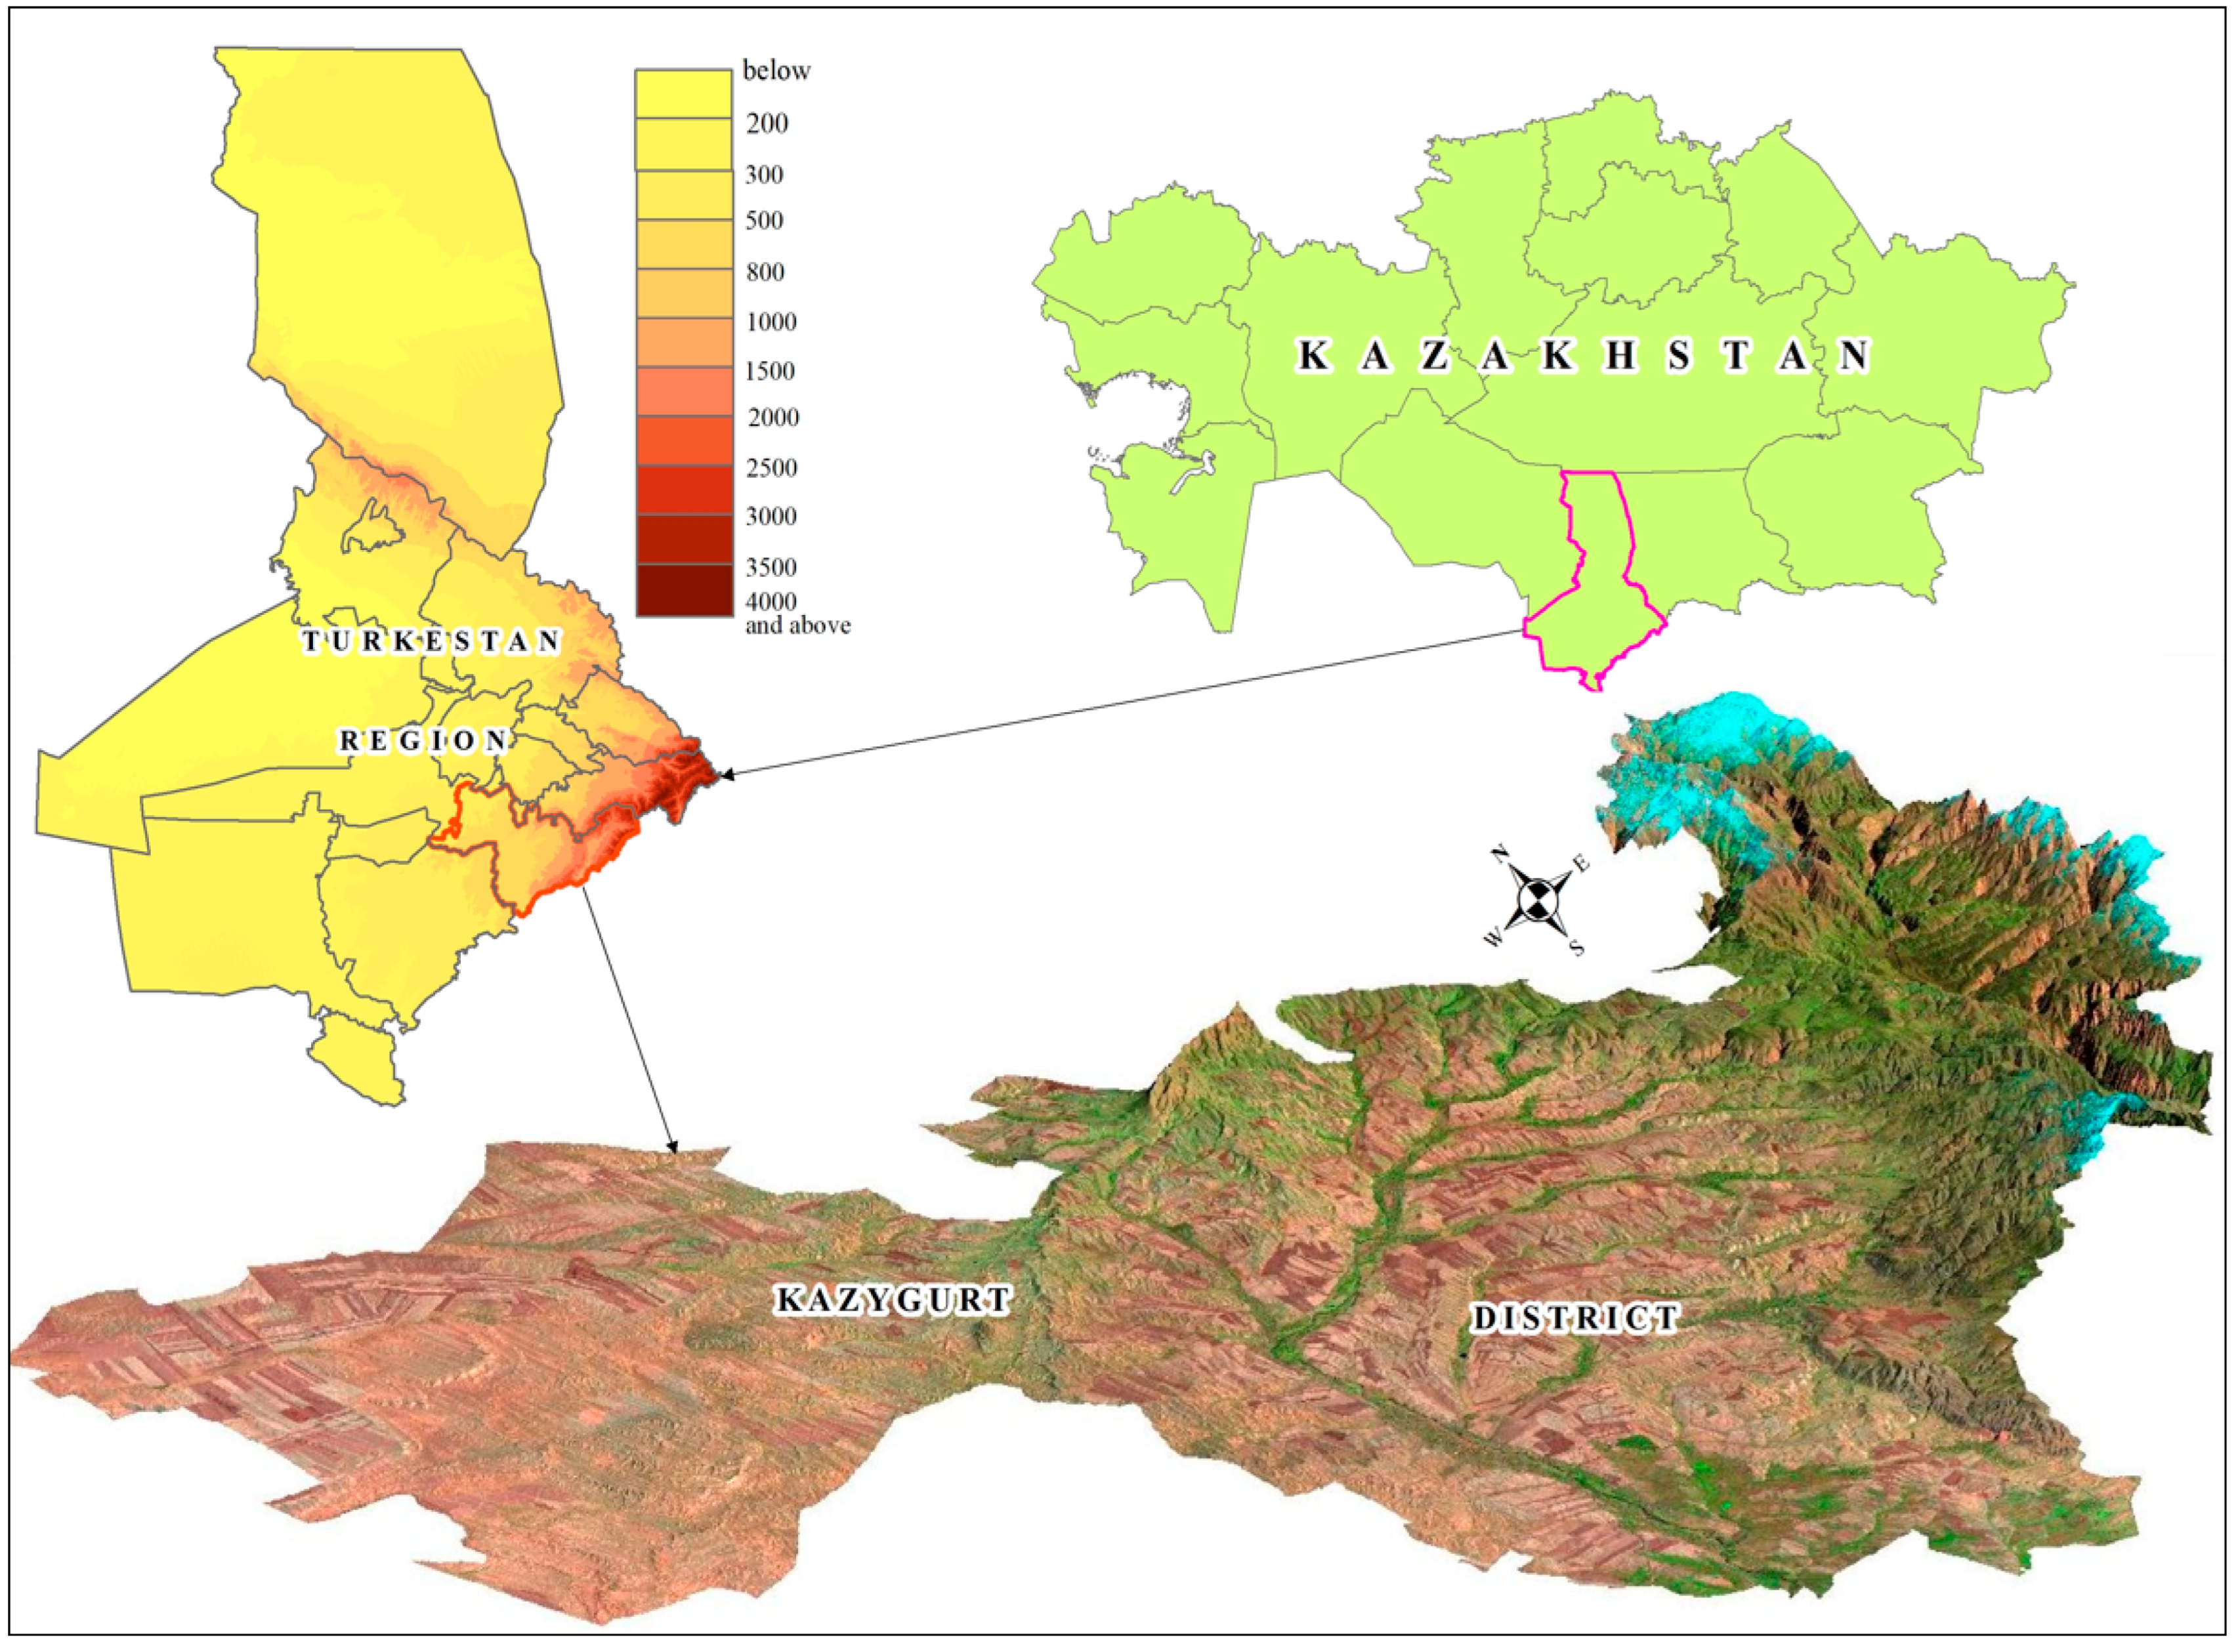
The Kazygurt district is in the southern part of the Turkestan region and represents a typical rainfed agro-landscape of the foothill–plain zone. The district extends approximately between 41.35°–42.15° N and 68.50°–70.20° E, covering an area of about 4.0 thousand km2. Its southern and southeastern parts adjoin the northern spurs of the Ugam and Maidantal ranges, forming a pronounced combination of foothills and open plains (Figure 1).
Figure 1.
Boundary of the Kazygurt district, Turkestan region.
The climate of the Kazygurt district is sharply continental and was characterized using long-term meteorological observations from the Kazygurt weather station (rp5.kz), which is representative of the study area. The mean annual precipitation ranges from 350 to 420 mm, with approximately 60–65% of the total occurring during the cold season (November–March) and early spring. The summer period is marked by very limited rainfall (less than 40–60 mm during June–August), which enhances aridity and increases the dependence of rainfed agriculture on soil moisture accumulated during the autumn–winter period.
The thermal regime is characterized by a relatively mild autumn with gradual cooling (mean monthly temperatures decreasing from approximately +22 °C in September to +7 °C in November), providing favorable conditions for winter cereal emergence. Spring arrives early, with mean temperatures ranging from +8 °C to +16 °C in March–April, supporting rapid resumption of winter crop vegetation and early tillering [27].
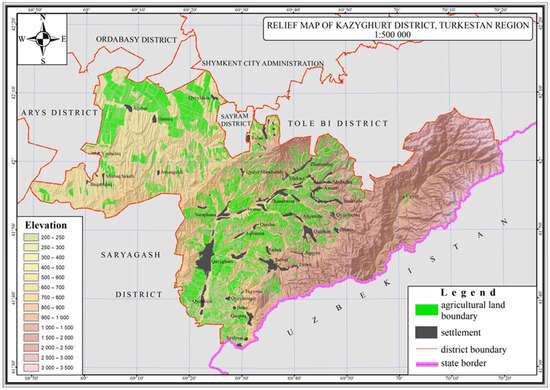
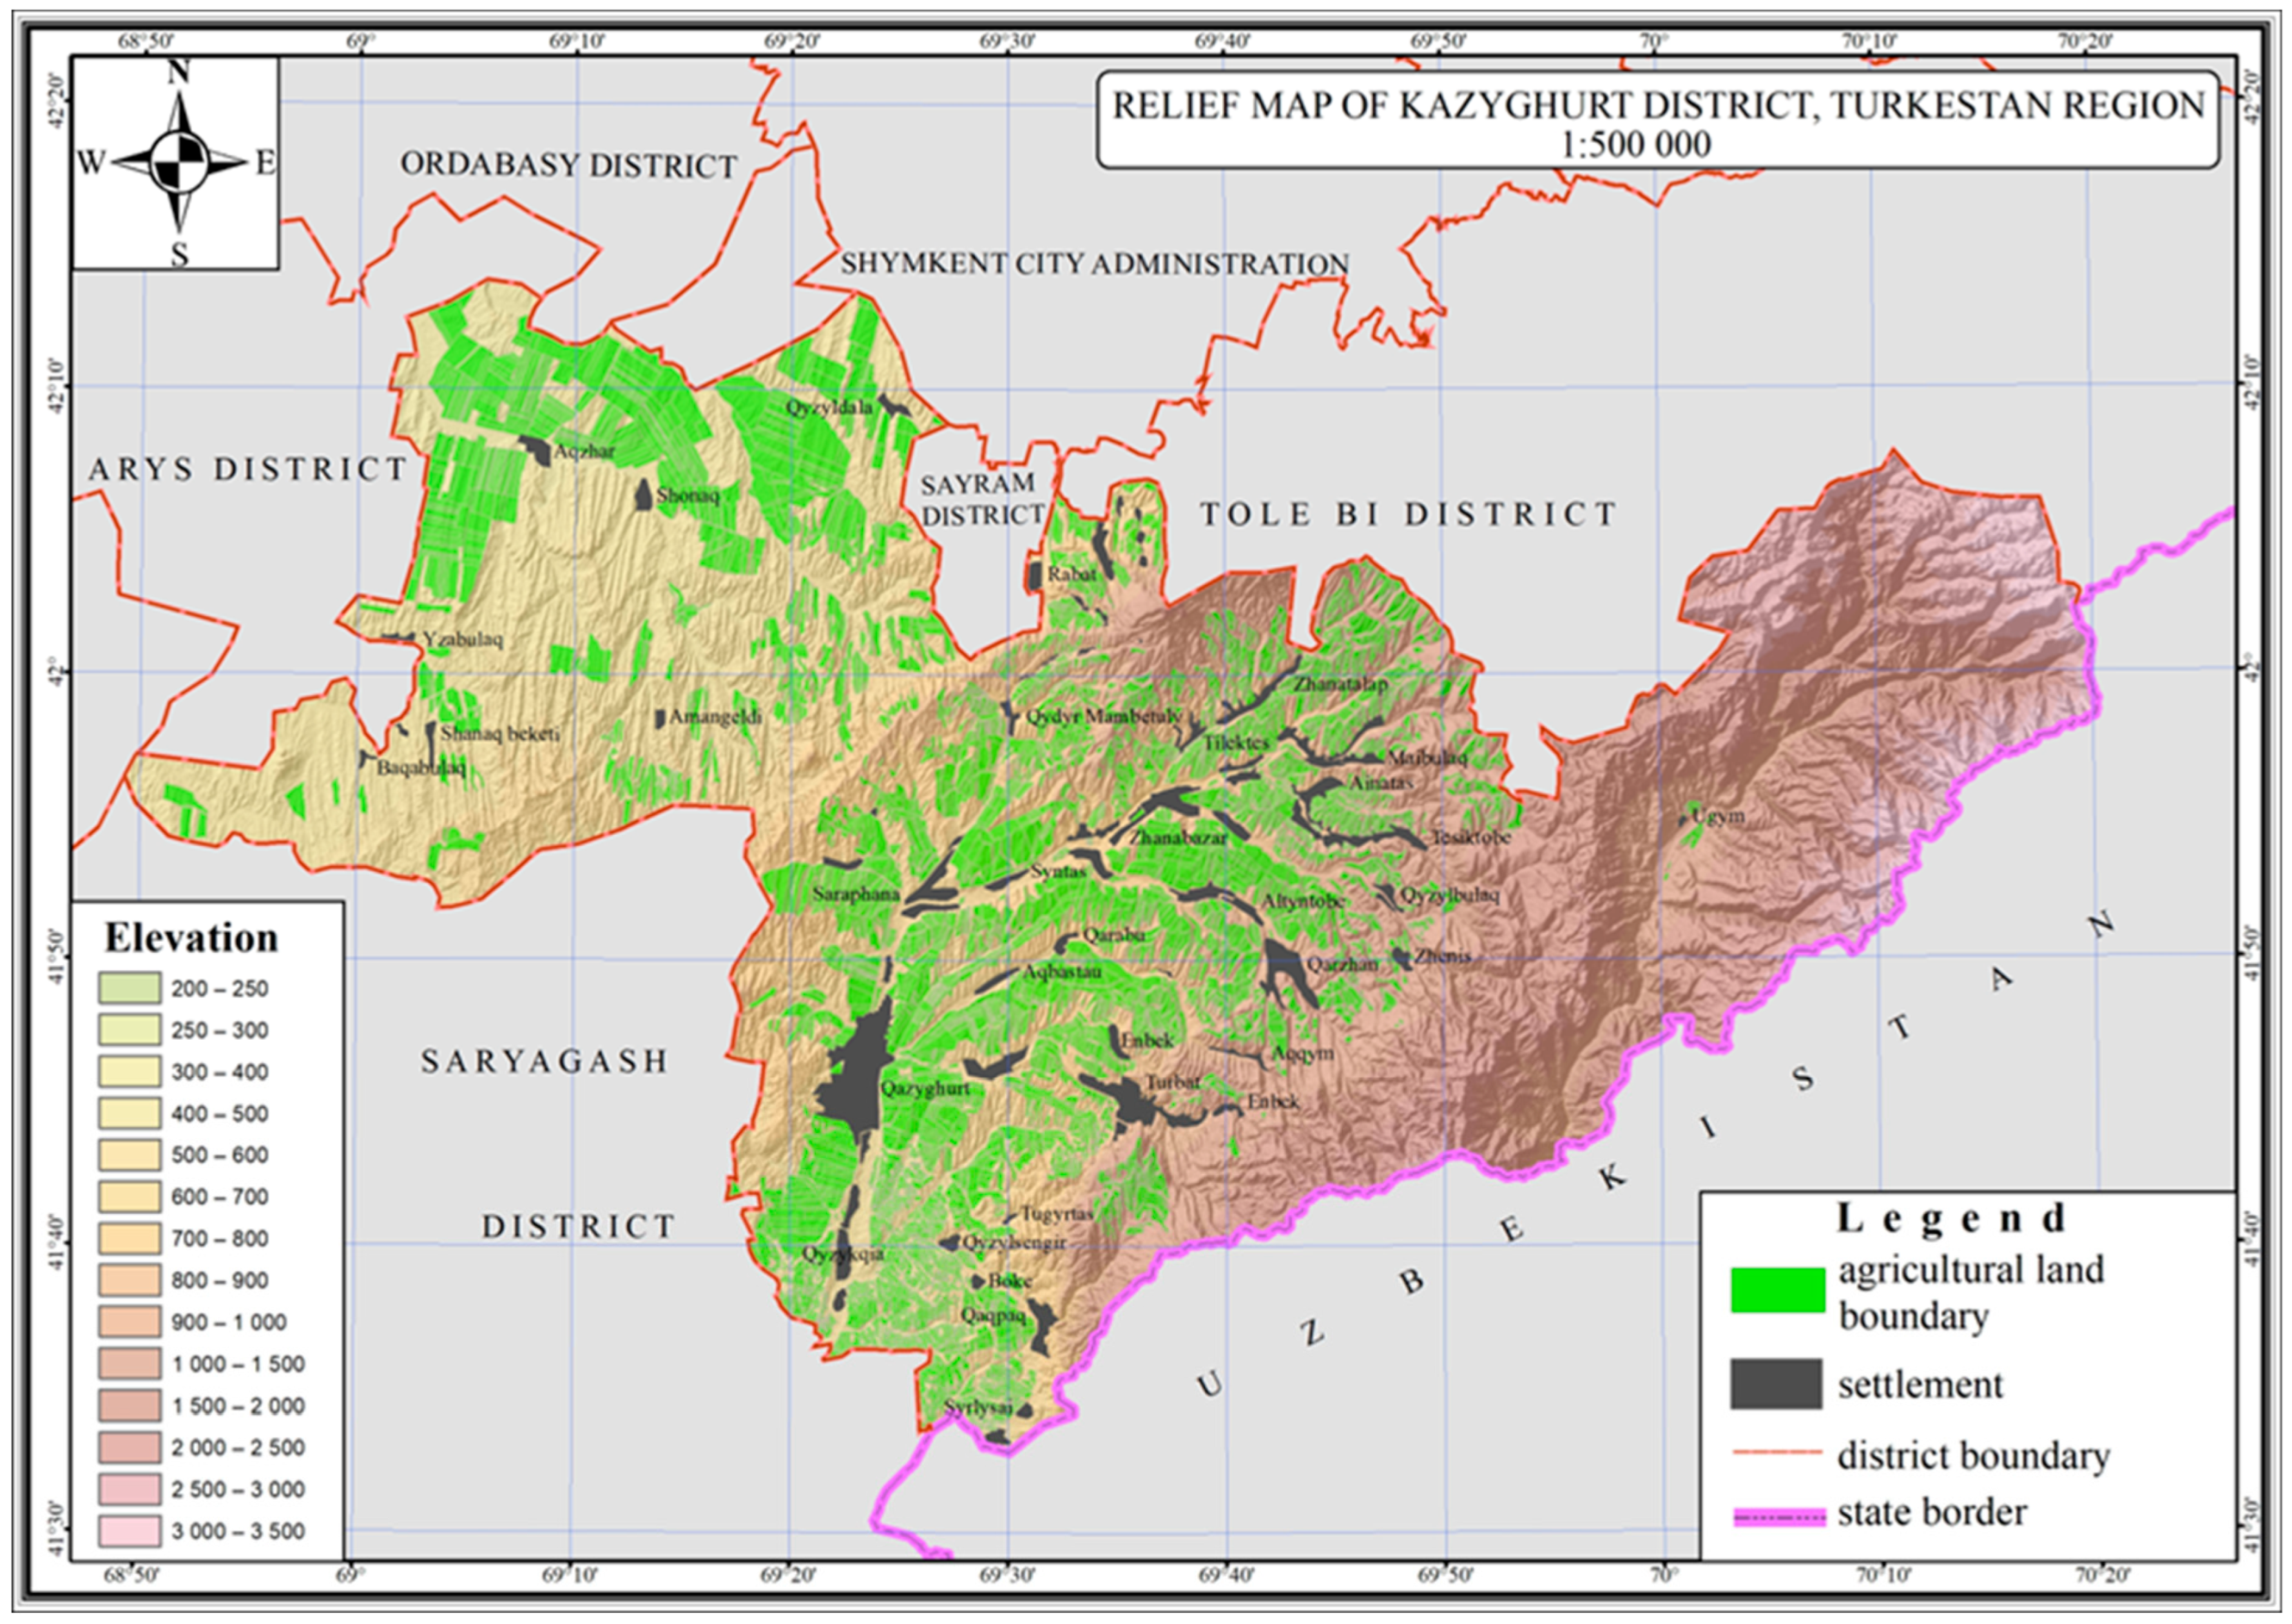
The relief comprises two structurally distinct zones. The foothill areas are characterized by alternating slopes of varying steepness, local drainage hollows, and elevated soil stoniness. The plain part consists predominantly of leveled surfaces with moderate inclination towards major dry channels. The soil cover includes a complex of light chestnut, grey-chestnut, and sierozem soils, suitable for rainfed agriculture given sufficient accumulation of winter–spring moisture. In certain foothill loci, inclusions of gravelly and weakly eroded horizons are present [28] (Figure 2).
Figure 2.
Relief map of Kazygurt district, Turkestan region.
The agricultural structure of the district comprises several major crop groups. Winter cereals, spring cereals, and safflower form the core of annual field agriculture. Winter and spring crops are cultivated across both plain and foothill zones. Safflower is predominantly concentrated in the foothill areas, where its biological characteristics align with higher temperatures and the presence of loamy, often stony soils. In addition to annual crops, perennial forages—primarily alfalfa—play an important role and are distributed across the same terrain zones, except for high-altitude sites. These crops support the stability of the fodder base and influence the long-term dynamics of crop rotations (Table 1) [29].
Table 1.
Share of sown areas of winter cereals, spring cereals, and safflower in foothill and plain zones, % (Kazygurt District).
The relevance of studying repeated winter sowing is driven by two key factors. First, irregular autumn precipitation results in some fields not being sown within optimal timeframes after initial soil preparation; land users then compensate either by planting spring crops or by reintroducing winter cereals in the following season. Second, intensive use of rainfed lands under limited crop rotation fosters a persistent practice of returning winter crops to the same fields, especially in foothill environments where soils retain moisture for longer periods. This combination of climatic and management factors makes the Kazygurt district a representative model for analyzing long-term patterns of repeated winter sowing across the broader territory of southern Kazakhstan.
2.2. Dataset
2.2.1. Sentinel-2 Imagery
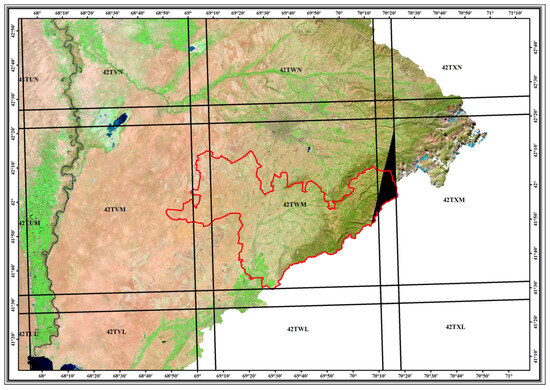
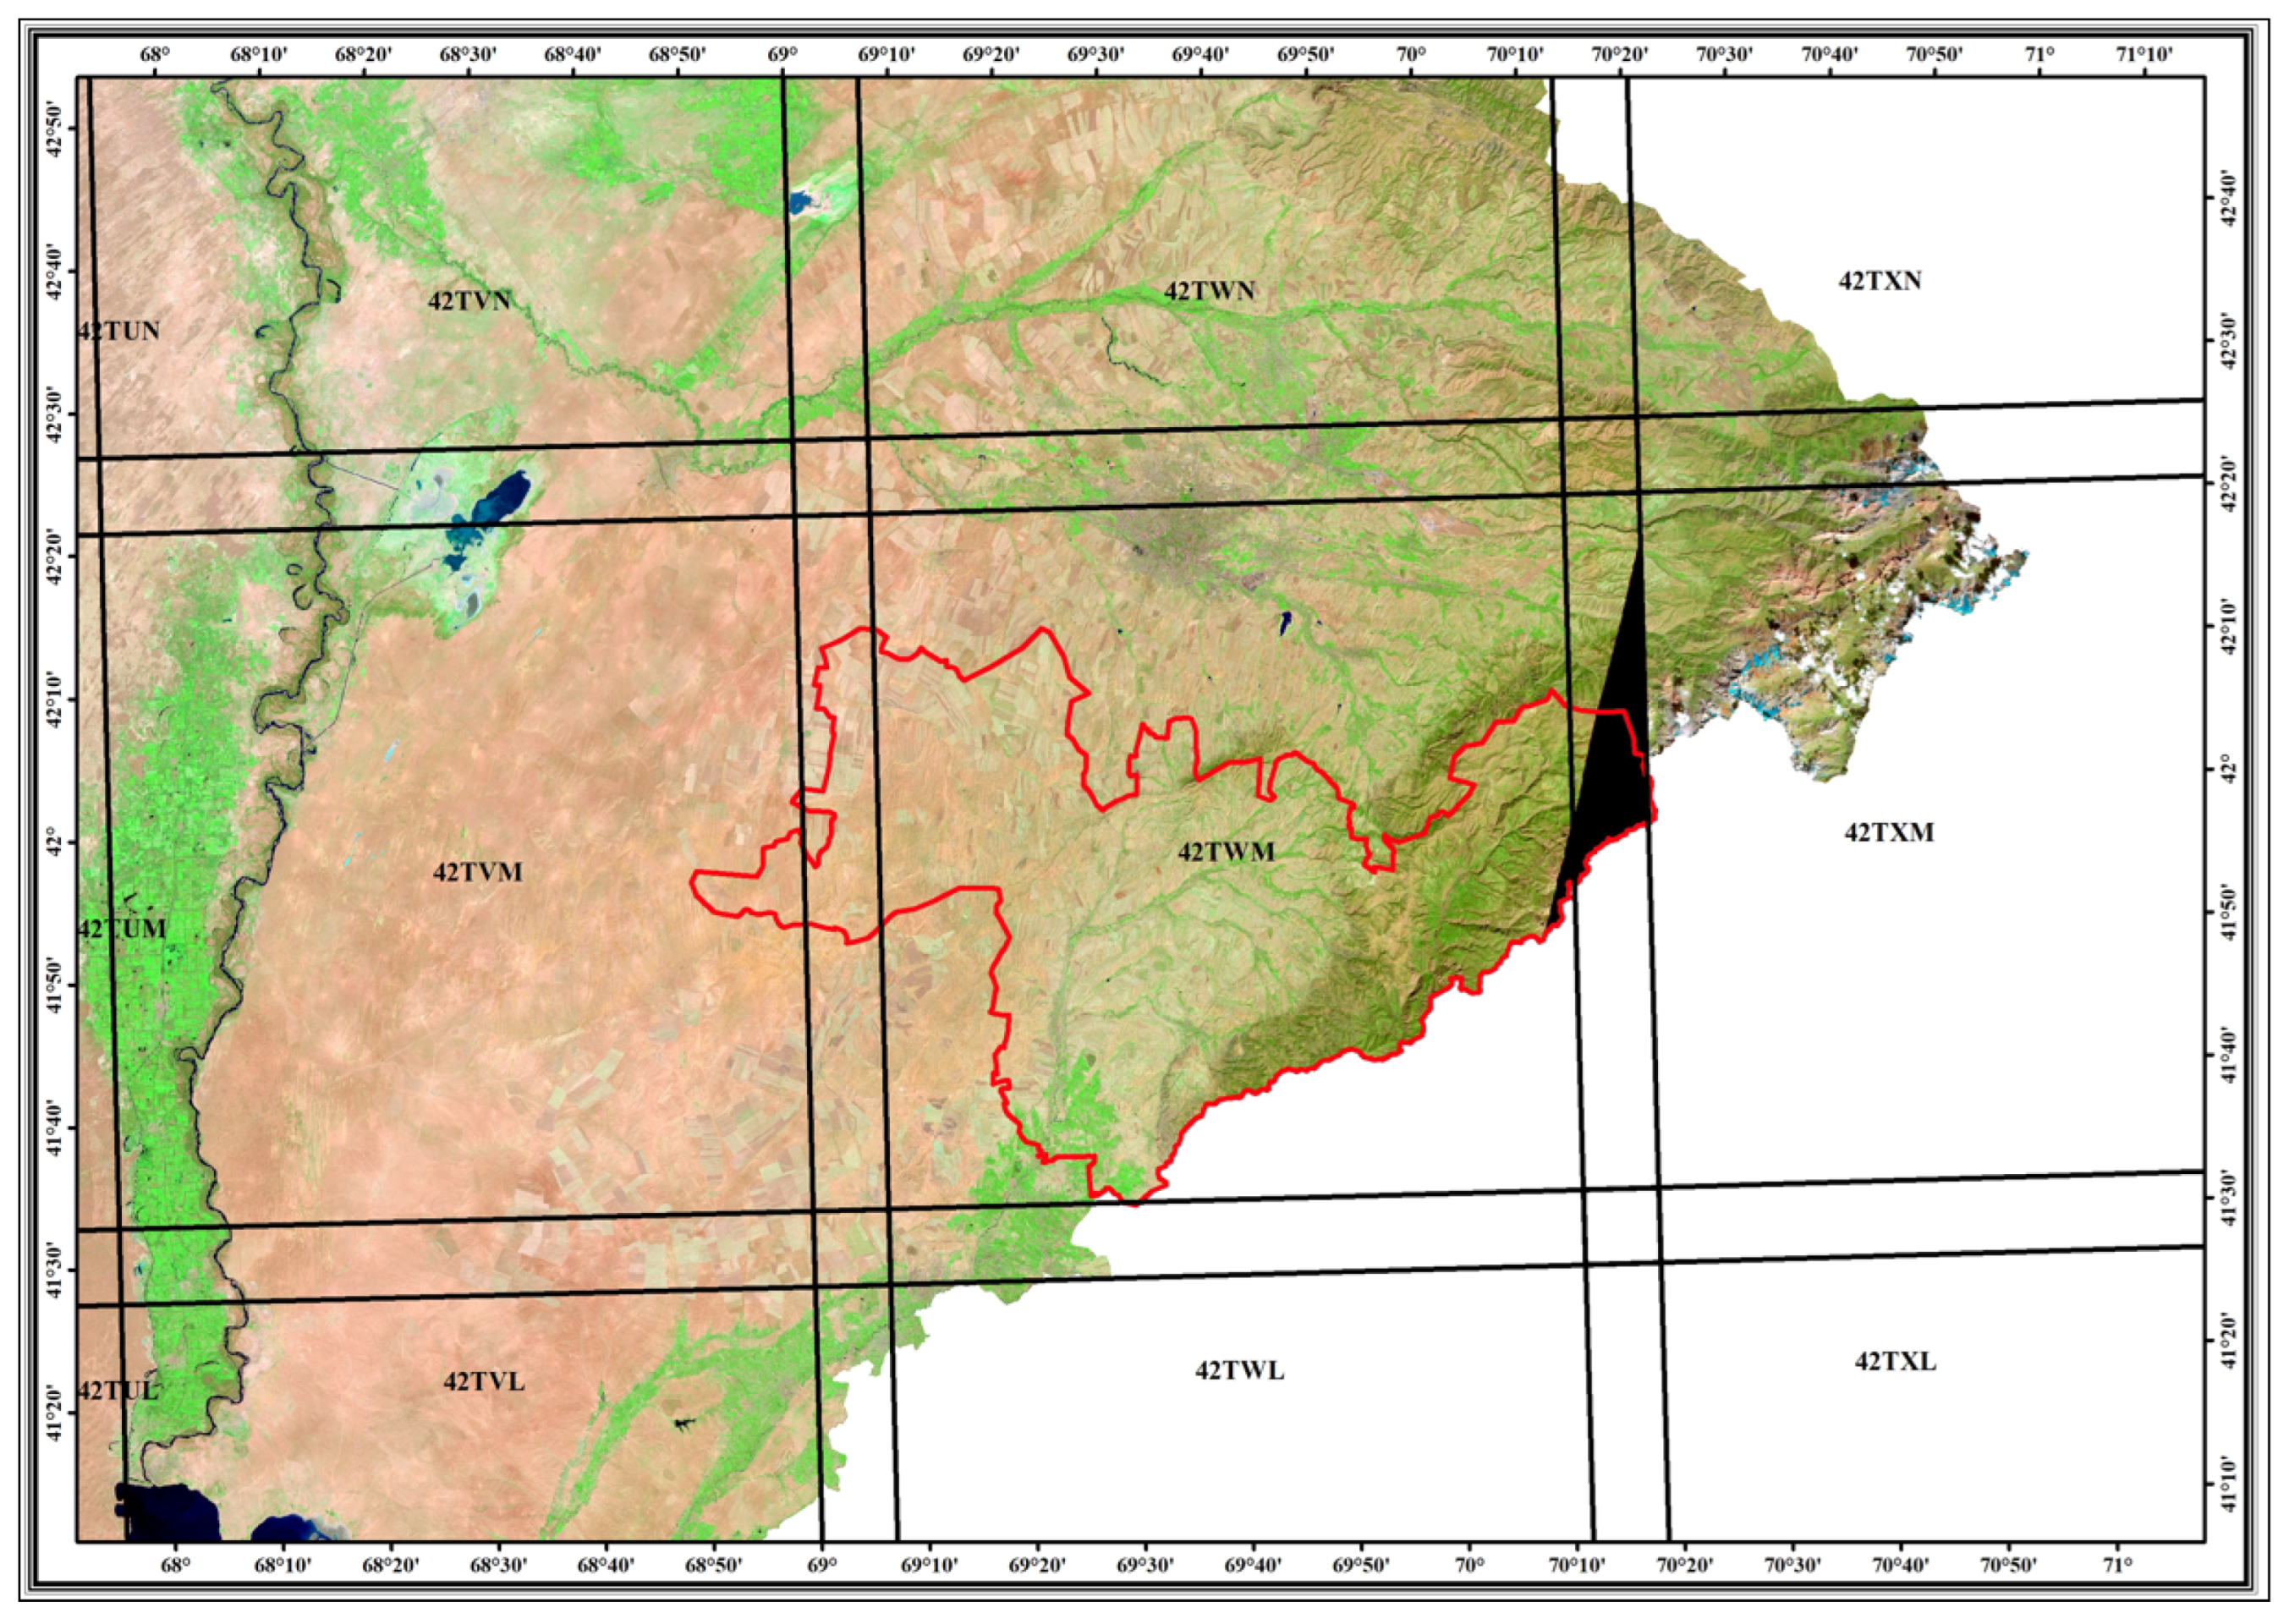
The study employed Sentinel-2 MSI Level-2A data containing bottom-of-atmosphere (BOA) surface reflectance. The spatial coverage of the Kazygurt district is provided by two tiles: 42TWM, which covers approximately 97–98% of the territory, and 42TVM, which accounts for the remaining 2–3% (Table 2, Figure 3).
Table 2.
Sentinel-2 imagery used in the study (Kazygurt District).
Figure 3.
Sentinel-2 tile coverage of the Kazygurt district. Sentinel-2 SWIR2–NIR–Red composite used as background imagery.
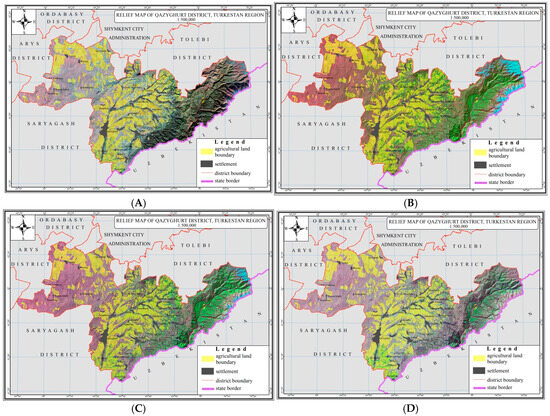
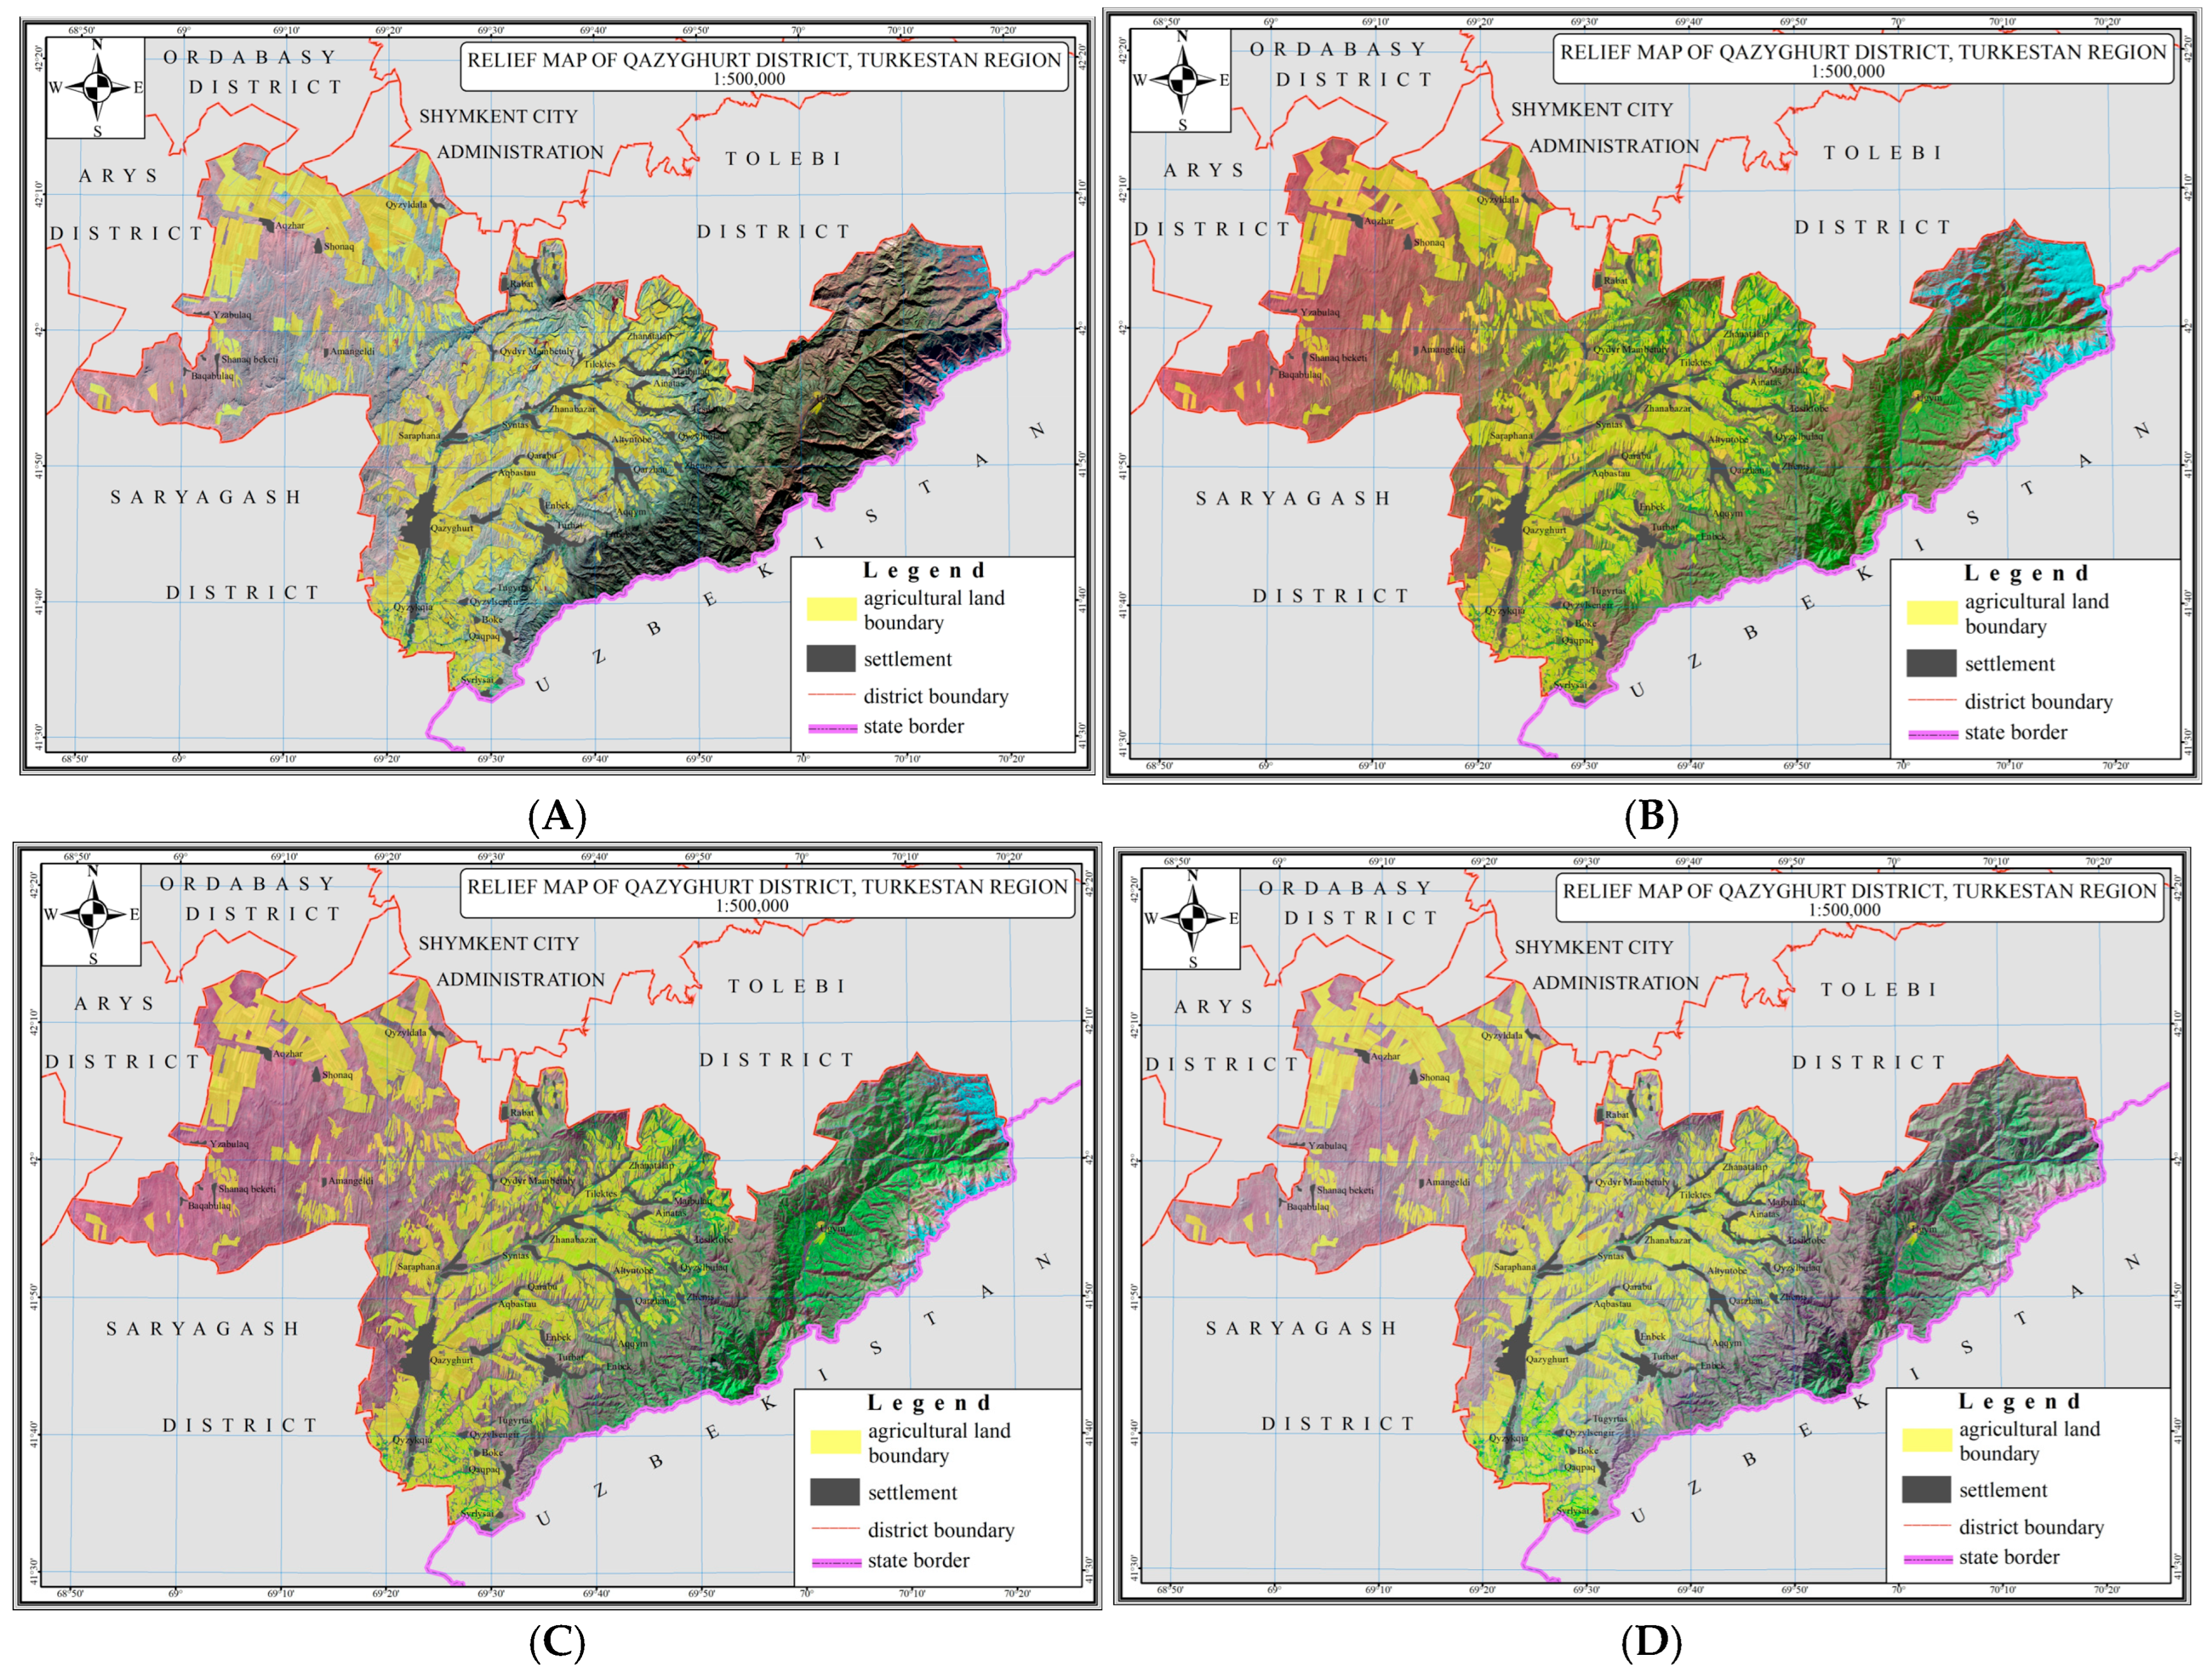
A small triangular fragment in the northeastern part of the Kazyugurt district is not covered by the selected Sentinel-2 tiles (Figure 3). Sentinel-2 is a European Copernicus Satellite mission program [30]. This area represents a marginal portion of the administrative boundary and does not include agricultural fields involved in winter or spring crop production. The main cropland areas of the district are located in the central and western parts, which are fully covered by Sentinel-2 imagery for the entire study period. Consequently, the uncovered fragment does not affect the spatial analysis, crop classification results, or the assessment of repeated winter cereal sowing. The spectral dataset includes 13 bands with spatial resolutions of 10, 20, and 60 m. The analysis employed visible bands (Blue, Green, Red), the near-infrared band (NIR), red-edge bands, and the shortwave infrared ranges (SWIR1, SWIR2). For visual interpretation and examination of the spatial structure of the agro-landscape, the standard SWIR2–NIR–RED composite was used, which enables clear discrimination between soil, vegetation, and terrain structure (Figure 4) [31,32].
Figure 4.
Sentinel-2 composites in SWIR2–NIR–RED for different phenological periods of the Kazygurt district: (A)—5 November 2023; (B)—24 May 2024; (C)—18 June 2024; (D)—12 August 2024.
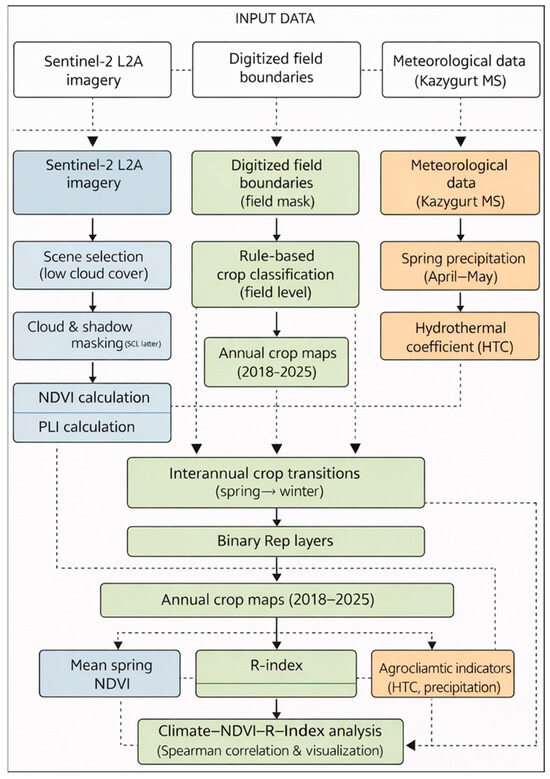
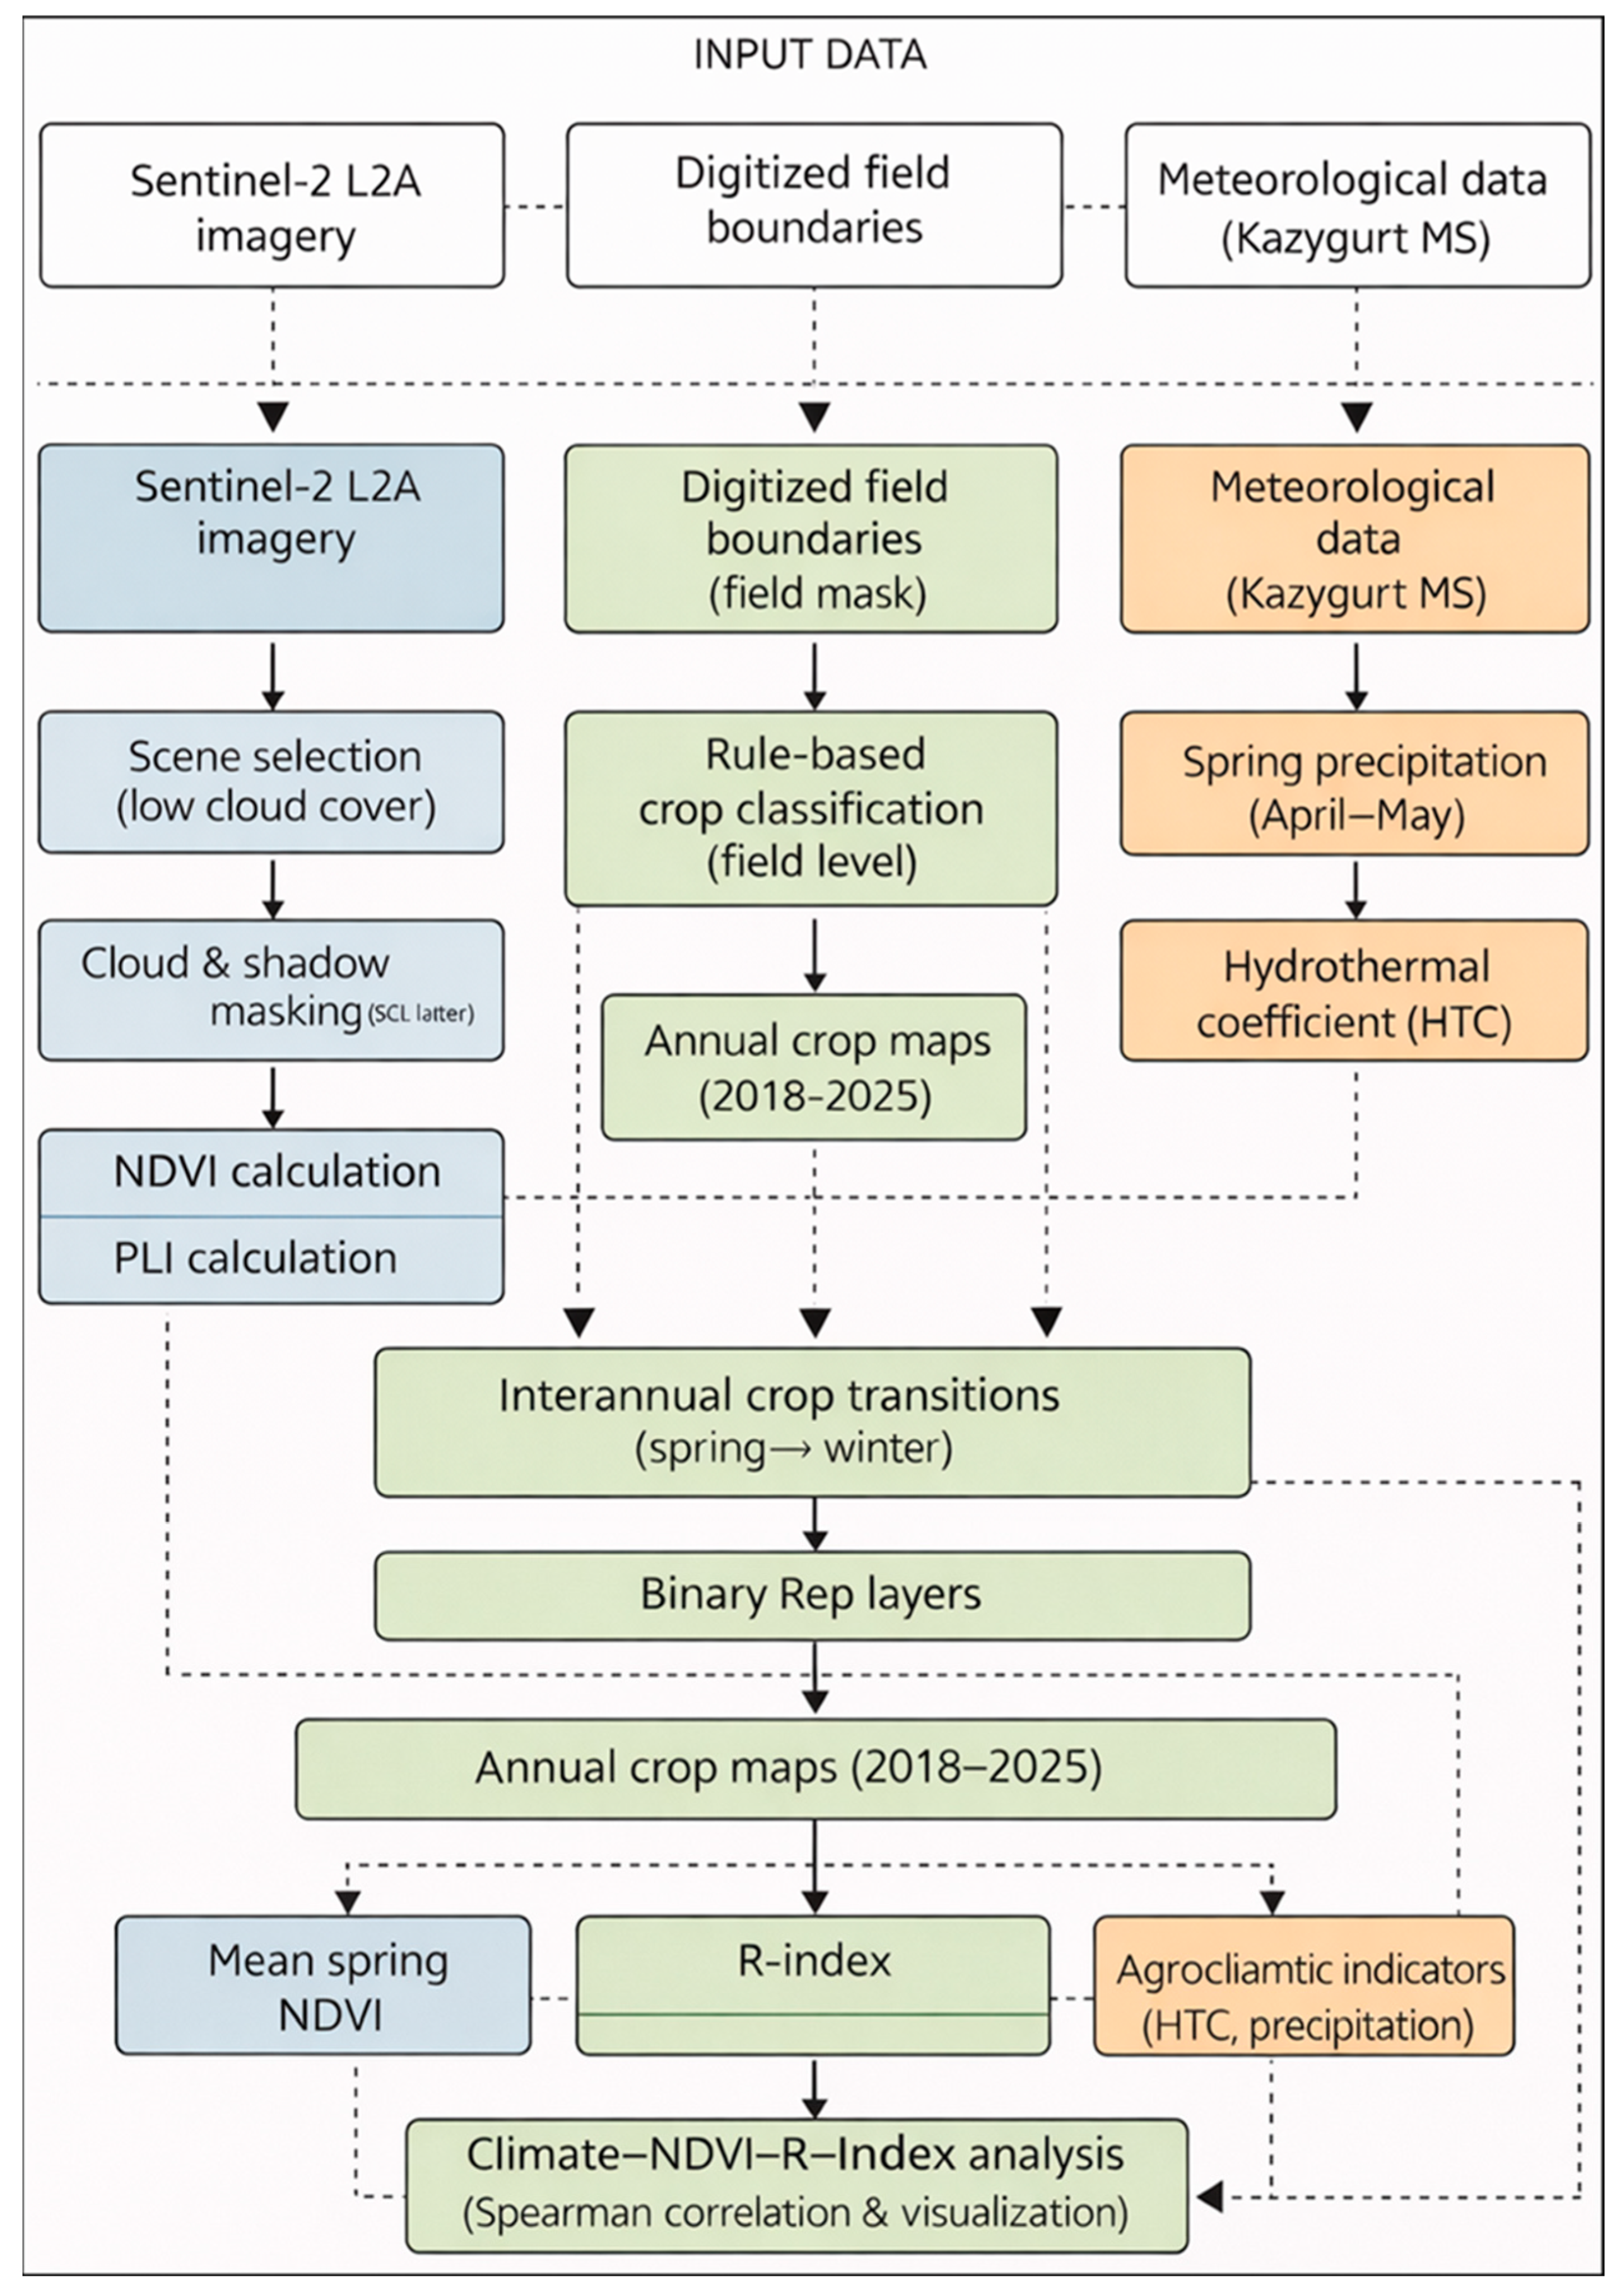
The image dataset was compiled within two seasonal intervals determined by the phenology of winter crops: 1 September–30 November for analyzing autumn sowing and early emergence, and 20 March–30 June for capturing spring vegetation recovery and peak NDVI. For each year in the 2018–2025 period, scenes with minimal cloud cover were selected. The preprocessing included cloud and shadow masking based on the Scene Classification Layer (SCL) of Sentinel-2 Level-2A products [32]. Pixels classified as clouds, cirrus clouds, cloud shadows, and no-data were excluded from the analysis. The SWIR bands (B11 and B12) were resampled from a spatial resolution of 20 m to 10 m using bilinear interpolation in the ArcGIS Pro 3.0 (Esri) environment. This approach ensured spectral consistency of the data for index calculations and improved the comparability of interannual observations under conditions of high heterogeneity in foothill agricultural landscapes (Figure 5).
Figure 5.
Methodological framework of the study illustrating the integration of Sentinel-2 remote sensing data, field-level crop classification, and agroclimatic indicators for the analysis of repeated winter cereal sowing and its relationship with climatic conditions.
2.2.2. Multi-Year Crop Classification Dataset
The multi-year classification dataset was developed based on the methodology presented in Arystanov et al. [25], where an automated algorithm for delineating major rainfed crops using Sentinel-2 data was introduced. The core of the algorithm is the analysis of NDVI time series calculated as 3–5-day composites, generated by averaging all available cloud-free observations within each temporal window. This approach reduces atmospheric noise and yields stable phenological profiles of vegetation.
To detect seasonal soil tillage, the PLI was used, derived from the Tasseled Cap brightness component [24]. The index is a linear combination of six Sentinel-2 bands (B2, B3, B4, B8, B11, B12) with optimized weighting coefficients:
PLI = −0.0037 × B2 − 0.1793 × B3 + 0.5403 × B4 − 0.5585 × B8 − 0.1082 × B11 + 0.3013 × B12
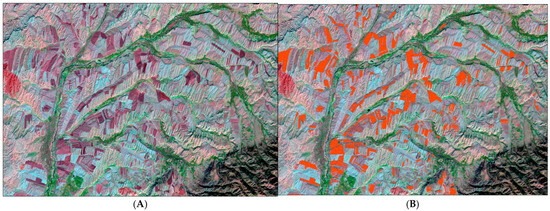
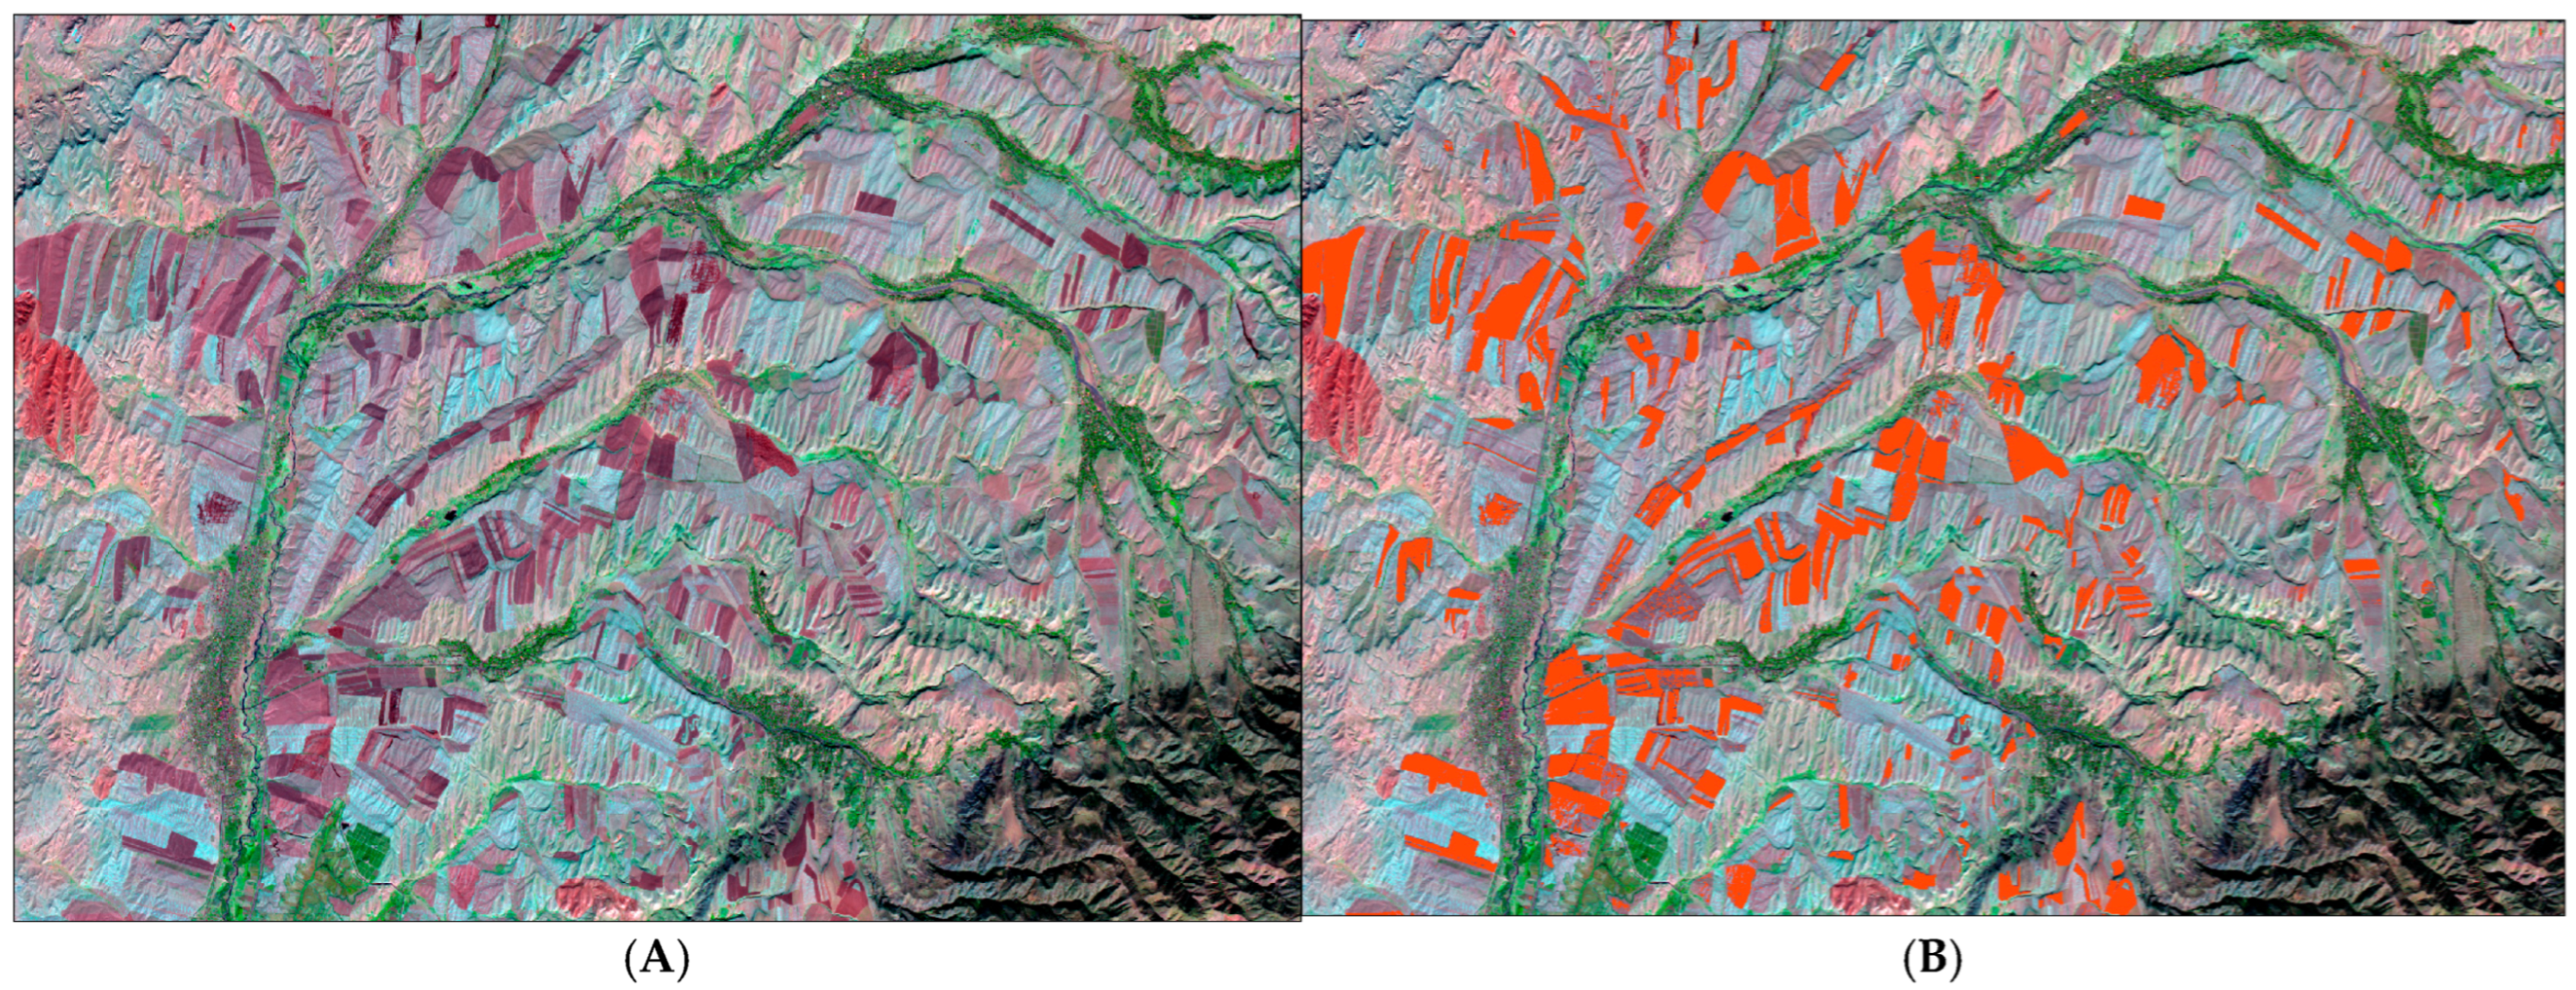
The parameters of the formula were adapted for foothill and plain environments of the Turkestan region, where seasonal differences in soil tillage serve as key indicators for separating winter and spring crops. Autumn ploughing (September–early November) is characteristic of winter cereals, whereas spring tillage (March–April) corresponds to spring crops. These agronomic distinctions were incorporated into a rule-based classification system that integrates logical conditions combining NDVI trajectories with seasonal PLI maps (Figure 6).
Figure 6.
Identification of plowed land using the PLI: (A) Sentinel-2 composite from 29 October 2024, visually showing plowed fields, presented in the purple color; (B) Result of the PLI calculation, where plowed land contours are highlighted in orange reddish color.
The classification was performed in ArcGIS Pro 3.0 using a set of deterministic rules [33,34] that account for the seasonal dynamics of four major crop classes: winter cereals, spring cereals, safflower, and perennial forages (alfalfa). Winter cereals were identified based on autumn tillage and early spring NDVI rise; spring cereals by spring tillage and a characteristic NDVI maximum in late May; safflower by late NDVI growth with a peak in mid-June; and perennial forages by the absence of soil tillage and a stable seasonal NDVI curve. All rules were applied within the Agri zone mask of rainfed cropland, which excludes non-agricultural areas and ensures that data processing is restricted to arable land (Table 3).
Table 3.
Main crop classes, their agrotechnical characteristics, and spectral–phenological indicators used in the multi-year Sentinel-2 classification.
For example, the identification of winter cereals was based on conditions reflecting autumn ploughing without evidence of spring tillage. Two main types of NDVI composites were used in the classification procedure:
- (1)
- Temporal NDVI composites, representing mean NDVI values calculated from all available cloud-free Sentinel-2 observations within 3–5-day intervals (e.g., NDVI_25apr_composite). These composites were generated using the Cell Statistics—Mean function and were used to track vegetation development dynamics.
- (2)
- Peak NDVI composite (NDVI_peak), representing the maximum NDVI value for each pixel during the characteristic peak growth period of a given crop (e.g., 5–25 May for winter cereals), generated using the Cell Statistics—Max function.
Specific classification rules were implemented in the ArcGIS Pro Raster Calculator. Winter cereals (code 1) were identified using the following logical expression:
| Con(((Agri_zone == 1) & (PLI_autumn > 0) & (PLI_spring <= 0) & |
| (NDVI_25apr_composite > NDVI_25mar_composite) & |
| (NDVI_15may_composite > NDVI_25apr_composite) & |
| (NDVI_30may_composite < NDVI_peak)), 1, 0) |
The ArcGIS Pro 3.0 Raster Calculator original expression system is used.
Here, NDVI_peak represents the composite raster of maximum NDVI values during the typical vegetation peak period, PLI_autumn > 0 indicates autumn soil tillage, and PLI_spring ≤ 0 ensures the absence of spring plowing.
For validation of the classification rules, a boundary-based (“mask-based”) classification was used, where crop areas were calculated from detailed digitized field polygons. These results were compared with the outputs of the automated classification performed within the Agri zone mask, as well as with official statistics and field survey materials collected at key farms in the region. The mean classification accuracy was 85–90%, which is consistent with the published methodology and confirms the validity of the algorithm [25].
An additional expert-based visual assessment was conducted to refine local classification errors arising from the limitations of rule-based separation, spectral ambiguity of bare soil conditions, and boundary effects at the field scale. This assessment involved detailed analysis of NDVI temporal profiles, Sentinel-2 SWIR2–NIR–RED composites, and field geometry within the agricultural landscape. The expert correction step allowed adjustment of misclassified areas where seasonal tillage signals detected by the PLI were insufficiently distinctive. As a result, the overall classification error was reduced to 3–5%, corresponding to an integrated classification accuracy of approximately 95–97%. This refinement was particularly important in the foothill zone, where high spatial heterogeneity of relief and field patterns increases classification uncertainty.
Thus, the multi-year classification dataset represents a key spatiotemporal layer used in this study to analyze interannual crop transitions, quantify repeated winter sowing, and identify spatial patterns of agricultural land use. The classification itself is not the focus of methodological development in the present work; its role is analytical, serving as the foundation for subsequent multi-year assessments.
For consistency in further analysis, each crop category was assigned a unique code: 1—winter cereals, 2—spring cereals, 3—safflower, 4—perennial forages, 5—fallow. This coding ensures unambiguous crop identification at the field level, enabling correct formation of interannual transitions and supporting subsequent calculations of repeated winter sowing.
2.2.3. Meteorological Data
Meteorological data used in this study were obtained from the Kazygurt meteorological station, located within the boundaries of the study area and representing climatic conditions of the foothill–plain zone of southern Kazakhstan. The dataset covers the period 2017–2025 and includes monthly precipitation totals and mean air temperature values, which form the basis for agroclimatic characterization of rainfed crop production.
The temporal resolution of the dataset corresponds to monthly observations, which is sufficient for analyzing seasonal moisture and thermal regimes relevant to winter cereal development. Particular emphasis was placed on two critical periods of the agricultural cycle:
- -
- The autumn period (September–October), which determines soil preparation and sowing conditions for winter cereals;
- -
- The spring period (April–May), corresponding to vegetation recovery and the phenological maximum reflected in spring NDVI values.
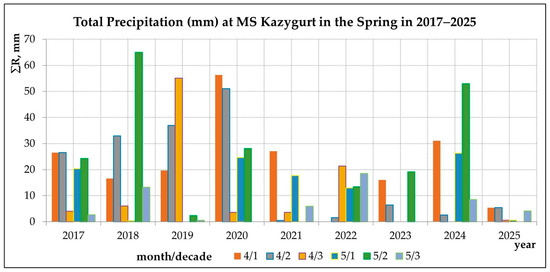
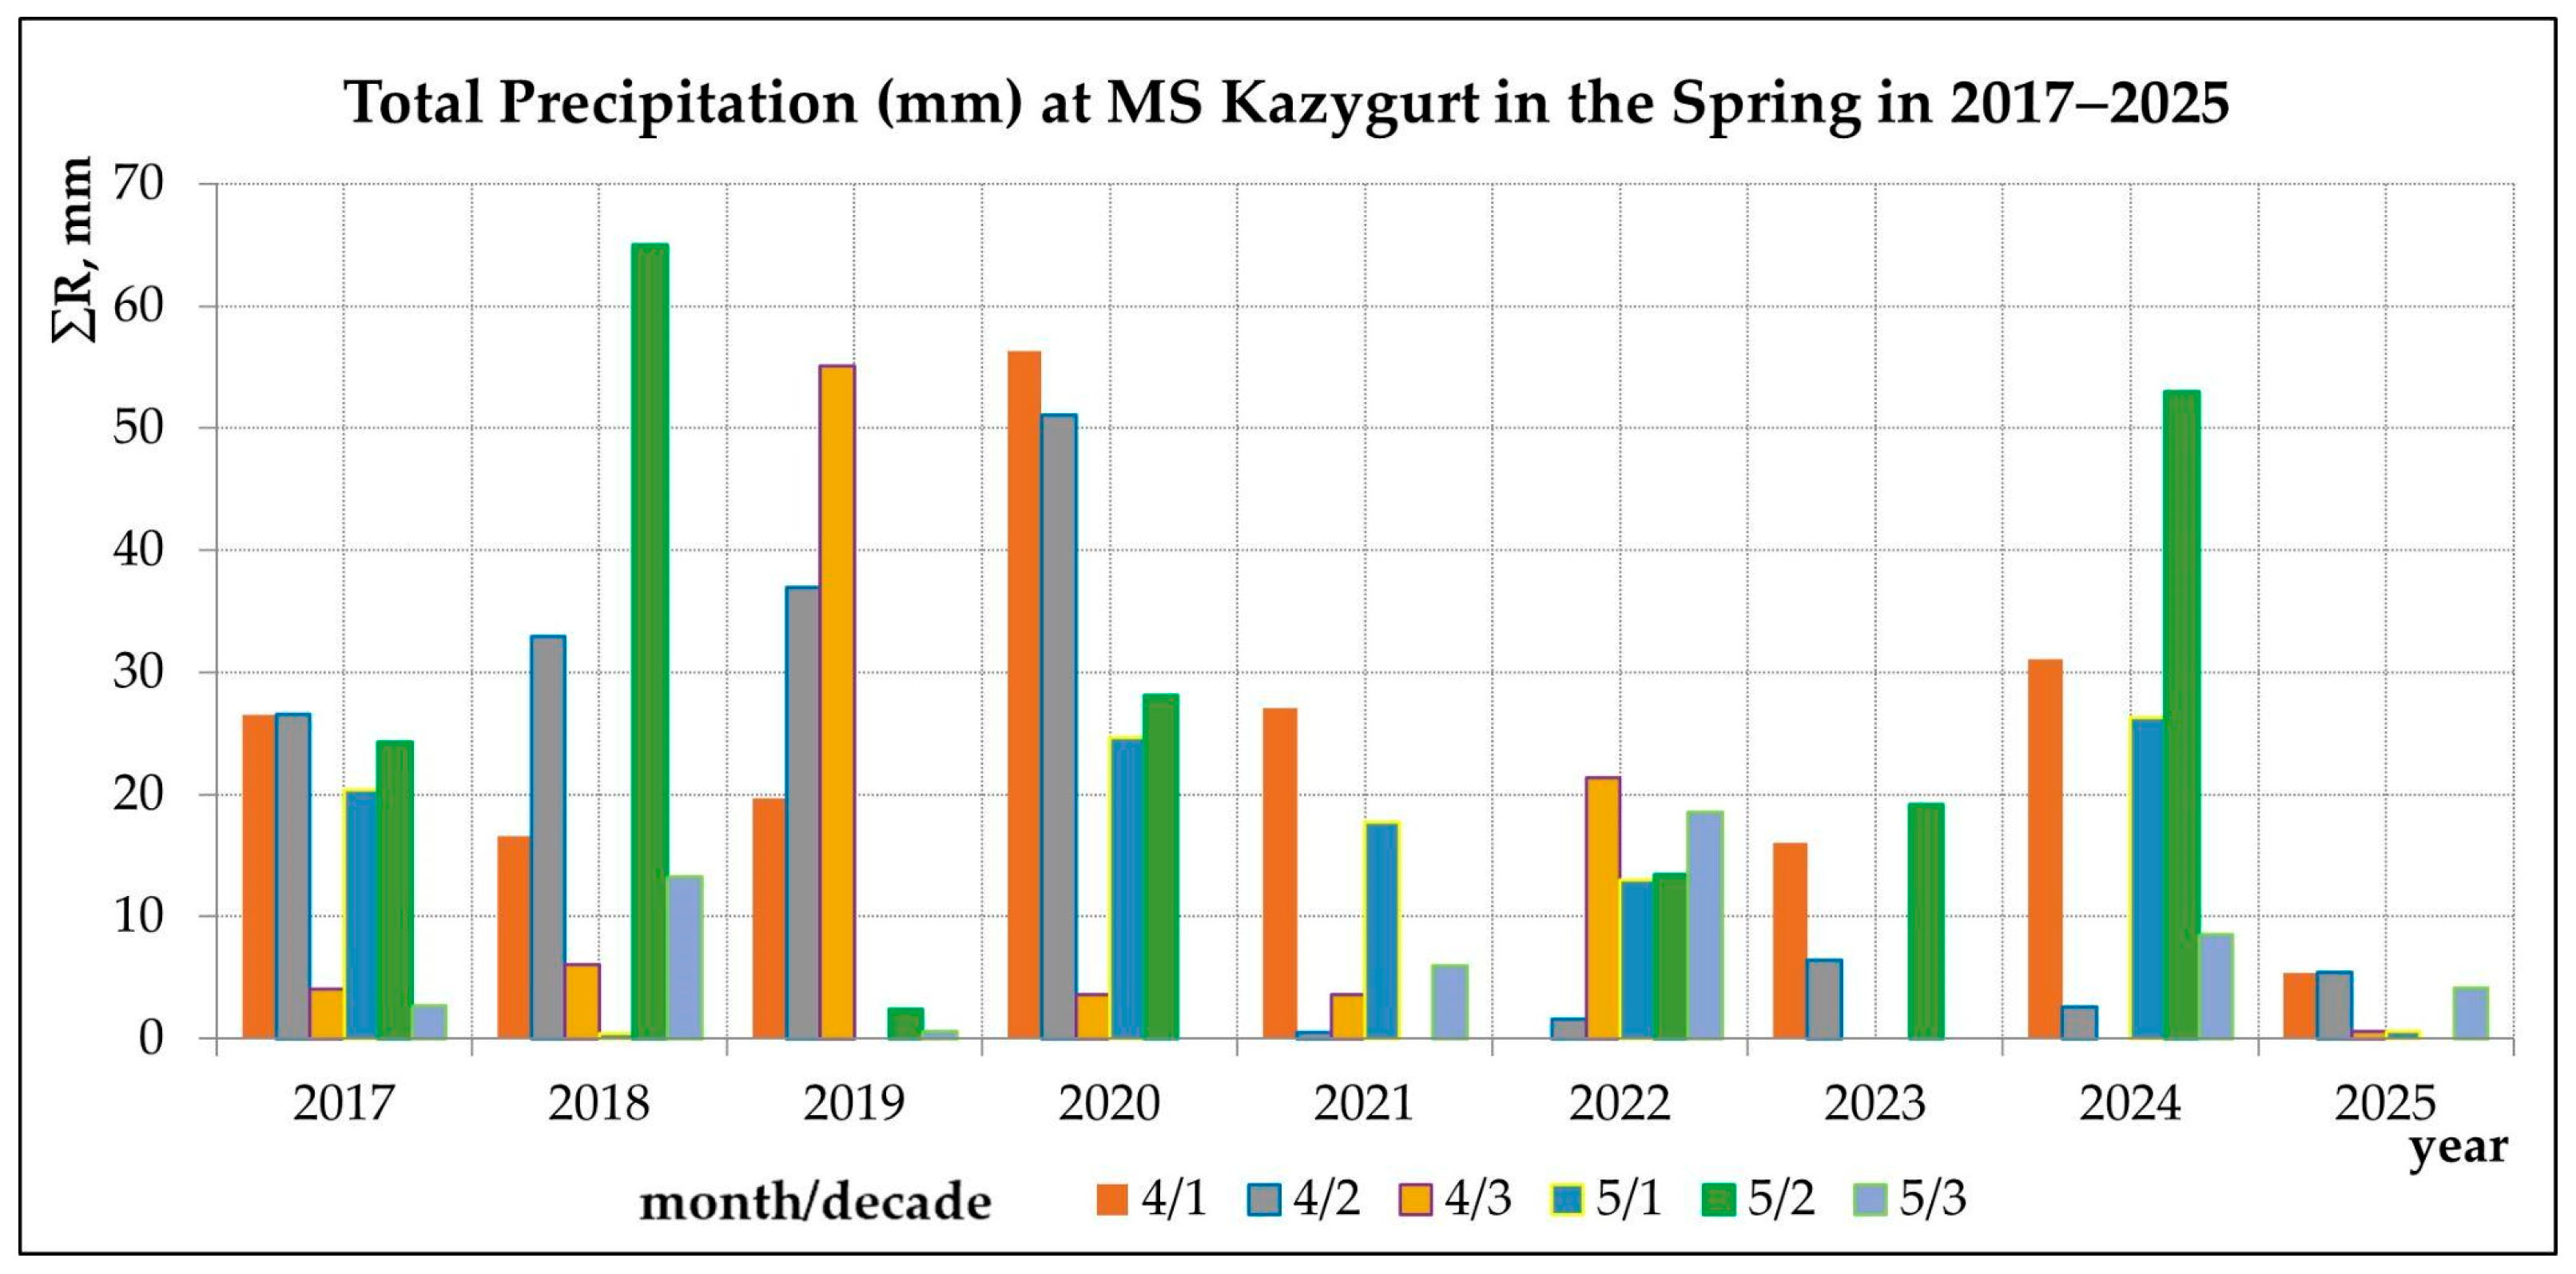
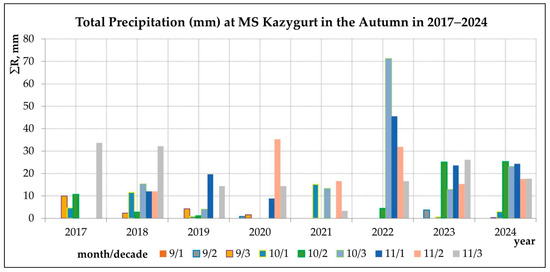
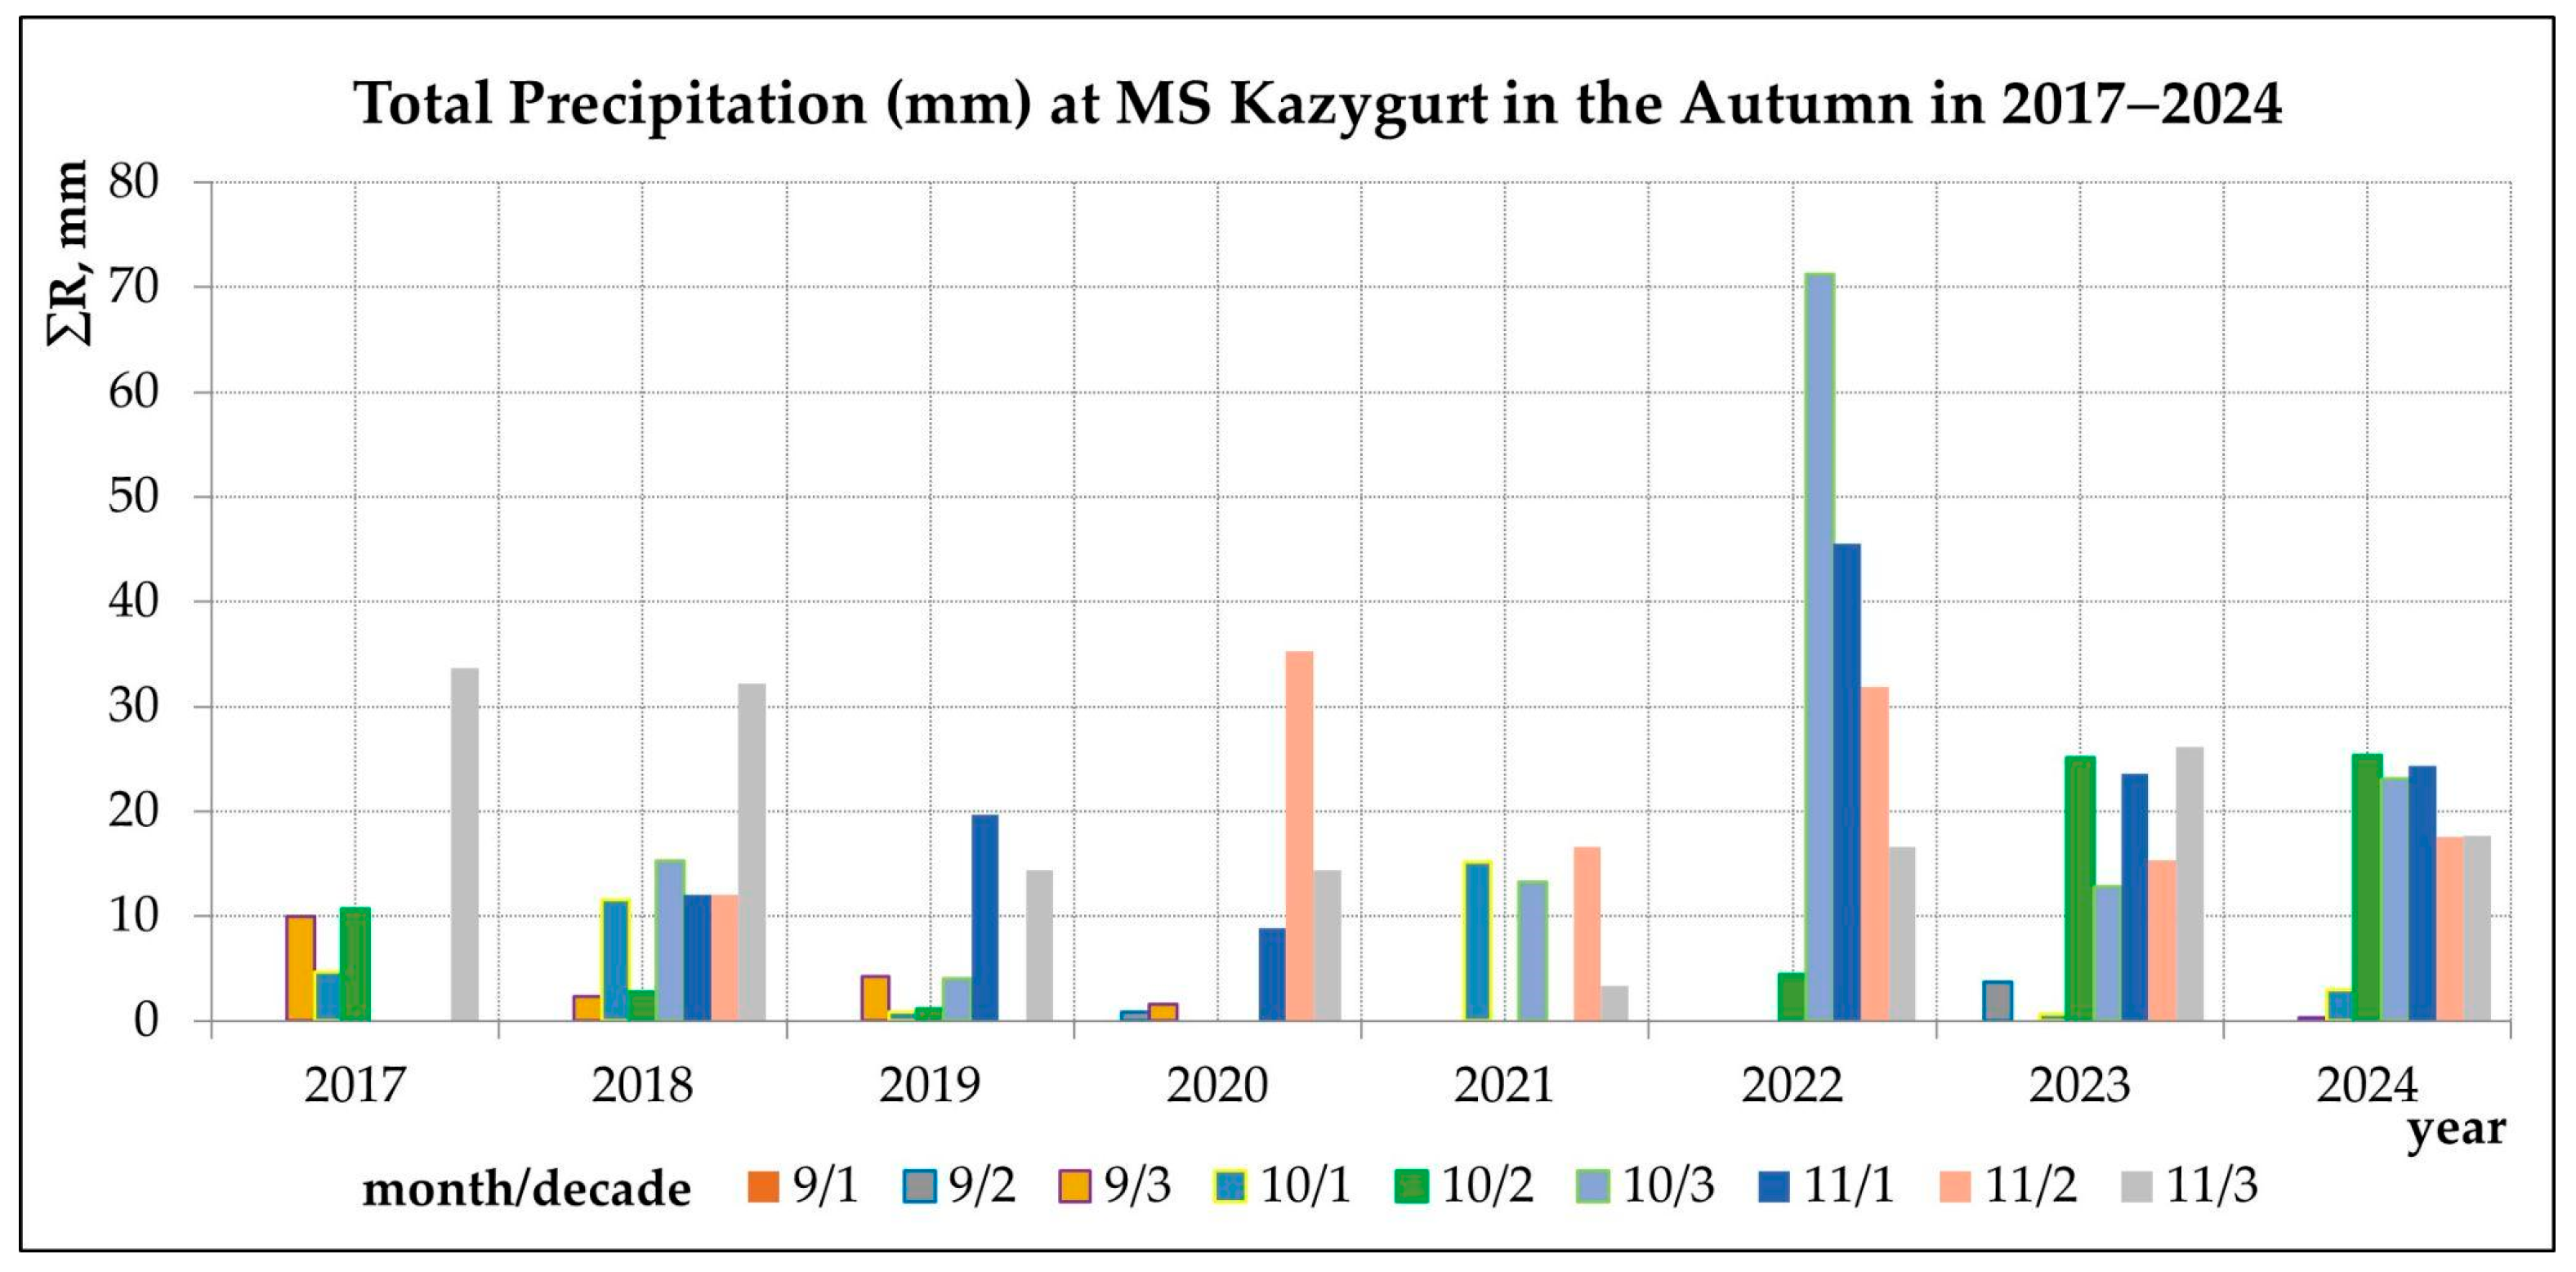
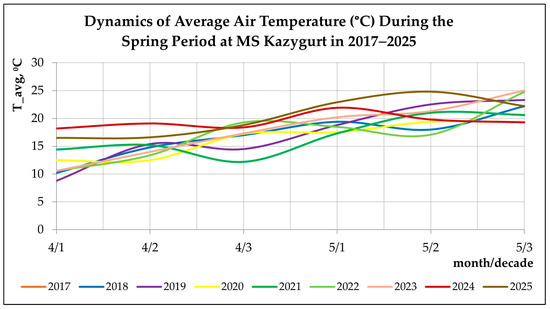
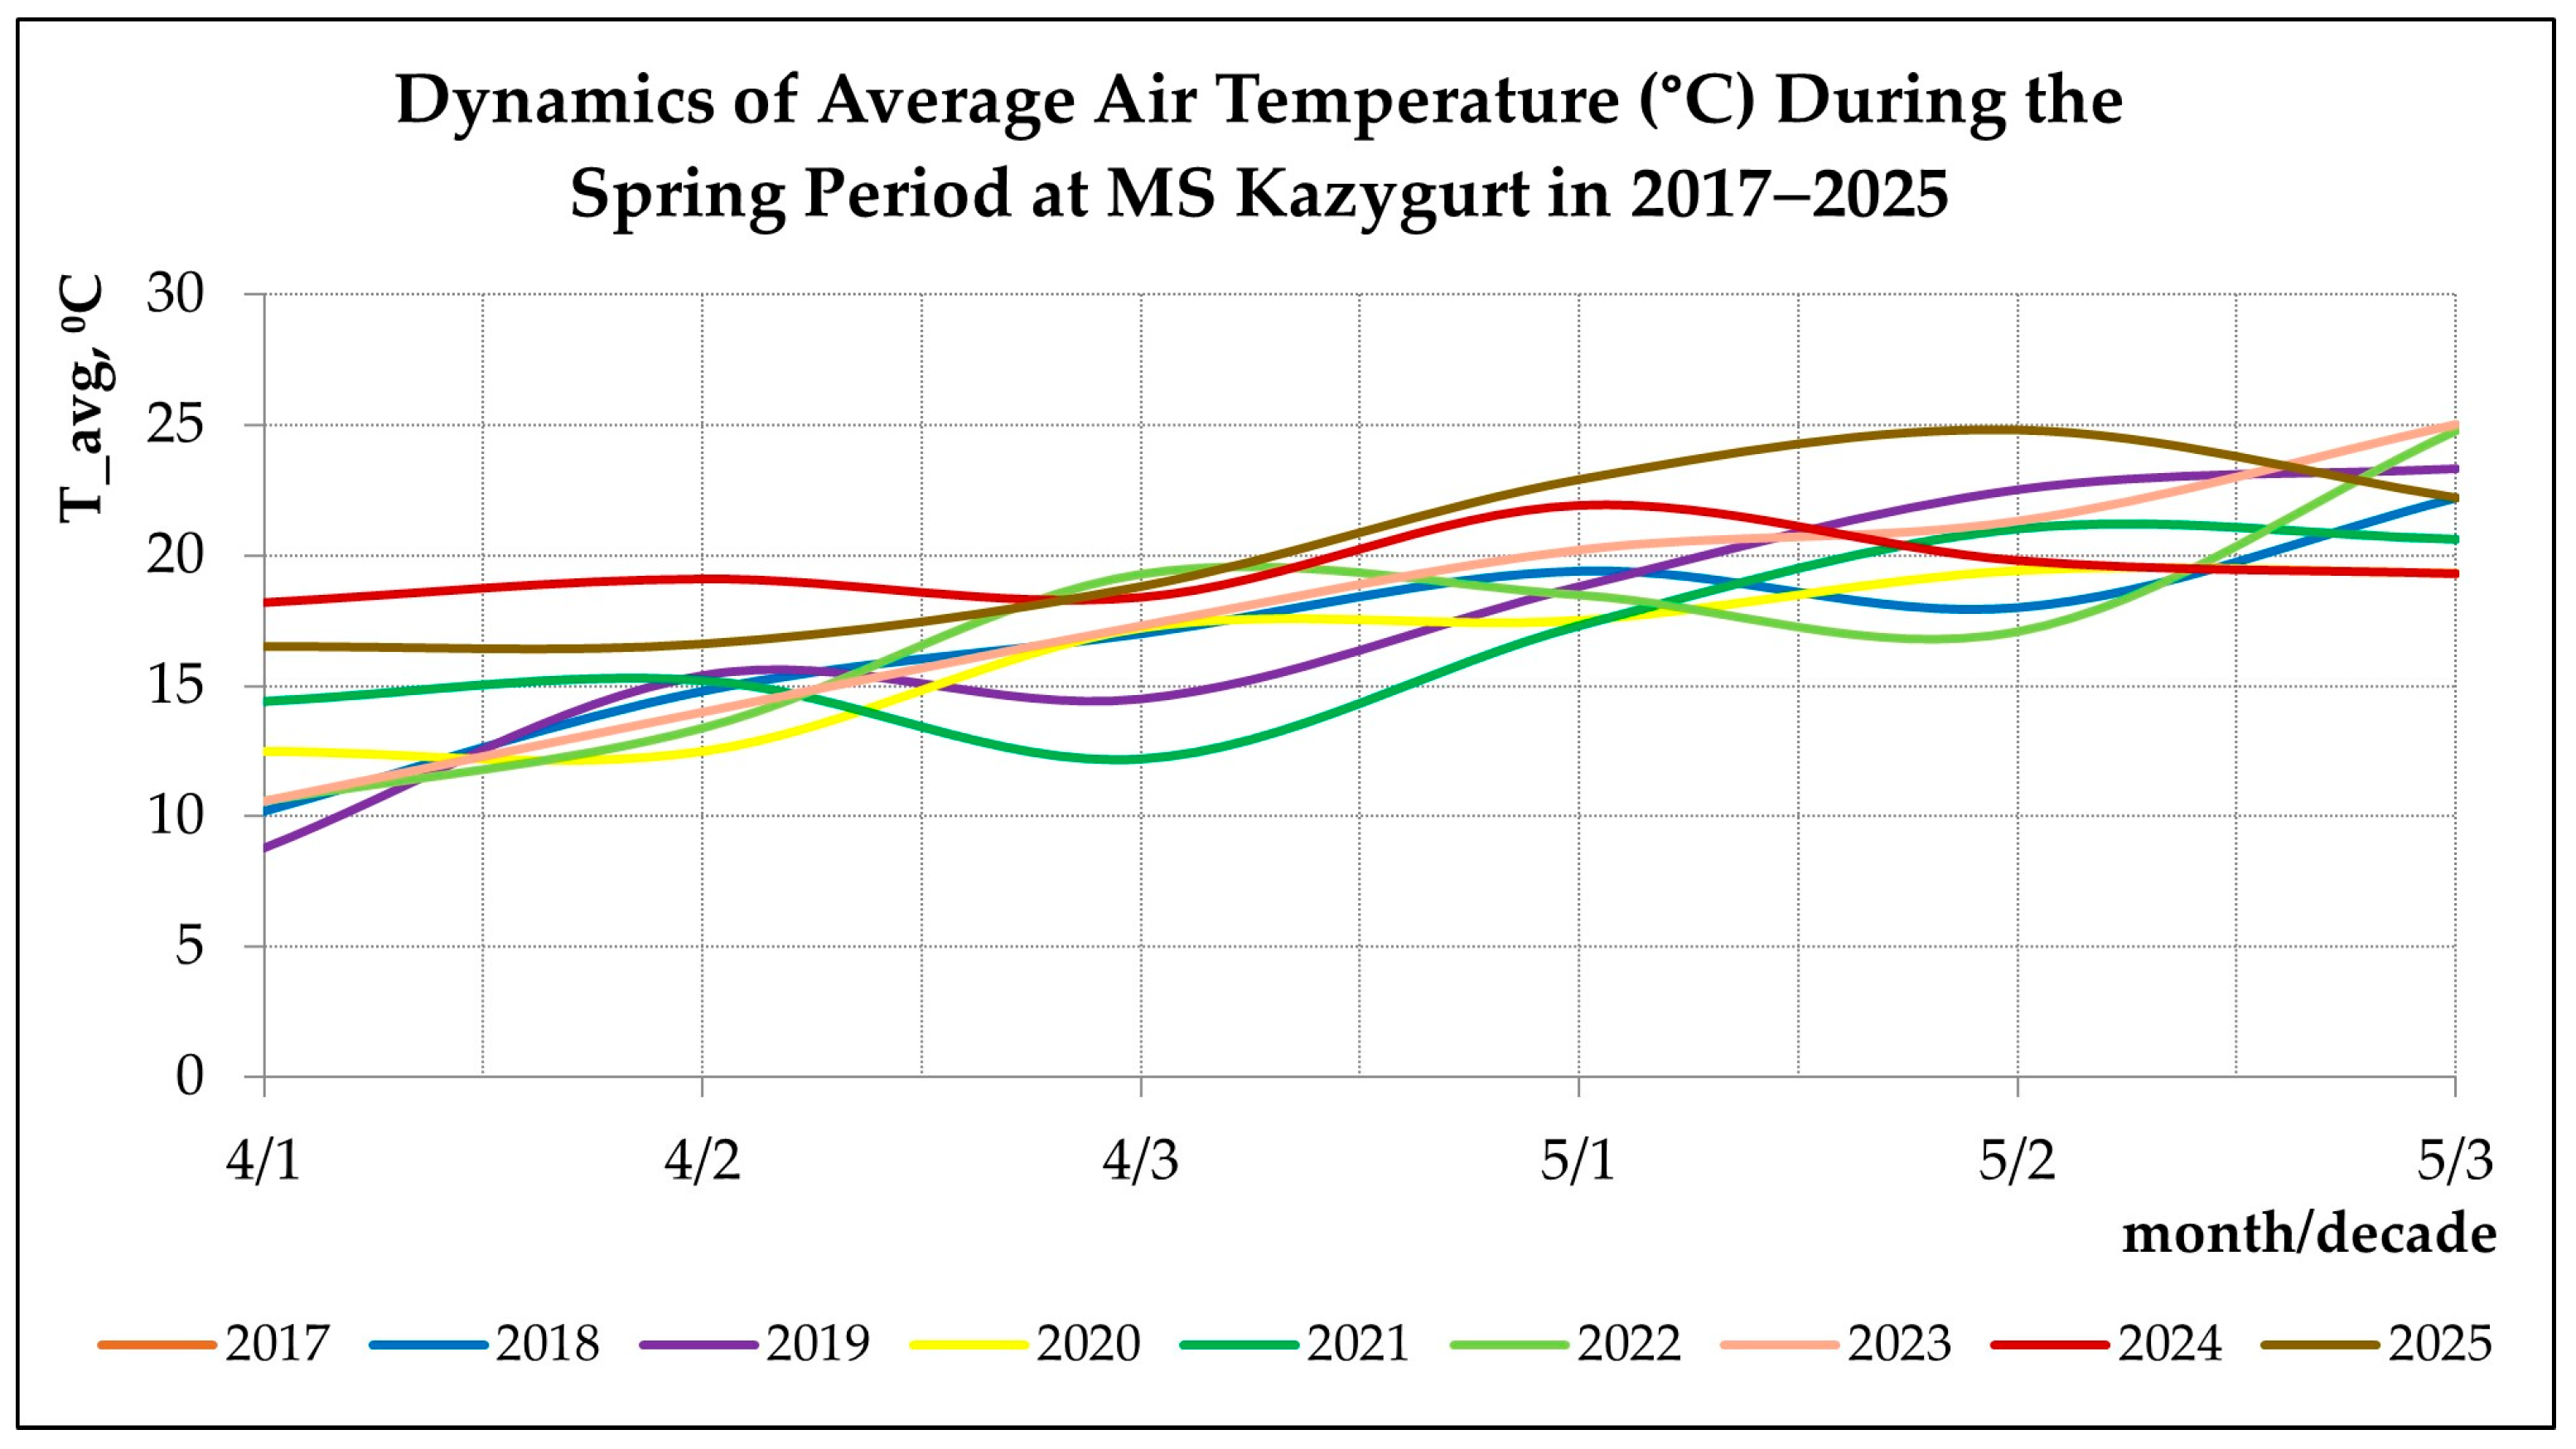
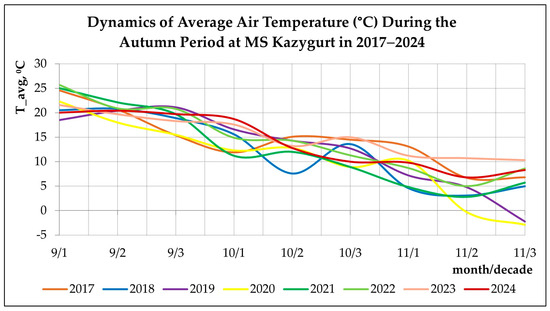
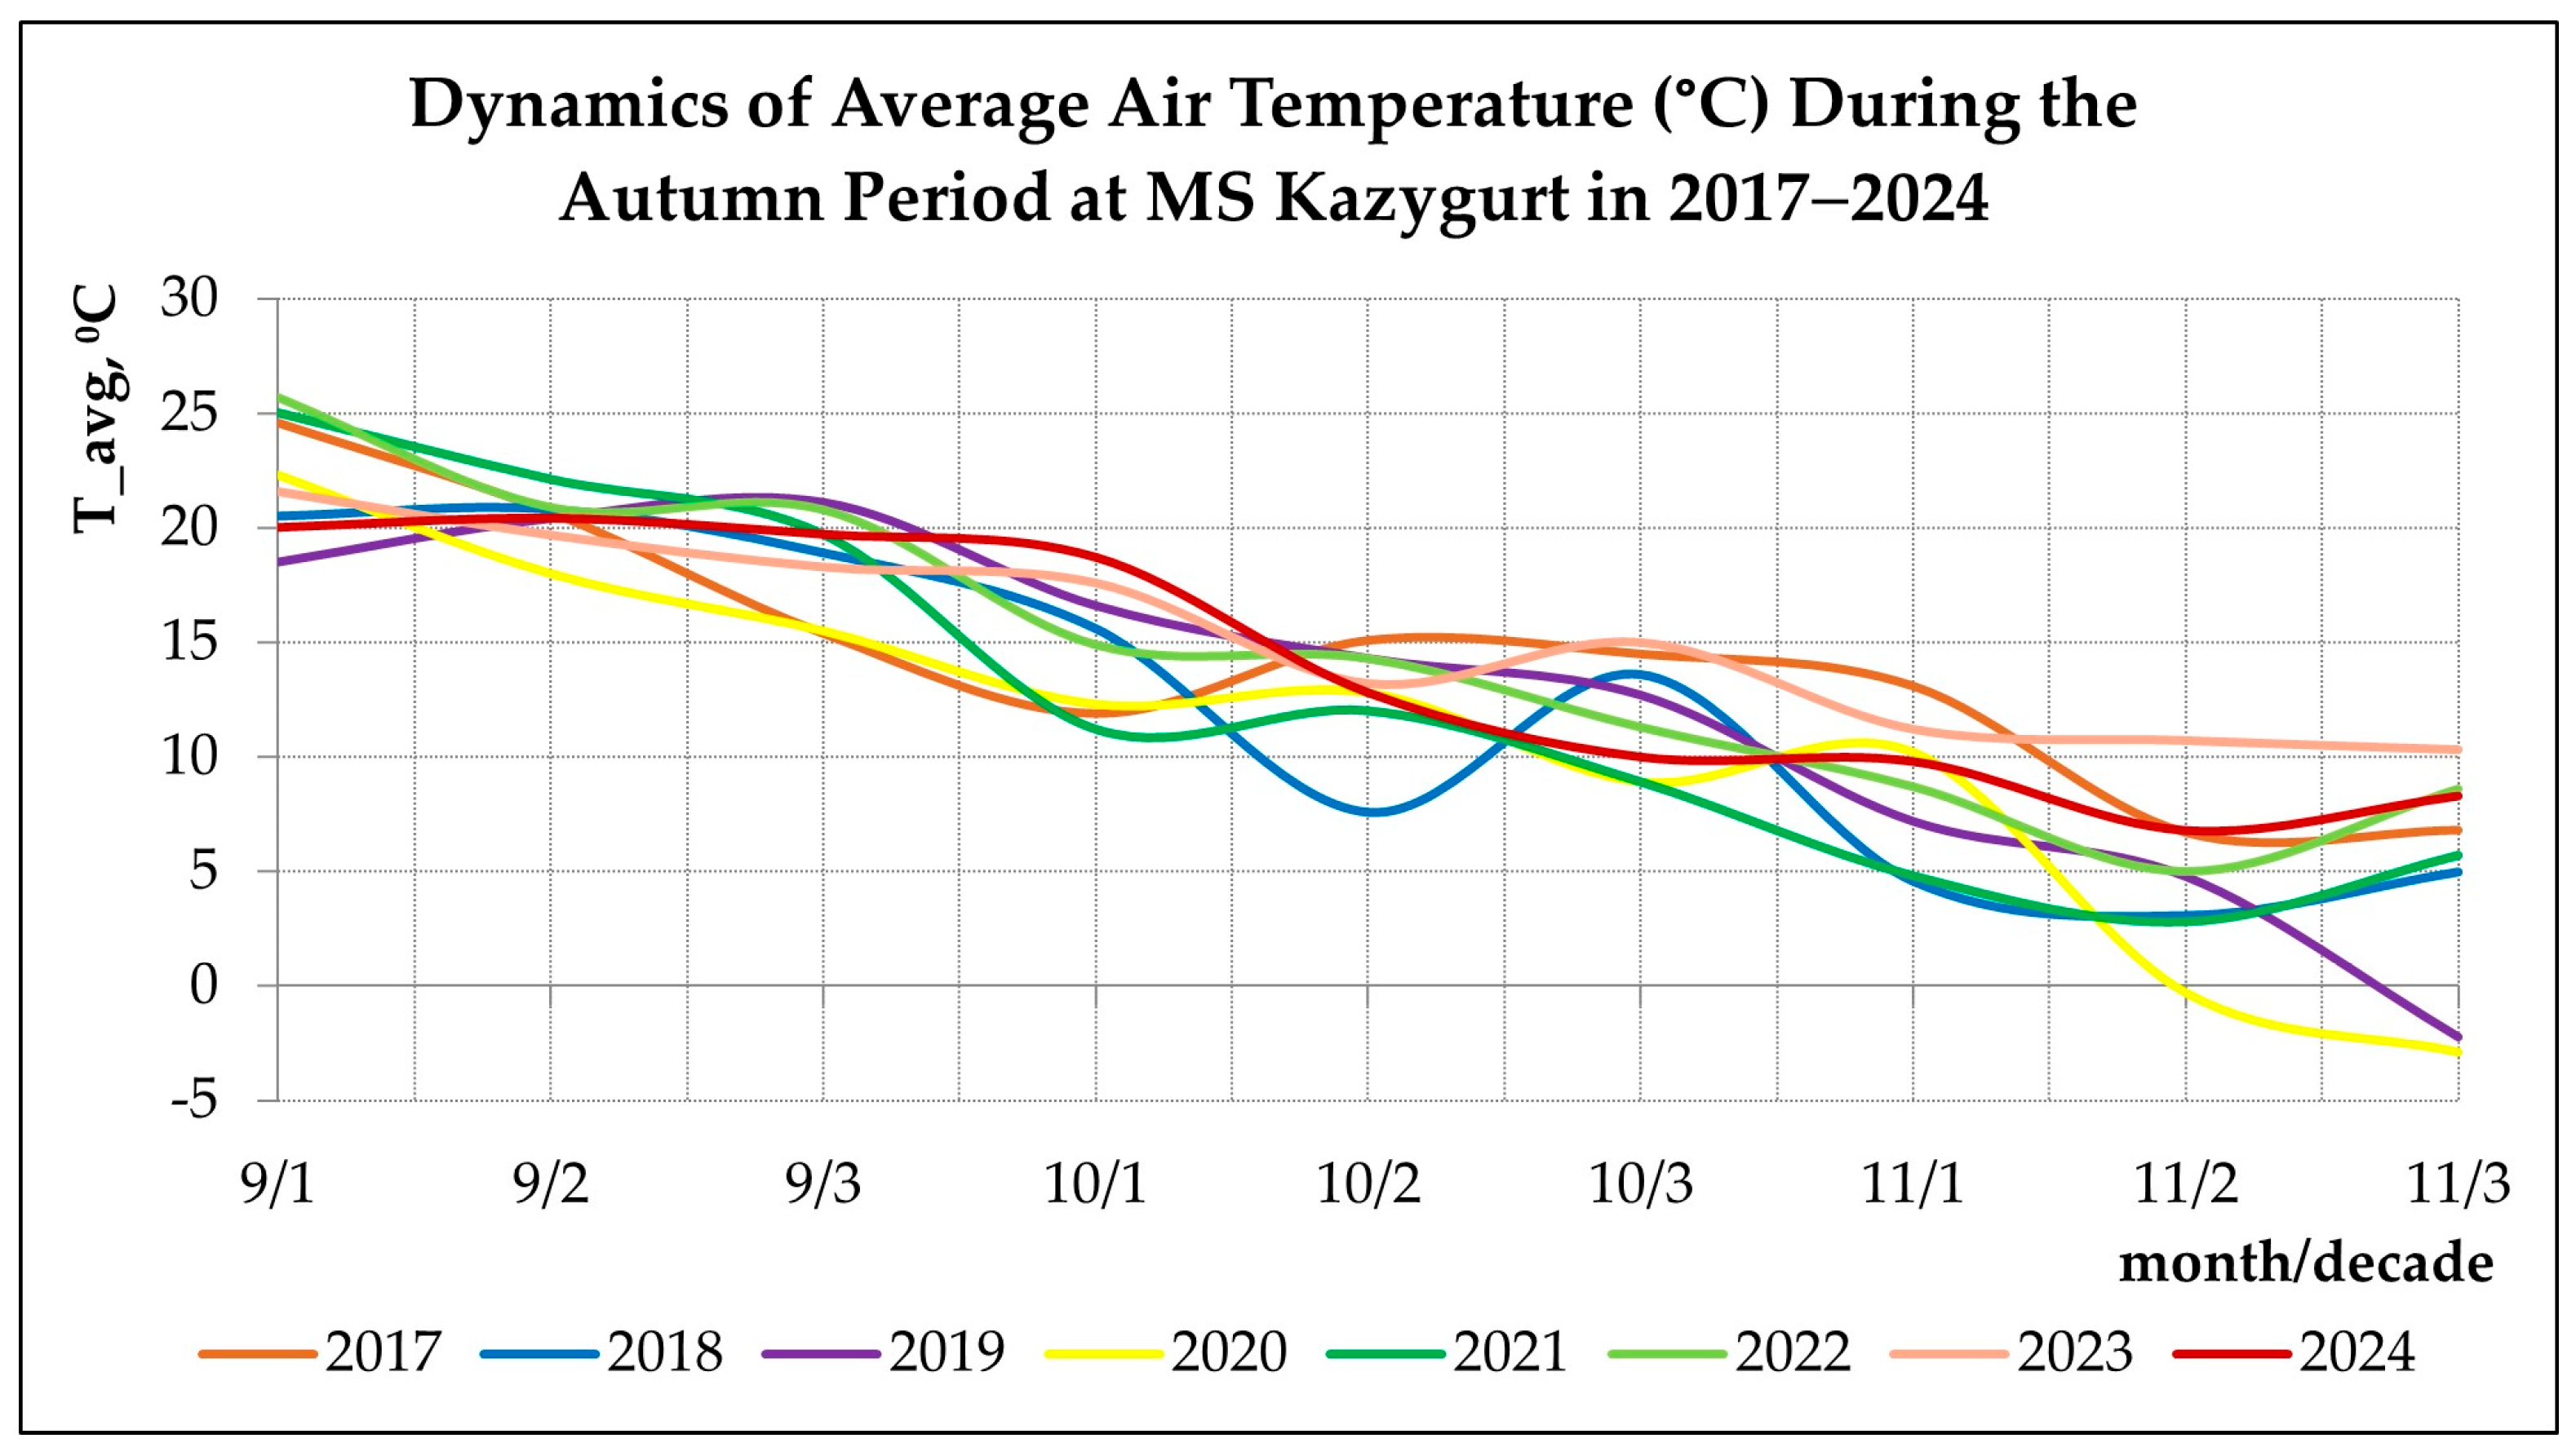
To characterize intra-seasonal climatic variability, precipitation and temperature dynamics were analyzed at the decadal scale within the spring and autumn seasons. Spring and autumn precipitation totals are illustrated in Figure 7 and Figure 8, while the dynamics of mean air temperature during these periods are presented in Figure 9 and Figure 10. These figures provide a detailed representation of interannual contrasts in moisture availability and thermal conditions affecting both crop establishment and early biomass formation.
Figure 7.
Spring precipitation at MS Kazygurt (2018–2025).
Figure 8.
Autumn precipitation at MS Kazygurt (2017–2024).
Figure 9.
Dynamics of spring temperature (2018–2025).
Figure 10.
Dynamics of autumn temperature (2017–2024).
In addition to basic meteorological variables, an agroclimatic indicator, the Selyaninov Hydrothermal Coefficient (HTC), was calculated for each year for the April–May period. HTC integrates thermal and moisture conditions and is defined as
where ∑P is the sum of precipitation (mm) and ∑T>10 °C is the sum of mean daily air temperatures above 10 °C over the same period. HTC is widely used in agroclimatic studies to assess moisture availability for crop growth and to classify years as dry, moderately moist, or humid [35,36].
The derived agroclimatic indicators, including spring precipitation, HTC, and mean spring NDVI, were summarized in Table 4 (Input agroclimatic dataset, 2018–2025), which served as the basis for subsequent statistical analysis.
Table 4.
Input agroclimatic dataset and mean spring NDVI values for foothill and plain zones (2018–2025).
To quantify relationships between climatic conditions and crop status, a Spearman rank correlation analysis was applied between spring NDVI values and agroclimatic indicators (spring precipitation and HTC), calculated separately for foothill and plain zones. The use of Spearman’s correlation was motivated by the limited length of the temporal series, non-normal data distributions, and the aggregated nature of multi-year, field-level indicators. Spearman correlation is commonly recommended for such conditions, as it captures monotonic relationships without assuming linearity [37,38].
Meteorological variables were not used as direct predictors within the crop classification procedure. Instead, they were employed as independent explanatory factors to support interpretation of interannual crop transitions, repeated winter sowing patterns, and observed variations in spring NDVI. This approach ensures a clear methodological separation between remote-sensing-based classification and climatic interpretation, while maintaining transparency and reproducibility of the analysis.
2.3. Methodology
2.3.1. Identification of Crop Transitions
Interannual crop transitions were identified at the level of individual field polygons. For each field, a sequence of annual crop codes (1—winter cereals; 2—spring cereals; 3—safflower; 4—perennials; 5—fallow) was constructed for the entire 2018–2025 observation period. Transitions were analysed for all consecutive year pairs (2018 → 2019, 2019 → 2020, …, 2024 → 2025), allowing detection of changes in crop category for each specific field.
To formalize interannual transitions, binary transition layers were generated, marking the occurrence of winter cereals after a spring-crop year. Each such layer is denoted as Rep_t, where t is the transition year (t → t + 1). A field receives a value of 1 in Rep_t if the following condition is met:
Thus, the key rule is explicitly defined: if a field had a spring crop (barley or safflower) in year t and a winter cereal in year t + 1, the transition is recorded as repeated winter sowing.
Seven transition layers (Rep_2018 … Rep_2024) were produced, corresponding to all interannual intervals of the study period. These layers served as the basis for calculating the integrated indicator of winter-sowing frequency.
Subsequent aggregation of Rep layers at the field level enabled the calculation of repeated winter sowing frequency for each agricultural polygon across the multi-year period. This procedure formed the basis for computing the integral R-index, which represents the number of repeated winter sowings over eight years.
2.3.2. Definition of Winter Cereal Re-Sowing
In this study, repeated winter sowing is defined as the return of winter cereals to the same agricultural field in year t + 1 after spring crops were grown there in year t. This definition reflects the agronomic specificity of the region, where winter and spring crops have distinct soil tillage calendars and phenological trajectories.
Formally, repeated winter sowing is recorded when the following sequence occurs for a given field:
where
- 1—winter cereals;
- 2—spring cereals;
- 3—safflower.
This rule reflects the fundamental biophysical and agronomic mechanism: spring crops leave the field after spring tillage and harvest, enabling reintroduction of winter cereals on the same contour in the subsequent season. In the foothill–plain agro-landscapes of the Kazygurt district, this transition is the dominant mechanism behind multi-year repeated sowing patterns.
Repeated winter sowing is not recorded when:
- -
- The field had winter cereals in both years t and t + 1 (ordinary continuous cultivation);
- -
- The field was under perennials (4) or fallow (5) in year t;
- -
- The field left agricultural production or changed to a non-agricultural category.
Thus, repeated winter sowing is defined strictly as the transition “spring crops/safflower → winter cereals,” ensuring unambiguous interpretation and excluding ambiguous cases involving perennials or fallow.
This structured definition facilitates subsequent calculation of the R-index, enabling quantitative assessment of repeated winter sowing frequency for each field across multiple years. The R-index represents the cumulative frequency of repeated winter cereal re-sowing over the observation period and does not distinguish between consecutive and temporally separated repetitions.
2.3.3. Frequency Analysis (R-Index)
The frequency of repeated winter sowing was computed using the integrated R-index, which quantifies the number of transitions “spring crop or safflower → winter cereal” across consecutive years. For each annual interval, a binary Rep_t layer was generated, where 1 indicates the presence of a transition; 0 indicates its absence. Transition layers were constructed using logical expressions in ArcGIS Pro 3.0. For example, the transition 2018 → 2019 was defined as
where 1—winter cereals; 2—spring cereals; 3—safflower.
Similarly, seven transition layers were created for all year-to-year intervals:
Rep_2018, Rep_2019, Rep_2020, Rep_2021, Rep_2022, Rep_2023, Rep_2024.
The R-index was computed as the sum of all Rep layers:
Interpretation:
- -
- R = 0—no repeated winter sowing;
- -
- R = 1—one repeated winter sowing event;
- -
- R ≥ 2—multiple repeated sowings.
The raster R-index layer was converted to vector format while preserving the original coding, enabling field-level area calculations without zonal statistics.
2.3.4. Spatial Analysis
Spatial analysis of repeated winter sowing was performed using the integrated R-index layer. First, areas with high intensity (R ≥ 2) were identified, highlighting “hotspots” of recurrent winter cereal return. Next, the distribution of R-index values was compared between foothill and plain zones to reveal territorial differences in agricultural resilience.
The spatial structure analysis included evaluation of the configuration of high-R polygons, their relation to terrain elements, and their association with crop allocation patterns. The result was a set of multi-year maps of winter-sowing recurrence, reflecting spatial agricultural patterns and differences between the district’s morphological zones.
2.3.5. Crop Condition Assessment
Winter crop condition was assessed using spring NDVI values corresponding to maximum leaf biomass [39,40,41,42,43]. For each study year, seasonal NDVI composites representing the peak growth phase (1–20 May) were generated by averaging all cloud-free Sentinel-2 scenes within the interval. This approach minimizes short-term atmospheric noise and captures the stable phase of biomass accumulation characteristic of winter cereals in southern Kazakhstan.
For spatial comparison between crop condition and repeated sowing frequency, NDVI values were aggregated by winter-crop field polygons for each year. Mean NDVI was extracted via zonal statistics, where each field contour served as a zone and the spring NDVI composite as the input raster [44,45]. Extracted NDVI values were then combined with the R-index assigned to each field.
Groups were formed according to R-index values:
- R = 0—no repeated winter sowing;
- R = 1—one repeated sowing;
- R ≥ 2—multiple repeated sowings.
Descriptive NDVI statistics (mean) were computed for each group, enabling quantitative comparison of crop condition across fields with different histories of winter-crop recurrence. This approach reveals whether multiple repeated sowings are associated with reduced, stable, or enhanced spring vegetation in foothill and plain environments.
3. Results
3.1. Distribution of Crop Types (2018–2025)
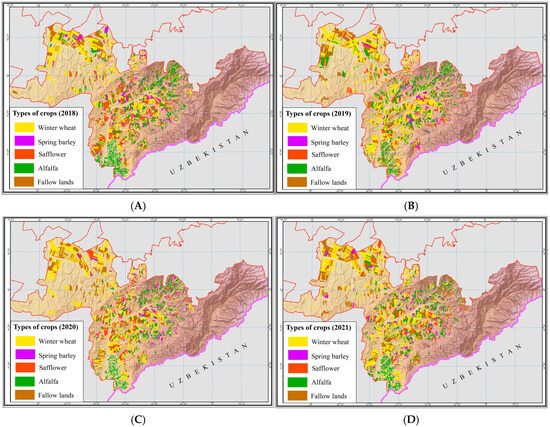
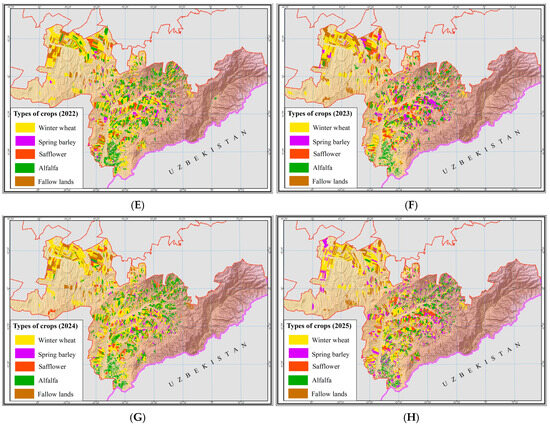
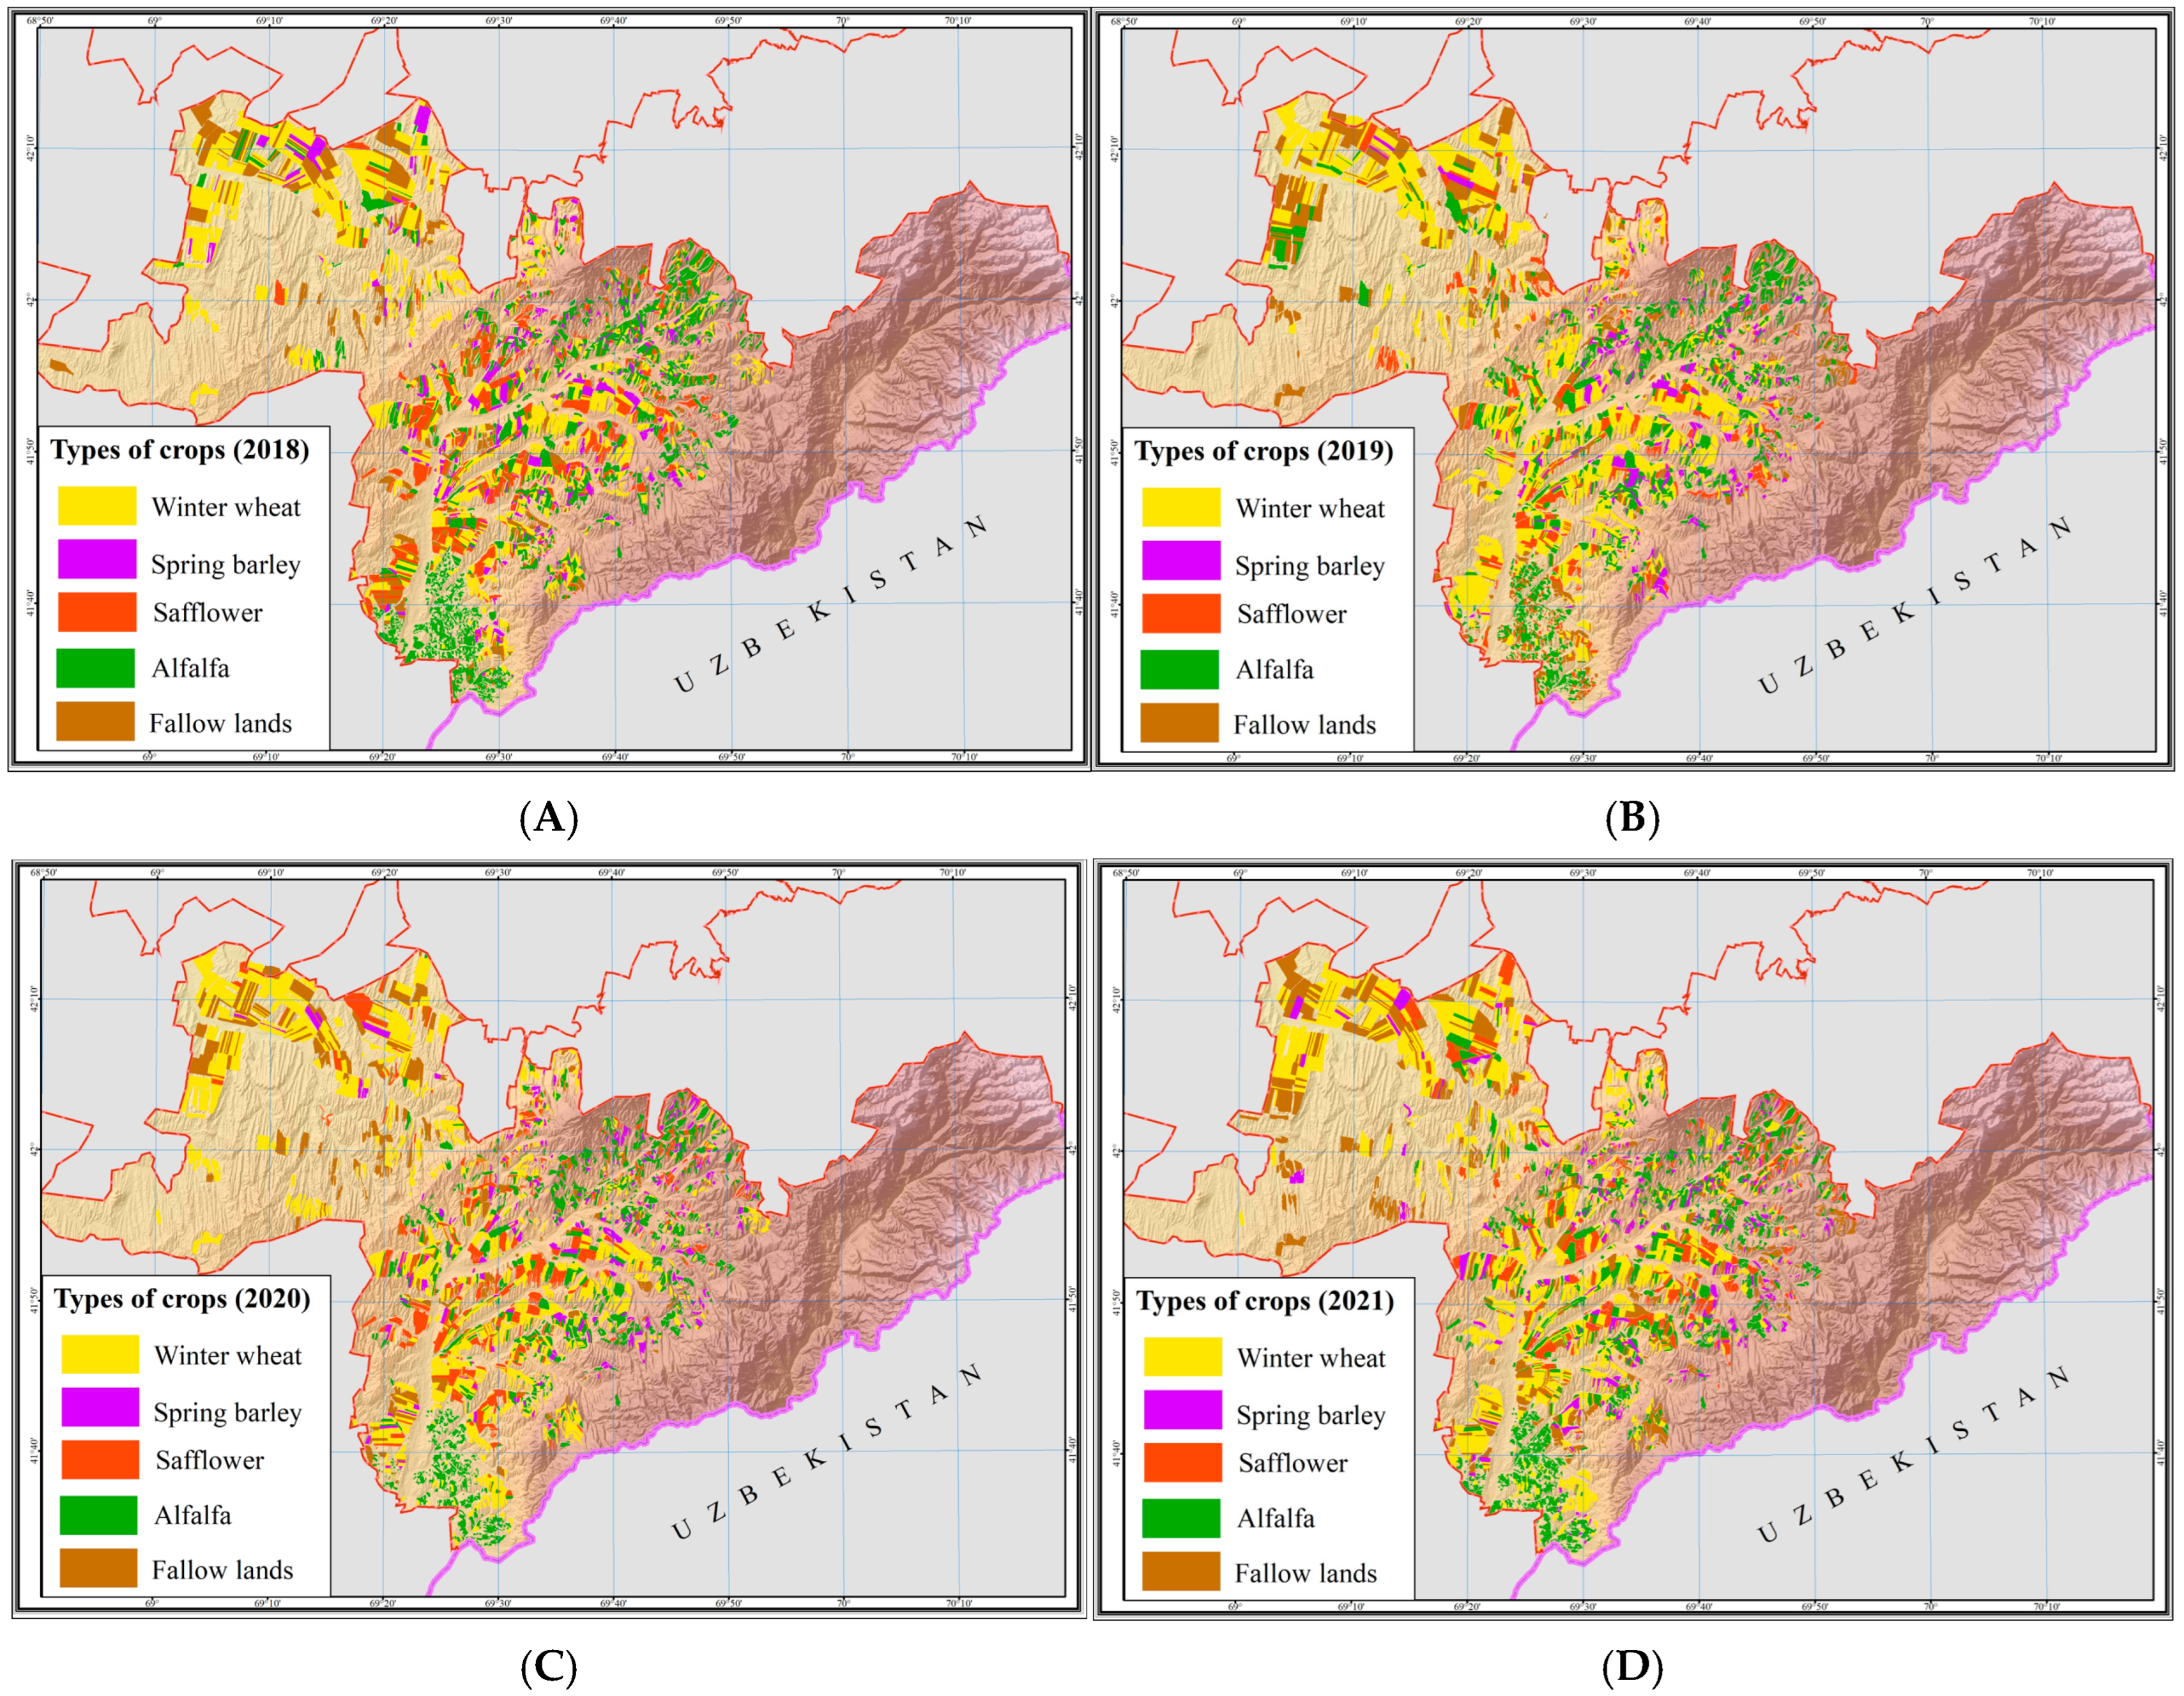
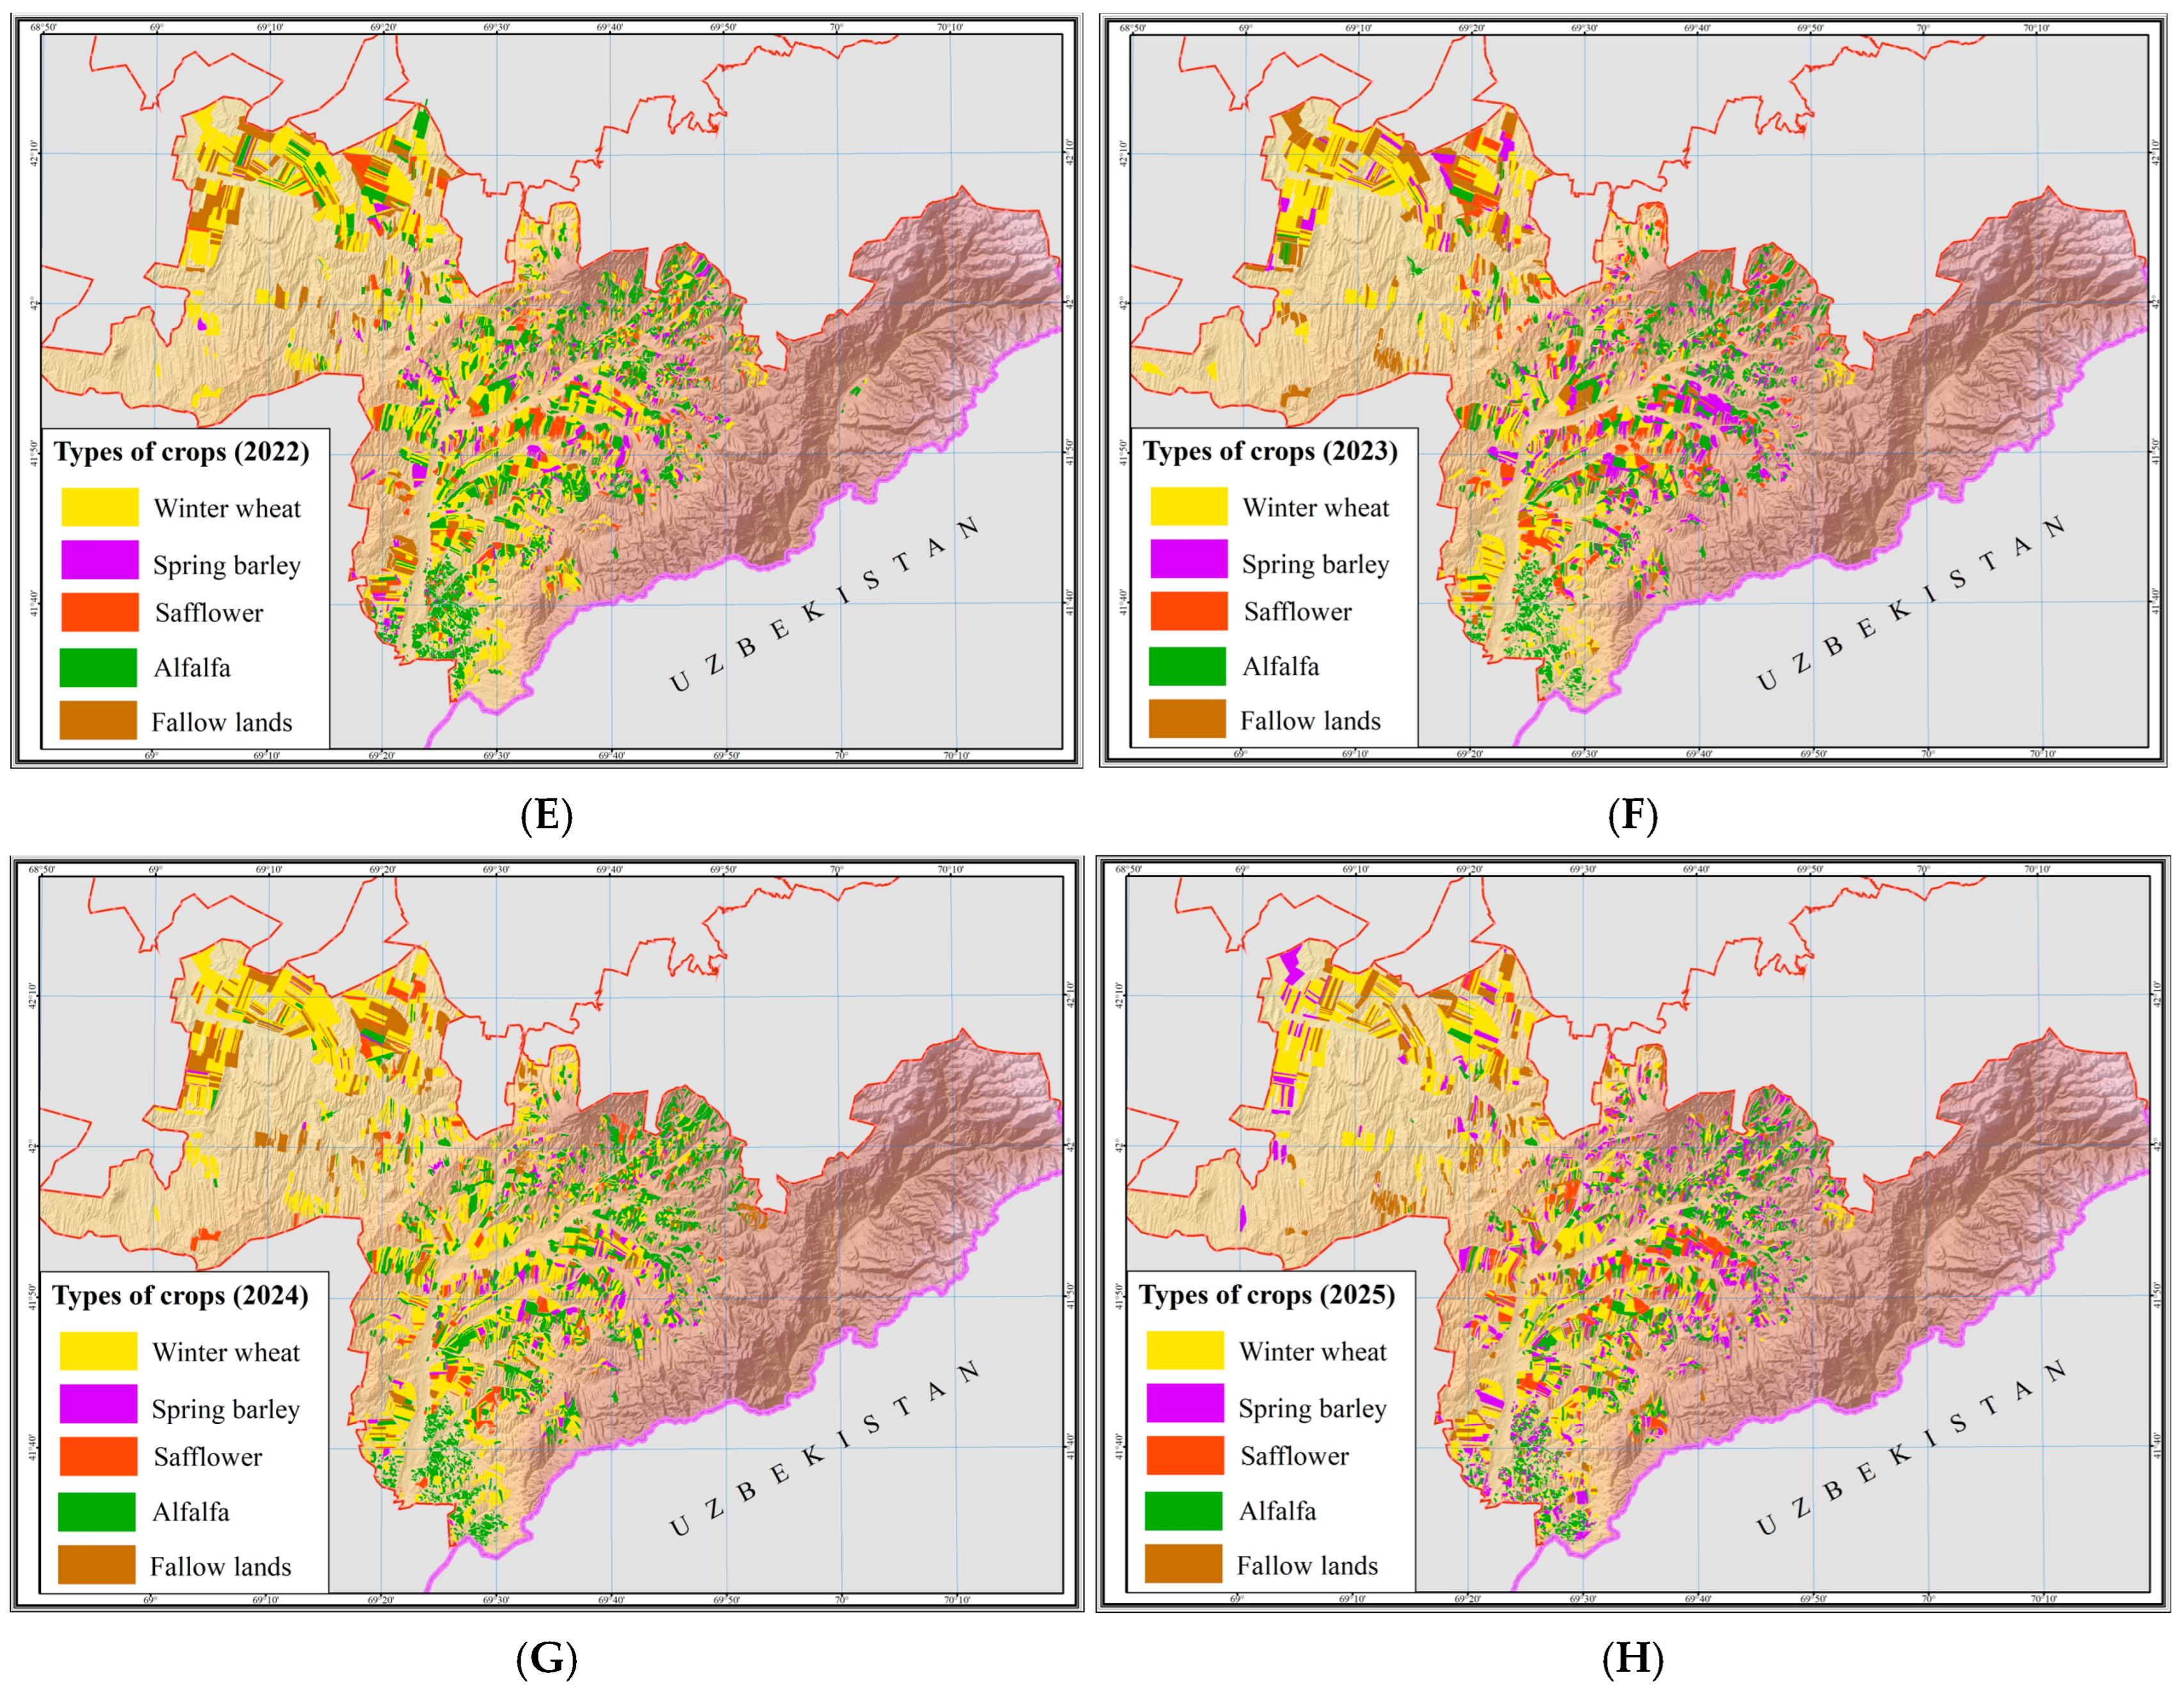
The multi-year Sentinel-2 classification enabled identification of the spatial and temporal distribution of the main crops in the Kazygurt district over the 2018–2025 period [25]. The classification scheme includes four primary crop groups—winter cereals, spring cereals (barley), safflower, and perennial forages (alfalfa)—as well as fallow as a separate categorical class. The results reveal stable interannual patterns of crop allocation at the field level and characterize sowing–structure dynamics under rainfed agricultural conditions (Figure 11).
Figure 11.
Spatial distribution of the main rainfed crop types in the foothill zone of the Turkestan region for 2018–2025: (A)—2018; (B)—2019; (C)—2020; (D)—2021; (E)—2022; (F)—2023; (G)—2024; (H)—2025.
Annual winter-crop areas derived from the remote-sensing classification varied between 30–47 thousand ha depending on the year, reaching maximum values in 2022 and 2024 (45,561 and 46,957 ha, respectively). Minimum winter-crop areas were recorded in 2023 (30,629 ha) and 2025 (36,301 ha). Throughout the entire observation period, winter cereals remained the dominant component of the agricultural structure, consistently forming the core of sown areas in the Kazygurt district.
Comparison of classification-based areas with official governmental statistics indicated error within ±3–5%, which corresponds to the typical error range of field surveys and administrative reporting. The highest correspondence was observed in years with favorable atmospheric conditions and minimal cloud contamination (2020 and 2023), whereas relatively larger discrepancies occurred in 2021 and 2025, driven by interannual variability in spring tillage intensity and spatial heterogeneity of field mosaics. To support this comparison, a field-based validation table was added, summarizing annual winter crop areas derived from Sentinel-2 classification and corresponding official governmental statistics. The relative difference between the two datasets does not exceed ±3–5% for all years, which is within the expected uncertainty range of administrative agricultural statistics and field surveys. Given that the analysis is conducted at the field level using digitized field boundaries, this comparison provides a robust and transparent validation framework for the classification results (Table 5).
Table 5.
Comparison of winter crop areas derived from Earth remote sensing data and official national statistics (2018–2025).
The annual crop distribution maps (Figure 11) demonstrate a stable geographical allocation of crops. Winter cereals are concentrated primarily on the plains of the northern sector and in the central foothill zone, where conditions for early spring emergence are most favorable. Spring cereals and safflower form characteristic clusters in foothill areas and on medium-sloped terrain, reflecting later soil tillage and sowing periods. Perennial forages are consistently observed on long-term managed fields with permanent cover, most frequently in the southern and southwestern parts of the district.
Thus, the crop distribution for 2018–2025 is characterized by high interannual stability of spatial structure and reflects the typical features of the rainfed agro-landscape of southern Kazakhstan: the dominance of winter wheat, alternating clusters of spring cereals and safflower in foothill zones, and localized persistence of perennial forages. These results provide the necessary foundation for analyzing repeated winter sowing, interannual crop transitions, and long-term trends in the utilization of arable land (Figure 12).
Figure 12.
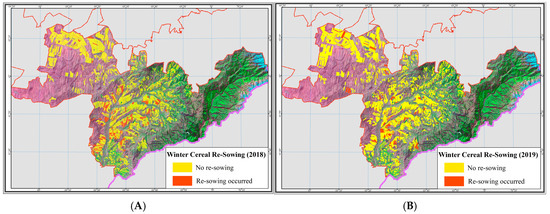
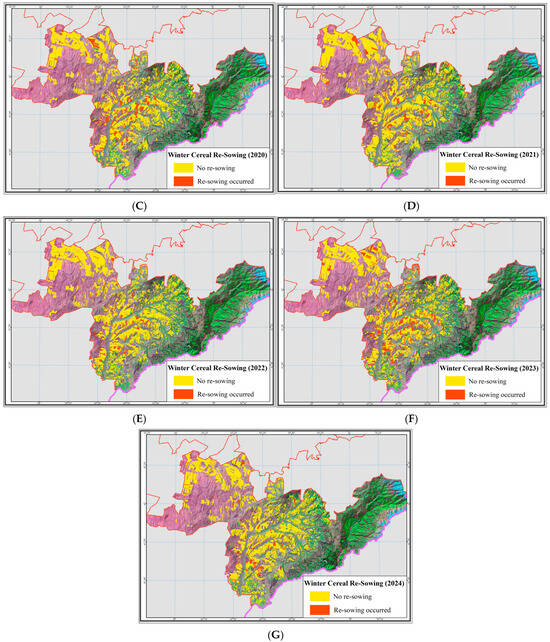
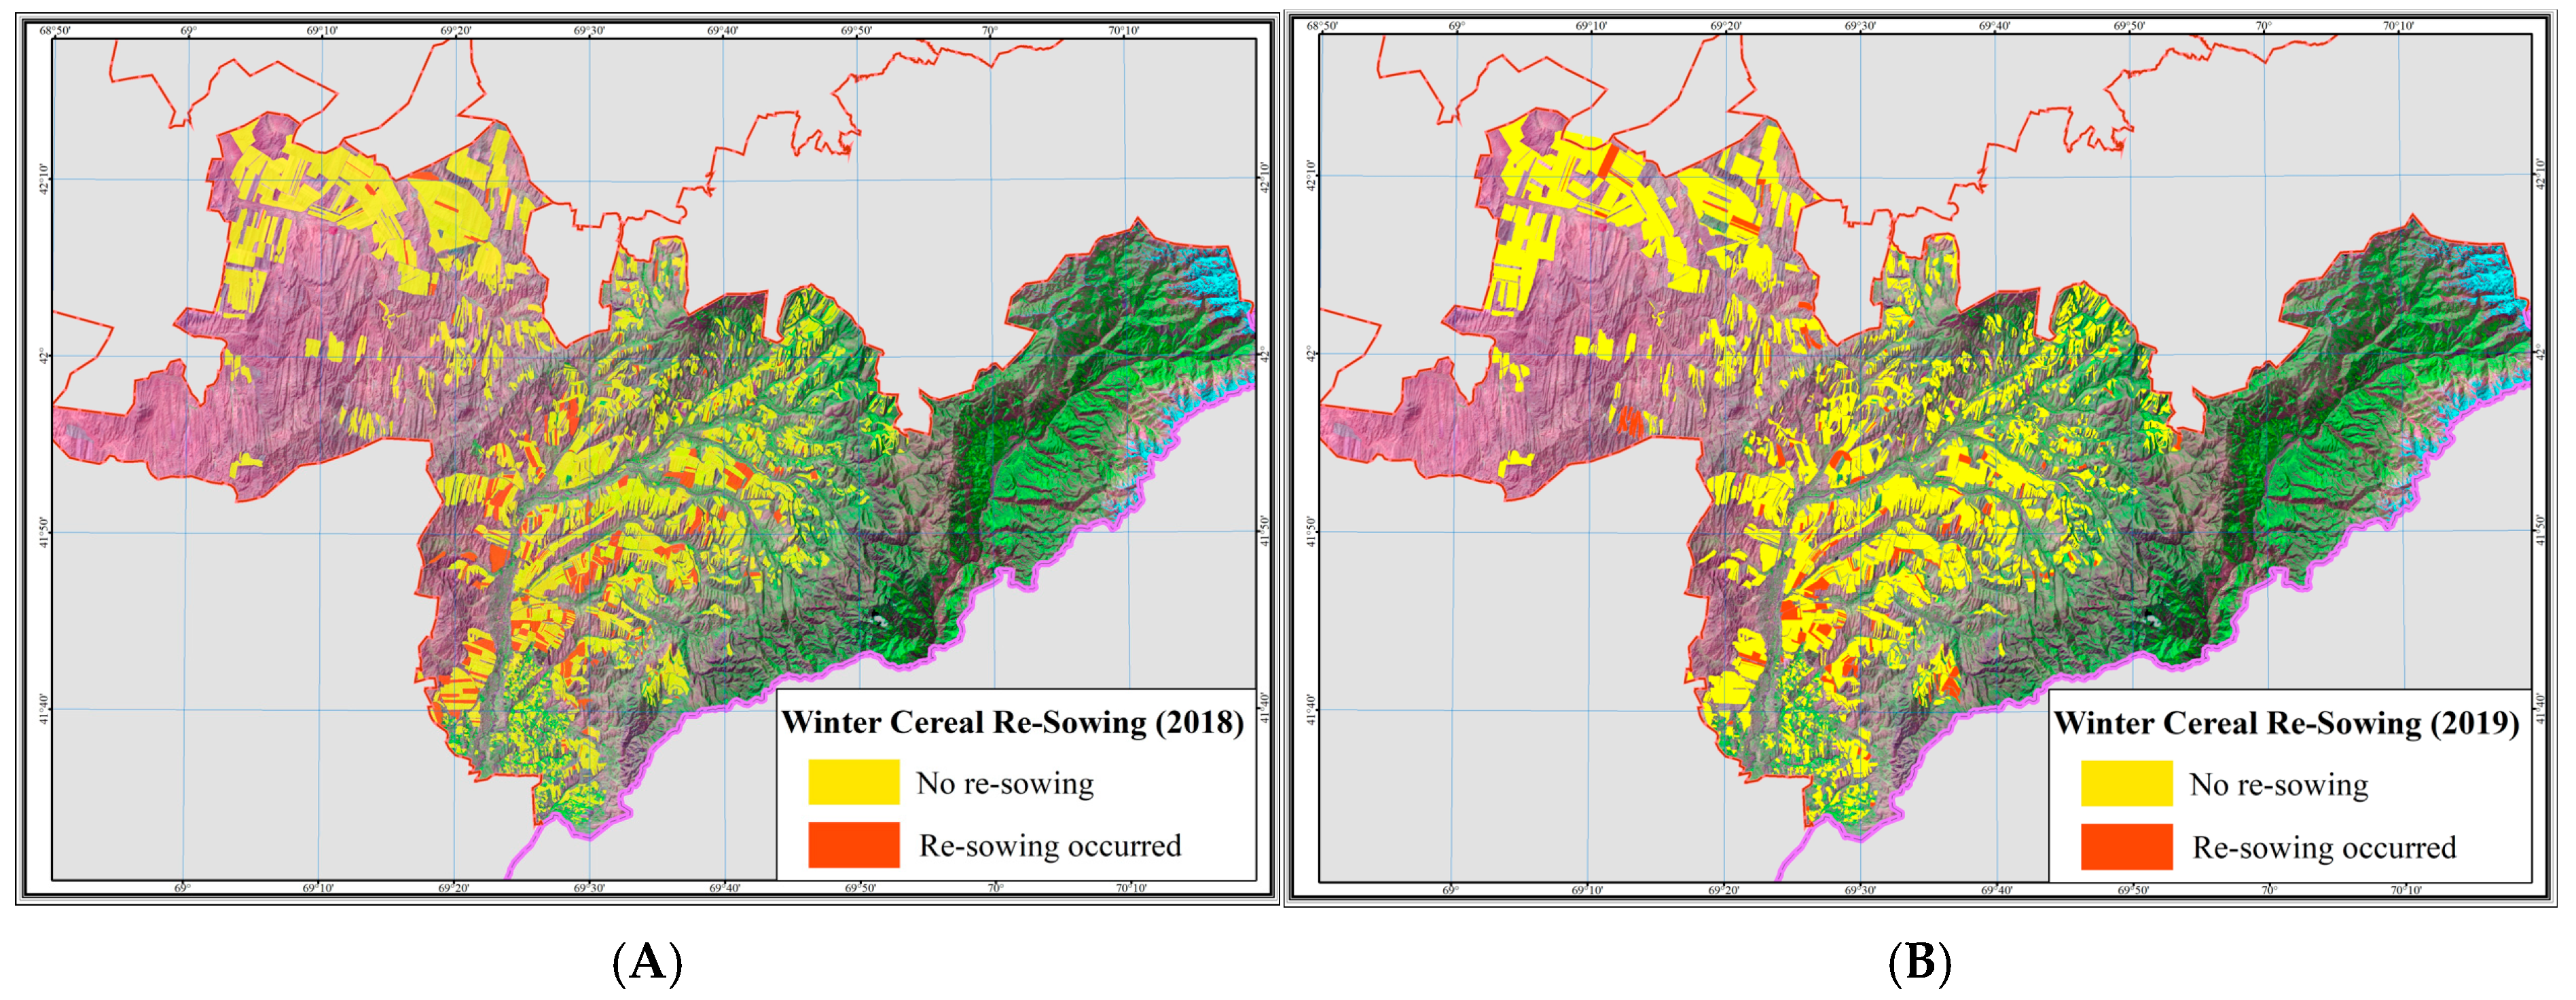
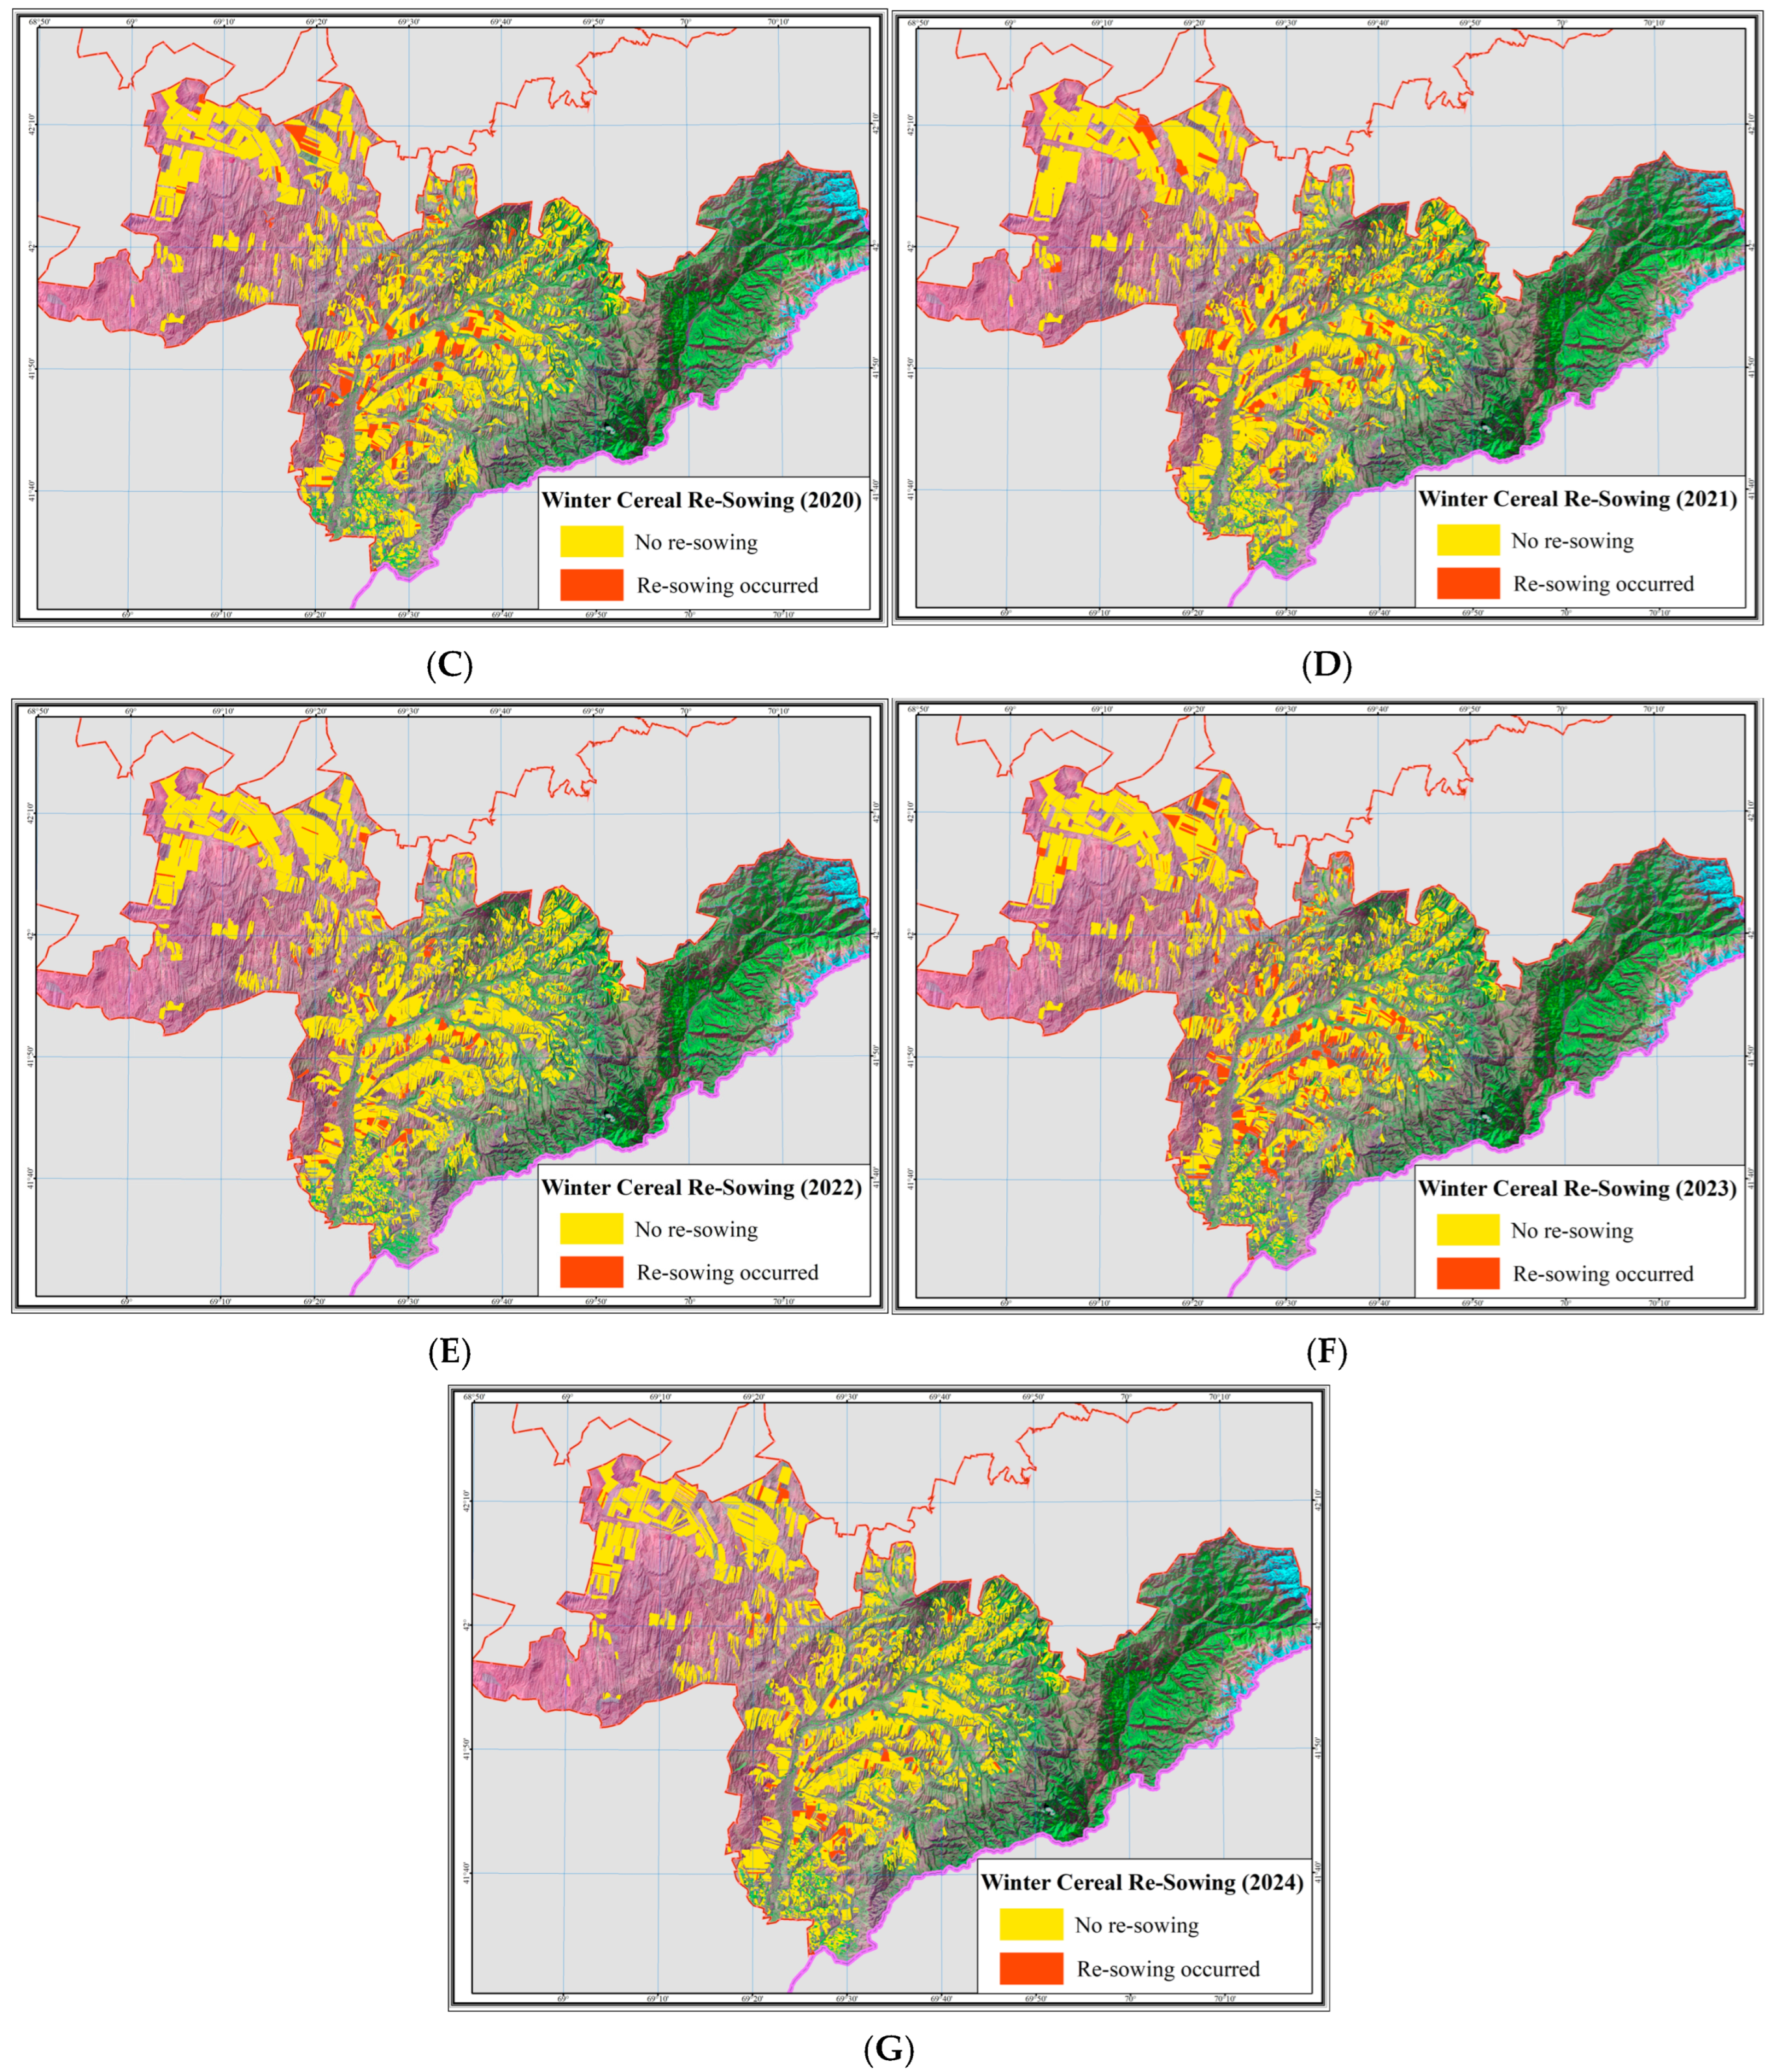
Spatial distribution of repeated winter cereal sowing in 2018–2024: (A)—2018; (B)—2019; (C)—2020; (D)—2021; (E)—2022; (F)—2023; (G)—2024. The background image is a Sentinel-2 false-color composite (SWIR2–NIR–Red), providing enhanced visualization of vegetation structure, cultivated fields, and surface moisture patterns.
3.2. Annual Occurrence of Winter Cereal Re-Sowing
The annual dynamics of repeated winter cereal sowing were assessed using seven transition intervals (2018 → 2019 … 2024 → 2025). For each interval, the area exhibiting the transition “spring crops/safflower → winter cereals” was calculated and interpreted as repeated sowing. These values were compared with the total winter-crop area derived from remote-sensing data for the corresponding year.
The results demonstrate substantial interannual variability in repeated sowing. In the first interval (2018 → 2019), the repeated-sowing area amounted to 9847 ha, representing a considerable share of the winter-crop area (39,035 ha). In subsequent years, interannual variability was observed, with a decrease in repeated sowing area to 6078 ha in 2019 → 2020, followed by an increase to 9432 ha in 2020 → 2021.
A notable feature is the 2022 → 2023 interval, which recorded the lowest repeated-sowing area—4125 ha—despite the unusually large winter-crop extent (301,629 ha), a discrepancy linked to the expanded agricultural-land figures reported in the 2023 official statistics of the Turkestan region. The highest repeated-sowing value occurred in 2023 → 2024 (12,800 ha), reflecting the substantial expansion of spring-crop areas in 2023 and the subsequent return of part of those fields to winter cereals. The final interval (2024 → 2025) exhibited a decrease in repeated sowing to 3711 ha, with a total winter-crop area of 36,301 ha (Table 6).
Table 6.
Annual area of repeated winter cereal sowing in 2018–2025.
When expressed as a proportion of the total winter-crop area, repeated sowing accounted for 10.2–27.5% depending on the transition year, with the highest relative contribution observed in 2023 → 2024 (27.5%) and the lowest in 2024 → 2025 (10.2%).
The spatial distribution of repeated winter sowing demonstrates clear and persistent patterns. In the foothill zone of the Kazygurt district, repeated sowing is concentrated on medium-slope terrains and in areas with highly mosaic land use, as consistently observed across the annual repetition maps. In the plain zone, repeated sowing appears more fragmented and is primarily associated with farms practicing intensive alternation of spring and autumn tillage operations.
The annual maps (Rep_2018–Rep_2024), presented in Figure 7, illustrate the spatial structure of repetitions and confirm the presence of both localized “re-sowing clusters” and stable zones without repeated sowing. These maps form the foundation for the subsequent analysis in Section 3.3, which focuses on long-term tendencies and the integrated repetition indicator (R-index).
3.3. Spatial Distribution of Repeated Sowing
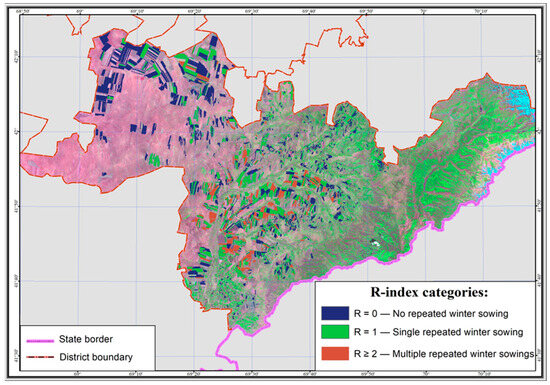
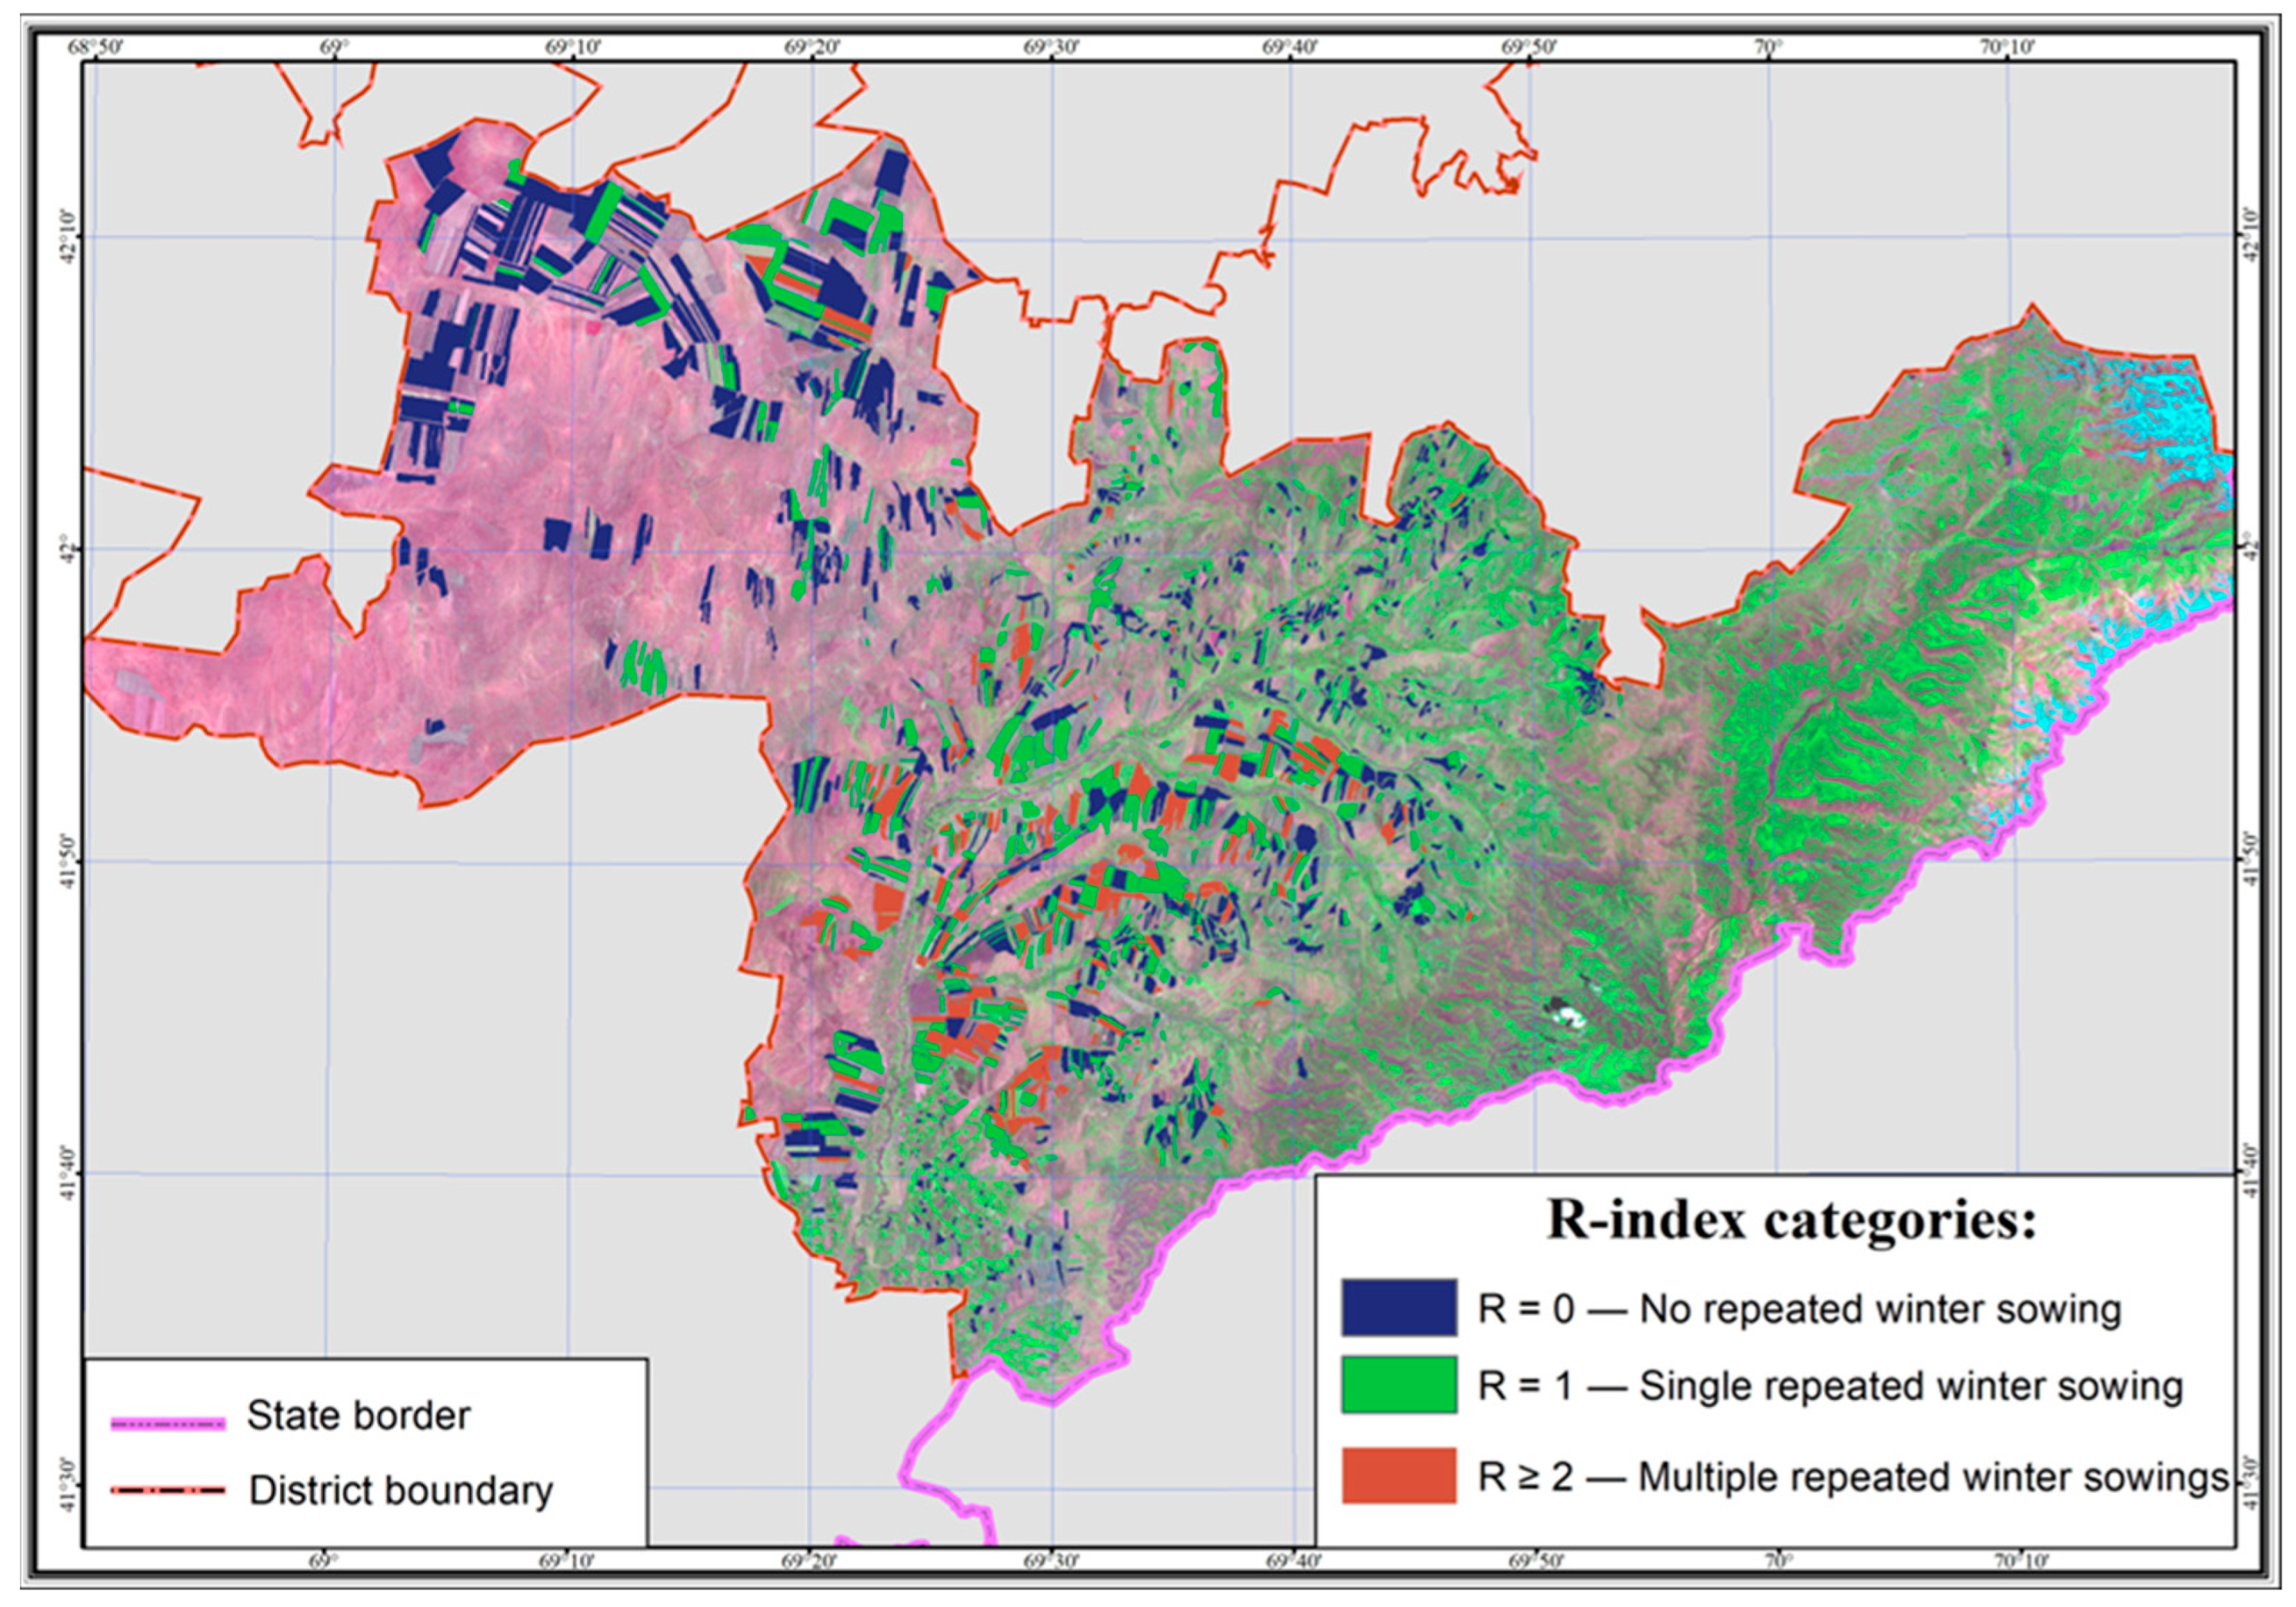
Spatial analysis of repeated winter sowing revealed a pronounced geographical heterogeneity in the distribution of “spring → winter” transitions within the study area. The annual repetition maps (Rep_2018–Rep_2024) show a persistent dominance of repeated sowing in foothill and mountain–plain transitional landscapes, where the agro-landscape is characterized by high mosaicity, complex terrain structure, and increased variability of microclimatic conditions. These zones include the southern and southeastern parts of the district, distinguished by marked vertical differentiation of cultivated areas (Figure 13).
Figure 13.
Map of repeated winter cereal sowing (R-index) in the Kazygurt district: R = 0—no repeated winter sowing; R = 1—single repeated winter sowing; R ≥ 2—multiple repeated winter sowing events. The background image is a Sentinel-2 false-color composite (SWIR2–NIR–Red), providing enhanced visualization of vegetation structure, cultivated fields, and surface moisture patterns.
In the northern and northwestern plains of the district, repeated winter seeding occurs far less frequently. Here, the spatial structure of fields is more homogeneous, field blocks are larger, and crop rotations follow more stable schemes. Consequently, the proportion of fields exhibiting repeated winter sowing is minimal in this part of the territory, reflected by the dominance of the “No re-sowing” category across all annual maps.
Comparison of year-by-year spatial patterns shows that the most intensive distribution of repeated sowing occurred in the transitional years 2020, 2021, and 2023, when repeated-sowing areas exceeded 8700–12,800 ha. These episodes spatially coincide with zones of heightened transformation of crop boundaries—areas where the alternation of spring crops (barley or safflower) and winter cereals occurred consecutively over several years. This concentration confirms the presence of stable “hotspots,” characterized by regular returns to winter cereals.
These hotspots are located along major floodplain systems, on slopes of moderate steepness, and in areas with favorable moisture conditions, where winter cereals display more stable long-term performance. Repetitions in these locations were recorded in nearly all annual Rep_2018–Rep_2024 layers, indicating the persistence of repeated winter sowing practices in these agricultural landscapes.
In contrast, stable “cold spots”—zones with no repeated sowing—are observed in the large plain field blocks of the northwest and central parts of the district, where stable rotations of spring crops prevail with minimal deviations. The existence of such territories confirms the spatial differentiation of land-use strategies.
Thus, the spatial distribution of repeated winter sowing forms a clear gradient: from rare repetitions in the plains to persistent zones of repeated sowing in the foothill agro-landscapes. This spatial pattern corresponds to the characteristics of relief, soil structure, and agroclimatic conditions in the study area and provides a basis for further interpretation of the factors influencing repeated sowing.
3.4. Field-Level Recurrence (R-Index)
Field-level recurrence of winter cereals was assessed using the integrated R-index, which reflects the number of “spring crop → winter crop” transitions over the eight-year observation period. For each cultivated field polygon, a final R-index value was assigned, representing the frequency of repeated winter sowing during the entire study period.
The results reveal marked spatial heterogeneity in recurrence. The largest area falls into the R = 0 category (26,071 ha), indicating no repeated winter seeding on most fields. An R = 1 value was recorded on 14,662 ha, representing one repeated-sowing event over eight years. Categories R = 2 and R = 3 account for 6474 ha and 1916 ha, respectively, indicating fields with a stable multi-year practice of returning to winter cereals.
Spatially, higher R-index values are concentrated in the foothill zone, where terrain and microclimatic conditions favor annual placement of winter crops. In the plains, R = 0–1 value dominates, consistent with more variable crop-rotation structures. These patterns are corroborated by the mapping materials (Figure 9), where recurrence levels are visualized for all R-index categories.
Thus, the R-index provides a quantitative basis for assessing the spatial stability of winter cropping, identifying fields with high winter-crop pressure, and delineating zones of regular repeated sowing that are relevant for agro monitoring and for evaluating soil resource depletion risks.
3.5. Crop Condition Under Repeated Sowing
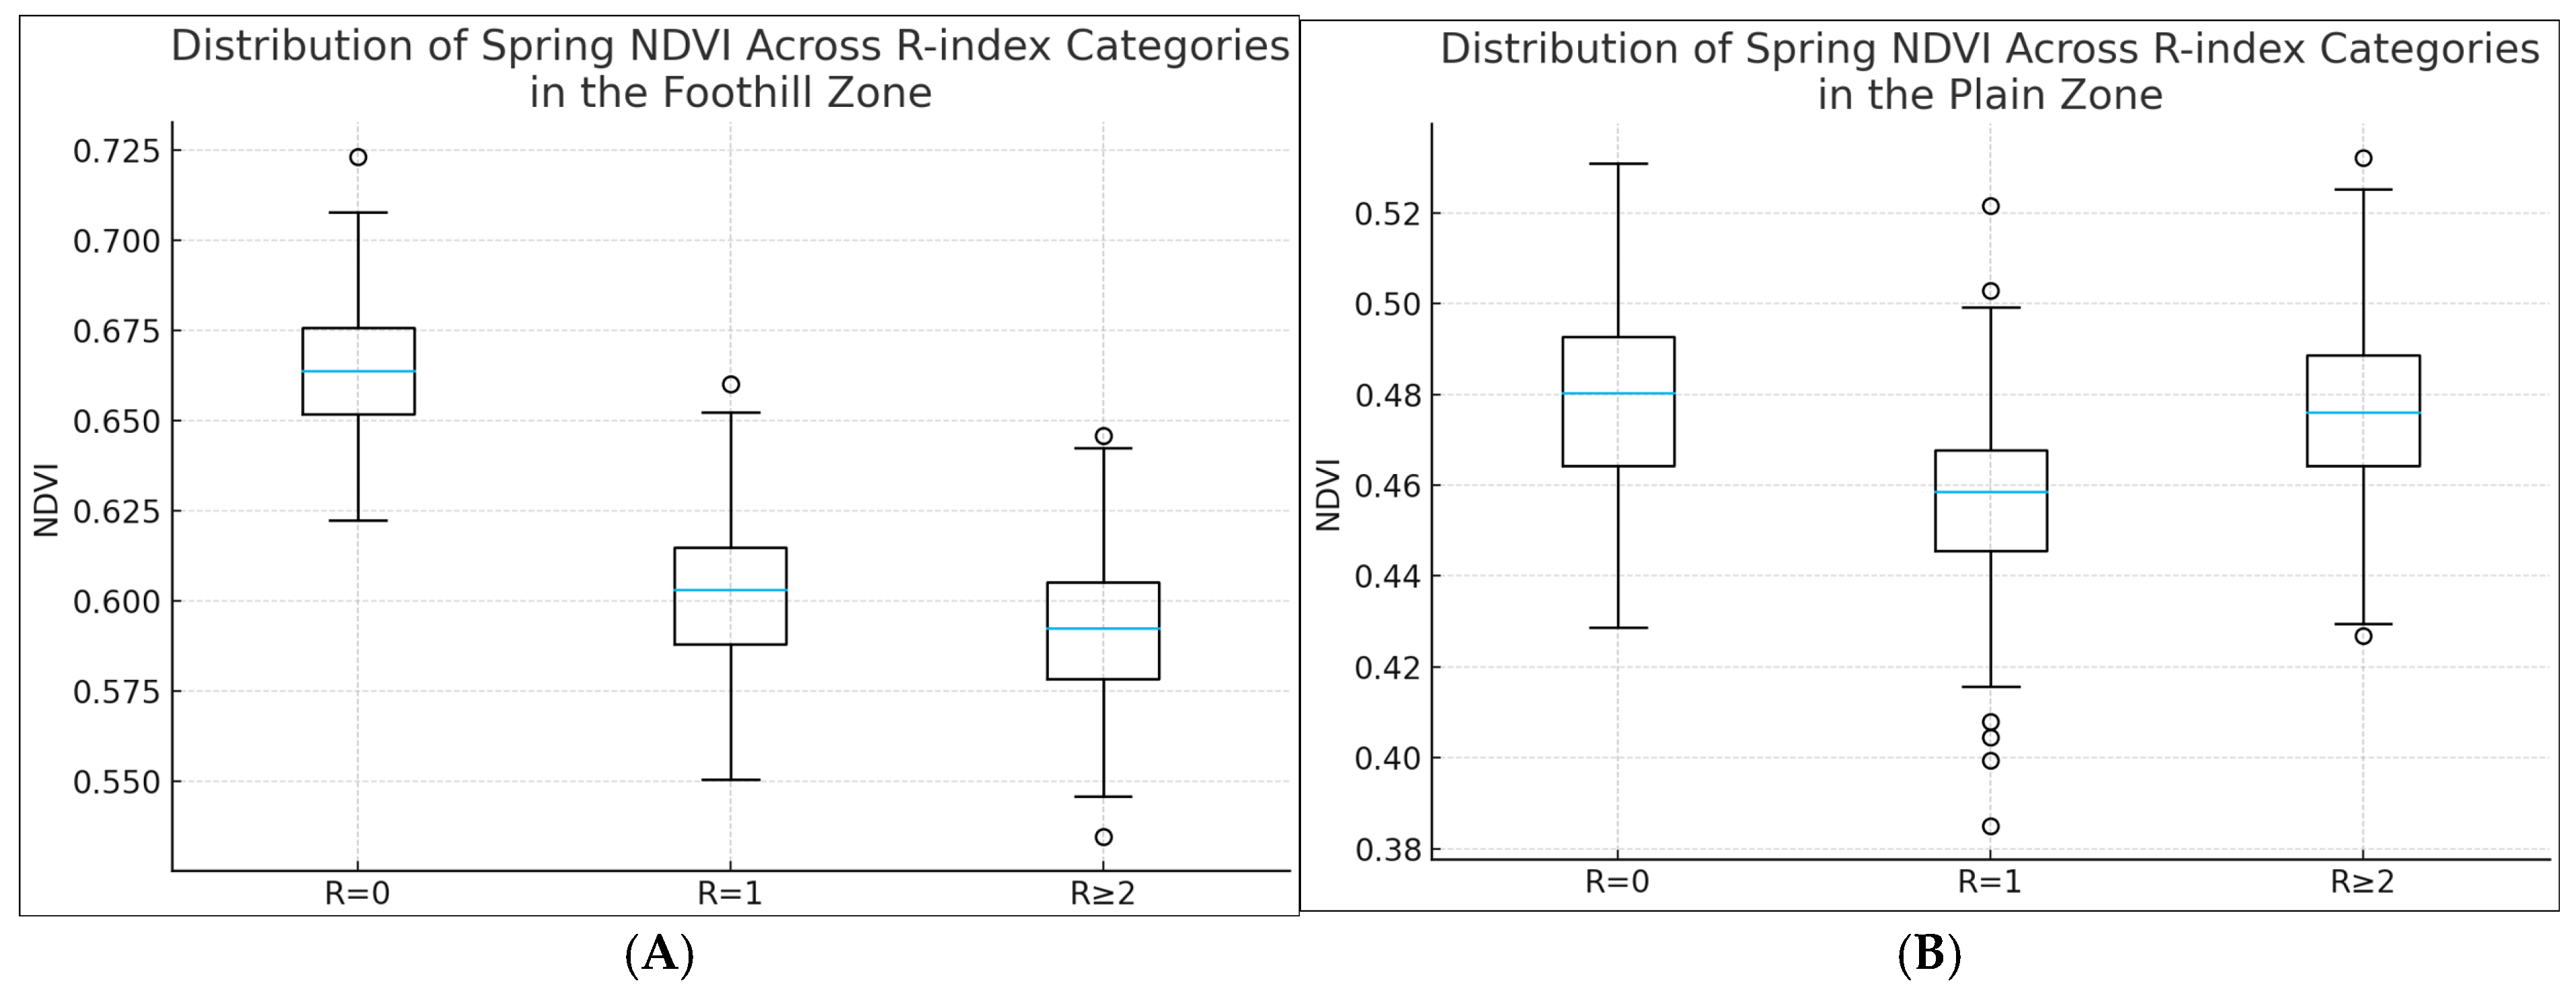
Crop condition was assessed using mean spring NDVI values extracted separately for foothill and plain areas. The analysis was based on comparing NDVI across R-index categories that reflect the accumulated frequency of “spring crop → winter crop” transitions over the eight-year observation period (Table 7, Figure 14).
Table 7.
Mean spring NDVI values for winter cereals as a function of repeated sowing frequency (R-index) in foothill and plain zones.
Figure 14.
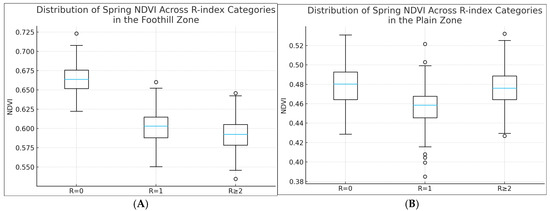
(A)—Distribution of Spring NDVI Across R-index Categories in the Foothill Zone; (B)—Distribution of Spring NDVI Across R-index Categories in the Plain Zone. In the box plots, the horizontal blue line inside each box indicates the median spring NDVI value for the corresponding R-index category. The box boundaries represent the interquartile range (25th–75th percentiles), while the whiskers extend to 1.5 times the interquartile range. Individual circles denote outliers, corresponding to fields with atypically high or low NDVI values relative to the main distribution.
The results demonstrate a clear pattern of declining vegetative activity with increasing frequency of repeated winter sowing. In the foothill zone, the mean NDVI is 0.665 in the absence of repeats (R = 0), decreases to 0.602 under a single repetition (R = 1), and reaches a minimum of 0.594 under multiple repetitions (R ≥ 2). A similar trend is observed in the plains: NDVI declines from 0.480 (R = 0) to 0.458 (R = 1), followed by partial recovery to 0.476 under R ≥ 2. This divergence between foothill and plain zones is driven by differences in water availability and contrasting microclimatic conditions.
The decrease in spring NDVI with increasing repetition frequency reflects two interconnected mechanisms. The first is associated with degradation of soil structure and reduced water-holding capacity resulting from successive annual autumn tillage. The second mechanism relates to delayed early growth stages of winter cereals on fields where winter → spring → winter cycles occur with minimal interruption. These effects are more pronounced in foothill environments, which is confirmed by the steeper NDVI gradient across R-index categories.
The observed relationships indicate that the multi-year dynamics of repeated winter sowing exert a cumulative impact on early-spring crop condition, and that NDVI serves as a sensitive indicator of this load in both structurally complex foothill agro-landscapes and the plain rainfed areas. It should be noted that NDVI reflects an integrated crop response and may also be influenced by varietal differences, fertilization regimes, and sowing dates, which were not explicitly accounted for in this analysis.
The comparison of spring NDVI across R-index categories reveals consistent differences in early-season vegetation development between fields with varying frequencies of repeated winter sowing. However, these patterns should be interpreted as comparative associations rather than causal effects. NDVI variations may also reflect differences in sowing dates, crop varieties, fertilization intensity, and local management practices, which were not explicitly controlled in the present study. Consequently, the NDVI results provide an indicative characterization of crop condition under repeated sowing, rather than a predictive assessment of agronomic impact.
3.6. Climatic Conditions and Their Influence on Multi-Year Crop Dynamics
The analysis of agroclimatic conditions based on data from the Kazygurt meteorological station for the period 2018–2025 revealed pronounced interannual variability in moisture and thermal supply during the spring period (April–May), which is critically important for the formation of winter cereal biomass. Total spring precipitation ranged from extremely low values (16–42 mm in 2023 and 2025) to high amounts (exceeding 130–160 mm in 2018 and 2020), while the Selyaninov hydrothermal coefficient (HTC) varied from 0.3 to 1.5, reflecting contrasting moisture conditions across years.
To quantitatively assess the relationships between climatic parameters and crop condition, a Spearman correlation analysis was conducted between spring NDVI values, total April–May precipitation, and HTC, calculated separately for the foothill and plain zones. The use of rank-based correlation was motivated by the limited length of the temporal series and the pronounced heterogeneity of agro-landscapes (Table 8).
Table 8.
Spearman correlation between agroclimatic indicators and spring NDVI (2018–2025).
The results of the correlation analysis revealed statistically significant positive relationships between spring climatic conditions and mean NDVI values in both zones. In the foothill part of the district, Spearman’s coefficients reached ρ = 0.86 (p = 0.006) for precipitation and ρ = 0.84 (p = 0.009) for HTC, indicating a high sensitivity of vegetation cover to interannual variability in moisture availability. In the plain zone, the relationships were more moderate (ρ = 0.74 and ρ = 0.71, respectively), which is consistent with a more buffered moisture regime and a reduced role of orographic effects.
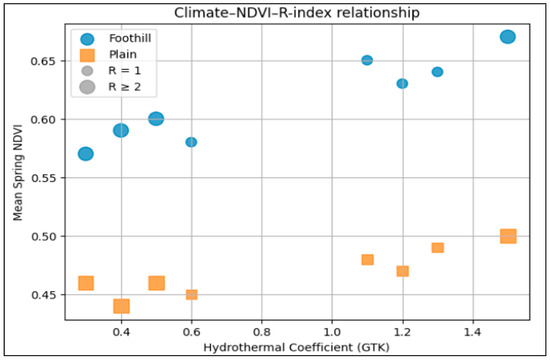
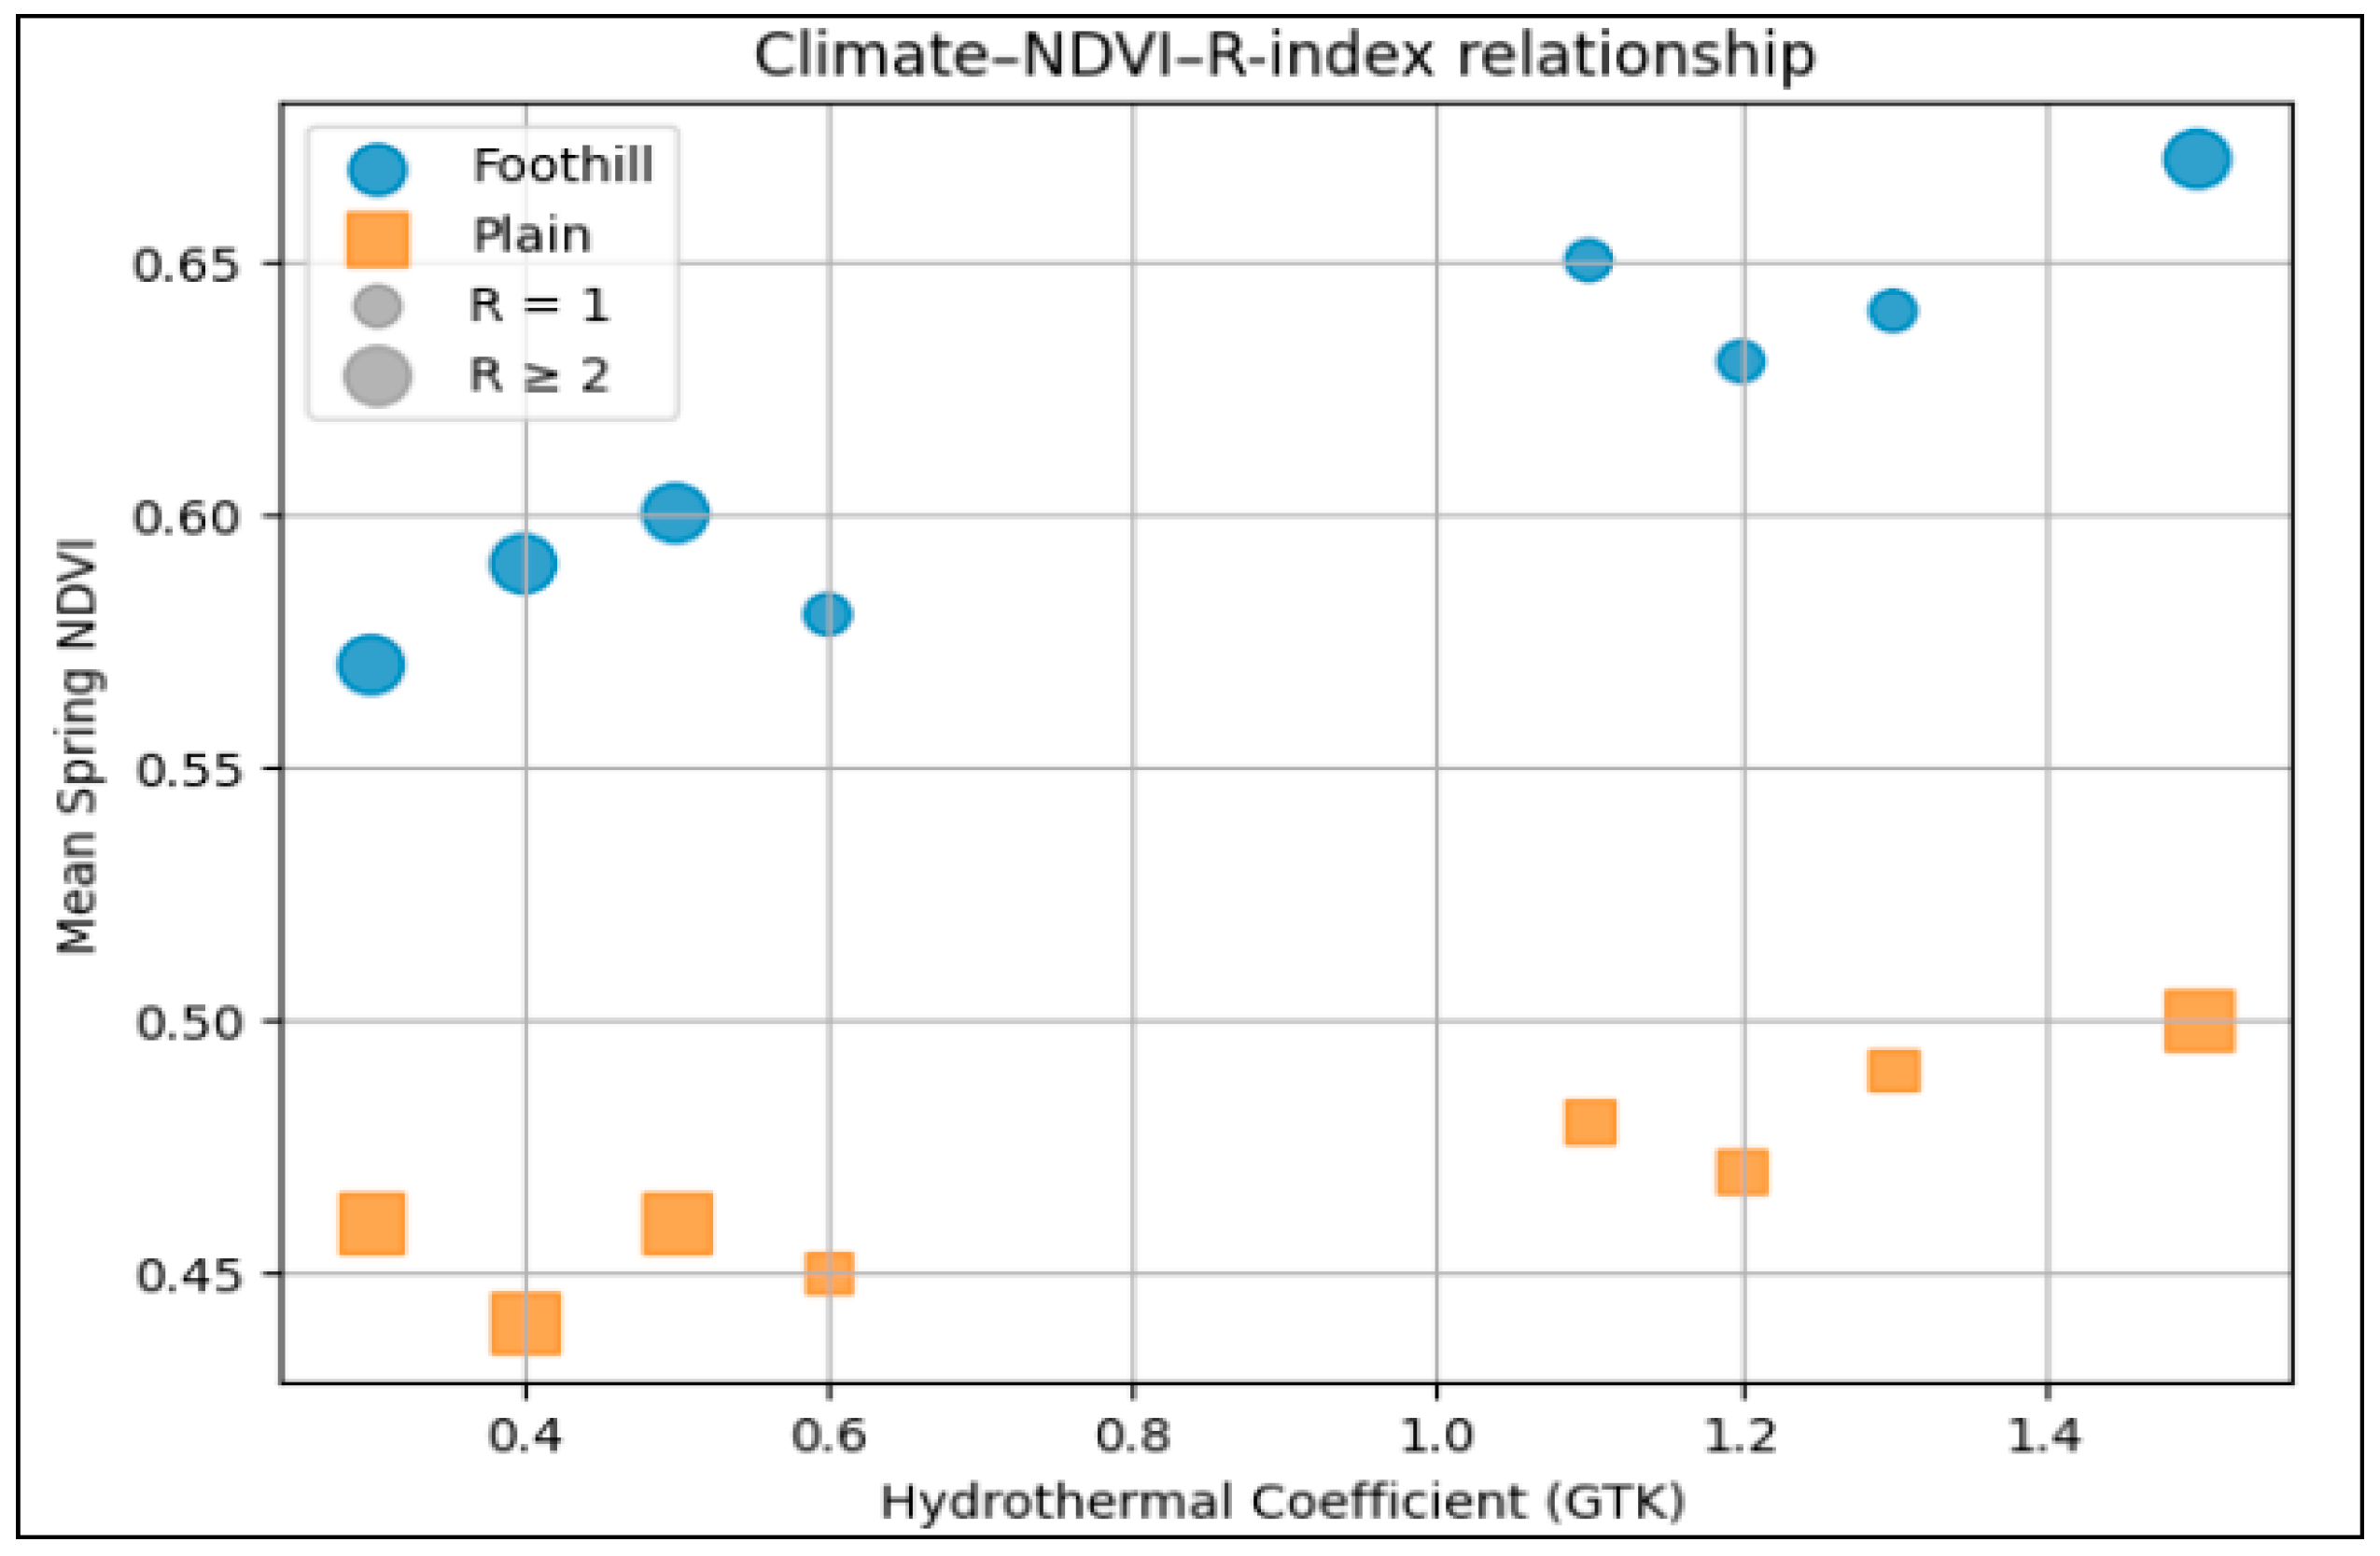
For visual interpretation of the combined influence of climatic conditions and repeated winter sowing, a joint visualization of NDVI dependence on HTC was performed, incorporating information on repetition frequency (R-index). Marker size represents the repeated sowing category, allowing climatic and agronomic factors to be examined within a unified feature space (Figure 15).
Figure 15.
Climate–NDVI–R-index relationship for foothill and plain zones (2018–2025). Note: marker size corresponds to R-index categories.
Analysis of the diagram shows that, for comparable R-index values, higher NDVI levels are consistently observed in years with elevated HTC (2019, 2020, 2024), whereas during dry seasons (2021, 2023, 2025), NDVI decreases regardless of repetition frequency. This indicates a comparable role of climatic constraints and agronomic pressure in shaping crop condition, particularly in foothill environments.
Overall, the results of the correlation analysis confirm that interannual variability in spring moisture exerts a statistically significant influence on the spatiotemporal dynamics of winter cereals. At the same time, the identified relationships should be interpreted as aggregated tendencies rather than direct cause–effect relationships, which is consistent with the scale and nature of the available data.
4. Discussion
The results demonstrate a stable spatiotemporal structure of repeated winter sowing under rainfed agricultural conditions in the Turkestan region. The dynamics of repeated-sowing areas across annual transitions showed substantial interannual variability, reflecting the influence of weather conditions, tillage timing, and differences in farming practices across land users. The largest repeating areas were observed for the 2020 → 2021 and 2023 → 2024 transitions, whereas the smallest values occurred in 2022 → 2023, consistent with the favorable autumn moisture conditions that year.
The spatial distribution of repeated sowing is characterized by a strong differentiation between foothill and plain zones. In the foothills, repeated sowing shows high local concentration, forming spatial clusters confirmed by cartographic analysis and by the statistical distribution of R-index categories. This spatial structure is shaped by three factors:
- Heterogeneity of microrelief affecting crop maturity and harvest timing
- Soil–water regime variability determining conditions for autumn preparation;
- High agro-landscape fragmentation caused by small field blocks and pronounced vertical zonation.
The relationship between recurrence frequency and spring NDVI revealed a consistent decline in spring biomass with increasing repetition. In the foothills, mean spring NDVI decreases from 0.665 (R = 0) to 0.594 (R ≥ 2), reflecting the potential effects of repeated tillage and reseeding on early-season crop conditions. In the plains, this pattern is less pronounced but remains evident. These differences indicate that repeated sowing influences the biophysical condition of winter cereals, especially in erosion-prone and orographically complex landscapes. In the present study, the influence of climatic factors was evaluated using an interannual comparative framework rather than formal regression modelling. This approach allowed the identification of stable tendencies linking precipitation conditions, the intensity of repeated winter sowing, and spring NDVI values under conditions of pronounced spatial heterogeneity typical of foothill agro-landscapes. The application of formal correlation and regression models requires longer temporal series and will be methodologically justified in future studies aimed at quantifying climate–crop interactions with higher statistical robustness.
The findings underscore the need for spatially adaptive land-use systems in landscapes with strong relief dissection and high erosion risk. A promising direction is contour–strip land management with the integration of shelter belts aligned along key slope gradients and microrelief features. Such systems reduce surface runoff, enhance infiltration, and stabilize soil moisture regimes—critical factors in foothill areas where multiple repeated winter sowings occur [46,47,48,49,50,51,52].
In many regions of Kazakhstan, nature-based solutions aimed at enhancing soil water retention and developing a “sponge soil” structure remain underutilized. Limited implementation stems from insufficient long-term economic incentives for farmers, short-term financing models, high initial investment costs, and the decline of large-scale state programs supporting shelterbelt systems that were widespread in previous decades. Reduced institutional support has led to widespread degradation of protective plantations, weakened soil moisture retention, and increased vulnerability to drought.
To strengthen land-use resilience, it is essential to develop long-term financing mechanisms, dual-education programs, and capacity-building initiatives in adaptive landscape design. Priority measures include regular agrochemical monitoring, hydrogeological assessment of soil moisture reserves, and broader adoption of contour farming and agroforestry. The combined use of nature-based land-management solutions can significantly increase soil water capacity, reduce erosion, and enhance the adaptive potential of agro-landscapes in southern Kazakhstan.
Therefore, the observed NDVI patterns should be interpreted as indicative of cumulative agro-environmental stress rather than as direct evidence of soil degradation caused solely by repeated winter sowing.
5. Conclusions
This study proposed a multi-year remote-sensing-based framework for identifying repeated winter cereal sowing in rainfed agro-landscapes of southern Kazakhstan using Sentinel-2 data and a deterministic classification approach based on NDVI phenology and the Plowed Land Index (PLI).
The developed classification dataset (2018–2025) enabled reconstruction of interannual crop transitions at the field level and provided a basis for analysing the spatial and temporal patterns of repeated winter sowing. The derived R-index served as an integrative indicator describing the frequency of “spring crop → winter crop” transitions over multiple years.
The results indicated pronounced interannual variability in repeated sowing areas and a clear spatial differentiation between foothill and plain zones. Foothill landscapes exhibited localized clusters of repeated sowing, reflecting the combined influence of microrelief, moisture variability, and fragmented field structure, whereas plains were dominated by stable crop-rotation patterns.
Comparative analysis of spring NDVI across R-index categories suggested a tendency toward lower NDVI values under higher repetition frequencies, particularly in foothill environments. However, these patterns should be interpreted as associations rather than direct causal effects, as spring NDVI is also strongly influenced by climatic conditions, crop management practices, and other agronomic factors.
Correlation analysis confirmed that agroclimatic conditions, especially spring precipitation and the hydrothermal coefficient, are significantly associated with spring NDVI and can modulate the effects linked to repeated sowing. The study highlights the importance of considering both climatic variability and land-use history when interpreting multi-year vegetation dynamics.
Overall, the proposed approach demonstrates the potential of integrating multi-year Sentinel-2 data, phenological indices, and field-level transition analysis for studying long-term land-use patterns. The findings provide a descriptive and analytical basis for further research aimed at quantitative modelling of climate–management interactions and for developing sustainable land-use strategies in erosion-prone foothill regions.
6. Recommendations for Sustainable Agriculture in Complex Landscape–Climatic Environments
The results highlight the need to adapt land-use practices in foothill and erosion-prone environments. For landscapes with pronounced orographic complexity and high degradation risk, the following measures are recommended:
- (1)
- Implementation of contour–strip land organization aligned with microrelief and natural drainage pathways.
- (2)
- Restoration and establishment of shelterbelts to enhance soil water retention, reduce wind erosion, and stabilize microclimatic conditions.
- (3)
- Development of nature-based soil–moisture solutions (“sponge soil” concept), including micro-terracing, bioengineering strips, and terrain-adaptive agro-landscape designs.
In Kazakhstan, these practices are currently applied only sporadically. Limitations include insufficient economic motivation for land users, dominance of short-term financial models, limited access to long-term credit, and the reduction in state programs supporting shelterbelt and soil protection agriculture over recent decades. These constraints have contributed to diminished soil moisture regulation, increased erosion, and reduced agro-ecosystem resilience.
Strengthening sustainable land use requires expanded systematic agrochemical monitoring, hydrogeological diagnostics, water balance assessment, and dual-education programs for farmer training. Financial incentives for shelterbelt establishment and contour farming are also essential. Integrated application of nature-based solutions can enhance soil water capacity, mitigate erosion, and improve the adaptive potential of agro-landscapes in southern Kazakhstan.
Author Contributions
Conceptualization, A.A.; Methodology, A.A., J.S., D.S. and E.Y.; Software, A.A. and B.S.; Validation, R.B.; Formal analysis, G.K., R.B. and D.M.; Investigation, D.S., M.B. and E.Y.; Data curation, G.K. and D.S.; Writing—original draft, A.A. and M.B.; Writing—review & editing, J.S.; Visualization, D.M., M.B., E.Y. and B.S.; Supervision, J.S.; Project administration, R.B. All authors have read and agreed to the published version of the manuscript.
Funding
This research has been funded by the Science Committee of the Ministry of Education and Science of the Republic of Kazakhstan, grant IRN AP25794147 “GIS Modeling of Winter Cereal Crop Yields in Southern Regions of Kazakhstan Using Remote Sensing Data under Climate Change Conditions”.
Institutional Review Board Statement
Not applicable.
Informed Consent Statement
Not applicable.
Data Availability Statement
The raw data supporting the conclusions of this article will be made available by the authors on request.
Conflicts of Interest
Author Gulnara Kabzhanova was employed by the company JSC “NC “Kazakhstan Gharysh Sapary”. The remaining authors declare that the research was conducted in the absence of any commercial or financial relationships that could be construed as a potential conflict of interest.
References
- Turebayeva, S.; Sydyk, D.; Seilkkhan, A.; Kazybaeva, A.; Zhanbyrbayev, Y.; Dossymbetova, S.; Abdrassulova, Z. Productivity of Winter Wheat (Triticum aestivum) as Influenced by Fertilizer Rates in Rainfed Fields of South Kazakhstan. Res. Crops 2021, 22, 747–758. [Google Scholar] [CrossRef] [Scilit]
- Turebayeva, S.; Zhapparova, A.; Kekilbayeva, G.; Kenzhegulova, S.; Aisakulova, K.; Yesseyeva, G.; Bissembayev, A.; Sikirić, B.; Sydyk, D.; Saljnikov, E. Development of Sustainable Production of Rainfed Winter Wheat with No-Till Technologies in Southern Kazakhstan. Agronomy 2022, 12, 950. [Google Scholar] [CrossRef] [Scilit]
- Conrad, C.; Usman, M.; Morper-Busch, L.; Schönbrodt-Stitt, S. Remote sensing-based assessments of land use, soil and vegetation status, crop production and water use in irrigation systems of the Aral Sea Basin. A review. Water Secur. 2020, 11, 100078. [Google Scholar] [CrossRef] [Scilit]
- Raab, C.; Spies, M. Characterising cropland fragmentation in post-Soviet Central Asia, using Landsat remote-sensing time series data. Appl. Geogr. 2023, 156, 102968. [Google Scholar] [CrossRef] [Scilit]
- Tucker, C.J. Red and photographic infrared linear combinations for monitoring vegetation. Remote Sens. Environ. 1979, 8, 127–150. [Google Scholar] [CrossRef] [Scilit]
- Drusch, M.; Del Bello, U.; Carlier, S.; Colin, O.; Fernandez, V.; Gascon, F.; Hoersch, B.; Isola, C.; Laberinti, P.; Martimort, P.; et al. Sentinel-2: ESA’s Optical High-Resolution Mission for GMES Operational Services. Remote Sens. Environ. 2012, 120, 25–36. [Google Scholar] [CrossRef] [Scilit]
- Belgiu, M.; Csillik, O. Sentinel-2 cropland mapping using pixel-based and object-based time-weighted dynamic time warping analysis. Remote Sens. Environ. 2017, 204, 509–523. [Google Scholar] [CrossRef] [Scilit]
- Immitzer, M.; Vuolo, F.; Atzberger, C. First Experience with Sentinel-2 Data for Crop and Tree Species Classifications in Central Europe. Remote Sens. 2016, 8, 166. [Google Scholar] [CrossRef] [Scilit]
- Saini, R.; Ghosh, S. Crop classification using Sentinel-2 imagery using random forest and suppor vector machine. The International Archives of the Photogrammetry. Remote Sens. Spat. Inf. Sci. 2018, 42, 683–688. [Google Scholar] [CrossRef] [Scilit]
- Barker, B.; Whitcraft, A.; Oliva, P.; Mobley, K.; Justice, C.; Sahajpal, R. Crop Type Maps for Operational Global Agricultural Monitoring. Sci. Data 2023, 10, 172. [Google Scholar] [CrossRef] [Scilit] [PubMed]
- Li, G.; Han, W.; Dong, Y.; Zhai, X.; Huang, S.; Ma, W.; Cui, X.; Wang, Y. Multi-Year Crop Type Mapping Using Sentinel-2 Imagery and Deep Semantic Segmentation Algorithm in the Hetao Irrigation District in China. Remote Sens. 2022, 15, 875. [Google Scholar] [CrossRef] [Scilit]
- Burger, R.; Aouizerats, B.; Den Besten, N.; Guillevic, P.; Catarino, F.; Jackson, D.; Koopmans, R.; Ridderikhoff, M.; Robson, G.; Zajdband, A.; et al. The Biomass Proxy: Unlocking Global Agricultural Monitoring through Fusion of Sentinel-1 and Sentinel-2. Remote Sens. 2023, 16, 835. [Google Scholar] [CrossRef] [Scilit]
- Dubrovin, K.; Verkhoturov, A.; Stepanov, A.; Aseeva, T. Multi-Year Cropland Mapping Based on Remote Sensing Data: A Case Study for the Khabarovsk Territory, Russia. Remote Sens. 2023, 16, 1633. [Google Scholar] [CrossRef] [Scilit]
- Zhao, X.; Wang, J.; Ding, Y.; Gao, X.; Li, C.; Huang, H.; Gao, X. High-resolution (10 m) dataset of multi-crop planting structure on the Loess Plateau during 2018–2022. Sci. Data 2025, 12, 1190. [Google Scholar] [CrossRef] [Scilit] [PubMed]
- Qiu, B.; Hu, X.; Chen, C.; Tang, Z.; Yang, P.; Zhu, X.; Yan, C.; Jian, Z. Maps of cropping patterns in China during 2015–2021. Sci. Data 2022, 9, 479. [Google Scholar] [CrossRef] [Scilit] [PubMed]
- Hu, J.; Zhang, B.; Peng, D.; Huang, J.; Zhang, W.; Zhao, B.; Li, Y.; Cheng, E.; Lou, Z.; Liu, S.; et al. Mapping 10-m harvested area in the major winter wheat-producing regions of China from 2018 to 2022. Sci. Data 2024, 11, 1038. [Google Scholar] [CrossRef] [Scilit]
- Qi, H.; Qian, X.; Shang, S.; Wan, H. Multi-year mapping of cropping systems in regions with smallholder farms from Sentinel-2 images in Google Earth engine. GISci. Remote Sens. 2024, 61, 2309843. [Google Scholar] [CrossRef] [Scilit]
- Löw, F.; Fliemann, E.; Abdullaev, I.; Conrad, C.; Lamers, J.P. Mapping abandoned agricultural land in Kyzyl-Orda, Kazakhstan using satellite remote sensing. Appl. Geogr. 2015, 62, 377–390. [Google Scholar] [CrossRef] [Scilit]
- Löw, F.; Prishchepov, A.V.; Waldner, F.; Dubovyk, O.; Akramkhanov, A.; Biradar, C.; Lamers, J.P. Mapping Cropland Abandonment in the Aral Sea Basin with MODIS Time Series. Remote Sens. 2018, 10, 159. [Google Scholar] [CrossRef] [Scilit]
- Gorooei, A.; Gaiser, T.; Aynehband, A.; Rahnama, A.; Kamali, B. The Effect of Farming Management and Crop Rotation Systems on Chlorophyll Content, Dry Matter Translocation, and Grain Quantity and Quality of Wheat (Triticum aestivum L.) Grown in a Semi-Arid Region of Iran. Agronomy 2023, 13, 1007. [Google Scholar] [CrossRef] [Scilit]
- Unal, E.; de Bie, C.A.J.M. Mapping Wheat Growing Areas of Turkey by Integrating Multi-Temporal NDVI Data and Official Crop Statistics. J. Field Crops Cent. Res. Inst. 2017, 26, 11–23. [Google Scholar] [CrossRef] [Scilit]
- Martínez-Casasnovas, J.A.; Martín-Montero, A.; Auxiliadora Casterad, M. Mapping multi-year cropping patterns in small irrigation districts from time-series analysis of Landsat TM images. Eur. J. Agron. 2005, 23, 159–169. [Google Scholar] [CrossRef] [Scilit]
- Sadenova, M.A.; Beisekenov, N.A.; Varbanov, P.S.; Kulenova, N.A.; Abitaev, F.; Kamenev, Y. Digitalization of crop production for transition to climate-optimized agriculture using spring wheat in East Kazakhstan as an example. Chem. Eng. Trans. 2022, 96, 415–420. [Google Scholar] [CrossRef]
- Arystanov, A.; Karabkina, N.; Sagin, J.; Nurguzhin, M.; King, R.; Bekseitova, R. Use of Indices Applied to Remote Sensing for Establishing Winter–Spring Cropping Areas in the Republic of Kazakhstan. Sustainability 2023, 16, 7548. [Google Scholar] [CrossRef] [Scilit]
- Arystanov, A.; Sagin, J.; Karabkina, N.; Arystanova, R.; Yermekov, F.; Kabzhanova, G.; Bekseitova, R.; Aktymbayeva, A.; Kutymova, N. Automatic Classification of Agricultural Crops Using Sentinel-2 Data in the Rainfed Zone of Southern Kazakhstan. Agronomy 2025, 15, 2040. [Google Scholar] [CrossRef] [Scilit]
- Karabkina, N. Operational Solution of Space Monitoring of Grain Crops in South Kazakhstan Based on Data of Sentinel-2, Landsat-8, PlanetScope. In Proceedings of the 16th All-Russia Open Conference on Current Problems in Remote Sensing of the Earth from Space, Moscow, Russia, 12–16 November 2018; pp. 321–328. [Google Scholar]
- Mustafayev, Z.; Skorintseva, I.; Toletayev, A.; Bassova, T.; Aldazhanova, G. Assessment of climate change in natural areas of the Turkestan region of the Republic of Kazakhstan for the purposes of sustainable agricultural and recreational nature management. Geo J. Tour. Geosites 2023, 46, 70–77. [Google Scholar] [CrossRef] [Scilit]
- Mustafayev, Z.; Skorintseva, I.; Toletayev, A.; Kuderin, A.; Omarov, A. Assessment of soil resources of agricultural landscapes in Turkestan region of the Republic of Kazakhstan based on agrochemical indexes. Open Geosci. 2024, 16, 20220652. [Google Scholar] [CrossRef] [Scilit]
- Toletayev, A.; Mustafayev, Z.; Skorintseva, I.; Bassova, T.; Omarov, A. Assessment of agroclimatic resources in agricultural landscapes of the Turkestan region of the Republic of Kazakhstan. J. Water Land Dev. 2024, 62, 76–87. [Google Scholar] [CrossRef] [Scilit]
- Sentinel-2, European Copernicus Satellite Mission Program. Available online: https://dataspace.copernicus.eu/data-collections/copernicus-sentinel-data/sentinel-2 (accessed on 11 January 2026).
- Hagolle, O.; Sylvander, S.; Huc, M.; Claverie, M.; Clesse, D.; Dechoz, C.; Lonjou, V.; Poulain, V. SPOT-4 (Take 5): Simulation of Sentinel-2 Time Series on 45 Large Sites. Remote Sens. 2015, 7, 12242–12264. [Google Scholar] [CrossRef] [Scilit]
- Bauer-Marschallinger, B.; Falkner, K. Wasting petabytes: A survey of the Sentinel-2 UTM tiling grid and its spatial overhead. ISPRS J. Photogramm. Remote Sens. 2023, 202, 682–690. [Google Scholar] [CrossRef] [Scilit]
- Packt Publishing. ArcGIS Pro 3.x Cookbook, 2nd ed.; Packt Publishing Ltd.: Birmingham, UK, 2024. [Google Scholar]
- Bajali, W. ArcGIS Pro and ArcGIS Online: Applications in Water and Environmental Sciences; Springer: Cham, Switzerland, 2023. [Google Scholar]
- Selyaninov, G.T. Methods of agricultural climatological characterization of moisture conditions. Proc. All-Union Res. Inst. Agric. Meteorol. 1937, 20, 165–177. (In Russian) [Google Scholar]
- Chirkov, Y.I. Agrometeorology; Gidrometeoizdat: Leningrad, Russia, 1968; p. 320. (In Russian) [Google Scholar]
- Spearman, C. The proof and measurement of association between two things. Am. J. Psychol. 1904, 15, 72–101. [Google Scholar] [CrossRef] [Scilit]
- Mukaka, M.M. Statistics corner: A guide to appropriate use of correlation coefficient in medical research. Malawi Med. J. 2012, 24, 69–71. [Google Scholar]
- Uribeetxebarria, A.; Castellón, A.; Aizpurua, A. A First Approach to Determine If It Is Possible to Delineate In-Season N Fertilization Maps for Wheat Using NDVI Derived from Sentinel-2. Remote Sens. 2021, 14, 2872. [Google Scholar] [CrossRef] [Scilit]
- Nasrallah, A.; Baghdadi, N.; Mhawej, M.; Faour, G.; Darwish, T.; Belhouchette, H.; Darwich, S. A Novel Approach for Mapping Wheat Areas Using High Resolution Sentinel-2 Images. Sensors 2018, 18, 2089. [Google Scholar] [CrossRef] [Scilit] [PubMed]
- Skendžić, S.; Zovko, M.; Lešić, V.; Pajač Živković, I.; Lemić, D. Detection and Evaluation of Environmental Stress in Winter Wheat Using Remote and Proximal Sensing Methods and Vegetation Indices—A Review. Diversity 2023, 15, 481. [Google Scholar] [CrossRef] [Scilit]
- Li, F.; Ren, J.; Wu, S.; Zhao, H.; Zhang, N. Comparison of Regional Winter Wheat Mapping Results from Different Similarity Measurement Indicators of NDVI Time Series and Their Optimized Thresholds. Remote Sens. 2020, 13, 1162. [Google Scholar] [CrossRef] [Scilit]
- Qu, C.; Li, P.; Zhang, C. A spectral index for winter wheat mapping using multi-temporal Landsat NDVI data of key growth stages. ISPRS J. Photogramm. Remote Sens. 2021, 175, 431–447. [Google Scholar] [CrossRef] [Scilit]
- Winsemius, S.; Braaten, J. Zonal Statistics. In Cloud-Based Remote Sensing with Google Earth Engine; Cardille, J.A., Crowley, M.A., Saah, D., Clinton, N.E., Eds.; Springer: Cham, Switzerland, 2024. [Google Scholar] [CrossRef] [Scilit]
- Chatterjee, S.; Murray, S.C.; Matias, F.I.; Fahlgren, N. FIELDimagePy: A tool to estimate zonal statistics from an image, bounded by one or multiple polygons. Crop Sci. 2024, 65, e21357. [Google Scholar] [CrossRef] [Scilit]
- Gathagu, J.N.; Mourad, K.A.; Sang, J. Effectiveness of Contour Farming and Filter Strips on Ecosystem Services. Water 2018, 10, 1312. [Google Scholar] [CrossRef] [Scilit]
- Sahu, M.; Gu, R.R. Modeling the effects of riparian buffer zone and contour strips on stream water quality. Ecol. Eng. 2009, 35, 1167–1177. [Google Scholar] [CrossRef] [Scilit]
- Choudhary, R.; Sharma, S.; Gautam, S.K. Contour farming and strip cropping for soil protection. In Soil Conservation Techniques and Erosion Control; Kumar, R., Senthamizhkumaran, V.R., Verma, S., Lallawmkimi, M.C., Mubeen, Eds.; Golden Leaf Publishers: Lucknow, Uttar Pradesh, India, 2024; pp. 112–130. [Google Scholar]
- Kaur, A.; Paruchuri, R.G.; Nayak, P.; Devi, K.B.; Upadhyay, L.; Kumar, A.; Yousuf, M. The role of agroforestry in soil conservation and sustainable crop production: A comprehensive review. Int. J. Environ. Clim. Change 2023, 13, 3089–3095. [Google Scholar] [CrossRef] [Scilit]
- Wu, G. Soil and Water Conservation in Agricultural and Forestry Systems. Water 2019, 11, 1937. [Google Scholar] [CrossRef] [Scilit]
- Chaudhary, V.P.; Ghaley, B.B. Insights into Beneficial Effects of an Agroforestry System on Soil Properties and Crop Yields: A Case Study from the Experimental Farm at University of Copenhagen, Denmark. Sustainability 2024, 17, 1466. [Google Scholar] [CrossRef] [Scilit]
- Yair, A.; Víctor, J.; César, J.; María, R. Agroforestry Systems Enhance Soil Moisture Retention and Aquifer Recharge in a Semi-Arid Mexican Valley. Water 2024, 17, 1488. [Google Scholar] [CrossRef] [Scilit]

Disclaimer/Publisher’s Note: The statements, opinions and data contained in all publications are solely those of the individual author(s) and contributor(s) and not of MDPI and/or the editor(s). MDPI and/or the editor(s) disclaim responsibility for any injury to people or property resulting from any ideas, methods, instructions or products referred to in the content. |
© 2026 by the authors. Licensee MDPI, Basel, Switzerland. This article is an open access article distributed under the terms and conditions of the Creative Commons Attribution (CC BY) license.