


Abstract
Impervious surface expansion is a defining manifestation of urbanization, but changes in total area alone cannot reveal how transitions in development density reshape landscape structure. Adopting an integrated area–density perspective, this study examined impervious surface expansion and landscape reconfiguration in Zhengzhou, China, using Landsat observations from 1990, 2000, 2010, and 2019. Impervious surface fractions were estimated using dynamic endmember linear spectral mixture analysis. Impervious surface area (ISA) was assessed using expansion statistics, spatial autocorrelation, and standard deviational ellipses, while transitions among six impervious surface percentage (ISP) classes were analyzed using transition matrices and landscape metrics. Total ISA increased from 71.12 to 523.34 km2. Absolute expansion peaked during 2000–2010, whereas annual expansion intensity declined from 14.70% in 1990–2000 to 4.07% in 2010–2019. ISA expansion exhibited significant positive spatial autocorrelation (Moran’s I = 0.404–0.663), and the footprint retained a southeast–northwest orientation. Natural surfaces declined from 92.16% to 12.75%, accompanied by growth in high-density and fully impervious classes. Decreasing CONTAG and increasing SHDI indicated weakened landscape continuity and greater configurational diversity. Urban development shifted from outward land conversion toward heterogeneous density reconfiguration. Sustainable planning should prioritize reconnecting residual natural surfaces, managing growth in fragmented transition zones, and promoting redevelopment in high-density areas.
1. Introduction
Rapid urbanization has transformed extensive areas of vegetation, cropland, wetlands, and other permeable land into roofs, roads, pavements, and related impervious surfaces [1,2]. Because impervious cover modifies surface energy exchange, rainfall–runoff pathways, and pollutant transport, its extent and spatial configuration are widely used to characterize urban growth and associated environmental pressure [3,4,5]. Impervious surface monitoring is therefore relevant not only to land-cover mapping but also to sustainable urban planning, particularly in rapidly growing cities where the retention and connectivity of natural surfaces must be balanced against continued development.
Remote sensing provides a consistent basis for reconstructing impervious surface change over several decades. Existing approaches include spectral indices, supervised classifiers, regression and decision-tree models, and spectral mixture analysis [6,7]. Spectral mixture analysis is especially useful for medium-resolution imagery because it estimates subpixel land-cover fractions within heterogeneous urban pixels. Following the vegetation–impervious surface–soil framework [8], linear spectral mixture analysis has been widely applied to urban composition mapping [9,10]. Its main limitation is the spectral similarity between bare soil and some impervious materials, particularly in suburban and construction areas. The dynamic endmember linear spectral mixture analysis (DELSMA) model addresses this problem by stratifying an image before selecting layer-specific endmembers and has previously shown improved performance for Landsat sensors in Zhengzhou [11,12].
Most urban impervious-surface studies emphasize total area, expansion direction, or binary conversion between built and non-built land [13,14]. These approaches have established where and how rapidly urban footprints expand, while landscape-metric studies have quantified fragmentation, aggregation, shape complexity, and compositional diversity. However, these two strands are often treated separately, leaving an important process unresolved: how outward land conversion and internal changes in development density jointly reorganize landscape structure through successive stages of urbanization. Recent work on sustainable urban morphology likewise emphasizes that environmental performance depends not only on the amount of urbanized land but also on density, compactness, spatial configuration, and the continuity of open spaces [15]. In this context, impervious surface area (ISA) represents the aggregate amount of impervious cover, whereas impervious surface percentage (ISP) captures subpixel development density. Integrating ISA, ISP transitions, and landscape metrics therefore creates a continuous explanatory chain from footprint expansion, through density reconfiguration, to landscape response. This integration provides information that cannot be obtained from binary expansion analysis or landscape metrics alone and is particularly relevant for distinguishing residual natural areas, rapidly converting urban fringes, and established high-density districts.
Accordingly, this study applies an integrated ISA–ISP framework to the central urban area of Zhengzhou over 1990–2019 and addresses three research questions: (1) How did the magnitude, spatial clustering, and directional structure of impervious-surface expansion evolve across the three development intervals? (2) How did transitions among impervious-density classes vary from early expansion to accelerated growth and the subsequent slower-development stage? (3) How were these area and density transitions associated with changes in landscape fragmentation, aggregation, boundary complexity, and diversity? By linking these questions within a single framework, the study aims to distinguish outward land conversion from internal density reconfiguration and to clarify their combined implications for sustainable land-use management.
2. Materials and Methods
2.1. Study Area
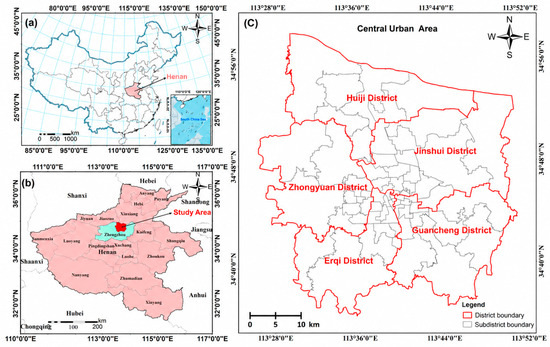
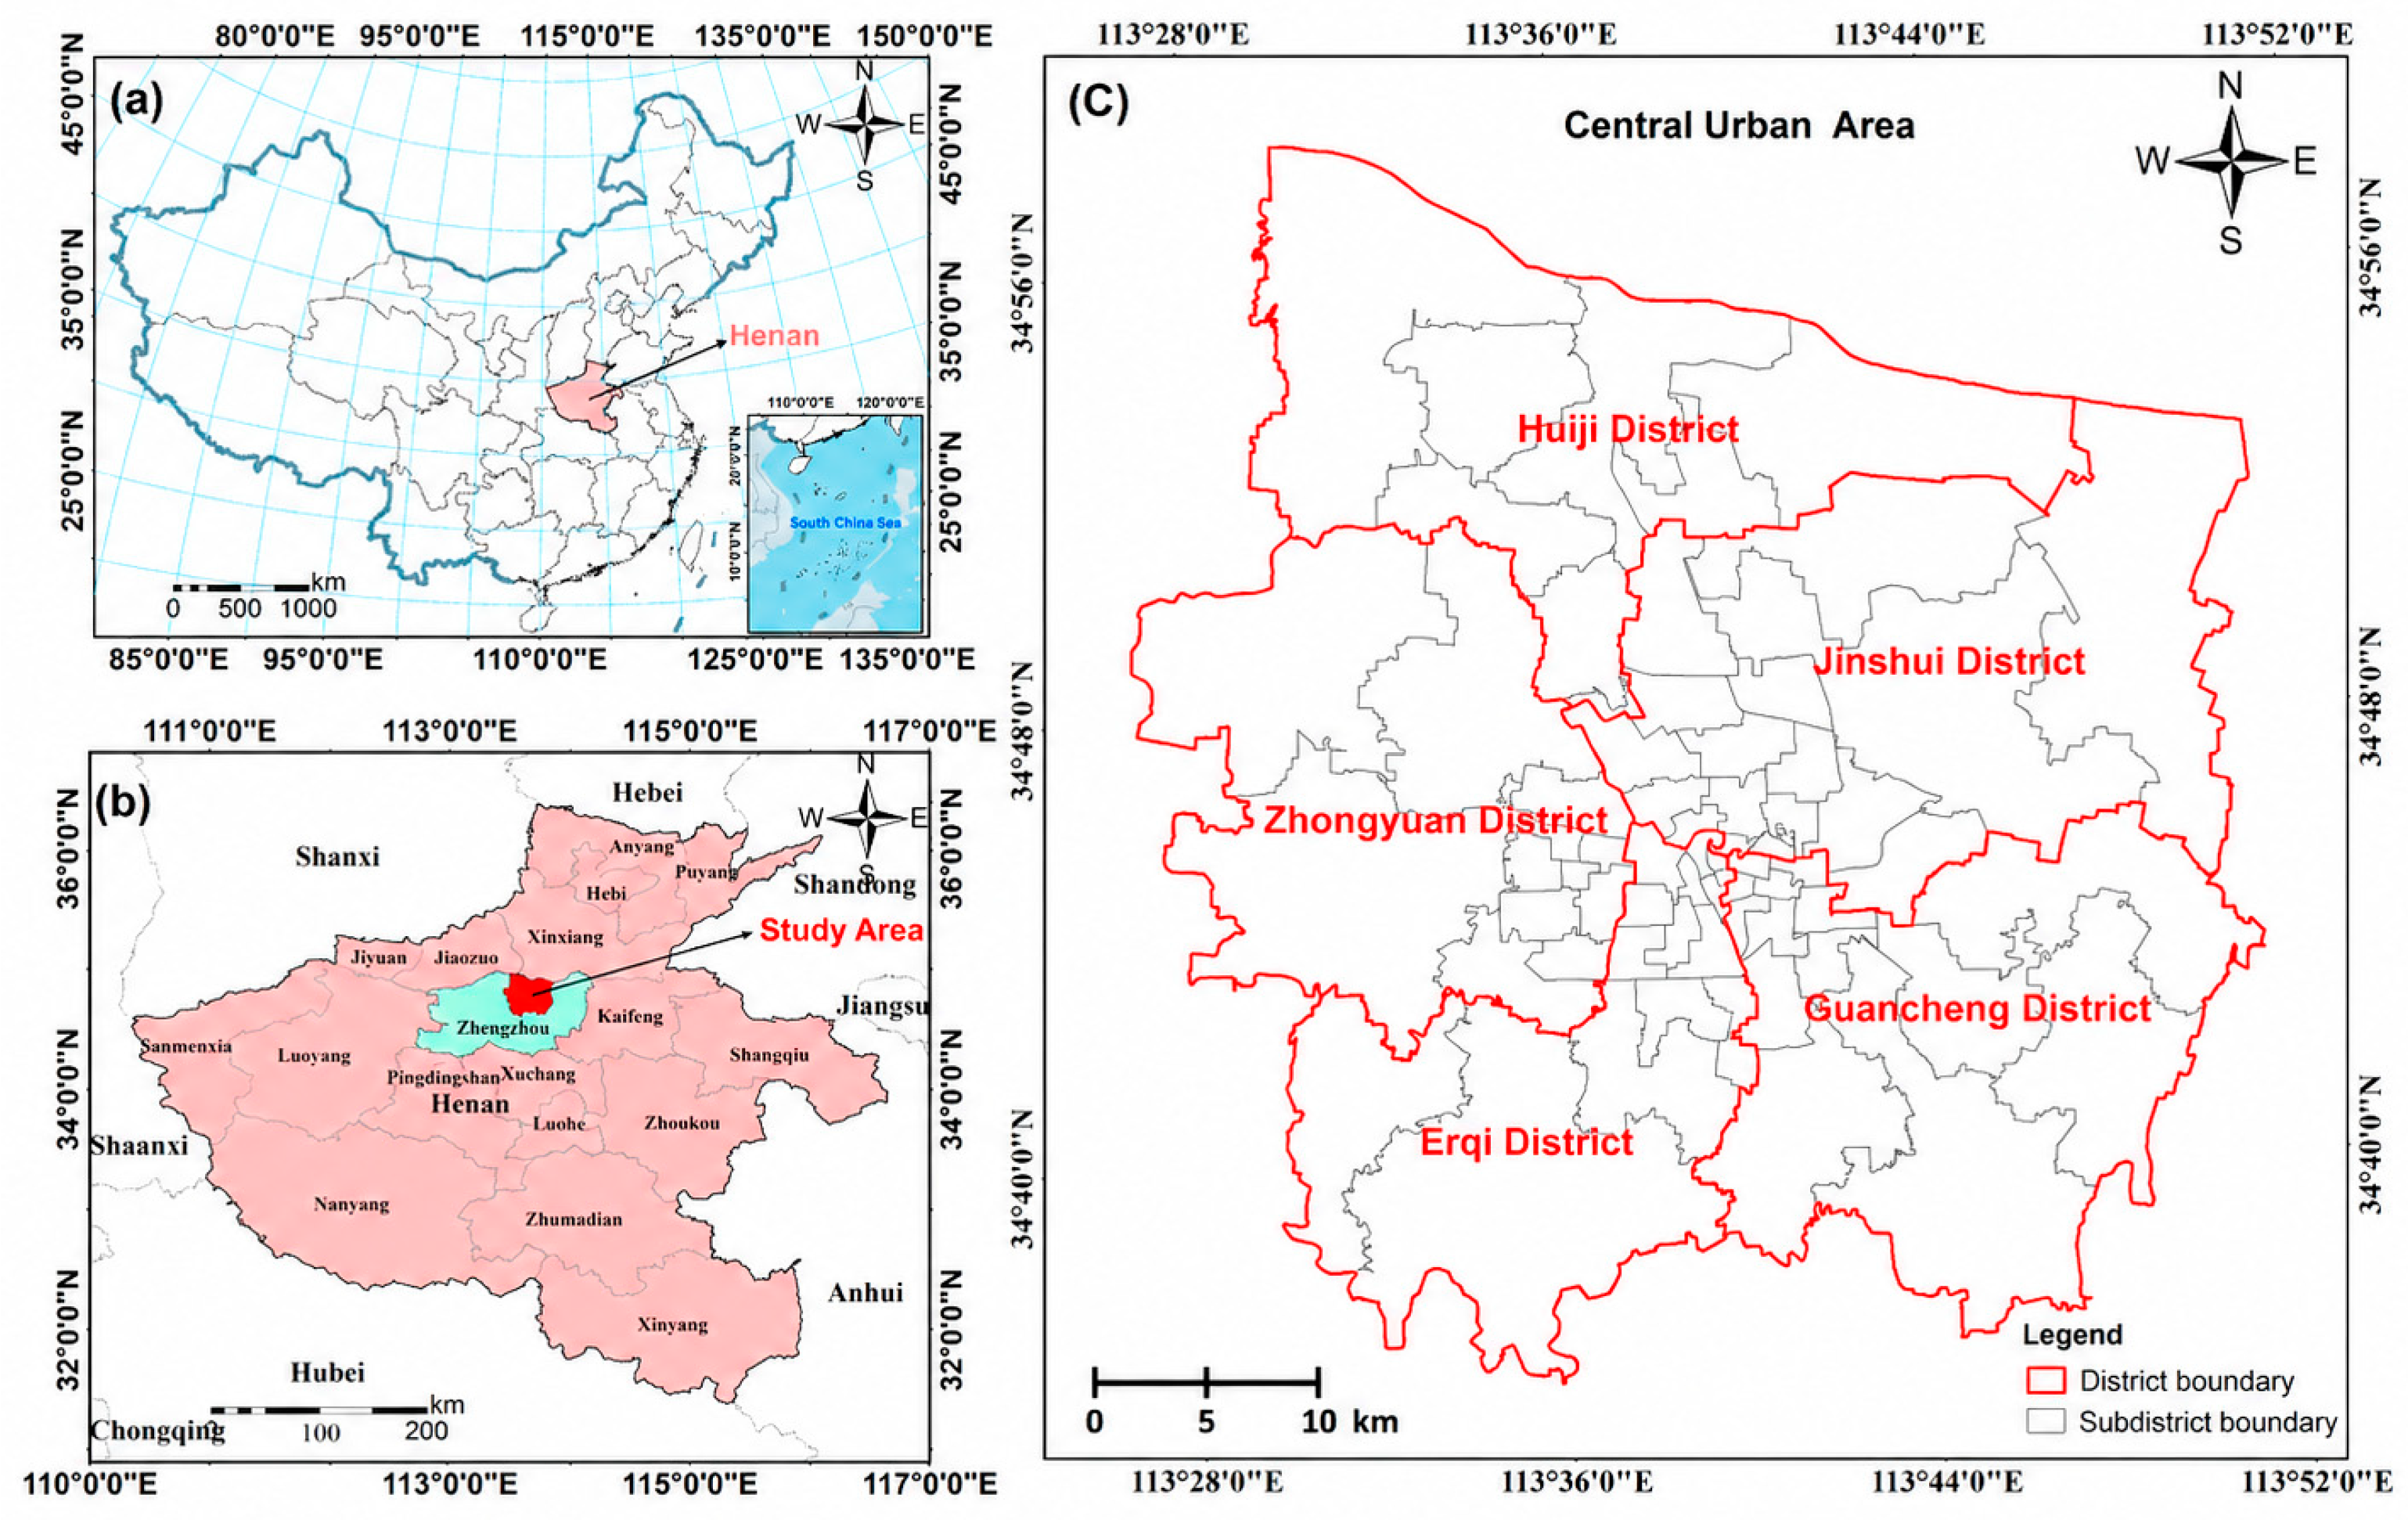
Zhengzhou, the capital of Henan Province, is located on the Yellow River plain in central China (34°36′–34°58′ N, 113°28′–113°52′ E). The city has a north-temperate continental monsoon climate, with a mean annual temperature of approximately 14.4 °C and mean annual precipitation of approximately 640.9 mm. Zhengzhou has experienced sustained population growth and rapid urbanization; previous work reported that its urban population increased from approximately 1.25 million in 1978 to 5.23 million in 2018, while the urbanization rate rose from 32.4% to 73.4% over the same period [11]. Its role as a major national railway and transport hub, together with continuing socioeconomic development, generated strong demand for urban construction land. The analysis focuses on five central districts—Erqi, Zhongyuan, Jinshui, Guancheng, and Huiji—comprising 66 subdistricts and approximately 1016 km2 (Figure 1). These districts encompass the historical urban core and major expansion areas and therefore provide an appropriate setting for examining the transition from predominantly natural surfaces to a heterogeneous, high-density urban landscape.
Figure 1.
Location of the study area: (a) Henan Province in China; (b) Zhengzhou in Henan Province; and (c) the 66 subdistricts in the five central districts (15 in Erqi, 12 in Zhongyuan, 17 in Jinshui, 14 in Guancheng, and 8 in Huiji).
2.2. Data and Preprocessing
The analysis used Landsat imagery to estimate impervious-surface fractions and administrative boundary data to delimit the study area and aggregate change at the subdistrict level. Four observations were selected to represent approximately decadal conditions in 1990, 2000, 2010, and 2019. The 1990–2019 period was designed as a stage-based retrospective analysis rather than an assessment of the current urban condition. It spans nearly three decades and captures the major transition from early expansion, through the principal acceleration phase, to a later stage characterized by substantially lower proportional expansion and increasing internal density reconfiguration. Accordingly, 2019 was retained as the endpoint of the long-term developmental sequence. This multi-temporal design supports comparison among three major development intervals rather than annual change detection; post-2019 changes are outside the scope of the present analysis and are addressed as a limitation and future research need.
Landsat scenes for Path 124/Row 36 were obtained from the United States Geological Survey EarthExplorer (https://earthexplorer.usgs.gov, accessed on 22 March 2026). The dataset includes Landsat 5 Thematic Mapper (TM), Landsat 7 Enhanced Thematic Mapper Plus (ETM+), and Landsat 8 Operational Land Imager (OLI) imagery, all analyzed at a 30 m spatial resolution (Table 1). To reduce seasonal inconsistency, scenes were preferentially selected within the local growing season (May–September), when vegetation is generally in a leaf-on condition; within this seasonal window, priority was given to scenes with low cloud contamination, complete study-area coverage, and satisfactory image quality. Because each Landsat satellite has a 16-day repeat cycle and cloud conditions differ among acquisition dates, suitable scenes were not available on identical or closely matched calendar dates for every target year. Preprocessing comprised radiometric calibration, atmospheric correction with the FLAASH Atmospheric Correction module in ENVI 5.3.1 (Harris Geospatial Solutions, Inc., Broomfield, CO, USA), and clipping to the study boundary. During FLAASH processing, image-specific acquisition and sensor parameters were read from the corresponding Landsat metadata files, and the same preprocessing workflow was applied to all observations. Gap repair was additionally applied to the 2010 Landsat 7 ETM+ scene before analysis. This strategy constrains, but cannot completely eliminate, residual cross-sensor and phenological differences, which are considered explicitly in the limitations.
Table 1.
Landsat imagery used in this study.
2.3. Methods
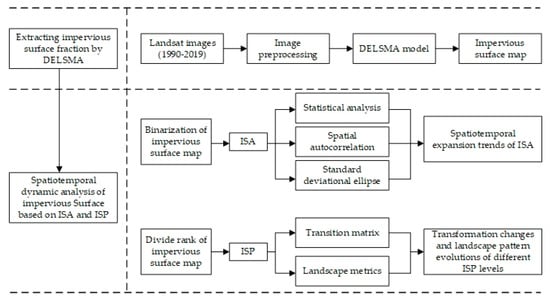
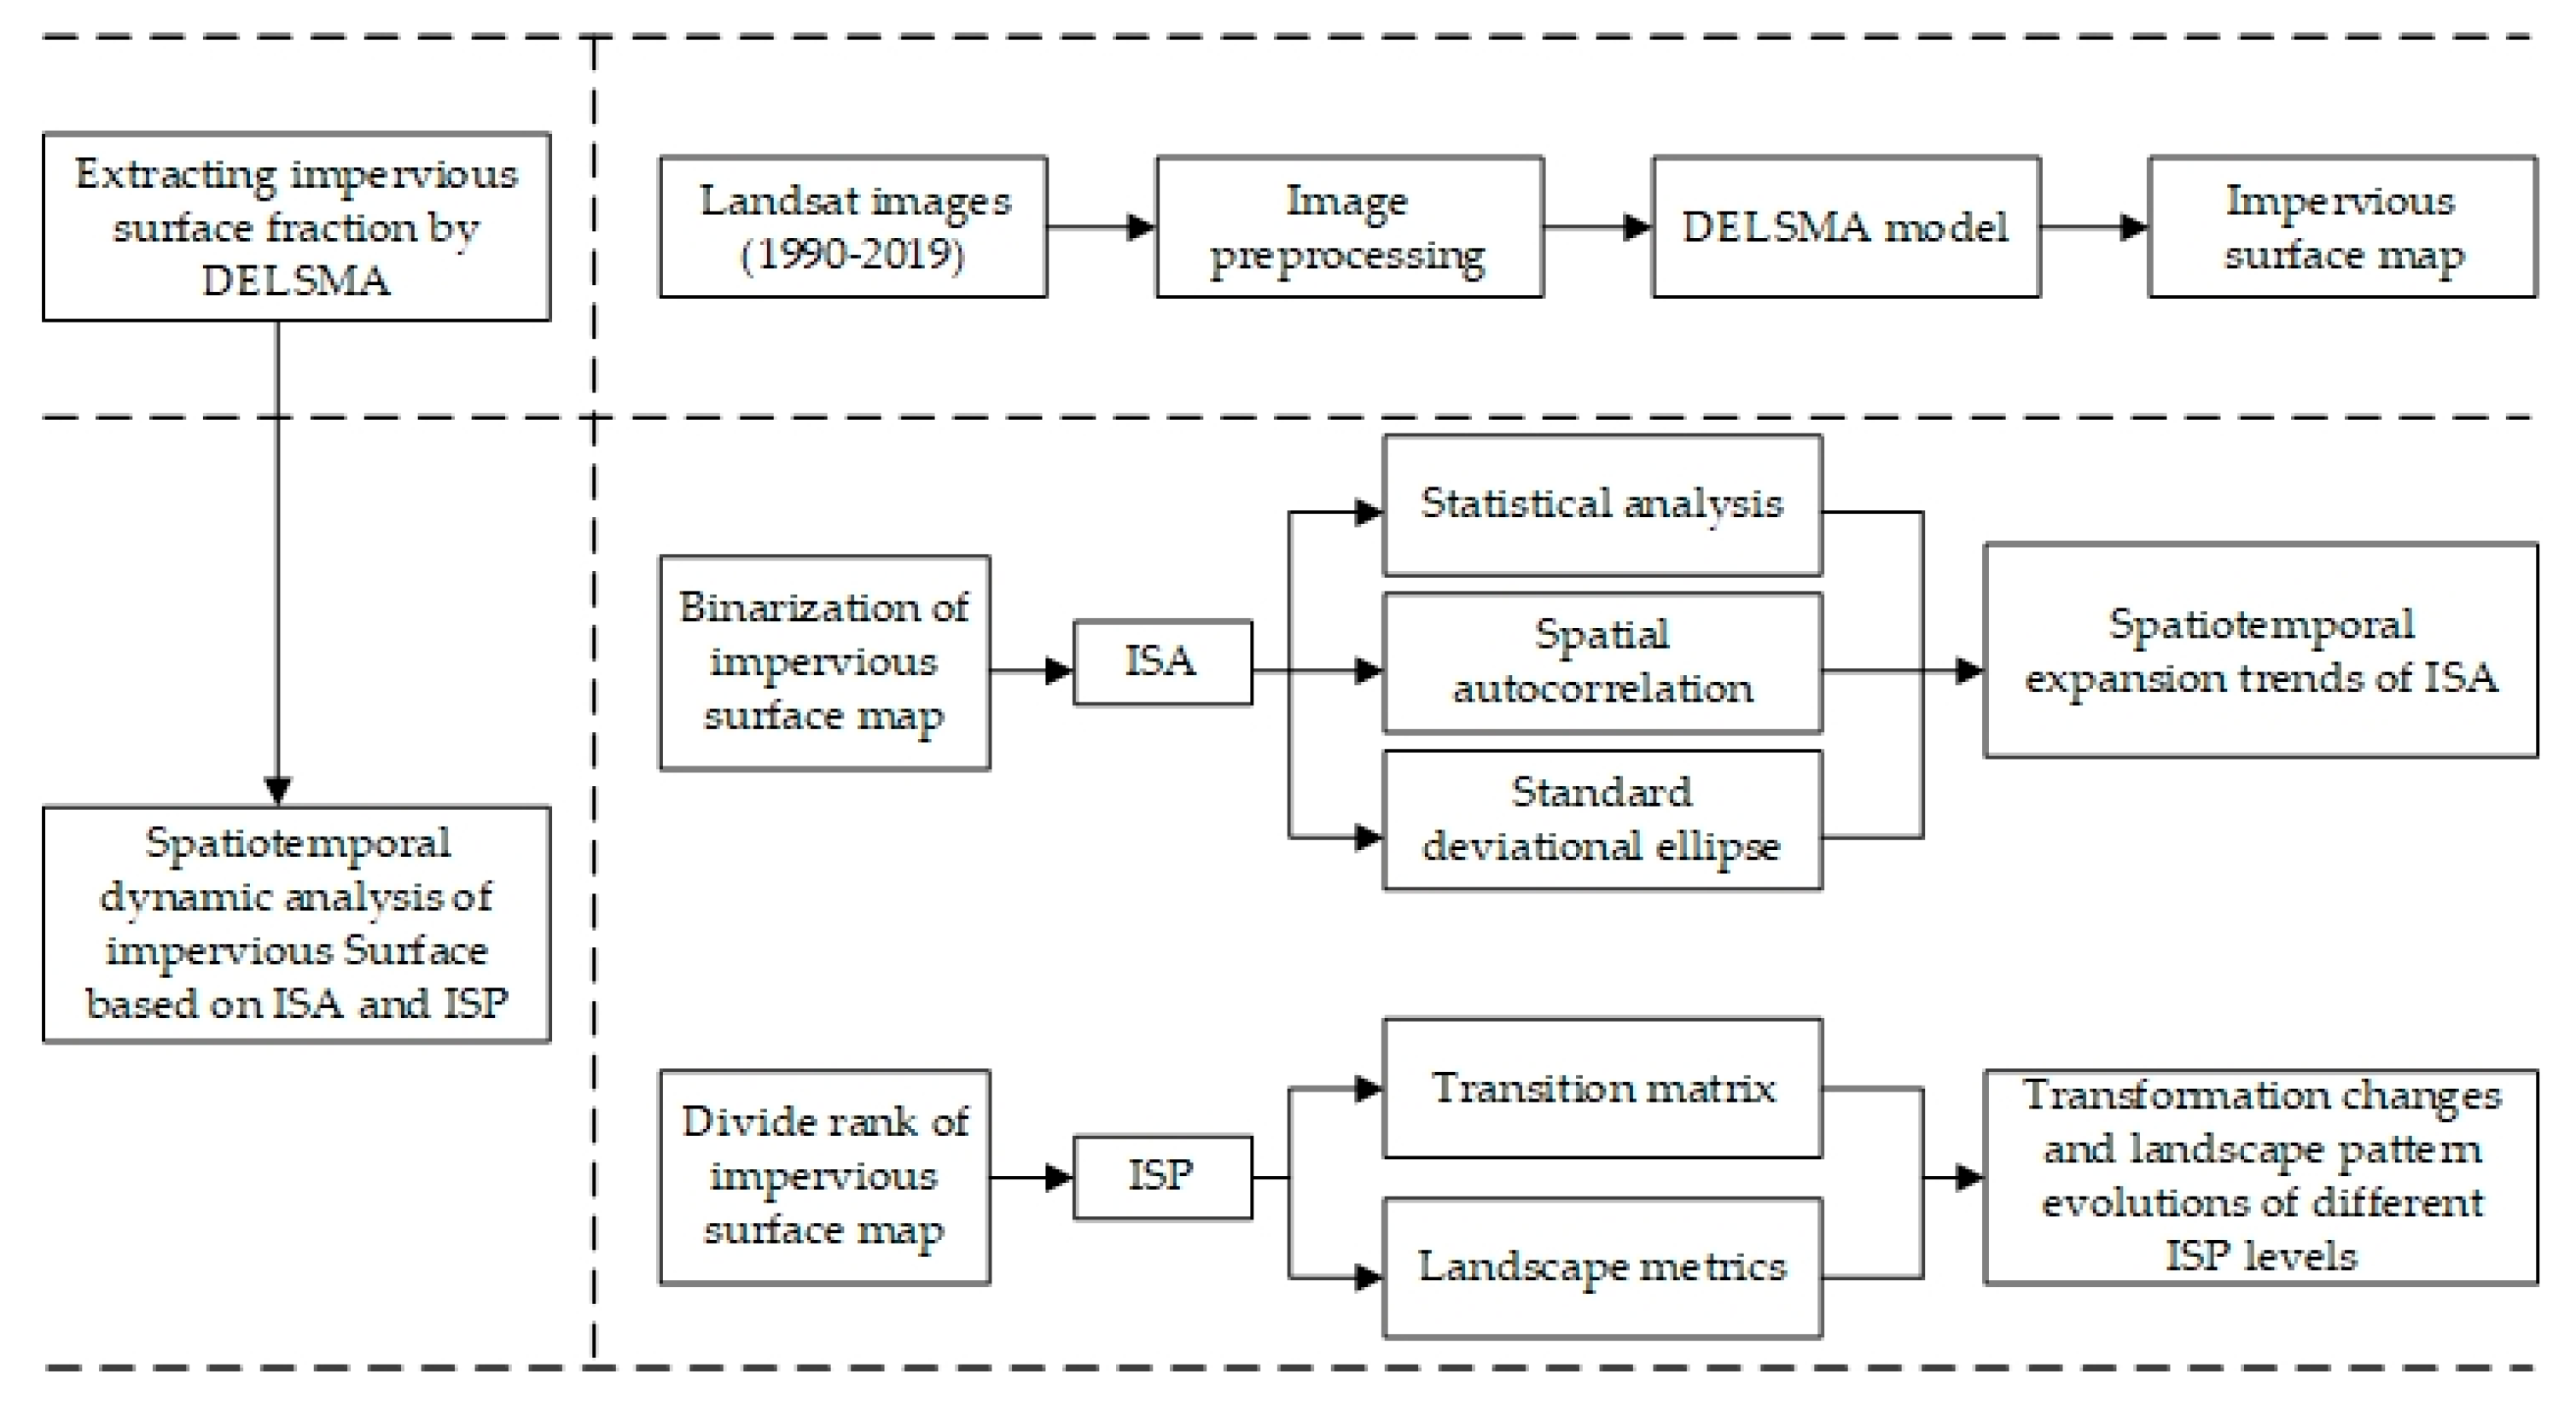
The analytical framework links impervious-surface amount, spatial expansion, density transition, and landscape configuration (Figure 2). DELSMA was first used to estimate continuous ISP values from each Landsat observation. ISA was then summarized for the study area and its administrative units, and its spatial clustering and directional distribution were examined using Moran’s I, local indicators of spatial association (LISA), and standard deviational ellipses (SDEs). For the density perspective, ISP values were grouped into six classes: natural surface (NS, ISP < 10%), very-low-density impervious surface (VLDISP, 10% ≤ ISP < 20%), low-density impervious surface (LDISP, 20% ≤ ISP < 35%), medium-density impervious surface (MDISP, 35% ≤ ISP < 50%), high-density impervious surface (HDISP, 50% ≤ ISP < 75%), and fully impervious surface (FDISP, ISP ≥ 75%) [16]. These literature-based thresholds were kept fixed across all four dates so that transition matrices and landscape metrics describe a consistent density-class system through time. Transition matrices and landscape metrics were subsequently used to characterize changes among these classes.
Figure 2.
Analytical framework for impervious surface expansion, density transition, and landscape reconfiguration.
2.3.1. Impervious Surface Fraction Estimation
Impervious-surface fractions were estimated using DELSMA, a stratified spectral mixture model previously developed and independently evaluated in the same Zhengzhou study area for Landsat TM, ETM+, and OLI imagery [11,12]. The dedicated cross-sensor evaluation used 100 spatially distributed reference samples for each sensor, with 3 × 3 Landsat-pixel sampling units compared against impervious-surface proportions digitized from temporally corresponding high-resolution Google Earth imagery. Performance was quantified using RMSE, correlation coefficients, and coefficients of determination. Reported DELSMA RMSE values were 0.0090, 0.0092, and 0.0063 for TM, ETM+, and OLI, respectively; correlation coefficients were close to or greater than 0.9 and R2 values exceeded 0.8. Thus, the present study uses DELSMA as an established mapping basis in the same study area and with the same Landsat sensor families, and focuses on the new scientific question of long-term ISA–ISP dynamics and landscape reconfiguration rather than re-evaluating the extraction algorithm itself. The absence of separate independent validation for the four specific scenes is nevertheless retained as an explicit source of uncertainty in the limitations.
DELSMA contains three main steps. First, each image is divided into spectrally distinct layers using the biophysical composition index (BCI), feature enhancement, and Otsu threshold segmentation [17,18,19], as expressed in Equations (1)–(3). Second, minimum noise fraction transformation and reference to high-resolution Google Earth imagery are used to identify layer-specific endmembers [9,20]. Third, fully constrained linear spectral mixture analysis estimates the fractions of high-albedo, low-albedo, soil, and vegetation components (Equation (4)). The impervious fraction is obtained from the relevant high- and low-albedo fractions and the layer-specific results are mosaicked to produce a continuous ISP map (Equation (5)).
where is the first three components of the Tasseled Cap Transformation
where is the enhanced index map, is the normalized original index map, is the sensitivity factor, and is the average value of the target land cover type.
where , , , , , is the probability of the gray level , and is the optimal threshold obtained by OTSU algorithm.
where , is the reflectance for each band ; is the number of endmembers; is the reflectance of endmember in band ; is the fraction of endmember ; and is the standard residual.
where , , and are the reflectance of impervious surface, high-albedo endmember and low-albedo endmember in band , respectively; and are the fractions of low albedo and high albedo, respectively.; and is the unmodeled residual.
2.3.2. Spatial Autocorrelation
Spatial autocorrelation was used to determine whether subdistricts with similar ISA expansion rates were spatially clustered. For each interval, an expansion-speed indicator was calculated from the change in ISA within each subdistrict. A first-order queen-contiguity spatial-weights matrix was adopted consistently for both global Moran’s I and local Moran’s I analyses; two subdistricts were defined as neighbors when they shared either a common boundary or a vertex. This specification was selected because the irregular subdistrict polygons frequently meet at both edges and corner points, and queen contiguity therefore provides a more inclusive representation of local administrative adjacency. Global Moran’s I describes the overall tendency toward clustering, while local Moran’s I and LISA identify the location and type of local associations [21,22,23]. Positive global values indicate that subdistricts with similar expansion rates tend to be adjacent; values close to zero indicate a weak or random spatial pattern.
Global Spatial Autocorrelation
Global Moran’s I ranges from −1 to 1. Positive values indicate clustering of similar expansion rates, negative values indicate neighboring dissimilarity, and values near zero indicate an approximately random spatial arrangement. The standardized z statistic was used to evaluate whether the observed association differed significantly from spatial randomness.
Local Spatial Autocorrelation
Global statistics do not show where clusters occur. Local Moran’s I was therefore used to classify subdistricts as high–high (a high value surrounded by high values), low–low, high–low, or low–high. High–high and low–low categories indicate local spatial clustering, whereas high–low and low–high categories indicate spatial outliers [24,25].
2.3.3. Standard Deviational Ellipse
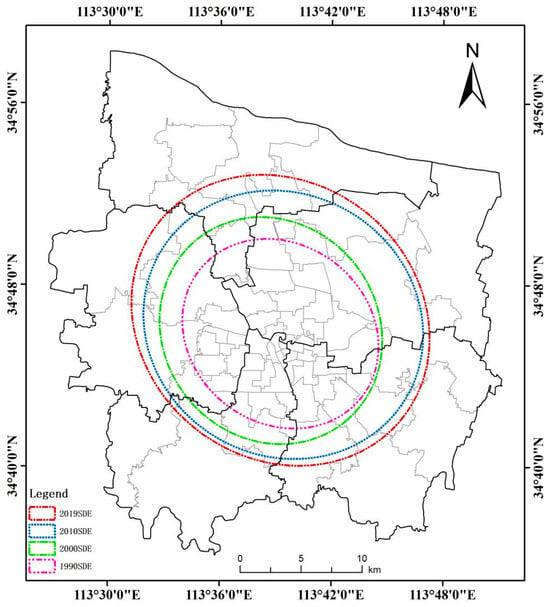
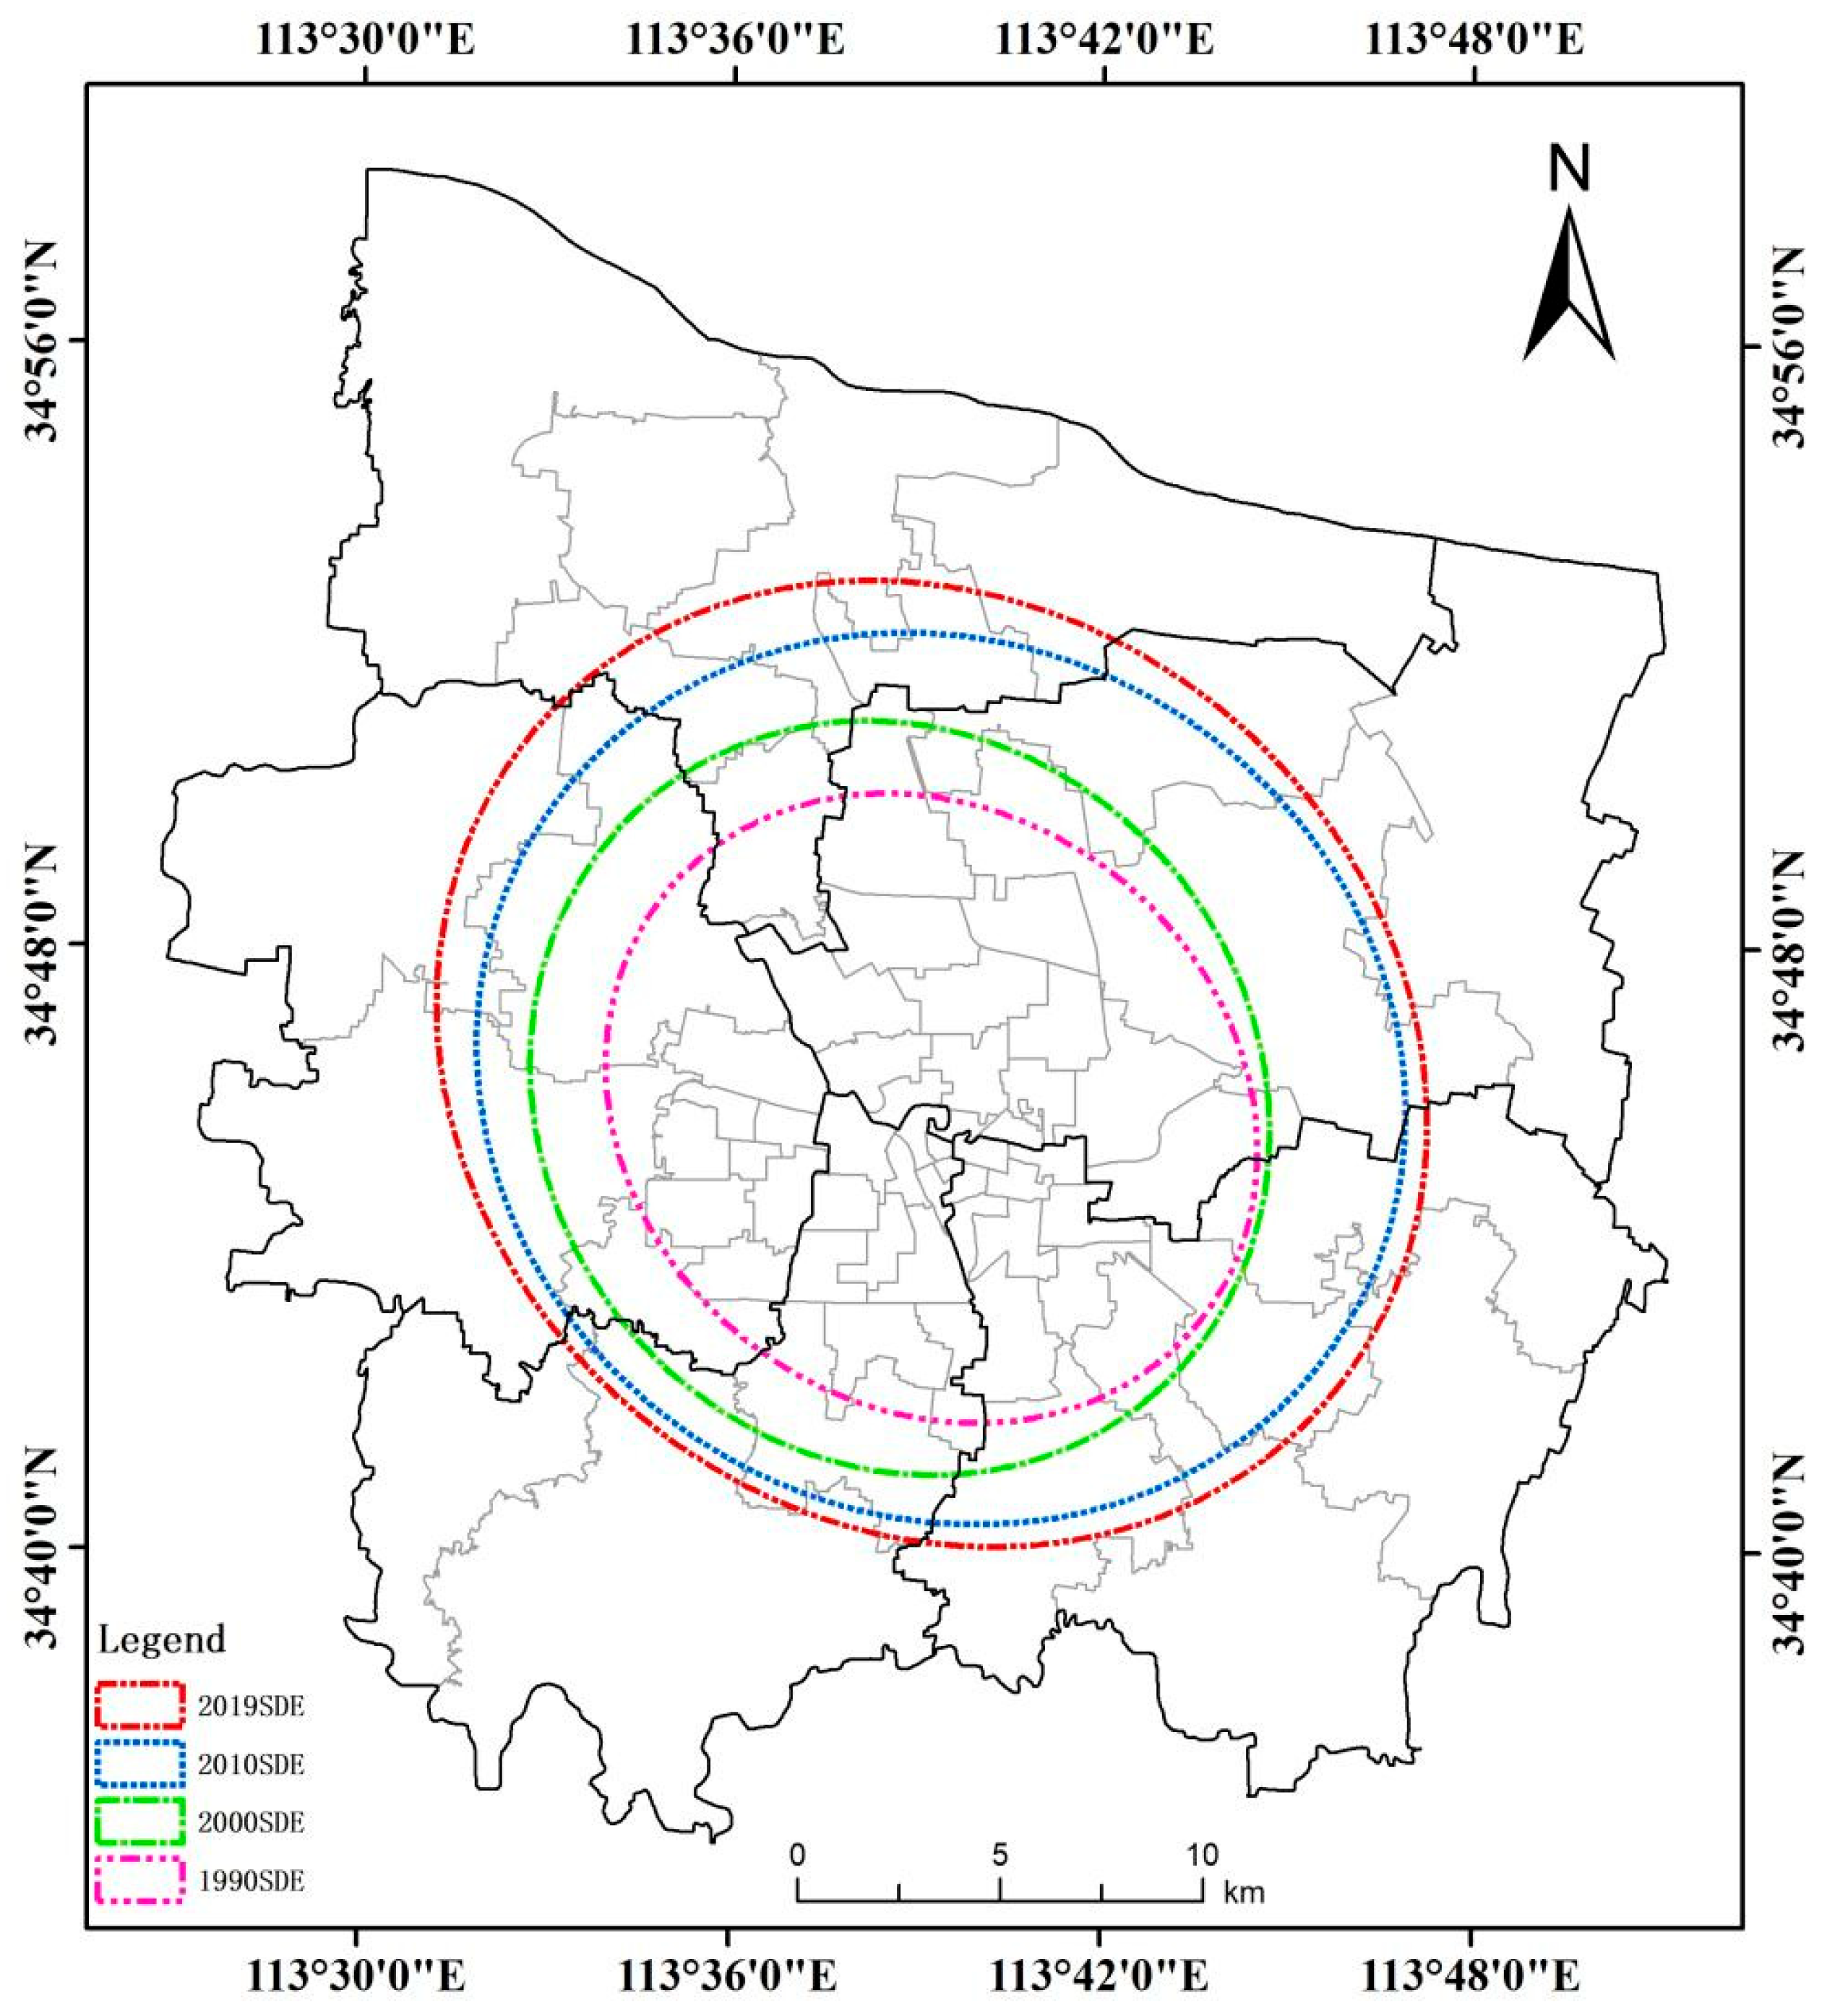
The SDE summarizes the center, dispersion, and dominant orientation of a spatial distribution [26,27]. Its long and short axes describe the principal and secondary spread of ISA, the axis ratio indicates the strength of directional elongation, and the rotation angle indicates the orientation of the long axis. One-standard-deviation ellipses were calculated for each observation to compare changes in the overall spatial footprint. Because an ellipse represents an axis rather than a one-way vector, its orientation is interpreted as a southeast–northwest alignment rather than a causal direction of growth.
2.3.4. Impervious Surface Percentage Transition Matrix
An impervious surface percentage transition matrix (ISPTM) was constructed for each pair of consecutive observations. ISP-class maps for the beginning and end of an interval were overlaid, and the area transferred from origin class i to destination class j was calculated [28,29]. Diagonal entries represent persistence within the same density class, while off-diagonal entries represent densification, de-intensification, or conversion between natural and impervious surfaces. The accompanying input and output percentages normalize each transition by the total area of its origin or destination class, allowing both the source and composition of change to be interpreted.
2.3.5. Landscape Metrics
Landscape metrics were used to quantify how the six ISP classes were spatially configured [30,31]. At the class level, patch density (PD) represents fragmentation, aggregation index (AI) represents within-class adjacency, and landscape shape index (LSI) represents boundary complexity. At the landscape level, contagion index (CONTAG) represents overall dominance and connectivity, while Shannon’s diversity index (SHDI) represents compositional diversity. The metrics and their interpretation are summarized in Table 2 and were calculated in FRAGSTATS 4.2 (University of Massachusetts Amherst, Amherst, MA, USA). Their joint interpretation is emphasized because no single metric fully describes landscape structure.
Table 2.
Landscape metrics used to characterize ISP configuration.
3. Results
3.1. Multitemporal Impervious Surface Distribution
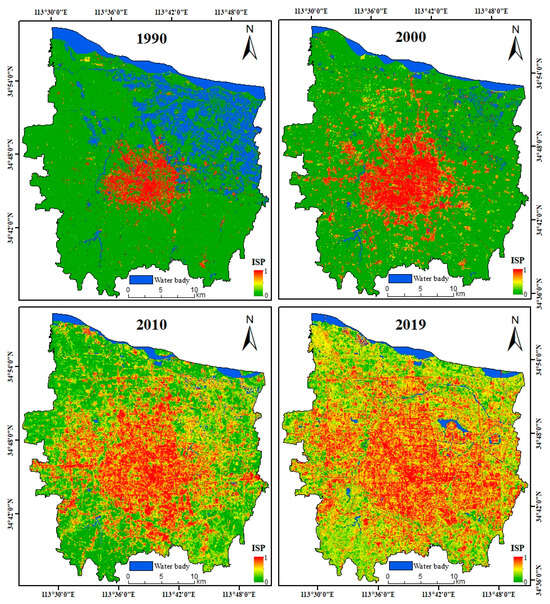
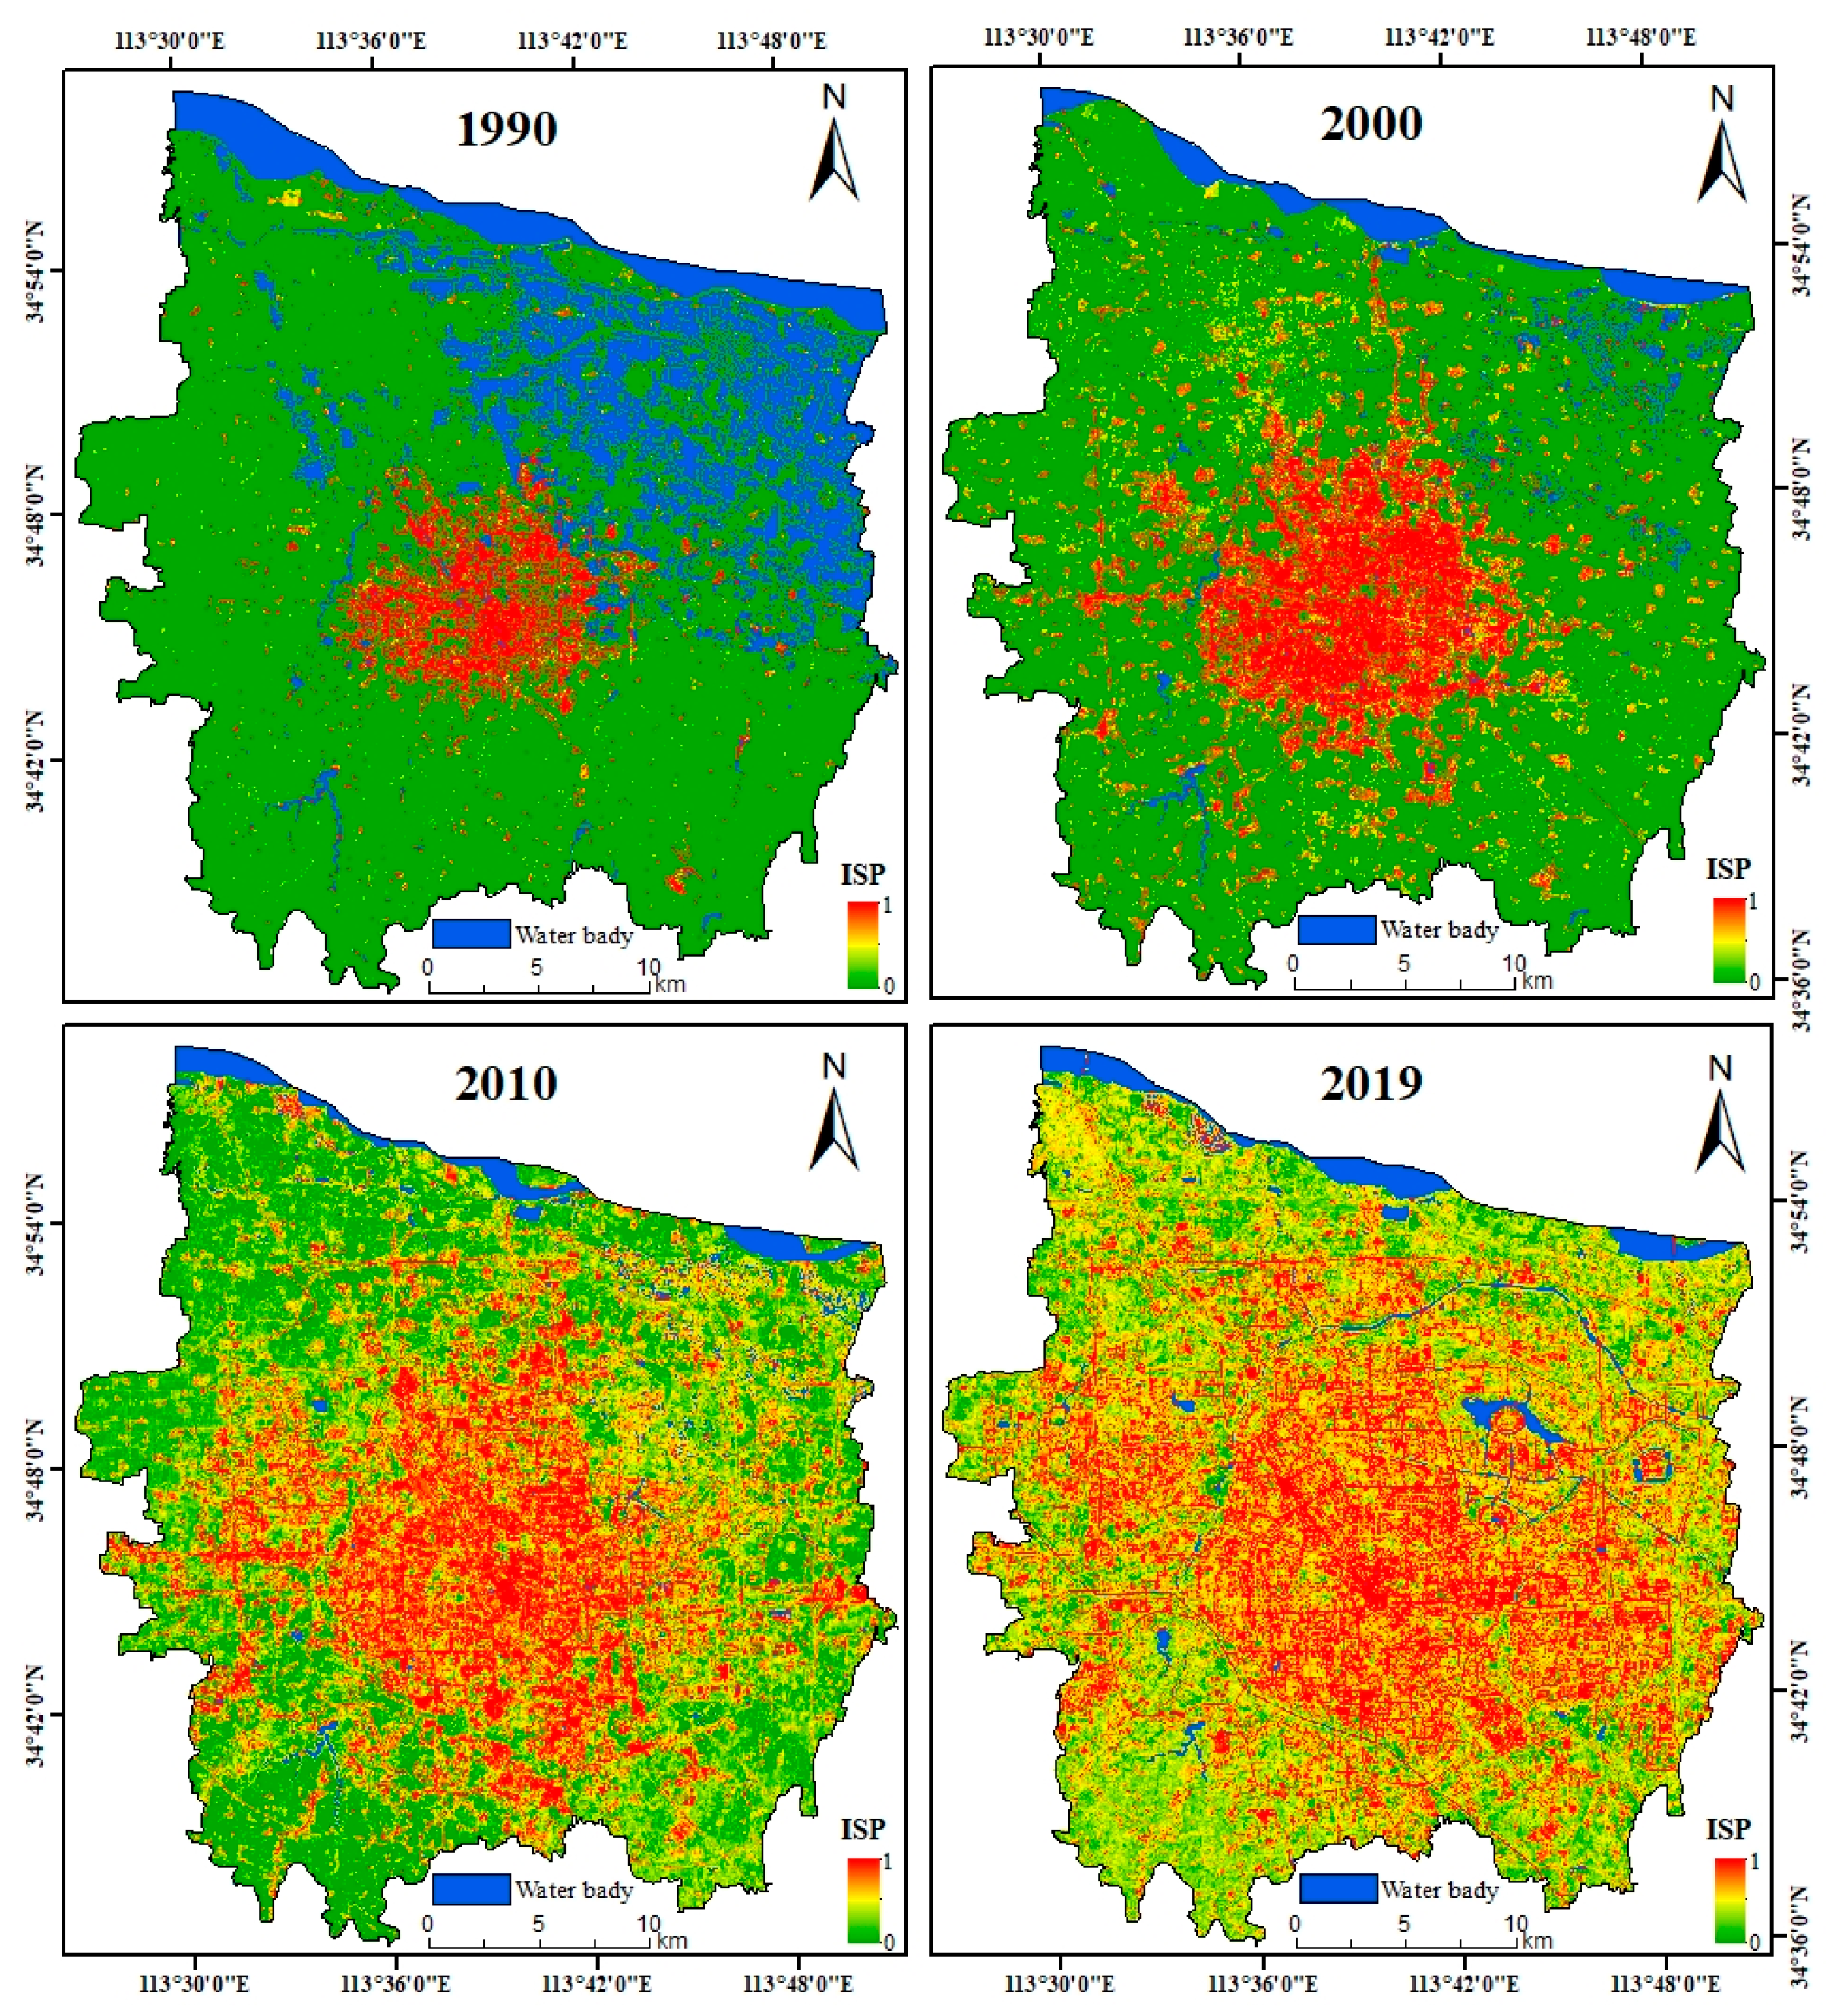
The DELSMA outputs represent continuous impervious surface fractions between 0 and 1 (Figure 3). In 1990, high ISP values were concentrated in the established urban core, whereas most peripheral areas were dominated by natural surfaces. By 2000, the core had expanded and additional impervious patches appeared along the urban fringe. The most extensive redistribution occurred between 2000 and 2010, when impervious cover spread across large suburban areas and a broad gradient of low-, medium-, and high-density development emerged. By 2019, high ISP values occupied much of the study area, but the spatial pattern was increasingly heterogeneous rather than uniformly compact. The maps therefore show both outward conversion of natural surfaces and internal redistribution among impervious-density classes.
Figure 3.
Impervious surface percentage in Zhengzhou in 1990, 2000, 2010, and 2019.
3.2. Spatiotemporal Dynamics from the ISA Perspective
3.2.1. Magnitude and Temporal Stages of ISA Expansion
Total ISA increased from 71.12 km2 in 1990 to 175.63 km2 in 2000, 382.92 km2 in 2010, and 523.34 km2 in 2019 (Table 3). The net increase over the full period was 452.22 km2. Absolute annual expansion was greatest during 2000–2010 (20.73 km2 year−1), compared with 10.45 km2 year−1 during 1990–2000 and 15.60 km2 year−1 during 2010–2019. In contrast, annual expansion intensity relative to the ISA at the beginning of each interval declined from 14.70% to 11.80% and then to 4.07%. Thus, the city continued to add impervious cover after 2010, but the proportional pace of expansion slowed as the existing impervious base became larger. The average ISA ratio increased from 7.00% to 51.49%, confirming a fundamental shift in the dominant surface composition of the study area.
Table 3.
ISA amount and interval-specific expansion statistics.
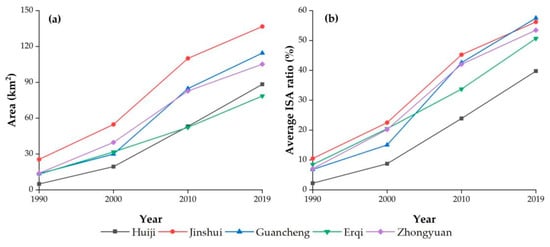
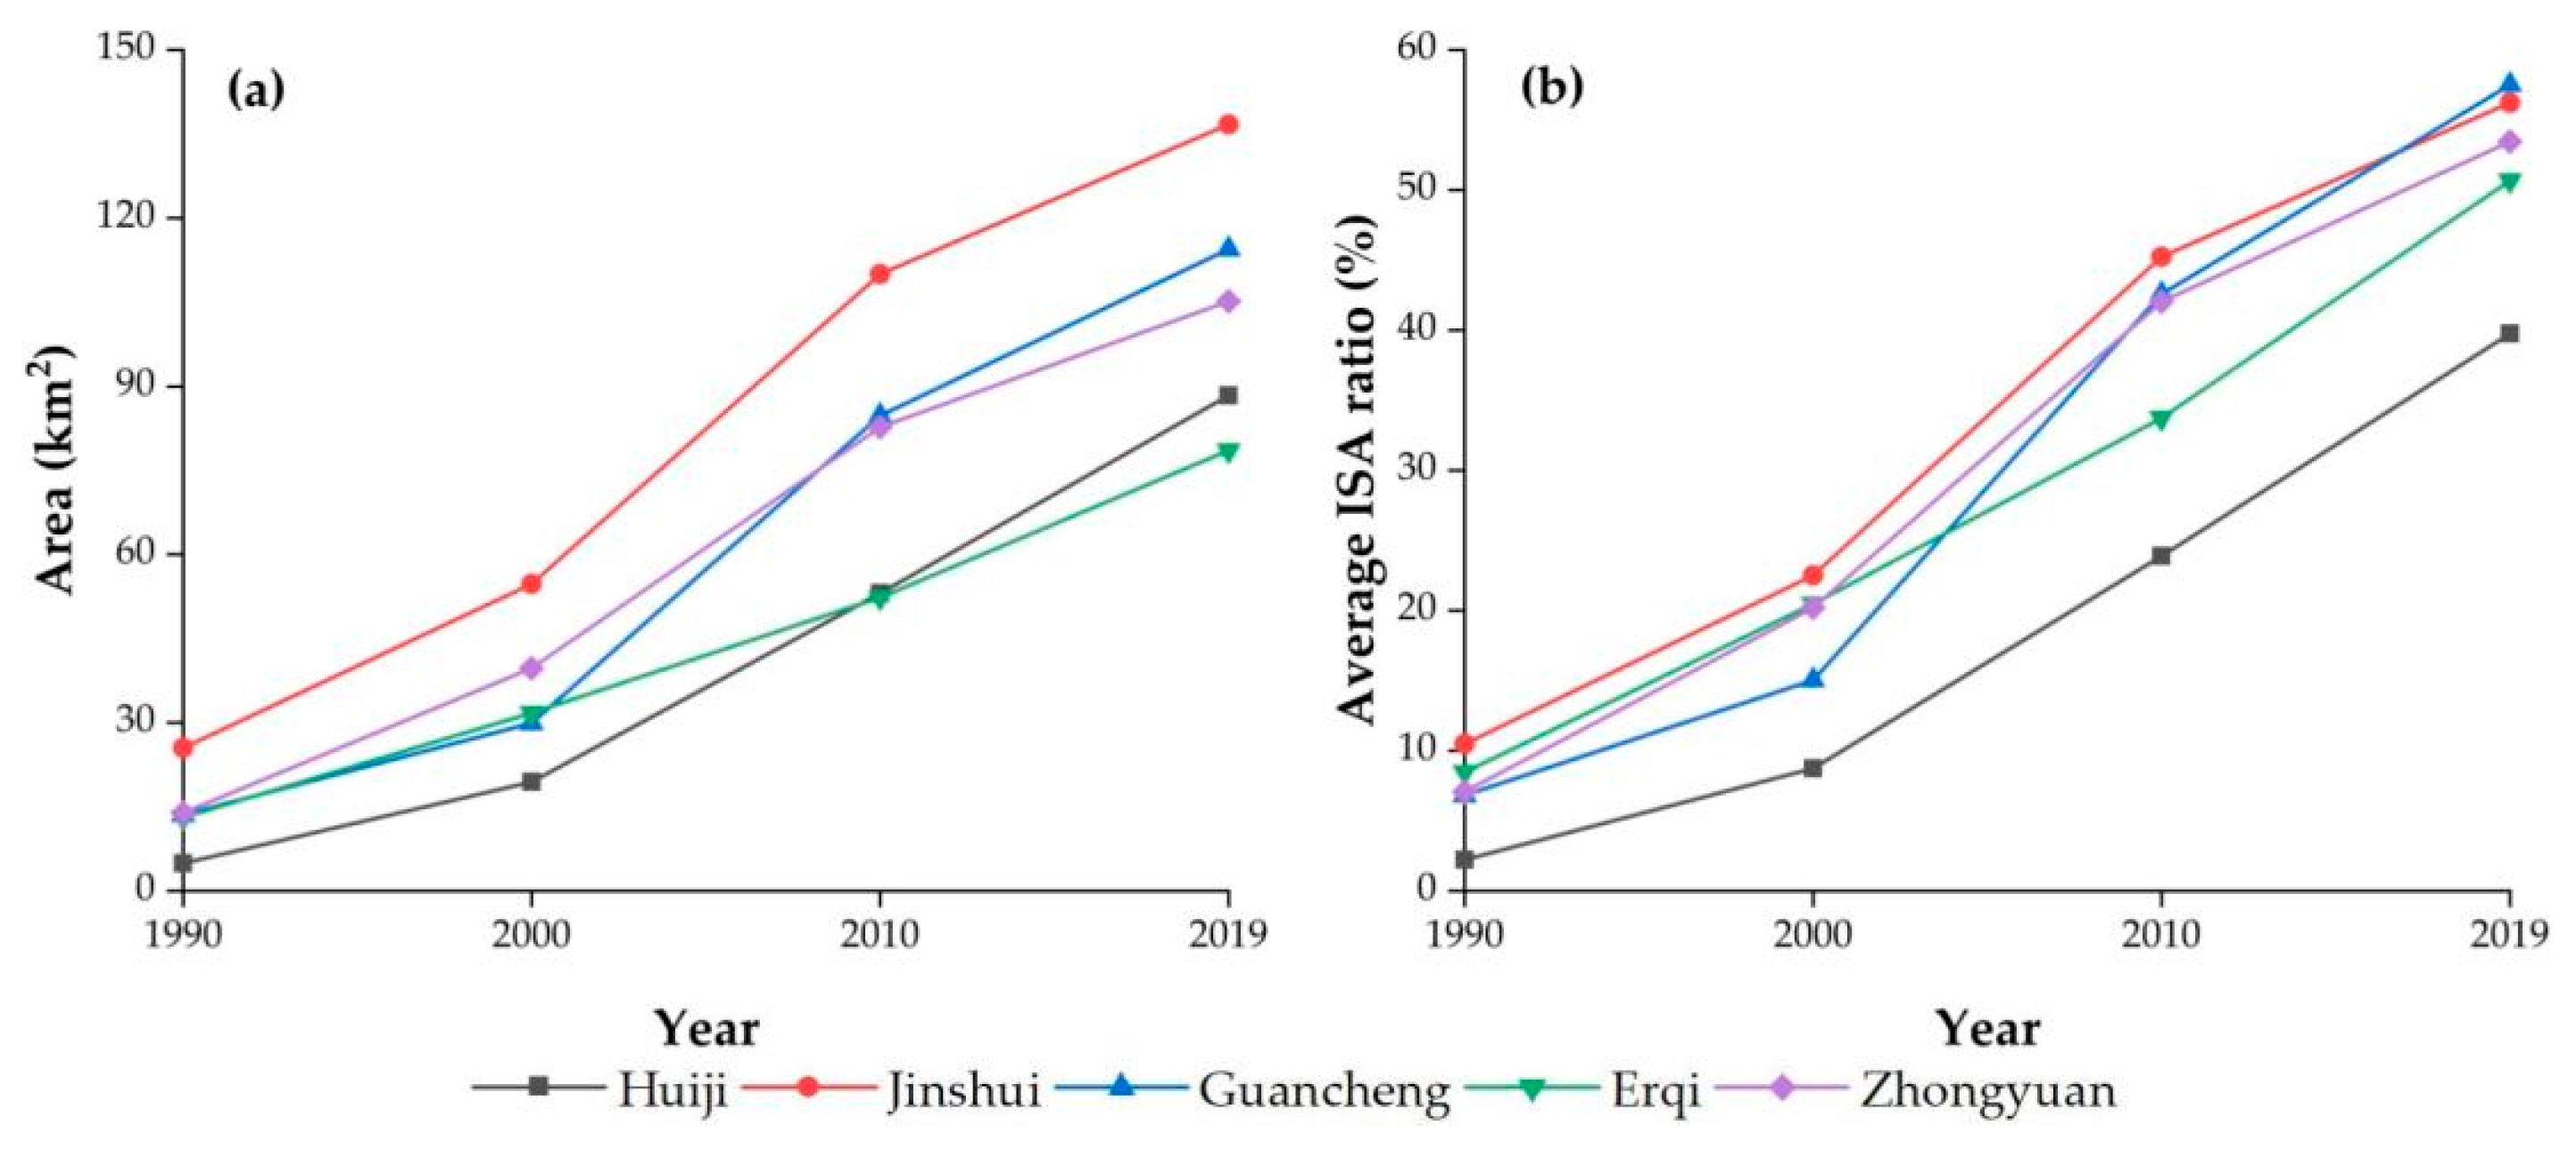
ISA increased in all five districts (Figure 4a), but the magnitude and timing differed spatially. Jinshui recorded the largest absolute increase (111.21 km2), while substantial growth also occurred in the other central districts. The district-level ISA ratios converged over time (Figure 4b): the initially high ratios in the established core were increasingly matched by formerly peripheral districts as urban development spread outward. This convergence indicates that the urbanization process was not limited to enlargement of the original core; it progressively incorporated multiple districts into a more continuous metropolitan fabric.
Figure 4.
District-level changes in (a) ISA and (b) mean ISA ratio in Zhengzhou.
3.2.2. Spatial Clustering of ISA Expansion
Global Spatial Autocorrelation
The global Moran’s I values for the expansion-speed indicator were 0.4036, 0.6633, and 0.5809 for 1990–2000, 2000–2010, and 2010–2019, respectively (Table 4). The corresponding standardized statistics were all positive and significant, demonstrating that subdistricts with similar expansion rates were spatially clustered rather than randomly distributed. Clustering strengthened markedly during 2000–2010 and remained pronounced after 2010, although its intensity declined slightly in the final interval.
Table 4.
Global Moran’s I for ISA expansion speed by interval.
Local Spatial Autocorrelation
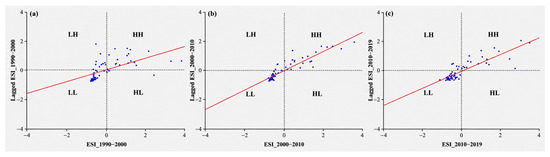
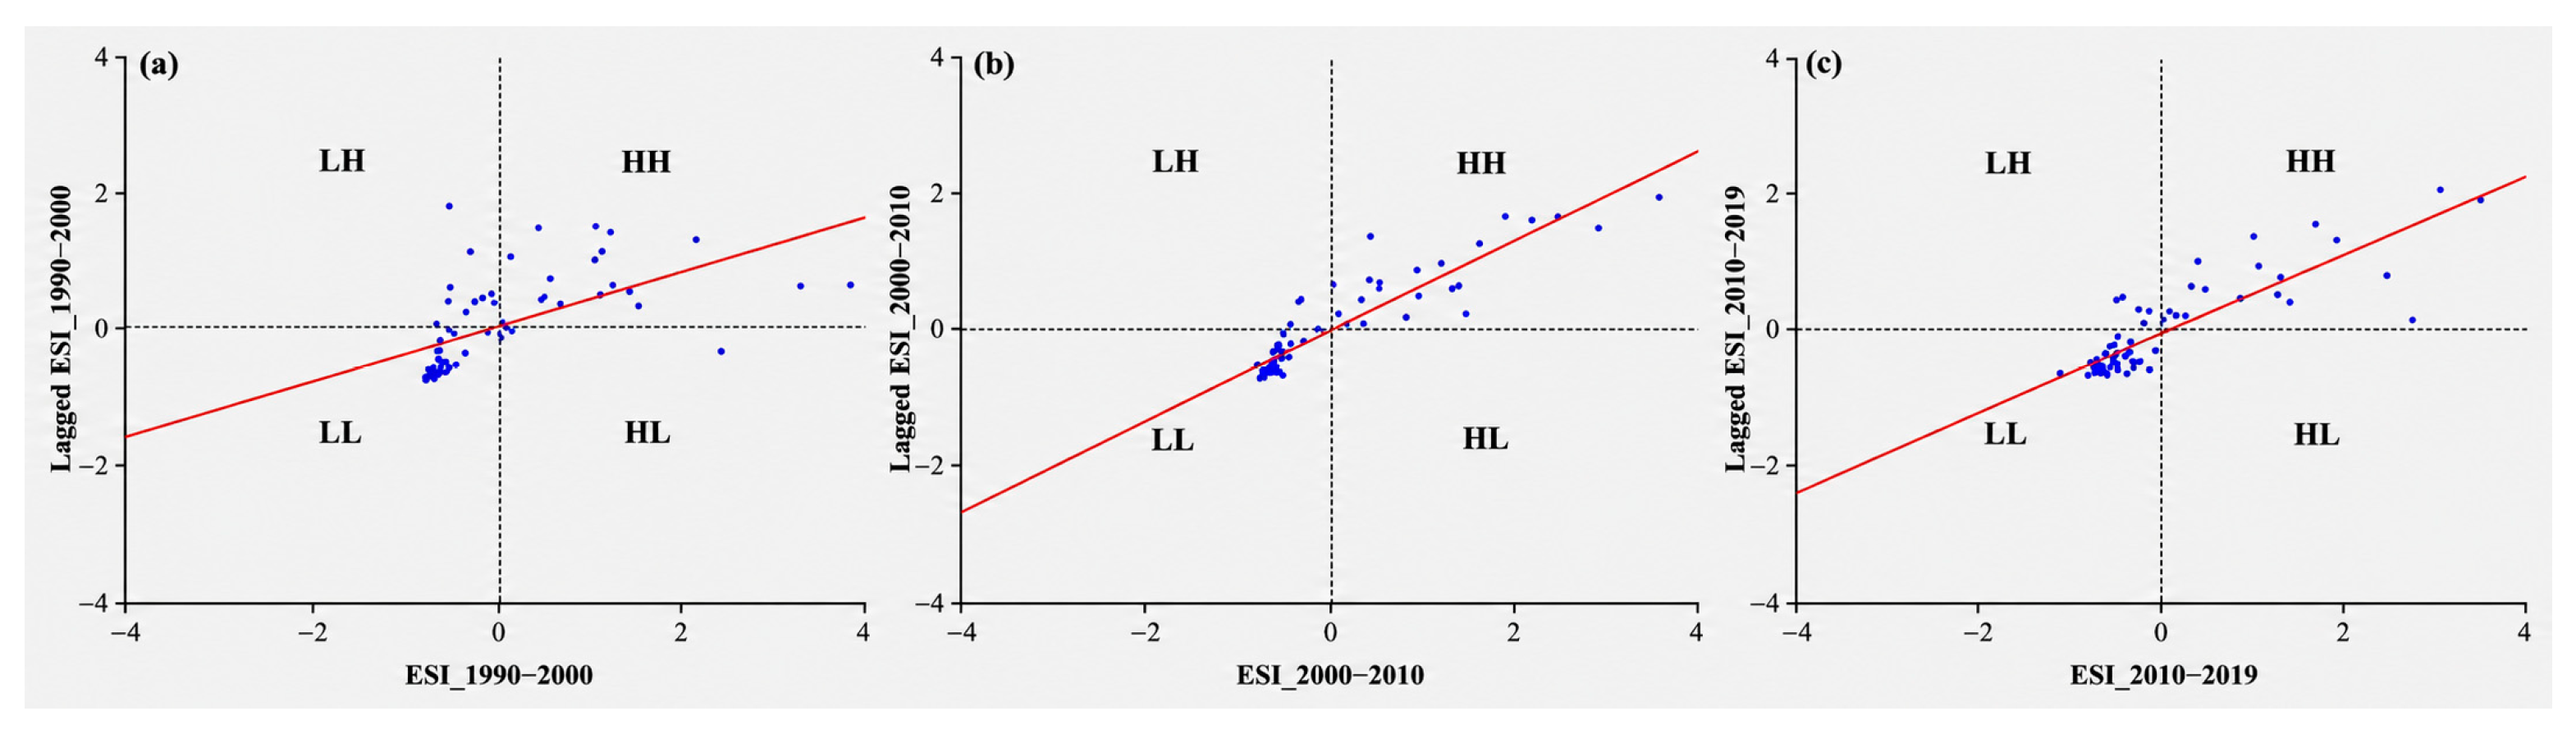
The Moran scatterplots show that high–high and low–low associations dominated all three intervals (Figure 5). Together, these two quadrants contained 53, 63, and 61 of the 66 subdistricts, equivalent to 80.30%, 95.45%, and 92.42%, respectively. The strong dominance of like-with-like associations confirms that expansion operated through spatially connected clusters rather than isolated subdistrict-level changes. The larger share during and after 2000 is consistent with coordinated suburban development across neighboring administrative units.
Figure 5.
Moran scatterplots of subdistrict-level ISA expansion speed: (a) 1990–2000, (b) 2000–2010, and (c) 2010–2019.
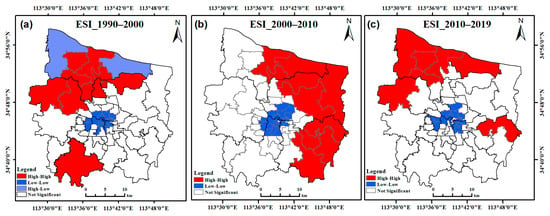
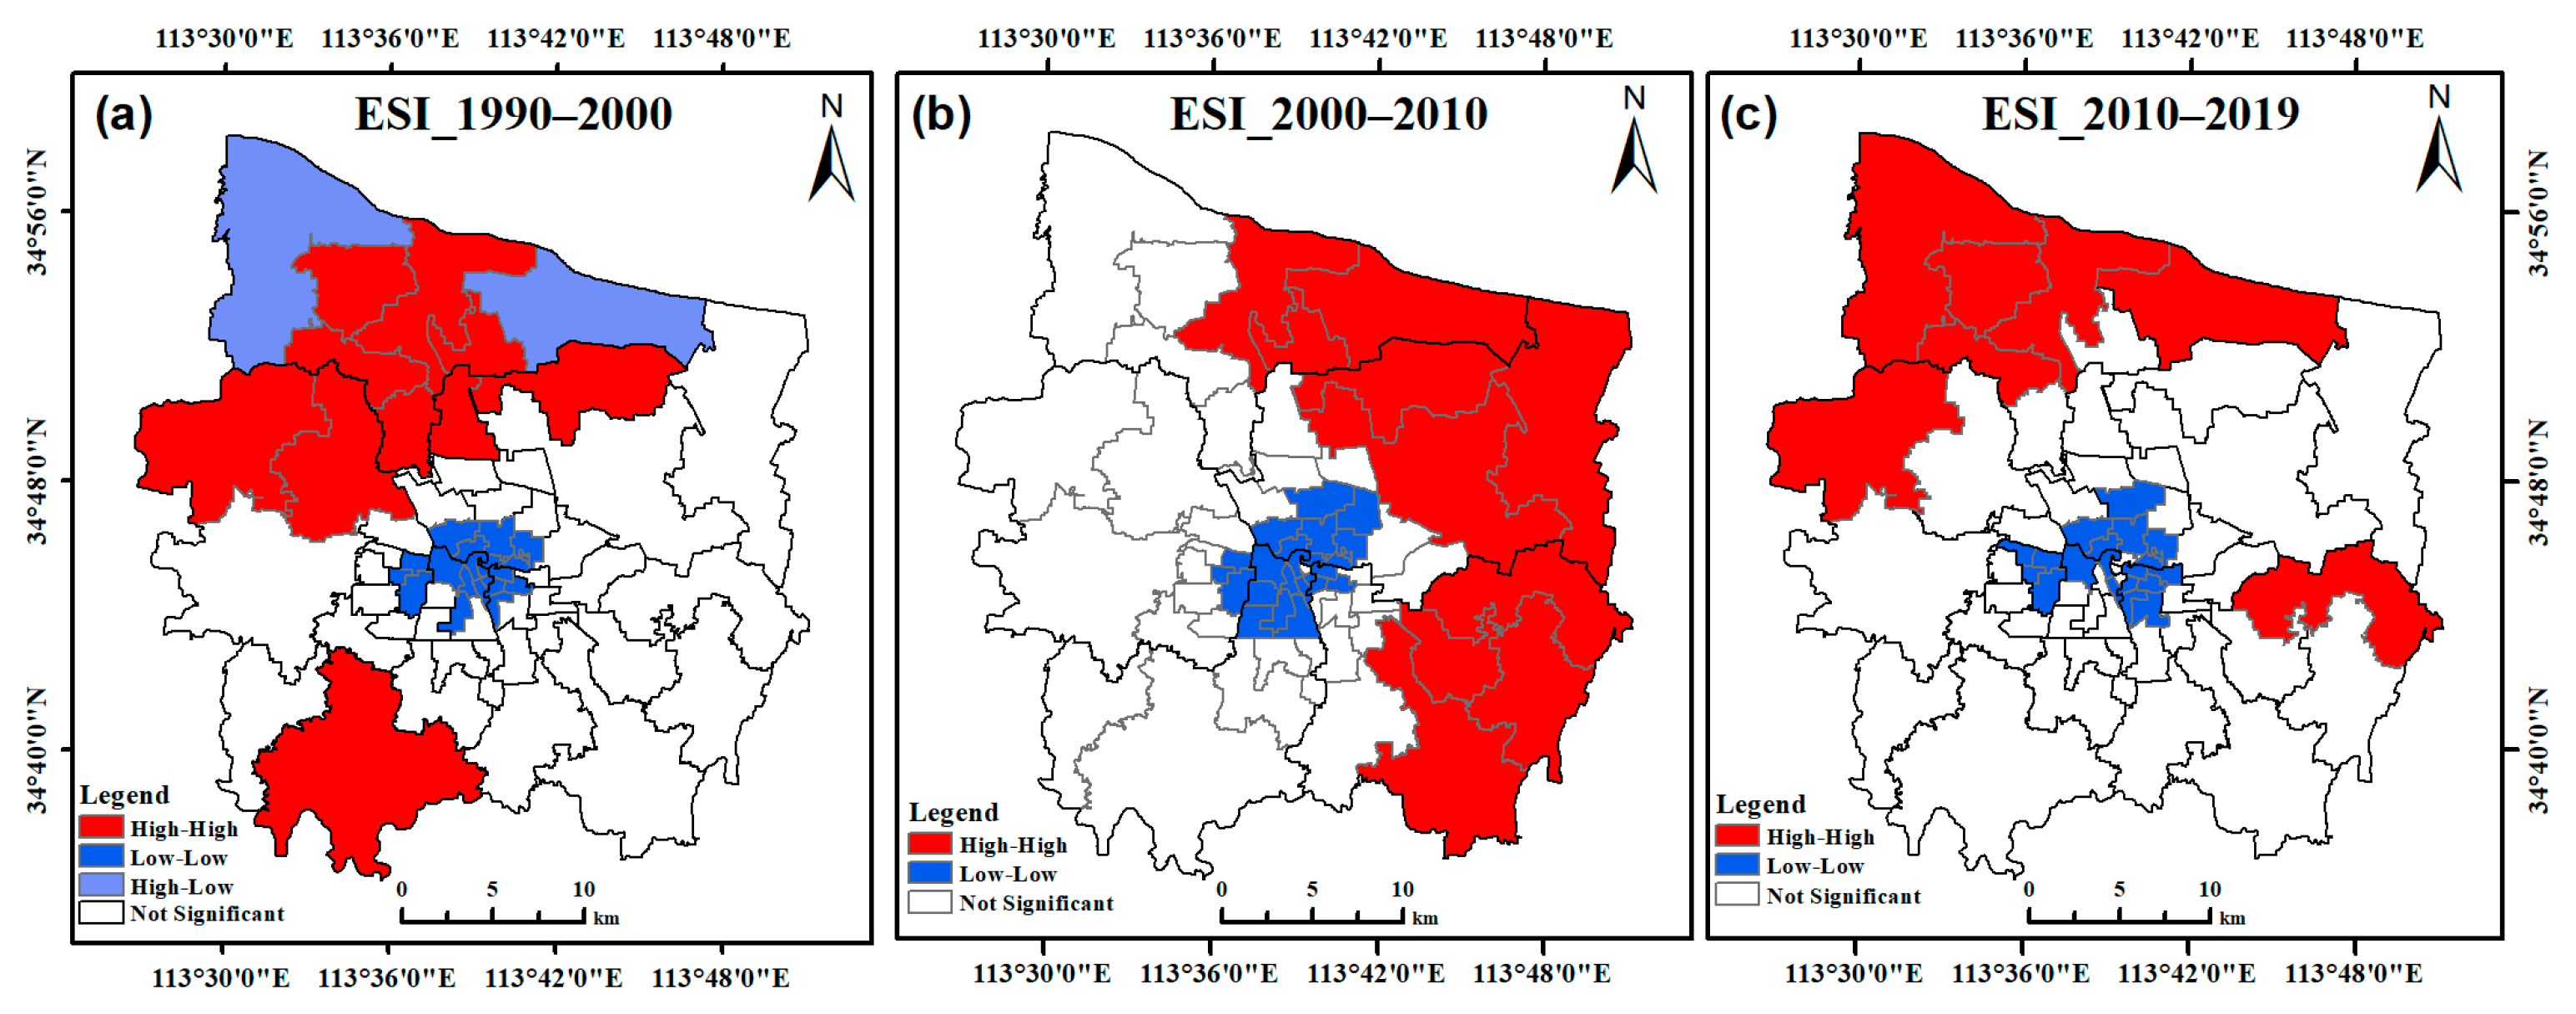
The LISA maps further reveal that the location of rapid-growth clusters shifted over time (Figure 6). High–high clusters were concentrated in parts of Erqi, Zhongyuan, and Huiji during 1990–2000; in Huiji, Jinshui, and Guancheng during 2000–2010; and in Zhongyuan, Huiji, and Guancheng during 2010–2019. Low–low clusters occupied areas with comparatively limited expansion in each interval. These shifts show that the leading edge of urban growth was mobile, while the persistence of spatial clustering indicates that adjacent subdistricts tended to pass through similar development stages.
Figure 6.
LISA cluster maps of subdistrict-level ISA expansion speed: (a) 1990–2000, (b) 2000–2010, and (c) 2010–2019.
3.2.3. Spatial Orientation of ISA
The SDEs expanded steadily across the four observations (Table 5; Figure 7). The long axis increased from 8.43 km in 1990 to 12.78 km in 2019, while the short axis increased from 7.30 to 11.25 km, indicating enlargement in both principal directions. Axis ratios remained close to 1.1, which suggests only moderate directional elongation. Rotation angles ranged from 119.11° to 139.09° and consistently defined a southeast–northwest axis. The results therefore indicate broad, multidirectional expansion with a persistent southeast–northwest spatial orientation, rather than a strongly one-directional growth process.
Table 5.
Standard deviational ellipse parameters for ISA, 1990–2019.
Figure 7.
Standard deviational ellipses of ISA in 1990, 2000, 2010, and 2019.
3.3. Spatiotemporal Dynamics from the ISP Perspective
The ISP perspective complements total-area analysis by identifying how individual locations moved among development-density classes. Changes in class area describe the changing composition of the urban landscape, while transition matrices identify the origin and destination of those changes. Landscape metrics then show how the resulting class mosaic became more or less fragmented, aggregated, and diverse.
3.3.1. Changes in ISP-Class Composition
The class composition changed profoundly between 1990 and 2019 (Table 6). Natural surfaces declined from 936.91 km2 (92.16%) to 129.62 km2 (12.75%). Over the same period, HDISP increased from 7.07 km2 (0.70%) to 267.58 km2 (26.32%), becoming the largest impervious class in 2019, while FDISP increased from 66.11 km2 (6.50%) to 246.07 km2 (24.21%). VLDISP, LDISP, and MDISP expanded particularly rapidly by 2010, reflecting the formation of extensive transitional urban landscapes. After 2010, VLDISP declined and LDISP changed little, whereas MDISP and HDISP continued to increase. This sequence indicates that much of the later-period change involved densification of already modified land rather than only first-time conversion of natural surfaces.
Table 6.
Area and proportion of ISP classes in Zhengzhou, 1990–2019.
3.3.2. Transitions Among ISP Classes
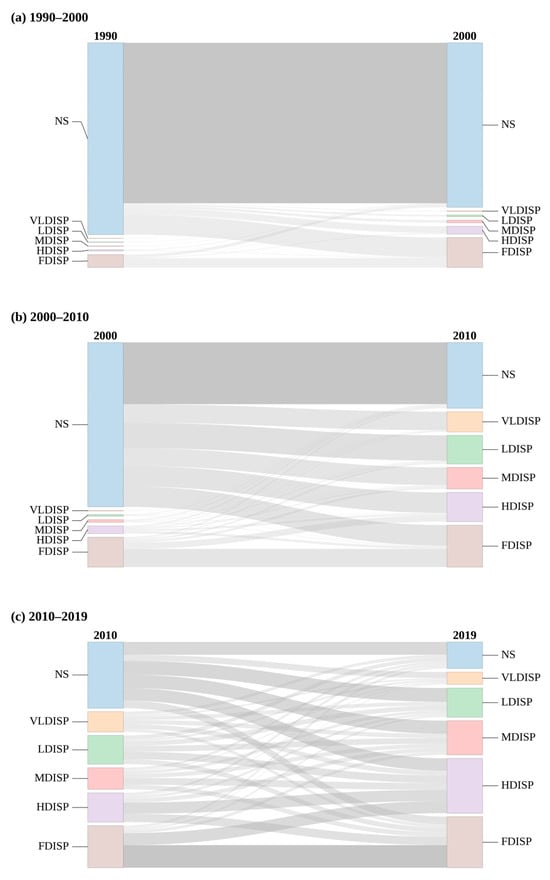
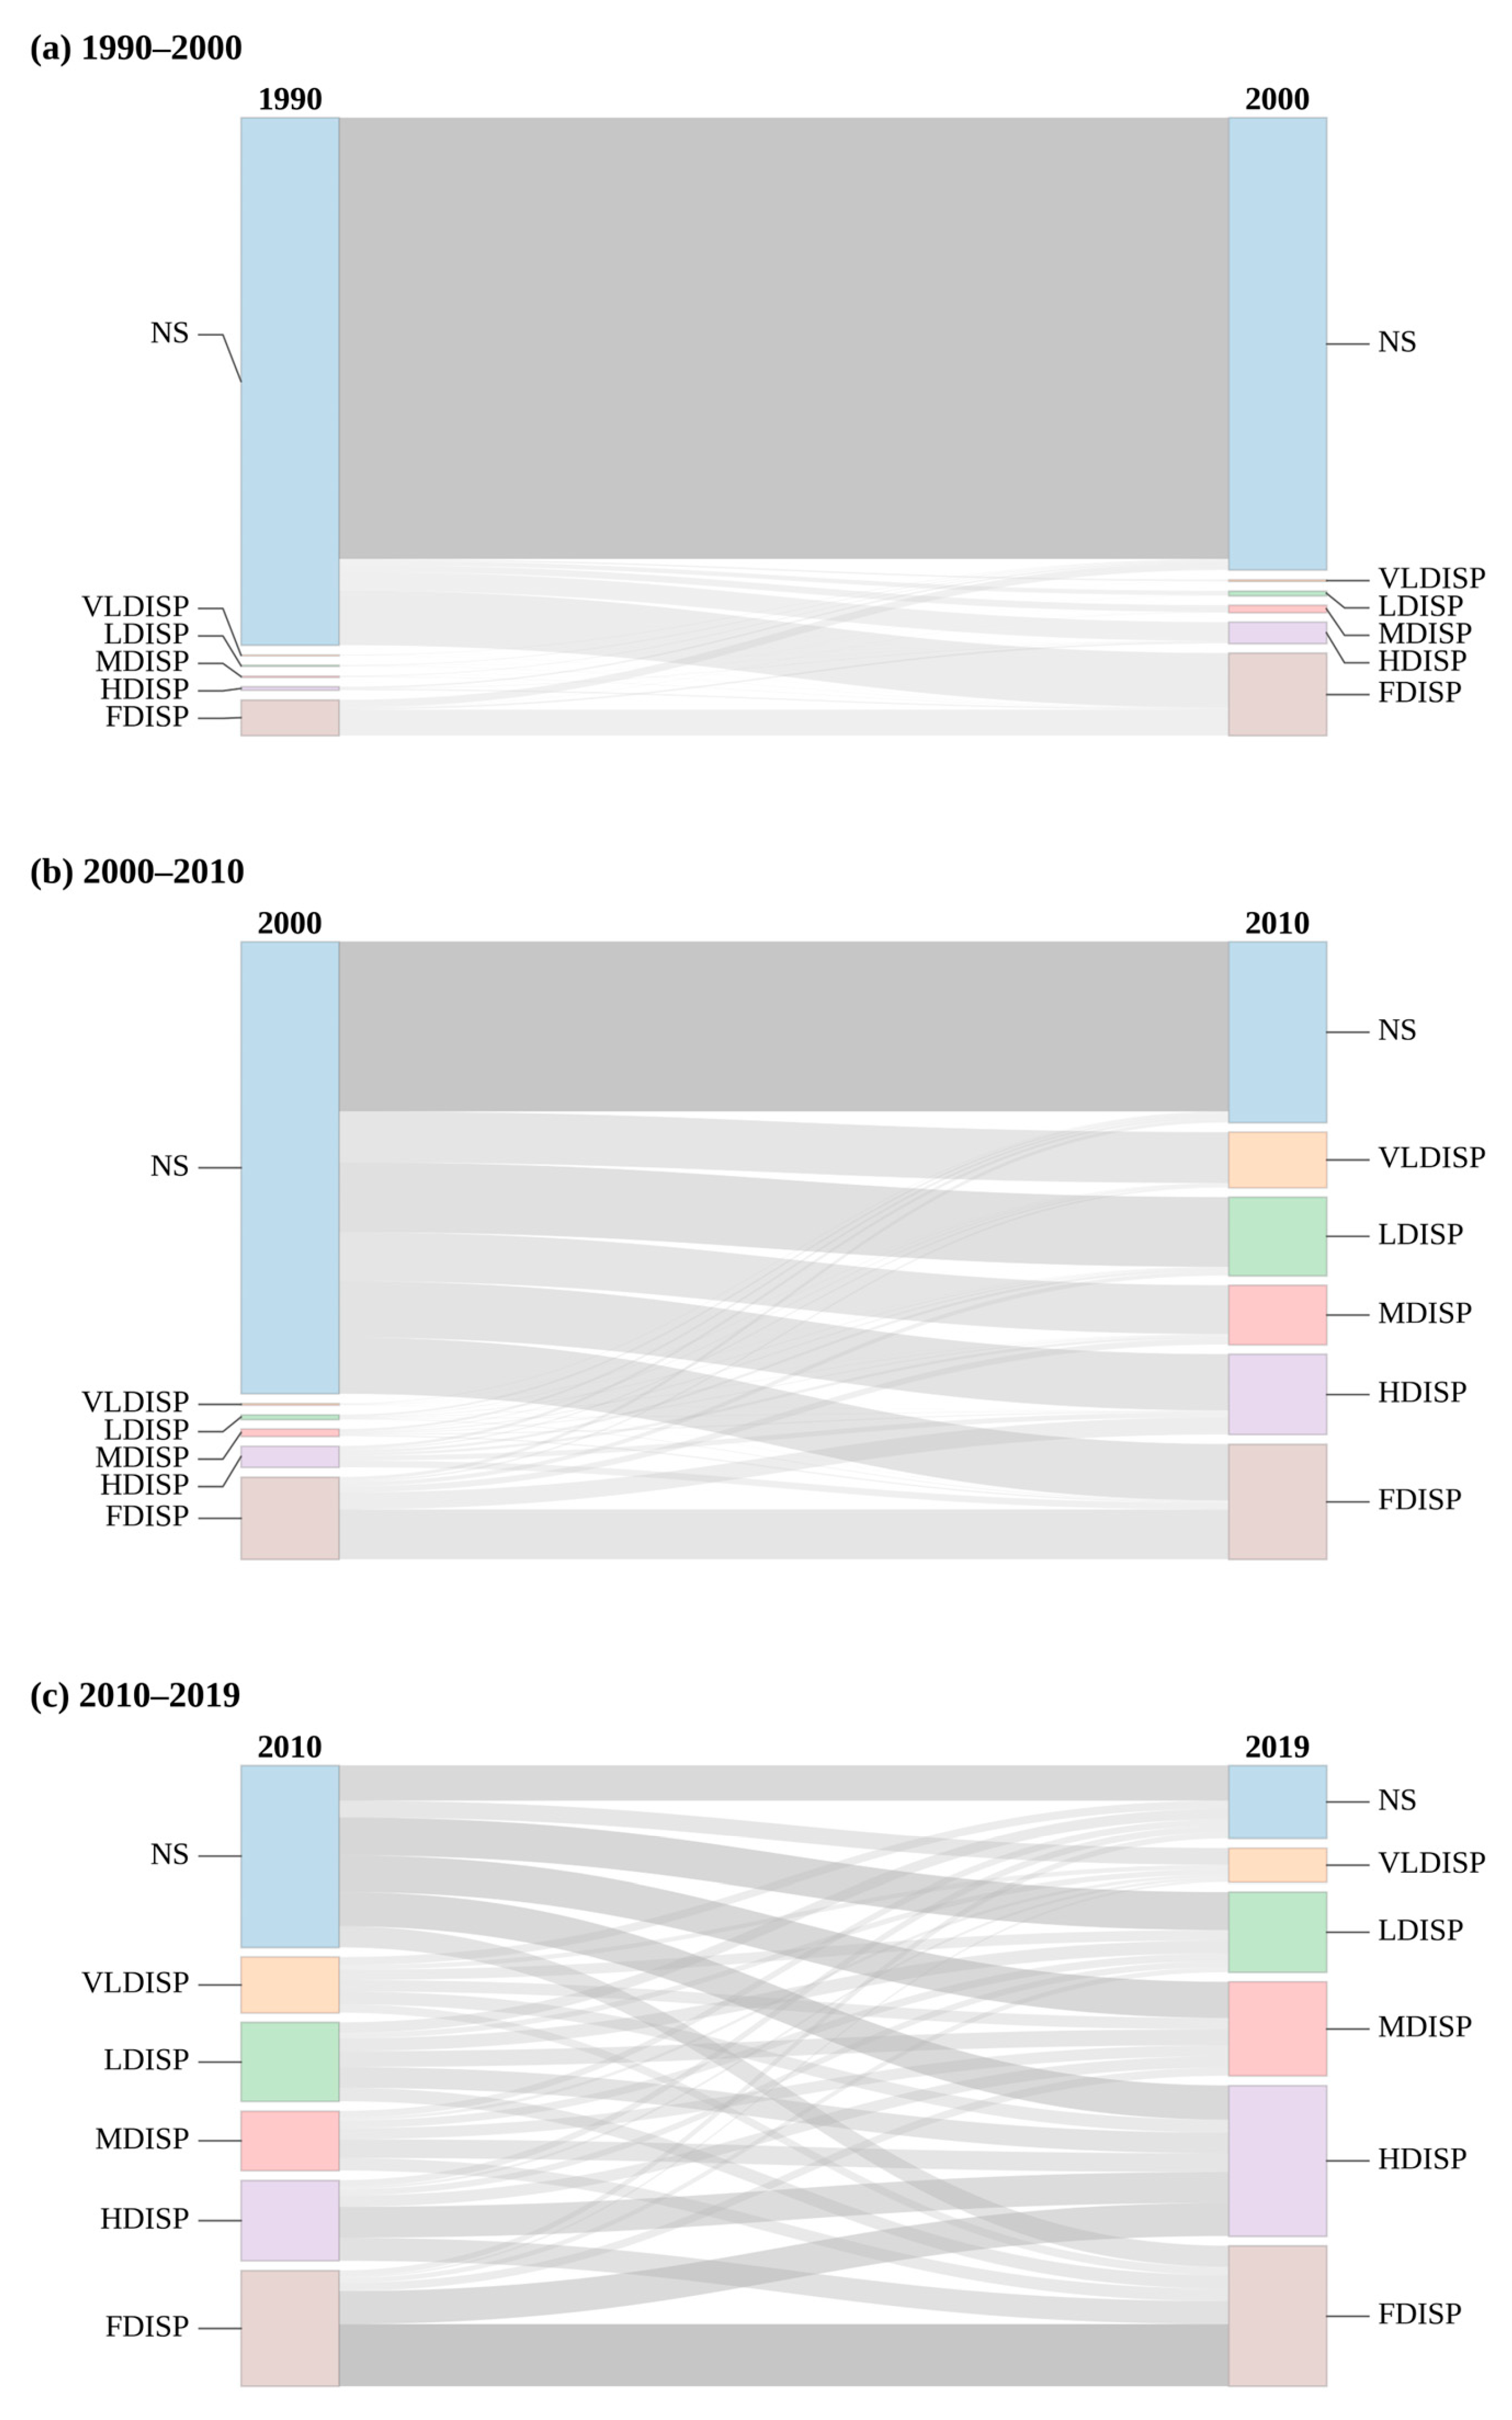
The ISPTMs identify three distinct phases of density transition (Table 7, Table 8 and Table 9) and are summarized visually by the Sankey diagrams in Figure 8: an early phase of incremental conversion (1990–2000), an acceleration phase with widespread redistribution (2000–2010), and a later phase characterized by continued conversion together with substantial densification and class mixing (2010–2019).
Table 7.
ISP transition matrix for Zhengzhou, 1990–2000 (Unit: km2, %).
Table 8.
ISP transition matrix for Zhengzhou, 2000–2010 (Unit: km2, %).
Table 9.
ISP transition matrix for Zhengzhou, 2010–2019 (Unit: km2, %).
Figure 8.
Sankey diagrams of ISP-class transitions in Zhengzhou for (a) 1990–2000, (b) 2000–2010, and (c) 2010–2019. The width of each flow is proportional to the transition area (km2).
During 1990–2000, 787.21 km2 of natural surface persisted, while the largest off-diagonal transition was 97.24 km2 from NS to FDISP (Table 7). Transitions from NS to the intermediate classes were smaller, and most initially impervious areas remained within impervious classes. The early phase was therefore dominated by outward conversion around an established, highly impervious core, with relatively limited intermediate-density development.
During 2000–2010, only 303.02 km2 of NS persisted, and large areas of NS were redistributed across every impervious class (Table 8). Conversions from NS to LDISP, HDISP, and FDISP each exceeded 100 km2, while 90.82 km2 and 87.25 km2 shifted to VLDISP and MDISP, respectively. The broad distribution of destination classes distinguishes this interval from the earlier phase and explains the sharp increase in intermediate-density landscapes by 2010.
During 2010–2019, persistence within NS fell to 63.04 km2, while 259.72 km2 of 2010 natural surface converted to impervious classes (Table 9). At the same time, substantial off-diagonal exchanges occurred among VLDISP, LDISP, MDISP, HDISP, and FDISP. FDISP gained 110.32 km2 through persistence and received large contributions from HDISP and other classes, whereas HDISP both persisted and exchanged area with FDISP and MDISP. The later phase thus combined continued fringe conversion with internal density reconfiguration, producing a more heterogeneous urban mosaic.
3.3.3. Landscape Reconfiguration Across ISP Classes
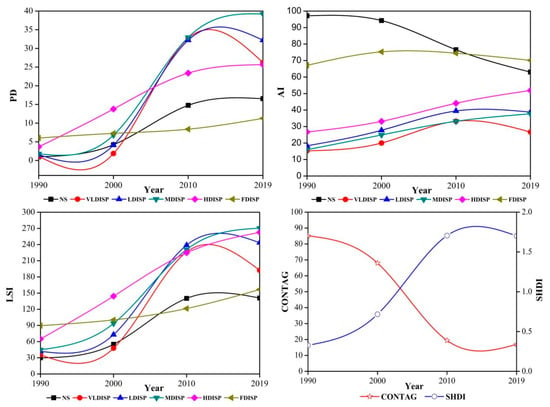
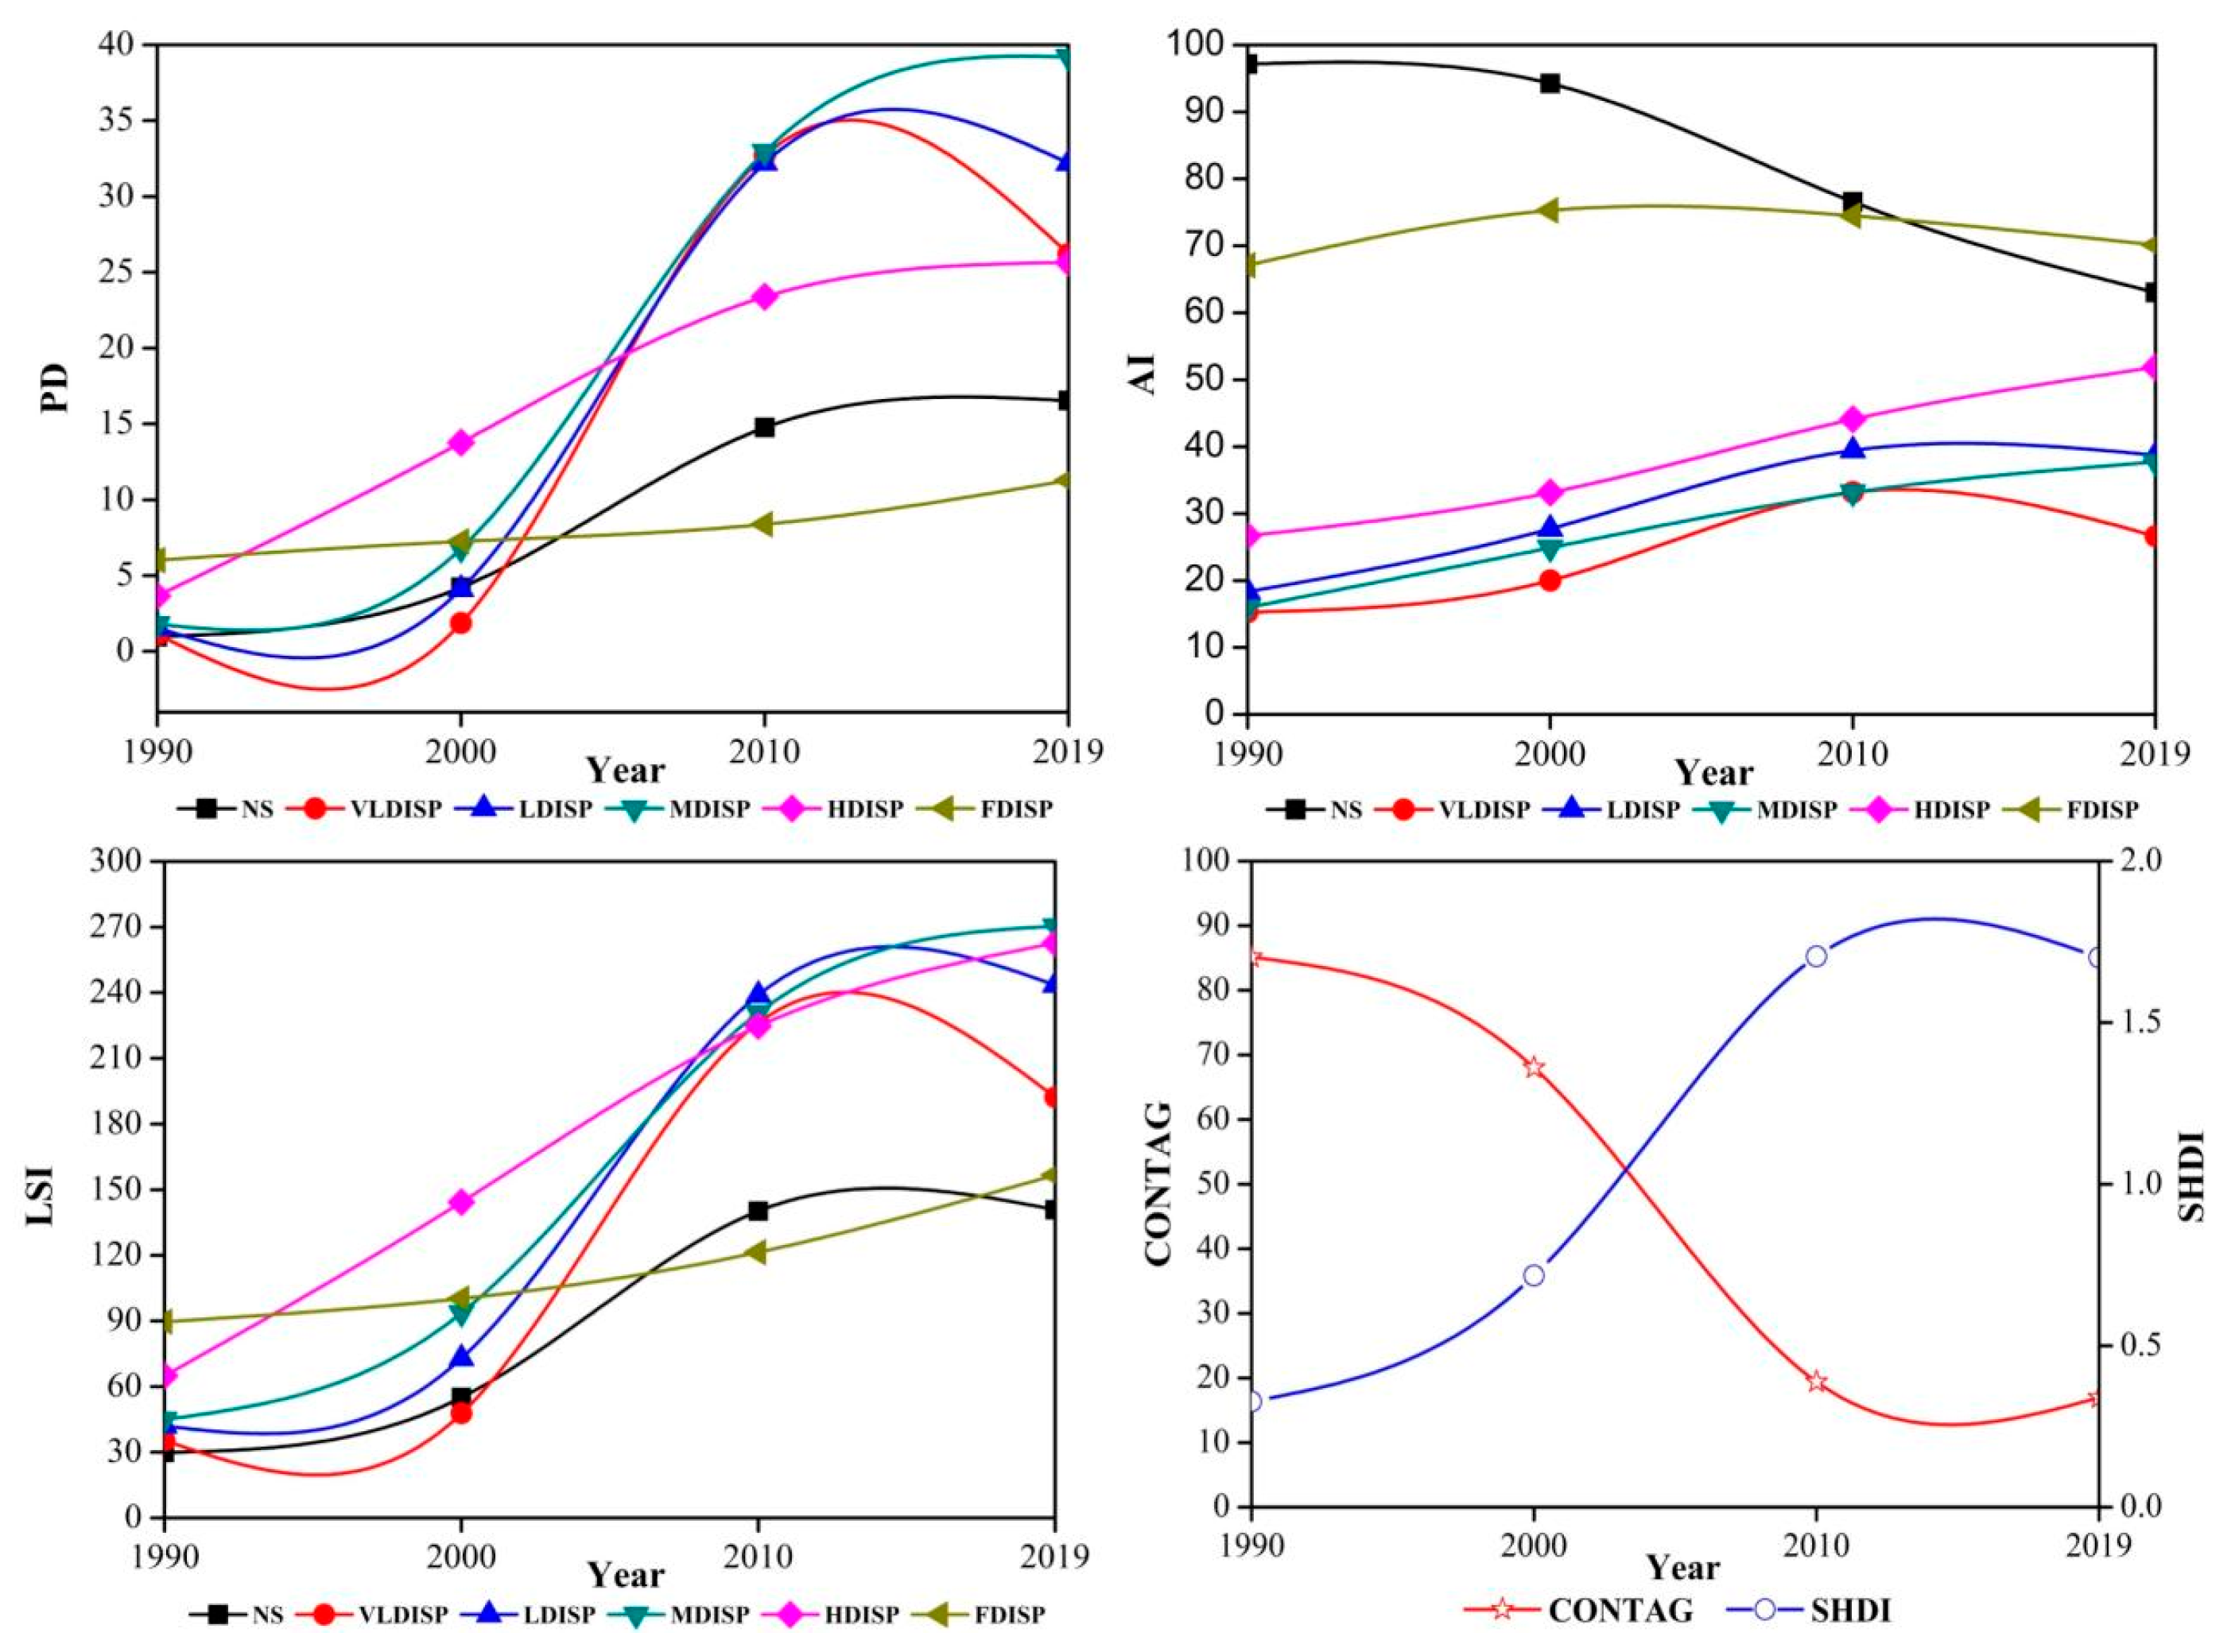
Class-level and landscape-level metrics calculated in FRAGSTATS 4.2 were interpreted together with the ISP transition matrices to identify how density conversion translated into landscape reconfiguration (Figure 9). Rather than treating PD, AI, LSI, CONTAG, and SHDI as independent signals, the analysis focuses on their complementary implications for fragmentation, coalescence, boundary complexity, dominance, and diversity across the three development stages.
Figure 9.
Changes in class- and landscape-level metrics for ISP classes in Zhengzhou, 1990–2019.
During 1990–2000, the dominant process was outward conversion of NS into impervious classes while much of the natural matrix still persisted. The emergence of new VLDISP–MDISP patches increased patch density and began to reduce the aggregation of NS. During 2000–2010, when ISA expansion reached its maximum absolute rate and the transition matrices recorded widespread redistribution of NS across all impervious classes, PD and LSI for NS and the intermediate-density classes increased strongly, while AI for NS declined. These coupled changes indicate that the acceleration phase simultaneously fragmented the residual natural matrix and generated a highly dissected transitional urban fringe composed of numerous low- and medium-density patches.
The 2010–2019 period shows a different configuration response. VLDISP, LDISP, and MDISP patch densities declined from their 2010 peaks even though ISA continued to increase, while substantial transitions among existing impervious classes persisted. This combination is consistent with partial coalescence, absorption, and densification of previously fragmented intermediate-density patches rather than simple continuation of the earlier expansion mode. At the same time, LSI continued to rise for MDISP, HDISP, and FDISP, indicating increasingly intricate boundaries within the mature urban fabric. The class-level metrics therefore support the transition-matrix evidence that late-stage urbanization involved both fringe conversion and internal density reorganization.
At the landscape level, CONTAG declined continuously while SHDI increased, showing a progressive shift from a landscape dominated by extensive natural surfaces and a compact impervious core toward a heterogeneous mosaic of multiple density classes. In combination with the class-level results, lower contagion reflects weakened continuity of the formerly dominant natural matrix, whereas higher diversity reflects a more even mixture of development densities created by successive conversion and densification. Increased diversity in this context should not be interpreted automatically as ecological improvement because it coincided with a major reduction and fragmentation of natural surfaces. Overall, the ISA, ISP-transition, and landscape-metric results describe a coherent sequence from outward land conversion, through proliferation of transitional-density patches, to increasing consolidation and internal densification.
4. Discussion
4.1. Stage-Dependent Urban Expansion and Density Transformation
The ISA results reveal a clear change in both the pace and spatial organization of urban growth. Absolute expansion accelerated during 2000–2010 and remained substantial after 2010, whereas annual expansion intensity declined from 14.70% to 4.07% as the pre-existing impervious base enlarged. Comparable combinations of continued land conversion and declining proportional growth have been reported in other rapidly urbanizing Chinese cities, including Hangzhou and Xuzhou [32,33], and national-scale evidence likewise shows that urban expansion trajectories vary strongly by developmental stage [1]. In Zhengzhou, the temporal transition was accompanied by significant positive spatial autocorrelation in every interval, indicating that rapid and slow expansion were organized in neighboring clusters rather than distributed independently among subdistricts. The mobile high–high clusters and expanding SDEs further show that no single district or direction explains the full process; instead, adjacent subdistricts successively became growth fronts while the metropolitan footprint retained a moderate southeast–northwest orientation.
The density transitions add an important dimension to this stage interpretation. Large NS-to-impervious conversions during 2000–2010 produced a broad transitional belt of low- and medium-density development, whereas the post-2010 period combined continued fringe conversion with extensive exchanges among existing impervious classes. This pattern suggests a gradual shift from growth dominated by outward land conversion toward a mixed regime in which internal densification and reorganization became increasingly important. Such an interpretation is consistent with contemporary urban-morphology research emphasizing that sustainable urban development cannot be evaluated solely from the amount of built-up land, because density, compactness, spatial configuration, and internal reorganization jointly shape urban performance [15]. The present results therefore extend conventional urban-expansion analysis by showing how the same increase in total ISA can be associated with different internal density pathways at different development stages. Because policy, infrastructure, population, and economic variables were not explicitly modeled, these contextual factors are not interpreted here as causal drivers; rather, the observed stage differences define patterns that future driver-oriented studies can test directly.
4.2. Coupling ISA Expansion, ISP Transitions, and Landscape Reconfiguration
The principal contribution of the integrated framework is that ISA expansion, ISP transition, and landscape metrics can be read as successive components of the same urbanization process rather than as parallel analyses. The acceleration phase illustrates this coupling most clearly: rapid ISA gain coincided with widespread NS conversion into multiple density classes, which in turn generated higher PD and LSI and lower aggregation of the remaining natural surfaces. After 2010, ISA continued to grow, but the decline of PD in several intermediate-density classes together with continuing upward transitions to MDISP, HDISP, and FDISP indicates partial patch consolidation and internal densification. Thus, the landscape metrics provide the configurational consequence of the transitions identified by the ISPTMs, while the ISPTMs identify the density pathways that cannot be inferred from landscape indices alone. This continuous chain—area expansion → density transition → landscape response—clarifies the new information added by the ISA–ISP framework compared with studies based only on binary built-up expansion or only on landscape configuration.
This integrated interpretation also supports broader ecological and planning implications. The strong decline in NS, its reduced aggregation, and the continuous decline in CONTAG suggest increasing fragmentation and weakening continuity of the residual natural matrix, conditions that may constrain ecological connectivity and the provision of ecosystem functions even when overall landscape diversity increases. In Zhengzhou, previous research has also shown that impervious-surface expansion is associated with changes in local precipitation characteristics, illustrating how continued surface sealing can interact with urban climate and hydrological processes [34]. These findings support differentiated planning responses: residual natural surfaces should be protected and reconnected as a network; fragmented VLDISP–MDISP transition zones require controls that limit piecemeal conversion and preserve blue–green corridors; and established HDISP–FDISP districts are better suited to redevelopment, permeable retrofits, and blue–green infrastructure than to further outward expansion. Ecosystem-assessment approaches that explicitly link land transformation with ecosystem-service capacity provide a useful basis for translating such spatial evidence into land-protection and planning decisions [35]. In terms of the United Nations Sustainable Development Goals, these implications relate directly to SDG 11 through compact and resilient urban planning, SDG 13 through climate adaptation and urban resilience, and SDG 15 through the conservation and reconnection of fragmented terrestrial and semi-natural habitats. These planning implications are evidence-informed interpretations of the observed spatial configuration; their site-specific effectiveness should be tested with hydrological, thermal, ecological, and socioeconomic data before implementation.
4.3. Limitations, Transferability, and Research Needs
Several limitations bound the interpretation of the results. First, the four approximately decadal observations were selected to reconstruct major development stages rather than annual trajectories. The 1990–2019 sequence captures the transition from early growth through the principal acceleration phase to a later, proportionally slower and increasingly density-restructuring stage, but 2019 does not represent the current condition of Zhengzhou; post-2019 changes should therefore be evaluated in future extensions of the time series. Second, although all scenes were selected within the May–September growing season and processed using a consistent FLAASH workflow, the analysis combines TM, ETM+, and OLI imagery acquired in different months, and the 2010 ETM+ scene required gap repair. Residual cross-sensor, phenological, atmospheric, and reconstruction effects may therefore influence individual ISP estimates. Third, DELSMA has been independently validated in the same study area for all three Landsat sensor families used here, but the four specific scenes were not subjected to separate date-specific reference validation. Greatest confidence should consequently be placed on large and persistent spatiotemporal patterns rather than small transitions near class boundaries. Fourth, the six ISP classes follow established threshold-based practice and were held constant to ensure temporal comparability; alternative thresholds or spatial resolutions could change some transition areas and landscape metrics, particularly near class boundaries. Finally, the analysis identifies spatial associations and configurational consequences but does not test causal socioeconomic or policy drivers or directly quantify ecosystem services. Future work should extend the framework with denser recent observations, date-specific validation where historical reference imagery permits, threshold-sensitivity tests, ecological-connectivity and ecosystem-service indicators, and explicit driver models. Because ISA and ISP are generic quantities obtainable from long-term Landsat records, the framework is transferable to other rapidly urbanizing cities, but threshold behavior, dominant transition pathways, and planning implications should be reassessed for local urban form and environmental context.
5. Conclusions
Using an integrated ISA–ISP framework, this study reconstructed nearly three decades of impervious-surface evolution in central Zhengzhou and linked changes in urban footprint, internal development density, and landscape configuration. Rather than treating these dimensions independently, the framework identifies how outward expansion and density reorganization jointly produce stage-specific landscape responses. The main findings are as follows:
- (1)
- Total ISA increased by 452.22 km2, from 71.12 km2 in 1990 to 523.34 km2 in 2019. Absolute expansion was greatest during 2000–2010, whereas annual expansion intensity declined across successive intervals. The temporal pattern therefore reflects not only continued growth but also a transition from the principal acceleration phase toward proportionally slower expansion after 2010.
- (2)
- ISA expansion was significantly and positively clustered among neighboring subdistricts in all three intervals. The locations of high–high clusters shifted over time, while the metropolitan footprint retained a moderate southeast–northwest orientation. These results characterize expansion as spatially coordinated and stage-dependent rather than uniformly distributed.
- (3)
- Natural surfaces declined from 92.16% to 12.75% of the study area, accompanied by substantial growth in high-density and fully impervious classes. When the transition matrices are interpreted jointly with landscape metrics, the sequence progresses from outward conversion of natural surfaces to proliferation of fragmented intermediate-density development, and then to a mixed regime of fringe conversion, patch consolidation, and internal densification. The resulting landscape became more compositionally diverse but less contagious, with fragmented natural surfaces and increasingly complex dense-development patches. Conceptually, this demonstrates the value of integrating ISA and ISP: area-based indicators identify how much and where urbanization expands, while density transitions reveal how already modified land is reorganized, and landscape metrics show the configurational consequences of those changes. The framework can therefore support comparative analysis in other rapidly urbanizing cities, provided that local density thresholds, sensor uncertainty, and urban-development context are explicitly considered. For planning, the results support protection and reconnection of residual natural surfaces, careful management of fragmented transition zones, and blue–green retrofits and redevelopment within established high-density districts.
Author Contributions
Conceptualization, W.L.; methodology, X.H.; software, F.L.; validation, X.H., F.L. and W.L.; formal analysis, G.D.; investigation, R.C.; resources, W.M.; data curation, H.H.; writing—original draft preparation, X.H.; writing—review and editing, F.L.; visualization, X.H.; supervision, W.L.; project administration, X.H.; funding acquisition, W.L. All authors have read and agreed to the published version of the manuscript.
Funding
This research was supported by the Natural Science Foundation of Henan (Grant No. 262300421761), the Open Research Fund Program of the State Key Laboratory of Water Disaster Prevention (Grant No. 2025490111), the Henan Provincial Science and Technology Research Project (Grant No. 242102320322), the Key Scientific Research Project of Colleges and Universities in Henan Province (Grant No. 24A570003), the National Natural Science Foundation of China (Grant No. 52309018), and the Key Research and Development Special Project of Henan Province (Grant No. 2411113211003).
Institutional Review Board Statement
Not applicable.
Informed Consent Statement
Not applicable.
Data Availability Statement
The data used in this study were obtained from publicly available datasets and institutional data sources described in the Materials and Methods section (Section 2). Derived data supporting the findings of this study are available from the corresponding author upon reasonable request.
Acknowledgments
The authors thank the United States Geological Survey (USGS) for providing publicly available datasets used in this study.
Conflicts of Interest
Author Guoquan Dong was employed by the company Power China Beijing Engineering Corporation Limited. The remaining authors declare that the research was conducted in the absence of any commercial or financial relationships that could be construed as a potential conflict of interest.
References
- Wang, C.; Liu, S.; Zhou, S.; Zhou, J.; Jiang, S.; Zhang, Y.; Feng, T.; Zhang, H.; Zhao, Y.; Lai, Z.; et al. Spatial-temporal patterns of urban expansion by land-use/land-cover transfer in China. Ecol. Indic. 2023, 155, 111009. [Google Scholar] [CrossRef] [Scilit]
- Chang, M.; Luo, X.; Zhang, Y.; Pang, Y.; Li, M.; Liu, J.; Da, L.; Song, K. Land-use diversity can better predict urban spontaneous plant richness than impervious surface coverage at finer spatial scales. J. Environ. Manag. 2022, 323, 116205. [Google Scholar] [CrossRef] [Scilit]
- Hou, Y.; Ding, W.; Liu, C.; Li, K.; Cui, H.; Liu, B.; Chen, W. Influences of impervious surfaces on ecological risks and controlling strategies in rapidly urbanizing regions. Sci. Total Environ. 2022, 825, 153823. [Google Scholar] [CrossRef] [Scilit]
- Wang, M.; Fu, X.; Zhang, D.; Chen, F.; Liu, M.; Zhou, S.; Su, J.; Tan, S.K. Assessing urban flooding risk in response to climate change and urbanization based on shared socio-economic pathways. Sci. Total Environ. 2023, 880, 163470. [Google Scholar] [CrossRef] [Scilit]
- Ren, L.; Song, S.; Zhou, Y. Evaluation of river ecological status in the plain river network area in the context of urbanization: A case study of 21 rivers in Jiangsu Province, China. Ecol. Indic. 2022, 142, 109172. [Google Scholar] [CrossRef] [Scilit]
- Fu, B.B.; Peng, Y.R.; Zhao, J.; Wu, C.H.; Liu, Q.X.; Xiao, K.X.; Qian, G.R. Driving forces of impervious surface in a world metropolitan area, Shanghai: Threshold and scale effects. Environ. Monit. Assess. 2019, 191, 771. [Google Scholar] [CrossRef] [Scilit]
- Wei, D.; Chang, Y.; Kuang, H. Extraction and spatiotemporal analysis of impervious surfaces in Chongqing based on enhanced DeepLabv3+. Sci. Rep. 2025, 15, 9807. [Google Scholar] [CrossRef] [Scilit]
- Ridd, M.K. Exploring a V-I-S (vegetation-impervious surface-soil) model for urban ecosystem analysis through remote sensing: Comparative anatomy for cities. Int. J. Remote Sens. 1995, 16, 2165–2185. [Google Scholar] [CrossRef] [Scilit]
- Wu, C.; Murray, A.T. Estimating impervious surface distribution by spectral mixture analysis. Remote Sens. Environ. 2003, 84, 493–505. [Google Scholar] [CrossRef] [Scilit]
- Wu, C. Normalized spectral mixture analysis for monitoring urban composition using ETM+ imagery. Remote Sens. Environ. 2004, 93, 480–492. [Google Scholar] [CrossRef] [Scilit]
- Huang, X.; Liu, W.; Han, Y.; Wang, C.; Wang, H.; Hu, S. Performance evaluation and comparison of modified spectral mixture analysis methods for different Landsat sensors. Sustainability 2019, 11, 6227. [Google Scholar] [CrossRef] [Scilit]
- Huang, X.; Liu, W.; Han, Y.; Zhang, H.; Li, X.; Mu, W. A method of estimating urban impervious surface based on the DELSMA model. Sci. Surv. Mapp. 2019, 44, 79–86. [Google Scholar] [CrossRef]
- Kawakubo, F.; Morato, R.; Martins, M.; Mataveli, G.; Nepomuceno, P.; Martines, M. Quantification and analysis of impervious surface area in the metropolitan region of São Paulo, Brazil. Remote Sens. 2019, 11, 944. [Google Scholar] [CrossRef] [Scilit]
- Man, W.; Nie, Q.; Hua, L.; Wu, X.; Li, H. Spatio-temporal variations in impervious surface patterns during urban expansion in a coastal city: Xiamen, China. Sustainability 2019, 11, 2404. [Google Scholar] [CrossRef] [Scilit]
- Mobaraki, A.; Nikoofam, M.; Mobaraki, B. The nexus of morphology and sustainable urban form parameters as a common basis for evaluating sustainability in urban forms. Sustainability 2025, 17, 3967. [Google Scholar] [CrossRef] [Scilit]
- Arnold, C.L., Jr.; Gibbons, C.J. Impervious surface coverage: The emergence of a key environmental indicator. J. Am. Plan. Assoc. 1996, 62, 243–258. [Google Scholar] [CrossRef] [Scilit]
- Deng, C.; Wu, C. BCI: A biophysical composition index for remote sensing of urban environments. Remote Sens. Environ. 2012, 127, 247–259. [Google Scholar] [CrossRef] [Scilit]
- Liu, J.H.; Fang, T.; Li, D.R. Shadow detection in remotely sensed images based on self-adaptive feature selection. IEEE Trans. Geosci. Remote Sens. 2011, 49, 5092–5103. [Google Scholar] [CrossRef] [Scilit]
- Otsu, N. A threshold selection method from gray-level histograms. IEEE Trans. Syst. Man Cybern. 1979, 9, 62–66. [Google Scholar] [CrossRef] [Scilit]
- Sun, G.; Chen, X.; Ren, J.; Zhang, A.; Jia, X. Stratified spectral mixture analysis of medium-resolution imagery for impervious surface mapping. Int. J. Appl. Earth Obs. Geoinf. 2017, 60, 38–48. [Google Scholar] [CrossRef] [Scilit]
- Cui, Y.; Li, L.; Chen, L.; Zhang, Y.; Cheng, L.; Zhou, X.; Yang, X. Land-use carbon emissions estimation for the Yangtze River Delta urban agglomeration using 1994–2016 Landsat image data. Remote Sens. 2018, 10, 1334. [Google Scholar] [CrossRef] [Scilit]
- Fu, W.J.; Jiang, P.K.; Zhou, G.M.; Zhao, K.L. Using Moran’s I and GIS to study the spatial pattern of forest litter carbon density in a subtropical region of southeastern China. Biogeosciences 2014, 11, 2401–2409. [Google Scholar] [CrossRef] [Scilit]
- Tiefelsdorf, M. The saddlepoint approximation of Moran’s I’s and local Moran’s Ii’s reference distributions and their numerical evaluation. Geogr. Anal. 2002, 34, 187–206. [Google Scholar] [CrossRef] [Scilit]
- Zhang, C.; Luo, L.; Xu, W.; Ledwith, V. Use of local Moran’s I and GIS to identify pollution hotspots of Pb in urban soils of Galway, Ireland. Sci. Total Environ. 2008, 398, 212–221. [Google Scholar] [CrossRef] [Scilit]
- Yuan, Y.; Cave, M.; Zhang, C. Using local Moran’s I to identify contamination hotspots of rare earth elements in urban soils of London. Appl. Geochem. 2018, 88, 167–178. [Google Scholar] [CrossRef] [Scilit]
- Lefever, D.W. Measuring geographic concentration by means of the standard deviational ellipse. Am. J. Sociol. 1926, 32, 88–94. [Google Scholar] [CrossRef] [Scilit]
- Al-Kindi, K.M.; Kwan, P.; Andrew, N.R.; Welch, M. Modelling spatiotemporal patterns of dubas bug infestations on date palms in northern Oman: A geographical information system case study. Crop Prot. 2017, 93, 113–121. [Google Scholar] [CrossRef] [Scilit]
- Wang, S.; Zhao, Z.; Xu, Y.; Li, X. Mathematical analysis of urban land-use change in Xi’an city wall area using parcel-level data. Sci. China Technol. Sci. 2019, 62, 687–697. [Google Scholar] [CrossRef] [Scilit]
- Liu, Z.H.; Wang, Y.L.; Peng, J. Quantifying spatiotemporal pattern dynamics of impervious surfaces in Shenzhen. Geogr. Res. 2012, 31, 1535–1545. [Google Scholar] [CrossRef]
- Cushman, S.A.; McGarigal, K.; Neel, M.C. Parsimony in landscape metrics: Strength, universality, and consistency. Ecol. Indic. 2008, 8, 691–703. [Google Scholar] [CrossRef] [Scilit]
- Liu, T.; Yang, X. Monitoring land changes in an urban area using satellite imagery, GIS, and landscape metrics. Appl. Geogr. 2015, 56, 42–54. [Google Scholar] [CrossRef] [Scilit]
- Li, L.; Lu, D.; Kuang, W. Examining urban impervious surface distribution and its dynamic change in Hangzhou metropolis. Remote Sens. 2016, 8, 265. [Google Scholar] [CrossRef] [Scilit]
- Li, H.; Li, L.; Chen, L.; Zhou, X.; Cui, Y.; Liu, Y.; Liu, W. Mapping and characterizing spatiotemporal dynamics of impervious surfaces using Landsat images: A case study of Xuzhou, East China, from 1995 to 2018. Sustainability 2019, 11, 1224. [Google Scholar] [CrossRef] [Scilit]
- Huang, X.; Liu, W.; Cao, R.; Han, Y. Effects of impervious surface expansion on precipitation characteristics in main urban area of Zhengzhou City. Water Resour. Prot. 2022, 38, 22–30. [Google Scholar] [CrossRef]
- Córdoba Hernández, R.; Camerin, F. The application of ecosystem assessments in land use planning: A case study for supporting decisions toward ecosystem protection. Futures 2024, 161, 103399. [Google Scholar] [CrossRef] [Scilit]

Disclaimer/Publisher’s Note: The statements, opinions and data contained in all publications are solely those of the individual author(s) and contributor(s) and not of MDPI and/or the editor(s). MDPI and/or the editor(s) disclaim responsibility for any injury to people or property resulting from any ideas, methods, instructions or products referred to in the content. |
© 2026 by the authors. Licensee MDPI, Basel, Switzerland. This article is an open access article distributed under the terms and conditions of the Creative Commons Attribution (CC BY) license.