


Abstract
Construction materials move in large volumes, over varying distances and through fragmented logistics chains. Yet EN 15804 Module A4, which covers transport to the building site, is still often calculated with static assumptions rather than verified transport data. This creates a gap between declared and project-specific cradle-to-site emissions, especially when circular strategies shift flows from factory-to-site towards site-to-site, site-to-processing and processing-to-site logistics. This paper focuses on dynamic A4 assessment, using macro-level analysis to identify the material flows, spatial patterns, transport modes and digital data needed for traceable logistics-based carbon accounting. The framework connects construction material-flow analysis with Digital Product Passports, ISO 14083 logistics data, GS1 Digital Link, GS1 EPCIS and digital-twin concepts. Building-permit data are used as spatial indicators of material sinks and transport-demand hotspots. The analysis uses Slovenian road, rail and maritime freight statistics, operational railway data for construction-related material categories, CDW data and building-permit data for 2020–2024. Results show that domestic road transport accounts for 93–95% of transported construction-material tonnage, while the smaller international freight volume generates nearly half of total ton-kilometers. Macro-level analysis is essential for locating material demand, potential transport hotspots and 5R strategies: refuse, reduce, reuse, repurpose and recycle. This study defines key information needs for product identification, transported mass, transport legs, distance, mode, energy pathway, load factor, empty running, logistics events and traceability. The results support policymakers, standardization bodies, contractors, logistics providers, manufacturers, researchers and software developers.
1. Introduction
Construction is entering a combined digital and green transition, driven by the EU Green Deal [1], Ecodesign for Sustainable Products Regulation (ESPR) EU 2024/1781 [2] and emerging Digital Product Passport (DPP) [3]. These instruments shift sustainability reporting from voluntary disclosure towards machine-readable and verifiable product information across the value chain. For construction products, this creates a direct link between DPPs, Environmental Product Declarations (EPDs) [4,5] and transport emissions, as cradle-to-site impacts cannot be assessed from manufacturing data alone. EN 15804 Module A4 [6] is therefore a critical interface between product carbon and logistics data.
1.1. The Role of Construction Logistics
This study focuses on EN 15804 Module A4 (Figure 1), which covers transport to the construction site and links product stage (A1–A3) with construction activities (A5). In this study, static A4 refers to assumption-based assessment, project-specific A4 refers to assessment based on known suppliers and routes and dynamic A4 refers to event-based assessment that can be updated as logistics activities occur. This distinction is particularly important in circular construction, where materials may originate not only from manufacturers but also from demolition sites, urban mining, reuse hubs and recovery facilities.
Figure 1.
Context of this study, focusing on EN 15804 Module A4, defined as transport to the building site. Transport is an important but often underestimated contributor to cradle-to-site impacts.
Current A4 assessments often use representative assumptions. Default distances, vehicles, modes and utilization rates therefore replace actual transport chains [5]. Although EN 15804-compliant, this remains a proxy for real logistics. A4 links product carbon data with physical material flows and should therefore be treated as a logistics-dependent part of cradle-to-site assessment, not a fixed scenario.
This is especially relevant for high-volume materials such as aggregates, concrete, cementitious products, steel, timber, earth and secondary minerals. Distance, routing, utilization and handling can offset product-stage emission reductions. A4 can range from almost zero to more than 80% of upfront embodied carbon [7], while A4 and A5 may also contribute significantly to whole-life carbon [8]. Infrastructure studies report similar limitations where actual transport distances are unavailable [9,10].
Circular materials add further logistics between sources, processing facilities and receiving projects. Transport distance can determine whether recycled or low-carbon materials retain their environmental benefits [11,12]. Modal choice is therefore important: road provides flexibility and last-mile access, while rail and waterborne transport can reduce impacts for bulk and long-distance flows [13,14].
Prefabricated and modular construction introduces similar dependencies through stacking, vehicle capacity and delivery sequencing, which can be managed using digital twins [15]. Loading-efficiency models confirm substantial effects on transport emissions [16]. A4 is therefore a logistics configuration problem, not merely a distance multiplier.
Transport also affects sourcing decisions. Local supply is not always preferable when production impacts, loading efficiency, or transport modes differ. Construction Consolidation Centers [17], regional hubs and reverse logistics can improve utilization, backhauling and material redistribution. Electrification, modal shift and consolidation can further reduce emissions, depending on infrastructure and operational feasibility [18]. Harmonized calculation methods are also needed across logistics actors [19].
A4 is becoming a decision layer connecting design, procurement, logistics, circular sourcing and carbon governance. Dynamic A4 should connect EN 15804 product data with ISO 14083 transport accounting [20], DPPs and GS1 EPCIS logistics-event records [21]. Supply-chain digital twins, EPD/DPP itineraries, IoT and telematics can replace generic assumptions with shipment-specific data and reduce transport-emission errors [7,22,23,24]. Adoption remains constrained by incomplete metadata, heterogeneous telematics, processing demands, privacy and inconsistent accounting methods [25,26,27,28,29,30].
LCA and DPP/EPCIS solutions can integrate transport routes, energy use, transport conditions and provenance [31,32,33,34] but face query complexity, confidentiality, investment costs and uncertain returns [35,36,37,38,39,40,41]. Alignment among ISO 22057 [42], ILCD + EPD, IFC 4.3 [43], ISO 14083, GLEC [44] and DIN SPEC 91472 [45] supports automated exchange between EPD, BIM and LCA systems [4,46,47,48,49,50,51,52]. Digital EPDs, however, still lack consistent identifiers, scenario fields, complete datasets and country-specific inventories [46,53,54,55,56,57,58].
Federated data spaces, Asset Administration Shells (AASs), blockchain and decentralized identifiers (DID) can strengthen data access, integrity and provenance [59,60,61,62,63], while fragmented infrastructure, weak governance, limited skills and resistance to digital transition remain major barriers [64,65,66,67,68,69,70].
Appendix A provides the full taxonomic analysis. The identified potentials and barriers are consolidated below into research gaps for dynamic and automated EN 15804 Module A4 assessment.
1.2. Research Gaps
A4 implementation remains fragmented and context-specific. Reported results differ by about 30% to more than 146%, depending on modeling choices, datasets and emission factors [23,28]. Appendix A groups the solutions and barriers into four essential areas: primary logistics data, DPP/EPCIS traceability, standards alignment and data-space governance. Eight gaps remain.
Gap 1: Data gap. Shipment-level data on distance, mode, vehicle, energy pathway, load factor, empty running and allocation are often missing or generic [8,9,71]. Digital twins and telematics improve resolution, but metadata, privacy and data heterogeneity still constrain accuracy and implementation [7,22,24].
Gap 2: Methodological gap. Results vary with distance sources, emission factors, allocation, empty running, co-loading and multi-modal treatment. EN 15804 gives limited operational guidance [72,73]. A consistent workflow must link product or batch identity, quantity, transport legs, allocation and project location. ISO 14083/GLEC and machine-readable EPD/DPP can support this but remain only partly integrated [7,8,23,47,48].
Gap 3: Benchmarking and validation gap. Benchmarks across materials, projects and regions remain limited, although A4 can exceed 80% of upfront embodied carbon [7]. Direct method comparisons are rare [74,75], and inconsistent data and EPD quality hinder validation [7,22]. Recent cradle-to-site embodied-carbon project-level frameworks improve transparency by detailed material quantification, structured carbon-factor selection and representativeness checks at project level [76] but lack macro freight benchmarks, spatial material-sink analysis and logistics-event validation.
Gap 4: Geographical transferability gap. Evidence remains limited across smaller economies, transit regions and port-based systems. Regional differences in modes, fleets, fuels, infrastructure and electricity mixes require region-specific routing, intermodal accounting, inventories and logistics data [7,22,24].
Gap 5: Transparency and uncertainty gap. A4 is often reported deterministically despite uncertain routing, loading, return trips and emission factors. Fragmented data and insufficient standardization can further reduce transparency and comparability [77], requiring data-quality indicators, uncertainty flags and traceability [24,63].
Gap 6: Latency gap. EPD/DPP approaches rarely update A4 when logistics events occur. DPPs and GS1 EPCIS can support event-based A4, but complexity, confidentiality, cost and limited A4-specific research remain barriers [31,34,60,61,62].
Gap 7: Design-integration gap. LCA tools are often used after key logistics decisions are made [78]. Earlier integration of digital twins, DPPs, machine-readable schemas and ISO 14083/GLEC into BIM/LCA workflows remains limited and incomplete [7,22,23,62].
Gap 8: Interoperability and governance gap. Transport data remain fragmented across actors, platforms, CDEs, public datasets and telematics. Different formats, access rights, ownership models and confidentiality rules prevent reliable exchange. Dynamic A4 requires trusted interoperability among DPPs, ISO 14083 [20], GS1 identifiers, EPCIS events [79], telemetry and project systems. Gaia-X, AAS, blockchain and decentralized identifiers can support secure exchange, but governance deficits, fragmented infrastructure, skills gaps and resistance to digital transition remain major barriers [51,59,60,62].
1.3. Objective and Contribution of This Study
Existing A4 studies mainly calculate project-level transport emissions using assumed or project-specific distances. National freight studies describe macro-level movements but do not connect them to EN 15804 project assessment. DPP and EPCIS studies address identification and traceability but rarely link logistics events to construction A4.
The objective of this study is to connect these levels by using macro freight, CDW and permit data to identify monitoring priorities and by defining the procedural, mathematical and digital requirements for subsequent shipment-level A4 assessment.
The macro-to-project methodological framework uses national freight, CDW and construction-permit statistics to identify dominant material flows and material sinks. Material-flow and CDW data show the balance between primary inputs, accumulated stock and secondary flows. Building permits are used in two ways: retrospectively, to locate where construction demand has concentrated over a defined period; prospectively, to indicate where future material sinks and transport destinations are likely to emerge before shipment-level data are available. This study contributes by:
- providing a transferable macro-to-project methodological framework for construction material-flow analysis relevant to cradle-to-site A4 transport impact assessment;
- identifying dominant construction-related material flows through road, rail and maritime freight data, CDW data and material-flow statistics;
- using building-permit patterns to identify past demand concentrations, future material sinks at specific geographic locations and potential transport-carbon hotspots;
- defining dynamic A4 priorities through transport volume, ton-kilometers, transport mode, cargo type, CDW flows, spatial demand and circular logistics paths;
- specifying how static cradle-to-site assumptions can be incrementally replaced by verified, event-based logistics records supported by ISO 14083 transport accounting, DPPs, GS1 identifiers, EPCIS logistics events, CDEs and telemetry.
This paper does not present a validated real-time A4 calculation system. Rather, it develops a macro-to-project methodological framework that uses logistics evidence to define data requirements and prepare future project-level dynamic cradle-to-site A4 assessment. Although demonstrated with Slovenian data for 2020–2024, the framework can be adapted to countries or regions with different logistics, material-flow and construction-demand characteristics, since all EU countries report comparable transport and construction statistics. The following section explains the research design, system boundary, data sources and workflow used to develop and apply this framework.
2. Research Methods
Figure 2 summarizes the macro-to-project methodological framework logic. The research methods are built around five assumptions for analyzing transport in dynamic A4 carbon assessment:
Figure 2.
Conceptual architecture linking EN 15804 product stages (A1–A3) and dynamic A4 transport, ISO 14083 activity-based logistics data and EU Digital Product Passport (DPP) data that could be used for digital twin with verifiable traceability of impacts.
- EN 15804 provides the lifecycle structure. A1–A3 represent manufacturer-declared cradle-to-gate impacts, while A4 represents transport from the supply source to the construction site. A4 is a logistics-dependent module, not a fixed product attribute.
- DPPs and logistics data are complementary. DPPs can provide product identity, material composition, EPD-related information and end-of-life data, but actual transport performance requires logistics data (e.g., routes, legs, shipment events, vehicle info).
- The digital layer enables traceability and updating. EN 15804 product data, ISO 14083 transport activity data, GS1 Digital Link identifiers, GS1 EPCIS logistics events, telemetry, CDEs and future digital-twin functionality are considered as the basis for data ingestion, harmonization, calculation, verification, visualization and updating.
- The 5R logic captures circular construction strategies. This study uses refuse, reduce, reuse, repurpose and recycle. This is more suitable for construction than the narrower 3R approach because transport consequences arise along project lifecycle.
- Construction supply chains have specific data constraints. They are project-based, fragmented and material-intensive, connecting quarries, manufacturers, logistics nodes, sites, demolition areas, recycling facilities and material banks. Because bulk flows can be blended, split, stored, or transformed, dynamic A4 requires mass- and volume-aware traceability, including batch ID, density and moisture data.
2.1. System Boundary and Module A4 Scope
This study retains system boundary on EN 15804 Module A4, transport to the site. A1–A3 product-stage impacts are treated as upstream product-information interfaces that may be linked to A4 through EPDs and DPPs. A5 construction-installation processes, including delivery and operation of on-site machinery, temporary works, packaging and installation-related waste, are outside the boundary of consideration. Similarly, end-of-life transport in C2 is also outside the boundary. However, the same event-based logistics logic may be extended to A2 raw-material transport, A5 machinery and site-logistics transport and C2 transport from demolition sites to reuse, recycling or disposal facilities.
2.2. Procedural and Mathematical Distinction Between Static and Dynamic A4 Assessment
All A4 calculations are related to the functional or declared unit of the assessed product, in accordance with EN 15804. In conventional static A4 assessment, transport emissions are usually calculated based on assumed transport distance, generic transport mode, standard vehicle type and default emission factors.
where is transported quantity (mass), and and are default distance and emission factor. This approach is suitable for EPD and early-stage assessments, but it does not capture actual logistics conditions, such as real supplier location, route deviations, partial loads, empty return trips, or multi-modal transport chains.
In contrast, the proposed dynamic A4 approach keeps the EN 15804 Module A4 boundary unchanged but replaces static assumptions with observed logistics-event data. Transport emissions are calculated incrementally for each shipment, transport leg, or logistics event. This allows the A4 value to be updated when verified information on material identity, transported mass, route, mode, vehicle type, energy pathway, load factor and empty running becomes available.
where AF is the leg-specific allocation factor reflecting load factor, empty running, backhaul, or shared-transport allocation. Note that in a dynamic system, A4 is not calculated only once. It can be updated whenever a verified logistics event is recorded. The cumulative A4 value at time t can be expressed as:
where is the before the event and is the contribution of the logistic event. This equation provides the operational logic for connecting EPCIS events, Digital Product Passports and transport carbon accounting. Each shipment, dispatch, receipt, transfer, or transformation event can update the cumulative A4 value. Table 1 summarizes the procedural differences between static and dynamic A4 assessment.
Table 1.
Procedural comparison between used static A4 and proposed dynamic A4 assessment.
The improvement from static to dynamic can be expressed as an uncertainty ratio:
where can be any parameter, e.g., distance, transported mass, vehicle type, load factor, empty running, transport mode, or other parameter affecting the assessment of A4. This formulation can be applied to evaluate the contribution of individual parameters. For example, if the assumed transport distance is 100 km but the verified transport distance is 140 km, the difference becomes visible and can be used to update future assumptions.
Macro-level freight statistics do not directly calculate project-specific A4 emissions. Instead, they identify where detailed project-level logistics data are most important. The priority of a material category in a region for dynamic A4 can be expressed as:
where denotes the priority of material m in region r, expressed as a function of transport volume, transport work, modal share, spatial demand and 5R goals.
2.3. Data Sources and Macro-Level Workflow
The empirical analysis uses five datasets for 2020–2024. Data from the Statistical Office of the Republic of Slovenia (SURS) [80] support road-flow analysis, maritime-flow analysis and building-permit demand mapping. SURS and Slovenian Railways data support rail-flow analysis, while SURS and the Slovenian Environment Agency (ARSO) [81] provide construction and demolition waste (CDW) data for the circularity context.
Construction-related freight was selected from four NST 2007 categories: mining and quarrying products, non-metallic mineral products, basic metals and fabricated metal products, and secondary raw materials and wastes [82]. These categories cover aggregates, sand, gravel, cement, concrete, glass, ceramics, metals and CDW. Since NST 2007 is not construction-exclusive, the results are construction-related freight flows rather than exact project quantities. Road freight was analyzed by domestic and international flows, tonn, ton-kilometers and cargo form. Rail analysis combined SURS statistics with Slovenian Railways operational data, which distinguish individual materials such as cement, concrete products, aggregates, sand, gravel and glass products. Maritime transport was analyzed through import, export, dry-bulk and container indicators. Building-permit floor area was mapped by municipality as a proxy for future construction material demand. Table 2 provides an overview of the datasets used, their processing and limitations.
Table 2.
Overview of datasets used for macro-level construction-material flow analysis.
The macro-level to project requirements workflow followed five steps presented in Figure 2:
- Step 1: Identification and classification of materials using NST 2007 categories.
- Step 2: Collection of road, rail and maritime data for the selected five-year period. Further details are provided in the Data Availability and Supplementary Materials.
- Step 3: Data preparation and processing by year, transport mode and materials.
- Step 4: Macro-level analysis. Modal charts, cargo-form comparisons, diagrams and municipal maps were used to show transport structure, material-flow patterns and demand. Building-permit floor area was visualized using relevant shapefiles.
- Step 5: Framework output. The macro-level findings were translated into dynamic A4 requirements.
2.4. Required Data, Digital Integration and Logistics Traceability
The macro-level workflow identifies relevant flows; digital integration defines how these flows become verifiable A4 evidence. The proposed workflow links product or batch identifiers with transport events from dispatch, transfer, terminal handling and delivery, enabling A4 calculation according to ISO 14083. After delivery, the accumulated A4 value represents the project-specific transport footprint.
GS1 Digital Link connects identifiers with product, EPD, material, regulatory and end-of-life information, while GS1 EPCIS records logistics events by defining what happened, when and where it happened, why it happened and which objects were involved. Together, they create an auditable link between product data and time-resolved logistics evidence. Because automated records do not guarantee correct results, the workflow requires validation rules, audit trails, access rights and responsibility for data provision. Operational tools such as CCC, transport management systems, telematics, GPS tracking, route optimization, delivery-slot management, digital weighbridges and automated gate records provide the practical layer for turning A4 from a static assumption into verified transport evidence.
3. Results of Macro-Level Supply Chain Analysis
The results translate the methodological framework into a systemic, macro-level reading of construction material flows. The aim is not to calculate project-specific A4 emissions but to identify where such calculations require better data. Dynamic A4 requires more than transport totals. It requires knowing which material categories move, in what quantities, by which modes and towards which spatial demand nodes or material sinks.
The analysis addresses this by combining freight statistics, material-flow data, CDW pathways and building-permit patterns. From a systemic point of view, building permits, and especially future digital permits, can act as early spatial signals of material demand. They indicate where new material sinks are likely to emerge and where transport pressure, logistics bottlenecks and potential A4 hotspots should be monitored.
Figure 3 provides the material-flow logic. Primary materials move from quarries, plants and manufacturers through road, rail, maritime and intermodal networks to construction sites. Secondary materials extend this logic by adding demolition sites, excavation flows, sorting facilities, material banks and recycling plants. These flows can reduce primary material demand, but they also create site-to-site, site-to-processing and processing-to-site transport. Their carbon effect depends on distance, mode, load efficiency and network organization.
Figure 3.
Macro-level construction material-flow paths linking primary materials, secondary materials, logistics networks, construction sites, building stock and end-of-life pathways. The figure shows how traditional supply chains and urban-mining flows create different transport legs relevant to dynamic A4 assessment.
The results are structured in three steps. Section 3.1 analyses road, rail and maritime transport by mass, transport work and cargo structure. Section 3.2 links material flows with geographical boundaries, CDW pathways and building-permit-based material sinks. Section 3.3 translates these findings into requirements for dynamic A4 scenarios, including logistics data, interoperability and digital traceability.
3.1. Macro-Level Analysis of Construction Material Flows by Transport Mode
This section examines how construction-related materials move through road, rail and maritime transport in Slovenia from 2020 to 2024. The aim is to identify the dominant transport modes, the difference between transported mass and transport work, and the logistics patterns most relevant for cradle-to-site EN 15804 Module A4 assessment.
3.1.1. Road Transport of Construction Materials
Figure 4 shows road transport of construction-related materials. Domestic road transport dominates the transported mass, accounting for approximately 93–95% of construction-material tonnage. International road transport represents only a small share of tons but generates nearly half of total ton-kilometers because of longer haul distances.
Figure 4.
Road transport of construction-related materials in Slovenia, 2020–2024. Domestic road transport accounts for approximately 93–95% of transported tonnage, while international road transport generates nearly half of total ton-kilometers because of longer distances. The figure shows why A4 assessment must distinguish transported mass from transport work and capture route distance, transport type and load utilization (Source: SURS; classification: NST 2007).
This confirms that A4 relevance cannot be assessed from material mass alone. Distance, transport type, route structure and load utilization must also be captured. Road transport is therefore the primary mode for identifying potential A4 hotspots, especially for domestic supply, short-haul movement and last-mile delivery.
Figure 5 disaggregates road freight by volume, transport work, cargo form and vehicle body type. The figure shows that high transported mass and high ton-kilometers do not necessarily occur in the same logistics segment. Domestic transport dominates volume, while long-distance international transport dominates transport work. A4 therefore depends not only on mass but also on distance, route structure, supply-chain geography and vehicle utilization.
Figure 5.
Road freight in Slovenia by volume, ton-kilometers, cargo form and body type, 2020–2024. Cargo-form and body-type totals differ from Figure 4 because they use separate SURS logistics-structure statistics, not construction-related NST 2007 material categories. The figure shows that dynamic A4 needs differentiated road-transport scenarios for bulk, palletized, bundled and body-type-specific logistics (Source: SURS).
The cargo-form and body-type data use separate SURS logistics-structure statistics and are therefore not directly comparable with the construction-related NST 2007 totals in Figure 4. They are used here as complementary evidence for defining road-transport scenarios.
The figure shows three different logistics profiles. Bulk cargo is typical for aggregates, sand, gravel, soil and other heavy mineral flows. It is volume-dominant and requires data on payload, density, moisture, sourcing distance, vehicle utilization and backhauling. Palletized cargo has a smaller volume share but dominates ton-kilometers, indicating longer and more fragmented chains through manufacturers, warehouses, logistics centers and construction sites. It requires data on consolidation, warehousing, partial loads and delivery frequency. Bundled cargo is relevant for timber, pipes, steel profiles, reinforcement and prefabricated elements, where dimensions, packaging, loading efficiency, sequencing and site access are decisive.
Vehicle body type further refines these scenarios. Tippers indicate bulk mineral flows, open bodies with tarpaulin indicating longer-distance general freight, and concrete mixers indicate time- and route-sensitive delivery. Road freight should therefore not be modeled as one generic truck scenario. Dynamic A4 should distinguish cargo form and vehicle body type because each implies different data requirements and different transport-carbon behavior.
3.1.2. Rail Transport of Construction Materials
Figure 6 shows that rail transport is relevant mainly for international, transit and corridor-based bulk flows. Annual construction-related rail volumes remained relatively stable, while transport work reached 2.3–2.7 billion ton-kilometers. Mining and quarrying products dominate rail freight, followed by metals, secondary raw materials and non-metallic minerals. For dynamic A4, rail should be represented as part of a multi-modal chain that includes first-mile transport, terminal handling, transhipment and last-mile delivery.
Figure 6.
Railway transport of construction-related materials in Slovenia, 2020–2024. Rail mainly supports international, transit and corridor-based bulk flows (Source: SURS).
Figure 7 shows detailed Slovenian Railways construction-related rail material flows that are concentrated in a small number of bulk material categories, mainly cement, cement-based products, stone aggregates and selected mineral products. This supports the interpretation of rail as a specialized corridor mode rather than a site-delivery mode. Although total rail movement declined, the material structure remained relatively stable.
Figure 7.
Railway flows of selected construction-related materials by traffic type, Slovenia, 2020–2024. Values are grouped by internal traffic, import and export. Source: Slovenian Railways.
3.1.3. Maritime Transport of Construction Materials
Figure 8 shows the gateway role of maritime transport in Slovenian construction-material supply chains. Imports of construction-related mineral products exceed exports, while the 2024 cargo structure is dominated by dry bulk commodities, including minerals, aggregates and cement. Containers form the second major cargo group. Although maritime transport represents only a selective part of national construction-material flows, it is important for long-distance and import-dependent supply chains.
Figure 8.
Maritime transport of construction-related materials in Slovenia, 2020–2024: import/export trends, cargo structure and container throughput. Maritime flows are relevant for A4 when imported materials pass through port handling, storage, inland distribution and final delivery to site (Source: SURS).
For dynamic A4 assessment, maritime transport should not be treated as a single port-to-site distance. It should be modeled as a gateway chain that includes vessel arrival, terminal handling, storage, customs or logistics processing, inland transport and final delivery to the construction site.
These indicators confirm that maritime transport has a selective but strategic role in dynamic A4 assessment. Its relevance is not defined by national tonnage alone but by its function as an entry point for imported bulk and containerized construction materials. From an A4 perspective, the critical issue is therefore the inland continuation of the maritime chain: terminal handling, temporary storage, customs or logistics processing, transfer to road or rail and final delivery to site. These steps can add transport work, waiting time and handling-related emissions that are not visible if maritime flows are reduced to a single import value.
The modal analysis of road, rail and maritime transport identifies how construction materials move through the Slovenian supply chain. However, modal data alone do not explain how these flows relate to circularity, accumulated building stock and future material sinks. The next section therefore links transport activity with material inflows, CDW generation, end-of-life pathways and building-permit-based spatial demand. This perspective supports the identification of regions where construction demand, waste generation, reuse potential and circular logistics opportunities are likely to overlap.
3.2. Macro-Level Analysis of Construction Material Flows Across Geographical Boundaries
Construction material supply chains extend across local, regional, national and international markets, resulting in significant differences in transport distances, logistics complexity and carbon intensity.
Figure 9 illustrates a systemic structure through a simplified Sankey diagram for Slovenia, showing the relationship between annual material inputs, the accumulated building stock, construction and demolition waste (CDW) generation and current end-of-life pathways. The figure highlights that the Slovenian construction sector remains dominated by large inflows of primary materials, especially aggregates, concrete and cement, while the outflow from demolition and renovation is still largely directed towards backfilling, downcycling and landfill, with only negligible reuse of components. This confirms that construction material flows should be analyzed not only as linear supply chains delivering products to sites but also as circular or potentially circular flows in which demolition outputs may become inputs for new projects.
Figure 9.
Simplified Sankey diagram of construction material flows in Slovenia, showing annual material inputs, building stock, CDW generation and end-of-life pathways (source: ARSO, SURS).
Construction materials cross multiple geographical boundaries before reaching the construction site and again at the end of their service life. Primary materials originate from quarries, forests, steelworks and manufacturing plants, while secondary materials emerge from demolition, renovation and excavation activities and are transported to recycling facilities, backfilling locations, landfills, or new projects. The spatial relationship between sources, processing facilities, logistics hubs and construction sites determines transport distance, vehicle utilization, modal choice and ultimately the cradle-to-site carbon footprint. This is especially relevant for bulk materials, which combine high mass with relatively low unit value, making transport a major component of both cost and environmental impact.
To complement the material-flow perspective shown in Figure 9, the analysis examines issued building permits by municipality and estimates corresponding floor areas for 2020–2024 illustrated in Figure 10. These data provide a proxy for future construction demand and help identify areas with expected material inflows, potential CDW generation and circular logistics opportunities. Combining material-flow data, waste pathways and permit-based construction activity enables a more spatially differentiated assessment of future transport demand and potential material hotspots. It also supports the identification of locations where local reuse, material banks, recycled aggregates or shorter transport loops could be most effective. Figure 10 presents the spatial distribution of issued building permits in Slovenia between 2020 and 2024 for all, residential and non-residential buildings at municipal level. Expressed as gross floor area, the maps provide a proxy for the future spatial distribution of construction material demand.
Figure 10.
Spatial distribution of issued building permits by municipality in Slovenia, 2020–2024, expressed as gross floor area. The maps provide a proxy for future construction-material demand and potential A4 transport-demand hotspots (Source: SURS).
Since material consumption is generally proportional to floor area, particularly at aggregated regional scales, permit data can be used to estimate the location and magnitude of future construction material flows before projects enter the procurement phase. Separating residential and non-residential buildings further improves the analysis, as these building types exhibit substantially different material intensities, structural systems and logistics characteristics. Residential construction is typically dominated by concrete, masonry and finishing materials, whereas non-residential buildings generally require higher proportions of structural steel, prefabricated concrete, façade systems and technical equipment, resulting in different transport demands and supply chain configurations.
Figure 10 shows the spatial distribution of future construction demand. Municipalities with higher permitted floor area represent stronger material-demand nodes, while residential and non-residential permits indicate different material intensities, structural systems and logistics profiles. For A4, this means that transport impacts depend on project location, sourcing distance, logistics infrastructure, material type and access to reuse or recycling facilities. Permit-based spatial analysis therefore provides an early screening layer for identifying regional transport demand, future material sinks, logistics bottlenecks and locations where dynamic A4 monitoring is most useful.
Figure 11 translates this spatial demand logic into a macro-to-project traceability structure. It connects seven location levels: national material flows, regional corridors, logistics hubs, distribution centers, suppliers, transport legs and the exact project site. When permit locations are combined with DPP-based product information, material quantities and logistics events, macro-level material-flow data can be linked to project-specific transport chains. This enables A4 assessment before procurement is fixed and supports comparison of sourcing strategies, consolidation options, material banks, reuse centers and recycling facilities. From an urban-metabolism perspective, high-construction municipalities act as future material sinks, while aging building stocks represent future secondary material sources. These two layers should be analyzed together because circular flows do not automatically reduce transport impacts. Reuse, recycling, backfilling and landfill each create different site-to-site, site-to-processing, or processing-to-site chains. Dynamic A4 therefore requires spatial traceability of both incoming materials and outgoing secondary flows.
Figure 11.
Macro-to-project traceability hierarchy for cradle-to-site logistics emissions. The figure links national material flows, regional corridors, logistics hubs, suppliers, transport legs and project-site locations for future dynamic A4 assessment.
The proposed hierarchy follows materials from national flows through regional corridors, logistics hubs, distribution centers, manufacturing plants and transport legs to the exact construction site. This creates the spatial structure required for dynamic A4 assessment, where transport activities can be linked to specific products, projects and delivery events. Combined with DPP-based product information and logistics records, the framework enables tracking of material origin, routes, vehicle utilization and delivery verification. The same hierarchy can also support future urban mining, material banks and circular supply chains by connecting secondary material sources with new construction demand. In this way, spatial traceability becomes a foundation for dynamic A4 and 5R.
3.3. Macro-Level Analysis of Requirements for Future Dynamic Logistics Configuration Scenarios
Dynamic transport carbon assessment requires linking construction products with verified transport activities through interoperable digital data, including product identity, material quantities, transport routes, vehicle and energy characteristics, logistics events and ISO 14083 emission factors. Integration through DPPs, GS1 Digital Link, EPCIS and telemetry can provide the digital backbone for future automated A4 calculations.
Scenario modeling (Figure 12) evaluates how alternative logistics configurations influence A4, enabling systematic sensitivity analysis and quantification of transport optimization strategies. The following simplified case illustrates how the scenario logic can be translated into an event-based calculation. A typical circular construction logistics case occurs when one project removes excavated soil and another nearby project needs soil for landscaping, backfilling, or terrain modeling. For the first project, the removal of soil is not Module A4; it is a site-logistics or waste-related movement that may be treated under A5 or, in end-of-life cases, C2. For the receiving project, however, the same material becomes an incoming construction material. Its transport to the receiving site can therefore be assessed as A4. The example shows that the same event-based logistics logic can support A4 and can later be extended to A5 or C2, while the present study keeps its calculation boundary focused on A4. Appendix B provides a simplified EPCIS 2.0 event structure for such a case. It records an excavated-soil material lot, a wet net mass of 20.0 tons, a non-hazardous soil classification, a certified weighbridge measurement method and a road transport operation by tipper truck. These fields are sufficient to demonstrate how a material-flow event can be connected to a transport-carbon calculation shown in Table 3.
Figure 12.
Scenarios for dynamic transport carbon assessment.
Table 3.
Illustrative static and dynamic calculation for EPCIS-linked soil transport. Material identity, mass, mode and vehicle type are based on the Appendix B extract; distance, empty-return allocation and emission factor are illustrative assumptions.
The example is illustrative, not a validated project result. It compares a static A4 assumption with a dynamic event-based calculation. The static case assumes a default 10 km road distance. The dynamic case uses a verified 14.8 km loaded route and allocates 50% of the empty return to the material flow. The same emission factor is used in both cases to isolate the effect of verified logistics data.
The example demonstrates the macro-to-project logic. Macro-level data identify excavated soil, aggregates and other bulk materials as priority flows because they are heavy, local, route-sensitive and strongly affected by load factor and empty running. Project-level EPCIS/DPP records then provide the event data needed to calculate the actual transport consequence. The calculation does not change the EN 15804 A4 boundary. It changes the quality of the input data. The same logic can support other transport-related modules. If the focus is the project that removes the soil, the movement may be treated as A5 site logistics or waste-related transport. If the focus is a demolition project, it may support C2 transport to reuse, recycling, or disposal. If the focus is the receiving project, the same movement becomes incoming material transport and can be assessed under A4. This confirms that event-based logistics records are reusable across lifecycle modules, while module allocation depends on the accounting perspective.
Figure 12 translates the macro-level findings into scenario logic. The scenarios show that A4 should be treated as a variable outcome rather than a fixed input. Static A4 assumptions can be compared with future activity-based assessments, while intervention scenarios can test reduced empty running, higher load factors, consolidation, modal shift and regional sourcing. The figure separates dynamic A4 into three practical uses: checking static assumptions, testing operational improvements and comparing sourcing geographies. It therefore frames A4 as a decision-support process rather than only a reporting output. This confirms the need for dynamic assessment systems that can update A4 values when logistics decisions change. Three main scenarios considered are:
- Scenario 1 compares a conventional EPD-based A4, derived from representative assumptions, with a dynamic A4 calculated from observed shipment events and ISO 14083 activity data, including transport distance, mode, energy pathway, load factor, empty running and terminal operations. In future implementation, the dynamic approach would provide project-specific, leg-by-leg cradle-to-site carbon calculations.
- Scenario 2 evaluates logistics interventions, including reduced empty running, improved load factors and modal shift. Alternative backhauling strategies, consolidation, delivery scheduling and multi-modal transport options are analyzed to quantify their influence on transport emissions while accounting for first/last-mile transport and terminal handling.
- Scenario 3 examines the influence of supply chain geography. Long-distance supply chains are assessed for sensitivity to transport mode, fuel pathway and routing variability, whereas regional sourcing scenarios evaluate the benefits of shorter transport distances, consolidation centers and urban logistics optimization.
Table 4 defines the data requirements for dynamic A4 assessment. It shows how verified logistics evidence can replace static assumptions through product identity, material quantity, origin, destination, transport legs, vehicle data, energy data, logistics events, traceability and data governance.
Table 4.
Information requirements for the dynamic transport carbon assessment.
4. Discussion
The preceding macro-level analyses of road, rail and maritime transport demonstrate that construction material logistics exhibit considerable spatial and temporal variability that cannot be adequately represented using conventional static A4 assumptions. The analysis revealed substantial differences in transported material volumes, transport modes, regional distribution patterns, import dependencies and logistics structures, highlighting the importance of considering the complete transport system rather than isolated shipments. The Slovenian case is relevant beyond the national context. It reflects the logistics structure of many small and open European economies, where construction materials combine local sourcing, cross-border flows, port-based imports and transit corridors. Road dominates transported tons because it is flexible and essential for last-mile delivery. International flows generate a disproportionately high share of ton-kilometers, showing that distance and supply chain geography are critical for A4. Rail and maritime transport have a different role: they are less important for site delivery but strategic for long-distance bulk flows. This confirms that dynamic A4 assessment must combine project-level logistics data with macro-level material-flow analysis.
Recent cradle-to-site A1–A4 frameworks improve project-level transparency through material quantification, carbon-factor selection and representativeness checks [76]. This study adds the missing macro-to-project logistics layer. It uses national freight flows, transport work, cargo structure, CDW pathways and building-permit-based material sinks to identify where future dynamic A4 monitoring is most needed.
4.1. Macro-Level Transport Carbon Framework
Based on these observations, a conceptual macro-level transport carbon model is proposed to bridge national freight statistics, DPPs, ISO 14083 transport data, telemetry and scenario modeling into a unified analytical environment. The framework extends traditional A4 calculations by incorporating multi-level material flow analysis, circular economy principles, advanced analytics and impact traceability, thereby enabling both operational optimization and strategic planning for transport decarbonization.
Figure 13 synthesizes the analytical layers into a macro transport carbon framework. It connects material-flow data, transport activity data, carbon modeling, scenario analysis and decision support within one architecture. The framework combines macro-level statistics with project-level logistics data, supporting both strategic decisions, such as modal-shift policy, and operational decisions, such as supplier, route, vehicle and consolidation choices. At the center is the Macro Transport Carbon Model. It integrates four components: material-flow modeling, transport activity modeling, carbon-emission modeling and scenario and sensitivity analysis. These components operate within a continuous PDCA cycle, allowing transport strategies and emission estimates to be updated and refined over time.
Figure 13.
Conceptual macro-level transport carbon framework integrating construction material flow analysis, telemetry, Digital Product Passports, scenario modeling, circular economy principles and decision support for transport carbon assessment.
On the left, the framework captures construction material flows at state, regional and city/project levels, recognizing that transport decisions and potential emission hotspots emerge at different spatial scales. The model integrates heterogeneous macro-level data sources, including trade and customs statistics, maritime and port statistics, road and railway freight data, infrastructure information, construction activity indicators, emission factors and real-time telemetry obtained from IoT devices, GPS tracking, fuel consumption records, load sensors and Common Data Environments (CDEs). This combination can support historical analysis and, where telemetry and project-level data are available, future near-real-time monitoring of transport activities. The upper-right section summarizes the principal outputs of the framework, including transport carbon indicators, hotspot identification, comparative regional benchmarking, scenario evaluation, policy support and ESG-compliant reporting. Alternative transport strategies can be evaluated through dedicated scenario modeling, including business-as-usual, modal shift, logistics optimization, circular economy interventions and policy or technology scenarios.
A distinctive feature of the framework is the integration of the 5R circular economy strategy—Refuse, Reduce, Reuse, Repurpose and Recycle—which influences transport demand by reducing material consumption, extending product life, promoting local reuse and repurposing and increasing material recovery at end-of-life. Rather than treating circularity as a separate lifecycle stage, the framework embeds these strategies directly within transport planning and scenario analysis. The lower part of the framework extends the operational model towards strategic decision support. Macro-level aggregation of construction material flows enables benchmarking across administrative levels, identification of regional dependencies and transport bottlenecks and evaluation of infrastructure performance.
Advanced analytics further support predictive modeling, optimization, resilience assessment and alignment with the Sustainable Development Goals (SDGs) in construction [83]. Finally, a complete impact traceability chain links primary transport data with harmonization, lifecycle impact calculations, verification procedures and Digital Product Passports, ensuring transparent, auditable and interoperable reporting.
The framework generates a comprehensive set of Key Performance Indicators (KPIs), including total transport emissions, emission intensity (kg CO2e/t·km), vehicle load factor, empty running ratio, modal share, low-carbon transport share, regional hotspot intensity, scenario emission reduction potential and circularity rate. Collectively, these indicators provide a quantitative basis for evaluating logistics performance, supporting evidence-based policymaking and accelerating the decarbonization of construction supply chains at national, regional and local scales.
4.2. Implications for Standards, Policy and Practice
The framework shows that A4 should become a digitally connected part of carbon assessment, not a static reporting assumption. EN 15804 provides the lifecycle structure, ISO 14083 provides transport-emission accounting and DPPs, GS1 Digital Link, GS1 EPCIS, telemetry and CDEs provide the digital basis for linking product information with logistics evidence. This integration can shift sustainability reporting from document-based towards traceable, updateable and auditable cradle-to-site carbon records.
Table 5 clarifies the role of each standard or digital system in the proposed dynamic A4 framework. It distinguishes between the reporting structure, transport-emission calculation logic, product or material identification, event traceability, project information management and operational transport data. The table also shows that no single system is sufficient on its own; dynamic A4 requires coordinated use of LCA standards, transport accounting, digital identifiers, logistics-event records, project platforms and telemetry.
Table 5.
Roles and compatibility issues of standards and digital systems for dynamic A4 assessment.
For practice, this turns A4 into logistics decision support. Manufacturers can attach verified transport evidence to product declarations; contractors can compare sourcing options, consolidate deliveries and reduce empty running; logistics providers can optimize routes, backhauls and modal choices; and software developers can connect DPP, BIM, CDE, telemetry and transport-management systems. The same logic is central for 5R circular construction, where reuse, repurposing and recycling create site-to-site, site-to-processing and processing-to-site flows that require CCC, material hubs, common data spaces and secure data-sharing mechanisms supported by the EU Data Act [84].
The forthcoming EU Circular Economy Act [85] can support the secure data sharing, digital traceability and secondary-material markets needed for Scope 3 reporting, ESG compliance and low-carbon circular supply chains. The Circular Economy Act is particularly relevant because it aims to strengthen the Single Market for secondary raw materials and increase the supply of high-quality recycled materials. In construction, this directly supports intensified use of secondary construction materials, stronger markets for CDW-derived resources and digitalization of circular material flows.
The framework is not presented as a universal real-time calculation platform but as a regional implementation logic that links macro freight data with project-level A4 data requirements and supports informed policy development.
National implementation could start with default A4 scenarios for dominant materials, followed by pilot projects using verified shipment-level data and finally integration with DPP-compatible material passports and public procurement requirements. These implications can be translated into a staged implementation pathway. Table 6 summarizes possible short-, medium- and long-term actions for Slovenia, linking statistical harmonization, project-level data collection, DPP/EPCIS pilots and transport-carbon KPIs with the actors responsible for implementation.
Table 6.
Example of suggested regional policies for Slovenia.
4.3. Limitations of This Study
This study is limited by its macro-level scope. SURS, NST 2007 and Slovenian Railways data are suitable for identifying construction-related freight patterns, modal shares, transport work and material-flow structures, but they do not represent project-specific quantities, procurement routes or verified shipment records. The results should therefore be interpreted as a basis for methodological development and hotspot identification, not as direct project-level A4 values.
The proposed framework is conceptual and has not yet been validated through real-time implementation on construction projects. Its practical performance will depend on the availability, quality and interoperability of DPP, EPD, logistics, telemetry, BIM, CDE and transport-management data. Current digital ecosystems remain unevenly developed, and access to operational logistics data, especially vehicle utilization, empty running, shipment-level allocation and terminal operations, is still limited. Commercial confidentiality also restricts the use of detailed project and company data.
The analysis relies on aggregated statistics and representative logistics configurations. It cannot fully capture construction sequencing, site access constraints, contractual arrangements, temporary storage, delivery windows, local routing, congestion, vehicle availability, or supplier-specific practices. This study also focuses on cradle-to-site assessment and does not quantify downstream lifecycle stages or operational 5R benefits in real projects.
Bulk construction materials remain a specific challenge. Aggregates, sand, excavated soil and cementitious materials are often blended, split, stored and transformed, making persistent identification, batch tracking, mass-based allocation and GS1 event traceability difficult. Future research should validate the framework through industrial case studies, develop digital identification methods for bulk flows, test ISO 14083-compliant data exchange and examine interoperability with European data spaces, the EU Data Act and emerging circular-economy legislation for secure access to operational logistics data.
The proposed framework is intentionally focused on EN 15804 Module A4, defined as transport to the building site. This focus is justified because the empirical analysis directly addresses construction-material freight flows, transport modes, logistics distances and spatial demand patterns relevant to A4. The framework does not recalculate A1–A3 product-stage impacts, nor does it include A5 construction-installation processes or C2 end-of-life transport within the calculation boundary. However, the same event-based logistics logic could support future extensions to other transport-related modules. In A2, it could describe raw-material transport to manufacturing facilities. In A5, it could capture transport of construction machinery, temporary works, packaging and installation-related waste. In C2, it could support transport from demolition sites to reuse, recycling, or disposal facilities. These extensions require additional datasets and are therefore treated as future research rather than part of the present assessment.
The Slovenian case is not statistically representative of all European construction logistics systems. The transferability of the framework lies in the methodological sequence, not in the specific modal shares or freight values.
4.4. Implications for Controlled Transport Impact Using the 5R Approach
At project level, transport impacts can be managed through six linked stages: planning, sourcing and supply planning, transport execution, on-site management, impact control and improvement and reporting and learning. Early decisions define carbon targets, suppliers, material alternatives, routes, transport modes, consolidation options and delivery plans. During execution, actual logistics performance should be monitored through vehicle utilization, empty running, delivery frequency, route length, waiting time, unloading conditions and site-access constraints.
These operational parameters are rarely visible in conventional LCA but can directly affect A4 emissions. They should therefore be included in project logistics plans and linked to measurable transport KPIs. Planned and actual performance should be compared during project delivery rather than only after completion. Deviations in load factor, empty running, modal share, delivery frequency, or route length can trigger corrective actions such as schedule changes, supplier changes, consolidation, backhauling, or modal shift.
The 5R strategies have different transport consequences. Refuse and reduce can eliminate unnecessary material movements or lower transported mass and delivery frequency. Reuse and repurpose may avoid transport of virgin materials but can create additional site-to-site or processing-related movements. Recycling introduces site-to-processing and processing-to-site transport legs and should therefore be evaluated against the transport avoided by replacing primary materials. The effect of each 5R strategy should be assessed as a net A4 outcome rather than assumed to reduce emissions automatically.
Dynamic A4 can support this control process by linking DPPs, CDEs, telemetry and logistics-event data with transport KPIs. This enables continuous comparison of planned and actual performance and supports evidence-based improvement at both project and policy levels.
4.5. Future Outlook
Module A4 should no longer be treated as a fixed value based on representative distance, generic vehicle type and average load factor. It should become a dynamic calculation that reflects how materials actually move. DPPs, ISO 14083-compliant logistics data, BIM, GIS, CDEs, IoT telemetry and digital twins provide the technical basis for this shift. Together, they can connect product information with transport events, vehicle utilization, routing, energy pathways and delivery status throughout the project lifecycle.
A key research direction is the development of macro-level construction material-flow platforms. These platforms should integrate national statistics, customs data, port activity, road and railway freight, construction activity, building permits and CDW flows [83]. Their role would be to monitor how materials move across national, regional, urban and project scales. This would support the identification of potential transport carbon hotspots, regional dependencies, logistics bottlenecks and opportunities for modal shift, consolidation and local sourcing. AI can further improve this system. Machine learning can forecast material demand, optimize routes, improve vehicle utilization, reduce empty running and recommend modal shifts when project conditions change. Coupled with digital twins, these tools would allow continuous comparison of alternative transport scenarios. Carbon reduction would become proactive rather than retrospective.
Future frameworks should also integrate urban metabolism. Construction materials should be understood as stocks and flows within cities and regions. New construction, renovation, demolition, material banks, reuse markets and recycling facilities should be linked into one logistics system. In this context, the 5R principles—Refuse, Reduce, Reuse, Repurpose and Recycle—should become measurable transport strategies. They should quantify not only avoided primary material production but also the transport needed for site-to-site, site-to-processing and processing-to-site flows.
Policy will increasingly require verified transport carbon disclosure within DPPs and lifecycle assessments. Harmonized KPIs, interoperable standards and trusted data governance can replace generic A4 assumptions with project-specific evidence and support resilient, circular construction supply chains.
5. Conclusions
This study developed a macro-to-project methodological framework for dynamic cradle-to-site EN 15804 Module A4 assessment.
The analysis confirms that road transport dominates construction-related material flows in Slovenia. Domestic road transport accounted for approximately 93–95% of transported construction-material tonnage between 2020 and 2024. However, the much smaller international road-freight share generated nearly half of the total ton-kilometers, showing that transport distance and supply-chain geography are as important as transported mass for A4 assessment.
Rail transport played a smaller but strategically important role in long-distance and corridor-based bulk flows. Construction-related rail transport generated approximately 2.3–2.7 billion ton-kilometers annually, while mining and quarrying products formed the dominant material category. These findings confirm that rail-based A4 assessment must include first-mile transport, terminal handling, transhipment and last-mile delivery.
Maritime transport was mainly associated with imported mineral and bulk materials. In 2024, dry bulk commodities represented approximately 56% of total cargo handled at the Port of Koper, while containers accounted for about 25%. Although maritime transport represented a selective share of national construction-material flows, it was important for long-distance and import-dependent supply chains.
The results also show that transported mass alone is an insufficient indicator of A4 relevance. The difference between the very high domestic share of tonnage and the disproportionately high international share of ton-kilometers demonstrates the need to distinguish tons from transport work and to record actual distance, mode, vehicle utilization and empty running.
The material-flow analysis also shows that construction logistics are becoming more spatially complex. Primary material inflows remain dominant, while CDW is still mainly directed towards backfilling, downcycling and landfill. Building-permit data show that future construction demand is unevenly distributed across municipalities. A4 assessment must therefore consider mass, distance, mode, cargo form, vehicle utilization, empty running, logistics nodes, future demand and circular material pathways.
This paper defines the requirements for future dynamic A4 assessment. These include product identification, transported mass, transport-chain decomposition, actual distance, mode, vehicle and energy data, load factor, empty running, terminal operations, logistics events, traceability and data governance. The proposed framework connects these requirements with DPPs, ISO 14083, EN 15804, GS1 Digital Link, GS1 EPCIS, CDEs, telemetry and digital-twin concepts.
The principal contribution is therefore not a completed real-time calculation platform but a macro-to-project methodological framework that connects regional logistics evidence with the requirements for future project-specific dynamic A4 assessment.
Author Contributions
Conceptualization, T.C.; methodology, T.C. and I.J.; formal analysis, I.J.; investigation, T.C. and I.J.; resources, T.C. and I.J.; data curation, I.J.; visualization, T.C.; validation, T.C. and I.J.; writing—original draft, T.C.; writing—review and editing, T.C. and I.J.; project administration, I.J. All authors have read and agreed to the published version of the manuscript.
Funding
This research received no external funding.
Institutional Review Board Statement
Not applicable.
Informed Consent Statement
Not applicable.
Data Availability Statement
The data presented in this study are openly available in [SURS] [https://www.stat.si/StatWeb/en/Field/Index/6] (accessed on 7 July 2026).
Acknowledgments
The authors gratefully acknowledge the Statistical Office of the Republic of Slovenia for access to official transport, construction and material-flow statistics and Slovenian Railways for providing operational data on construction-material transport.
Conflicts of Interest
The authors declare no conflicts of interest.
Abbreviations
The following abbreviations are used in this manuscript:
| 3R | Reduce, Reuse and Recycle. |
| 5R | Refuse, Reduce, Reuse, Repurpose and Recycle. |
| A1 | Raw material supply. |
| A2 | Transport to manufacturer. |
| A3 | Manufacturing. |
| A4 | Transport to the building site. |
| A5 | Construction-installation process. |
| AAS | Asset Administration Shell. |
| AI | Artificial Intelligence. |
| API | Application Programming Interface. |
| ARSO | Slovenian Environment Agency (Agencija Republike Slovenije za okolje). |
| B2B | Business-to-Business. |
| BIM | Building Information Modeling. |
| C2 | Transport to waste processing. |
| CAN | Controller Area Network. |
| CCC | Construction Consolidation Center. |
| CDE | Common Data Environment. |
| CDW | Construction and Demolition Waste. |
| CO2e | Carbon dioxide equivalent. |
| CPR | Construction Products Regulation. |
| CSRD | Corporate Sustainability Reporting Directive. |
| DID | Decentralized Identifier. |
| DIN | German Institute for Standardization (Deutsches Institut für Normung). |
| DLT | Distributed Ledger Technology. |
| DMP | Digital Material Passport. |
| DPP | Digital Product Passport. |
| ECBT | Edge-Cloud-Blockchain-Terminal. |
| EPD | Environmental Product Declaration. |
| EPCIS | Electronic Product Code Information Services. |
| ERP | Enterprise Resource Planning. |
| ESG | Environmental, Social and Governance. |
| ESPR | Ecodesign for Sustainable Products Regulation. |
| EU | European Union. |
| GHG | Greenhouse Gas. |
| GIS | Geographic Information System. |
| GLEC | Global Logistics Emissions Council. |
| GPS | Global Positioning System. |
| GS1 | Global Standards One. |
| GTIN | Global Trade Item Number. |
| HCT | High-Capacity Transport. |
| HVO | Hydrotreated Vegetable Oil. |
| IDS | Information Delivery Specification. |
| IFC | Industry Foundation Classes. |
| ILCD | International Reference Life Cycle Data System. |
| IoT | Internet of Things. |
| ISO | International Organization for Standardization. |
| KPI | Key Performance Indicator. |
| LCA | Life Cycle Assessment. |
| LCI | Life Cycle Inventory. |
| LNG | Liquefied Natural Gas. |
| LTL | Less-than-Truckload. |
| ML | Machine Learning. |
| NST 2007 | Standard Goods Classification for Transport Statistics. |
| PDCA | Plan–Do–Check–Act. |
| PM | Particulate Matter. |
| RFID | Radio-Frequency Identification. |
| SDG | Sustainable Development Goal. |
| SME | Small and Medium-Sized Enterprise. |
| SURS | Statistical Office of the Republic of Slovenia (Statistični urad Republike Slovenije). |
| TEU | Twenty-foot Equivalent Unit. |
| TMS | Transport Management System. |
| URI | Uniform Resource Identifier. |
Appendix A
Table A1 presents an integrated taxonomy that contrasts technical implementation mechanisms, ranging from supply-chain digital twins and IoT telematics to machine-interpretable EPD schemas, against the operational impacts and practical bottlenecks obstructing their deployment.
To provide a structured evaluation of how dynamic, verifiable logistics data can replace generic assumptions in EN 15804 Module A4 environmental calculations, solutions and barriers are organized into four distinct technical categories that cover real-time data collection and vehicle tracking, digital identity and supply chain traceability, standard data formats and interoperability and decentralized data sharing and governance.
Table A1.
Comparative analysis of DPP/LCA technical solutions and implementation barriers for EN 15804 Module A4.
Appendix B
Appendix B provides a shortened EPCIS 2.0 JSON extract to support the worked example in Section 3.3. The extract is not intended to represent a complete or validated EPCIS document. It includes only the main elements needed to illustrate the macro-to-project logic: material lot identification, quantity, measurement basis, material type, origin, logistics event, transport mode and vehicle type. The extract is intentionally truncated after the main shipping event fields to avoid presenting a full implementation schema.
{
  "@context": [
    "https://ref.gs1.org/standards/epcis/epcis-context.jsonld",
    {
      "ex": "https://example.org/construction-a4/"
    }
  ],
  "type": "EPCISDocument",
  "schemaVersion": "2.0",
  "creationDate": "2026-07-07T12:00:00+02:00",
  "epcisBody": {
    "eventList": [
      {
        "type": "ObjectEvent",
        "eventID": "https://example.org/construction-a4/event/soil-commissioning-20250505",
        "eventTime": "2025-05-05T06:45:00+02:00",
        "eventTimeZoneOffset": "+02:00",
        "quantityList": [
          {
            "epcClass":
"https://id.gs1.org/01/03812345000013/10/SOIL-LOT-2026-07-22-A",
            "quantity": 20.0,
            "uom": "TNE"
          }
        ],
        "action": "ADD",
        "bizStep": "commissioning",
        "disposition": "active",
        "readPoint": {
          "id": "urn:epc:id:sgln:3831234.00001.1"
        },
        "bizLocation": {
          "id": "urn:epc:id:sgln:3831234.00001.0"
        },
        "ilmd": {
          "ex:materialType": "excavated_soil",
          "ex:originProject": "construction_site_A",
          "ex:intendedUse": "reuse_at_nearby_receiving_project",
          "ex:soilClass": "non_hazardous_excavated_soil",
          "ex:initialWetMassTonnes": 20.0,
          "ex:dryMatterContentPercent": 82.0,
          "ex:measurementMethod": "certified_weighbridge",
          "ex:massBasis": "wet_net_mass"
        }
      },
      {
        "type": "AggregationEvent",
        "eventID": "https://example.org/construction-a4/event/loading-outbound-20250505",
        "eventTime": "2025-05-05T07:00:00+02:00",
        "eventTimeZoneOffset": "+02:00",
        "parentID": "https://id.gs1.org/00/038123450000000129",
        "childQuantityList": [
          {
            "epcClass":
"https://id.gs1.org/01/03812345000013/10/SOIL-LOT-2026-07-22-A",
            "quantity": 20.0,
            "uom": "TNE"
          }
        ],
        "action": "ADD",
        "bizStep": "loading",
        "readPoint": {
          "id": "urn:epc:id:sgln:3831234.00001.2"
        },
        "bizLocation": {
          "id": "urn:epc:id:sgln:3831234.00001.0"
        },
        "ex:journeyStage": "outbound_to_temporary_storage",
        "ex:transportMode": "road",
        "ex:vehicleType": "tipper_truck"
      },
      {
        "type": "ObjectEvent",
        "eventID": "https://example.org/construction-a4/event/shipping-to-temporary-site-20250505",
        "eventTime": "2025-05-05T07:15:00+02:00",
        "eventTimeZoneOffset": "+02:00",
        "epcList": [
          "https://id.gs1.org/00/038123450000000129"
        ],
        "quantityList": [
          {
            "epcClass":
"https://id.gs1.org/01/03812345000013/10/SOIL-LOT-2026-07-22-A",
            "quantity": 20.0,
            "uom": "TNE"
          }
        ],
        "action": "OBSERVE",
        "bizStep": "shipping",
        "disposition": "in_transit",
        "readPoint": {
          "id": "urn:epc:id:sgln:3831234.00001.3"
        },
        "bizLocation": {
          "id": "urn:epc:id:sgln:3831234.00001.0"
        },
References
- European Commission. A European Green Deal. Available online: https://ec.europa.eu/info/strategy/priorities-2019-2024/european-green-deal_en (accessed on 1 July 2026).
- European Parliament; Council of the European Union. Regulation (EU) 2024/1781 of the European Parliament and of the Council of 13 June 2024 Establishing a Framework for the Setting of Ecodesign Requirements for Sustainable Products, Amending Directive (EU) 2020/1828 and Regulation (EU) 2023/1542 and Repealing Directive 2009/125/EC. Off. J. Eur. Union 2024, OJ L, 2024/1781. [Google Scholar]
- Gieß, A.; Möller, F. Exploring the Value Ecosystem of Digital Product Passports. J. Ind. Ecol. 2025, 29, 561–573. [Google Scholar] [CrossRef] [Scilit]
- Durão, V.; Silvestre, J.D.; Mateus, R.; De Brito, J. Assessment and Communication of the Environmental Performance of Construction Products in Europe: Comparison between PEF and EN 15804 Compliant EPD Schemes. Resour. Conserv. Recycl. 2020, 156, 104703. [Google Scholar] [CrossRef] [Scilit]
- Acampora, A.; Cova, M.; Capolini, F. Over Twenty Years of Environmental Product Declarations (EPDs): From Communication Tools to Sustainability Decision-Support Systems. Int. J. Life Cycle Assess. 2026, 31, 17. [Google Scholar] [CrossRef] [Scilit]
- EN 15804:2012+A2:2019; SIST—Sustainability of Construction Works—Environmental Product Declarations—Core Rules for the Product Category of Construction Products. Slovenski Inštitut za Standardizacijo (SIST): Ljubljana, Slovenia, 2019.
- Greer, F.; Horvath, A. Exploring the Significance of Transportation Emissions in Upfront Embodied Carbon in Buildings. Build. Environ. 2025, 269, 112457. [Google Scholar] [CrossRef] [Scilit]
- Kanafani, K.; Magnes, J.; Lindhard, S.; Balouktsi, M. Carbon Emissions during the Building Construction Phase: A Comprehensive Case Study of Construction Sites in Denmark. Sustainability 2023, 15, 992. [Google Scholar] [CrossRef] [Scilit]
- Paratscha, R.; Thannen, M.; Smutny, R.; Lampalzer, T.; Strauss, A.; Rauch, H. Screening LCA of Torrent Control Structures in Austria. Int. J. Life Cycle Assess. 2019, 24, 129–141. [Google Scholar] [CrossRef] [Scilit]
- Toller, S.; Larsson, M. Life cycle assessment and benchmarking of end of life treatments of flexible pavements in California. In Pavement Life Cycle Assessment; Taylor & Francis Group: London, UK, 2017. [Google Scholar] [CrossRef] [Scilit]
- Göswein, V.; Gonçalves, A.; Silvestre, J.; Freire, F.; Habert, G.; Kurda, R. Transportation Matters—Does It? GIS-Based Comparative Environmental Assessment of Concrete Mixes with Cement, Fly Ash, Natural and Recycled Aggregates. Resour. Conserv. Recycl. 2018, 137, 1–10. [Google Scholar] [CrossRef] [Scilit]
- Gerald, L.; Carlos, B.-V.; Marta, G.-G.; Jan, P.; Nika, T. A Decision-Support Tool for Analysing Transport Impacts in Building Life Cycle Assessment. IOP Conf. Ser. Earth Environ. Sci. 2025, 1546, 012067. [Google Scholar] [CrossRef] [Scilit]
- Hemmati, M.; Messadi, T.; Gu, H. Life Cycle Assessment of Cross-Laminated Timber Transportation from Three Origin Points. Sustainability 2021, 14, 336. [Google Scholar] [CrossRef] [Scilit]
- Kleizienė, R.; Vaitkus, A. Life Cycle Evaluation of Material Transportation Impacts in Asphalt Mixture Production. Int. Conf. Environ. Eng. 2026, 13, 1–7. [Google Scholar] [CrossRef] [Scilit]
- Lee, D.; Lee, S. Digital Twin for Supply Chain Coordination in Modular Construction. Appl. Sci. 2021, 11, 5909. [Google Scholar] [CrossRef] [Scilit]
- Xiang, Y.; Ma, K.; Mahamadu, A.; Florez-Perez, L.; Zhu, K.; Wu, Y. Embodied Carbon Determination in the Transportation Stage of Prefabricated Constructions: A Micro-Level Model Using the Bin-Packing Algorithm and Modal Analysis Model. Energy Build. 2022, 279, 112640. [Google Scholar] [CrossRef] [Scilit]
- Guerlain, C.; Renault, S.; Ferrero, F. Understanding Construction Logistics in Urban Areas and Lowering Its Environmental Impact: A Focus on Construction Consolidation Centres. Sustainability 2019, 11, 6118. [Google Scholar] [CrossRef] [Scilit]
- Fufa, S.M.; Venås, C. Environmental Impact Assessment of On-Site and off-Site Construction Logistics Activities—A Case Study Analysis from Norway. IOP Conf. Ser. Earth Environ. 2023, 1196, 012048. [Google Scholar] [CrossRef] [Scilit]
- Dobers, K.; Ehrler, V.C.; Davydenko, I.Y.; Rüdiger, D.; Clausen, U. Challenges to Standardizing Emissions Calculation of Logistics Hubs as Basis for Decarbonizing Transport Chains on a Global Scale. Transp. Res. Rec. J. Transp. Res. Board 2019, 2673, 502–513. [Google Scholar] [CrossRef] [Scilit]
- ISO 14083:2023; Greenhouse Gases—Quantification and Reporting of Greenhouse Gas Emissions Arising from Transport Chain Operations. International Organization for Standardization: Geneva, Switzerland, 2023.
- GS1 Ireland Digital Product Passport (DPP) and the Adoption of GS1 Standards for the Identification of Construction Products. GS1 Irel. Ind. Brief. 2024. Available online: https://www.gs1ie.org/media/4ksijb2x/digital-product-passport-dpp-and-the-adoption-of-gs1-standards-for-the-identification-of-construction-products.pdf (accessed on 7 July 2026).
- Accorsi, R.; Battarra, I.; Guidani, B.; Manzini, R.; Ronzoni, M.; Volpe, L. Augmented Spatial LCA for Comparing Reusable and Recyclable Food Packaging Container Networks. J. Clean. Prod. 2022, 375, 134027. [Google Scholar] [CrossRef] [Scilit]
- Soust-Verdaguer, B.; Hoxha, E.; Llatas, C.; Passer, A. How Transport Modelling Affects the Building Life Cycle Assessment (LCA) Results: A Case Study Analysis. IOP Conf. Ser. Earth Environ. 2022, 1078, 012096. [Google Scholar] [CrossRef] [Scilit]
- Yavari, A.; Bagha, H.; Korala, H.; Mirza, I.; Dia, H.; Scifleet, P.; Sargent, J.; Shafiei, M. ParcEMon: IoT Platform for Real-Time Parcel Level Last-Mile Delivery Greenhouse Gas Emissions Reporting and Management. Sensors 2022, 22, 7380. [Google Scholar] [CrossRef] [Scilit] [PubMed]
- Yin, Y.; Wang, H.; Deng, X. Real-Time Logistics Transport Emission Monitoring-Integrating Artificial Intelligence and Internet of Things. Transp. Res. Part Transp. Environ. 2024, 136, 104426. [Google Scholar] [CrossRef] [Scilit]
- Ghaffarpasand, O.; Burke, M.; Osei, L.K.; Ursell, H.; Chapman, S.; Pope, F.D. Vehicle Telematics for Safer, Cleaner and More Sustainable Urban Transport: A Review. Sustainability 2022, 14, 16386. [Google Scholar] [CrossRef] [Scilit]
- Arshad, H.; Zayed, T. A Multi-Sensing IoT System for MiC Module Monitoring during Logistics and Operation Phases. Sensors 2024, 24, 4900. [Google Scholar] [CrossRef] [Scilit] [PubMed]
- Hasselsteen, L.; Thuesen, W.; Kanafani, K. Navigating Scope 3: Transport GHG Emissions Assessment in Construction Supply Chains. IOP Conf. Ser. Earth Environ. 2025, 1554, 012099. [Google Scholar] [CrossRef] [Scilit]
- Koupal, J.W.; DenBleyker, A.; Manne, G.; Batista, M.H.; Schmitt, T. Capabilities and Limitations of Telematics for Vehicle Emissions Inventories. Transp. Res. Rec. J. Transp. Res. Board 2022, 2676, 49–57. [Google Scholar] [CrossRef] [Scilit]
- Turkensteen, M. The Accuracy of Speed and Distance Assumptions in Logistics Carbon Footprint Calculation. Transp. Res. Part Transp. Environ. 2017, 54, 245–260. [Google Scholar] [CrossRef] [Scilit]
- Haupt, J.; Cerdas, F.; Herrmann, C. Derivation of Requirements for Life Cycle Assessment-Related Information to Be Integrated in Digital Battery Passports. Procedia CIRP 2024, 122, 300–305. [Google Scholar] [CrossRef] [Scilit]
- Burchart, D.; Przytuła, I. Review of Environmental Life Cycle Assessment for Fuel Cell Electric Vehicles in Road Transport. Energies 2025, 18, 1229. [Google Scholar] [CrossRef] [Scilit]
- Statkiewicz, W.; Ragin-Skorecka, K.; Krzywy, J.; Nowak, F. Toward Circular Electromobility: Integrating Digital Product Passports into EV Battery Disassembly Processes. Procedia Comput. Sci. 2026, 277, 1704–1713. [Google Scholar] [CrossRef] [Scilit]
- Wiesner, M.; Moreira, J.; Guizzardi, R.; Scholz, P. A Reference Architecture for Digital Product Passports at Batch Level to Support Manufacturing Supply Chains. In Proceedings of the Research Challenges in Information Science; Araújo, J., de la Vara, J.L., Santos, M.Y., Assar, S., Eds.; Springer Nature Switzerland: Cham, Switzerland, 2024; pp. 307–323. [Google Scholar]
- Ahn, J.; Gaza, H.; Lee, J.; Kim, H.; Byun, J. Oliot EPCIS: An Open-Source EPCIS 2.0 System for Supply Chain Transparency. SoftwareX 2023, 23, 101477. [Google Scholar] [CrossRef] [Scilit]
- Buyurgan, N.; Landry, R.; Chimka, J.R. Item-Level Supply Chain Tracking: Workarounds, Retrofitting Costs, and ROI Constraints. Int. J. RF Technol. 2011, 2, 201–218. [Google Scholar]
- Jayathilaka, G.; Thurairajah, N.; Rathnasinghe, A. Digital Data Management Practices for Effective Embodied Carbon Estimation: A Systematic Evaluation of Barriers for Adoption in the Building Sector. Sustainability 2023, 16, 236. [Google Scholar] [CrossRef] [Scilit]
- Kidane, Y.; Kim, D. Traceability Architecture: Extending EPCIS to Enhance Track and Trace with NoSQL Data Model. In Proceedings of the 2016 IEEE International Conference on Services Computing (SCC), San Francisco, CA, USA, 27 June 2016; IEEE: New York, NY, USA, 2016; pp. 880–883. [Google Scholar]
- Mêda, P.; Fauth, J.; Schranz, C.; Sousa, H.; Urban, H. Twinning the Path of Digital Building Permits and Digital Building Logbooks—Diagnosis and Challenges. Dev. Built Environ. 2024, 20, 100573. [Google Scholar] [CrossRef] [Scilit]
- Ruismäki, W.; Zu Castell-Rüdenhausen, M.; Pohjalainen, E.; Wahlström, M. Stakeholder Perspectives on Digital Product Passports for Construction Products. Clean. Logist. Supply Chain 2025, 17, 100275. [Google Scholar] [CrossRef] [Scilit]
- Tolcha, Y.K.; Da Silva Vanin, F.N.; Park, G.; Costa, C.A.; Righi, R.; Kim, D. Hybrid EPCIS: Integrating GS1/ISO Standards with On-Chain and Off-Chain Distributed Ledger for Supply Chain Traceability. In Proceedings of the 2025 IEEE International Conference on Decentralized Applications and Infrastructures (DAPPS), Tucson, AZ, USA, 21 July 2025; IEEE: New York, NY, USA, 2025; pp. 50–59. [Google Scholar]
- ISO 22057:2022; Sustainability in Buildings and Civil Engineering Works. Data Templates for the Use of Environmental Product Declarations (EPDs) for Construction Products in Building Information Modelling (BIM). International Organization for Standardization: Geneva, Switzerland, 2022.
- Industry Foundation Classes (IFC). Available online: https://www.buildingsmart.org/standards/bsi-standards/industry-foundation-classes/ (accessed on 7 July 2026).
- Smart Freight Centre. Global Logistics Emissions Council Framework for Logistics Emissions; Smart Freight Centre: Amsterdam, The Netherlands, 2023. [Google Scholar]
- DIN SPEC 91472; Remanufacturing (Reman). Quality Classification for Circular Processes. Deutsches Institut für Normung: Berlin, Germany, 2023.
- Aragón, A.; Alberti, M.G. Limitations of Machine-Interpretability of Digital EPDs Used for a BIM-Based Sustainability Assessment of Construction Assets. J. Build. Eng. 2024, 96, 110418. [Google Scholar] [CrossRef] [Scilit]
- Brockmann, T. Digitalization of Building LCA and International Activities—In the Context of German Assessment System for Sustainable Building. IOP Conf. Ser. Earth Environ. Sci. 2019, 323, 012108. [Google Scholar] [CrossRef] [Scilit]
- Fancello, G.; Vitiello, M.; Serra, P. Evaluating the Environmental Sustainability of an Intermodal Freight Logistic Chain Using the GLEC Framework and ISO 14083. In Computational Science and Its Applications—ICCSA 2023; Springer: Berlin/Heidelberg, Germany, 2023; pp. 341–356. [Google Scholar]
- Morganti, L.; Elguezabal Esnarrizaga, P.; Pracucci, A.; Zaffagnini, T.; Garcia Cortes, V.; Rudenå, A.; Brunklaus, B.; Astudillo Larraz, J. Data-Driven and LCA-Based Framework for Environmental and Circular Assessment of Modular Curtain Walls. J. Facade Des. Eng. 2024, 12, 9–42. [Google Scholar] [CrossRef] [Scilit]
- Plociennik, C.; Nazeri, A.; Rimaz, M.H.; Knetsch, S.; Lopes, A.D.C.P.; Hagedorn, T.; Baehr, J.; Vogelgesang, M.; Li, C.; Benner, W.; et al. Connecting Producers and Recyclers: A Digital Product Passport Concept and Implementation Suitable for End-of-Life Management. Procedia CIRP 2024, 122, 831–836. [Google Scholar] [CrossRef] [Scilit]
- Psarommatis, F.; May, G. Digital Product Passport: A Pathway to Circularity and Sustainability in Modern Manufacturing. Sustainability 2024, 16, 396. [Google Scholar] [CrossRef] [Scilit]
- Thunyaluck, M.; Valilai, O.F. Integrating Digital Product Passports in Multi-Level Supply Chain for Enabling Horizontal and Vertical Integration in the Circular Economy. In Proceedings of the 2024 IEEE International Conference on Industrial Engineering and Engineering Management (IEEM), Bangkok, Thailand, 15–18 December 2024; IEEE: New York, NY, USA, 2024; pp. 36–42. [Google Scholar]
- Del Rosario, P.; Palumbo, E.; Traverso, M. Environmental Product Declarations as Data Source for the Environmental Assessment of Buildings in the Context of Level(s) and DGNB: How Feasible Is Their Adoption? Sustainability 2021, 13, 6143. [Google Scholar] [CrossRef] [Scilit]
- Jaleel, N.A.; Abramovich, L.A.; Jasim Raheem, A.-R.S.; Dmitrievich, K.D.; Ibrahem, A.M.M. Sustainability Assessment Framework Based on MABAC-BIM Index. J. Asian Archit. Build. Eng. 2025, 1–20. [Google Scholar] [CrossRef] [Scilit]
- Moré, F.B.; Galindro, B.M.; Soares, S.R. Assessing the Completeness and Comparability of Environmental Product Declarations. J. Clean. Prod. 2022, 375, 133999. [Google Scholar] [CrossRef] [Scilit]
- Olanrewaju, O.I.; Enegbuma, W.I.; Donn, M. Challenges in Life Cycle Assessment Implementation for Construction Environmental Product Declaration Development: A Mixed Approach and Global Perspective. Sustain. Prod. Consum. 2024, 49, 502–528. [Google Scholar] [CrossRef] [Scilit]
- Brisson Stapel, E.; Balouktsi, M.; Grau Sørensen, C.; Birgisdottir, H. Methodological Challenges in Aligning EPDs with Whole Life Carbon Limits for Buildings: A B2B Approach. IOP Conf. Ser. Earth Environ. Sci. 2024, 1402, 012025. [Google Scholar] [CrossRef] [Scilit]
- Zhang, J.; Zhang, Y.; Qin, Q.; Borrion, A.; Li, G. Aligning National Waste Management Targets with Local Context: An LCA-Based Framework for Greenhouse Gas Mitigation–Insights from a Case Study in China. J. Environ. Manag. 2025, 383, 125436. [Google Scholar] [CrossRef] [Scilit] [PubMed]
- Gleich, K.; Behrendt, S.; Hörger, M.; Benfer, M.; Lanza, G. An Asset Administration Shell-Based Digital Product Passport as a Gaia-X Service. Procedia CIRP 2024, 127, 224–229. [Google Scholar] [CrossRef] [Scilit]
- Hulea, M.; Miron, R.; Muresan, V. Digital Product Passport Implementation Based on Multi-Blockchain Approach with Decentralized Identifier Provider. Appl. Sci. 2024, 14, 4874. [Google Scholar] [CrossRef] [Scilit]
- Lindow, K.; Steiner, J.; Manoury, M. Enabling the Concept of an Integrated Product Data Model for Life Cycle Engineering by Digital Product Passports. Procedia CIRP 2026, 140, 845–850. [Google Scholar] [CrossRef] [Scilit]
- Reif, M.; Plociennik, C.; Rimaz, M.H.; David, A.; Ruskowski, M. Shared Digital Product Passport for Holistic Lifecycle Assessment: CO2 Calculation with the Product AAS. Atp. Mag. 2024, 66, 58–65. [Google Scholar] [CrossRef] [Scilit]
- Shi, S.; Yan, X. A Critical Review on Spatially Explicit Life Cycle Assessment Methodologies and Applications. Sustain. Prod. Consum. 2024, 52, 566–579. [Google Scholar] [CrossRef] [Scilit]
- Balasubramanian, S.; Shukla, V. Green Supply Chain Management: An Empirical Investigation on the Construction Sector. Supply Chain Manag. Int. J. 2017, 22, 58–81. [Google Scholar] [CrossRef] [Scilit]
- Bailey, M.; Booth, C.A.; Horry, R.; Vidalakis, C.; Mahamadu, A.-M.; Awuah, K.G.B. Opinions of Small and Medium UK Construction Companies on Environmental Management Systems. Proc. Inst. Civ. Eng.— Manag. Procure. Law. 2021, 174, 23–34. [Google Scholar] [CrossRef] [Scilit]
- Gurgun, A.P.; Koc, K.; Kunkcu, H. Exploring the Adoption of Technology against Delays in Construction Projects. Eng. Constr. Archit. Manag. 2024, 31, 1222–1253. [Google Scholar] [CrossRef] [Scilit]
- Nnaji, C.; Karakhan, A.A. Technologies in Construction Safety and Health: Technology Adoption Barriers and Integration Effort. J. Constr. Eng. Manag. 2020, 146, 04020050. [Google Scholar] [CrossRef] [Scilit]
- Pittri, H.; Godawatte, G.A.G.R.; Forster, A.M. Embodied Carbon Tracking in the Construction Supply Chain: Phenomenological Insights into Challenges and Strategies. Constr. Innov. 2026. [Google Scholar] [CrossRef] [Scilit]
- Singh, G.; Singh, S.; Daultani, Y.; Chouhan, M. Measuring the Influence of Digital Twins on the Sustainability of Manufacturing Supply Chain: A Mediating Role of Supply Chain Resilience and Performance. Comput. Ind. Eng. 2023, 186, 109711. [Google Scholar] [CrossRef] [Scilit]
- Thirumal, S.; Udawatta, N.; Karunasena, G.; Al-Ameri, R. Barriers to Adopting Digital Technologies to Implement Circular Economy Practices in the Construction Industry: A Systematic Literature Review. Sustainability 2024, 16, 3185. [Google Scholar] [CrossRef] [Scilit]
- Chen, H.; Reitberger, R.; Lang, W. LCA in the Construction Process A4 and A5: Insights for Germany from European Best Practices. J. Phys. Conf. Ser. 2025, 3140, 132009. [Google Scholar] [CrossRef] [Scilit]
- Næss, J.K.; Bouzada, A.M.S.; Modaresi, R. GHG Emissions from Sawnwood Products in Norway: The Importance of Harmonized LCA Methodology in Environmental Product Declarations (EPDs). In Proceedings of the World Conference on Timber Engineering (WCTE 2023), Oslo, Norway, 19–22 June 2023. [Google Scholar] [CrossRef] [Scilit]
- Zimmermann, T.; Hauschke, F. Assessing Reusable Packaging: The Importance of Methodological Choices in Carbon Footprint Calculation. Sustainability 2024, 16, 4723. [Google Scholar] [CrossRef] [Scilit]
- Frischknecht, R.; Birgisdóttir, H.; Chae, C.; Lützkendorf, T.; Passer, A.; Alsema, E.; Balouktsi, M.; Berg, B.; Dowdell, D.; Martínez, A.G.; et al. Comparison of the Environmental Assessment of an Identical Office Building with National Methods. IOP Conf. Ser. Earth Environ. 2019, 323, 012037. [Google Scholar] [CrossRef] [Scilit]
- Frischknecht, R.; Birgisdóttir, H.; Chae, C.U.; Lützkendorf, T.; Passer, A. IEA EBC Annex 72—Assessing Life Cycle Related Environmental Impacts Caused by Buildings—Targets and Tasks. IOP Conf. Ser. Earth Environ. 2019, 323, 012042. [Google Scholar] [CrossRef] [Scilit]
- Oliveira, M.J.; Pinheiro, M.D.; Vergara, M. A Practical Framework for Cradle-to-Site Embodied Carbon Assessment: Application to a Multifamily Residential Building in Faro, Portugal. Sustainability 2026, 18, 6590. [Google Scholar] [CrossRef] [Scilit]
- Schmid, C.; Krych, K.; Xiong, S. Reduction of Building Embodied Impacts: Circular Construction: The 90th Discussion Forum on Life Cycle Assessment, 7th of May 2025. Int. J. Life Cycle Assess. 2025, 30, 2688–2690. [Google Scholar] [CrossRef] [Scilit]
- Barbhuiya, S.; Das, B.B. Life Cycle Assessment of Construction Materials: Methodologies, Applications and Future Directions for Sustainable Decision-Making. Case Stud. Constr. Mater. 2023, 19, e02326. [Google Scholar] [CrossRef] [Scilit]
- GS1 Global Language of Business EPCIS (Electronic Product Code Information Services) Standard Version 2.0. 2022. Available online: https://ref.gs1.org/standards/epcis/ (accessed on 7 July 2026).
- Statistični urad Republike Slovenije, S. Podatkovni Portal SiStat: Statistični Podatki o Transportu, Gradbeništvu in Okolju v Sloveniji. Ur. Stat. Repub. Slov. 2024. Available online: https://www.stat.si (accessed on 7 July 2026).
- Agencija Republike Slovenije za okolje, A. Informacijski Sistem o Varstvu Okolja: Podatki o Nastajanju in Ravnanju z Gradbenimi Odpadki v Republiki Sloveniji. Ur. Evid. Minist. ZA Okolje Podneb. Energ. 2024. Available online: https://www.arso.gov.si (accessed on 7 July 2026).
- UNECE. Classification NST 2007. Available online: https://unece.org/classification-nst-2007 (accessed on 7 July 2026).
- Fei, W.; Opoku, A.; Agyekum, K.; Oppon, J.A.; Ahmed, V.; Chen, C.; Lok, K.L. The Critical Role of the Construction Industry in Achieving the Sustainable Development Goals (SDGs): Delivering Projects for the Common Good. Sustainability 2021, 13, 9112. [Google Scholar] [CrossRef] [Scilit]
- Holtz, J.N. The EU Data Act and Policymaking in the European Union; Studies in National Governance and Emerging Technologies; Springer Nature Switzerland: Cham, Switzerland, 2025. [Google Scholar]
- European Commission. Circular Economy Act—European Commission Strategy. Eur. Comm. Strategy Action Plan. 2026. Available online: https://environment.ec.europa.eu/strategy/circular-economy_en?prefLang=en#circular-economy-act (accessed on 7 July 2026). [CrossRef] [Scilit] [PubMed]
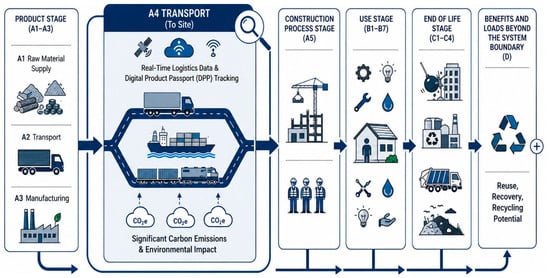
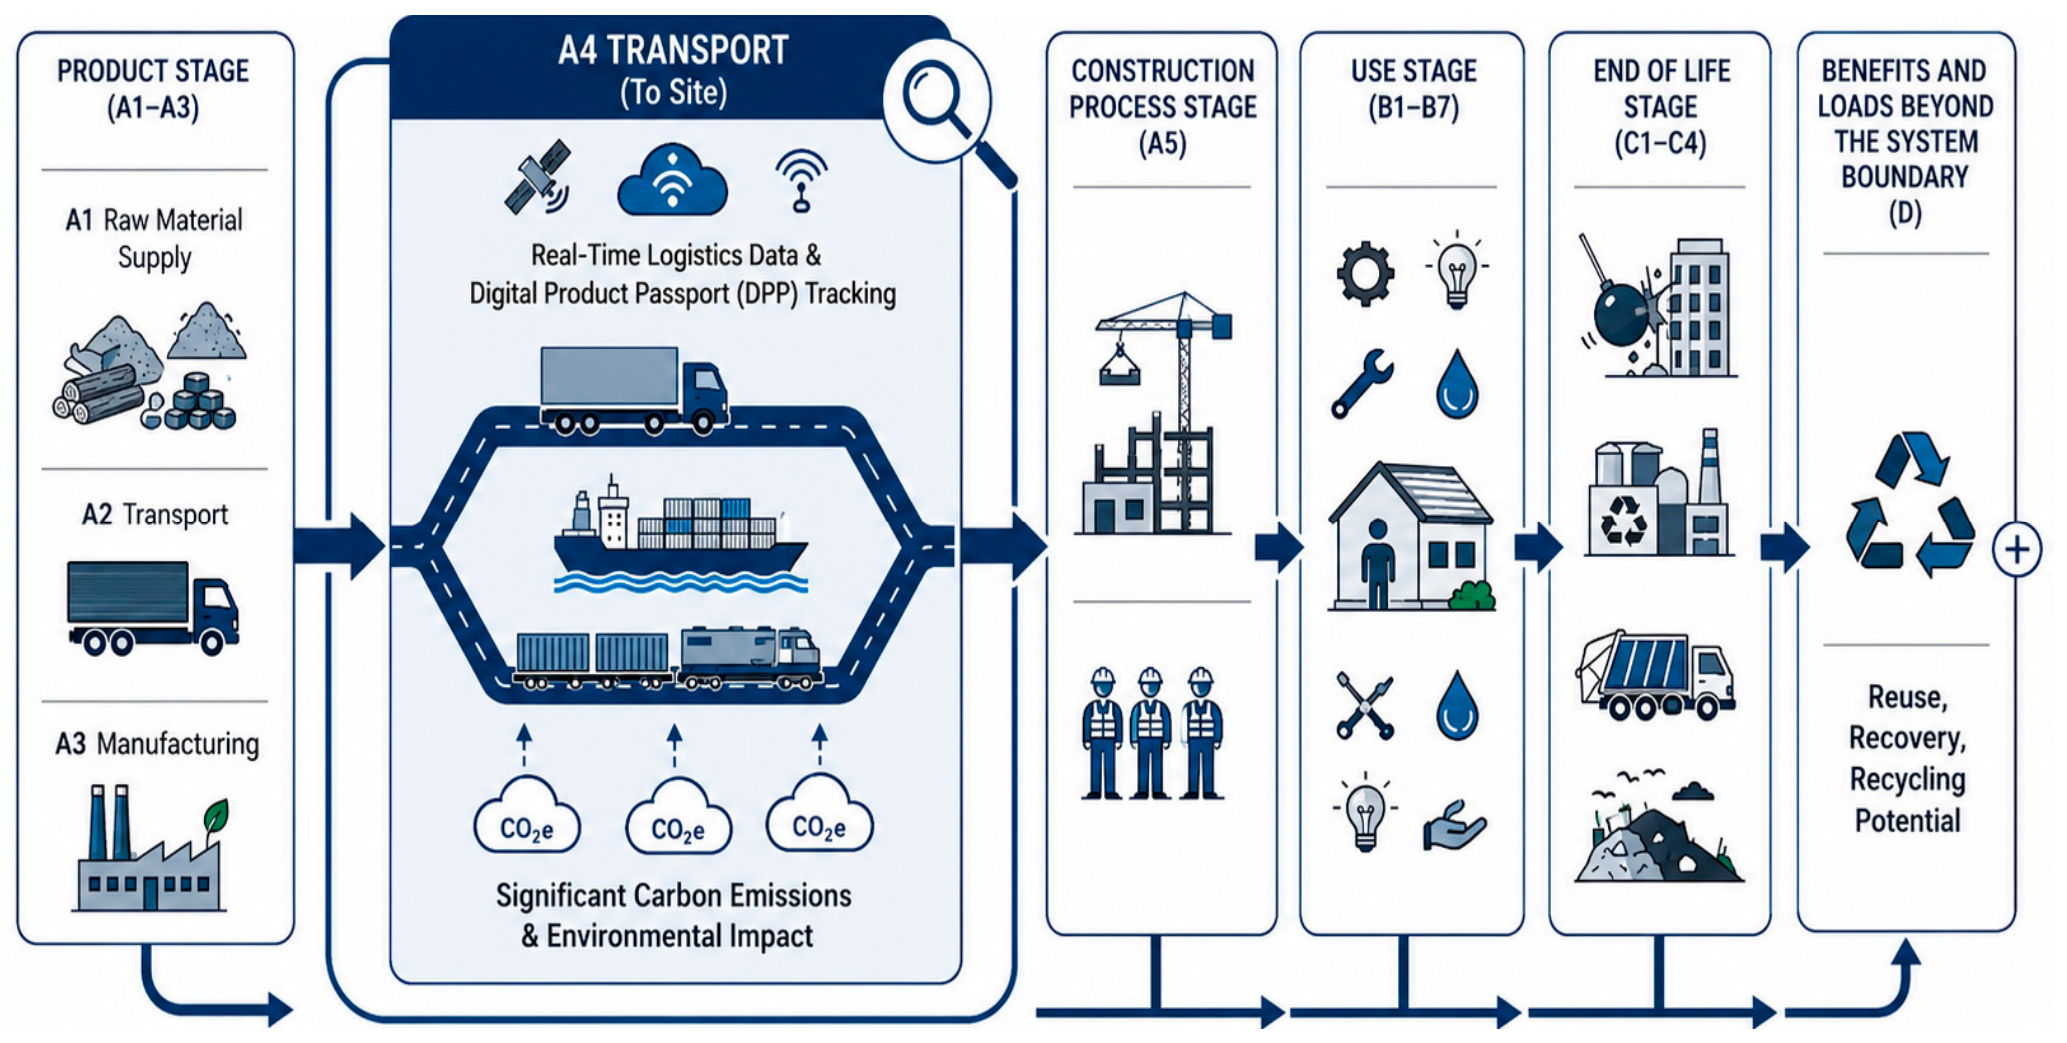
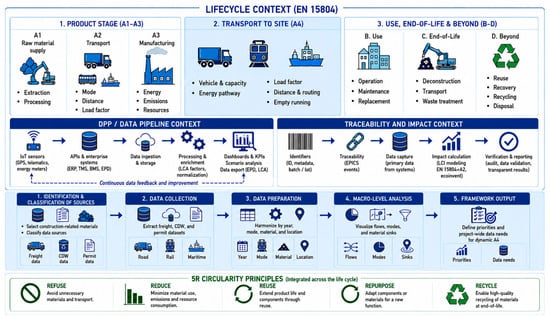
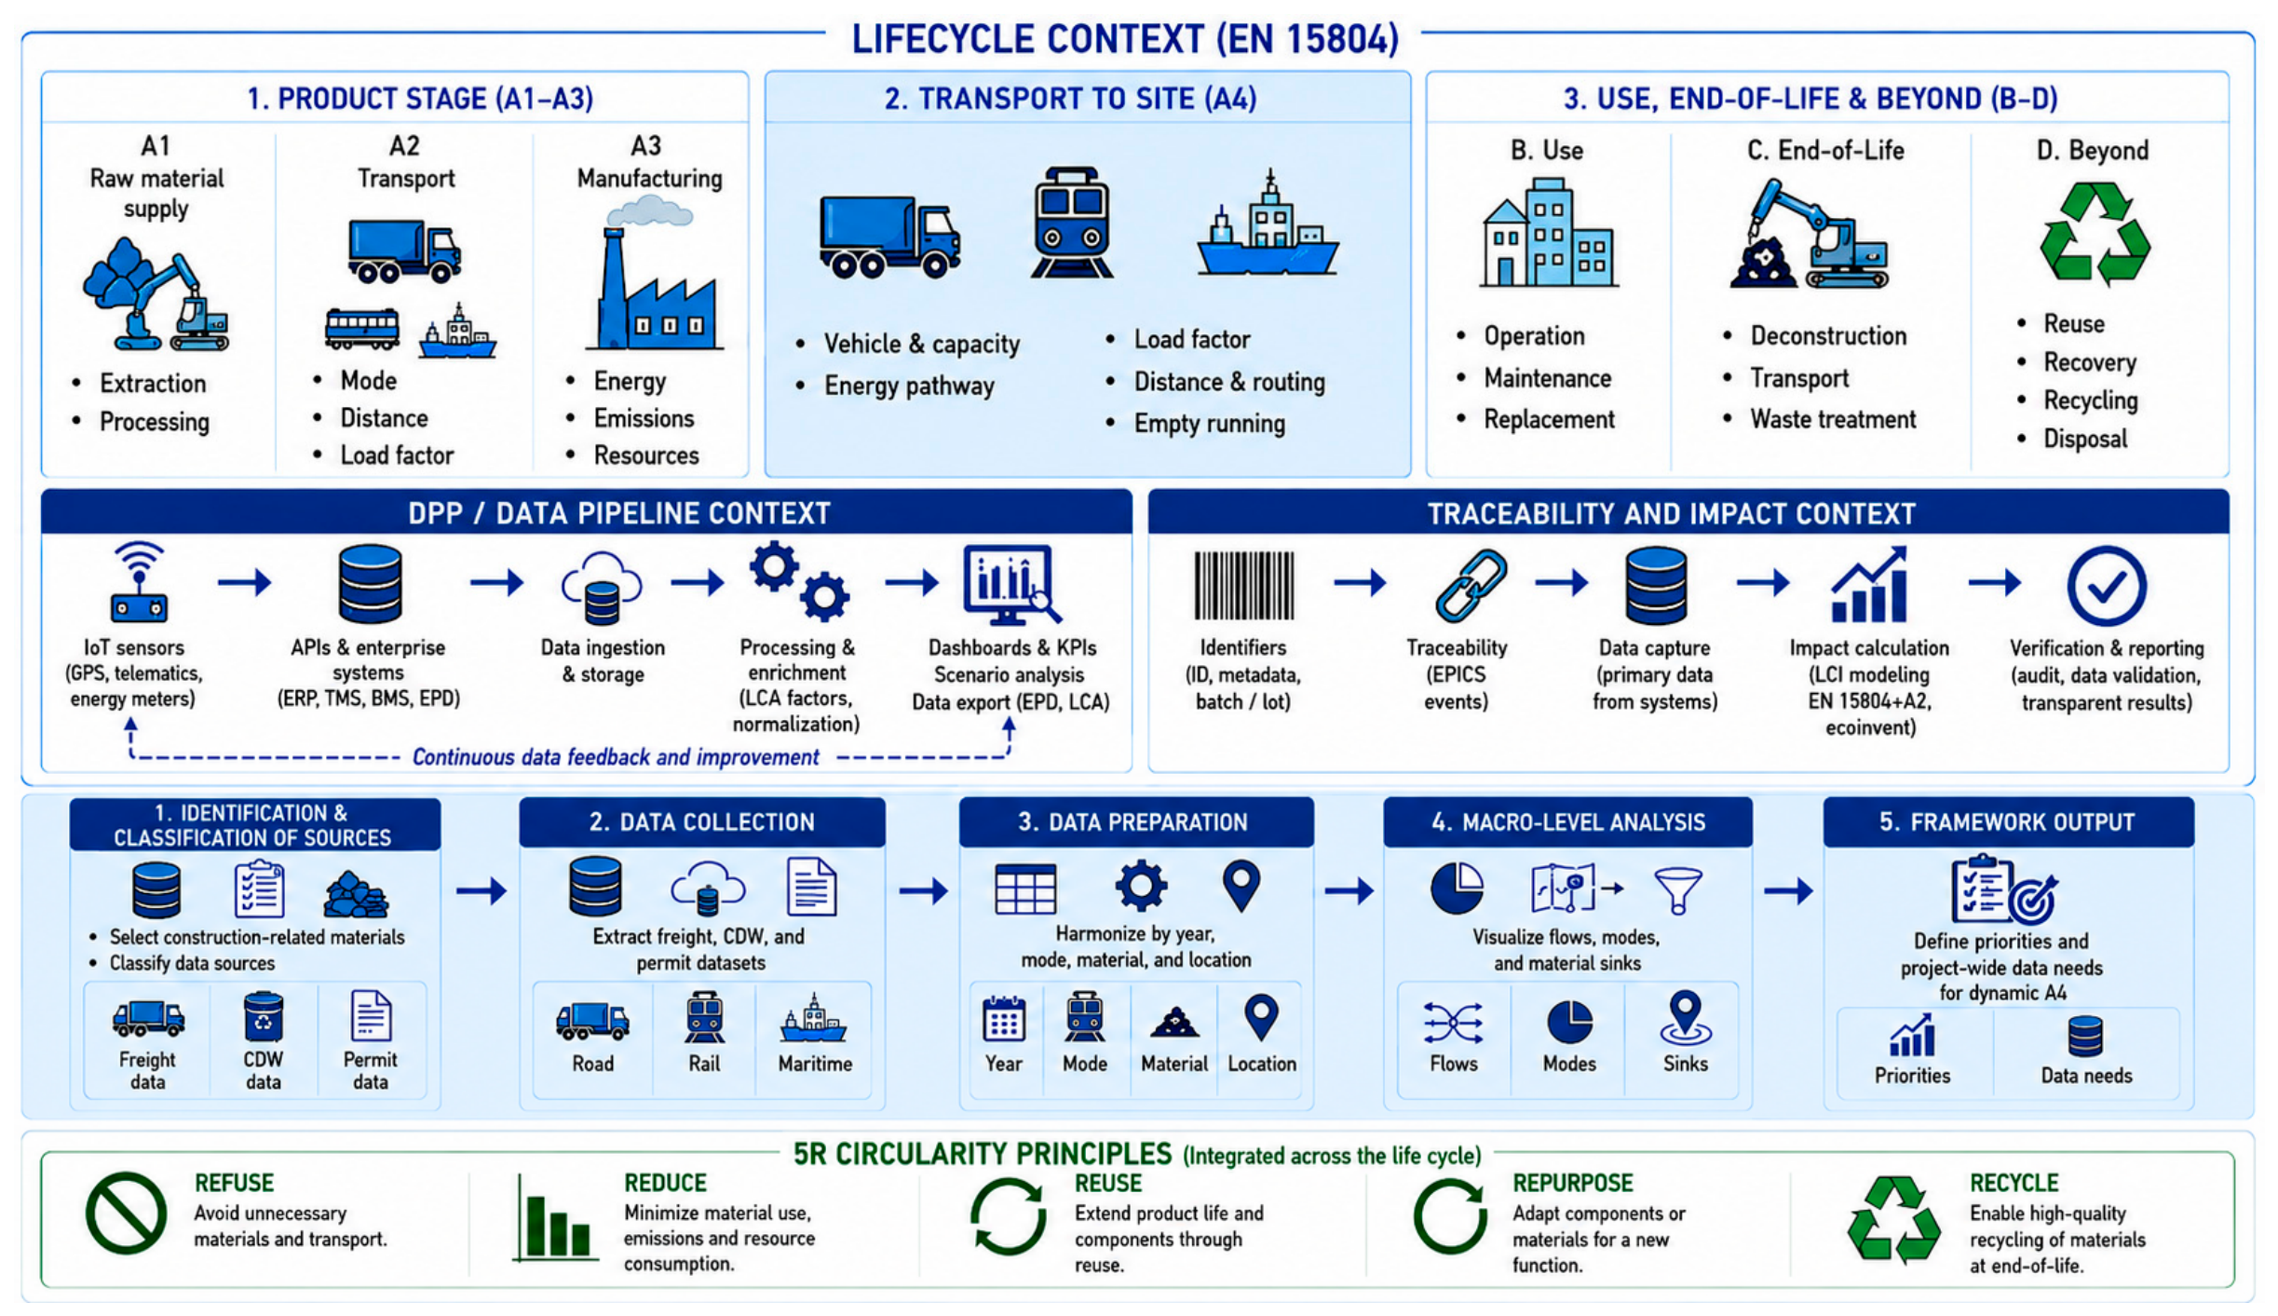
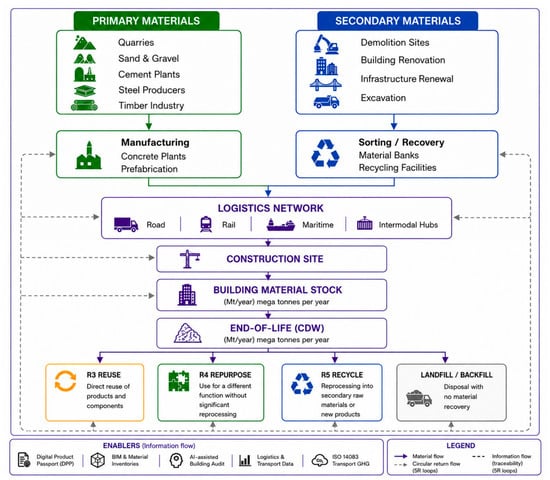
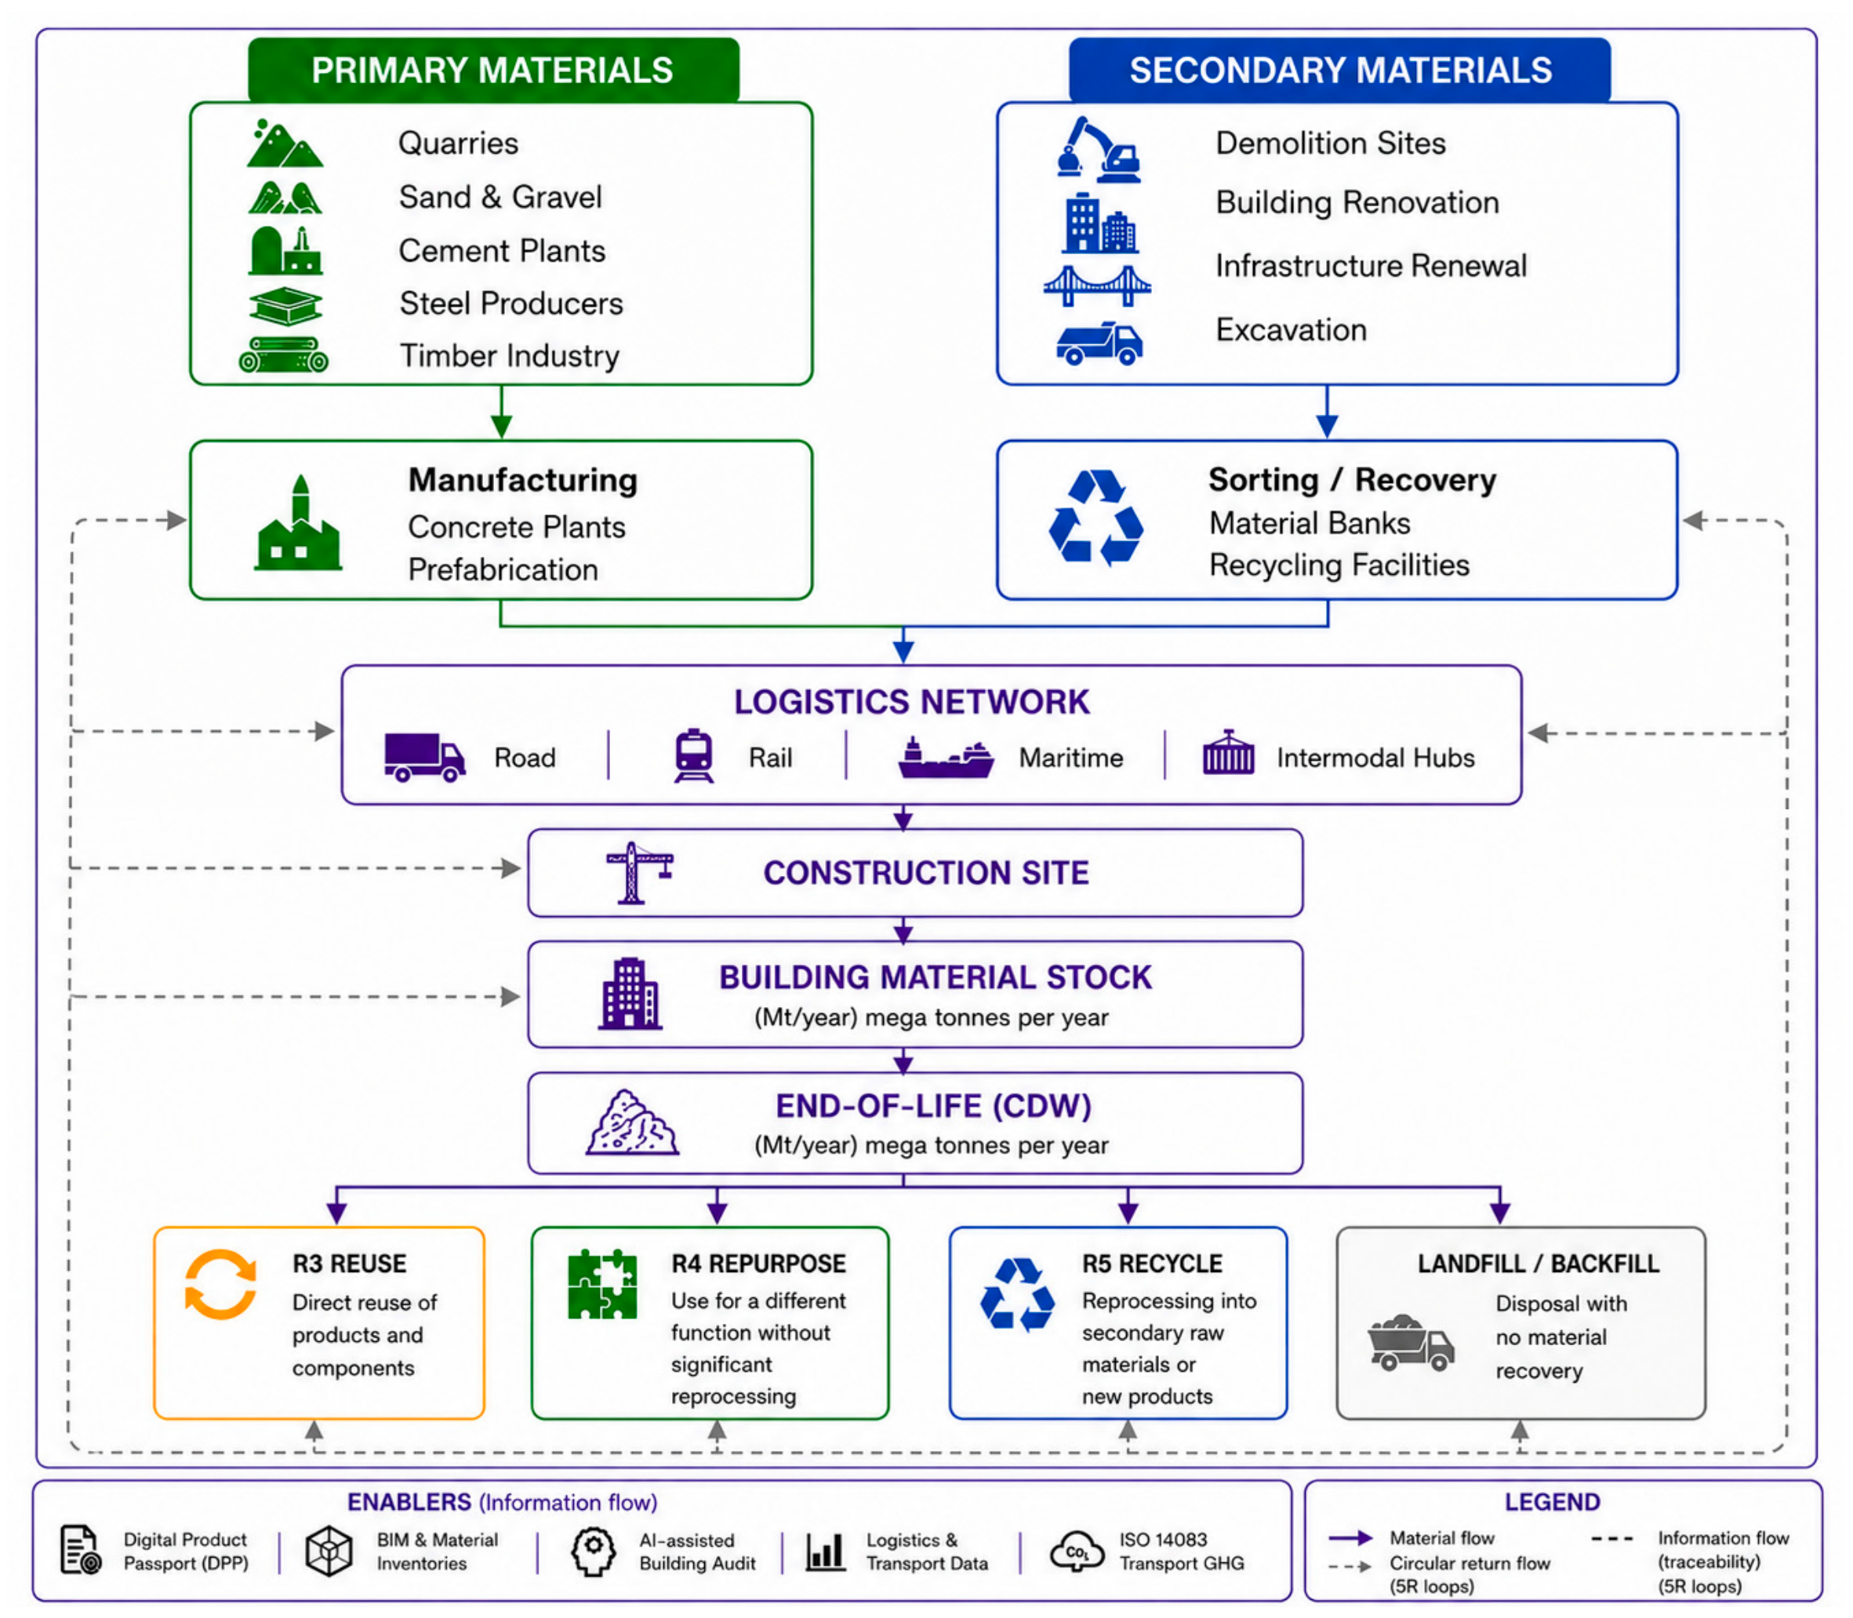
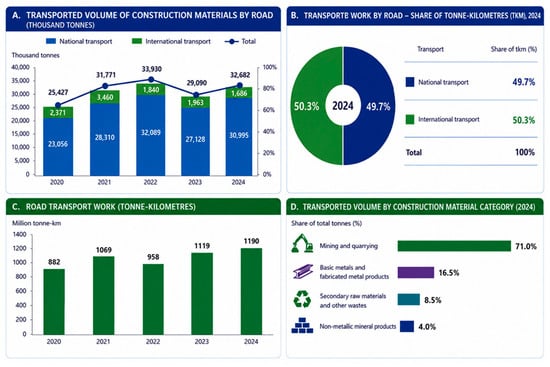
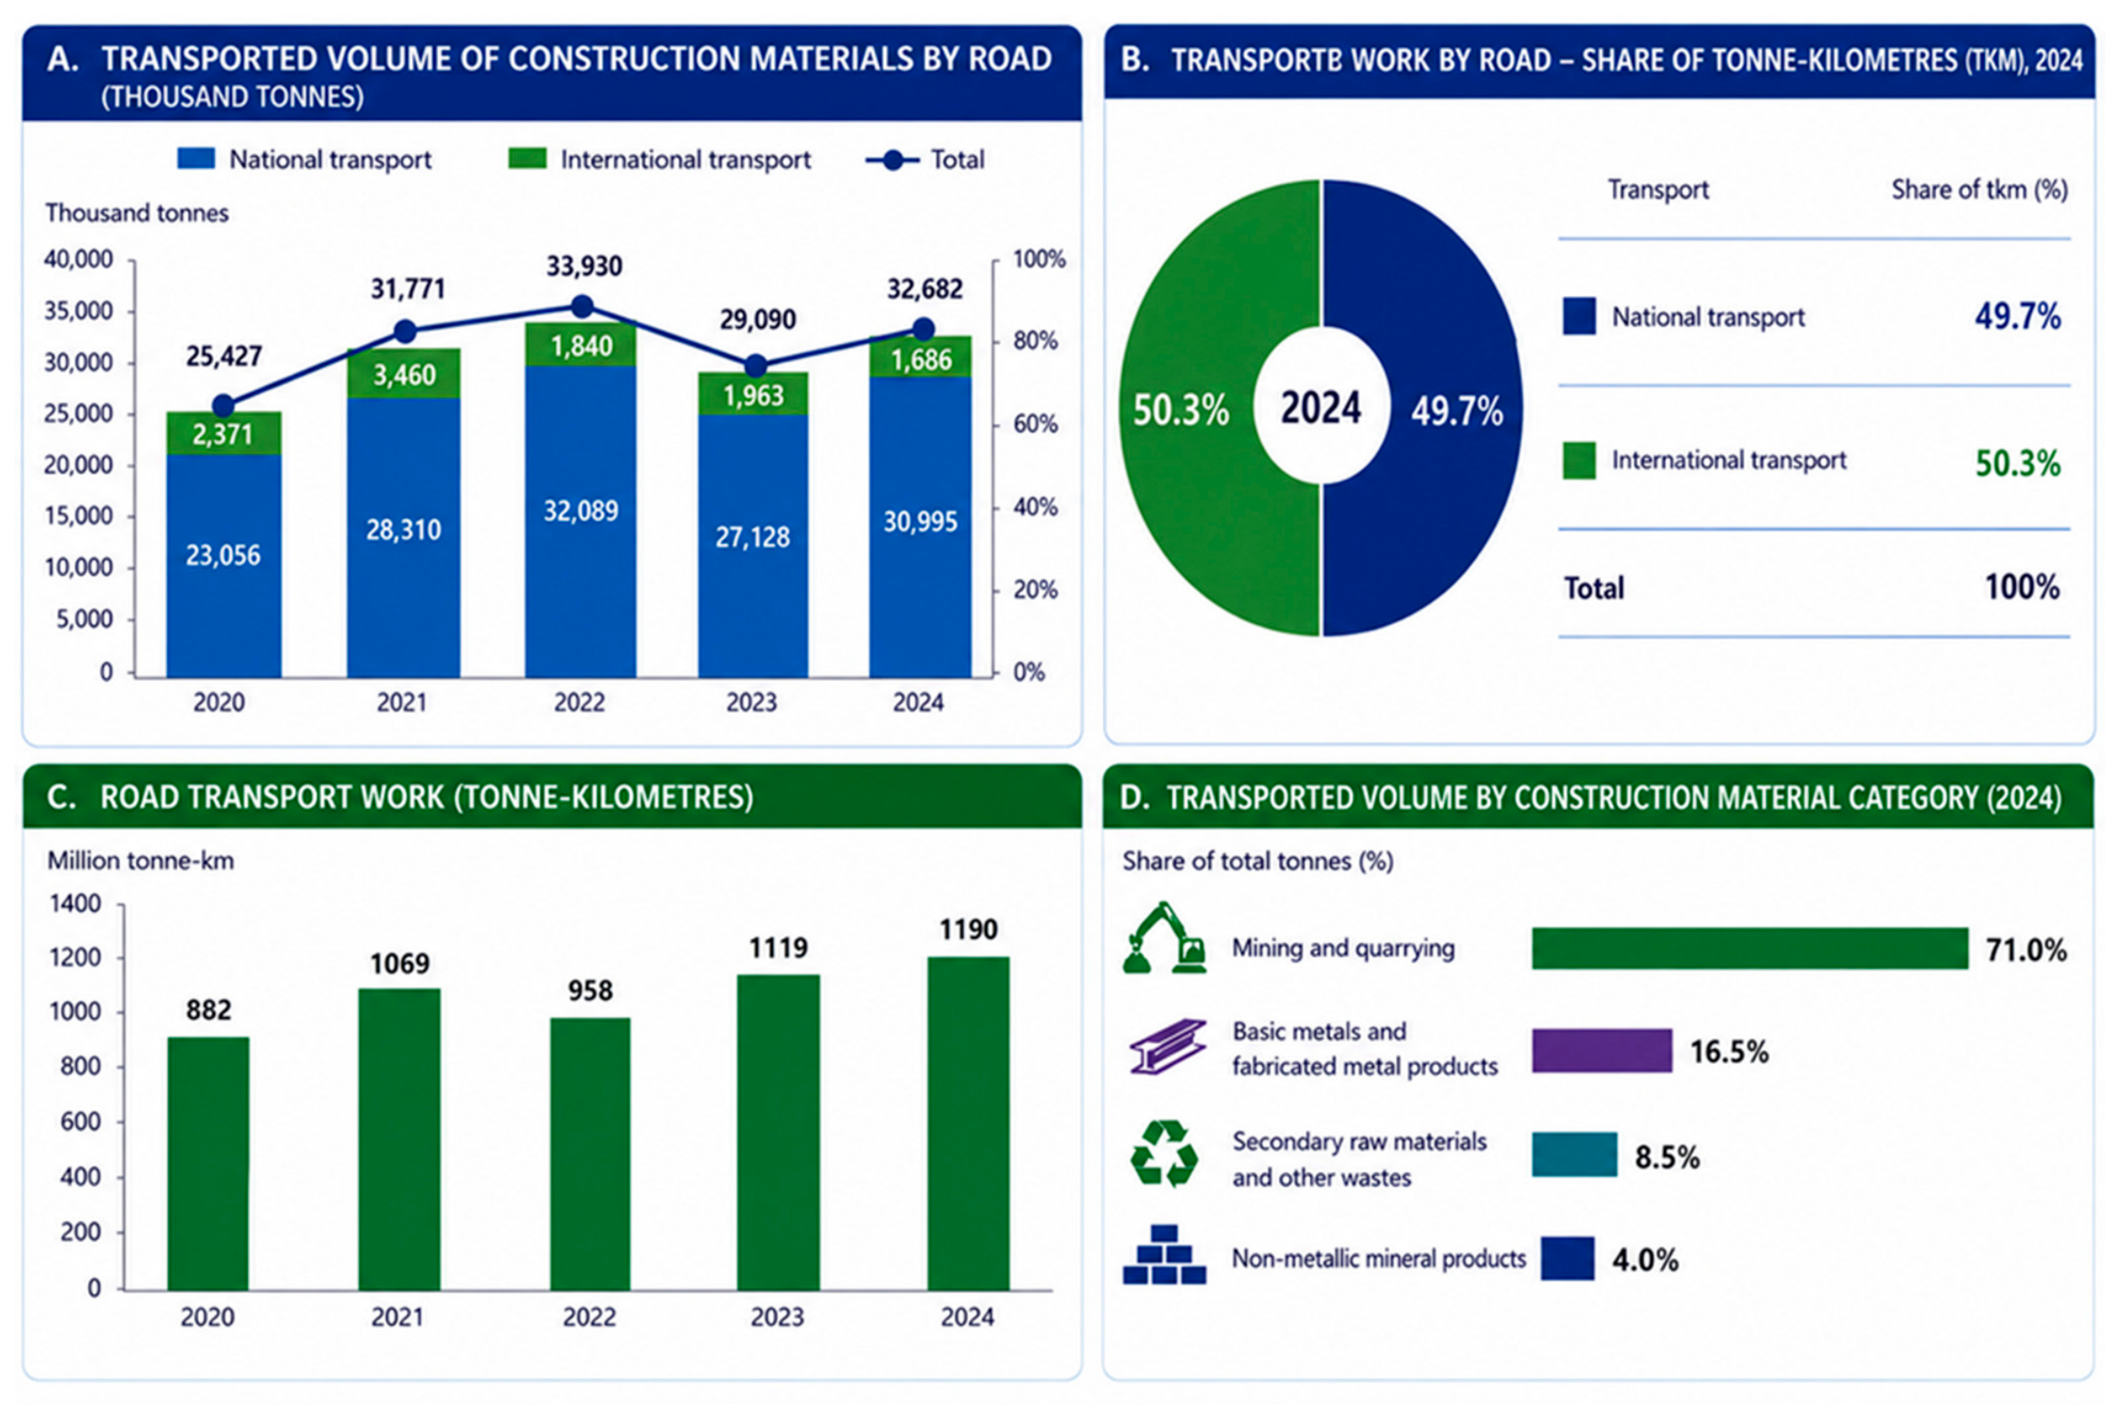
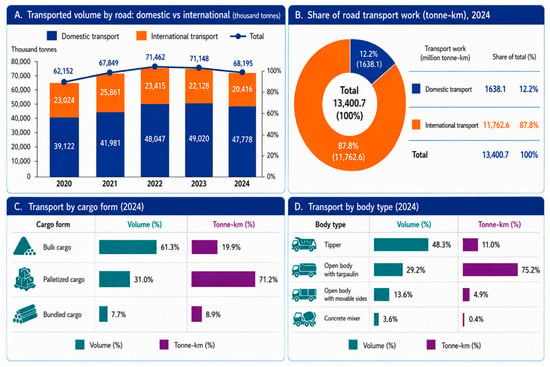
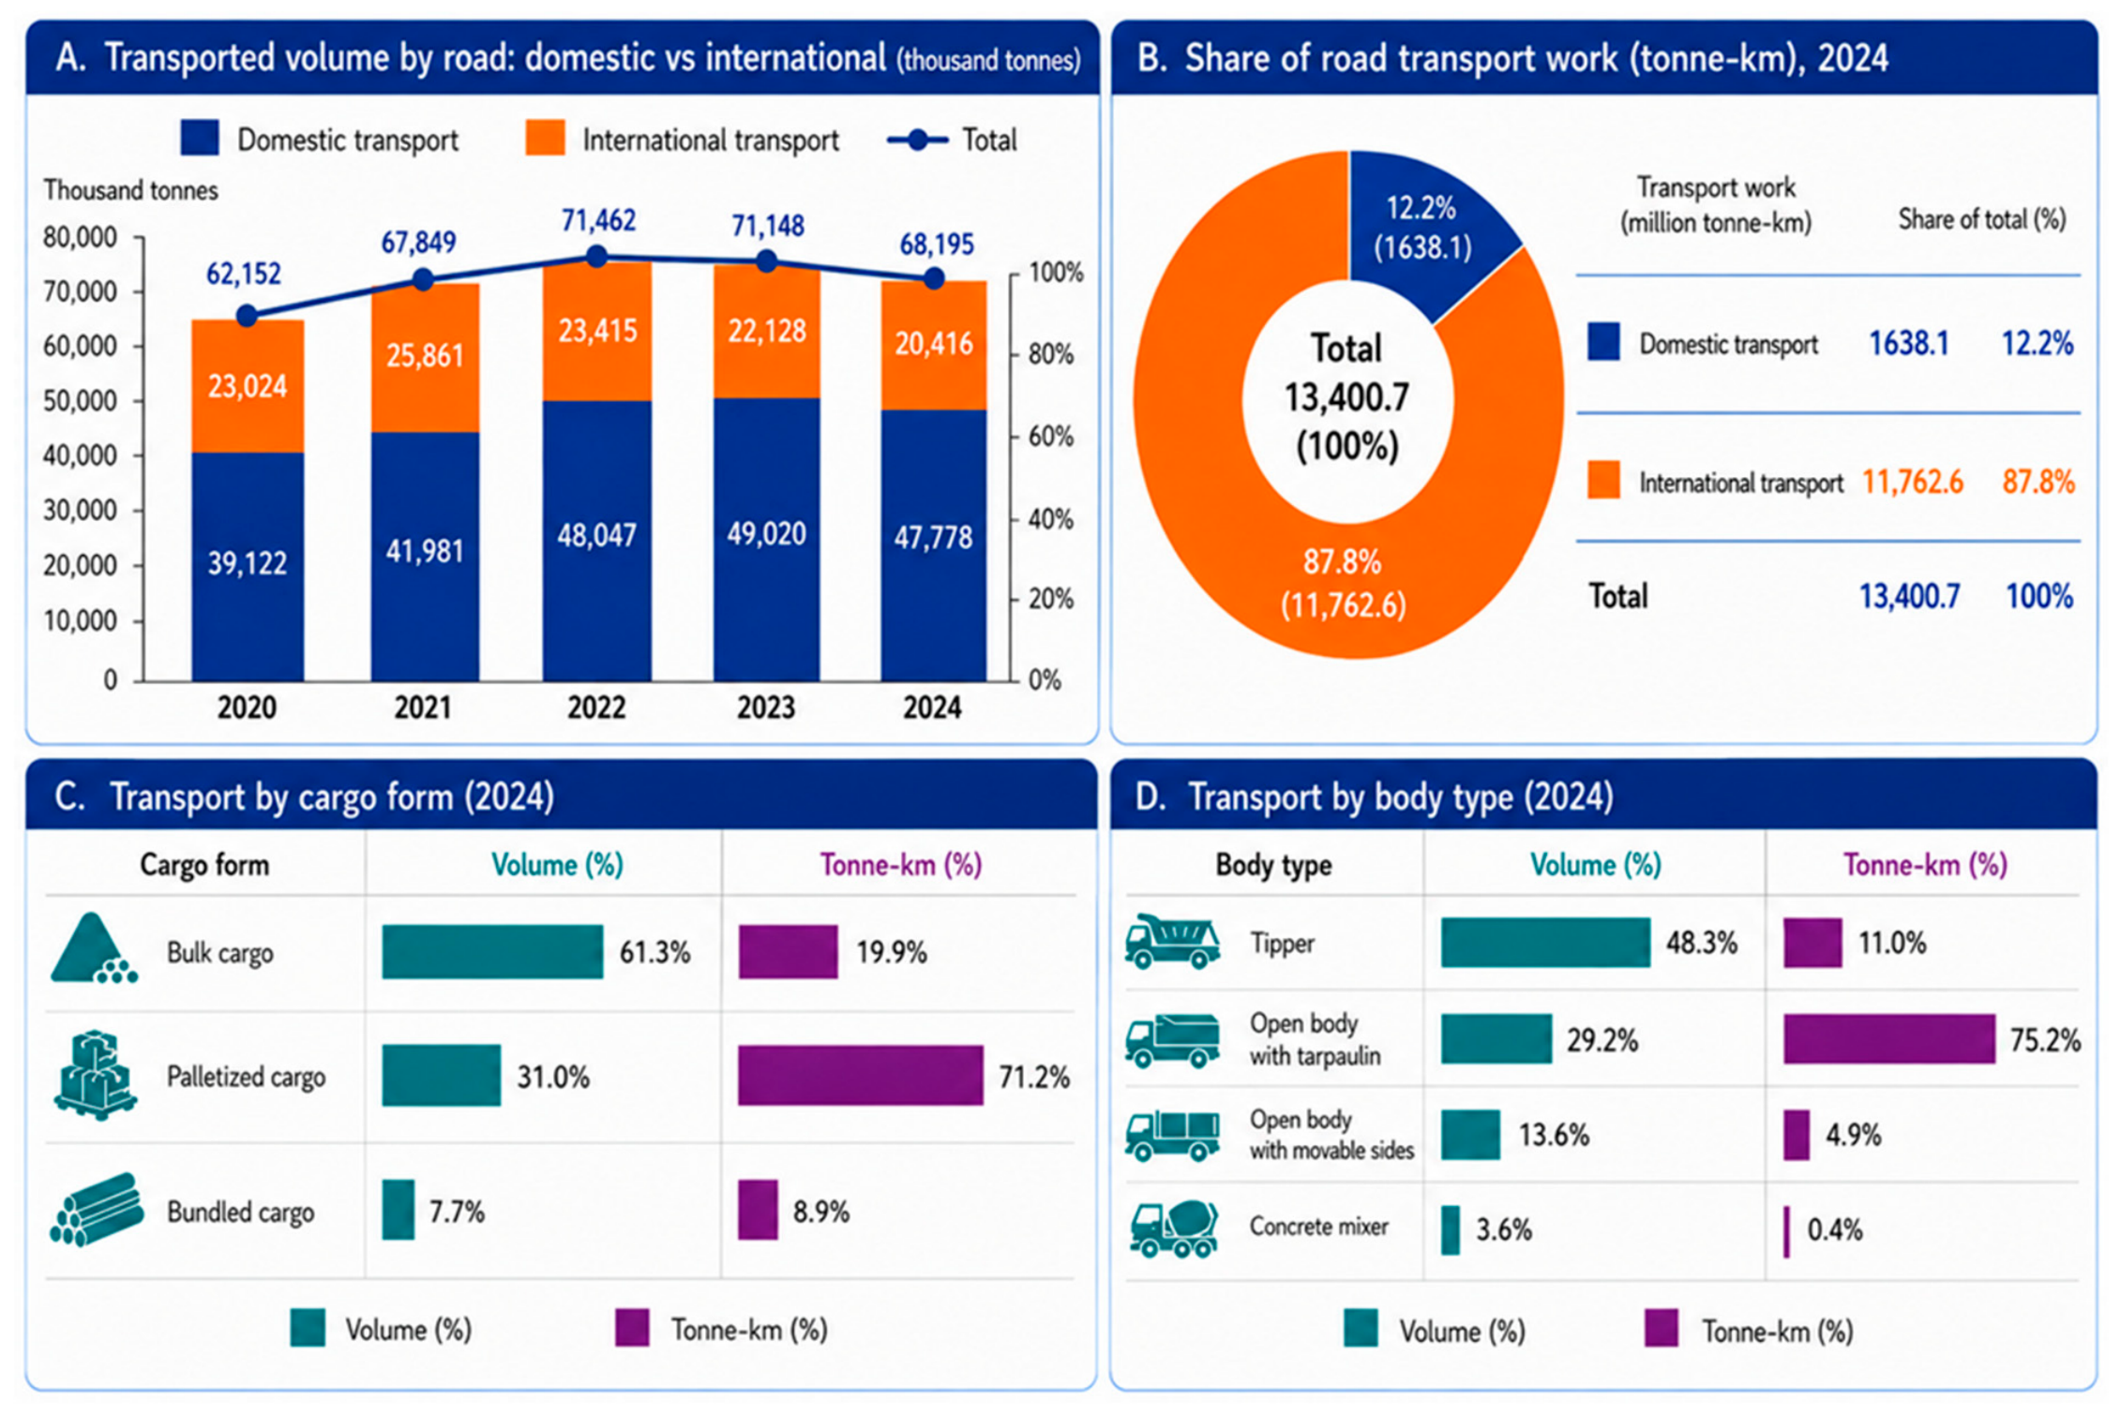
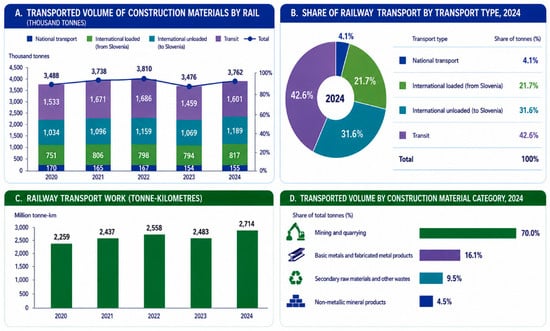
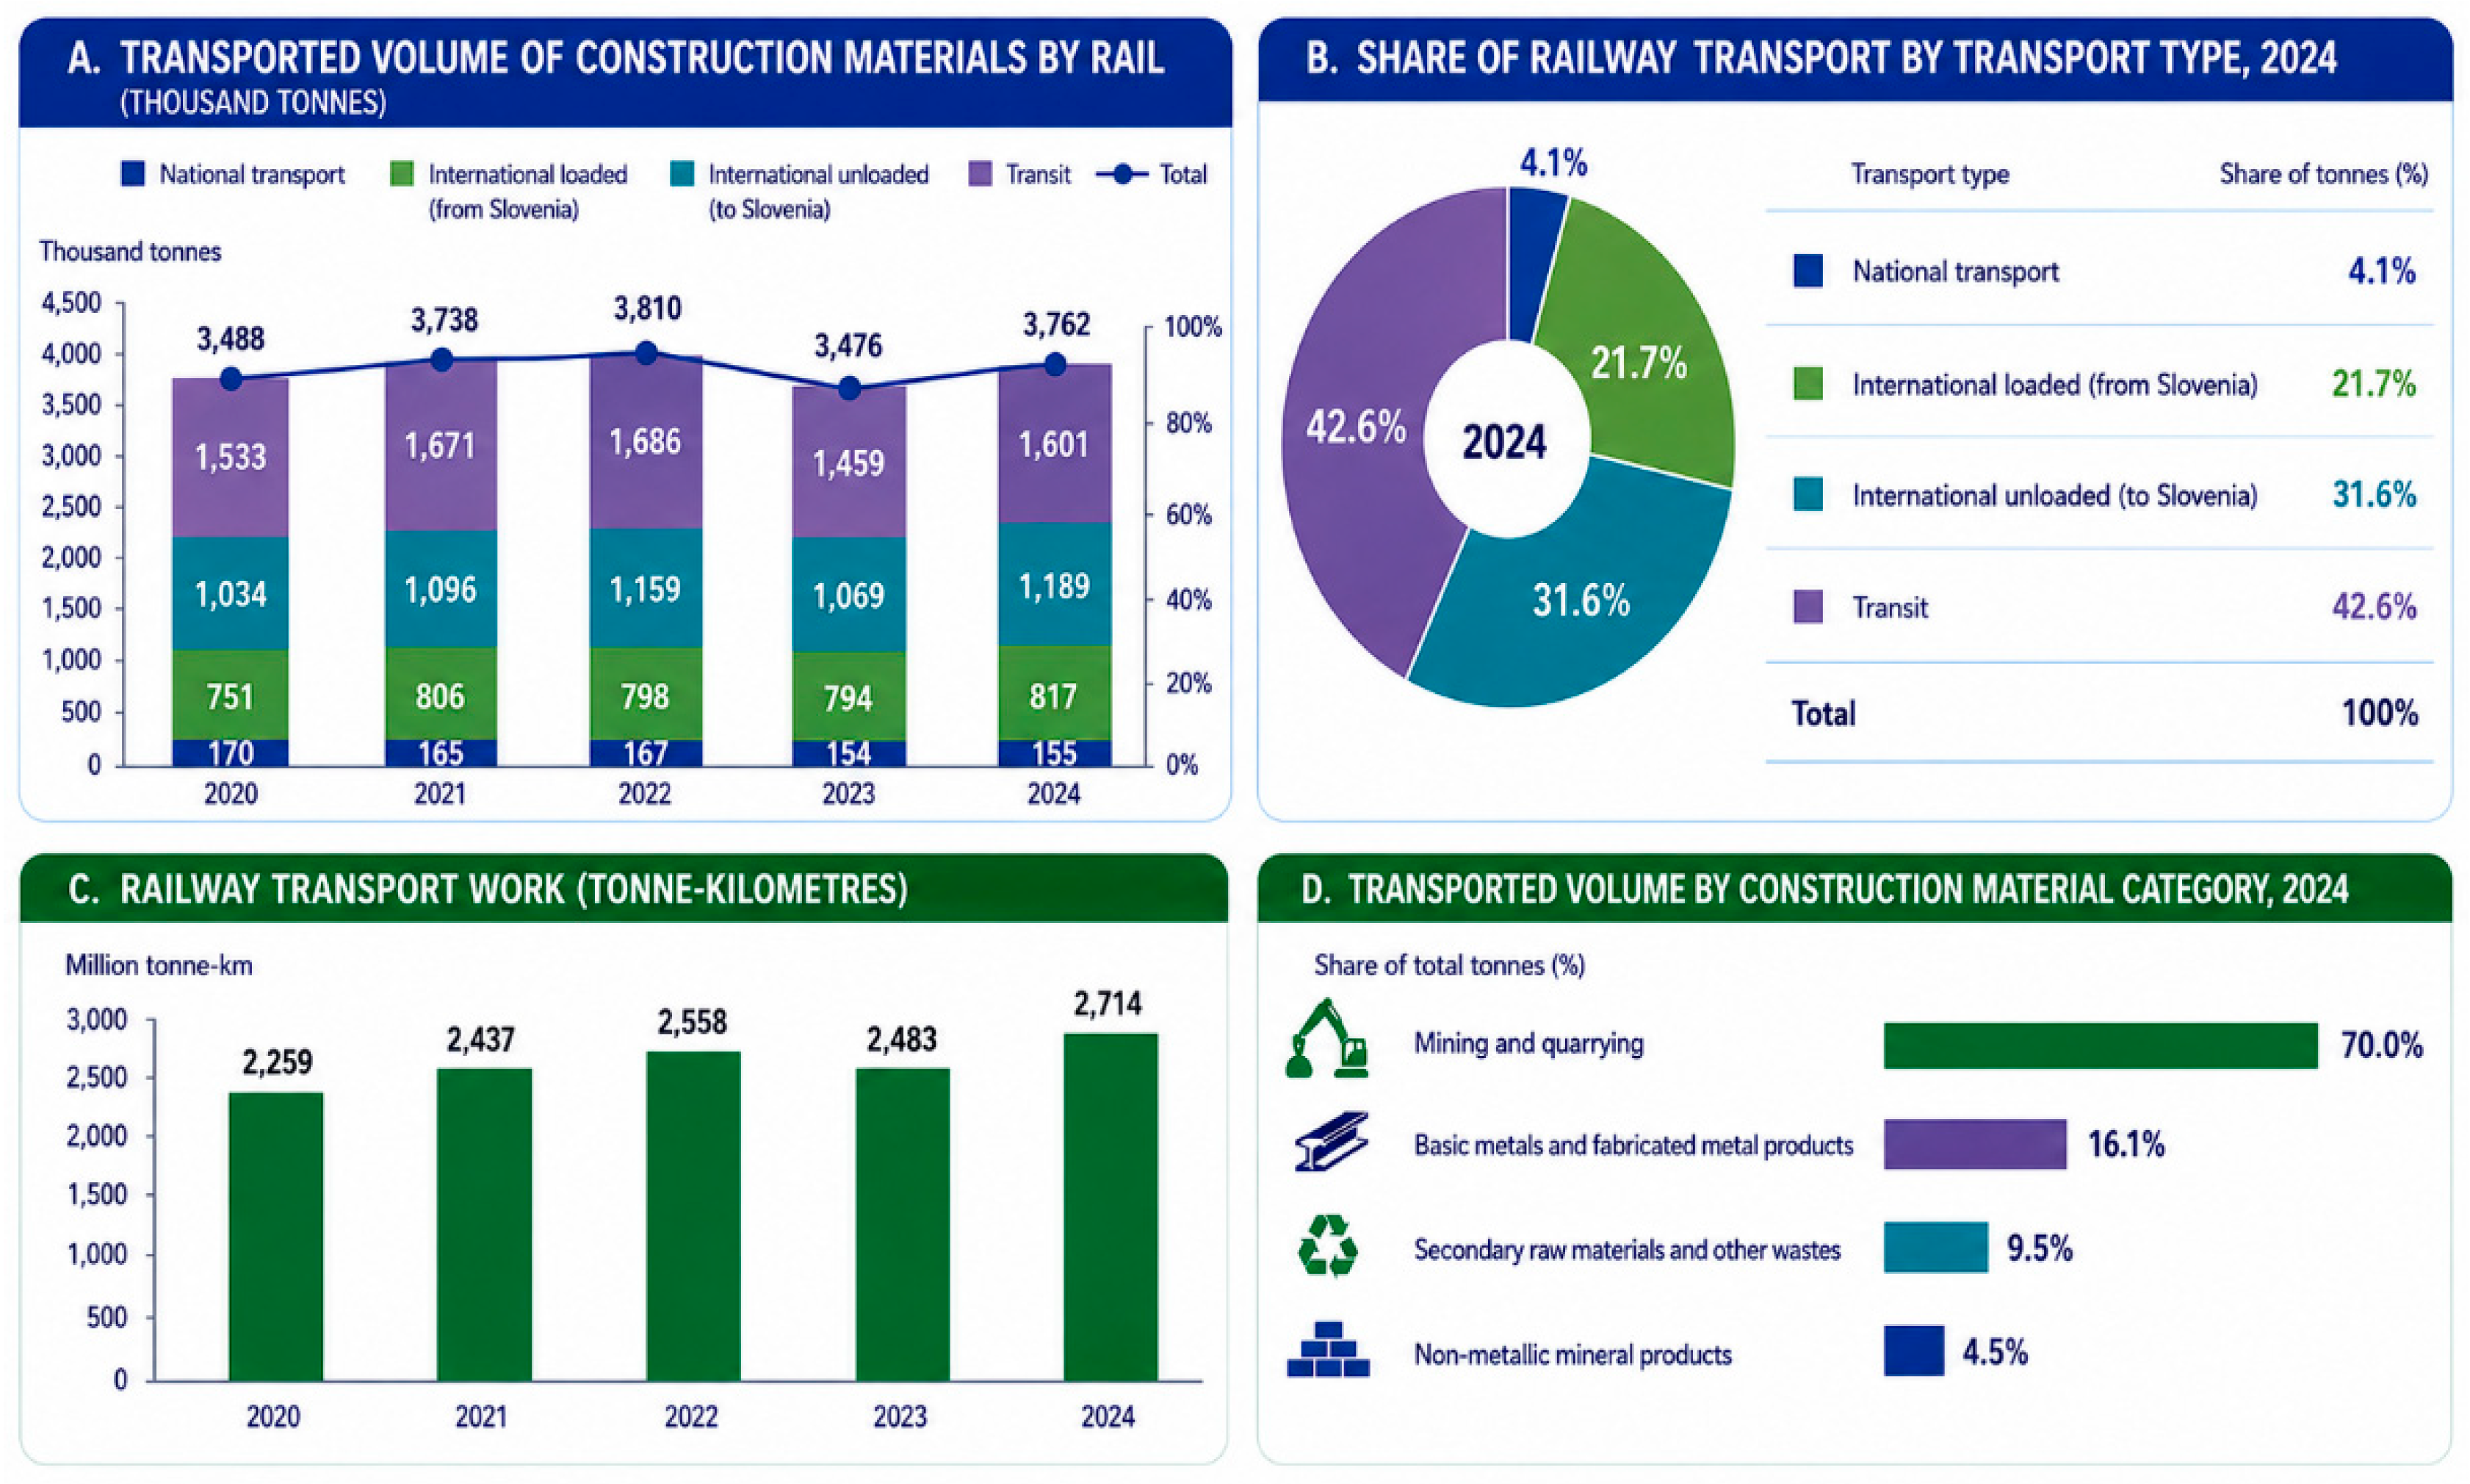
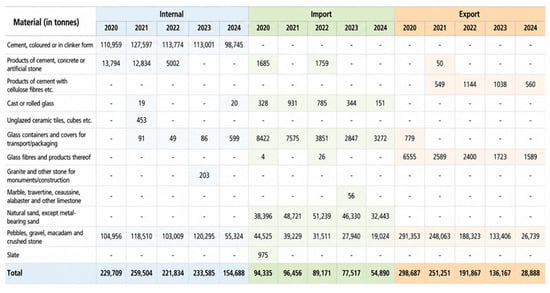
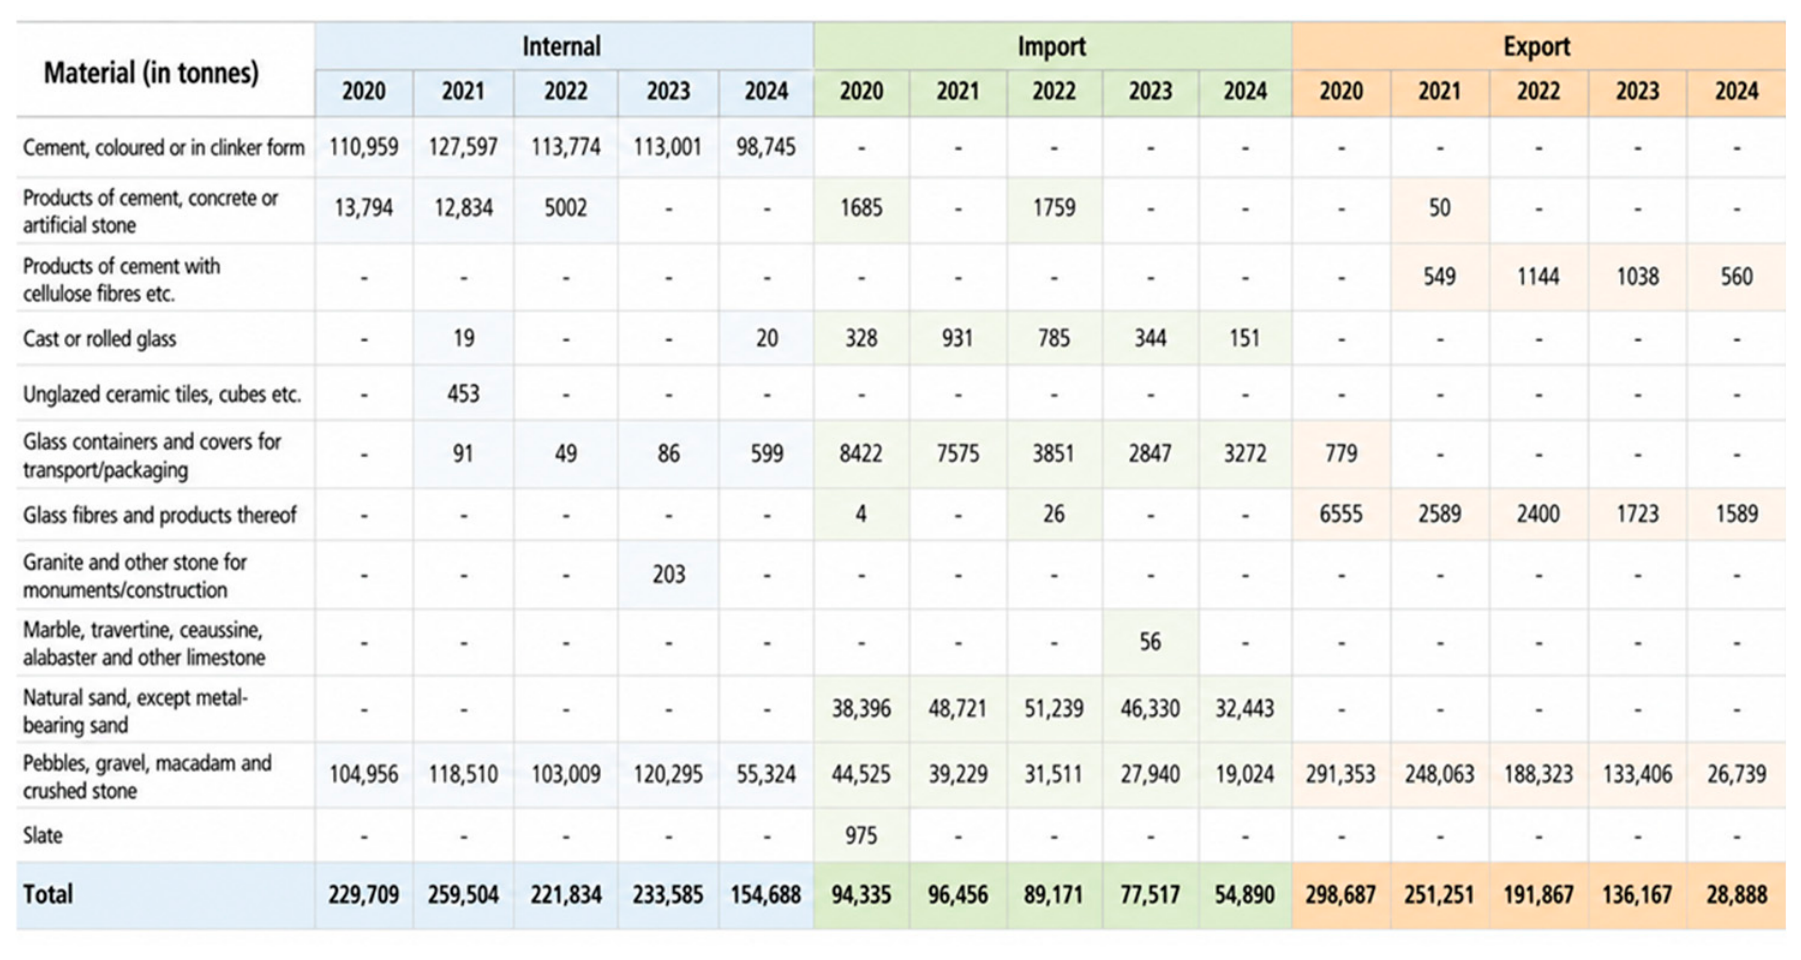
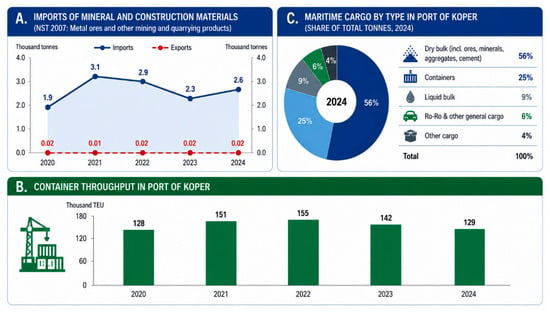
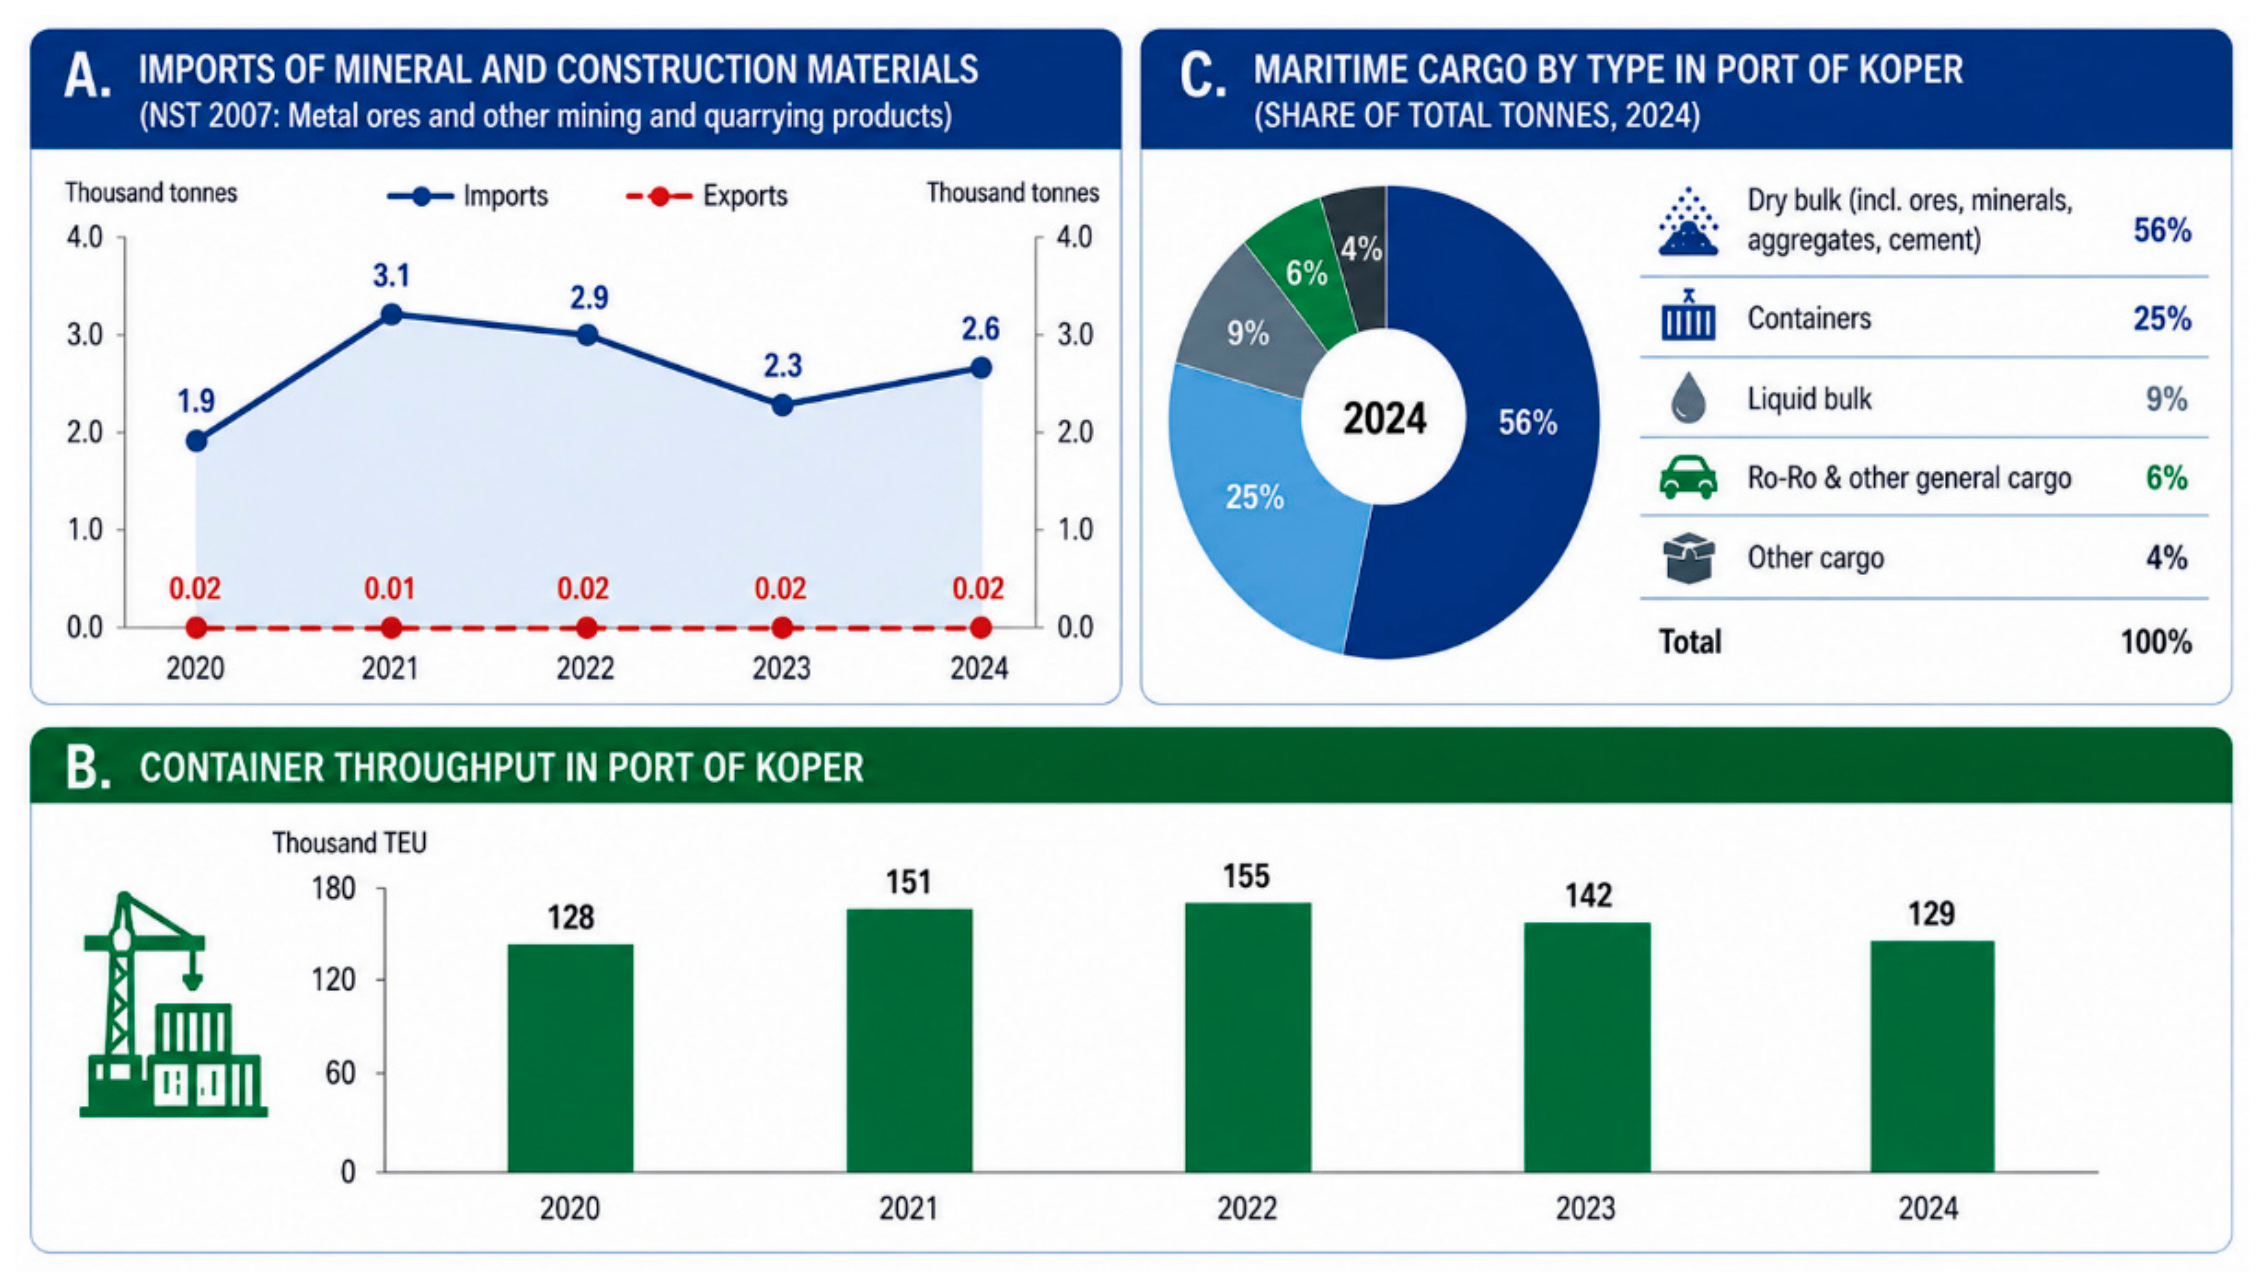
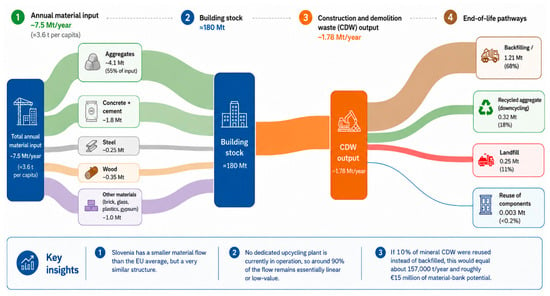
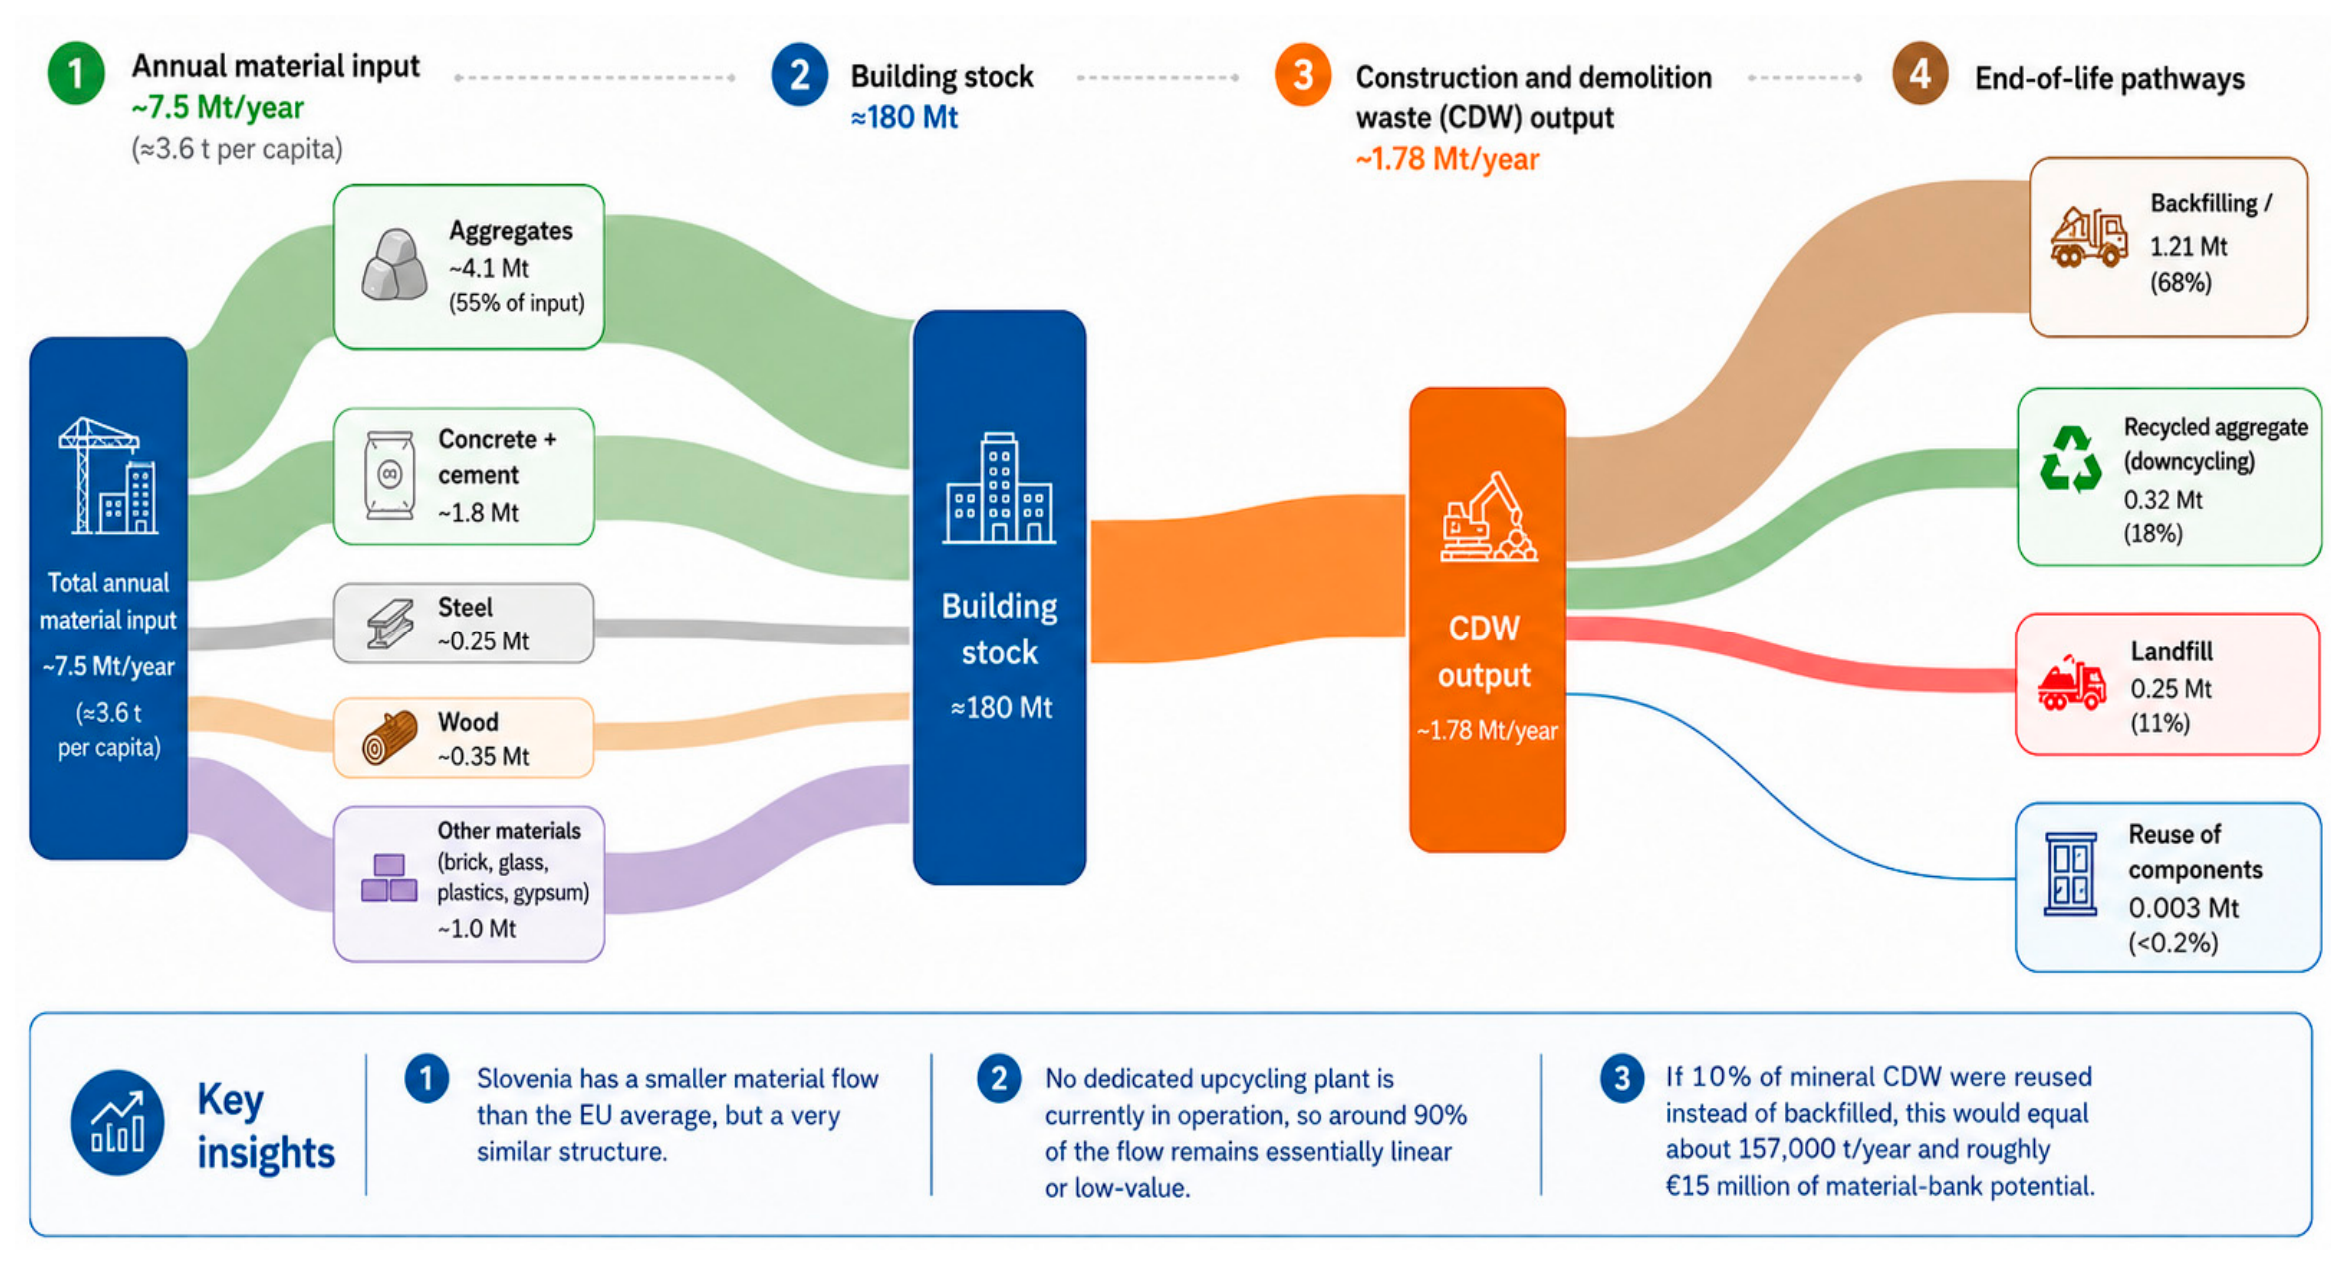
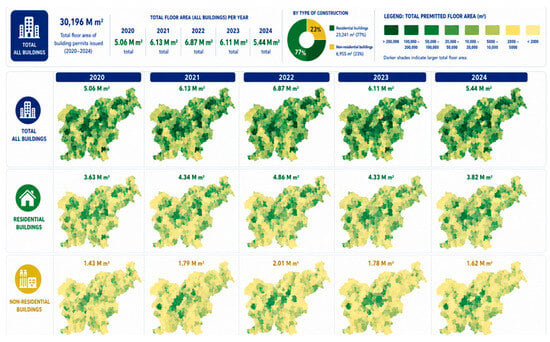
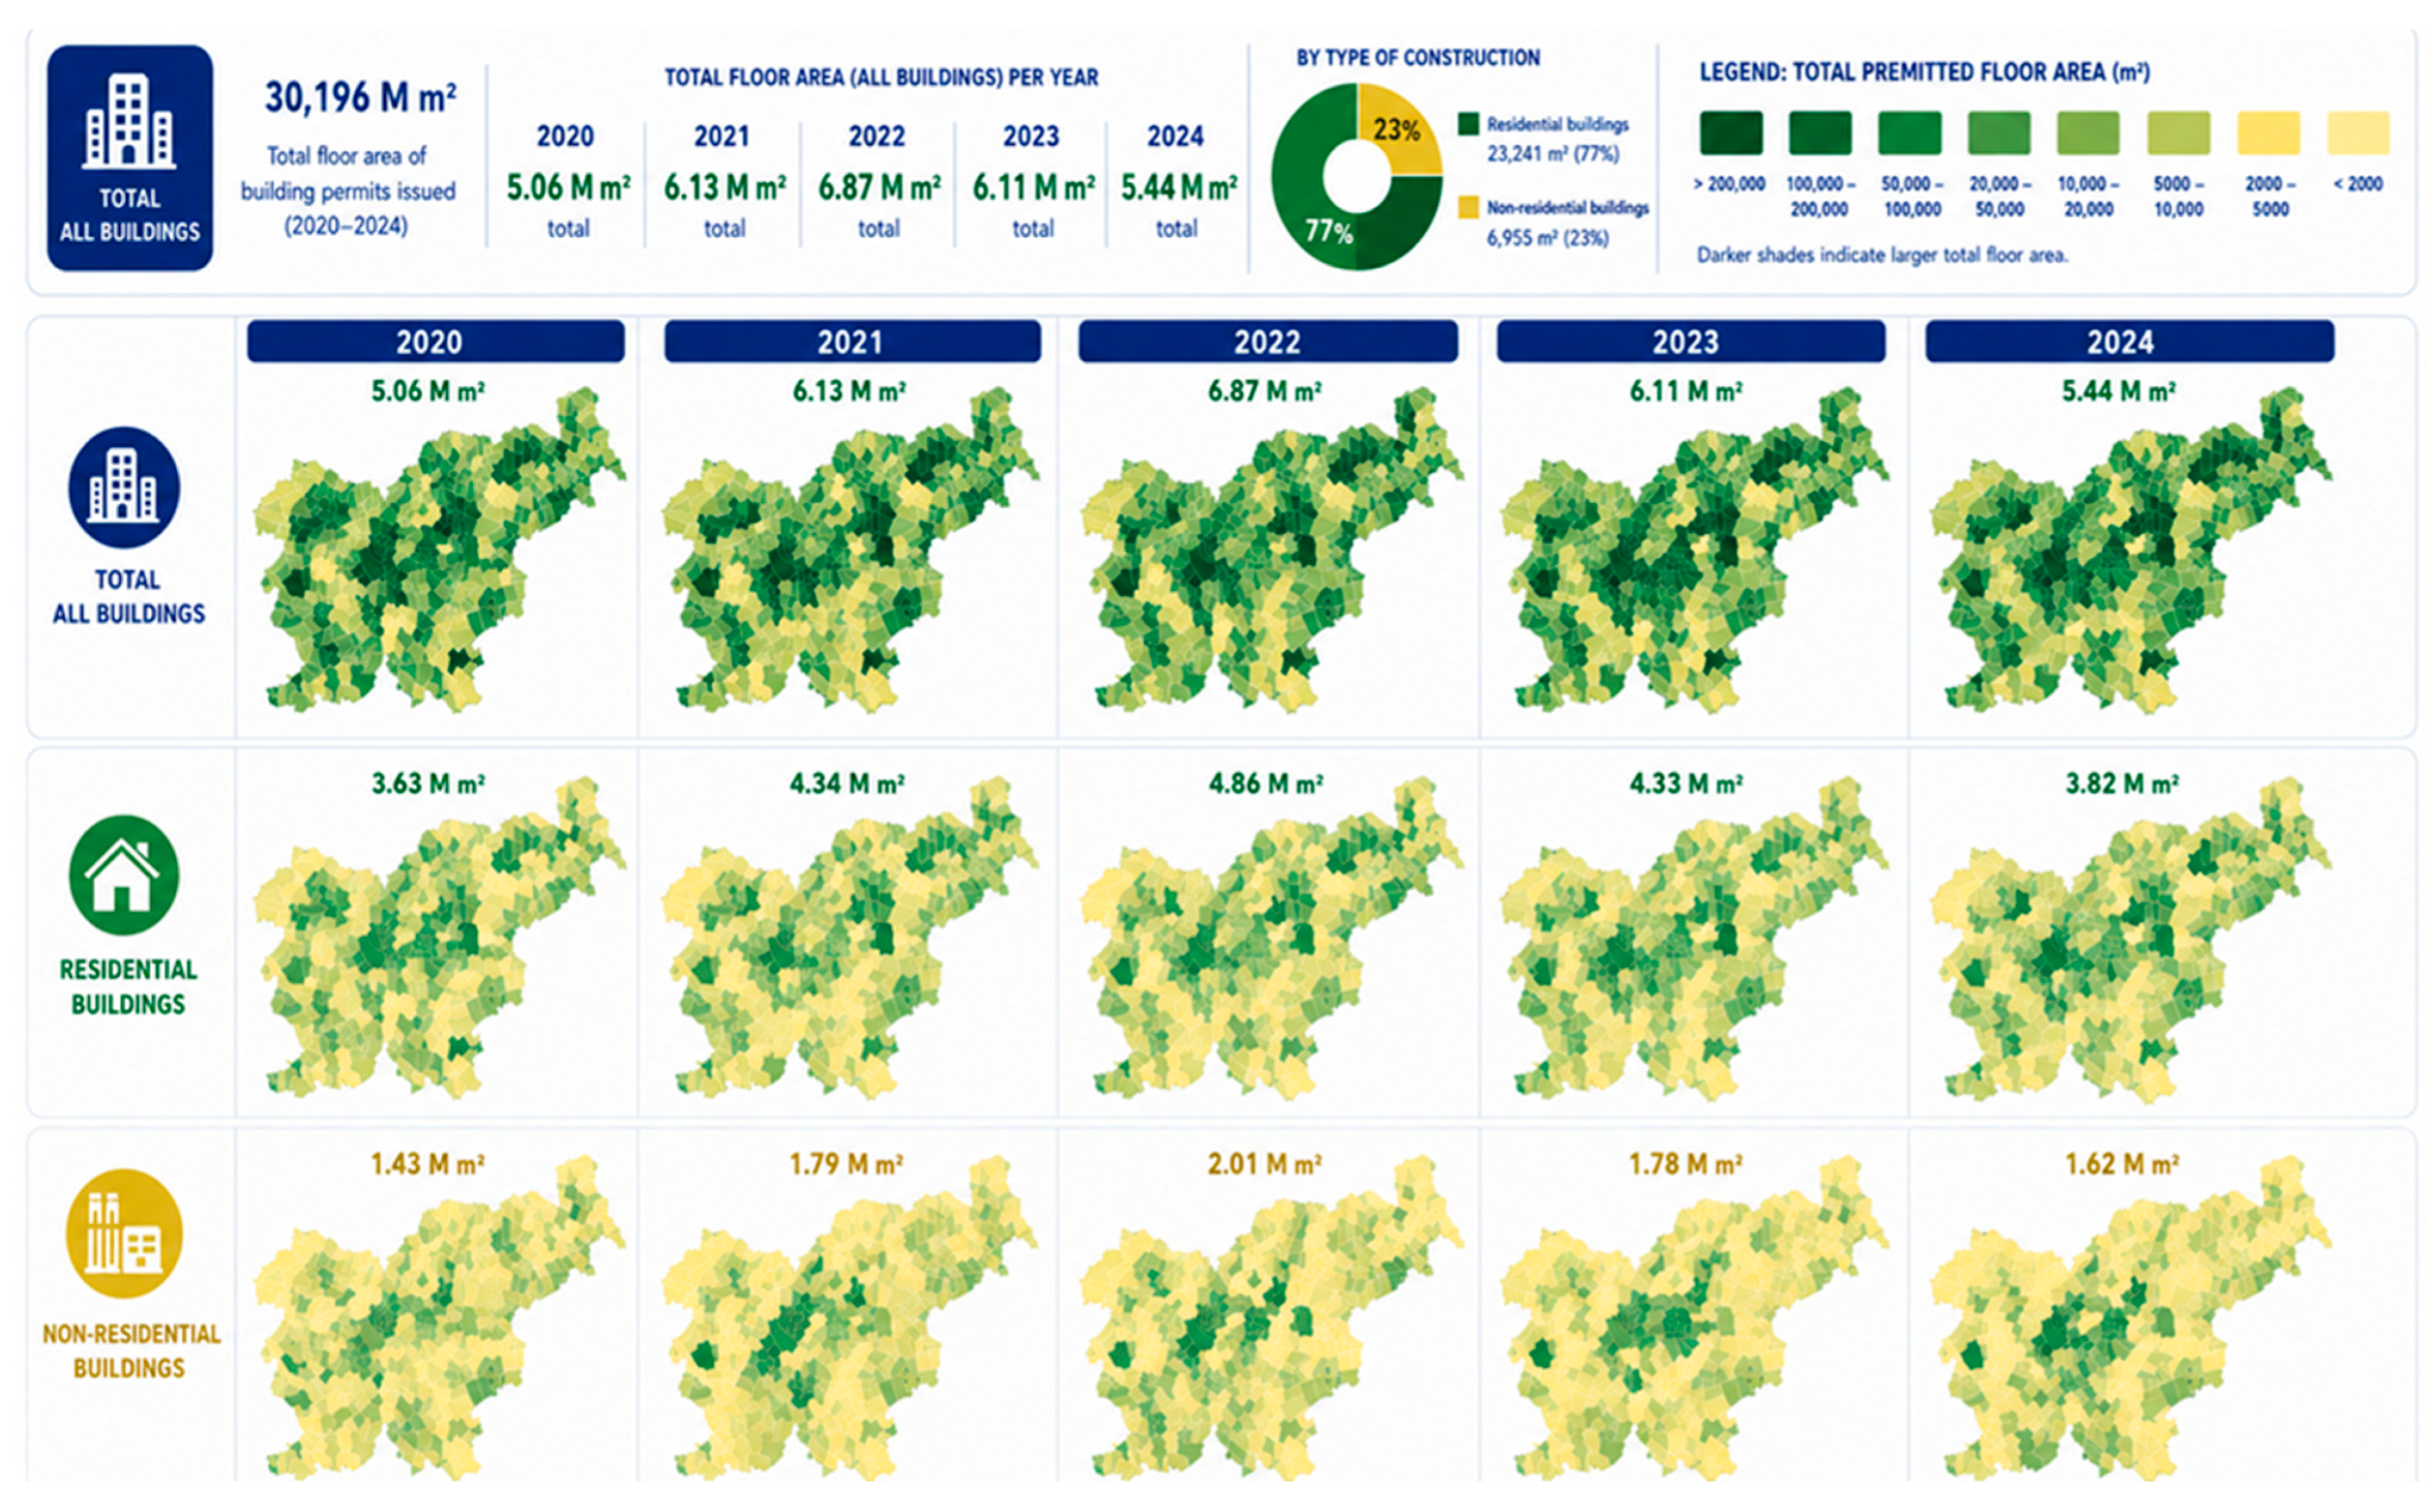
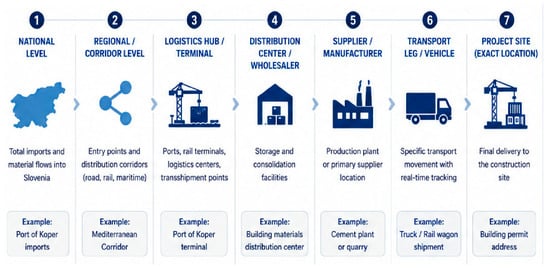
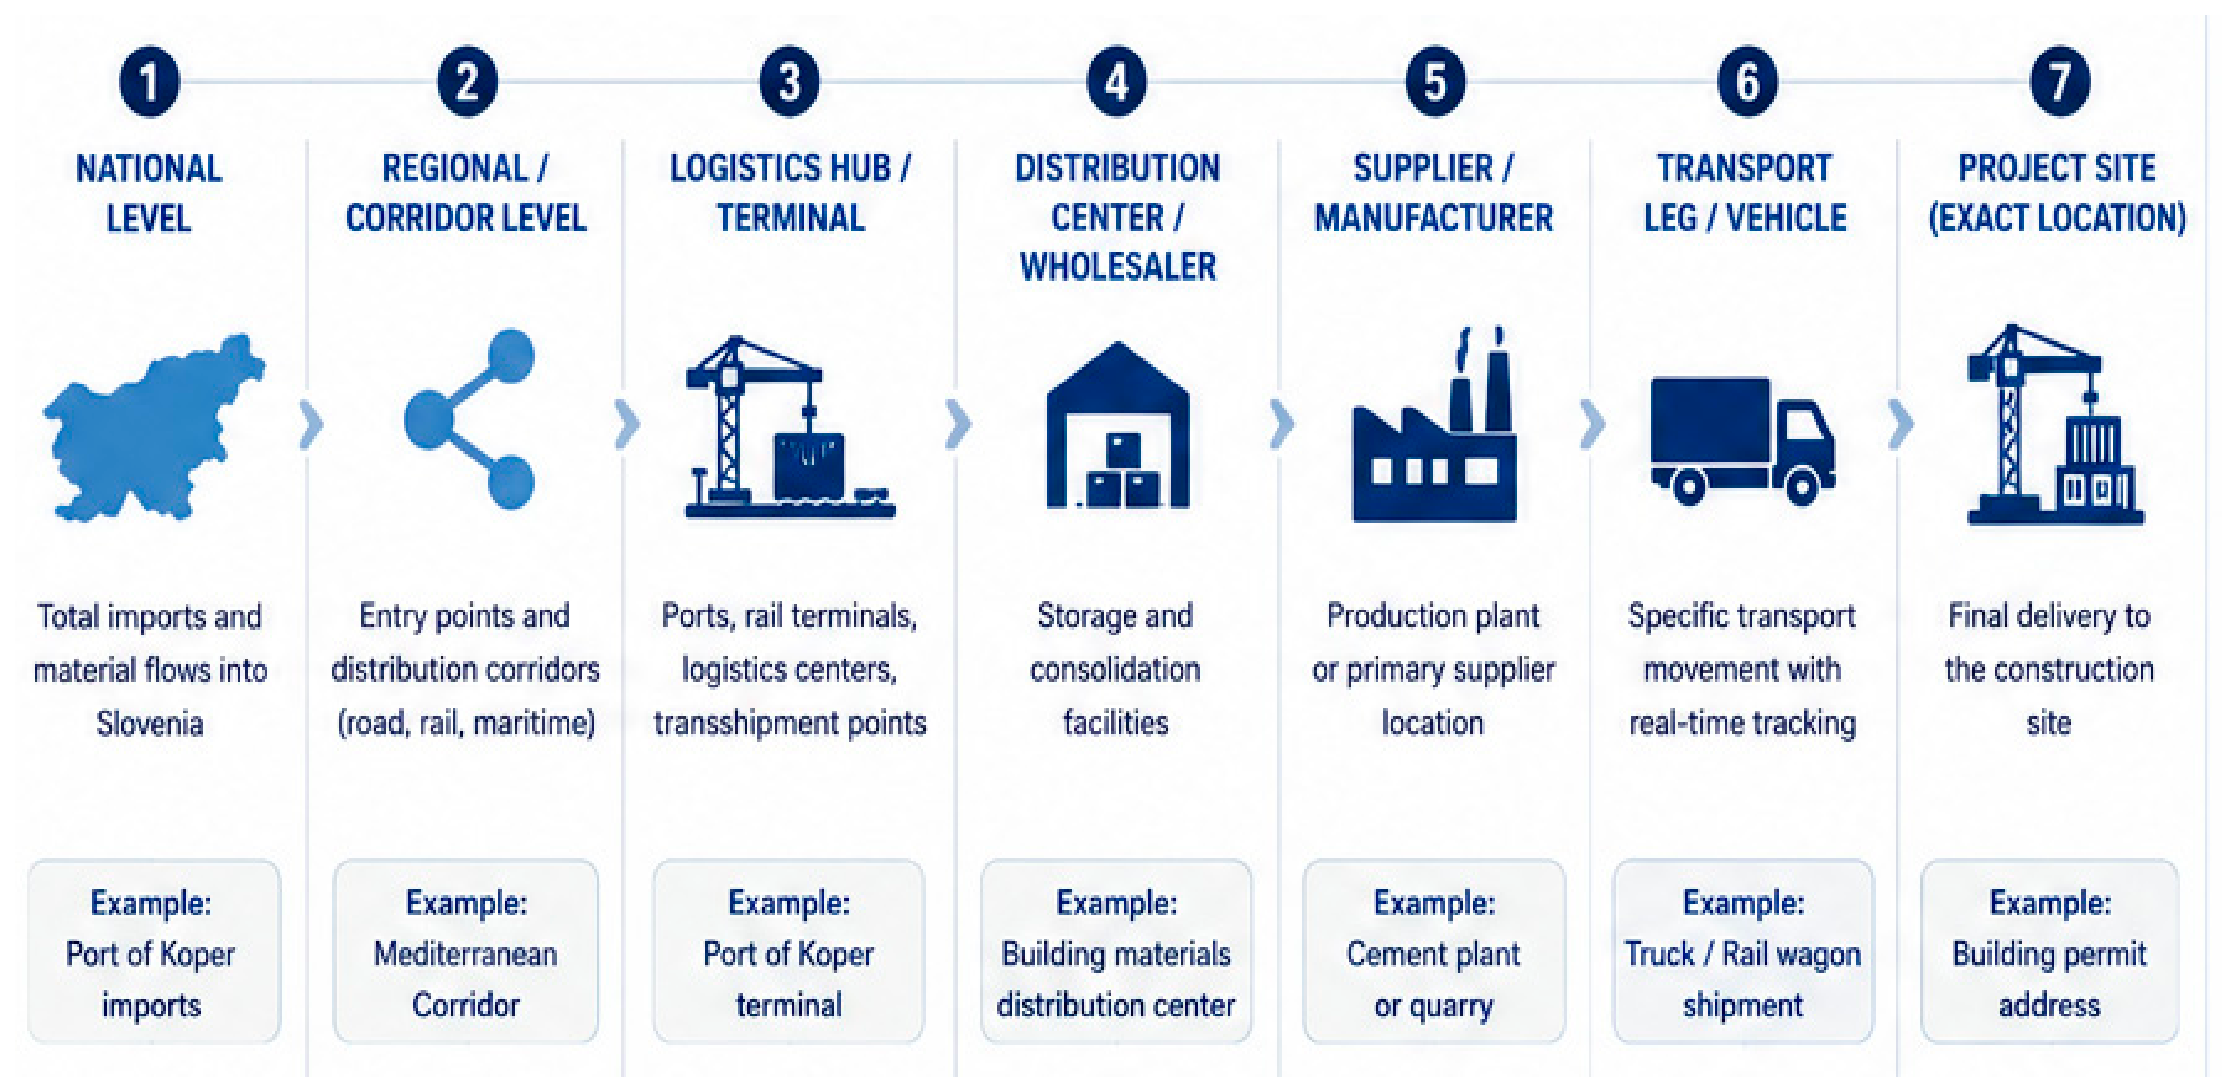
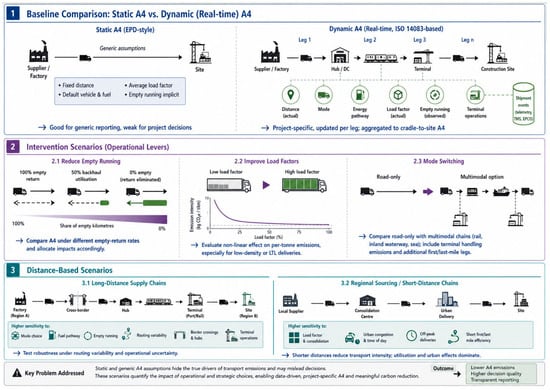
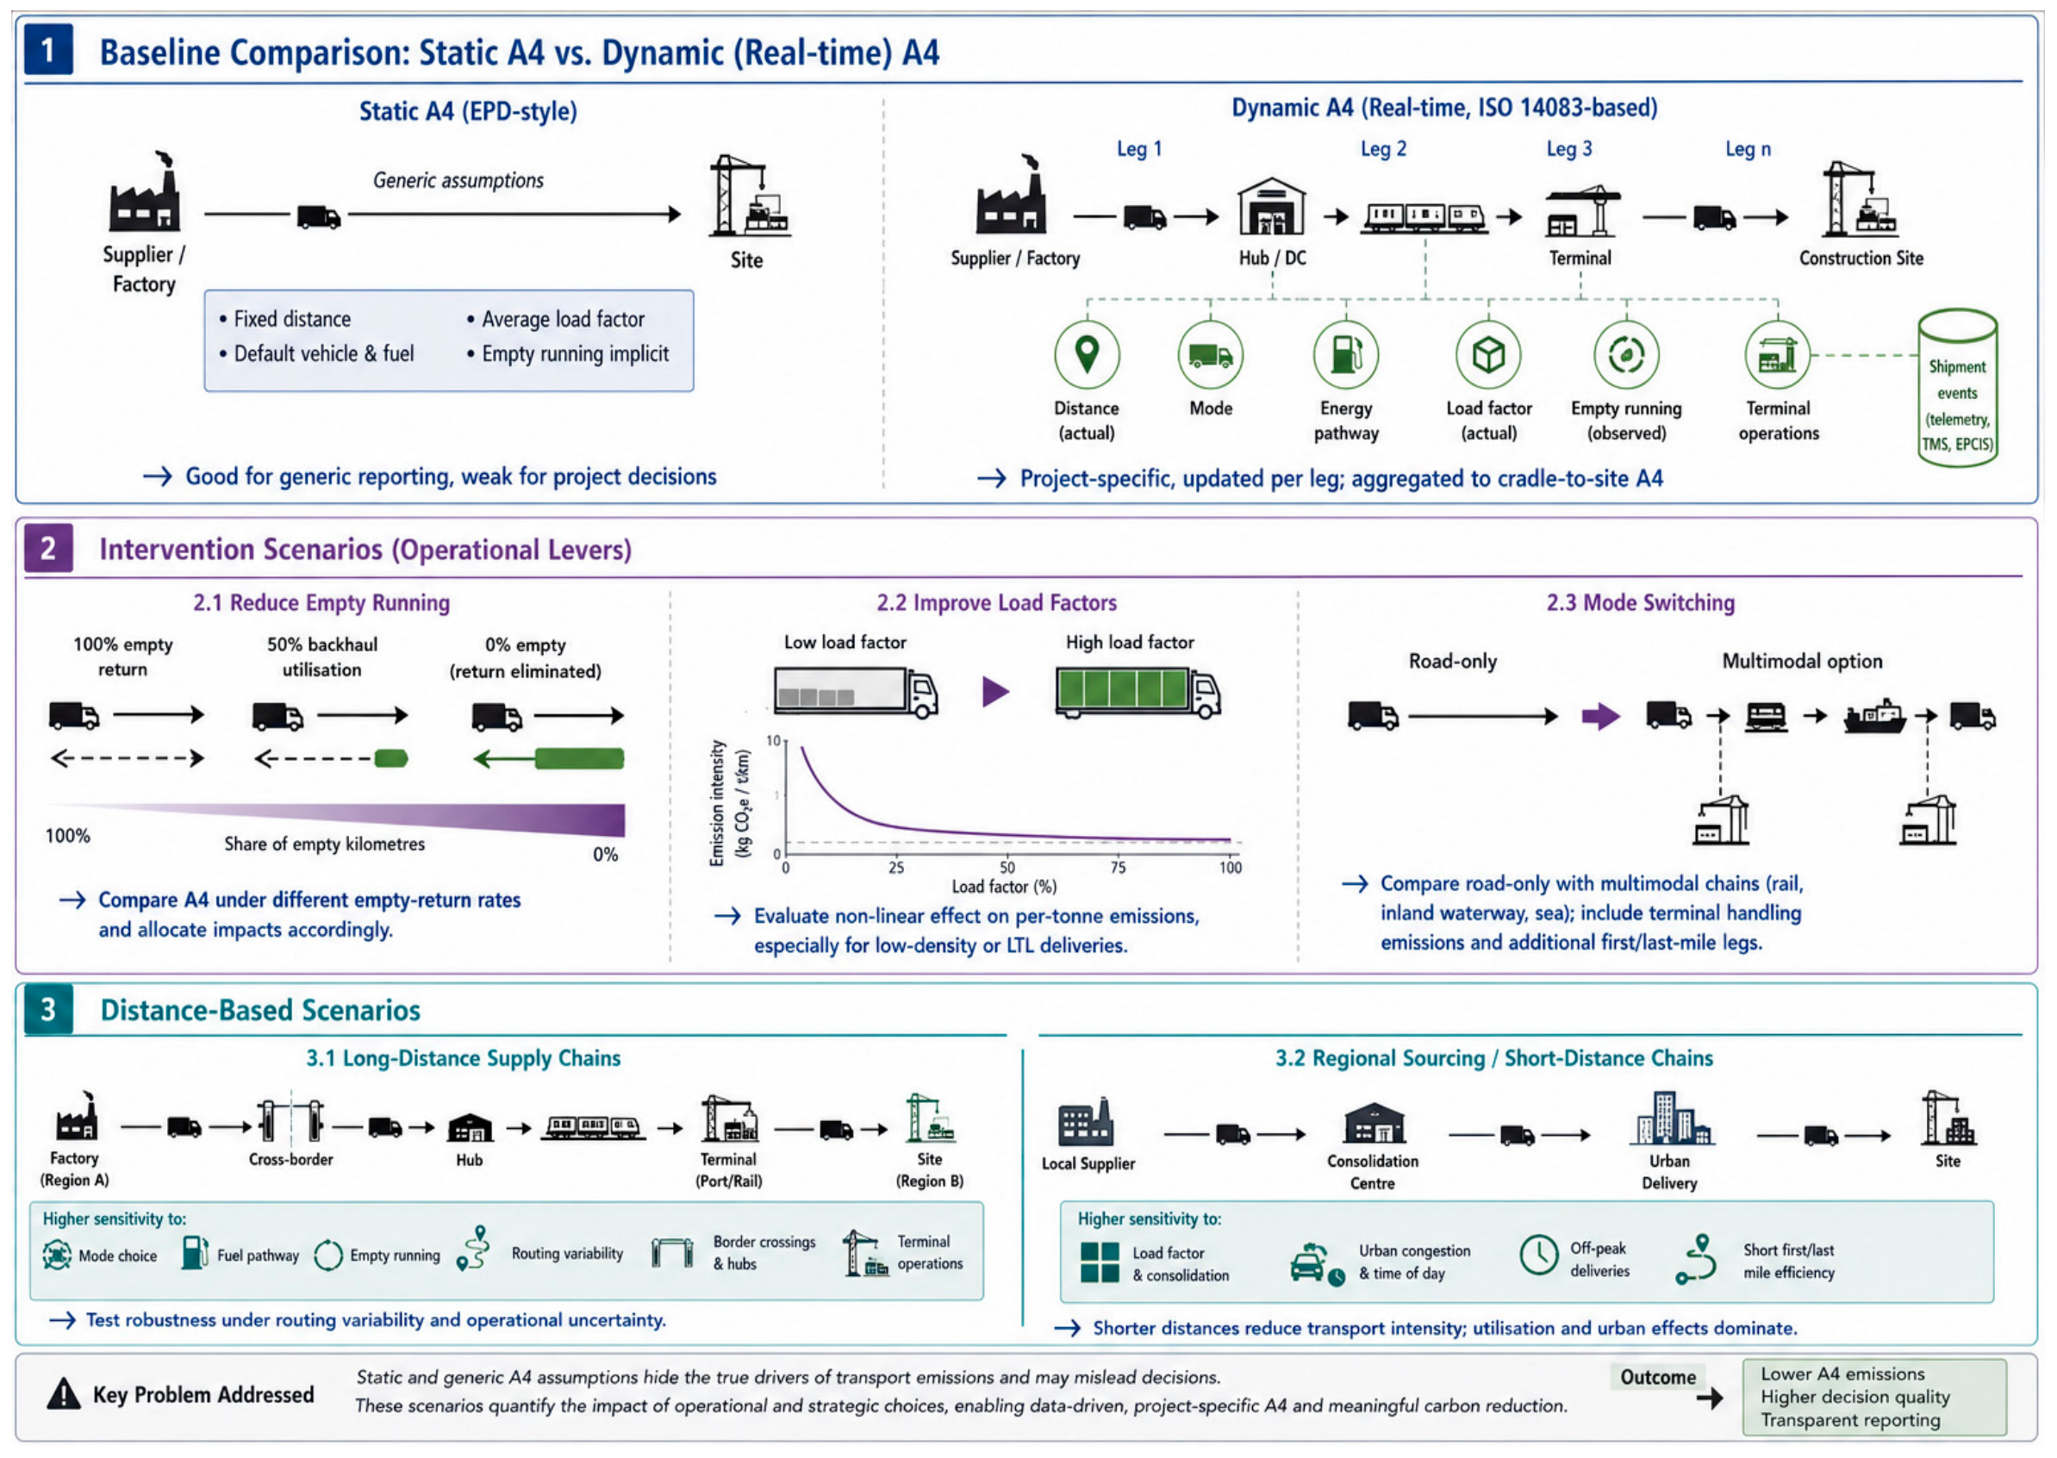
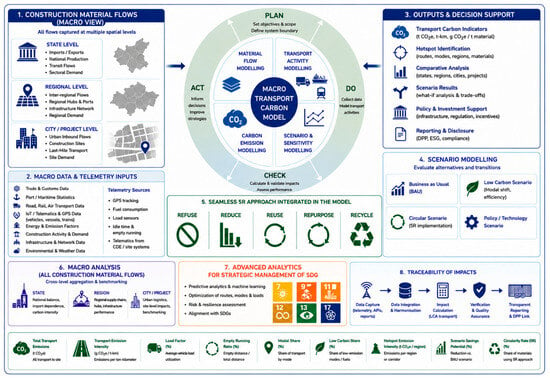
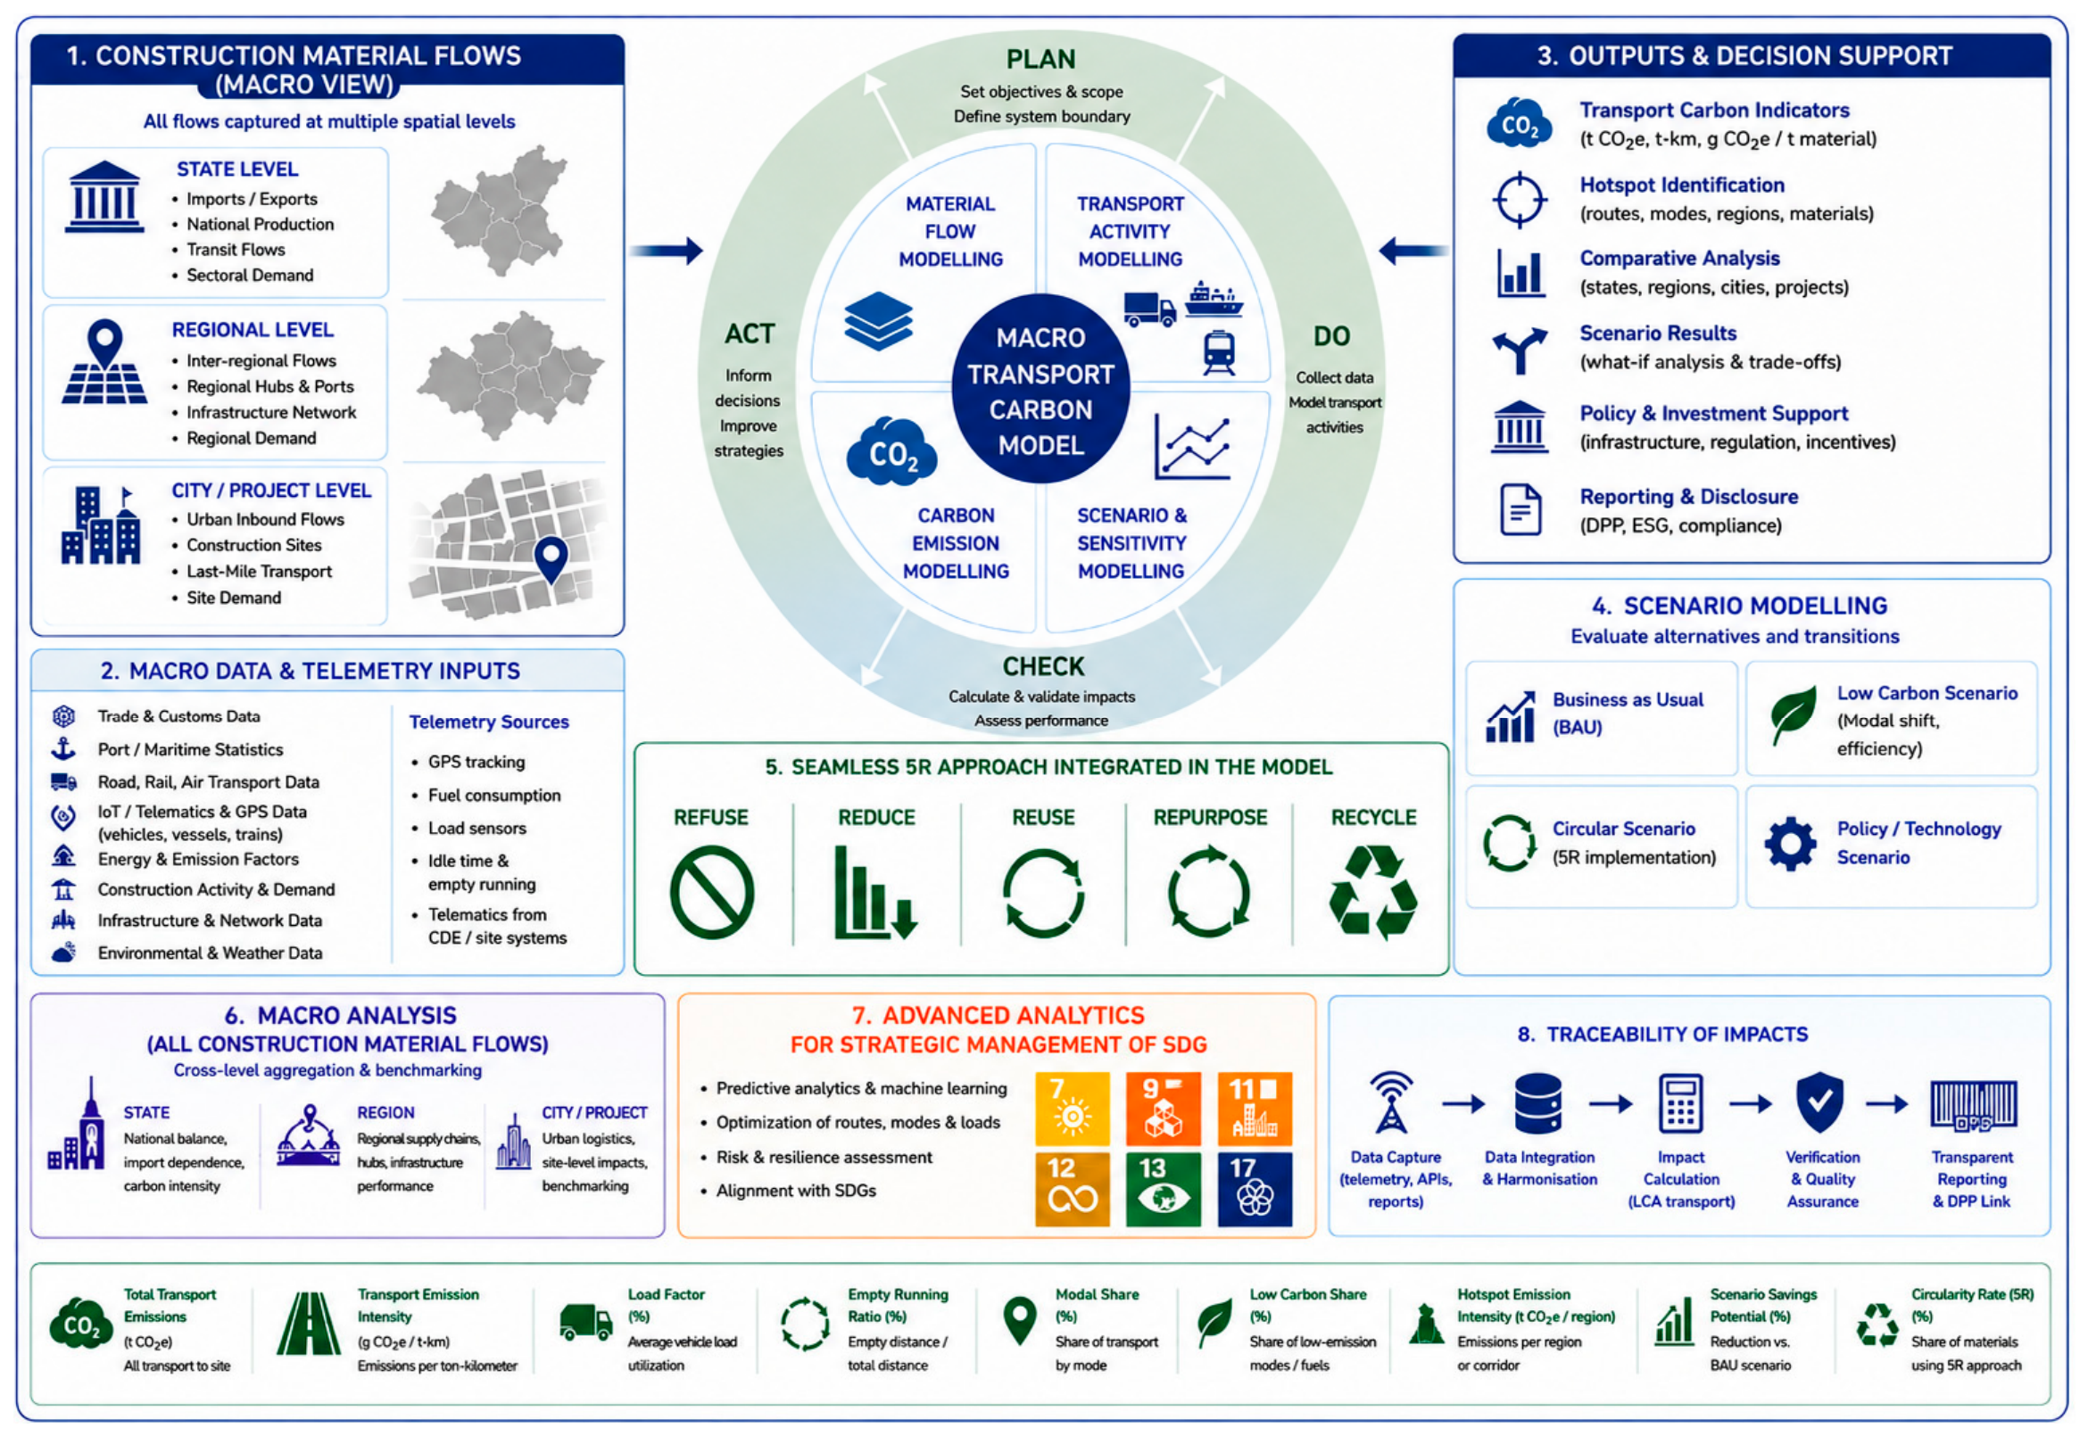

Disclaimer/Publisher’s Note: The statements, opinions and data contained in all publications are solely those of the individual author(s) and contributor(s) and not of MDPI and/or the editor(s). MDPI and/or the editor(s) disclaim responsibility for any injury to people or property resulting from any ideas, methods, instructions or products referred to in the content. |
© 2026 by the authors. Licensee MDPI, Basel, Switzerland. This article is an open access article distributed under the terms and conditions of the Creative Commons Attribution (CC BY) license.