


Abstract
Municipal solid waste (MSW) incineration with energy recovery is embedded in national decarbonization strategies but emits fossil CO2 from plastic-derived combustion, challenging the long-term sustainability of waste-to-energy systems. Carbon capture and utilization (CCU) offers a potential mitigation route, yet assessments rarely link technology economics, environmental performance, and the carbon-pricing instruments that would finance deployment. This study develops a break-even carbon-pricing framework integrating life-cycle CO2 emissions (LCCO2) and discounted annualized life-cycle cost (LCC; capital-recovery-factor annualization at a 4% real discount rate) for two CCU routes—methanation and methanol synthesis—applied to a 300 t/day Japanese incineration facility (84,000 t/y) under 2024 and 2050 energy-system conditions, thereby quantifying the environmental and the economic dimensions of sustainable CCU deployment in the waste sector. Two complementary indicators are distinguished: an incremental break-even carbon price, the price at which adding CCU to the existing waste-to-energy facility becomes economically neutral, and a plant-level cash balance price. Under the product-system boundary and photovoltaic-electrolysis hydrogen, both routes show lower life-cycle emissions than the baseline in both years; the magnitude—and, for methanation in 2024, the sign—of the net climate benefit depends on the downstream-use accounting boundary. The incremental break-even price for methanol falls from 20.3 × 10⁴ JPY/t-CO2 (≈1293 USD/t-CO2) in 2024 to 1.90 × 10⁴ JPY/t-CO2 (≈122 USD/t-CO2) in 2050, while that for methanation falls from 32.2 × 10⁴ JPY/t-CO2 to 0.75 × 10⁴ JPY/t-CO2 (≈48 USD/t-CO2)—about half the 2023 EU ETS average price—and approaches zero at approximately a one-third capital subsidy. This collapse is driven largely by the assumed hydrogen-price decline (100 → 20 JPY/Nm3); hydrogen-supply policy, rather than carbon pricing alone, therefore appears to be the dominant lever for making CCU at MSW incineration a viable contribution to sustainable, carbon-neutral waste management. Sensitivity analyses covering the discount rate (2–8%), plant scale (300–900 t/day), methane leakage, product-market absorption, and hydrogen delivered price premiums support the robustness of this sequencing conclusion.
1. Introduction
1.1. Waste-to-Energy in Carbon-Neutral Transitions
Municipal solid waste (MSW) incineration with energy recovery, or waste-to-energy (WtE), delivers two services that are difficult to substitute: hygienic disposal of residual waste streams and recovery of electricity or heat. At the same time, WtE is a non-trivial source of fossil CO2 emissions from plastic-derived combustion. Japan’s MSW sector emitted approximately 32 Mt-CO2-eq in 2022 [1], and the Ministry of the Environment has identified deep decarbonization of waste treatment as a critical pathway to the 2050 carbon-neutrality target [2]. WtE plants in the European Union, the United Kingdom, and East Asia face similar pressure as electricity grids decarbonize and the relative emission intensity of waste combustion rises [3,4].
1.2. Carbon Capture and Utilization at WtE Plants
Post-combustion carbon capture using monoethanolamine (MEA) is the most mature option for retrofitting WtE facilities [3]. Captured CO2 can be utilized rather than geologically stored—i.e., carbon capture and utilization (CCU)—by reaction with hydrogen to produce synthetic fuels or chemicals. The two most-studied pathways are methanation (the Sabatier reaction) and methanol synthesis [5,6]. Bisinella et al. [3] assessed carbon capture and storage (CCS) as a post-treatment technology in waste incineration and reported climate-change reductions of approximately 700 kg-CO2-eq per ton of waste under European conditions. Bisinella et al. [7] extended this analysis to the Amager Bakke plant in Copenhagen (600,000 t/y capacity), showing that CCS can shift a WtE plant from a net emitter to near-neutral or net-negative depending on the energy-system context. García-Luna and Ortiz [8] examined partial oxycombustion combined with amine capture for waste-to-methane conversion, reporting a nine-year payback under favorable power-purchase-agreement conditions. Moioli et al. [4] conducted a techno-economic assessment of the CO2 value chain for an Italian WtE plant, evaluating sequestration in the Adriatic Sea and sodium bicarbonate production. Tang and You [9] provided one of the earlier integrated environmental and economic assessments of MSW incineration with CCS for Chinese conditions.
1.3. The Existing Literature and Remaining Gaps
Three gaps remain in the literature relevant to policy and investment decisions. First, the dominant focus has been on technical feasibility and absolute LCCO2 reduction, with little attention to how technology economics compare against the carbon-pricing instruments that would finance deployment. Where economic assessment is included (e.g., [4,8]), it is conducted under fixed power-purchase-agreement or product-price assumptions rather than policy-coupled sensitivity. Second, most published assessments use a single energy-system snapshot (typically present-day conditions), although the economic and environmental performance of CCU is sensitive to hydrogen and electricity carbon factors that change substantially between 2024 and 2050 [10,11]. Treating CCU as a static technology obscures the question of when, and under what conditions, the route becomes feasible. Third, while subsidy regimes for carbon capture, utilization, and storage (CCUS) are widely discussed in policy documents [12], no published quantitative analysis links capital-expenditure (CAPEX) subsidies and carbon pricing to the marginal deployment economics of CCU at MSW incineration facilities. In particular, published break-even analyses often do not distinguish between the incremental cost of adding CCU to an existing facility—the quantity relevant to a marginal investment or policy decision—and the plant-level cash balance of the entire integrated facility, which additionally reflects the pre-existing economics of the host plant. Connecting LCCO2, life-cycle cost (LCC), and the carbon-price level required to break even within a single integrated framework, with these two questions kept explicitly separate, remains an open challenge.
1.4. Objective and Contribution
This study introduces a break-even carbon-pricing framework for CCU deployment at MSW incineration. Building on our prior environmental and economic assessment [13] and the broader treatment of these systems in the first author’s doctoral dissertation [14], we extend and methodologically refine the analysis to compute the carbon-pricing level required for economic neutrality under 2024 and 2050 scenarios, across two CCU routes (methanation and methanol synthesis) and five CAPEX subsidy cases, including the no-subsidy case. The framework distinguishes two break-even carbon-price (CP) indicators with different decision-making interpretations: the incremental CP, which measures the carbon price needed for the addition of CCU to break even against the existing WtE baseline (the marginal deployment question), and the plant-level CP, which measures the price needed for the whole integrated facility’s annual balance to reach zero (an operational question). The incremental indicator is treated as primary throughout. The environmental side of the framework is likewise reported under two accounting boundaries—the product-system (cradle-to-product (C2P)) convention and a stricter cradle-to-grave (C2G) bound—so that the sensitivity of any climate benefit claim to the downstream fate of the synthetic fuels is explicit. Together, these indicators link technology cost, environmental benefit, and policy thresholds, allowing transparent comparison against the internationally implemented carbon-pricing levels reported in the World Bank dataset used here [15]. Relative to those earlier assessments [13,14], the present study revises the hydrogen-supply carbon factor to a physically consistent photovoltaic-electrolysis basis, unifies the captured-CO2 accounting on a single carbon-balance-consistent quantity, and adds both the incremental-versus-plant-level break-even distinction and the cradle-to-product-versus-cradle-to-grave boundary sensitivity; these refinements revise the quantitative break-even levels relative to the earlier work and are the methodological contribution of this article. Section 2 describes the methods, Section 3 presents the results, Section 4 discusses implications and limitations, and Section 5 concludes. By quantifying both the environmental and the economic dimensions of CCU retrofits at municipal waste infrastructure—and the policy gap between them—the framework contributes to defining, measuring, and monitoring the sustainability transition of waste-to-energy systems under national carbon-neutrality targets.
2. Materials and Methods
2.1. System Boundary and Functional Unit
This study assesses the life-cycle CO2 emissions (LCCO2) and life-cycle cost (LCC) of an MSW incineration facility integrated with carbon capture (CC) and CCU under 2024 and 2050 conditions. The system boundary and inventory framework follow our prior assessment of CCUS at MSW incineration [13,14], with two additions central to the present study: (i) explicit modeling of the 2024–2050 transition in hydrogen and electricity carbon factors, and (ii) the break-even carbon-pricing analysis (Section 2.7). The system boundary is shown in Figure 1. The functional unit is one MSW incineration facility processing 84,000 t/y of waste (300 t/day × 280 days/y), corresponding to a representative scale for Japanese intermediate-size facilities (the Hikarigaoka facility, Tokyo, served as the reference plant). The boundary includes (i) waste combustion and electricity generation (the WtE process), (ii) post-combustion CO2 capture using MEA, (iii) liquefied-CO2 transport by road tanker over 50 km, and (iv) CCU conversion via methanation or methanol synthesis. Hydrogen for CCU is supplied externally from photovoltaic (PV) electrolysis. The MEA unit captures 90% of the total flue-gas CO2—both fossil and biogenic—and all of it is routed to CCU conversion. The main accounting boundary ends at the CCU product (cradle-to-product): captured CO2 is treated as a burden-free feedstock, the fossil CO2 removed from the flue gas is not charged to the CCU scenarios, and the downstream combustion of the synthetic fuels is not counted, while the product-substitution credit represents the avoided supply and use of the displaced fossil fuel. This convention is common in CCU life-cycle studies, but it is asymmetric for the fossil fraction of the captured carbon: that carbon is not permanently removed—it is re-emitted when the synthetic fuel is eventually burned—so the cradle-to-product boundary is favorable to CCU. To make the consequences of this choice explicit rather than implicit, all headline environmental results are accompanied by a cradle-to-grave bound in which the fossil-derived carbon embodied in the synthetic fuels is charged back at end use (Section 3.6 and Supplementary Materials Table S4). Capital goods (construction-phase emissions of the CC and CCU facilities) are included and annualized over equipment lifetime. Excluded are upstream waste collection and human-related operations. Following IPCC AR6 guidance [16], only fossil CO2 from combustion is counted as a positive emission in the LCCO2; biogenic combustion CO2 is treated as climate-neutral, and biogenic-CO2 capture is not credited as a negative emission.
Figure 1.
System boundary of the MSW incineration facility integrated with CO2 capture (MEA), CO2 transport, and CCU conversion via methanation (CCU-CH4) or methanol synthesis (CCU-MeOH). Solid arrows denote material flows; navy dashed arrows denote hydrogen inputs. The grey dashed pathway marks the cradle-to-grave bound reported as a boundary sensitivity (Section 3.6): synthetic fuel end use re-emits the product-embodied fossil carbon, which is not charged under the product-system boundary; the add-back is route- and year-specific and is reported in Section 3.6 and Supplementary Materials Table S8. Biogenic CO2 is climate-neutral, and its capture is not credited as permanent removal.
2.2. Scenario Design
Eight main scenarios combine two CCU routes (CH4 and CH3OH) with two reference years (2024 and 2050). Energy-system parameters were updated for each year (Table 1). The hydrogen price falls from 100 to 20 JPY/Nm3, the latter being the target of Japan’s Basic Hydrogen Strategy [10]. Rather than adopting an external hydrogen carbon factor, the hydrogen-production CO2 factor is derived internally from the assumed photovoltaic (PV) electrolysis route as (electrolyzer-specific energy) × (PV electricity carbon factor) plus a small electrolyzer-embodied term, giving 3.20 kg-CO2/kg-H2 in 2024 and 0.90 in 2050. This keeps the hydrogen factor consistent with the study’s own PV electricity assumptions and within the range reported for PV-electrolysis hydrogen in the life-cycle literature (1.75–3.82 kg-CO2/kg-H2 [17]). Two policy-sensitivity analyses were added: (i) CAPEX subsidy at five levels, including no subsidy (s = 0, 1/3, 1/2, 2/3, and 1), following the structure of Japan’s existing decarbonization-infrastructure subsidies, applied to the combined CC + CCU facility CAPEX; and (ii) carbon-pricing sensitivity computed continuously to identify the break-even level under each subsidy condition (Section 2.7). For 2050, the facility’s own power demand is also reduced to approximately 100 kWh per ton of waste (from about 290 kWh/t in 2024), and both the purchased and the displaced (grid-avoided) electricity are evaluated using an effective net-zero-aligned grid CO2 factor of 0.070 kg-CO2/kWh. This value is used as a scenario assumption for the 2050 electricity terms, rather than as a direct average emission factor derived from a specific published power-mix table; the resulting electricity terms are reported in the reproducible workbook (Supplementary Materials).
Table 1.
Scenario and energy-system parameters for the 2024 and 2050 reference years.
2.3. Inventory Data
Inventory data are summarized in Table 2; detailed emission factors are given in Supplementary Materials Table S1. Waste composition is based on Japanese national average data (24% plastic share in 2024), giving a fossil CO2 emission factor of 0.315 kg-CO2/kg-waste. The lower heating value (LHV) is 8322 kJ/kg-waste for 2024 [19] and 6592 kJ/kg-waste for 2050, reflecting projected reductions in plastic content under the 2050 waste-composition projection [20]. The source inventory holds the total flue-gas CO2 constant across the two years (74,621 t/y): the lower plastic-derived fossil carbon of the 2050 composition is offset by a correspondingly higher biogenic share, so the year effect enters through the fossil/biogenic split and the lower heating value (Supplementary Materials Table S8). Generation efficiency is 20.5% without CC and 13.9% with CC integrated, the reduction reflecting steam extraction for MEA regeneration. CC operating parameters are from Bisinella et al. [3]: 90% capture efficiency, 15 kWh/t-CO2 regeneration power, 3.15 GJ/t-CO2 regeneration heat, 65 kWh/t-CO2 compressor power, and 2.4 kg/t-CO2 MEA make-up. CO2 transport is modeled as 50 km road haulage by 22 t-capacity tankers at a 75% loading rate; the sensitivity to transport distance is reported in Supplementary Materials Table S5. The MEA unit captures 90% of the total flue-gas CO2 (fossil plus biogenic), amounting to 67,169 t-CO2/y, all of which is routed to CCU conversion. CCU process data for methanation are from Navajas et al. [22]: 2.94 kg-CO2 consumed per kg-CH4, comprising the stoichiometric 2.75 kg-CO2/kg fixed in the product and a 0.19 kg-CO2/kg process loss, with 0.51 kg-H2/kg-CH4 and 0.33 kWh/kg-CH4. Routing the full captured stream through methanation therefore yields 67,169/2.94 = 22,847 t-CH4/y, a hydrogen demand of 11,652 t-H2/y, and a process CO2 loss of 4341 t/y. Methanol synthesis data are from Khojasteh-Salkuyeh et al. [23]: with the stoichiometric requirement of 1.375 kg-CO2/kg-CH3OH and a 7.0% process CO2 loss, the captured stream yields 45,431 t-MeOH/y, a hydrogen demand of 9222 t-H2/y (0.203 kg-H2/kg including conversion losses), and a process loss of 4702 t-CO2/y. The complete mass balances of both routes—including the closed fossil-carbon balance, in which uncaptured, process-loss, and product-embodied fossil CO2 sum exactly to the fossil combustion CO2—are reported in Supplementary Materials Table S8 and the calculation workbook. CCU products substitute fossil-fuel equivalents on a one-to-one mass basis: synthetic methane substitutes fossil natural gas (2.69 kg-CO2/kg-CH4 avoided in 2024, declining to 2.14 by 2050 as gas supply chains decarbonize), and synthetic methanol substitutes fossil-derived methanol (1.50 kg-CO2/kg in 2024; 1.19 in 2050). All emission factors are from the Japanese Carbon Footprint Database v4.0 [21] unless otherwise specified. The substitution factors (2.69 kg-CO2/kg-CH4 against natural gas; 1.50 kg-CO2/kg-MeOH against fossil methanol) represent the avoided conventional supply and use of the displaced fossil fuel; because the downstream combustion of the synthetic fuels themselves is not charged under the cradle-to-product boundary, the fossil-carbon asymmetry that this combination creates is quantified separately in Section 3.6. Downstream methane leakage during distribution or end use of the substituted natural gas is not modeled as an independent parameter; the CCU-CH4 substitution credit is conditional on the selected natural-gas emission factor, and additional leakage would reduce the net benefit of the methanation route (see Section 4.5).
Table 2.
Key inventory and cost parameters (full emission-factor list in Supplementary Materials Table S1).
2.4. Life-Cycle CO2 Emissions (LCCO2) Calculation
LCCO2 is calculated as the algebraic sum of fossil CO2 emissions and credits across all system processes:
LCCO2 = Ecombustion + Eutility + Ecapital,annualized + Ecapture + Etransport + ECCU,operation − Edisplaced,electricity − Edisplaced,product
Here, Ecombustion is the fossil CO2 emission from waste combustion; Eutility covers ancillary chemicals and reagents (lime, ammonia, activated carbon, etc.); Ecapital,annualized is the construction-phase emission divided by equipment lifetime (30 years for CC; 20 years for CCU); Ecapture and ECCU,operation are the operational emissions of CO2 capture and CCU conversion; Etransport is the emission from CO2 haulage; Edisplaced,electricity is the credit from grid electricity displaced by WtE generation; and Edisplaced,product is the credit from fossil-fuel substitution by CCU products. Capital-goods emissions are based on construction-phase material and energy inputs from the Carbon Footprint Database v4.0 [21]. The formulation matches our prior LCCO2 assessment of small-scale CCU systems [24], where the same accounting structure was applied to a direct-air-capture-and-utilization (DACCU) plant. Biogenic CO2 captured via MEA is not credited in the main LCCO2 (fossil-only accounting). Consistently, the CO2 process losses of the CCU conversion are charged at their fossil share (35.5% in 2024 and 14.0% in 2050, the fossil fraction of the captured stream); the biogenic share of those losses is climate-neutral under the same convention. Under this cradle-to-product formulation, the CCU scenarios carry no Ecombustion term for the captured share of the flue gas: the captured fossil CO2 is treated as removed from the inventory. Because that carbon is embodied in a fuel and re-emitted at end use, Equation (1) is complemented by a cradle-to-grave bound, obtained by adding back the captured fossil CO2 as a positive term. The add-back comprises the fossil carbon embodied in the synthetic product only: because the fossil share of the CCU process loss is already charged as an emission in Equation (1), adding back the full captured fossil quantity would count that loss twice. The add-back is also year-specific, because the projected 2050 waste composition contains a lower plastic share and therefore less fossil carbon: the waste-combustion fossil CO2 is 26,475 t-CO2/y in 2024 and 10,416 t-CO2/y in 2050 (source inventory; Supplementary Materials Table S8), giving product-embodied fossil add-backs of 22,288 t-CO2/y (CH4) and 22,160 t-CO2/y (CH3OH) in 2024, and 8769 and 8718 t-CO2/y in 2050. With this convention, the fossil-carbon balance closes exactly in every scenario: uncaptured fossil CO2, the fossil share of process losses and product-embodied fossil CO2 sum to the fossil combustion CO2 (Supplementary Materials Table S8). The two accounting boundaries are compared in Section 3.6 and Supplementary Materials Table S4.
2.5. Life-Cycle Cost (LCC) Calculation
The LCC used in this study is an annualized net cost balance: the annual net economic balance of the integrated facility, in million JPY per year (M JPY/y), with capital costs converted to equivalent annual charges using the capital recovery factor (CRF), CRF = r(1 + r)n/[(1 + r)n − 1], where r is the real discount rate and n is the equipment lifetime. The base case uses r = 4%, the social discount rate prescribed for public-works evaluation in Japan [25], and the pre-tax internal rate of return assumed for municipal waste-power projects in Japan’s feed-in-tariff price setting [26]; sensitivity to r = 2% (the low-interest reference value introduced in the 2023 revision of the guideline [25]) and r = 8% (the standard assumption of the IEAGHG cost-evaluation guidelines for CO2 capture systems [27]) is reported in Section 3.7 and Supplementary Materials Table S9. Lifetimes are 30 years for the incinerator and the capture plant, within the 20–30-year service life of Japanese incineration facilities under periodic major renewal [28], and 20 years for the CCU units, consistent with techno-economic assessments of CO2 methanation and methanol synthesis. Because the annual balance is stationary, CRF annualization is mathematically equivalent to a zero-net-present-value levelized evaluation over the equipment lifetime; the break-even prices below are therefore levelized, discounted quantities. The balance is as follows:
LCC = Rwaste fee + RCCU product − (CAPEXannualized + OPEXutility + OPEXmaintenance + OPEXpersonnel + OPEXtransport)
Capital costs of the CC and CCU facilities are scaled from reference designs using the 0.6 power law [29]:
Costproject = Costreference × (Capacityproject/Capacityreference)0.6
An installation-cost factor of 4.74, based on the Lang-type factors of Towler and Sinnott [30], is applied to the equipment cost to estimate the installation (construction) cost, which is then added to the equipment cost to obtain the total installed cost; this additive convention is conservative relative to applying the factor to span the total installed cost. For the CC unit, the reference scale is 700 t-CO2/h; after 0.6-power scaling and Lang multiplication, the project-scale total installed cost is approximately 5025 M JPY, comprising an equipment cost of 875.5 M JPY and a construction (installation) cost of 4149.7 M JPY. Annualized with the CRF at r = 4% over a 30-year lifetime (CRF = 0.0578), this yields a CC CAPEX charge of 290.6 M JPY/y (167.5 M JPY/y under straight-line annualization). The CCU-CH4 unit is scaled from a reference design (9250 M JPY project-scale installed cost, 20-year lifetime, CRF = 0.0736), giving an annualized CAPEX of 680.3 M JPY/y (462.3 M JPY/y straight-line). The CCU-CH3OH unit is scaled from the LSC report [31] (6340 M JPY reference-scale cost at 1120 t-MeOH/day, scaled down by the 0.6-power law to the project scale, 20-year lifetime), giving an annualized CAPEX of 160.2 M JPY/y (108.8 M JPY/y straight-line). CO2 capture quantity is scaled linearly with project size (not via the 0.6 power law) because it is a flow-based parameter. OPEX components are hydrogen procurement, electricity (purchased at 19.7 JPY/kWh), ancillary chemicals, maintenance (a fixed percentage of CAPEX), personnel, and transport. Consistent with the reference cost model, the WtE generation is treated as self-consumed by the plant and its integrated CC/CCU loads, so no net electricity export is credited. Revenue components are therefore waste tipping fees (27.88 JPY/kg) and synthetic-fuel sales at market-equivalent prices (CCU-CH4: 128.6 JPY/Nm3 natural gas equivalent; CCU-CH3OH: 52,000 JPY/t).
2.6. Subsidy Sensitivity Analysis
The CAPEX subsidy is applied to the combined CC + CCU annualized capital cost. Five subsidy cases, including the no-subsidy case (s = 0, 1/3, 1/2, 2/3, 1), are evaluated. The subsidized LCC of the integrated CCU facility—expressed relative to its own unsubsidized balance LCCCCU,unsubsidized (the net balance of Equation (2)) and distinct from the WtE-only baseline LCCWtE,baseline used in Equations (5) and (6)—is as follows:
LCCCCU,subsidized = LCCCCU,unsubsidized + s × CAPEXannualized,combined
Subsidies based on operating expenditure (OPEX), such as a hydrogen price subsidy, are not modeled in the main scenarios in order to isolate the effect of CAPEX-based intervention; their potential effect is discussed in Section 4.3.
2.7. Break-Even Carbon Price (CP) Analysis
Two break-even carbon-price indicators are defined, answering two different questions. The primary indicator is the incremental break-even carbon price, which asks: given an existing WtE facility, what carbon price would make the addition of CC + CCU economically neutral relative to continuing baseline operation?
CPBE,inc = −(LCCCCU,subsidized − LCCWtE,baseline)/ΔLCCO2 × 100 [104 JPY/t-CO2]
Here, LCCCCU,subsidized is the subsidized annual balance of the integrated WtE + CCU facility (Equation (4)), LCCWtE,baseline is the annual balance of the unmodified WtE facility (−1783 M JPY/y under the discounted cost model of Section 2.5; −640 M JPY/y under undiscounted straight-line annualization), and ΔLCCO2 = LCCO2WtE,baseline − LCCO2CCU is the LCCO2 reduction (positive when CCU reduces emissions, t-CO2/y) achieved by the CCU pathway relative to the WtE-only baseline, evaluated under the cradle-to-product boundary. A positive CPBE is reported only when the relevant annual balance is negative; when the incremental balance is zero or positive (ΔLCC ≥ 0), the CCU addition is economically neutral or favorable without carbon pricing, and the result is reported as “not required” rather than as a negative price. The factor 100 converts M JPY/t-CO2 to 104 JPY/t-CO2, the standard reporting unit in the Japanese carbon-pricing literature (104 JPY = 1 man-yen). Because both numerator and denominator are increments over the same baseline, CPBE,inc is a marginal abatement cost in the sense of the marginal-abatement-cost-curve literature [32] as applied to CO2 capture systems [33], and it is insensitive to the baseline facility’s pre-existing profit or deficit.
The auxiliary indicator is the plant-level cash balance carbon price, which asks: what carbon price, credited to the same ΔLCCO2, would bring the whole integrated facility’s annual balance to zero?
CPBE,plant = −LCCCCU,subsidized/ΔLCCO2 × 100 [104 JPY/t-CO2]
CPBE,plant exceeds CPBE,inc whenever the baseline facility itself runs a deficit, because the carbon revenue must then also cover the pre-existing shortfall; it is an operational funding indicator for the facility owner, not a measure of the marginal cost of abatement, and the two must not be conflated. Results in Section 3.4 report CPBE,inc as the headline indicator, with CPBE,plant provided for completeness (Supplementary Materials Table S6). Both indicators use the cradle-to-product ΔLCCO2 in the denominator for consistency with the primary model; boundary-consistent values computed on the stricter cradle-to-grave denominator are reported as a sensitivity in Section 3.6 and Supplementary Materials Table S7. Carbon-pricing regimes vary across jurisdictions (carbon taxes, emissions trading systems, voluntary credits); both indicators are therefore treated as regime-agnostic gap measures. International carbon-price benchmarks are taken from the World Bank Carbon Pricing Dashboard [15] and tabulated in Supplementary Materials Table S2. Currency conversion uses 1 USD = 156.7 JPY (interbank rate, 23 May 2024).
2.8. Use of Generative Artificial Intelligence
A generative AI assistant (Claude, Anthropic; versions Opus 4.8, Fable 5, and Opus 5; https://claude.ai, accessed on 5 July 2026) was used to help implement the calculation workbook and the figure-generation scripts, to check the bibliographic metadata of the cited sources, and to edit the language of the manuscript. It was not used as a source of data or emission factors: all input values were taken from the cited literature and public statistics and were verified by the authors. The model assumptions, methodological choices, analyses, and conclusions were specified, checked, and approved by the authors, who take full responsibility for the content of this work.
3. Results
3.1. Life-Cycle CO2 Emissions
Figure 2 decomposes the annual fossil CO2 life-cycle emissions of the WtE baseline and the four CCU scenarios. Positive segments show emission contributions (waste combustion, facility and CC power, auxiliaries, capital goods, hydrogen supply, and CCU operations and losses); negative segments show CO2 credits (avoided grid electricity from on-site generation and avoided fossil-fuel emissions from CCU product substitution). Diamond markers show the net LCCO2 of each scenario.
Figure 2.
Decomposition of the annual fossil life-cycle CO2 emissions (LCCO2, kt-CO2/y) of the WtE baseline and the four CCU scenarios (methanation, CCU-CH4, and methanol synthesis, CCU-CH3OH; 2024 and 2050), under the cradle-to-product system boundary. Positive segments are emission contributions (e.g., hydrogen supply, facility and capture power, process losses); negative segments are CO2 credits (avoided grid electricity and CCU product substitution). White diamond markers (◇) show the net annual LCCO2; negative net values denote avoided-burden reductions rather than physical carbon removal (see Section 3.6). The bar labeled WtE (baseline, 2024) shows the 2024 baseline (+18.55 kt-CO2/y); the 2050 baseline is 8.69 kt-CO2/y (Section 3.1).
The WtE baseline emits 18.55 kt-CO2/y in 2024, dominated by waste combustion (26.48 kt-CO2/y of fossil emissions) partially offset by an avoided electricity credit of −18.71 kt-CO2/y. Under the projected 2050 waste composition, the baseline falls to 8.69 kt-CO2/y, mainly because the fossil-carbon contribution from plastic-derived waste combustion decreases; this effect outweighs the smaller avoided electricity credit under the decarbonized 2050 grid. Adding CCU fundamentally restructures the emission profile: hydrogen supply becomes the largest single positive contribution (37.29 kt-CO2/y for CCU-CH4 and 29.51 kt-CO2/y for CCU-CH3OH under 2024 conditions), while a large new credit—CCU product substitution—appears on the negative side (−61.5 and −68.1 kt-CO2/y, respectively).
With photovoltaic-electrolysis hydrogen, both CCU routes show substantially lower life-cycle emissions than the WtE baseline in both years under the cradle-to-product boundary. Under 2024 conditions, CCU-CH4 reaches −14.72 kt-CO2/y and CCU-CH3OH −26.79 kt-CO2/y; relative to the 2024 baseline (18.55 kt-CO2/y) these correspond to reductions of 33.27 and 45.34 kt-CO2/y. The product-substitution credit (−61.5 kt for CCU-CH4, −68.1 kt for CCU-CH3OH) outweighs the combined burdens of hydrogen supply, facility and CC power, process losses, and the reduced avoided electricity credit caused by steam extraction for MEA regeneration. Methanol synthesis achieves the larger reduction because its higher CO2-utilization efficiency yields more product—and hence a larger displacement credit—per ton of captured CO2, while its lower per-product hydrogen requirement keeps the hydrogen-supply burden modest.
It must be emphasized that these negative net values are an avoided-burden result of the cradle-to-product convention, not physical carbon removal. The captured fossil carbon is embodied in fuels and re-emitted at end use, and under the stricter cradle-to-grave bound, the CCU-CH4 2024 scenario becomes a net emitter (Section 3.6).
By 2050, the reductions grow further (CCU-CH4: −35.85 kt-CO2/y, a 44.54 kt-CO2/y reduction against the 8.69 kt-CO2/y 2050 baseline; CCU-CH3OH: −42.65 kt-CO2/y, a 51.34 kt-CO2/y reduction). The improvement is driven by the fall in the hydrogen carbon factor to 0.90 kg-CO2/kg-H2 and in the PV electricity factor from 0.0534 to 0.014 kg-CO2/kWh, which shrink the hydrogen-supply and facility-power burdens; the product-displacement credit declines only slightly because the displaced fossil products themselves become less carbon-intensive (Table 1). Across both years, CCU-CH3OH delivers the larger absolute reduction, and its advantage is robust to the choice of accounting boundary (Section 3.6). Notably, even under 2024 conditions, the methanation route reduces rather than increases emissions under the product-system boundary—a marked contrast to power-to-gas assessments that assume grid-mix hydrogen and a direct consequence of adopting a physically consistent PV-electrolysis hydrogen factor; the threshold analysis in Section 3.6 shows that this result would reverse for hydrogen carbon intensities above 6.1 kg-CO2/kg-H2.
3.2. Life-Cycle Cost
Figure 3 decomposes the annual life-cycle cost. Negative segments are cost components (depreciation, maintenance, personnel, and utility, the last comprising hydrogen procurement plus purchased electricity); positive segments are revenue components (waste tipping fees and CCU product sales). Diamond markers show the net LCC.
Figure 3.
Decomposition of the annual life-cycle cost (LCC, M JPY/y; capital charges CRF annualized at r = 4%) of the WtE baseline and the four CCU scenarios (CCU-CH4 and CCU-CH3OH; 2024 and 2050). Positive segments are revenues (waste tipping fees and CCU product sales); negative segments are costs (depreciation, maintenance, personnel, and utility, the last dominated by hydrogen procurement in 2024). White diamond markers (◇) show the net annual LCC; negative values denote an annual deficit.
The WtE baseline operates at a deficit of −1783 M JPY/y under the discounted capital charges of Section 2.5 (−640 M JPY/y with undiscounted straight-line annualization): waste tipping fees (2342 M JPY/y) do not cover annualized capital, maintenance, personnel, and purchased power. Adding CCU shifts the LCC sharply negative under 2024 conditions. The dominant new cost is utility, overwhelmingly hydrogen: the 2024 hydrogen bill reaches 12,964 M JPY/y for CCU-CH4 and 10,261 M JPY/y for CCU-CH3OH, several times the entire baseline revenue stream.
CCU product revenue partially offsets this—4098 M JPY/y for CCU-CH4 and 2362 M JPY/y for CCU-CH3OH—but cannot close the gap. Net LCC reaches −12,487 M JPY/y for CCU-CH4 and −10,970 M JPY/y for CCU-CH3OH in 2024.
By 2050, the hydrogen bill falls roughly 80% (CCU-CH4: 12,964 → 2593 M JPY/y; CCU-CH3OH: 10,261 → 2052 M JPY/y) owing to the assumed hydrogen-price decline from 100 to 20 JPY/Nm3. The depreciation, maintenance, personnel, and product-revenue components are essentially unchanged between the two years. As a result, both routes narrow substantially—CCU-CH4 to −2116 M JPY/y and CCU-CH3OH to −2761 M JPY/y (the residual deficits remain larger than in an undiscounted evaluation because the discounted capital charges persist). The incremental balance relative to the baseline (ΔLCC = LCC − LCCWtE, with LCCWtE = −1783 M JPY/y) is more informative for the deployment decision: in 2024 it is −10,704 M JPY/y for CCU-CH4 and −9187 M JPY/y for CCU-CH3OH, whereas by 2050, it narrows to −333 M JPY/y for CCU-CH4—a small residual deficit that vanishes at approximately a one-third CAPEX subsidy—and to −978 M JPY/y for CCU-CH3OH. The structural shift is shown in Figure 4: the share of the hydrogen-plus-power utility cost in the total annual gross cost of CCU-CH3OH falls from about 69% in 2024 to 35% in 2050, while the capital share rises from roughly 20% to 42%.
Figure 4.
Composition of the annual gross cost of the CCU-CH3OH (methanol) route under 2024 (H2 = 100 JPY/Nm3) and 2050 (H2 = 20 JPY/Nm3) hydrogen-price conditions. Values are shares (%) of the annualized gross cost (capital charges CRF-annualized at r = 4%); the panel shows the shift from hydrogen-plus-power utility cost toward capital charges as the hydrogen price falls.
3.3. Sensitivity to CAPEX Subsidy
Figure 5 shows the sensitivity of LCC to the CAPEX subsidy rate (s = 0, 1/3, 1/2, 2/3, 1) applied to the combined CC + CCU annualized capital cost (971 M JPY/y for CCU-CH4, 451 M JPY/y for CCU-CH3OH at r = 4%) for both routes under 2024 and 2050 conditions. The 2024 lines are nearly flat: a full CAPEX subsidy (s = 1) improves the CCU-CH3OH LCC from −10,970 to −10,519 M JPY/y, an improvement of only 4.1% of the deficit, and CCU-CH4 from −12,487 to −11,516 M JPY/y (7.8%). The OPEX:CAPEX ratio of roughly 13–23:1 in 2024 (hydrogen cost of 10,000–13,000 M JPY/y versus combined annualized CAPEX of 450–970 M JPY/y) structurally limits the leverage of capital subsidies.
Figure 5.
Sensitivity of the annual life-cycle cost (LCC, M JPY/y; capital charges CRF-annualized at r = 4%) to the CAPEX subsidy rate (s = 0–1, applied to the combined CC + CCU annualized capital cost) for both CCU routes (CCU-CH4 and CCU-CH3OH) under 2024 and 2050 conditions. More negative values indicate a larger annual deficit.
Under 2050 conditions, the CAPEX subsidy becomes meaningfully effective. CCU-CH3OH in 2050 improves from −2761 to −2310 M JPY/y at full subsidy—a 16% reduction of the deficit—and CCU-CH4 from −2116 to −1145 M JPY/y, a 46% reduction; in incremental terms, CCU-CH4 2050 reaches balance at approximately a one-third CAPEX subsidy (ΔLCC = −333 M JPY/y at s = 0). The marginal effectiveness of CAPEX subsidies thus depends on prior reduction of the OPEX-dominant cost components, particularly hydrogen procurement. The implication for policy sequencing is examined in Section 4.3.
3.4. Break-Even Carbon Price
Figure 6 and Table 3 present the incremental break-even carbon price (CPBE,inc, Equation (5))—the price at which adding CC + CCU to the existing facility becomes economically neutral—for both routes at zero subsidy and its sensitivity to the CAPEX subsidy rate. The plant-level cash balance price (CPBE,plant, Equation (6)) is shown as an auxiliary indicator in Figure 6 and tabulated in Supplementary Materials Table S6; it exceeds CPBE,inc throughout because the baseline facility runs a pre-existing discounted deficit of 1783 M JPY/y that the plant-level indicator also charges to the carbon revenue.
Figure 6.
Break-even carbon price (104 JPY/t-CO2) versus CAPEX subsidy rate for both CCU routes under 2024 and 2050 hydrogen-price assumptions (logarithmic vertical scale). Solid lines: incremental break-even price (primary indicator—the price at which adding CCU to the existing facility becomes annually cost-neutral). Thin dashed lines: plant-level cash balance price (auxiliary indicator). CCU-CH4 2050 has a small positive incremental break-even price at zero subsidy and approaches zero at approximately a one-third CAPEX subsidy; beyond that point, carbon pricing is not required. Horizontal dotted lines show the Uruguay carbon tax (2.44 × 10⁴ JPY/t-CO2) and the 2023 EU ETS average (1.51 × 10⁴ JPY/t-CO2), converted at 1 USD = 156.7 JPY [15].
Table 3.
Incremental break-even carbon price (CPBE,inc) by CCU route and CAPEX subsidy rate (104 JPY/t-CO2; USD values in parentheses, converted at 1 USD = 156.7 JPY). “Not required” indicates ΔLCC ≥ 0, i.e., the CCU addition is economically neutral or better without carbon pricing. Plant-level values in Supplementary Materials Table S6.
Under 2024 hydrogen-price assumptions, the incremental break-even CP is 20.26 × 10⁴ JPY/t-CO2 for CCU-CH3OH and 32.18 × 10⁴ JPY/t-CO2 for CCU-CH4. Because the economics are hydrogen-dominated, capital subsidy barely moves these values—by about 5% and 9%, respectively, at full subsidy. Converted at 1 USD = 156.7 JPY, the CCU-CH3OH figure is about 1293 USD/t-CO2. This is roughly eight times the highest carbon-tax level in the World Bank 2023 dataset (Uruguay, 156 USD/t-CO2 [15]) and about thirteen times the 2023 EU Emissions Trading System (ETS) average (~96 USD/t-CO2 [15]).
The corresponding plant-level values are only slightly higher (24.19 and 37.54 × 10⁴ JPY/t-CO2) because the baseline deficit is small relative to the 2024 hydrogen bill. Under either definition, the 2024 break-even level is unattainable through any carbon-pricing instrument at the levels reported in the cited dataset.
Under 2050 hydrogen-price assumptions, the two indicators diverge qualitatively, and the distinction becomes decision-relevant. For CCU-CH4, the incremental balance narrows to a small deficit (ΔLCC = −333 M JPY/y), corresponding to an incremental break-even price of only 0.75 × 10⁴ JPY/t-CO2 (48 USD/t-CO2)—about half the 2023 EU ETS average—which falls to zero at approximately a one-third CAPEX subsidy. The plant-level indicator for the same scenario is 4.75 × 10⁴ JPY/t-CO2 (303 USD/t-CO2); however, this reflects the cost of also covering the host facility’s pre-existing discounted deficit, not the cost of the CCU investment itself.
For CCU-CH3OH, the incremental break-even CP falls to 1.90 × 10⁴ JPY/t-CO2 (122 USD/t-CO2)—a 91% reduction from 2024—about a quarter above the 2023 EU ETS average reported in the cited dataset. At a one-third CAPEX subsidy, it drops to 1.61 × 10⁴ JPY/t-CO2 (103 USD/t-CO2), essentially that 2023 EU ETS average. Capital subsidy is also materially more effective in 2050, moving the incremental price by up to about 46% for CCU-CH3OH, because the OPEX-utility component has by then been reduced through hydrogen-supply decarbonization.
Neither indicator is a price prediction or a policy recommendation. CPBE,inc quantifies the gap between the benchmark carbon-pricing levels reported in [15] and the marginal abatement cost of adding CCU; CPBE,plant quantifies the funding level at which the whole facility’s cash flow balances. The collapse from 2024 to 2050 in both is largely driven by the assumed hydrogen-price decline (100 → 20 JPY/Nm3), not by carbon pricing or subsidy intensification. Hydrogen-supply policy appears to be the dominant lever in these scenarios for closing the feasibility gap; carbon pricing and subsidies play complementary, secondary roles. A further caveat concerns comparability with actual instruments: existing carbon taxes and emissions-trading systems apply to regulated direct emissions, whereas the ΔLCCO2 denominator of Equations (5) and (6) is a life-cycle reduction that includes avoided emissions from product substitution, which no current scheme automatically converts into carbon revenue. The break-even values are therefore the prices that would close the cost gap if the full life-cycle reduction were remunerated; under an instrument pricing only the facility’s direct emissions, the required level would be correspondingly higher. They are benchmark gap indicators for comparing policy ambition, not revenue forecasts under any specific scheme.
3.5. Comparison of Methanation and Methanol Synthesis
The two CCU routes show distinct profiles. On the environmental axis, CCU-CH3OH consistently outperforms CCU-CH4 under the cradle-to-product boundary: it achieves the larger LCCO2 reduction in both years (45.3 versus 33.3 kt-CO2/y in 2024; 51.3 versus 44.5 kt-CO2/y in 2050), because its higher CO2-utilization efficiency converts the captured CO2 into more displacement-earning product. Its advantage widens under the cradle-to-grave bound (Section 3.6), where CCU-CH3OH retains a net reduction in both years while CCU-CH4 2024 becomes a net emitter. The environmental ranking is therefore robust to the boundary choice, but the absolute magnitudes are not.
On the economic axis, evaluated on the incremental indicator, the ranking is reversed and year-dependent. In 2024, CCU-CH3OH carries the smaller incremental deficit (ΔLCC = −9187 versus −10,704 M JPY/y for CCU-CH4), reflecting its lower hydrogen bill. By 2050, once the hydrogen bill collapses, CCU-CH4 approaches incremental cost neutrality, requiring only 0.75 × 10⁴ JPY/t-CO2 (48 USD/t-CO2; zero at a one-third CAPEX subsidy) because its methane product commands a higher natural-gas equivalent revenue than methanol, while CCU-CH3OH requires 1.90 × 10⁴ JPY/t-CO2 (122 USD/t-CO2). Route choice therefore depends on whether policy priority emphasizes maximum and boundary-robust decarbonization (favoring CCU-CH3OH) or near-term economic feasibility (favoring CCU-CH4 by 2050)—with the caveat that the route that is cheapest to deploy is also the one whose climate benefit is most sensitive to the downstream-use boundary.
3.6. Robustness: Accounting Boundary and Hydrogen Assumptions
Two structural assumptions dominate the robustness of the environmental results: the CO2-accounting boundary and the hydrogen supply.
Table 4 compares the net LCCO2 of each scenario under the main cradle-to-product boundary with a cradle-to-grave bound. Under the bound, the fossil carbon embodied in the synthetic product is charged back at the point of end use (Section 2.4). The add-back is year- and route-specific—22,288 (CH4) and 22,160 (CH3OH) t-CO2/y in 2024, falling to 8769 and 8718 t-CO2/y in 2050—because the projected 2050 waste composition contains a substantially lower plastic share, which reduces the fossil fraction of the captured carbon from 35.5% to 14.0% (Supplementary Materials Table S8). Only the product-embodied fossil carbon is added back, because the fossil share of the process loss is already charged in the main inventory (Section 2.4) and adding back the full captured quantity would count that loss twice; the bound still does not credit biogenic-CO2 capture, which would move all balances further negative.
Table 4.
Net LCCO2 and reduction relative to the WtE baseline under the two accounting boundaries (kt-CO2/y). The cradle-to-grave bound charges only the product-embodied fossil carbon back at synthetic fuel end use; the add-back is route- and year-specific and excludes the fossil share of process losses already counted in the product-system inventory.
Under the bound, CCU-CH4 2024 flips from −14.72 to +7.57 kt-CO2/y—a net emitter, though still below the 18.55 kt-CO2/y baseline. CCU-CH3OH 2024 remains clearly negative (−4.63 kt-CO2/y), and both 2050 scenarios stay well below zero (−27.08 and −33.94 kt-CO2/y). The reductions relative to the baseline shrink from 33.3–51.3 kt-CO2/y to 11.0–42.6 kt-CO2/y, with the 2024 methanation case retaining only a limited reduction (11.0 kt-CO2/y).
The break-even carbon prices of Section 3.4 use the cradle-to-product ΔLCCO2 in the denominator for consistency with the primary model. Because the economic numerator is unaffected by the emission boundary, a boundary-consistent sensitivity is obtained by recomputing CPBE,inc on the cradle-to-grave denominator (Supplementary Materials Table S7, all subsidy levels). The carbon-price requirement then rises in proportion to the shrinkage of the reduction.
The effect is most severe for CCU-CH4 2024, where the small cradle-to-grave reduction (10.98 kt-CO2/y) drives CPBE,inc from 32.18 to 97.51 × 10⁴ JPY/t-CO2 (≈6223 USD/t-CO2). It is moderate for CCU-CH3OH (20.26 → 39.63 × 10⁴ JPY/t-CO2 in 2024; 1.90 → 2.29 × 10⁴ JPY/t-CO2, i.e., 122 → 146 USD/t-CO2, in 2050) and minor for CCU-CH4 2050 (0.75 → 0.93 × 10⁴ JPY/t-CO2, 48 → 59 USD/t-CO2). Any claim of “negative emissions” is therefore conditional on the product-system convention and on the displaced fossil fuels actually being displaced. What is robust across both boundaries is that every modeled scenario emits less than its corresponding WtE baseline and that the 2050 scenarios retain a substantial net reduction.
Figure 7 generalizes the two scenario years into a continuous feasibility map over the hydrogen price (0–110 JPY/Nm3) and the hydrogen carbon intensity (0–9 kg-CO2/kg-H2), holding the remaining 2024- or 2050-context parameters fixed. The 2024 and 2050 scenario points are thus illustrative points in a continuous space rather than forecasts. The map separates three regions.
Figure 7.
Incremental break-even carbon price (104 JPY/t-CO2; color scale) as a function of hydrogen price (JPY/Nm3) and hydrogen carbon intensity (kg-CO2/kg-H2) for (a,b) CCU-CH4 and (c,d) CCU-CH3OH, under 2024-context and 2050-context parameters (substitution factors, electricity factors, and baseline of the respective year; Table 1). Grey region: no net climate benefit relative to the WtE baseline (no break-even price exists). Green region: no carbon price required (incremental balance non-negative). Stars mark the 2024 and 2050 scenario points of the main analysis.
First, above a route- and context-specific hydrogen carbon-intensity threshold (6.1 and 4.7 kg-CO2/kg-H2 for CCU-CH4 in the 2024 and 2050 contexts; 8.1 and 6.5 for CCU-CH3OH), the CCU addition yields no net climate benefit relative to the baseline, and no break-even price exists. Grid-based electrolysis in the 2024 Japanese mix—roughly 52 kWh/kg-H2 × 0.433 kg-CO2/kWh ≈ 22.5 kg-CO2/kg-H2—lies far above every threshold, confirming that dedicated low-carbon hydrogen is a precondition rather than an option. Second, below a hydrogen-price threshold (17.4 JPY/Nm3 for CCU-CH4; 10.5 JPY/Nm3 for CCU-CH3OH), the incremental balance is non-negative, and no carbon price is required. Third, between these bounds, the required incremental break-even price varies continuously, and it is far more sensitive to the hydrogen price than to the carbon intensity.
The Japanese hydrogen strategy target of 20 JPY/Nm3 [10] sits just above the CCU-CH4 economic neutrality threshold (17.4 JPY/Nm3), which is why the methanation route in the 2050 scenario retains only a small residual carbon-price requirement (0.75 × 10⁴ JPY/t-CO2) that approaches zero at approximately a one-third CAPEX subsidy and is not required from a one-half subsidy onward.
3.7. Additional Sensitivity Analyses: Discount Rate, Plant Scale, Methane Leakage, Market Absorption, and Hydrogen Delivered Price
Five further sensitivity analyses examine assumptions flagged as influential for the break-even results: the discount rate, the plant scale, downstream methane leakage, product-market absorption, and the delivered hydrogen price (Supplementary Materials Tables S9–S13; all values below are incremental break-even prices at zero subsidy unless noted).
Discount rate (Table S9). Varying r from 2% to 8% moves the 2024 break-even prices by only about ±4% (CCU-CH4: 31.6–33.4; CCU-CH3OH: 20.1–20.7 × 10⁴ JPY/t-CO2), because the 2024 economics are OPEX-dominated. The 2050 prices are proportionally more sensitive—0.34–1.69 × 10⁴ JPY/t-CO2 (22–108 USD/t-CO2) for CCU-CH4 and 1.72–2.33 × 10⁴ JPY/t-CO2 (110–149 USD/t-CO2) for CCU-CH3OH—because capital charges are by then a larger share of the balance. Under undiscounted straight-line annualization, the CCU-CH4 2050 case requires no carbon price; the discounted base case is retained as the more decision-relevant metric.
Plant scale (Table S10). Scaling the facility to 600 and 900 t/day (0.6 power law on capital and fixed costs; throughput-proportional variable terms) lowers the break-even prices by 2–5% in 2024 and more visibly in 2050: at 600 t/day and above, the CCU-CH4 2050 addition requires no carbon price, and the CCU-CH3OH 2050 price falls from 1.90 to 1.41 × 10⁴ JPY/t-CO2 (122 → 90 USD/t-CO2) at 900 t/day. Economies of scale therefore reinforce, but do not qualitatively change, the 2050 conclusions; large facilities such as the 600,000 t/y Amager Bakke plant [7] would sit further down this curve.
Methane leakage (Table S11). Charging fugitive losses of the synthetic methane chain at GWP100 = 29.8 [16], with the leaked fraction also forfeiting sales revenue and substitution credit, erodes the methanation denominator by roughly 7400 t-CO2/y per percentage point (22% of the 2024 and 16% of the 2050 reduction): a 1% leakage rate raises the 2024 break-even price by 29% (32.18 → 41.58 × 10⁴ JPY/t-CO2), and 3% roughly triples it (to 98.46 × 10⁴ JPY/t-CO2). The 2050 case is more robust—0.75 → 1.01 × 10⁴ JPY/t-CO2 at 1% and 2.01 × 10⁴ JPY/t-CO2 (129 USD/t-CO2) even at 3%—because the larger baseline reduction dilutes the leakage penalty. The methanation results should therefore be read as conditional on a tightly managed (≲1%) synthetic gas chain; CCU-CH3OH is unaffected.
Market absorption (Table S12). If only 75% (50%) of the CCU product is absorbed at the assumed price—with the unutilized captured CO2 vented and capital costs unchanged—the 2050 break-even price rises from 0.75 to 2.05 (4.77) × 104 JPY/t-CO2 for CCU-CH4 and from 1.90 to 2.59 (4.02) × 104 JPY/t-CO2 for CCU-CH3OH. Full absorption at fossil-parity prices is therefore a material assumption, particularly for the methane route, and offtake contracts are a natural policy complement.
Hydrogen delivered price (Table S13). The 20 JPY/Nm3 strategy target is a production-cost target; compression, storage, transport, and backup supply add a delivered-price premium. Premiums of +25%, +50%, and +100% raise the CCU-CH4 2050 break-even price from 0.75 to 2.20, 3.66, and 6.57 × 10⁴ JPY/t-CO2 (141, 234, and 419 USD/t-CO2), and the CCU-CH3OH price from 1.90 to 2.90, 3.90, and 5.90 × 10⁴ JPY/t-CO2. The delivered hydrogen price is thus the single most influential near-term parameter, consistent with the threshold structure of Figure 7, and on-site or pipeline-adjacent hydrogen supply is strongly favored. The full hydrogen-price sensitivity at fixed carbon intensity is tabulated in Supplementary Materials Table S3.
4. Discussion
4.1. Drivers of 2024 Economic Infeasibility
The 2024 incremental break-even CP—20.3 × 10⁴ JPY/t-CO2 for CCU-CH3OH and 32.2 × 10⁴ JPY/t-CO2 for CCU-CH4—reflects a structural mismatch between the cost of low-carbon hydrogen procurement and the value generated by displacing fossil fuels through CCU products. At a hydrogen price of 100 JPY/Nm3, the annual hydrogen expenditure for CCU-CH3OH (about 10,300 M JPY/y) is more than twice the facility’s combined revenue from waste tipping fees and CCU product sales (about 4700 M JPY/y).
The 2024 barrier is therefore primarily economic, but the environmental case is itself conditional in two respects. First, it depends on the hydrogen supply: the threshold analysis of Section 3.6 shows that the climate benefit disappears above 6.1 (CCU-CH4) or 8.1 (CCU-CH3OH) kg-CO2/kg-H2 in the 2024 context, and grid-mix electrolysis (~22.5 kg-CO2/kg-H2 for the 2024 Japanese grid) lies far above both. The concern raised by Ueckerdt et al. [34] about the carbon arithmetic of power-to-X routes thus applies in full to grid-supplied hydrogen, and dedicated PV electrolysis is what avoids it here. Second, it depends on the accounting boundary: under the cradle-to-grave bound, the 2024 methanation scenario becomes a net emitter, and the methanol scenario only approximately breaks even in emission terms. A defensible summary of 2024 is therefore that, with dedicated PV-electrolysis hydrogen, both routes reduce emissions relative to the baseline under either boundary, while the economics remain far from viable at the prevailing hydrogen price.
4.2. Drivers of the 2050 Transition
The improvement from 2024 to 2050 is driven by concurrent transitions in the upstream energy system. The hydrogen price falls from 100 to 20 JPY/Nm3 (an 80% reduction) under the Japanese hydrogen strategy target, which dominates the cost side. On the emission side, the PV electricity factor falls from 0.0534 to 0.014 kg-CO2/kWh (a 74% reduction) as the electricity mix decarbonizes [18], which, in turn, lowers the derived PV-electrolysis hydrogen factor from 3.20 to 0.90 kg-CO2/kg-H2. These transitions are not independent: the hydrogen-price decline is itself partly driven by electrolyzer learning curves and renewable-electricity cost reductions.
Policy interventions targeting the hydrogen system therefore propagate into multiple LCC and LCCO2 components at once, producing the disproportionate sensitivity seen in Section 3.4: an 80% hydrogen-price cut translates into a 91% collapse in the incremental break-even carbon price for CCU-CH3OH and a 98% collapse for CCU-CH4. Figure 7 shows that this is a threshold phenomenon: the 20 JPY/Nm3 target lies just above the methanation economic neutrality threshold (17.4 JPY/Nm3), so modest over- or under-shooting of the target materially changes whether that route needs only token support or a substantial carbon price (Section 3.7). The 2024 and 2050 points should accordingly be read as illustrative points in a continuous space, not as forecasts.
4.3. Policy Implications: Sequencing and Instrument Design
The results carry three implications for policy design. First, the break-even CP framework should be read as a gap indicator rather than a price target, and the two indicators answer different policy questions. The incremental CP is the quantity relevant to a decision about supporting new CCU deployment: the 2024 figure of approximately 20.3 × 10⁴ JPY/t-CO2 for CCU-CH3OH is roughly eight times the highest carbon-tax level in the World Bank 2023 dataset (Uruguay, 156 USD/t-CO2 ≈ 2.4 × 10⁴ JPY/t-CO2 [15]), and no realistic carbon-pricing policy can close this gap on its own. The plant-level CP, by contrast, speaks to the financial sustainability of the host facility—a question for municipal owners whose WtE plants already operate at a deficit—and it must not be quoted as the marginal cost of abatement since it bundles the pre-existing baseline shortfall into the carbon price. The clearest illustration is CCU-CH4 in 2050: incrementally, the addition needs only 0.75 × 10⁴ JPY/t-CO2 (48 USD/t-CO2, approaching zero at approximately a one-third CAPEX subsidy), while the plant-level indicator shows 4.75 × 10⁴ JPY/t-CO2 because the underlying facility loses 1783 M JPY/y with or without CCU.
Second, the results suggest a policy sequencing in which hydrogen-supply decarbonization appears to be the dominant lever in these scenarios, with carbon pricing and CAPEX subsidies playing complementary, secondary roles. Under 2024 conditions, a full CAPEX subsidy improves the CCU-CH3OH LCC by about 4%, while the hydrogen-price decline from 100 to 20 JPY/Nm3 alone reduces the deficit by roughly 75%. Policies that prioritize subsidy intensification before hydrogen-supply decarbonization risk locking in inefficient capital at facilities that remain economically unviable.
Third, the marginal effectiveness of CAPEX subsidies is highly context-dependent: the same full-subsidy intervention moves the CCU-CH3OH incremental break-even price by about 5% in 2024 but by about 46% in 2050—a one-third CAPEX subsidy alone brings the 2050 methanol figure to approximately the 2023 EU ETS average (103 USD/t-CO2) and essentially eliminates the small residual requirement of the 2050 methanation route. Subsidy programs designed today for present-day CCU economics may therefore be substantially over- or under-calibrated for the 2030–2050 deployment window. A policy package combining hydrogen-supply support (e.g., contracts-for-difference for low-carbon hydrogen) CAPEX subsidies calibrated to 2030–2050 economics, and a credible carbon-pricing trajectory would, in combination, likely be needed to make CCU at MSW incineration economically feasible. This study reports the gap that any such package would need to address rather than recommending a specific carbon-price target. Because the 2050 conclusions rest on an assumed hydrogen-price trajectory (20 JPY/Nm3) that remains policy-dependent and uncertain, they should be read as conditional on that target being met rather than as a forecast of 2050 feasibility.
These implications translate differently across carbon-pricing regimes. For Japan, where the GX-ETS is entering its compliance phase and a carbon levy is scheduled from FY2028, the near-term priority indicated by these results is delivered-cost reduction of low-carbon hydrogen—for example, through contracts for difference under the Hydrogen Society Promotion Act—combined with CAPEX support calibrated to the 2050 economics quantified here; carbon pricing at currently envisaged levels functions as a complementary revenue floor rather than the primary driver. For the European Union, where allowance prices already clear near the 2050 break-even levels computed here and municipal incineration is on a legislated inclusion trajectory [35], the binding constraints shift to the delivered cost of renewable hydrogen and the regulatory eligibility of waste-derived CCU fuels; if allowance prices persist near the 2023 average, methanol-route CCU at European WtE facilities would approach viability once delivered renewable hydrogen approaches the ≈20 JPY/Nm3 (≈1.3 EUR/kg) level assumed here. In both regimes, the sequencing conclusion—hydrogen first, with carbon pricing and CAPEX subsidies as calibrated complements—carries over.
4.4. International Context
The 2050 incremental break-even CP (0.75 × 10⁴ JPY/t-CO2 ≈ 48 USD/t-CO2 for CCU-CH4; 1.90 × 10⁴ JPY/t-CO2 ≈ 122 USD/t-CO2 for CCU-CH3OH) brackets the 2023 EU ETS average reported in the cited dataset (~96 USD/t-CO2 ≈ 1.5 × 10⁴ JPY/t-CO2) and sits well below the Uruguay carbon tax (156 USD/t-CO2). Under the 2050 hydrogen assumptions, the methanation route would need about half the ETS average price—and essentially none with a one-third CAPEX subsidy—while the methanol route needs about a quarter above that average; both are within the envelope of the instruments reported in the cited dataset. On the plant-level indicator, which additionally covers the host facility’s discounted baseline deficit, the corresponding figures are 303 and 343 USD/t-CO2.
Japan’s national carbon tax (the Global Warming Countermeasure Tax, 289 JPY/t-CO2 ≈ 0.03 × 10⁴ JPY/t-CO2) is nearly two orders of magnitude below even the 2050 methanol incremental break-even level. Japan’s GX-ETS, being phased in as of the cited strategy [10], would therefore need to mature into a substantially higher-priced regime to bridge the gap. In the European Union, municipal waste incineration became subject to monitoring, reporting, and verification obligations under the EU ETS in 2024, and its full inclusion by 2028 is under legislative review [35]; carbon pricing of WtE emissions is thus on a legislated near-term trajectory rather than a hypothetical one.
These findings are consistent with recent life-cycle evidence that post-combustion capture can substantially lower the climate burden of waste-to-energy, while its net benefit remains contingent on the energy system and accounting context [36,37]; recent techno-economic and life-cycle assessments of CO2-to-methanol routes similarly find that low-carbon hydrogen cost dominates feasibility [38]. Internationally, WtE-CCUS is most advanced at large-scale facilities such as Amager Bakke in Copenhagen [7], where 600,000 t/y of waste throughput supports a different economy of scale than the 84,000 t/y intermediate-size facility examined here. The break-even CP is indeed lower at larger scales, owing to CAPEX cost-scaling effects, as quantified in the plant-scale sensitivity analysis in Section 3.7 and Supplementary Materials Table S10. Comparable integrated assessments from other waste streams under China’s dual-carbon framework—an LCA-plus-LCC evaluation of demolition-waste management options monetized at carbon-trading prices [39] and simulation evidence that carbon-market prices combined with regulation alter enterprise waste-reduction behavior [40]—reach the same structural conclusion as this study: economic instruments unlock waste-sector abatement only when sequenced with technology-cost decline, supporting the transferability of the sequencing implication beyond the Japanese context.
From an industrial-symbiosis perspective, the CCU routes examined here are natural anchors for co-located production networks: the synthetic methane can feed adjacent city-gas grids or industrial boilers; by-product oxygen from electrolysis can support oxygen-enriched combustion; and the exothermic heat of methanation can serve district heating or sludge drying—configurations that would improve both the economics and the life-cycle performance beyond the standalone case modeled here. Conversely, decomposing the synthetic methane back into hydrogen and solid carbon (methane pyrolysis) would be counterproductive in this configuration, since it would respend the low-carbon hydrogen already embedded in the product; direct use of the methane as fuel or feedstock is the thermodynamically and economically coherent option.
4.5. Limitations
Several limitations deserve explicit acknowledgement. First, the MEA capture parameters are based on demonstration data from coal-fired and natural-gas-fired flue gases [3]; operation on real MSW flue gas may require additional pretreatment to manage HCl, SOₓ, fly ash, and trace metals, which could increase capital and operating costs, and pilot-scale data specific to MSW conditions remain limited. Second, the technology readiness level (TRL) of the two routes differs—methanation is at TRL 7–8 (e.g., the Audi e-gas plant), and methanol synthesis from captured CO2 at TRL 6–7 (Carbon Recycling International)—so the mature-technology cost assumptions adopted here may understate near-term deployment costs. Third, CCU product markets are assumed to absorb the synthetic methane and methanol at LNG-equivalent and fossil-methanol-equivalent prices, and the substitution credits assume one-to-one displacement of the fossil products; both assumptions weaken if deployment scales beyond niche volumes, since absorption at market prices is not guaranteed and partial displacement would proportionally reduce the credits on which the environmental results rest. The market-absorption sensitivity of Section 3.7 (Table S12) quantifies this risk: a 50% utilization rate raises the 2050 break-even prices roughly two- to six-fold.
Relatedly, downstream methane leakage is examined quantitatively in Section 3.7 (Table S11): each percentage point of fugitive loss (GWP100 = 29.8 [16]) erodes the methanation denominator by roughly 7400 t-CO2/y (22% of the 2024 and 16% of the 2050 reduction), raising the 2024 break-even price by about 29% at the first percentage point—with steeper, nonlinear increases thereafter (Table S11)—and the 2050 price from 0.75 to 1.01 × 10⁴ JPY/t-CO2 at 1% leakage. The methanation results should therefore be read as conditional on near-zero (≲1%) leakage across the synthetic gas chain, in addition to the emission factor selected for the displaced natural gas (Table 1); the CCU-CH3OH results are unaffected.
Fourth, the main accounting adopts a cradle-to-product boundary, which is favorable to CCU for the fossil fraction of the captured carbon, because utilization in a short-lived fuel delays that emission rather than removing it permanently; the cradle-to-grave bound quantifying this effect is presented in Section 3.6, and any “negative-emission” reading is conditional on the boundary convention. Fifth, only fossil CO2 from combustion is counted as a positive emission (IPCC AR6 default [16]); crediting biogenic-CO2 capture would lower the break-even CP further, but for short-lived fuel products, such crediting would itself require the accounting safeguards discussed above. Sixth, the hydrogen carbon factor is derived from the assumed PV-electrolysis route and the study’s PV electricity factors (3.20 and 0.90 kg-CO2/kg-H2 for 2024 and 2050); a grid-supplied or partially grid-supplied stream would carry a much higher factor and, above the thresholds of Section 3.6, would eliminate the climate benefit, and the analysis presumes that roughly 9200–11,700 t/y of dedicated low-carbon hydrogen is physically procurable at the assumed price; the delivered-price sensitivity of Section 3.7 (Table S13) brackets the compression, storage, transport, and backup premiums that a real supply chain would add. Seventh, the 2050 hydrogen price of 20 JPY/Nm3 is the Japanese strategy target rather than a forecast, and Figure 7 shows the results are threshold-sensitive precisely around this value. Moreover, the target is a supply-side production-cost projection: as hydrogen becomes cheaper, demand from fuel, industrial, and power applications will expand, and the market-clearing price may remain above production cost even as the technology improves; whether 2050 delivered prices reach the target, therefore, depends on the hydrogen supply–demand balance and sustained policy support, not on electrolyzer and photovoltaic cost decline alone. Eighth, the LCC applies CRF-based capital annualization at a 4% real discount rate (Section 2.5) and holds 2050 CAPEX, maintenance, and product prices at reference values; it does not model cash-flow timing, construction-period interest, or residual value, so although the discount-rate sensitivity (Table S9) brackets the financing-cost uncertainty, the break-even prices remain scenario-comparison metrics rather than investment-grade profitability estimates. Finally, MEA solvent degradation produces nitrosamine emissions and spent-solvent waste streams; these are included at literature default rates but warrant facility-specific characterization for any deployment decision.
5. Conclusions
This study introduced a break-even carbon-pricing framework for CCU deployment at MSW incineration, distinguishing an incremental indicator (the carbon price at which adding CCU to an existing facility breaks even) from a plant-level cash balance indicator, and applied it to a 300 t/day Japanese facility under 2024 and 2050 conditions. Four conclusions are robust within the stated boundaries. First, with dedicated photovoltaic-electrolysis hydrogen, both CCU routes emit less than the WtE baseline in both years under either accounting boundary; however, the magnitude of the benefit is boundary-dependent (reductions of 33.3–51.3 kt-CO2/y under the cradle-to-product convention versus 11.0–42.6 kt-CO2/y under a year-specific cradle-to-grave bound, with the 2024 methanation case retaining only a limited reduction), and claims of net-negative emissions hold only under the product-system convention. Second, the economics, not the environmental balance, are the binding constraint in 2024—the incremental break-even carbon price is 20.3 × 10⁴ JPY/t-CO2 for CCU-methanol and 32.2 × 10⁴ JPY/t-CO2 for CCU-methanation under a 4% real discount rate, far beyond any existing instrument—but by 2050 the incremental price falls to 1.90 × 10⁴ JPY/t-CO2 (≈122 USD/t-CO2) for methanol and to 0.75 × 10⁴ JPY/t-CO2 (≈48 USD/t-CO2, approaching zero at approximately a one-third CAPEX subsidy) for methanation under the assumed 20 JPY/Nm3 hydrogen price. Third, this collapse is driven largely by the hydrogen price: the feasibility map over hydrogen price and hydrogen carbon intensity shows economic neutrality thresholds at 17.4 (CH4) and 10.5 (CH3OH) JPY/Nm3 and climate-benefit thresholds at 4.7–8.1 kg-CO2/kg-H2, with grid-mix electrolysis far outside the feasible region—so hydrogen-supply decarbonization is a precondition, and hydrogen-price policy appears to be a dominant lever in these scenarios, while carbon pricing and CAPEX subsidies play complementary roles that strengthen markedly toward 2050. Fourth, the two routes trade off differently: methanation reaches economic neutrality first, but its climate benefit is the most boundary-sensitive, whereas methanol synthesis delivers the larger and more boundary-robust reduction at a modest remaining carbon-price requirement. The dual-indicator, dual-boundary framework is regime-agnostic and applicable beyond the case examined here. The sensitivity analyses indicate that these conclusions are robust to the discount rate and strengthen with plant scale, while methane leakage, incomplete market absorption, and hydrogen delivered price premiums are the principal threats to the 2050 case. Future work should resolve the fossil/biogenic split of the captured CO2 at the facility level, integrate uncertainty propagation across hydrogen-price and electricity-mix trajectories, and extend the framework to multi-product industrial-symbiosis configurations. By quantifying the carbon-price gap that separates current waste-to-energy practice from economically self-sustaining CCU operation, the framework offers a transferable tool for measuring and monitoring the sustainability transition of municipal waste infrastructure.
Supplementary Materials
The following supporting information can be downloaded at: https://www.mdpi.com/article/10.3390/su18168283/s1. Table S1. Extended inventory parameters and CO2 emission factors; Table S2. International carbon-pricing benchmarks (2023) used for comparison; Table S3. Incremental break-even carbon price as a function of hydrogen price, isolating the price effect at fixed 2024 and 2050 emission (hydrogen carbon-factor) settings (104 JPY/t-CO2); Table S4. CO2-accounting boundary sensitivity (cradle-to-product vs. cradle-to-grave); Table S5. Sensitivity to CO2 transport distance (one-way); Table S6. Plant-level cash-balance break-even carbon price (CP_BE,plant, Equation (6), main text) by CCU route and CAPEX subsidy rate (104 JPY/t-CO2; USD in parentheses, 1 USD = 156.7 JPY). These are the auxiliary (thin dashed) curves in Figure 6 of the main text; Table S7. Boundary-consistent incremental break-even carbon prices under product-system (C2P) and cradle-to-grave (C2G) accounting (104 JPY/t-CO2; USD in parentheses, 1 USD = 156.7 JPY); Table S8. Fossil and biogenic CO2 flows used in the cradle-to-grave accounting; Table S9. Discount-rate sensitivity of the incremental break-even carbon price (s = 0; 104 JPY/t-CO2, USD/t-CO2 in parentheses). r = 4% is the base case (MLIT public-works guideline; FIT waste-power IRR); 2% is the MLIT 2023 low-interest reference value; 8% is the IEAGHG CCS cost-guideline standard. r = 0% (undiscounted straight-line) shown for continuity; Table S10. Plant-scale sensitivity of the incremental break-even carbon price (0.6 power law on capital and fixed costs; throughput-proportional variable terms; r = 4%, s = 0); Table S11. Methane-leakage sensitivity of the CCU-CH4 incremental break-even carbon price (GWP100 = 29.8; leaked fraction forfeits sales revenue and substitution credit; r = 4%, s = 0). ΔLCCO2 shown to document denominator erosion; Table S12. Product-market-absorption sensitivity of the incremental break-even carbon price (utilization rate f; unutilized captured CO2 vented; capital costs unchanged; r = 4%, s = 0); Table S13. Hydrogen delivered-price sensitivity of the 2050 incremental break-even carbon price (production-cost target 20 JPY/Nm3 plus delivery premium for compression, storage, transport, and backup; r = 4%, s = 0). Tables S1–S13 are contained in the Supplementary Word file; the reproducible calculation workbook (Calculation_Data_MajorRev.xlsx) is provided as a separate Supplementary file.
Author Contributions
Conceptualization, T.C. and H.O.; methodology, T.C.; software, T.C.; validation, T.C. and H.O.; formal analysis, T.C.; investigation, T.C.; data curation, T.C.; writing—original draft preparation, T.C.; writing—review and editing, H.O.; visualization, T.C.; supervision, H.O.; project administration, H.O.; funding acquisition, H.O. All authors have read and agreed to the published version of the manuscript.
Funding
This work was supported by the Japan Science and Technology Agency (JST) through the SICORP e-ASIA Joint Research Program (Grant Number JPMJSC24E1) and by the Environment Research and Technology Development Fund (Grant Number JPMEERF20253J01) of the Environmental Restoration and Conservation Agency (ERCA), Japan, funded by the Ministry of the Environment, Japan.
Institutional Review Board Statement
Not applicable.
Informed Consent Statement
Not applicable.
Data Availability Statement
The data supporting the reported results are contained within the article and the Supplementary Materials; further inquiries can be directed to the corresponding author.
Acknowledgments
The authors gratefully acknowledge the Japan Waste Research Foundation (https://www.jwrf.or.jp/, accessed on 5 July 2026) for their support of this work. During the preparation of this manuscript, the authors used Claude (Anthropic; versions Opus 4.8, Fable 5, and Opus 5; https://claude.ai, accessed on 5 July 2026) for language editing, for assistance in implementing the calculation workbook and the figure-generation scripts, and for checking reference metadata. The authors have reviewed and edited the output and take full responsibility for the content of this publication.
Conflicts of Interest
The authors declare no conflicts of interest.
Abbreviations
The following abbreviations are used in this manuscript:
| CAPEX | Capital expenditure |
| CC | Carbon capture |
| CRF | Capital recovery factor |
| CCS | Carbon capture and storage |
| CCU | Carbon capture and utilization |
| CCUS | Carbon capture, utilization, and storage |
| CP | Carbon price |
| DACCU | Direct air capture and utilization |
| ETS | Emissions trading system |
| GWP | Global warming potential |
| LCC | Life-cycle cost |
| LCCO2 | Life-cycle CO2 emissions |
| LHV | Lower heating value |
| LNG | Liquefied natural gas |
| MEA | Monoethanolamine |
| MSW | Municipal solid waste |
| OPEX | Operating expenditure |
| PV | Photovoltaic |
| TRL | Technology readiness level |
| WtE | Waste-to-energy |
| C2G | Cradle-to-grave (accounting boundary) |
| C2P | Cradle-to-product (accounting boundary) |
| CH4 | Methane |
| CH3OH | Methanol |
| CO2 | Carbon dioxide |
| CPBE | Break-even carbon price |
| H2 | Hydrogen |
| JPY | Japanese yen |
| MeOH | Methanol (synthetic) |
| Nm3 | Normal cubic meter (gas volume at standard conditions) |
| LCA | Life-cycle assessment |
| GX-ETS | Green Transformation Emissions Trading System (Japan) |
References
- NIES. National Greenhouse Gas Inventory Document of Japan 2024; CGER-I170-2024; Greenhouse Gas Inventory Office of Japan, National Institute for Environmental Studies: Tsukuba, Japan, 2024. [Google Scholar]
- Ministry of the Environment, Japan. Mid- and Long-Term Scenario Toward Net-Zero Greenhouse Gas Emissions by 2050 in the Waste and Resource Circulation Sector (Draft); Ministry of the Environment: Tokyo, Japan, 2021. (In Japanese) [Google Scholar]
- Bisinella, V.; Hulgaard, T.; Riber, C.; Damgaard, A.; Christensen, T.H. Environmental assessment of carbon capture and storage (CCS) as a post-treatment technology in waste incineration. Waste Manag. 2021, 128, 99–113. [Google Scholar] [CrossRef] [Scilit] [PubMed]
- Moioli, S.; De Guido, G.; Pellegrini, L.A.; Fasola, E.; Riva, E.R.; Alberti, D.; Carrara, A. Techno-economic assessment of the CO2 value chain with CCUS applied to a waste-to-energy Italian plant. Chem. Eng. Sci. 2024, 287, 119717. [Google Scholar] [CrossRef] [Scilit]
- Pérez-Fortes, M.; Schöneberger, J.C.; Boulamanti, A.; Tzimas, E. Methanol synthesis using captured CO2 as raw material: Techno-economic and environmental assessment. Appl. Energy 2016, 161, 718–732. [Google Scholar] [CrossRef] [Scilit]
- Bailera, M.; Lisbona, P.; Romeo, L.M.; Espatolero, S. Power to Gas projects review: Lab, pilot and demo plants for storing renewable energy and CO2. Renew. Sustain. Energy Rev. 2017, 69, 292–312. [Google Scholar] [CrossRef] [Scilit]
- Bisinella, V.; Nedenskov, J.; Riber, C.; Hulgaard, T.; Christensen, T.H. Environmental assessment of amending the Amager Bakke incineration plant in Copenhagen with carbon capture and storage. Waste Manag. Res. 2022, 40, 79–95. [Google Scholar] [CrossRef] [Scilit] [PubMed]
- García-Luna, S.; Ortiz, C. Partial oxycombustion and amines-driven waste-to-methane for improved carbon capture and utilization (CCU). Energy Convers. Manag. 2024, 302, 118125. [Google Scholar] [CrossRef] [Scilit]
- Tang, Y.; You, F. Multicriteria environmental and economic analysis of municipal solid waste incineration power plant with carbon capture and separation from the life-cycle perspective. ACS Sustain. Chem. Eng. 2018, 6, 937–956. [Google Scholar] [CrossRef] [Scilit]
- METI. Basic Hydrogen Strategy (Revised); Ministry of Economy, Trade and Industry: Tokyo, Japan, 2023. [Google Scholar]
- IRENA. Global Hydrogen Trade to Meet the 1.5 °C Climate Goal: Part III—Green Hydrogen Cost and Potential; International Renewable Energy Agency: Abu Dhabi, United Arab Emirates, 2022. [Google Scholar]
- RITE. International Cases of Regulations and Incentives Toward CCS Deployment; Document 6, 3rd Meeting of the CCS Long-Term Roadmap Study Group; Research Institute of Innovative Technology for the Earth: Kyoto, Japan, 2022; Available online: https://www.meti.go.jp/shingikai/energy_environment/ccs_choki_roadmap/pdf/003_06_00.pdf (accessed on 8 July 2026). (In Japanese)
- Cheng, T.; Pandyaswargo, A.H.; Onoda, H. Environmental and economic assessment toward the utilization of CCUS technology in waste incineration facilities. In EcoDesign for Circular Value Creation, Volume II; Springer: Singapore, 2025; pp. 373–393. [Google Scholar] [CrossRef] [Scilit]
- Cheng, T. Research on the Environmental and Economic Evaluation of Carbon Cycle Systems for Unused Resources. Ph.D. Dissertation, Graduate School of Environment and Energy, Waseda University, Tokyo, Japan, 2025. Available online: https://waseda.repo.nii.ac.jp/records/2006783 (accessed on 3 July 2026). (In Japanese)
- World Bank. State and Trends of Carbon Pricing 2023; The World Bank: Washington, DC, USA, 2023. [Google Scholar]
- IPCC. Climate Change 2022: Mitigation of Climate Change. Contribution of Working Group III to the Sixth Assessment Report of the Intergovernmental Panel on Climate Change; Cambridge University Press: Cambridge, UK, 2022. [Google Scholar]
- Terlouw, T.; Bauer, C.; McKenna, R.; Mazzotti, M. Large-scale hydrogen production via water electrolysis: A techno-economic and environmental assessment. Energy Environ. Sci. 2022, 15, 3583–3602. [Google Scholar] [CrossRef] [Scilit]
- Tahara, K.; Nakamiya, K.; Ozawa, A.; Kudoh, Y.; Niwano, R.; Hondo, H. Prediction of the future CO2 emission intensity of renewable-energy power generation. In Proceedings of the 28th Annual Meeting of the Japan Institute of Energy, Tokyo, Japan, 7–8 August 2019; Volume 28, pp. 202–203. (In Japanese) [Google Scholar] [CrossRef] [PubMed]
- Tokyo Twenty-Three Wards Clean Association. Waste Characterization Survey Results. Available online: https://www.union.tokyo23-seisou.lg.jp/gijutsu/kankyo/toke/seijyou.html (accessed on 2 July 2026). (In Japanese)
- Yamada, K. Mid- and long-term scenarios for the waste and resource-circulation sector toward 2050 carbon neutrality. J. Jpn. Soc. Mater. Cycles Waste Manag. 2022, 33, 7–16. (In Japanese) [Google Scholar]
- METI. Carbon Footprint (CFP) Database v4.0: CO2 Conversion Factor Common Database; Ministry of Economy, Trade and Industry: Tokyo, Japan, 2012. (In Japanese) [Google Scholar]
- Navajas, A.; Mendiara, T.; Gandía, L.M.; Abad, A.; García-Labiano, F.; de Diego, L.F. Life cycle assessment of power-to-methane systems with CO2 supplied by the chemical looping combustion of biomass. Energy Convers. Manag. 2022, 267, 115866. [Google Scholar] [CrossRef] [Scilit]
- Khojasteh-Salkuyeh, Y.; Ashrafi, O.; Mostafavi, E.; Navarri, P. CO2 utilization for methanol production; Part I: Process design and life cycle GHG assessment of different pathways. J. CO2 Util. 2021, 50, 101608. [Google Scholar] [CrossRef] [Scilit]
- Cheng, T.; Hirota, T.; Onoda, H.; Pandyaswargo, A.H. LCCO2 assessment and fertilizer production from absorbed-CO2 solid matter in a small-scale DACCU plant. Energies 2024, 17, 5011. [Google Scholar] [CrossRef] [Scilit]
- MLIT. Technical Guideline on Cost–Benefit Analysis for Public Works Evaluation (Common Part); Ministry of Land, Infrastructure, Transport and Tourism: Tokyo, Japan, 2023; Available online: https://www.mlit.go.jp/tec/hyouka/public/230912/shishin/shishin230912.pdf (accessed on 21 July 2026). (In Japanese)
- METI Calculation Committee for Procurement Prices. Biomass Power Generation (Document 1, 83rd Meeting of the Calculation Committee for Procurement Prices); Agency for Natural Resources and Energy, Ministry of Economy, Trade and Industry: Tokyo, Japan, 2023; Available online: https://www.meti.go.jp/shingikai/santeii/pdf/083_01_00.pdf (accessed on 21 July 2026). (In Japanese)
- IEAGHG. Towards Improved Guidelines for Cost Evaluation of Carbon Capture and Storage; Technical Review 2021-TR05; IEA Greenhouse Gas R&D Programme: Cheltenham, UK, 2021. [Google Scholar]
- Ministry of the Environment, Japan. Guide for Preparing Comprehensive Life-Extension Plans for Waste Treatment Facilities (MSW Incineration Facilities); revised ed.; Ministry of the Environment: Tokyo, Japan, 2021. (In Japanese) [Google Scholar]
- Tribe, M.A.; Alpine, R.L.W. Scale economies and the “0.6 rule”. Eng. Costs Prod. Econ. 1986, 10, 271–278. [Google Scholar] [CrossRef] [Scilit]
- Towler, G.; Sinnott, R. Chemical Engineering Design: Principles, Practice and Economics of Plant and Process Design, 3rd ed.; Butterworth-Heinemann: Oxford, UK, 2021. [Google Scholar]
- Center for Low Carbon Society Strategy. Production of Methanol and Liquid Fuels Using Biomass-Gasification Gas and Captured CO2 (Technology Development); Proposal Paper for Policy Making No. fy2017-pp-09; Japan Science and Technology Agency: Tokyo, Japan, 2018; Available online: https://www.jst.go.jp/lcs/pdf/fy2017-pp-09.pdf (accessed on 2 July 2026). (In Japanese)
- Kesicki, F.; Ekins, P. Marginal abatement cost curves: A call for caution. Clim. Policy 2012, 12, 219–236. [Google Scholar] [CrossRef] [Scilit]
- Rubin, E.S.; Davison, J.E.; Herzog, H.J. The cost of CO2 capture and storage. Int. J. Greenh. Gas Control 2015, 40, 378–400. [Google Scholar] [CrossRef] [Scilit]
- Ueckerdt, F.; Bauer, C.; Dirnaichner, A.; Everall, J.; Sacchi, R.; Luderer, G. Potential and risks of hydrogen-based e-fuels in climate change mitigation. Nat. Clim. Change 2021, 11, 384–393. [Google Scholar] [CrossRef] [Scilit]
- European Union. Directive (EU) 2023/959 of the European Parliament and of the Council of 10 May 2023 amending Directive 2003/87/EC establishing a system for greenhouse gas emission allowance trading within the Union. Off. J. Eur. Union 2023, L 130, 134–202. [Google Scholar]
- Paulillo, A.; Sebastiani, A.; Lettieri, P.; Materazzi, M. Decarbonising waste-to-energy: A life cycle assessment study. Resour. Conserv. Recycl. 2024, 209, 107812. [Google Scholar] [CrossRef] [Scilit]
- Herraiz, L.; Struthers, I.; Su, D.; Muslemani, H.; Lucquiaud, M.; Thomson, R.C. Life cycle assessment of four waste-to-energy plant configurations equipped with post-combustion carbon capture and storage. Int. J. Greenh. Gas Control 2026, 151, 104588. [Google Scholar] [CrossRef] [Scilit]
- Tariq, G.; Chen, Z.; Zhao, M. Techno-economic and life cycle assessment of integrated bio- and e-methanol production from biomass with carbon capture and utilization. Chem. Eng. J. 2025, 515, 163850. [Google Scholar] [CrossRef] [Scilit]
- Liu, J.; Huang, Z.; Wang, X. Economic and Environmental Assessment of Carbon Emissions from Demolition Waste Based on LCA and LCC. Sustainability 2020, 12, 6683. [Google Scholar] [CrossRef] [Scilit]
- Liu, J.; Xu, D.; Kong, X. Exploring the Interaction Mechanisms of Behavioral Options and Policy Regulation for Construction Waste and Carbon Reduction. Eng. Constr. Archit. Manag. 2025. ahead of print. [Google Scholar] [CrossRef] [Scilit]
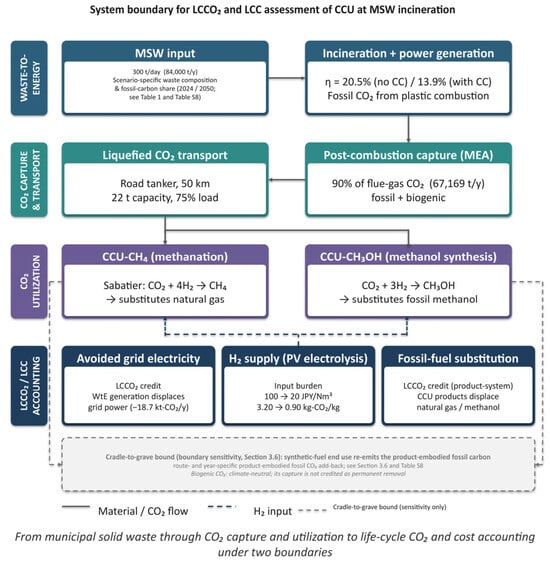
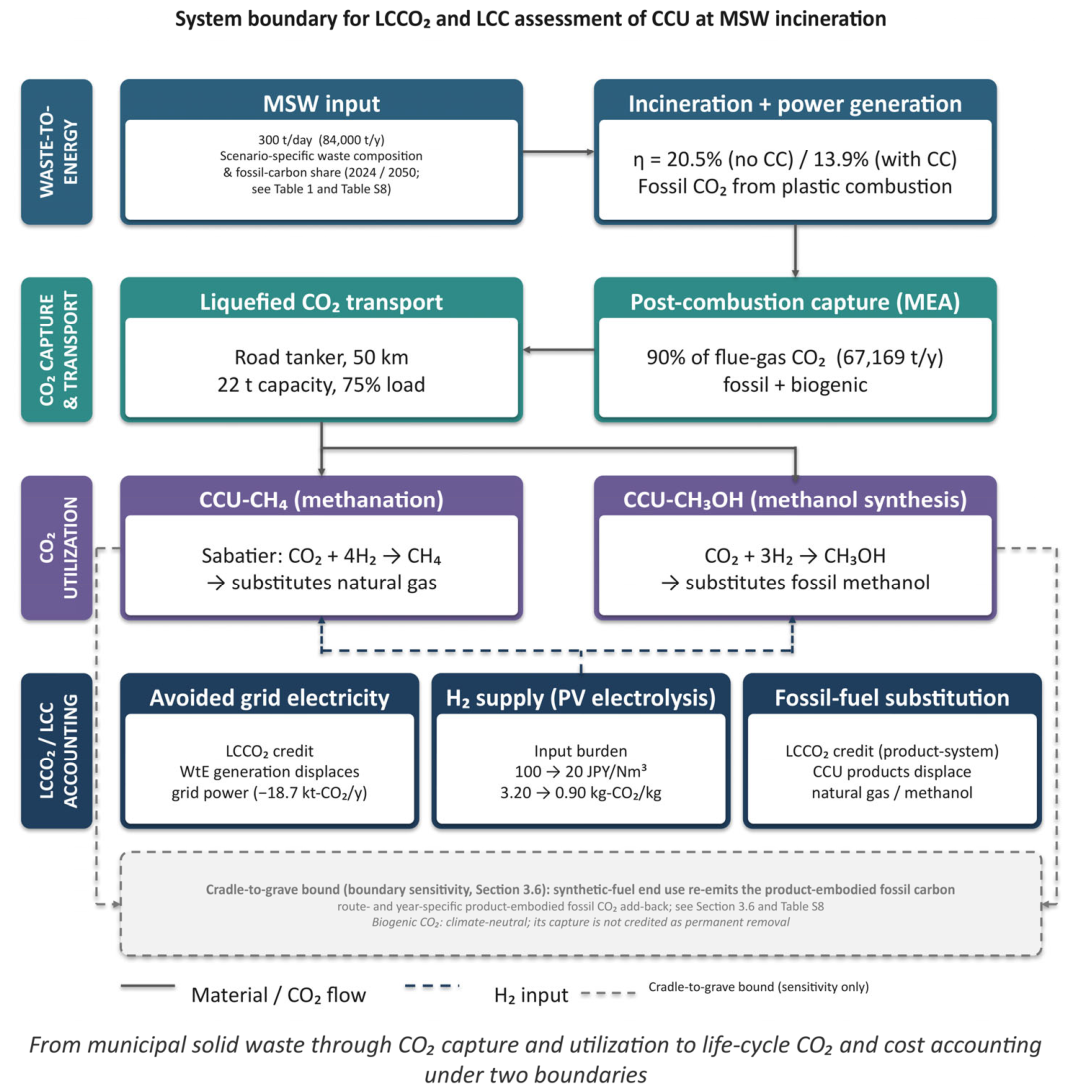
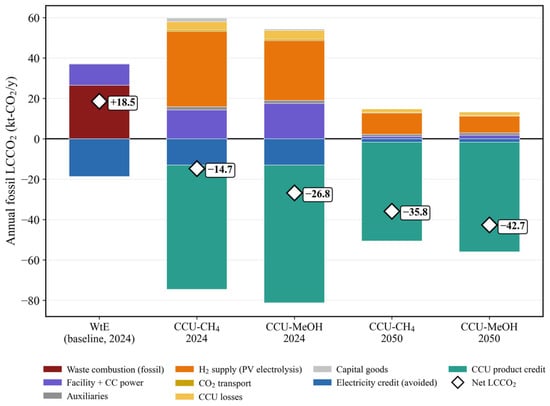
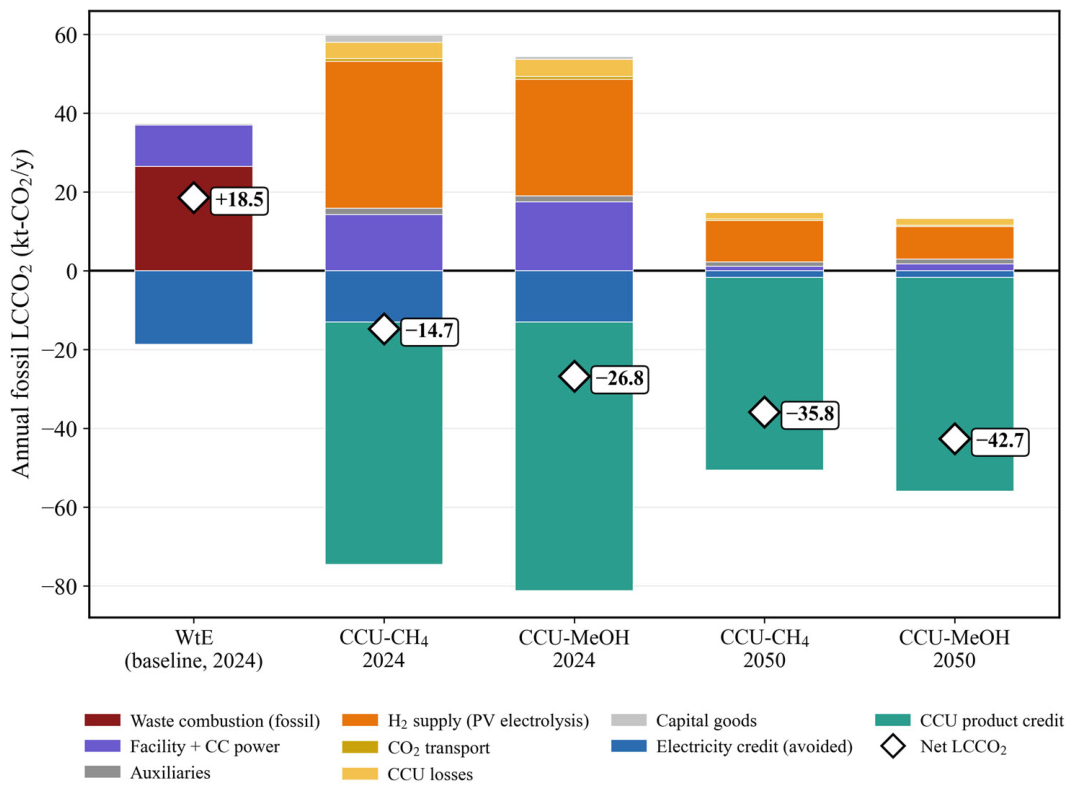
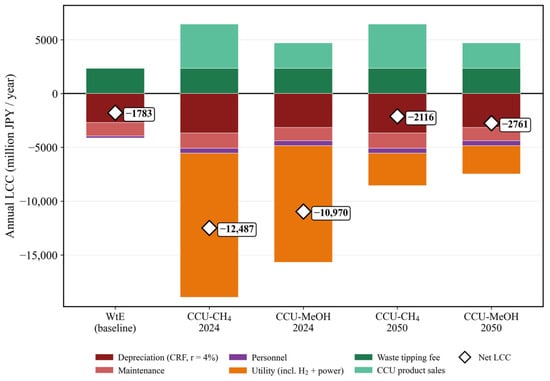
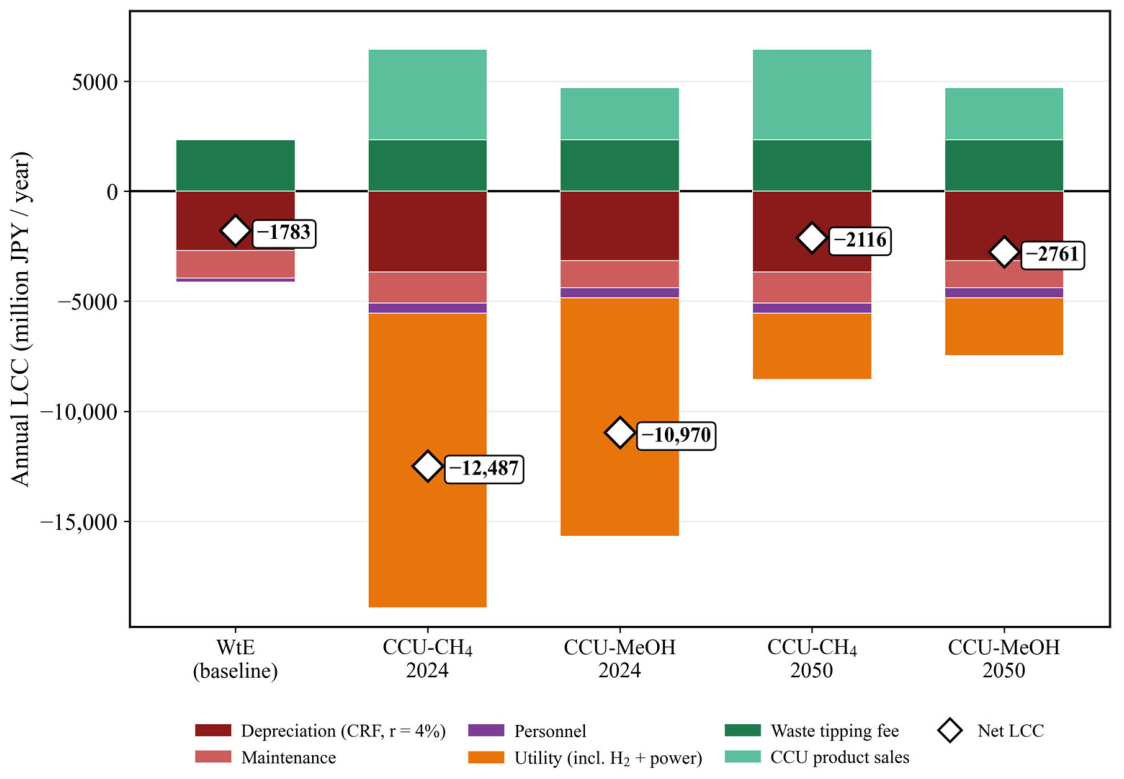
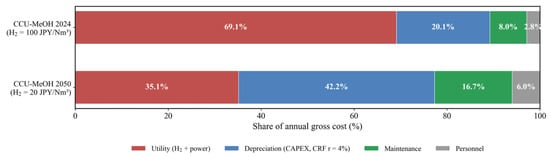
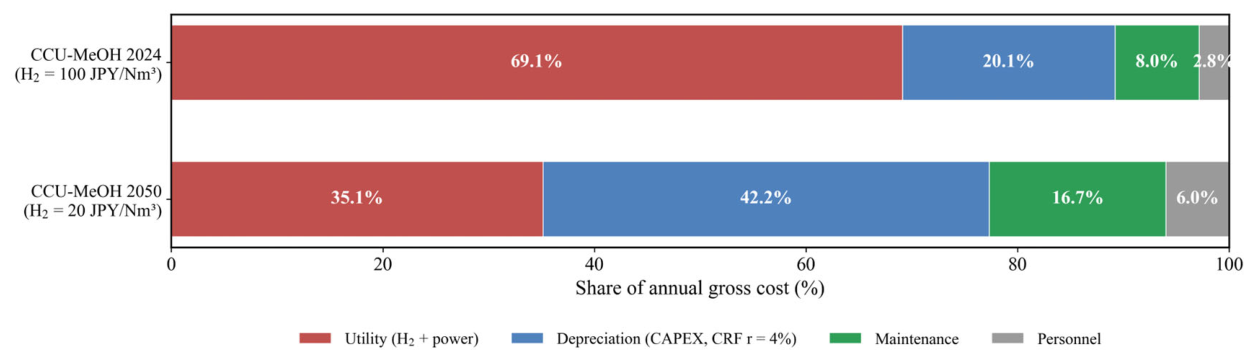
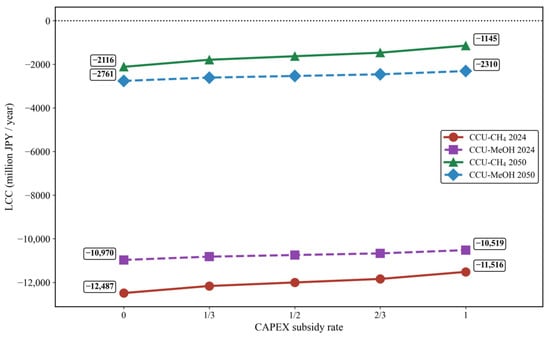
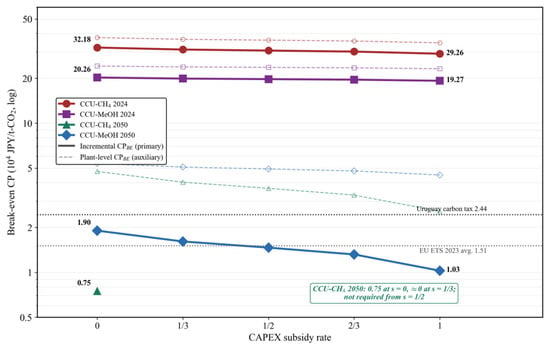
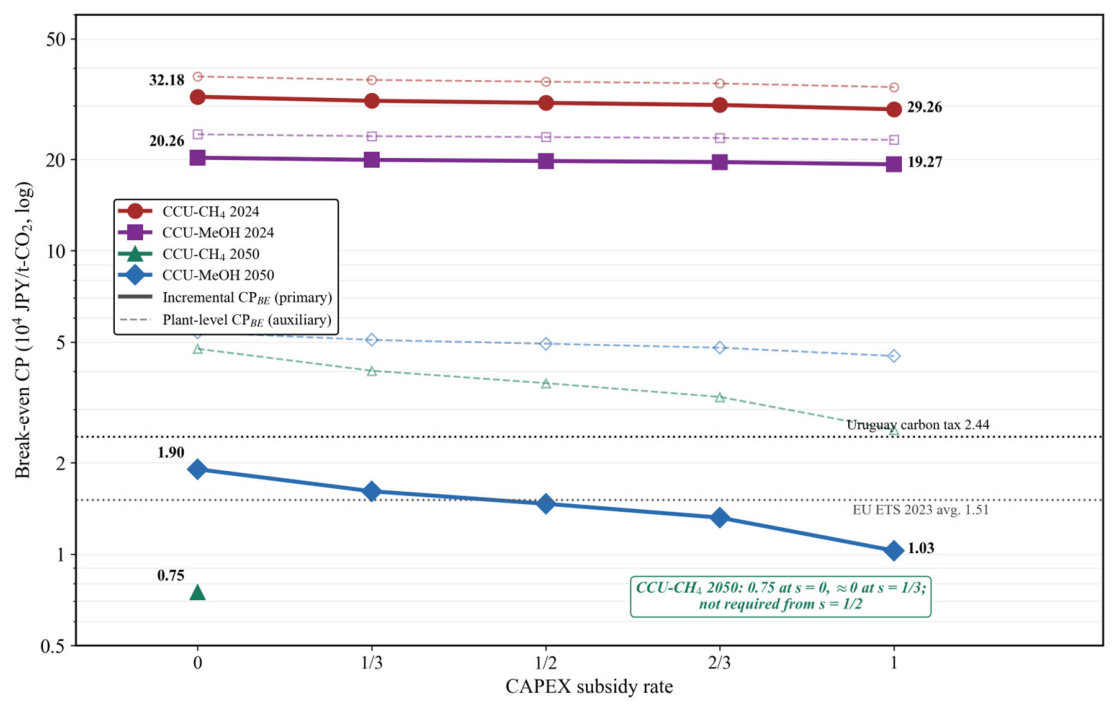
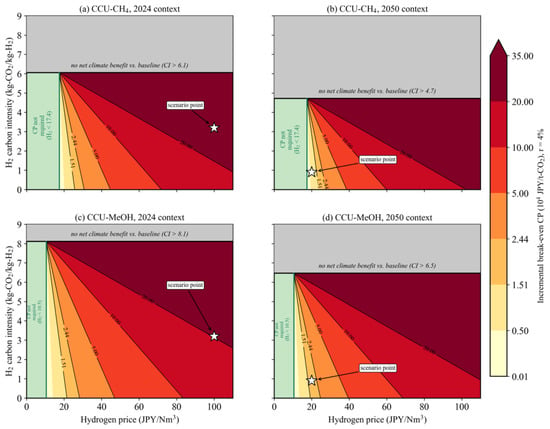
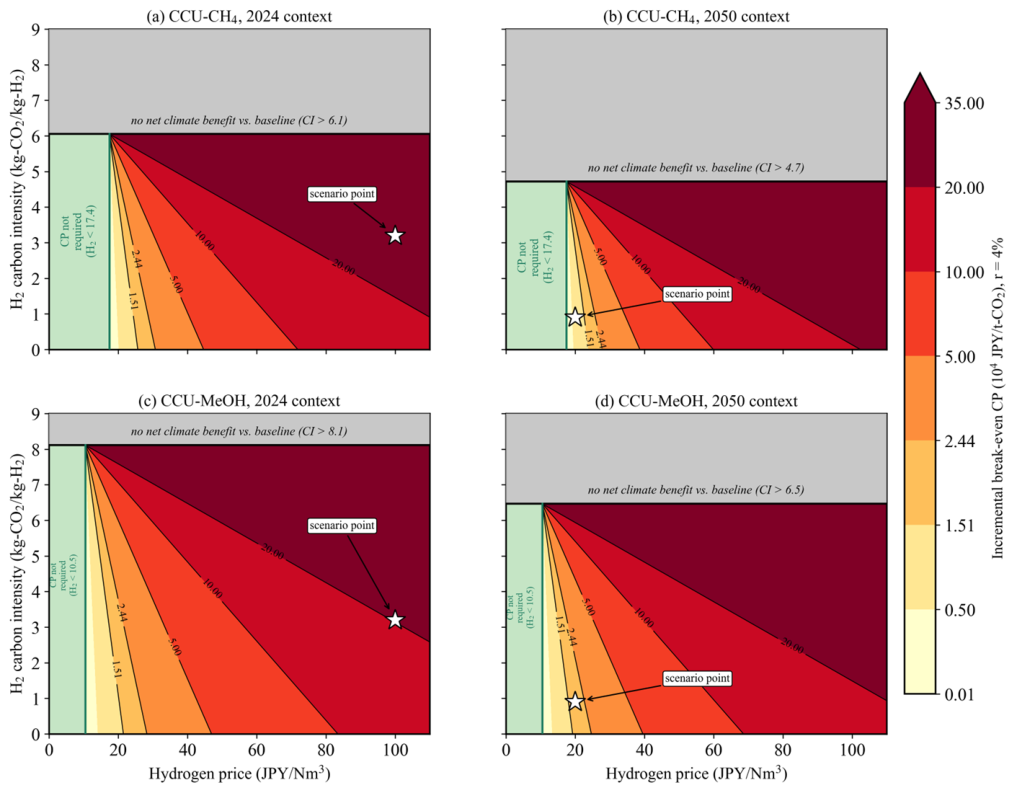

Disclaimer/Publisher’s Note: The statements, opinions and data contained in all publications are solely those of the individual author(s) and contributor(s) and not of MDPI and/or the editor(s). MDPI and/or the editor(s) disclaim responsibility for any injury to people or property resulting from any ideas, methods, instructions or products referred to in the content. |
© 2026 by the authors. Licensee MDPI, Basel, Switzerland. This article is an open access article distributed under the terms and conditions of the Creative Commons Attribution (CC BY) license.