


Abstract
Provincial power systems must decarbonize while sustaining rapid demand growth and improving air quality; yet, few integrated assessments separate the contributions of renewable expansion and carbon capture, utilization, and storage (CCUS) for China’s less-developed regions. We apply the Low Emissions Analysis Platform (LEAP) to model Guangxi’s power system to 2060 under four scenarios—Reference (BAS), Renewable-driven (RES), CCUS-intensive (CCS), and an Integrated comprehensive-policy scenario (ICS). Under ICS, solar photovoltaic generation rises from 38 TWh in 2025 to 408 TWh in 2060 (close to half of all generations), non-fossil capacity grows by about 730%, and power-sector CO2 falls by roughly 95% relative to BAS. A counterfactual decomposition shows that CCUS provides about 75% of the CO2 reduction along the coal-retaining CCS pathway but only about 5% along the renewables-led ICS pathway and reduces neither SO2 nor NOx. The air-quality co-benefits—up to 82%, 78%, and 73% lower SO2, NOx, and PM2.5 than BAS—arise mainly from renewable substitution, which also abates carbon more cheaply (about 120–190 versus 300 CNY t−1 CO2) while sharply raising flexibility needs. Once avoided fuel and carbon-market costs are included, the renewables-led pathways become net cost-saving on a full-system basis and yield a monetized air-quality health co-benefit roughly twice that of the CCUS-intensive route. The findings give policy-relevant guidance for sustainable low-carbon transitions in Guangxi and comparable emerging regions.
1. Introduction
Climate change mitigation and air-quality improvement are two of the most pressing sustainability challenges confronting China. Following its pledge to peak carbon dioxide (CO2) emissions before 2030 and to achieve carbon neutrality before 2060, the country has placed the decarbonization of its electricity sector—the single largest source of energy-related CO2—at the center of national strategy [1,2,3]. Because electricity demand, resource endowments, and industrial structure differ sharply across provinces, the national targets ultimately have to be delivered through province-level transitions, each with its own feasible technology mix and cost structure [4,5,6]. Understanding how individual provinces can reconcile continued economic growth with deep decarbonization is therefore essential for translating aspiration into implementable policy.
Guangxi, an ethnic-minority autonomous region in southern China, is an instructive case. It is a relatively less-developed province with electricity consumption still growing rapidly, but it already hosts one of the most renewable-rich power systems in the country. By the end of 2024, its total installed generating capacity reached about 94.8 GW, of which new energy sources (wind, solar, and biomass) accounted for roughly 43.5%, making renewables the single largest source of capacity [7]. Wind and solar capacity grew by 41.6% and 81.2% year-on-year in 2024, respectively, while the Fangchenggang nuclear plant and the cascade hydropower stations on the Hongshui River provide substantial firm low-carbon output [8,9,10]. At the same time, around 32.6 GW of coal-fired capacity remains the backbone of system reliability. Guangxi thus embodies the central dilemma of the Chinese energy transition: how to scale up variable renewables and manage a large existing coal fleet simultaneously while continuing to satisfy fast-rising demand.
Two technology families dominate discussions of power-sector decarbonization. The first is the large-scale expansion of variable renewable energy (VRE), particularly solar PV, whose levelized cost has fallen by more than 80% over the past decade and is now frequently the cheapest source of new generation [11,12]. The second is carbon capture, utilization, and storage (CCUS), which can abate the CO2 emissions of retained thermal plants and is widely regarded as indispensable for hard-to-abate residual emissions [13,14,15,16]. These two options are often treated as complementary, but they differ fundamentally in their wider sustainability footprint: renewable substitution removes the combustion process entirely and therefore eliminates both CO2 and co-emitted air pollutants such as sulphur dioxide (SO2) and nitrogen oxides (NOx), whereas CCUS targets only the CO2 stream and leaves—or even slightly increases—the energy penalty and conventional pollutant burden of the underlying coal plant [17]. The distinction matters greatly for provinces such as Guangxi, where the public-health benefits of cleaner air are an immediate policy priority alongside the longer-term climate goal.
Integrated long-term planning tools are needed to compare these pathways consistently. The Low Emissions Analysis Platform (LEAP), a widely used bottom-up energy–environment accounting framework, has been applied to national and sub-national systems worldwide to project demand, simulate the supply mix, and account for the associated greenhouse-gas and pollutant emissions [18,19]. Numerous Chinese studies have used LEAP to explore power-sector or provincial decarbonization, but two gaps remain. First, comparatively few quantify the joint carbon–air pollutant co-benefits of this transition for the less-developed western and southern provinces, where the structure of the system differs from the wealthy coastal regions that dominate the literature [20,21,22]. Second, most scenario studies bundle renewables and CCUS together, so the marginal contribution of CCUS—and whether that contribution is robust concerning the speed of renewable substitution—is rarely isolated.
This study addresses both gaps. We build a detailed LEAP model of Guangxi’s power system spanning 2024–2060 and design four scenarios that span the plausible policy space: a Reference scenario (BAS) that extends current strong momentum, a Renewable-driven scenario (RES) that emphasizes aggressive solar and wind growth, a CCUS-intensive scenario (CCS) that retains the coal fleet but retrofits it with progressively deeper capture, and an Integrated comprehensive-policy scenario (ICS) that combines the most ambitious renewable build-out with coal phase-down and broad CCUS. To separate the role of CCUS from that of renewable substitution, we additionally run counterfactual variants of the CCUS-bearing scenarios in which capture is switched off. The analysis quantifies, for each pathway, the evolution of the generation mix, the trajectory of CO2 emissions, the SO2 and NOx co-benefits, and the system-flexibility burden created by high VRE penetration. This provincial focus complements the few existing integrated assessments of Guangxi and of neighboring renewable-rich systems, which have so far relied mainly on top-down economy-wide or aggregate power-sector models [23].
The contribution of the paper is threefold. First, whereas existing assessments of Guangxi rely on top-down, economy-wide, computable-general-equilibrium modelling and the few bottom-up power-sector LEAP studies of neighboring systems bundle renewable and CCUS measures together [24,25], this study provides a technology-resolved carbon-air-pollutant co-benefit assessment dedicated to a renewable-rich but still-developing province. Second, it disentangles, through an explicit no-CCUS counterfactual, the distinct and sometimes overlapping roles of solar PV expansion and CCUS, showing that their contributions to carbon abatement and to air-quality improvement diverge sharply. Third, it draws out the flexibility and abatement–cost implications of very high renewable shares. The remainder of the paper is organized as follows. Section 2 describes the LEAP framework, the scenario design, and the emission-accounting methodology. Section 3 presents the results for the generation mix, emissions, and co-benefits. Section 4 discusses the policy implications and limitations, and Section 5 concludes.
2. Materials and Methods
2.1. The LEAP Modelling Framework
The analysis was carried out in the Low Emissions Analysis Platform (LEAP) (version 2024, Stockholm Environment Institute, Somerville, MA, USA), an integrated bottom-up modelling environment developed by the Stockholm Environment Institute and used in more than 190 countries for energy planning and climate-policy assessment. LEAP couples a demand module, a transformation (supply) module, and an environmental-loadings module within a single accounting framework. In this study, the demand module drives an exogenous electricity-requirement trajectory; the transformation module dispatches the modelled generating fleet to meet that requirement, and the environmental module converts the resulting fuel use and generation into CO2 and air-pollutant emissions using technology-specific emission factors. The base year is 2024, and the simulation horizon extends to 2060, consistent with China’s carbon-neutrality target year. Results are reported for representative milestone years (2024, 2030, 2035, 2040, 2045, 2050, 2055, and 2060).
The power system is represented by seven generating technologies—hydropower, coal, natural gas, biomass, onshore wind, solar PV, and nuclear—calibrated to Guangxi’s 2024 installed capacity of 94.77 GW. Each technology is characterized by a capacity credit, capital cost, fixed and variable operation-and-maintenance costs, process efficiency, maximum availability, and lifetime, summarized in Table 1. Annual generation is obtained from installed capacity and a technology-specific capacity factor derived from observed 2024 utilization hours, with thermal plants additionally constrained to balance the residual load after must-run renewable and nuclear output, as described in Section 2.5.
Table 1.
Techno-economic and operating parameters of the modeled generation technologies and corresponding data sources (2024 base year). Capital and fixed O&M costs are in 103 CNY MW−1; variable O&M is in CNY kWh−1.
Figure 1 summarizes the overall modelling framework. Five blocks of data inputs—installed capacity by technology and scenario, techno-economic parameters, emission factors, CCUS capture-rate trajectories, and fuel and carbon prices—feed the three coupled LEAP modules (demand, transformation, and environment), which in turn generate the generation-mix, CO2, air-pollutant, and flexibility outputs. The four scenarios and the CCUS-off counterfactuals parameterize every model run.
Figure 1.
Modelling framework of the Guangxi power-system LEAP analysis. Data inputs (left) feed the three coupled LEAP modules (centre), which produce the model outputs (right); the four scenarios and CCUS-off counterfactuals parameterize each run.
2.2. Study System and Electricity-Demand Projection
Electricity demand is projected from Guangxi’s 2024 total consumption of 261.4 TWh [26] using a phased sectoral growth model. Three growth phases are assumed, reflecting the national policy timeline: a carbon-peaking phase to 2030 with an average annual growth rate of 6.5%, a post-peak consolidation phase (2031–2040) at 3.5%, and a carbon-neutrality deepening phase (2041–2060) at 1.8%. Applying these rates to the nine consuming sectors yields a total electricity consumption that rises to 381.3 TWh in 2030 and 768.6 TWh in 2060. To convert end-use consumption into the generation that the supply side must provide, a constant 6% allowance for transmission-and-distribution losses and station own-use is applied, giving a required generation of 278.0 TWh in 2024 rising to 817.6 TWh in 2060.
These phase-specific growth rates are grounded in Guangxi’s recent experience and in provincial and national planning rather than assumed arbitrarily. Provincial electricity consumption has expanded by roughly 6–8% per year over the past decade and grew strongly again in 2024 [7,26], so the 6.5% carbon-peaking-phase rate is a moderate continuation of observed momentum. The subsequent step-downs to 3.5% after 2030 and 1.8% after 2040 reflect the expected saturation of industrial electricity intensity, slowing population and urbanization growth, and the efficiency objectives embedded in Guangxi’s 14th Five-Year Plan for energy development and national carbon-peaking guidance [1,27]; they are consistent with the demand trajectories adopted in comparable Chinese provincial and regional power-sector studies. Because demand is nonetheless the single most uncertain driver of residual emissions, its influence is bracketed explicitly by the ±1 percentage-point sensitivity analysis in Section 3.7. A ±1 percentage-point band was adopted because, compounded over the 36-year horizon, it already produces a wide spread in 2060 demand (541–1088 TWh; Section 3.7) and in the associated residual coal use and emissions, so it is informative about result sensitivity without assuming a structural break from Guangxi’s observed 6–8% historical growth corridor. We agree that a wider band, and a more systematic treatment of demand uncertainty alongside the other techno-economic parameters, would further strengthen the analysis; we identify this as part of the broader uncertainty analysis discussed in Section 4.
Sectoral demand in each phase grows geometrically (Equation (1)), and the electricity that the supply side must generate is obtained by inflating end-use demand for network losses and station own-use (Equation (2)):
where Dt is electricity consumption in year t, rp the phase-specific growth rate, Gt the required generation, and λ the loss-and-own-use fraction (6%).
Dt = Dt−1 × (1 + rp)
Gt = Dt/(1 − λ)
Figure 2 shows the resulting demand trajectory disaggregated by the consuming sector together with the three growth phases. Manufacturing remains the dominant load throughout, while the household and tertiary sectors grow their shares over time.
Figure 2.
Projected electricity demand of Guangxi, 2024–2060. (a) Sectoral electricity consumption; (b) total demand and the assumed annual growth rate across the carbon-peaking (6.5%/yr), consolidation (3.5%/yr), and neutrality-deepening (1.8%/yr) phases. Consumption is in TWh and the growth rate in % yr−1.
2.3. Scenario Design
Four scenarios were constructed to span the policy space between business-as-usual and deep decarbonization. They share the same demand trajectory and techno-economic parameters but differ in their capacity-expansion pathways and in the depth of CCUS retrofitting applied to the coal fleet (Table 2). In all scenarios, wind capacity follows the same ambitious build-out (rising from 18.1 GW in 2024 to 160 GW in 2060); the scenarios are differentiated chiefly by the scale of solar PV, the trajectory of coal capacity, and the intensity of CCUS.
Table 2.
Definition of the four power-system scenarios for Guangxi, 2024–2060.
The BAS scenario assumes that the coal fleet continues to expand through the peaking period before gradually retiring, with only incremental efficiency improvements and essentially no carbon capture. The RES scenario maximizes solar and wind deployment and allows the coal fleet to shrink to 12 GW, supported by moderate CCUS. The CCS scenario deliberately retains a large coal fleet (about 30 GW in 2060) but equips it with progressively deeper capture, so that the effective fleet-average capture rate reaches roughly 18% in 2030, 56% in 2040, and 90% in 2060; it represents a pathway in which CCUS, rather than renewable substitution, does most of the decarbonization work. The ICS scenario is the most ambitious overall, combining the largest solar build-out (450 GW) with an almost complete coal phase-down (to 7 GW) and broad but shallower CCUS on the residual fleet.
Because Guangxi’s committed wind, solar, and nuclear build-out is already substantial [27], even the Reference case—retained under the code BAS for consistency with the input dataset—reaches a high non-fossil share by 2060. It should therefore be read as a current-momentum reference that embeds already legislated renewable policy rather than as a frozen-technology baseline; it serves as the common benchmark against which the incremental effects of the more ambitious RES, CCS, and ICS pathways are measured.
The solar targets adopted here—450 GW in ICS and 175–320 GW in the other scenarios—are bounded by Guangxi’s solar resource and land availability rather than assumed arbitrarily. Guangxi receives a moderate but usable solar resource (about 1300 annual full-load hours, the basis of the 0.15 capacity factor in Table 1), and provincial and national assessments place its technical photovoltaic potential—aggregated across building rooftops, agrivoltaics, fishery-PV, highway and reservoir slopes, and marginal hill land—at the multi-terawatt scale, far above the levels modelled here [9,28,29]. At a typical utility-scale footprint of about 0.016 km2 MW−1, 450 GW would occupy on the order of 7000 km2, roughly 3% of Guangxi’s 237,600 km2 land area, and much of this can be met without competing with cropland through the distributed and dual-use deployment already underway (distributed systems reached about 10 GW by 2024) [7,28,30]. The 450 GW level should therefore be read as a deliberate upper-bound mobilization in the most ambitious scenario—implying an average build rate of roughly 12 GW yr−1, comparable to recent provincial additions—rather than as a central forecast, with the more conservative scenarios spanning the intervening range. Although the cited technical-potential assessments are not all Guangxi-specific, provincial deployment data lend some support to the plausibility of this scale: Guangxi’s distributed PV alone reached about 10 GW by 2024 amid 81% year-on-year growth in provincial solar capacity, and other Chinese provinces have already sustained comparable deployment intensity—cumulative installed PV capacity exceeds 40 GW in both Shandong and Hebei, and China added a record 277 GW of solar nationally in 2024 alone [31], so the roughly 12 GW yr−1 average build rate implied by the 450 GW ICS target is aggressive relative to Guangxi’s own history but not without precedent nationally. That said, reaching this scale within a single province would also require sustained transmission and grid-connection investment, continued expansion of polysilicon, wafer, cell, and inverter manufacturing capacity, a skilled installation and maintenance workforce, and careful siting to avoid conflict with cropland and ecologically sensitive land; these transmission, supply-chain, workforce, and social/ecological land-use constraints were not explicitly modelled here and could bind before the technical land-availability limit is reached. We therefore frame the 450 GW figure explicitly as an aspirational upper bound contingent on these enabling conditions being met rather than as a resource-constrained technical ceiling and identify a fuller feasibility assessment—covering transmission expansion plans, annual installation capacity, and workforce and supply-chain scaling—as a priority for future work.
2.4. Emission Accounting and CCUS Representation
CO2 emissions are computed in the LEAP environmental module from generation and technology-specific emission factors. Coal combustion is assigned a base emission factor of 0.832 t CO2 MWh−1 (derived from the IPCC 2006 default for bituminous coal and the efficiency of Guangxi’s ultra-supercritical fleet) and natural gas 0.202 t CO2 MWh−1 [32]. Biomass is treated as carbon-neutral at the point of combustion in accordance with IPCC convention, and hydro, wind, solar, and nuclear are assigned zero operational CO2. CCUS is represented as a time- and scenario-dependent reduction of the effective coal emission factor: the net factor equals the base factor multiplied by (1 – capture rate), with capture-rate trajectories specified for each scenario. By 2060, the effective coal factor falls to about 92% of its base value in BAS, 75% in RES, 51% in ICS, and only 10% in the deep-capture CCS scenario. This effective-emission-factor representation captures the reduced carbon content of the coal fleet’s output but, in the central scenario definitions themselves, does not separately add the extra fuel burned to power solvent regeneration, CO2 compression, transport, and storage; that parasitic energy penalty (8–12 percentage points of net efficiency, equivalent to a 15–25% reduction in net output) is instead introduced explicitly as a sensitivity case in Section 3.7, where it raises 2060 CCS emissions from 4.0 to 4.7–5.2 Mt. Because the penalty is tested only as a sensitivity and not folded into the central CCS and ICS runs, the central-case CCUS generation and abatement–cost figures should be read as a moderately optimistic bound on CCUS performance.
CCUS is represented as a reduction of the effective coal emission factor by the scenario- and time-specific capture rate (Equation (3)); total power-sector CO2 is then the generation-weighted sum of technology emission factors (Equation (4)):
where ηt is the fleet-average capture rate, EFi,t the (CCUS-adjusted) emission factor of technology i, and CEt the annual power-sector CO2 emissions. Air-pollutant emissions are computed analogously, with capture-equipped units receiving an additional SO2/NOx removal scaled by ηt.
EFcoal,tnet = EFcoalbase × (1 – ηt)
CEt = Σi Ei,t × EFi,
Air-pollutant emissions of SO2, NOx, and PM2.5 are computed from coal, gas, and biomass generation using post-control emission factors consistent with China’s ultra-low-emission limits for coal-fired power (built on the thermal-power emission standard GB 13223-2011); for coal these are 0.10, 0.10, and 0.005 g kWh−1 for SO2, NOx, and PM2.5, respectively [33]. Because CCUS solvent systems require additional desulphurization and denitrification of the flue gas, coal units fitted with capture in the CCS and ICS scenarios receive an additional SO2/NOx removal of up to 80%, scaled by the capture rate. Crucially, in scenarios without CCUS, the conventional pollutant factors are unchanged, so that any difference in SO2 and NOx between scenarios reflects the displacement of coal generation by renewables rather than the capture process itself. The 80% ceiling on additional SO2/NOx removal follows the flue-gas pretreatment requirements documented for amine-based post-combustion capture, where the deep desulphurization and denitrification needed to protect the solvent from degradation deliver pollutant co-removal beyond the ultra-low-emission baseline [34]. We attribute this co-removal to the pretreatment train that a capture retrofit necessitates rather than to the CO2-capture process itself; because this pretreatment is applied only to capture-equipped units in our accounting, we describe it as a CCUS-linked benefit while recognizing that, in principle, the same pretreatment could be installed on non-capture units independently of CCUS.
To translate avoided air-pollutant emissions into a public-health metric, the scenario reductions in SO2, NOx, and PM2.5 relative to BAS were monetized using a benefit-transfer approach. Each cumulative avoided emission over 2025–2060 was multiplied by central unit health-damage values derived from previous assessments of air-pollution-related health impacts and economic losses in China’s power sector. Specifically, representative damage factors of approximately 3 × 10⁴ CNY t−1 for SO2, 1.8 × 10⁴ CNY t−1 for NOx, and 3.5 × 10⁵ CNY t−1 for primary PM2.5 were adopted based on China-specific health impact assessments and power-sector pollution-control studies [20,21,35,36]. Among these pollutants, the monetized damages associated with SO2 and NOx mainly reflect their contributions to secondary PM2.5 formation, while the PM2.5 damage factor represents the direct health impacts associated with particulate exposure [20,21,35,36]. These values are used as central estimates for scenario comparison rather than precise location-specific health-damage estimates for Guangxi. The resulting estimate is reported as a central value with a low–high range and is deliberately conservative because the modelled coal fleet already meets China’s ultra-low-emission standard. In detail, the avoided tonnage of each pollutant is accumulated over the full 2025–2060 horizon, multiplied by its unit damage value, and summed; the central estimate uses the mid-point of each damage range and the low–high bounds use its extremes, so the reported range reflects valuation uncertainty rather than emission uncertainty. The unit values are benefit-transfer estimates from Chinese power-sector health-impact studies and embed concentration–response and value-of-statistical-life assumptions; because they are applied to an already ultra-low-emission fleet and omit ozone and broader morbidity effects, the resulting co-benefit is a conservative lower bound, and it is reported undiscounted to match the other economic indicators. We did not derive Guangxi-specific concentration–response functions or value-of-statistical-life estimates; the low–high range therefore reflects the spread already reported across the source studies [20,21,35,36] rather than a Guangxi-specific uncertainty analysis, and the transferability of national or regional Chinese unit values to Guangxi’s population density, baseline air quality, and income level is an acknowledged source of additional uncertainty that a dedicated benefit-transfer or local exposure–response study could resolve in future work.
2.5. Dispatch Logic and Counterfactual Decomposition
For each year and scenario, must-run output from hydro, nuclear, wind, solar, and biomass is first calculated from installed capacity and capacity factor (hydro 0.42, nuclear 0.85, wind 0.26, solar 0.15, biomass 0.65). The residual demand is then met by the thermal fleet, with a minimum coal output equivalent to a 10% capacity factor retained for firm capacity, reserve, and inertia services. Where must-run renewable output exceeds demand, the surplus is recorded as potential variable-renewable curtailment, a transparent no-storage indicator of the system’s flexibility requirement. To isolate the contribution of CCUS, each capture-bearing scenario (CCS and ICS) was additionally run with capture switched off—the coal fleet then follows the BAS effective-emission-factor trajectory while all other assumptions are held fixed. The difference in 2060 CO2 between the with-CCUS and no-CCUS variants measures the CCUS contribution, and the remainder of the reduction relative to BAS is attributed to renewable substitution and coal phase-down.
Formally, must-run generation from each non-thermal technology i is the product of installed capacity, capacity factor, and the hours in a year (Equation (5)); the coal fleet then supplies the residual load subject to a minimum firm-output floor (Equation (6)):
where Ei,t is the generation of technology i, CFi its capacity factor, and the floor term Efloor,t (in Equation (4)) is the minimum coal output retained for firm capacity, reserve, and inertia (10% capacity factor).
Ei,t = Ci,t × CFi × 8760
Ecoal,t = max(Gt – Σi Ei,t, Efloor,t)
Because the framework resolves an annual energy balance rather than hourly chronological operation, it does not explicitly represent unit-commitment constraints (ramping, minimum-load, and start-up limits beyond the coal floor), storage charge–discharge cycles, or intra-provincial network limits. The potential-curtailment term defined above is therefore an upper bound on the flexibility gap—the variable-renewable energy that could not be absorbed in the complete absence of storage, demand response, or expanded interchange—and not a forecast of energy that would actually be spilled once such resources are deployed. The renewable-integration results should accordingly be read as indicating the scale of the flexibility investment required (quantified in Section 3.4), and the coupling of LEAP with an hourly dispatch-and-storage model is identified as priority future work in Section 4. Limitations of the annual dispatch representation. The LEAP application in this study is based on annual energy balancing rather than chronological hourly unit commitment and economic dispatch. Consequently, the model cannot explicitly represent intraday ramping constraints, minimum stable generation levels, reserve requirements, or chronological storage operation. As a result, annual solar curtailment may be somewhat overestimated because an hourly dispatch model could exploit greater coal flexibility, storage cycling, and interprovincial electricity exchanges to absorb midday PV surplus. Conversely, short-duration supply shortages and flexibility requirements during low-renewable periods may be underestimated because temporal variability is averaged over the year. These limitations primarily affect the quantitative values of curtailment and storage requirements rather than the long-term transition trends identified in this study; the storage-sensitivity assumptions in Section 3.4 (a fixed daily cycle) are subject to the same chronological limitation. Future work will couple LEAP with an hourly chronological dispatch model to improve operational realism.
2.6. Base-Year Calibration
The 2024 base year was checked against reported provincial statistics [37] (Table 3). The model reproduces the official installed capacity (94.77 GW) exactly and the firm, dispatchable output—thermal and nuclear generation—to within about 10–12% of the reported values. Modeled hydropower and variable-renewable generation exceed the single-year 2024 figures for two understood reasons. First, 2024 was an exceptional year in which wind, solar, and hydropower output grew by 42%, 81%, and 49% year-on-year, so capacity installed during the year operated for only part of 2024 and the end-of-year capacity used in the model overstates the realized annual output. Second, the model assumes that provincial generation balances provincial demand and therefore excludes the roughly 17 TWh that Guangxi imported through the China Southern Power Grid in 2024. The base year is thus best read as a normalized full-operation year; because the scenario conclusions rest on the relative differences between pathways rather than on reproducing a single historical year, they are robust to these base-year effects.
Table 3.
Calibration of the 2024 base year: modeled versus reported values.
Reported generation: National Energy Administration/China Southern Power Grid 2024 provincial statistics [38]. Differences in hydropower and variable-renewable generation reflect within-year capacity growth and net interprovincial imports rather than model error (see text). Expressed as a percentage deviation from the reported 2024 values in Table 3, the calibration gap is +29.6% for hydropower, −11.4% for thermal generation (coal, gas, and biomass combined), +35.1% for wind power, +196.7% for solar PV, and +10.5% for nuclear power. Although the relative deviation for solar PV appears large, the corresponding absolute difference is only 17.9 TWh and is primarily attributable to the exceptionally rapid expansion of installed solar capacity during 2024. Specifically, Guangxi’s installed solar capacity increased from approximately 11.3 GW at the end of 2023 to 20.5 GW at the end of 2024. The LEAP model represents a normalized full-operation year based on end-of-year installed capacity, whereas the reported annual generation reflects the actual commissioning schedule, under which newly installed capacity contributed electricity generation for only part of the year. The same mechanism explains the higher solar generation projected under the ICS pathway in 2025. In this scenario, installed solar capacity is projected to increase further from 20.5 GW in 2024 to approximately 29.0 GW in 2025, consistent with the observed year-on-year solar capacity growth of approximately 81% in Guangxi during 2024.
The approximately 17 TWh of net interprovincial electricity imports reported in the official statistics were intentionally excluded from the calibration because the LEAP model represents only electricity generated within Guangxi to satisfy provincial electricity demand. Explicitly accounting for imported electricity would require modelling the generation portfolios and dispatch of exporting provinces, which is beyond the scope of a single-province power system model. Consequently, the “Total Generation” reported in Table 3 represents provincial electricity generation rather than provincial electricity supply. This modelling assumption has now been clarified in the revised manuscript.
To further evaluate the robustness of the calibration, an additional historical consistency check was performed using officially reported Guangxi installed capacities and generation data for 2020. Applying the same technology-specific performance assumptions adopted in the LEAP model to the actual end-of-2020 installed capacities (17.6 GW hydropower, 6.5 GW wind power, 2.1 GW solar PV, and 2.2 GW nuclear power) reproduced the observed generation pattern with deviations of +16.4% for hydropower, +62.9% for wind power, +190.0% for solar PV, and −4.1% for nuclear power. Importantly, the relative ranking of these deviations is consistent with that observed for the 2024 base-year calibration, with the smallest deviation occurring for the mature and slowly expanding nuclear fleet and the largest deviation occurring for the rapidly expanding solar PV sector. This additional historical consistency check indicates that the observed calibration differences are primarily associated with differences between end-of-year installed capacity and actual within-year commissioning schedules, rather than reflecting year-specific deficiencies in the LEAP model.
A complete technology-resolved historical validation covering the entire 2015–2024 period was not undertaken because consistent technology-resolved provincial generation statistics are complicated by frequent reclassification across years; we therefore validate at two well-documented anchor years (2020 and 2024). Nevertheless, the combination of the 2024 base-year calibration and the independent 2020 historical consistency check provides evidence that the model reproduces the principal characteristics of Guangxi’s electricity system and that the observed deviations can be explained by identifiable structural factors rather than systematic modelling errors. A comprehensive multi-year historical validation will be pursued in future work as additional historical data become available.
Table 4 summarizes this out-of-sample comparison. The solar-PV deviation is almost identical in the two independent years (+190.0% in 2020 and +196.7% in 2024), confirming that it is a fixed structural consequence of applying normalized full-load hours to end-of-year installed capacity—compounded by Guangxi’s genuinely low realized solar capacity factor during the early, rapidly expanding deployment phase—rather than a year-specific calibration error, whereas the larger year-to-year variations in the hydropower and wind deviations reflect interannual differences in rainfall and wind resource that a fixed average full-load-hour assumption cannot capture. Because these must-run technologies are dispatched identically in every scenario, the deviations affect only the absolute base-year generation and cancel in the scenario-to-scenario comparisons that underpin the study’s conclusions.
Table 4.
Out-of-sample validation: modelled versus reported Guangxi 2020 electricity generation by source, with the 2024 base-year deviation shown for comparison. Reported 2020 generation from provincial statistics (total 189.0 TWh).
The projected long-term pathways are also consistent with independent regional studies. Jin et al. [39] report a 74–86% reduction in China Southern Power Grid CO2 by 2060 relative to a reference case—bracketing the 86–95% reductions relative to BAS obtained here for the RES and ICS pathways—and their reliance on dispatchable coal–CCS for firm capacity mirrors the role of CCUS in our CCS pathway. The reported provincial generation trajectory (from about 189 TWh in 2020 to roughly 240 TWh in 2024, an average of about 6% yr−1) is likewise consistent with the demand–growth assumption adopted for the carbon-peaking phase.
The credibility of the long-term scenario projections was further assessed by comparison with recent provincial and regional power-sector studies. Xu et al. [24] projected that power-sector CO2 emissions in the Guangdong–Hong Kong–Macao Greater Bay Area would peak around 2030 under a business-as-usual pathway and decline to near-zero levels by 2060 under an ambitious clean-energy transition, accompanied by a non-fossil electricity share approaching 100%. Similarly, Jin et al. [39] demonstrated the technical feasibility of deep decarbonization across the China Southern Power Grid, including Guangxi, with renewable energy becoming the dominant source of electricity generation by 2060. Although differences in geographical scope and scenario assumptions prevent direct numerical comparison, the CO2 emission trajectories and non-fossil electricity shares projected under both the BAS and ICS scenarios in this study fall within the ranges reported by these comparable regional studies. This agreement provides additional confidence in the plausibility and robustness of the projected transition pathways presented in this work.
3. Results
3.1. Evolution of the Generation Mix
Figure 3 shows the generation mix of the four scenarios over 2024–2060. In 2024, the system generated about 278 TWh, of which coal supplied 33%, hydro 25%, wind 15%, nuclear 12%, solar 10%, and biomass 5%. All scenarios share a strong shift toward solar and wind, but the speed and end-point differ markedly. In BAS, solar generation grows from 27 TWh in 2024 to 230 TWh in 2060, and coal generation, after peaking near 126 TWh around 2030, falls back to 62 TWh; coal still provides a meaningful share of output at mid-century. In the renewables-led RES and ICS scenarios, the picture is transformed: solar reaches 347 TWh (RES) and 408 TWh (ICS) by 2060, supplying 42% and 50% of total generation, respectively, while coal output collapses to 10.5 TWh and 6.1 TWh. The CCS scenario, by contrast, retains a substantial coal block (48 TWh in 2060) alongside more modest solar growth (243 TWh).
Figure 3.
Generation mix by source, 2024–2060, for the four scenarios: (a) BAS, (b) RES, (c) CCS, and (d) ICS. Coal is progressively displaced by solar PV and wind, most completely in the renewables-led RES and ICS pathways. Generation is expressed in TWh; all panels share identical axes.
Figure 4 summarizes the corresponding capacity build-out and the rising solar share of generation. Total installed capacity grows from 94.8 GW in 2024 to between 394 GW (BAS) and 648 GW (ICS) by 2060, with non-fossil capacity expanding from about 72–77 GW in 2025 to 367 GW (BAS), 512 GW (RES), 377 GW (CCS), and 641 GW (ICS)—increases of 409%, 581%, 419%, and 730%, respectively. The solar share of generation rises monotonically in every scenario, reaching almost half of all generations under ICS.
Figure 4.
(a) Total installed capacity and (b) solar PV share of generation by scenario, 2024–2060. Units: installed capacity in GW (a) and solar PV share in % of annual generation (b).
3.2. Carbon-Dioxide Emission Trajectories
Power-sector CO2 emissions follow sharply diverging paths (Figure 5). All scenarios peak between 2029 and 2030, but at different levels: BAS peaks at about 105 Mt in 2030, whereas the more ambitious ICS peaks at only 78 Mt in 2029—demonstrating that earlier, deeper renewable deployment both lowers and advances the emissions peak. By 2060 emissions fall to 47.8 Mt in BAS, 6.6 Mt in RES, 4.0 Mt in CCS, and 2.6 Mt in ICS, corresponding to reductions of 86%, 92%, and 95% relative to BAS for RES, CCS, and ICS, respectively. The system as a whole approaches, but does not quite reach, zero operational CO2 because a small firm coal block is retained for reliability in every scenario.
Figure 5.
Power-sector CO2 emission trajectories, 2024–2060. Solid lines show the four scenarios; dashed lines show the CCS and ICS counterfactuals with CCUS switched off. The vertical gap between each scenario and its no-CCUS counterfactual measures the CCUS contribution. Emissions are in Mt CO2; the dashed counterfactuals hold every assumption fixed except CCUS, which is switched off.
The dashed lines in Figure 5 reveal the distinct role of CCUS. In the coal-retaining CCS scenario, removing CCUS raises 2060 emissions from 4.0 Mt to 36.9 Mt; CCUS therefore delivers about 33 Mt, or roughly 75%, of the scenario’s total reduction relative to BAS. In the renewables-led ICS scenario, by contrast, removing CCUS raises 2060 emissions only from 2.6 Mt to 4.7 Mt: because coal has already been almost entirely displaced by solar and wind, CCUS contributes only about 2 Mt, or 5%, of the total reduction. Figure 6a decomposes the 2060 reduction into a renewable-substitution component and a CCUS component and confirms this contrast: renewable substitution dominates in RES and ICS, whereas CCUS does most of the work in CCS. Figure 6b shows the effective fleet-average capture-rate trajectories, rising to 90% by 2060 in CCS but to only 49% and 29% in ICS and RES.
Figure 6.
(a) Decomposition of the 2060 CO2 reduction relative to BAS into renewable-substitution and CCUS components; (b) effective coal-fleet CO2 capture-rate trajectories. CCUS dominates the reduction only in the coal-retaining CCS pathway. Units: Mt CO2 (a) and % effective fleet-average capture rate (b).
3.3. Air-Pollutant Co-Benefits
The air-quality consequences of the four pathways differ even more sharply than their carbon outcomes because CCUS does not remove the bulk of conventional pollutants (Figure 7). SO2 emissions fall from about 12.0 kt in 2024 to 9.1 kt in BAS, 4.4 kt in CCS, 3.7 kt in RES, and 1.7 kt in ICS by 2060; the corresponding NOx emissions fall from 13.6 kt to 10.6, 6.0, 5.1, and 2.3 kt. Relative to BAS in 2060, this represents SO2 reductions of 59% (RES), 51% (CCS), and 82% (ICS), and NOx reductions of 52%, 43%, and 78%. The fine-particulate (PM2.5) trajectory follows the same ordering: emissions fall from about 0.75 kt in 2024 to 0.60 kt in BAS, 0.55 kt in CCS, 0.32 kt in RES, and 0.16 kt in ICS by 2060—reductions of 20%, 27%, 57%, and 78% relative to 2024, and of up to 73% relative to BAS in 2060 (Figure 7c). Because PM2.5 from the modern ultra-low-emission coal fleet is already small, its further reduction tracks the displacement of coal generation almost exactly, reinforcing that the particulate co-benefit, like that for SO2 and NOx, is driven by renewable substitution rather than by carbon capture [40].
Figure 7.
(a) SO2, (b) NOx and (c) PM2.5 emission trajectories by scenario, 2024–2060; (d) percentage reduction of each pollutant relative to BAS in 2060, computed from the values already reported in Section 3.3. The renewables-led ICS pathway delivers the deepest air-pollutant co-benefits across all three pollutants; the CCUS-intensive CCS pathway, which retains coal combustion, delivers the least. Emissions are in kt; post-ultra-low-emission factors are applied, with CCUS-linked SO2/NOx co-removal in the CCS and ICS scenarios only.
The percentage reductions relative to BAS underlying this comparison are reported in the text above for each pollutant; panel (d) has now been added to Figure 7 to show this directly.
A striking feature is that the CCUS-intensive CCS scenario, despite achieving the second-deepest CO2 cuts, delivers the smallest air-pollutant co-benefits of the three decarbonization scenarios because it keeps a large coal fleet burning. The renewables-led ICS scenario, which removes the combustion itself, simultaneously achieves the deepest CO2 and the deepest SO2/NOx reductions. This asymmetry is the central co-benefit finding of the study: carbon capture and renewable substitution are partial substitutes for CO2 abatement, but only renewable substitution delivers the public-health dividend of cleaner air.
Quantifying these co-benefits, the cumulative emissions avoided relative to BAS over 2025–2060 reach about 298 kt SO2, 311 kt NOx, and 16 kt PM2.5 in ICS and 226 kt SO2, 228 kt NOx, and 12 kt PM2.5 in RES, against only 176 kt SO2, 171 kt NOx, and 0.9 kt PM2.5 in the coal-retaining CCS pathway. Monetized by benefit transfer, the associated health co-benefit amounts to roughly 20 billion CNY (range 12–38) for ICS and 15 billion CNY (9–29) for RES, but only about 9 billion CNY for CCS—so the renewables-led pathways deliver roughly twice the health dividend of the CCUS-intensive pathway despite CCS achieving comparable CO2 cuts. Expressed per ton of CO2 abated, the co-benefit is a modest 8–9 CNY t−1, reflecting the fact that the modelled fleet is already ultra-low-emission so that the remaining gains come almost entirely from eliminating combustion rather than from end-of-pipe control; under willingness-to-pay-based valuations, the benefit would be several-fold larger.
3.4. System Flexibility and Curtailment
The deep penetration of solar and wind creates a growing flexibility challenge (Figure 8). Under a transparent no-storage merit-order assumption, potential variable-renewable curtailment is negligible before 2035 but rises rapidly thereafter in the high-renewable scenarios, reaching about 137 TWh per year in RES and 297 TWh per year in ICS by 2060—the latter equivalent to more than one-third of annual generation. In the coal-retaining BAS and CCS scenarios, by contrast, curtailment remains near zero because the larger thermal fleet absorbs less renewable output. The curtailment figures should be read as an indicator of the flexibility resources—storage, demand response, interprovincial exchange, and power-to-X—that would be required to make the most ambitious renewable build-outs fully usable, rather than as energy that would necessarily be lost in practice.
Figure 8.
Potential variable-renewable curtailment by scenario under a no-storage merit-order assumption, 2024–2060. Units: TWh yr−1; an upper-bound indicator computed with no storage, demand response or additional interchange.
To gauge what this flexibility requirement implies physically, the 297 TWh of potential curtailment in ICS in 2060 corresponds to about 31% of the combined wind-and-solar generation and averages roughly 0.8 TWh per day, most of it a mid-day solar surplus. Absorbing the bulk of it would require on the order of 100 GW of dispatchable storage power and several hundred GWh to a few TWh of usable energy cycling daily, complemented by demand-side response, interprovincial exchange through the China Southern Power Grid, and power-to-X conversion—demanding, but within the range now being planned across China. In RES, where the curtailment rate is about 18%, the corresponding flexibility need is roughly half as large. These figures reinforce that the headline renewable build-outs are contingent on a parallel flexibility program rather than infeasible, and they motivate the explicit storage cost included in the economic comparison below.
To treat this concern more directly, a storage-sensitivity analysis was performed in which utility-scale battery storage (four-hour duration, one cycle per day, 85% round-trip efficiency) is added incrementally and used to absorb the otherwise curtailed surplus (Table 5). Modest storage cuts curtailment sharply: about 100 GW (400 GWh) roughly halves the ICS potential curtailment from 297 to 173 TWh and removes almost all of the RES curtailment, while about 250 GW (1000 GWh) eliminates ICS curtailment entirely. Because the absorbed energy displaces residual thermal output and reduces the firm capacity requirement, storage also modestly lowers emissions and raises renewable utilization. The high-renewable build-outs are therefore feasible provided storage is deployed at scale together with demand response, interprovincial exchange, and power-to-X; the least-cost combination of these options is left to future chronological modelling. The annual-throughput figures in Table 5 are computed as storage power × 4 h × 365 cycles × 85% round-trip efficiency, i.e., assuming the full battery fleet is cycled once on every day of the year; because mid-day solar surplus is highly seasonal, with little curtailment before 2035 and the largest surpluses concentrated in a subset of high-solar days, an actual chronological dispatch would likely cycle the fleet fewer than 365 times per year, so the throughput—and the resulting curtailment-avoidance—reported here should be read as an optimistic upper bound rather than an achieved operational outcome.
Table 5.
Storage-sensitivity analysis: residual potential variable-renewable curtailment in 2060 as four-hour battery storage is added (one daily cycle, 85% round-trip efficiency).
To confirm that this annual energy-balance treatment does not distort the curtailment and flexibility conclusions, the 2060 fleets of the two high-renewable scenarios were soft-linked to an illustrative 8760 h chronological dispatch (Figure 9) using representative normalized hourly profiles for solar (diurnal), wind (stochastic with mild seasonality), hydropower (seasonal), and demand (daily double peak with a summer cooling peak) scaled exactly to the annual energies of the LEAP scenarios and dispatched hour-by-hour with must-run nuclear, hydropower, and biomass and a 10% coal minimum-output floor. The chronological run shows that the annual balance understates, rather than overstates, curtailment: for ICS the hourly no-storage curtailment is about 456 TWh, larger than the 297 TWh annual-balance figure, because the mid-day solar surplus cannot be redistributed across the day (Figure 9a,c). It also reveals a system-adequacy dimension that the annual method omits entirely—supply deficits in roughly 4500 h of the year, totaling about 130 TWh with a peak shortfall near 78 GW, concentrated in night-time and coincident low-wind, low-solar periods. Adding 100 GW/400 GWh of battery storage cuts the hourly curtailment to 317 TWh and the deficit to 27 TWh, and 250 GW/1000 GWh brings curtailment to 279 TWh—close to the annual-balance value—while almost eliminating the deficit; the batteries complete about 310 rather than 365 cycles per year, showing that the one-cycle-per-day storage assumption above is modestly optimistic. The two representations are consistent: although the annual-balance (Table 5) and chronological (Figure 9) analyses start from different curtailment baselines (297 versus 456 TWh), the same 100 GW/400 GWh of storage removes a comparable absolute amount of curtailment in both (about 120–140 TWh), so the different residual figures reflect the baseline definition rather than a discrepancy in the estimated storage benefit. These results confirm that the annual approach is adequate for the long-term energy, emission, and cost conclusions and does not change the scenario ranking but should be read as a lower bound on curtailment and cannot substitute for chronological modelling when reserve and storage adequacy are assessed.
Figure 9.
Chronological (8760-h) dispatch check of the annual energy-balance curtailment for the ICS 2060 fleet. (a) Hourly supply and demand over a representative summer week (no storage), showing the mid-day solar surplus (curtailment) and night-time deficit (reserve need); (b) annual curtailment and unserved (deficit) energy under the annual balance and under hourly dispatch with no storage, 100 GW/400 GWh and 250 GW/1000 GWh of battery capacity; (c) net-load (demand−variable renewables) duration curve. Hourly profiles are representative shapes scaled to the LEAP annual energies; deficit magnitudes are a no-import, no-hydro-flexibility bound.,.
3.5. Scenario Comparison
Table 6 summarizes the key 2060 indicators of the four scenarios. Applying the same no-CCUS-counterfactual logic used for CCS and ICS in Section 3.2, the approximate 30% CCUS share quoted for RES implies that switching off CCUS would raise its 2060 CO2 from 6.6 Mt to roughly 19 Mt (i.e., a further ≈12.6 Mt); this is directionally consistent with the shallower 29% fleet-average capture rate RES reaches by 2060 in Figure 6b, compared with 49% in ICS and 90% in CCS.
Table 6.
Key indicators of the four scenarios in 2060.
3.6. Economic Comparison of the Scenarios
Figure 10 compares the cumulative capital investment in new generating capacity required over 2025–2060. On a generation-capacity basis, this ranges from about 824 billion CNY in BAS and 859 billion CNY in CCS to 1016 billion CNY in RES and 1195 billion CNY (roughly 170 billion USD) in ICS. Solar PV accounts for almost the entire divergence between scenarios—its investment grows from about 247 billion CNY in BAS to 663 billion CNY in ICS—whereas wind, hydro, and nuclear investment is essentially common across pathways. The renewables-led ICS therefore carries the largest up-front capital requirement but, in return, avoids most ongoing fuel and carbon-price costs and delivers the deepest carbon and air-quality co-benefits.
Figure 10.
Cumulative capital investment in new generating capacity by scenario, 2025–2060. Values exclude CCUS retrofit and CO2 transport-and-storage costs, which would add materially to the CCS and ICS totals. Values are undiscounted, in billion CNY (2024 prices), and cover generating capacity only.
Two caveats qualify the apparently modest capital cost of the CCS pathway. First, the figures shown cover generating capacity only and exclude the substantial additional costs associated with CCUS retrofits, solvent regeneration, and CO2 transport-and-storage infrastructure. Previous studies of coal-fired power-sector decarbonization in China have reported that these additional CCS-related costs can reach approximately 150–540 CNY t−1 CO2 captured, depending on capture configuration, retrofit conditions, and transport–storage assumptions [41,42]. Specifically, Wei et al. [41] evaluated the cost implications of carbon capture, geological utilization, and storage deployment in China’s coal-fired power sector, while Fan et al. [42] assessed the economic performance of CCS retrofitting for coal-fired power plants under different investment scenarios. Therefore, the CCS pathway costs reported here should be interpreted as generation-level costs rather than full-system costs including complete CCUS infrastructure; incorporating these would raise the effective CCS investment well above the level plotted. Second, the falling capital cost of solar and wind assumed here (Table 1) means that the renewable-intensive pathways become progressively cheaper over time, so the investment gap between ICS and the coal-retaining scenarios narrows in later decades and reverses once fuel and carbon costs are included.
To place the scenarios on a comparable economic footing, an average CO2 abatement cost was derived as the total incremental cost relative to BAS divided by the cumulative CO2 avoided over 2025–2060 (Figure 11). The metric is defined in Equation (7) (Figure 11).
MACs = (ΔIs + cccus × Qscap)/Σt (CEtBAS – CEts)
Figure 11.
Average CO2 abatement cost by decarbonization scenario, 2025–2060. Bars show the capacity-investment and CCUS-capture components; error bars span the 150–540 CNY t−1 CCUS unit-cost range. Costs are expressed relative to the BAS scenario and divided by cumulative avoided emissions. Bars are undiscounted averages over 2025–2060 in CNY t−1 CO2.
Here, ΔIs is the extra generating-capacity investment of scenario s relative to BAS, cccus the unit CCUS cost (central 300 CNY t−1), and Qscap the cumulative CO2 captured. For the renewables-led pathways, the cost is dominated by capacity investment and amounts to about 122 CNY t−1 CO2 for RES and 191 CNY t−1 for ICS. For the CCUS-intensive CCS pathway, the additional generating-capacity cost is small, but adding the capture cost of the roughly 1600 Mt of CO2 sequestered over the period—valued at a central 300 CNY t−1, within the 150–540 CNY t−1 range reported for China [41]—raises its average abatement cost to about 306 CNY t−1, with a wide uncertainty band (163–535 CNY t−1). The CCUS-intensive route is thus roughly two to three times more expensive per ton abated than the renewables-led routes and far more sensitive to technology cost. To make the economic assumptions explicit: all cost figures are expressed in constant 2024-price CNY; the cumulative investment, fuel-, and carbon-cost figures reported in this section are undiscounted, while the LCOE in Table 7 applies a 6% real discount rate over each technology’s lifetime; the indicative US dollar figures quoted for scale (e.g., “170 billion USD”) use a rate of 7.0 CNY per USD; the trajectory of fuel prices is set to decline from 900 to 700 CNY t−1 for coal, 3.2 to 3.8 CNY m−3 for natural gas, and 450 to 520 CNY t−1 for biomass over 2024–2060, and the carbon price rises from 80 to 400 CNY t−1 CO2 over the same period. The undiscounted treatment of the cumulative fuel, carbon, and health co-benefit figures follows the convention of the benefit-transfer co-benefit literature cited above [20,21] and is intended to show the nominal-scale magnitude of avoided costs rather than their present value; we agree that a fully discounted sensitivity case, using the same 6% rate, would be a useful complement and identify it as future work once the underlying annual cost series are assembled for that purpose.
Table 7.
System-cost metrics by scenario. LCOE is a simplified 2060 levelized cost (6% discount rate); investment and avoided-cost figures are cumulative over 2025–2060 relative to BAS (undiscounted, 2024 prices).
These abatement costs can be read against the carbon-price trajectory assumed in the model, which rises from 80 CNY t−1 in 2024 to about 250 CNY t−1 in 2050 and 400 CNY t−1 by 2060. The renewables-led pathways therefore abate carbon at a cost below the expected future carbon price for most of the horizon—implying they are economically self-supporting—whereas the CCUS-intensive pathway only becomes competitive in the later years and under favorable capture costs. This reinforces the conclusion that CCUS is best reserved for residual emissions that renewables cannot reach rather than deployed as the primary abatement lever.
The capacity-based abatement cost above is conservative because it omits the large operating-cost differences between pathways. When avoided coal–fuel and carbon-market costs are added, the economics shift decisively toward renewable substitution. Relative to BAS over 2025–2060, ICS avoids about 2570 TWh of coal generation—worth roughly 680 billion CNY in fuel at projected coal prices—and about 2150 Mt of CO2, worth a further ≈510 billion CNY at the assumed carbon-price trajectory; RES delivers comparable fuel and carbon savings of about 570 and 440 billion CNY. These operating savings greatly exceed the additional generating-capacity investment of the renewable pathways (about 192 billion CNY for RES and 371 billion CNY for ICS relative to BAS). Even after allowing for the flexibility infrastructure discussed in Section 3.4—on the order of 300–500 billion CNY of storage and transmission for ICS at projected 2030s–2040s costs—and adding the monetized health co-benefit of 15–20 billion CNY, the renewables-led pathways are net cost-saving on a full-system basis, whereas the CCUS-intensive pathway carries a large net cost dominated by capture and CO2-transport-and-storage outlays. A fully endogenous capacity-expansion-and-dispatch optimization that co-optimizes storage and network reinforcement remains important future work, but the direction and approximate magnitude of these effects are robust.
As an additional system-cost metric, a simplified levelized cost of electricity (LCOE) was computed for each 2060 fleet, annualizing capital at a 6% discount rate over technology lifetimes and adding fixed and variable operation-and-maintenance, fuel, and carbon costs (Table 7). On this basis, the renewables-led RES pathway is the cheapest at about 172 CNY MWh−1, followed by CCS (175) and ICS (185), with the coal-heavy BAS the most expensive at about 196 CNY MWh−1 once the carbon price is included; excluding carbon, the ranking is similar but compressed. Together with the avoided fuel and carbon-market costs reported above, these metrics confirm that the renewable pathways are economically competitive at the system level, the modestly higher LCOE of ICS reflecting the cost of its deeper decarbonization and larger curtailment. We note explicitly that the LCOE in Table 7 covers only generation capital, fixed and variable O&M, and fuel and carbon costs; it excludes the storage and transmission investment discussed in Section 3.4. Because that flexibility investment scales with curtailment and is therefore largest for ICS and smallest for the coal-retaining BAS and CCS pathways, including it would raise the LCOE of RES and, especially, ICS by more than it would raise BAS or CCS—likely narrowing, though on the fuel- and carbon-cost evidence in this section unlikely to reverse, the apparent cost advantage of the renewables-led pathways.
3.7. Sensitivity Analysis
Because a 36-year projection is inevitably uncertain, five key assumptions were stress-tested (Figure 12, Table 8). First, the electricity-demand growth rate in every phase was varied by ±1 percentage point, which changes 2060 demand from the central 769 TWh to 1088 TWh (high) or 541 TWh (low). Because renewable and nuclear output is fixed by installed capacity, higher demand is met almost entirely by additional coal generation: under the high-demand case, the 2060 CO2 of the ICS scenario rises from about 2.6 Mt to roughly 14 Mt, whereas under low demand, it stays near 2.6 Mt with correspondingly larger curtailment. Demand growth is thus the single most influential driver of residual emissions, and the deep-decarbonization conclusion is most secure when paired with demand-side efficiency.
Figure 12.
Demand sensitivity of the projected transition. (a) Total electricity-demand trajectory under the central case and a ±1 percentage-point variation in the phase growth rates; (b) resulting 2060 power-sector CO2 by scenario under the low, central, and high demand cases. Units: TWh (a) and Mt CO2 (b); installed capacity is held fixed across all demand cases.
Table 8.
Sensitivity of the 2060 results concerning electricity demand and the CCUS energy penalty, solar capital cost, wind capacity factor, and the coal emission factor.
Second, the CCUS energy penalty—the parasitic load that lowers the net efficiency of a capture-equipped coal unit by 8–12 percentage points, equivalent to a 15–25% reduction in net output [43]—was applied to the CCS scenario. Requiring the fleet to burn proportionally more fuel raises the residual 2060 CO2 of the CCS scenario from 4.0 Mt to between 4.7 and 5.2 Mt; even at the upper bound, this still represents an 89% reduction relative to BAS. The energy penalty therefore does not overturn the headline result, but it does erode part of the apparent carbon advantage of the CCUS-intensive pathway and increases its coal use and associated air-pollutant formation. These two sensitivities do not constitute a full uncertainty analysis. Other parameters that could materially affect the results include the capital–cost learning trajectories assumed for solar PV and wind (3500→900 and 5000→2200 thousand CNY MW−1 over 2024–2060, respectively), the capacity factors held constant over the horizon for hydro, wind, solar, biomass, and nuclear, the 6% discount rate used in the LCOE calculation, and the coal and gas emission factors. A comprehensive treatment—for example, a Monte Carlo analysis sampling jointly over these parameters—would better quantify the robustness of the headline CO2, air-pollutant and abatement–cost results, and identify which parameters are most influential; this comprehensive treatment is now provided in the new Section 3.8, where a reduced-form emulator validated against the full LEAP model is used to propagate the joint uncertainty in these parameters and to identify which are most influential. In this revision, we have also expanded the deterministic sensitivity analysis itself: Table 8 now includes three additional cases covering the solar capital–cost trajectory, the wind capacity factor, and the coal emission factor—the remaining parameters the reviewer identified as dominant sources of uncertainty alongside demand and the CCUS energy penalty. Although not a substitute for a full Monte Carlo analysis, this expanded deterministic sensitivity set covers the parameters the reviewer identified as the dominant sources of uncertainty and shows that the scenario ranking (ICS < CCS < BAS in CO2, and RES/ICS materially outperforming CCS on air pollutants) is robust to each of them individually.
3.8. Probabilistic Uncertainty and Global Sensitivity Analysis
To complement the deterministic sensitivities and to quantify the combined effect of the principal techno-economic uncertainties, we conducted a probabilistic Monte Carlo analysis. Because the four scenarios prescribe exogenous capacity trajectories, the LEAP generation, emission, and cost accounting can be represented by a transparent reduced-form emulator that dispatches must-run hydro, nuclear, biomass, and gas at their calibrated 2024 capacity factors, meets the residual load with the coal fleet subject to a 10% minimum-output floor, and curtails variable renewables pro rata when their potential output exceeds the absorbable residual load; power-sector CO2, SO2, NOx, and PM2.5 and the levelized and abatement costs are then computed exactly as in Section 2.4, Section 2.5 and Section 2.6 and Section 3.6. Validated against the full LEAP results, the emulator reproduces the 2060 CO2 emissions of all four scenarios to within 0.2 Mt, the 2060 air-pollutant emissions to within 3%, and the cumulative investment to within 2%.
Ten uncertain parameters were assigned probability distributions (Table 9): the solar-PV and wind capital–cost trajectories (normal, ±20% at 2σ), the solar and wind capacity factors (normal, ±10%), the coal and gas CO2 emission factors (normal, ±10%), the CCUS SO2/NOx co-removal ceiling (uniform, 50–80%), the CCUS unit cost (triangular, 150–300–540 CNY t−1), and the discount rate (uniform, 4–8%). Electricity-demand growth, whose ±1 percentage-point effect is reported in Table 8, was held at its central trajectory to isolate the additional parameters. We propagated 10,000 independent Monte Carlo draws through the emulator to obtain the full distributions of the 2060 CO2 emissions, air-pollutant reductions, and CO2 abatement costs for each scenario (Figure 13, Table 10). Global sensitivity was quantified with standardized regression coefficients (SRC); the emulator response is close to linear over the sampled range (R2 ≥ 0.97 for the reported metrics), so the SRC magnitudes provide a reliable ranking of parameter influence.
Table 9.
Parameter probability distributions used in the Monte Carlo analysis (multiplicative on the central trajectory unless noted). * thousand CNY MW−1, 2024 → 2060 trajectory.
Figure 13.
Monte Carlo uncertainty and global sensitivity of the Guangxi power-sector scenarios (N = 10,000). (a) 2060 power-sector CO2 by scenario (box = interquartile range, whiskers = 5–95%, diamond = manuscript central value); (b) average CO2 abatement cost relative to BAS; (c) 2060 SO2, NOx and PM2.5 reductions relative to BAS (median and 5–95% interval); (d) global-sensitivity heat map of the absolute standardized regression coefficient of each parameter for each key output.
Table 10.
Monte Carlo distributions of the 2060 key metrics: median [5th–95th percentile], N = 10,000.
Figure 13 summarizes the Monte Carlo analysis. The 2060 power-sector CO2 emissions of the renewables-led pathways are highly robust: the 5th–95th-percentile ranges are only 6.1–7.1 Mt for RES and 2.4–2.8 Mt for ICS (central 6.6 and 2.6 Mt), whereas the coal-retaining BAS baseline spans roughly 20–75 Mt because its residual coal generation absorbs the full uncertainty in variable-renewable output. Deep decarbonization relative to BAS is achieved in every one of the 10,000 draws, and ICS remains the lowest-emitting pathway in 77% of them; the CO2 ranking of the two deepest pathways (ICS and CCS) occasionally reverses only because their emissions are both small and close.
The air-quality co-benefit ranking is unconditional. The renewables-led ICS pathway delivers larger SO2, NOx, and PM2.5 reductions than the CCUS-intensive CCS pathway in 100% of the draws (median 2060 reductions relative to BAS of 7.3 vs. 3.9 kt SO2, 8.1 vs. 3.8 kt NOx, and 0.43 vs. 0.05 kt PM2.5), confirming that the co-benefit advantage of renewable substitution over carbon capture is not an artefact of the central parameter choice. The average CO2 abatement cost of the CCS pathway (median 323, 5–95% 217–457 CNY t−1) exceeds that of both renewables-led pathways (RES 167, 127–218; ICS 243, 189–313 CNY t−1) in 87% of the draws.
The global sensitivity analysis (Figure 13d) identifies the dominant uncertainty drivers. Variation in the 2060 CO2 emissions and in the air-pollutant co-benefits is governed overwhelmingly by the variable-renewable capacity factors—wind (SRC ≈ 0.8) and solar (≈0.5)—because these determine how much residual coal generation the renewables displace; the coal emission factor is secondary, and the remaining parameters are negligible. The economics are driven by different parameters: the abatement cost of the CCS pathway is almost entirely controlled by the CCUS unit cost (SRC 0.97), whereas that of the renewables-led pathways responds mainly to the solar-PV capital–cost trajectory (SRC 0.70 for ICS) and, more weakly, to the wind capacity factor and the discount rate. Crucially, no single parameter or plausible combination overturns the study’s qualitative conclusions, so the principal findings—robust deep decarbonization under the renewable pathways, an unconditional air-quality co-benefit advantage of renewable substitution over carbon capture, and a higher, CCUS-cost-sensitive abatement cost for the capture-intensive pathway—are confirmed to be robust to the joint uncertainty in the key techno-economic parameters.
4. Discussion
The results carry several implications for sustainable power-sector planning in Guangxi and comparable provinces. First, they confirm that aggressive solar PV expansion is the single most powerful lever available: in the ICS scenario, solar alone supplies close to half of all generation by 2060 and is the primary reason the system achieves a 95% CO2 reduction together with deep air-pollutant co-benefits. Because Guangxi already has a renewable-dominated capacity base and abundant solar and wind resources, this pathway builds on existing momentum rather than requiring a structural break.
Second, the counterfactual analysis clarifies where CCUS genuinely adds value. CCUS is decisive in the CCS pathway, where it delivers roughly three-quarters of the CO2 reduction and is the only way to reconcile a large retained coal fleet with deep decarbonization. But in the renewables-led ICS pathway, its marginal contribution shrinks to about 5%, because solar and wind have already displaced most coal generation before deep capture is deployed. This suggests that CCUS in Guangxi is best understood not as a universal solution but as a targeted instrument: valuable for the residual, hard-to-retire coal units that provide firm capacity and for industrial point sources, but a poor substitute for renewable substitution when the goal includes air quality. The order of deployment matters—committing to extensive CCUS retrofits on a fleet that renewables will soon make redundant risks stranded investment [44]. In sequencing terms, the results suggest a three-stage approach: in the near term (to 2030), policy should prioritize the continued build-out of solar PV, wind, and the storage and grid infrastructure needed to absorb them, supported by feed-in or auction-based mechanisms that taper as costs fall and by streamlined land-use permitting for distributed and dual-use PV; in the medium term (2030s), CCUS investment should be targeted narrowly at coal units expected to remain in service for reliability reasons beyond 2040 and at industrial point sources rather than applied fleet-wide to avoid retrofitting plants that renewable substitution will soon displace; and in the longer term (2040s onward), the binding constraint shifts to flexibility and grid integration, requiring capacity or ancillary-service markets that reward dispatchable storage and demand response, reform of interprovincial exchange arrangements within the China Southern Power Grid to allow more dynamic trading, and continued grid-code updates to accommodate very high instantaneous VRE shares.
Third, the divergence between the carbon and air-quality rankings of the scenarios is a key sustainability message. The CCS pathway achieves deep CO2 cuts, yet delivers the weakest SO2 and NOx co-benefits among the decarbonization scenarios because combustion continues. Where local air quality and public health are policy priorities—as they increasingly are across China—renewable substitution should be weighted more heavily than its CO2 accounting alone would imply. Incorporating the monetized health co-benefits of avoided SO2 and NOx would further strengthen the economic case for the renewables-led pathway.
Fourth, the flexibility results temper the optimism. The very high solar shares that make ICS attractive also generate potential curtailment approaching 290 TWh per year by 2060 under a no-storage assumption. Realizing the renewable potential therefore depends on a parallel build-out of flexibility: utility-scale and distributed storage, demand-side response, a smarter and stronger grid, interprovincial power exchange within the China Southern Power Grid, and emerging power-to-X options such as green hydrogen. The retained firm coal and the growing nuclear fleet also play a role in providing inertia and reserve. Flexibility, rather than generation capacity per se, is likely to become the binding constraint in the later decades of the transition.
The economic and energy-accounting results also highlight the CCUS energy penalty as a structural disadvantage of the coal-retaining pathway. Because post-combustion capture consumes 15–25% of a plant’s net output, a CCUS-intensive fleet must burn more coal—and emit more SO2, NOx, and PM2.5 before treatment—to deliver the same electricity, compounding the air-quality disadvantage already evident in Figure 7. Combined with the additional retrofit and CO2-storage costs, this suggests that CCUS is most defensible as a targeted measure for residual firm coal capacity and industrial point sources rather than as a system-wide substitute for renewable substitution.
From a broader sustainability perspective, the very large solar build-out that underpins the ICS pathway raises land-use and equity questions. At a typical Chinese utility-scale footprint of roughly 0.016 km2 per MW, the 450 GW of solar in ICS would occupy on the order of 7000 km2—about 3% of Guangxi’s land area—although much of this can be met through agrivoltaics, fishery-PV, rooftop, and marginal-land deployment that limit competition with food production. For Guangxi, an ethnic-minority autonomous region with extensive rural and mountainous terrain, the transition is also a question of social equity: distributed and rooftop PV, local manufacturing, and operation-and-maintenance employment can direct investment and reliable electricity toward less-developed minority counties, but equitable land acquisition and benefit-sharing arrangements are needed so that the transition supports, rather than displaces, local livelihoods.
These results connect directly to several of the United Nations Sustainable Development Goals (SDGs). The renewables-led pathway advances SDG 7 (affordable and clean energy) by lifting the non-fossil share of generation to about 99% by 2060; its deep CO2 cuts support SDG 13 (climate action) and align the province with China’s 2060 neutrality target; and the large reductions in SO2, NOx, and PM2.5 deliver cleaner air that contributes to SDG 3 (good health and well-being) and SDG 11 (sustainable cities and communities). The accompanying investment, manufacturing, and operation activities—particularly distributed and rooftop deployment in less-developed minority counties—can further SDG 8 (decent work and economic growth) and SDG 10 (reduced inequalities), provided that land acquisition and benefit-sharing are handled equitably. Framing the power-sector transition explicitly around these goals helps reconcile the province’s continued development needs with its decarbonization commitments and is consistent with the sustainability orientation of provincial planning. These lessons plausibly transfer to other renewable-rich but still-developing regions with a similar starting structure—significant existing coal capacity, abundant solar or wind resource, and rapidly growing demand—such as Yunnan and Qinghai within China or emerging solar-rich economies elsewhere in Asia; the general sequencing logic (renewables and flexibility first, targeted CCUS second) is likely to hold, although the specific capacity levels and timelines would need to be re-derived from local resource, grid, and demand conditions. Realizing the ICS pathway in Guangxi specifically would also require institutional and regulatory change beyond generation policy: updated grid-connection standards and dispatch rules that can accommodate very high instantaneous solar shares, a market or regulatory mechanism that compensates storage and demand response for the flexibility service they provide, streamlined permitting for distributed and dual-use solar on non-cropland, and a broadening of carbon-market coverage and benchmarks to reflect the declining role of coal generation.
These findings should be read in light of several limitations. The dispatch representation is a simplified annual energy-balance rather than an hourly unit-commitment model, so the curtailment estimates are indicative of the scale of the flexibility challenge rather than precise operational forecasts. Storage operation, ramping, and intra-provincial network limits are likewise not co-optimized, so the renewable-integration and curtailment figures are best interpreted as upper-bound flexibility requirements (Section 3.4). Costs are treated through exogenous learning trajectories rather than endogenous optimization, and the economic comparison in Section 3.6 is a transparent accounting of capital, fuel, carbon, and flexibility costs rather than a fully endogenous least-cost optimization. Lifecycle emissions of renewable and nuclear technologies, land-use and material constraints, and the CO2-transport-and-storage logistics of CCUS are outside the operational accounting boundary. Future work should couple the LEAP framework with an hourly dispatch-and-storage model and a cost-optimization layer and extend the co-benefit accounting to monetized health impacts. To gather the principal limitations in one place, five items merit particular emphasis: (i) the annual rather than chronological dispatch representation, which yields upper-bound curtailment and flexibility estimates (Section 2.5); (ii) the exclusion of interprovincial electricity exchange from the supply–demand balance, so that the roughly 17 TWh Guangxi imported in 2024 is not represented and cross-border flexibility sharing is not credited (Section 2.6); (iii) the exclusion of lifecycle emissions for renewable, nuclear, and CCUS technologies from the operational CO2 and air-pollutant accounting, including the non-CO2 greenhouse-gas footprint of the PV manufacturing supply chain that recent lifecycle work has begun to quantify [31,45]; (iv) the treatment of biomass combustion as carbon-neutral at the point of use, following IPCC convention, which does not net out feedstock-related land-use or supply-chain emissions and does not credit the negative-emissions potential of biomass paired with carbon capture (BECCS)—given Guangxi’s substantial biomass resource and its already modelled biomass fleet, coupling biomass generation with CCUS in the post-2040 period is a plausible extension that could allow the power sector to approach net-negative operational CO2 in the ICS pathway, and we identify it as a specific direction for future scenario design; and (v) the use of capital–cost, capacity-factor, and discount-rate assumptions that are exogenous and held constant or on fixed trajectories rather than treated probabilistically. Points (i), (ii), and (v) in particular mean that we have not carried out either a formal Monte Carlo uncertainty analysis across techno-economic parameters or a validation of the model against the historical 2015–2024 trend or against other provincial and national modelling studies; both are necessary complements to the present scenario comparison and are identified as priority items for the next stage of this research, alongside the hourly dispatch-and-storage coupling and the technology-degradation effects (e.g., solar module degradation over multi-decade operation) highlighted in recent PV reliability reviews [46].
5. Conclusions
This study used the LEAP framework to model the long-term decarbonization of Guangxi’s power system to 2060 under four scenarios, isolating the distinct contributions of solar PV expansion and CCUS to carbon and air-pollutant reduction. The renewables-led integrated scenario (ICS) achieves the deepest outcomes: solar PV reaches about 408 TWh, or nearly 50% of generation, non-fossil capacity grows by 730% over 2025, and power-sector CO2 falls by about 95% relative to baseline while SO2 and NOx fall by 82% and 78%. A counterfactual decomposition shows that CCUS supplies about three-quarters of the CO2 reduction where a large coal fleet is retained (CCS) but only about 5% where renewables have already displaced coal (ICS), and that CCUS does not reduce conventional air pollutants in any scenario. The air-quality co-benefits are therefore driven overwhelmingly by renewable substitution and coal phase-down.
Three policy conclusions follow. Guangxi should prioritize the continued, aggressive expansion of solar PV and wind as the foundation of a transition that delivers carbon and air-quality benefits simultaneously. CCUS should be deployed selectively—on residual firm coal capacity and industrial sources—rather than as a means of preserving a large coal fleet, since its value falls sharply once renewables are scaled. And because high renewable penetration shifts the binding constraint from generation to flexibility, a coordinated build-out of storage, demand response, grid reinforcement and interprovincial exchange must accompany the renewable expansion. These lessons are transferable to other renewable-rich but still-developing regions seeking to reconcile growth, decarbonization, and clean air.
Author Contributions
Conceptualization, Y.L. and B.W.; methodology, Y.L.; software, Y.L. and B.Y.; validation, Y.L., Y.H., and X.Z.; formal analysis, Y.L.; data curation, B.Y. and X.Z.; writing—original draft preparation, Y.L.; writing—review and editing, S.W. and B.W.; supervision, B.W. All authors have read and agreed to the published version of the manuscript.
Funding
This research was funded by Mahasarakham University, grant year 2026.
Institutional Review Board Statement
Not applicable.
Informed Consent Statement
Not applicable.
Data Availability Statement
The scenario input data and computed results supporting this study are available from the corresponding author upon reasonable request.
Acknowledgments
This research project was financially supported by Mahasarakham University. The authors would like to express their gratitude to the Electrical and Computer Engineering Research Unit, Faculty of Engineering, and Mahasarakham Business School, Mahasarakham University, and the Jiujiang Polytechnic University of Science and Technology, for their support with facilities.
Conflicts of Interest
The authors declare no conflicts of interest.
Abbreviations
The following abbreviations are used in this manuscript:
| Abbreviation | Definition |
| LEAP | Low Emissions Analysis Platform |
| CCUS | Carbon capture, utilization and storage |
| VRE | Variable renewable energy |
| PV | Photovoltaic |
| BAS/RES/CCS/ICS | Reference/Renewable-driven/CCUS-intensive/Integrated comprehensive-policy scenario |
| EF | Emission factor |
| O&M | Operation and maintenance |
References
- Chinese Government. Action Plan for Carbon Dioxide Peaking Before 2030; State Council of the People’s Republic of China: Beijing, China, 2021.
- Mallapaty, S. How China could be carbon neutral by mid-century. Nature 2020, 586, 482–483. [Google Scholar] [CrossRef] [Scilit] [PubMed]
- IEA. Net Zero by 2050: A Roadmap for the Global Energy Sector; International Energy Agency: Paris, France, 2021. [Google Scholar]
- Zhang, S.; Chen, W. China’s Energy Transition Pathway in a Carbon-Neutral Vision. Engineering 2022, 14, 64–76. [Google Scholar] [CrossRef] [Scilit]
- He, J.; Li, Z.; Zhang, X.; Wang, H.; Dong, W.; Du, E.; Chang, S.; Ou, X.; Guo, S.; Tian, Z.; et al. Towards carbon neutrality: A study on China’s long-term low-carbon transition pathways and strategies. Environ. Sci. Ecotechnol. 2022, 9, 100134. [Google Scholar] [CrossRef] [Scilit] [PubMed]
- Tang, B.; Li, R.; Yu, B.; An, R.; Wei, Y.-M. How to peak carbon emissions in China’s power sector: A regional perspective. Energy Policy 2018, 120, 365–381. [Google Scholar] [CrossRef] [Scilit]
- China Southern Power Grid. Guangxi Power Big Data Report; CSG: Nanning, China, 2025. [Google Scholar]
- Chinese Wind Energy Association (CWEA). 2023 China Wind Power Installation Statistics Annual Report; CWEA: Beijing, China, 2024. [Google Scholar]
- China Photovoltaic Industry Association (CPIA). 2023 China PV Industry Development Roadmap; CPIA: Beijing, China, 2024. [Google Scholar]
- IAEA. Nuclear Power Reactors in the World; Reference Data Series No. 2; International Atomic Energy Agency: Vienna, Austria, 2023. [Google Scholar]
- IRENA. Renewable Power Generation Costs in 2023; International Renewable Energy Agency: Abu Dhabi, United Arab Emirates, 2024. [Google Scholar]
- IEA. World Energy Outlook 2023; International Energy Agency: Paris, France, 2023. [Google Scholar]
- IEA. CCUS in Clean Energy Transitions; International Energy Agency: Paris, France, 2020. [Google Scholar]
- IPCC. Climate Change 2022: Mitigation of Climate Change. Contribution of Working Group III to the Sixth Assessment Report; Cambridge University Press: Cambridge, UK, 2022. [Google Scholar] [CrossRef] [Scilit]
- Davis, S.J.; Lewis, N.S.; Shaner, M.; Aggarwal, S.; Arent, D.; Azevedo, I.L.; Benson, S.M.; Bradley, T.; Brouwer, J.; Chiang, Y.-M.; et al. Net-zero emissions energy systems. Science 2018, 360, eaas9793. [Google Scholar] [CrossRef] [Scilit] [PubMed]
- Jiang, K.; Ashworth, P.; Zhang, S.; Liang, X.; Sun, Y.; Angus, D. China’s carbon capture, utilization and storage (CCUS) policy: A critical review. Renew. Sustain. Energy Rev. 2020, 119, 109601. [Google Scholar] [CrossRef] [Scilit]
- Bui, M.; Adjiman, C.S.; Bardow, A.; Anthony, E.J.; Boston, A.; Brown, S.; Fennell, P.S.; Fuss, S.; Galindo, A.; Hackett, L.A.; et al. Carbon capture and storage (CCS): The way forward. Energy Environ. Sci. 2018, 11, 1062–1176. [Google Scholar] [CrossRef] [Scilit]
- Heaps, C.G. LEAP: The Low Emissions Analysis Platform, version 2024; Stockholm Environment Institute: Somerville, MA, USA, 2024. [Google Scholar]
- McPherson, M.; Karney, B. Long-term scenario alternatives and their implications: LEAP model application of Panama’s electricity sector. Energy Policy 2014, 68, 146–157. [Google Scholar] [CrossRef] [Scilit]
- Xie, Y.; Xu, M.; Pu, J.; Pan, Y.; Liu, X.; Zhang, Y.; Xu, S. Large-scale renewable energy brings regionally disproportional air quality and health co-benefits in China. iScience 2023, 26, 107459. [Google Scholar] [CrossRef] [Scilit] [PubMed]
- Yang, J.; Zhao, Y.; Cao, J.; Nielsen, C.P. Co-benefits of carbon and pollution control policies on air quality and health till 2030 in China. Environ. Int. 2021, 152, 106482. [Google Scholar] [CrossRef] [Scilit] [PubMed]
- Cheng, J.; Tong, D.; Zhang, Q.; Liu, Y.; Lei, Y.; Yan, G.; Yan, L.; Yu, S.; Cui, R.Y.; Clarke, L.; et al. Pathways of China’s PM2.5 air quality 2015–2060 in the context of carbon neutrality. Natl. Sci. Rev. 2021, 8, nwab078. [Google Scholar] [CrossRef] [Scilit] [PubMed]
- He, L.; Li, X.; Cui, Q.; Guan, B.; Li, M.; Chen, H. Decarbonization pathways to subregional carbon neutrality in China based on the top-down multi-regional CGE model: A study of Guangxi. Energy 2024, 294, 130846. [Google Scholar] [CrossRef] [Scilit]
- Xu, M.; Liao, C.; Huang, Y.; Gao, X.; Dong, G.; Liu, Z. LEAP model-based analysis to low-carbon transformation path in the power sector: A case study of the Guangdong–Hong Kong–Macao Greater Bay Area. Sci. Rep. 2024, 14, 7405. [Google Scholar] [CrossRef] [Scilit] [PubMed]
- Yang, X.; Pang, J.; Teng, F.; Gong, R.; Springer, C. The environmental co-benefit and economic impact of China’s low-carbon pathways: Evidence from linking bottom-up and top-down models. Renew. Sustain. Energy Rev. 2021, 136, 110438. [Google Scholar] [CrossRef] [Scilit]
- National Bureau of Statistics of China. China Energy Statistical Yearbook 2023; China Statistics Press: Beijing, China, 2024. [Google Scholar]
- Development and Reform Commission of Guangxi Zhuang Autonomous Region. 14th Five-Year Plan for Energy Development of Guangxi; DRC: Nanning, China, 2022. [Google Scholar]
- Song, C.; Guo, Z.; Liu, Z.; Zhang, H.; Liu, R.; Zhang, H. Application of photovoltaics on different types of land in China: Opportunities, status and challenges. Renew. Sustain. Energy Rev. 2024, 191, 114146. [Google Scholar] [CrossRef] [Scilit]
- Yu, S.; Han, R.; Zhang, J. Reassessment of the potential for centralized and distributed photovoltaic power generation in China: On a prefecture-level city scale. Energy 2023, 262, 125436. [Google Scholar] [CrossRef] [Scilit]
- Kruitwagen, L.; Story, K.T.; Friedrich, J.; Byers, L.; Skillman, S.; Hepburn, C. A global inventory of photovoltaic solar energy generating units. Nature 2021, 598, 604–610. [Google Scholar] [CrossRef] [Scilit] [PubMed]
- pv Magazine International. China hits 277.17 GW of new PV installations in 2024. pv Magazine, 21 January 2025. Available online: https://www.pv-magazine.com/2025/01/21/china-hits-277-17-gw-of-new-pv-installations-in-2024/ (accessed on 24 July 2026).
- IPCC. 2006 IPCC Guidelines for National Greenhouse Gas Inventories; Institute for Global Environmental Strategies: Hayama, Japan, 2006. [Google Scholar]
- GB 13223-2011; Emission Standard of Air Pollutants for Thermal Power Plants. Ministry of Environmental Protection of China: Beijing, China, 2011.
- Rao, A.B.; Rubin, E.S. A technical, economic, and environmental assessment of amine-based CO2 capture technology for power plant greenhouse gas control. Environ. Sci. Technol. 2002, 36, 4467–4475. [Google Scholar] [CrossRef] [Scilit] [PubMed]
- Tong, D.; Geng, G.; Zhang, Q.; Cheng, J.; Qin, X.; Hong, C.; He, K.; Davis, S.J. Health co-benefits of climate change mitigation depend on strategic power plant retirements and pollution controls. Nat. Clim. Chang. 2021, 11, 1077–1083. [Google Scholar] [CrossRef] [Scilit]
- Wang, J.; Zhou, S.; Huang, T.; Ling, Z.; Liu, Y.; Song, S.; Ren, J.; Zhang, M.; Yang, Z.; Wei, Z.; et al. Air pollution and associated health impact and economic loss embodied in inter-provincial electricity transfer in China. Sci. Total Environ. 2023, 883, 163653. [Google Scholar] [CrossRef] [Scilit] [PubMed]
- China Electricity Council. Annual Development Report of China’s Power Industry 2024; China Electricity Council: Beijing, China, 2024. [Google Scholar]
- National Energy Administration of China. 2024 Provincial Electricity Generation Statistics; National Energy Administration: Beijing, China, 2025.
- Jin, X.; Chowdhury, A.F.M.K.; Liu, B.; Cheng, C.; Galelli, S. China Southern Power Grid’s decarbonization likely to impact cropland and transboundary rivers. Commun. Earth Environ. 2024, 5, 192. [Google Scholar] [CrossRef] [Scilit]
- Zhao, M.; Xie, Y.; Xu, M.; Weng, Z.; Hanaoka, T.; Zhang, Y.; Tong, D. Optimizing air quality and health co-benefits of mitigation technologies in China: An integrated assessment. Environ. Sci. Ecotechnol. 2024, 22, 100454. [Google Scholar] [CrossRef] [Scilit] [PubMed]
- Wei, N.; Jiao, Z.; Ellett, K.; Ku, A.Y.; Liu, S.; Middleton, R.; Bromhal, G.S.; Harp, D.; Sun, Y.; Dahowski, R.T.; et al. Decarbonizing the Coal-Fired Power Sector in China via Carbon Capture, Geological Utilization, and Storage Technology. Environ. Sci. Technol. 2021, 55, 13164–13173. [Google Scholar] [CrossRef] [Scilit] [PubMed]
- Fan, J.-L.; Xu, M.; Yang, L.; Zhang, X. Benefit evaluation of investment in CCS retrofitting of coal-fired power plants and PV power plants in China based on real options. Renew. Sustain. Energy Rev. 2019, 115, 109350. [Google Scholar] [CrossRef] [Scilit]
- Goto, K.; Yogo, K.; Higashii, T. A review of efficiency penalty in a coal-fired power plant with post-combustion CO2 capture. Appl. Energy 2013, 111, 710–720. [Google Scholar] [CrossRef] [Scilit]
- Cui, R.Y.; Hultman, N.; Edwards, M.R.; He, L.; Sen, A.; Surana, K.; McJeon, H.; Iyer, G.; Patel, P.; Yu, S.; et al. Quantifying operational lifetimes for coal power plants under the Paris goals. Nat. Commun. 2019, 10, 4759. [Google Scholar] [CrossRef] [Scilit] [PubMed]
- Zheng, S.; Ye, Z.; Lu, K.; He, T.; Liu, Y.; Zhang, L.; Hao, Y. Accounting for non-CO2 greenhouse gases in global PV trade: Implications for climate responsibility and policy. Sustain. Prod. Consum. 2026, 62, 55–69. [Google Scholar] [CrossRef] [Scilit]
- Khan, Z.U.; Khan, A.D.; Khan, K.; AlKhatib, S.A.K.; Khan, S.; Khan, M.Q.; Ullah, A. A Review of Degradation and Reliability Analysis of a Solar PV Module. IEEE Access 2024, 12, 185036–185056. [Google Scholar] [CrossRef] [Scilit]
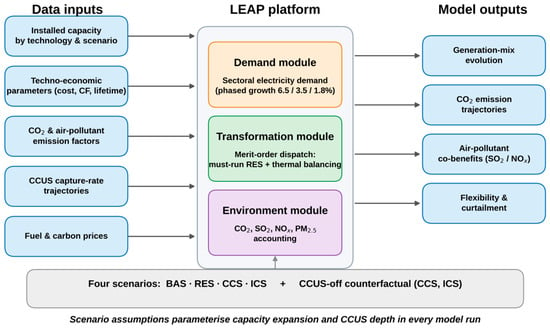
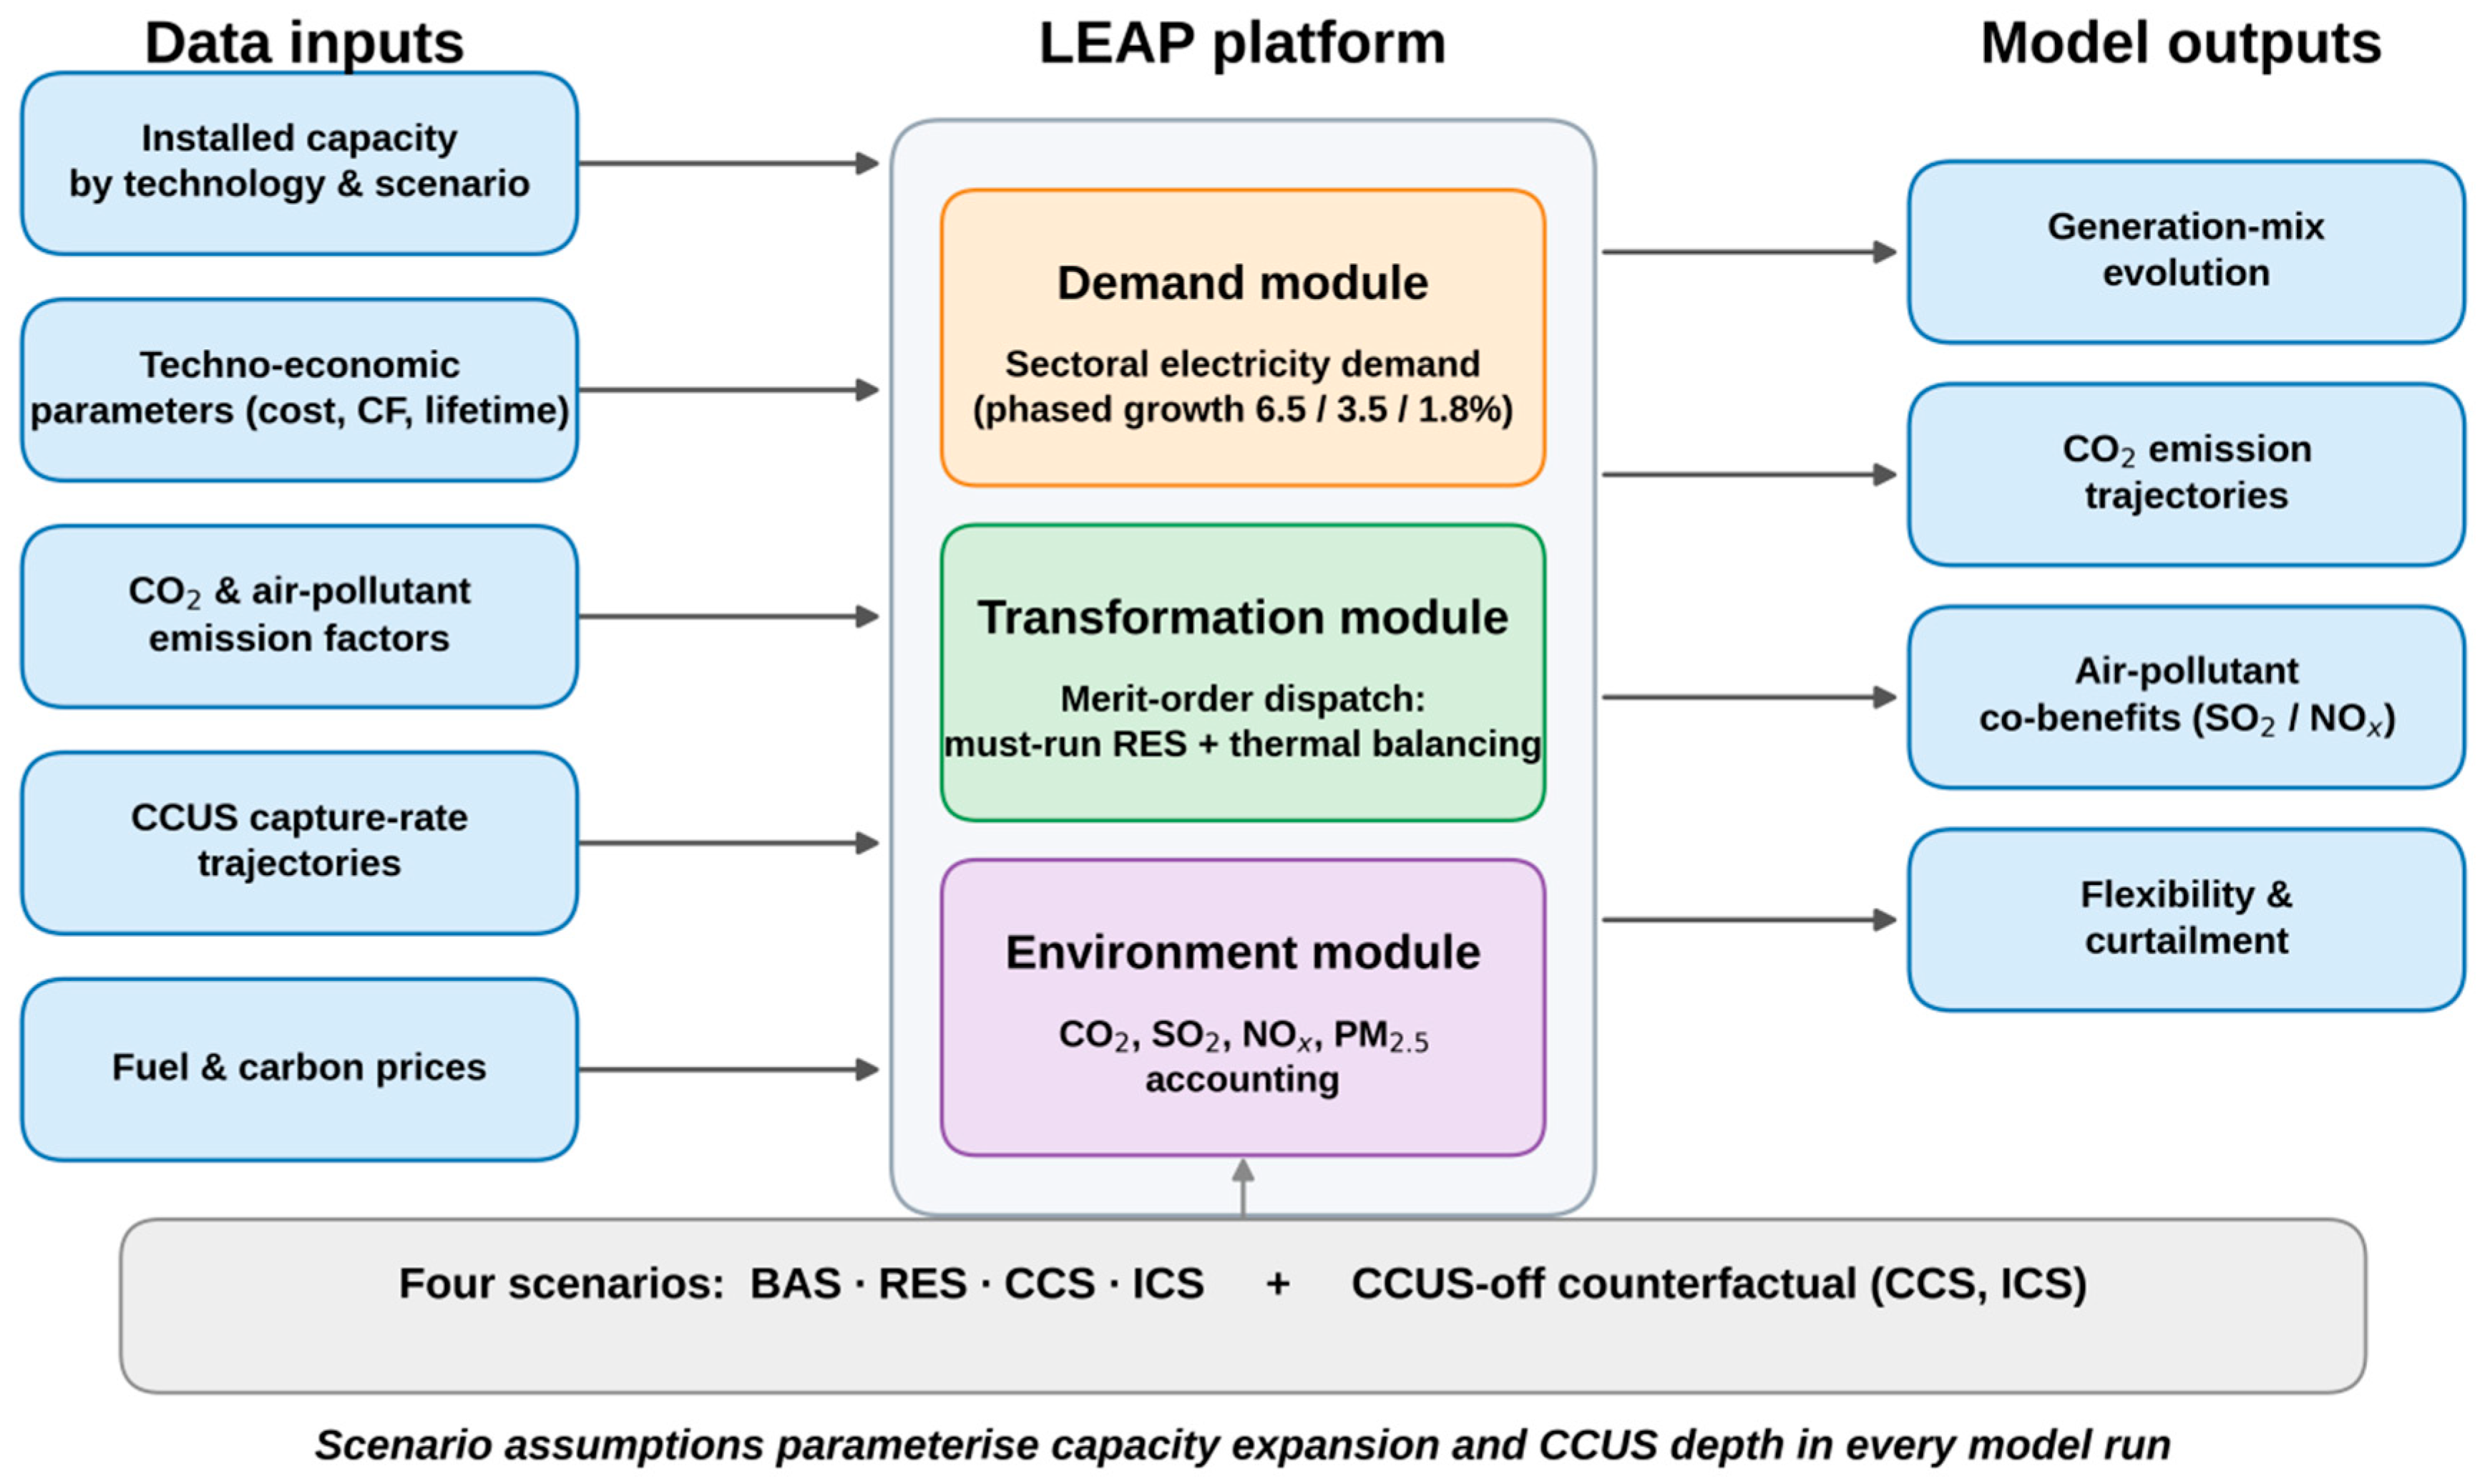
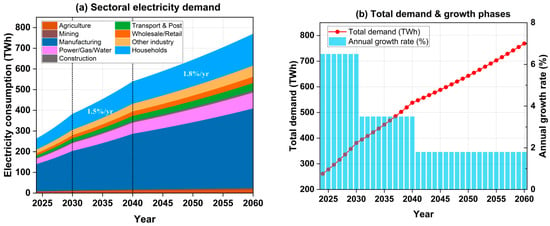
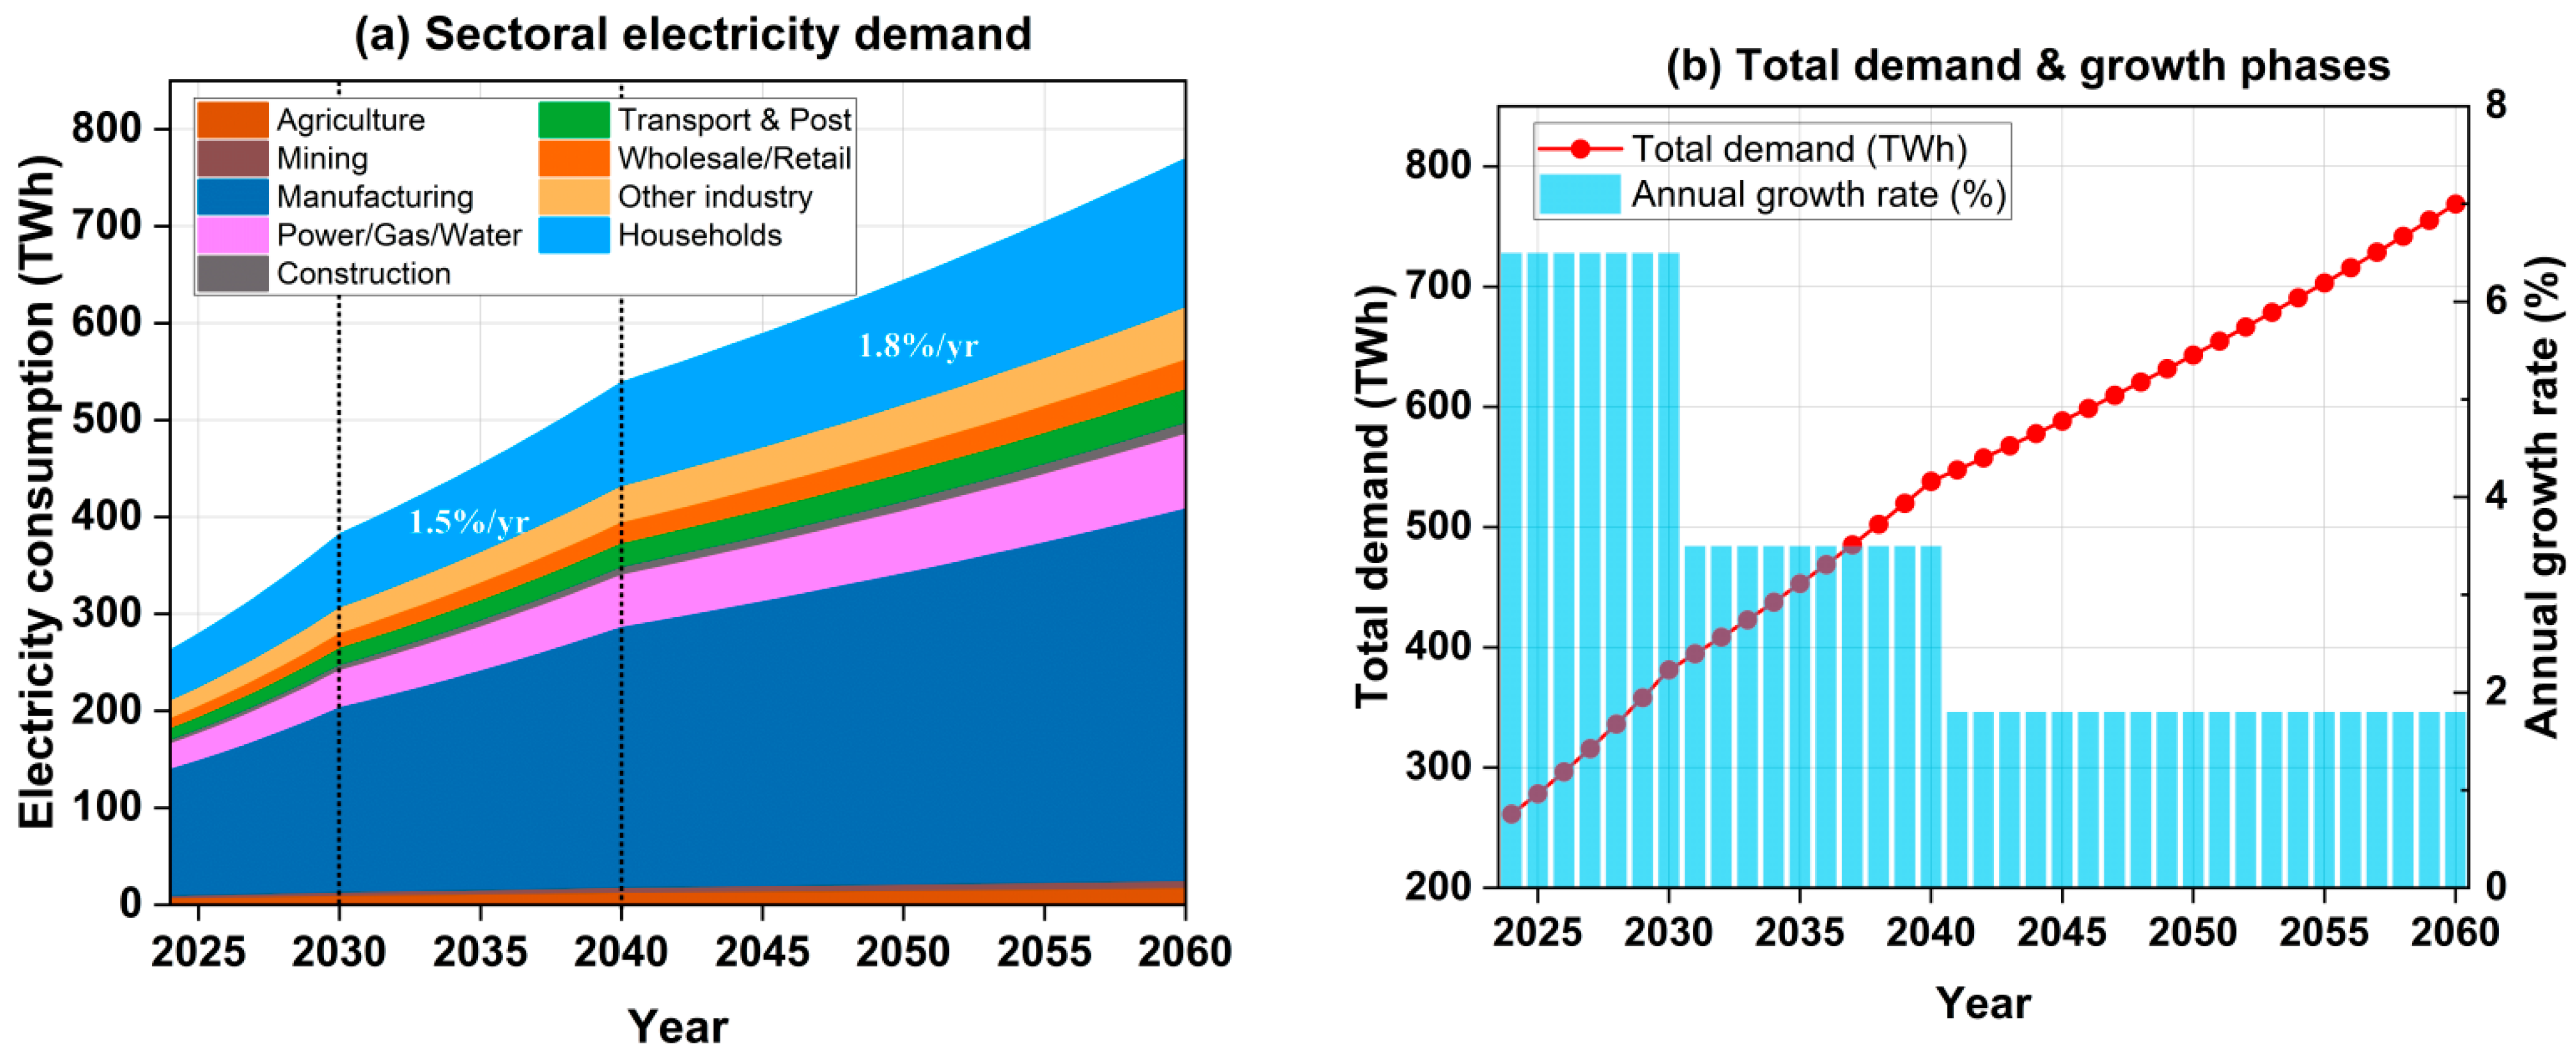
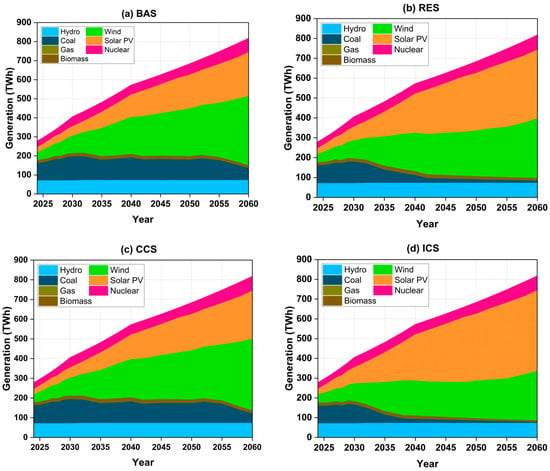
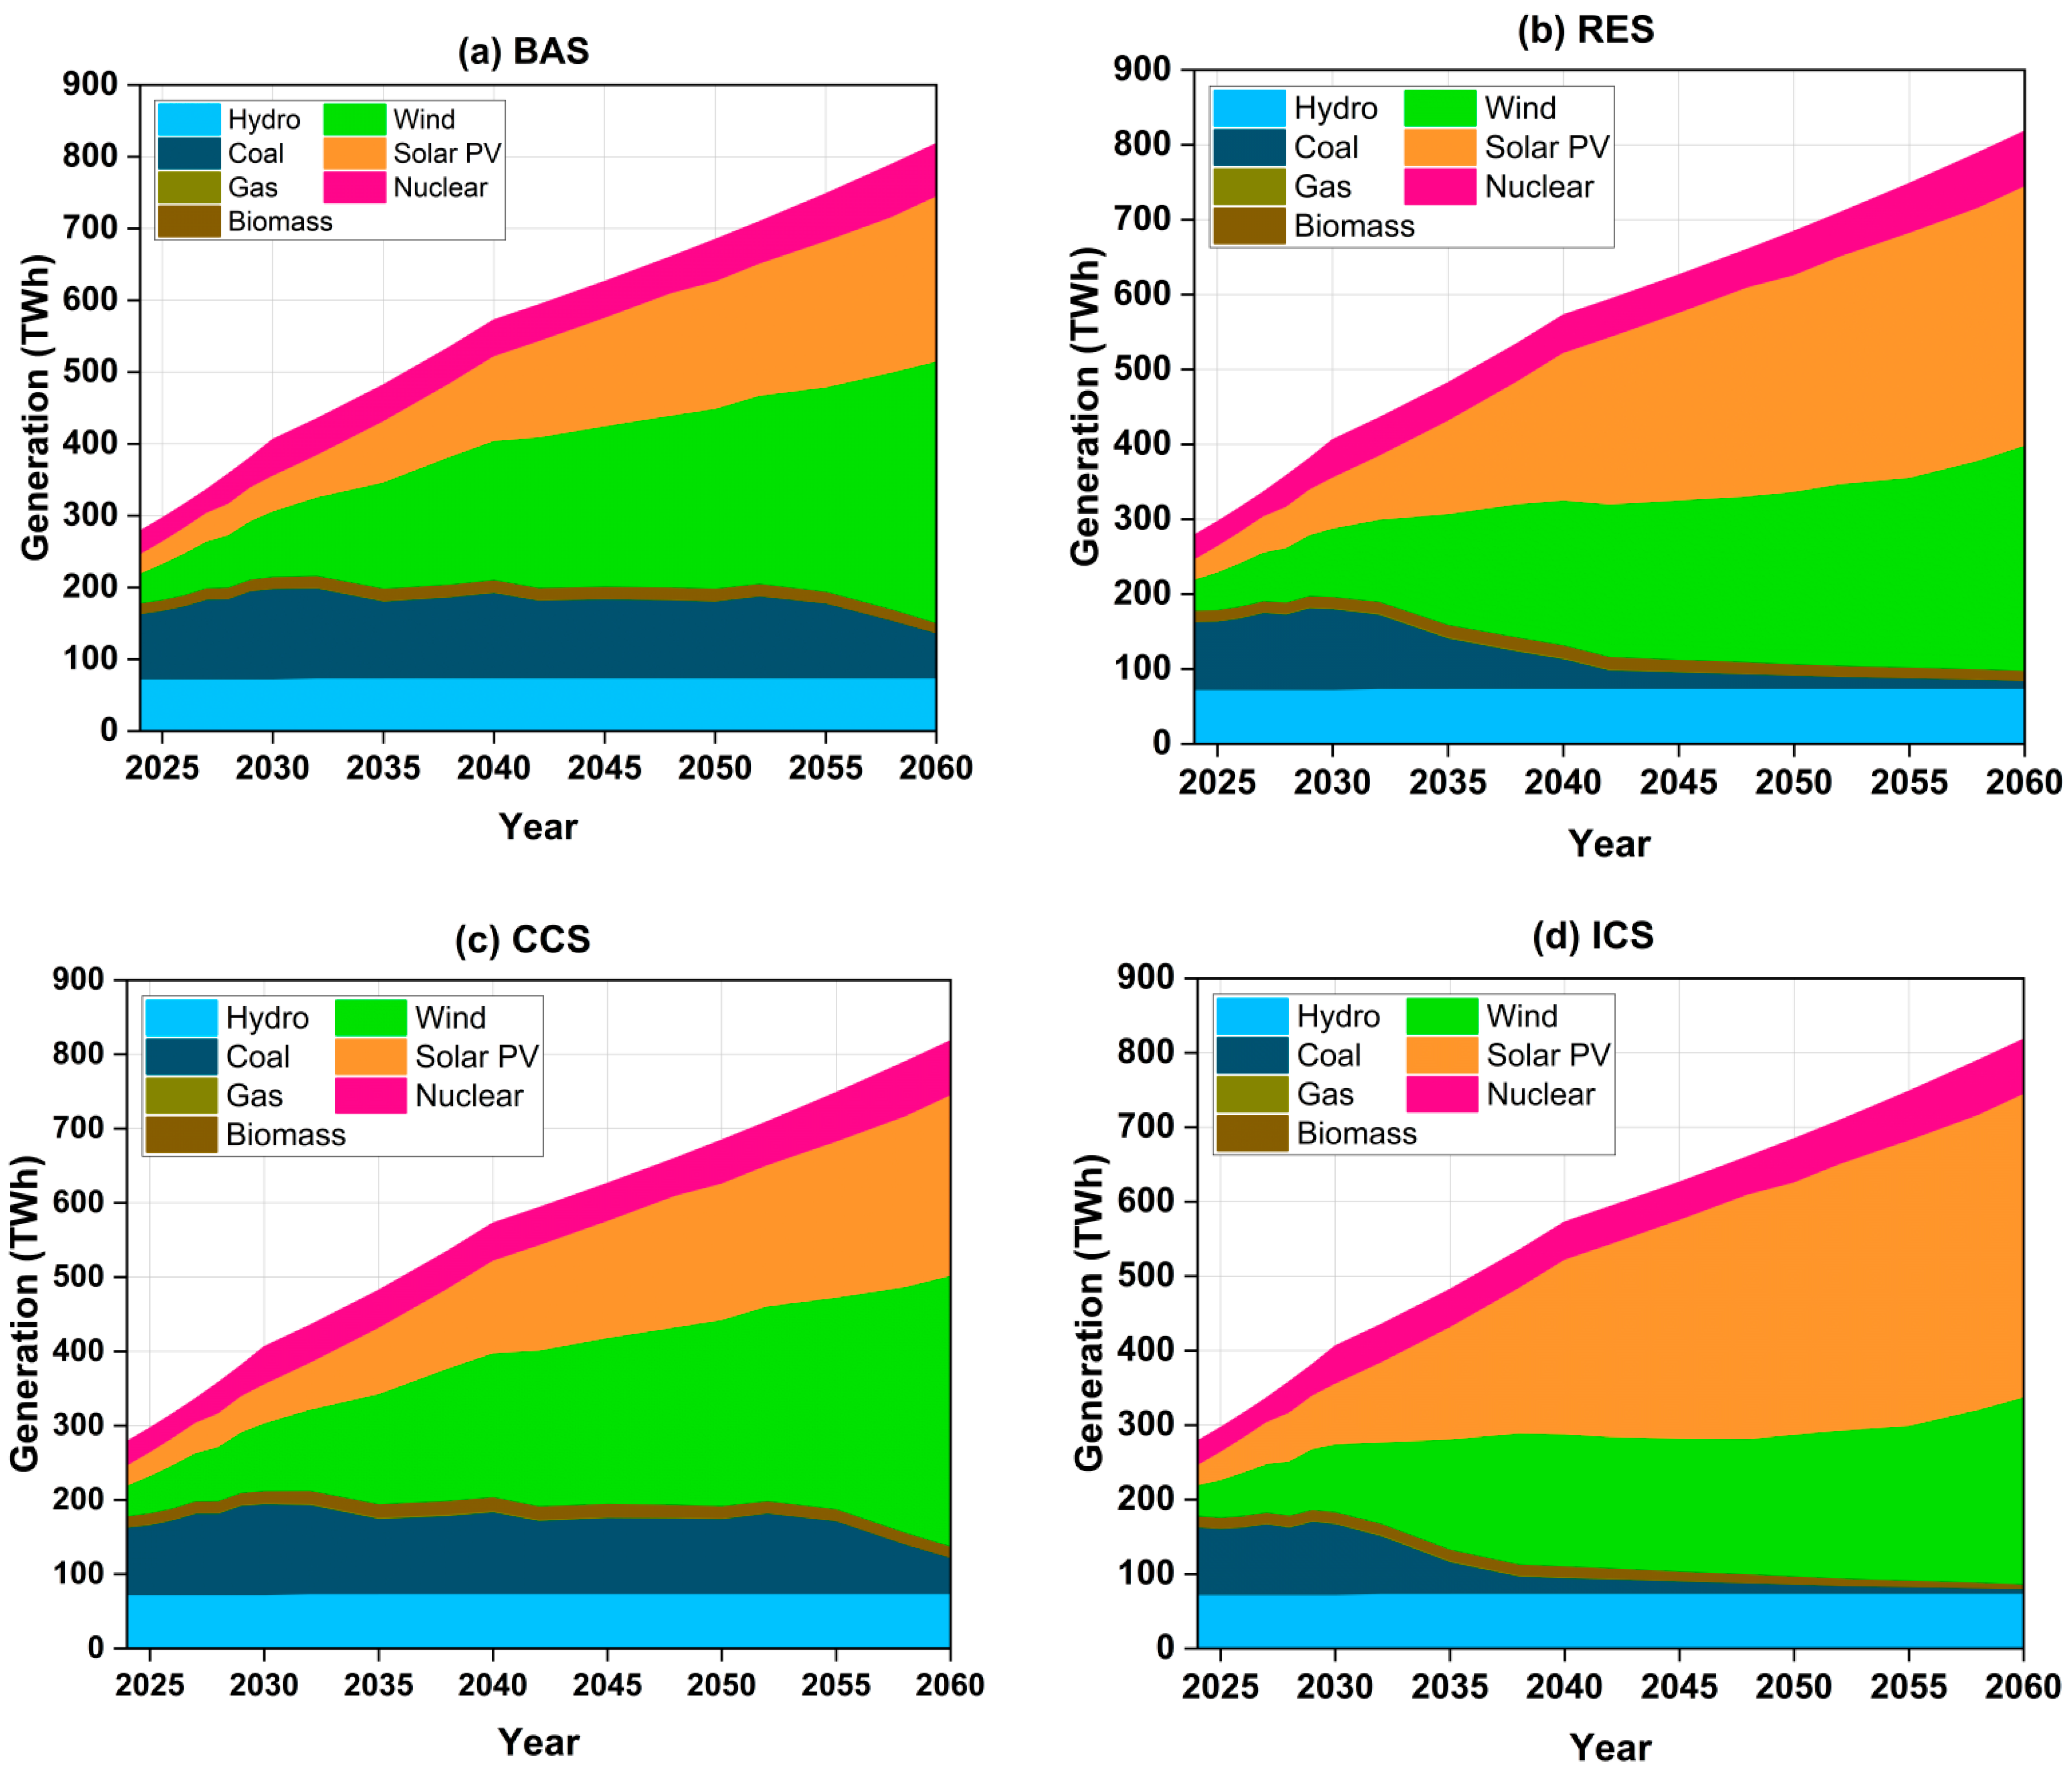
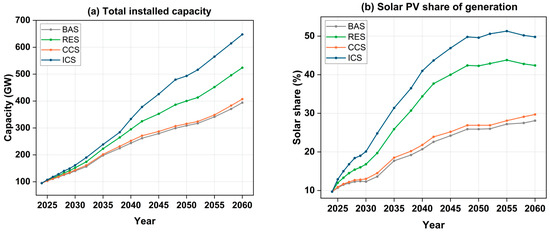
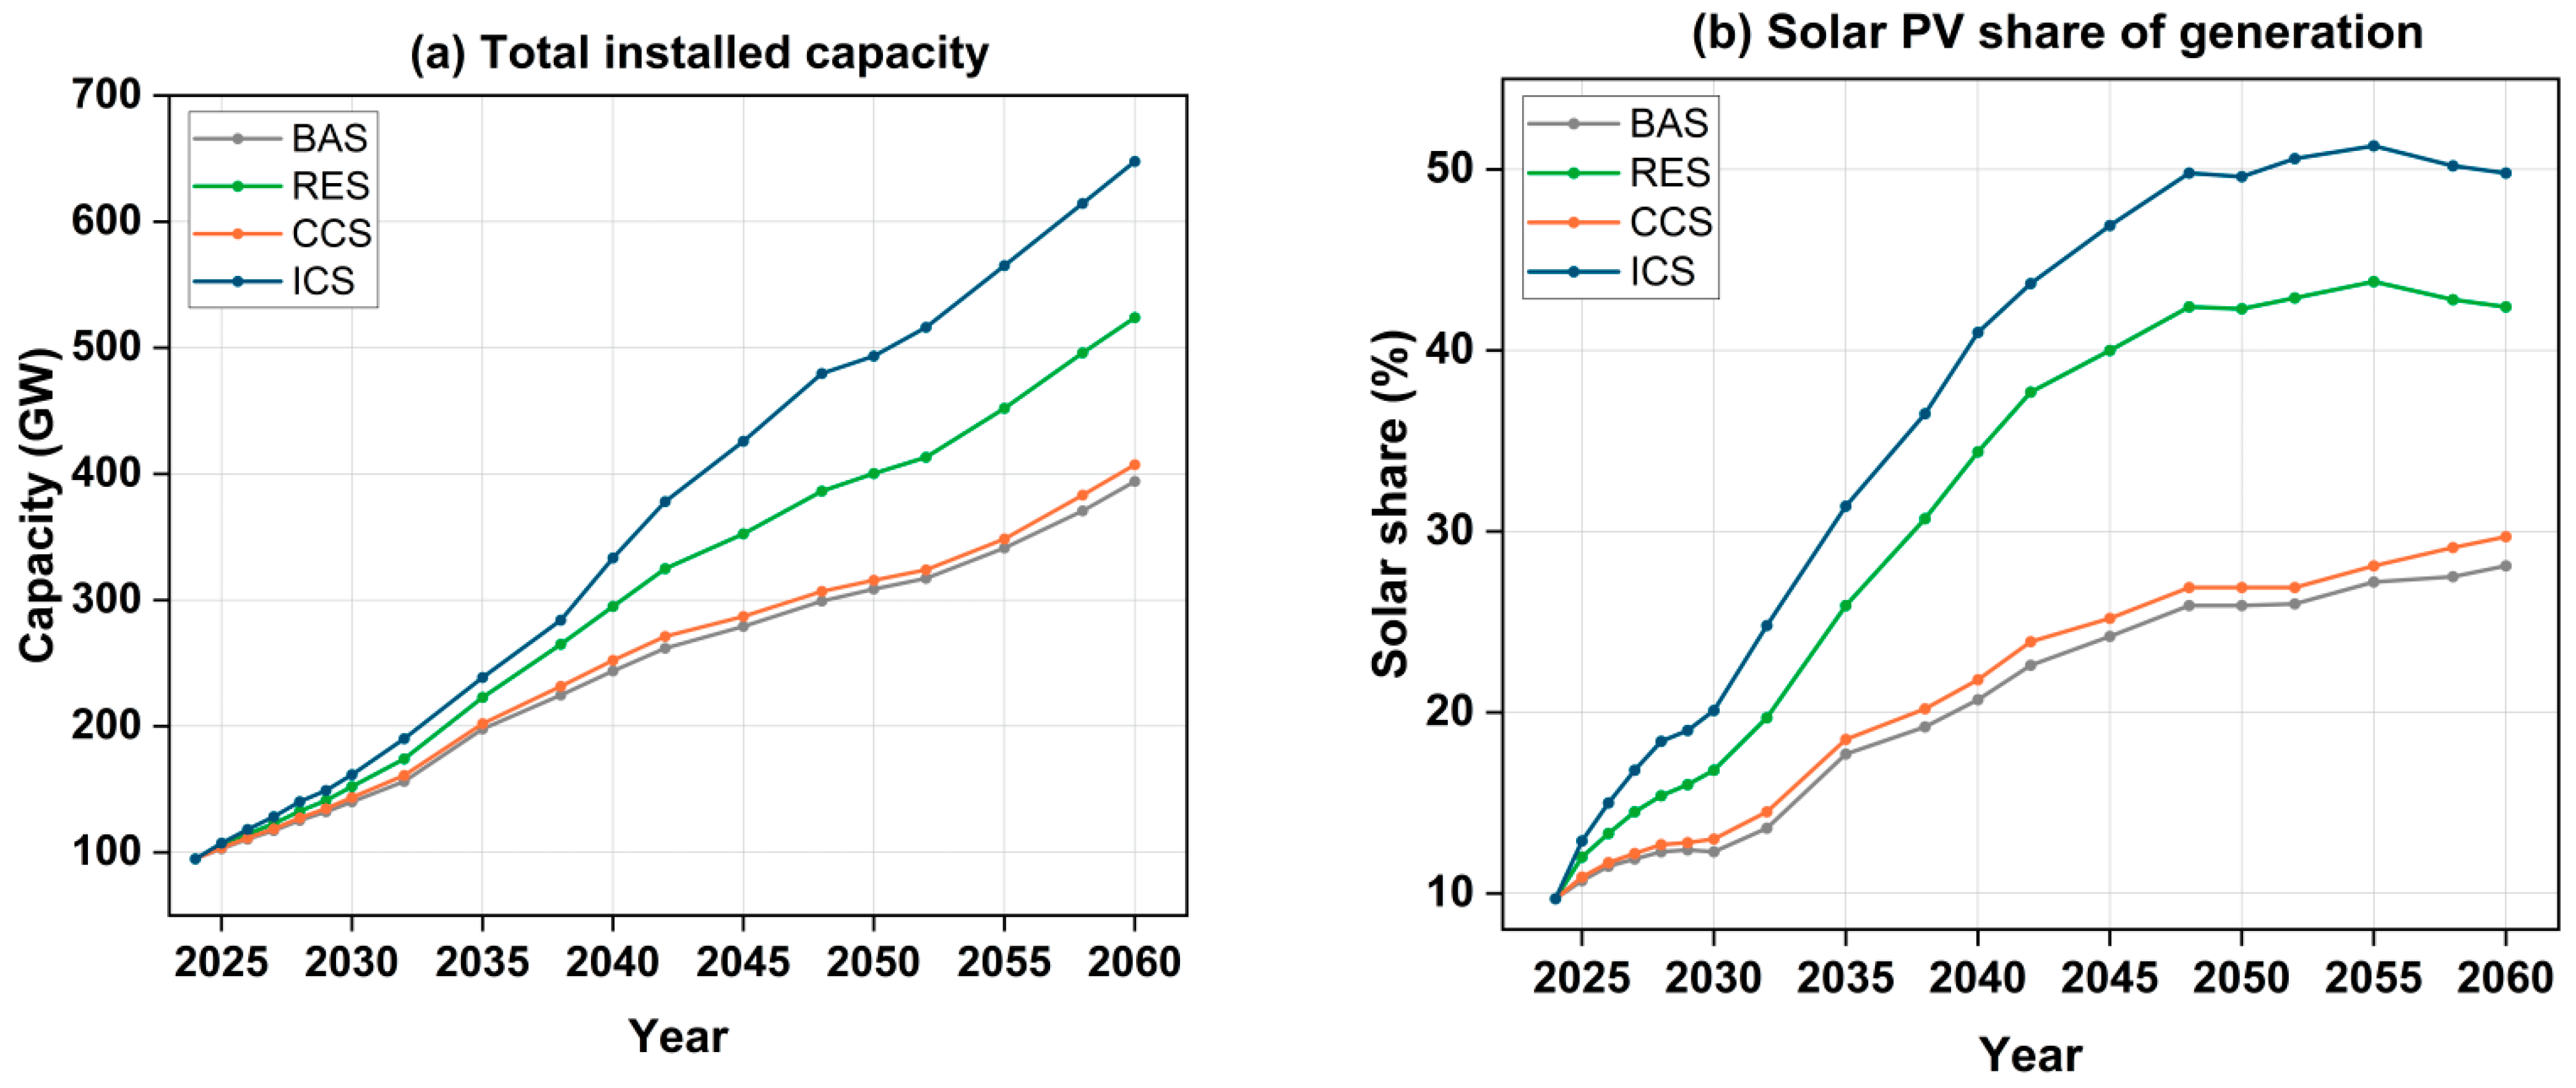
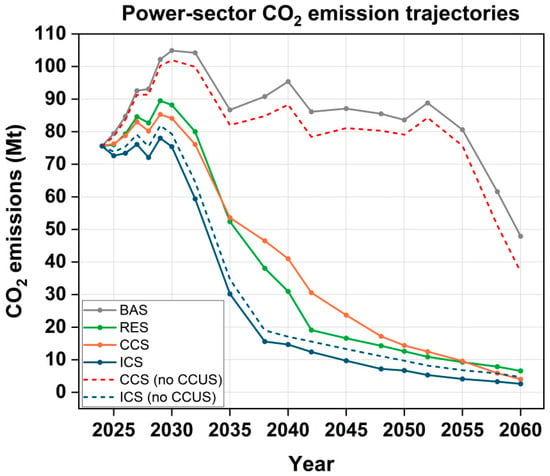
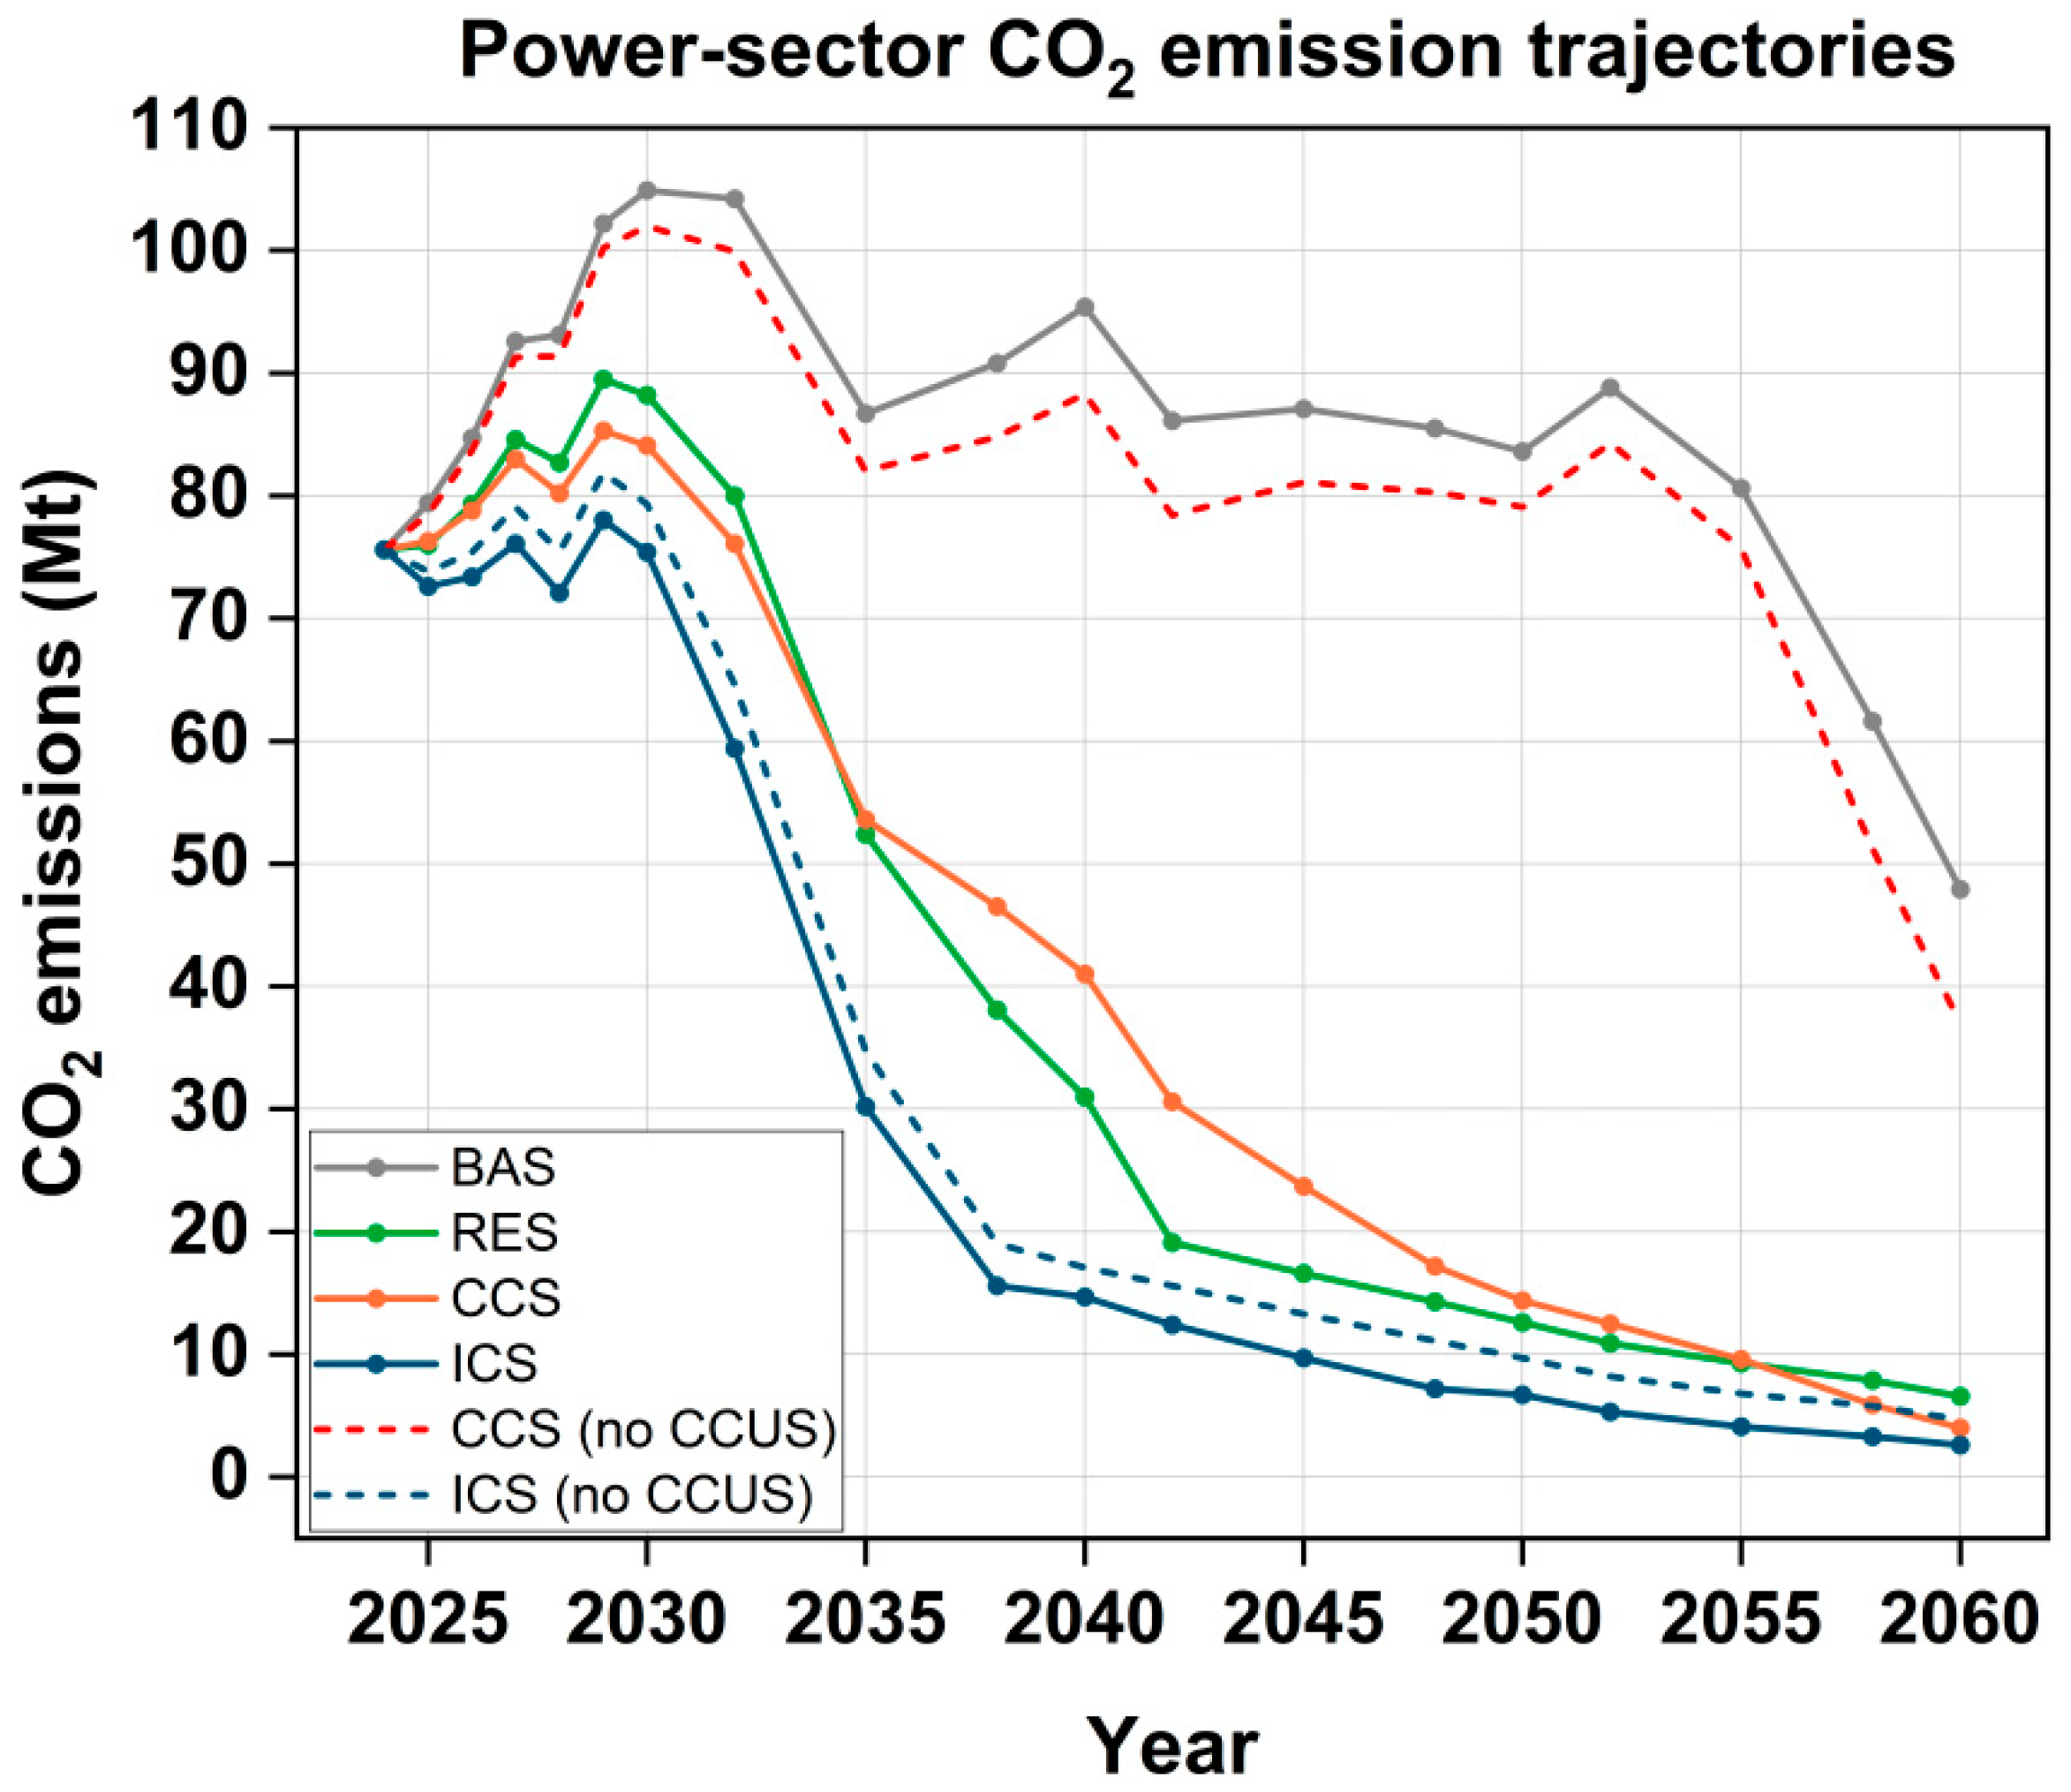
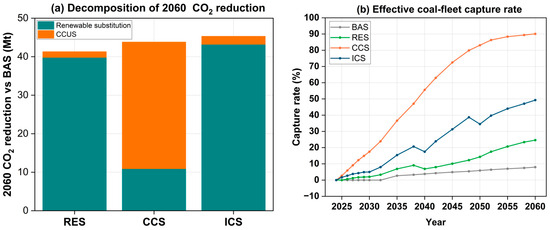
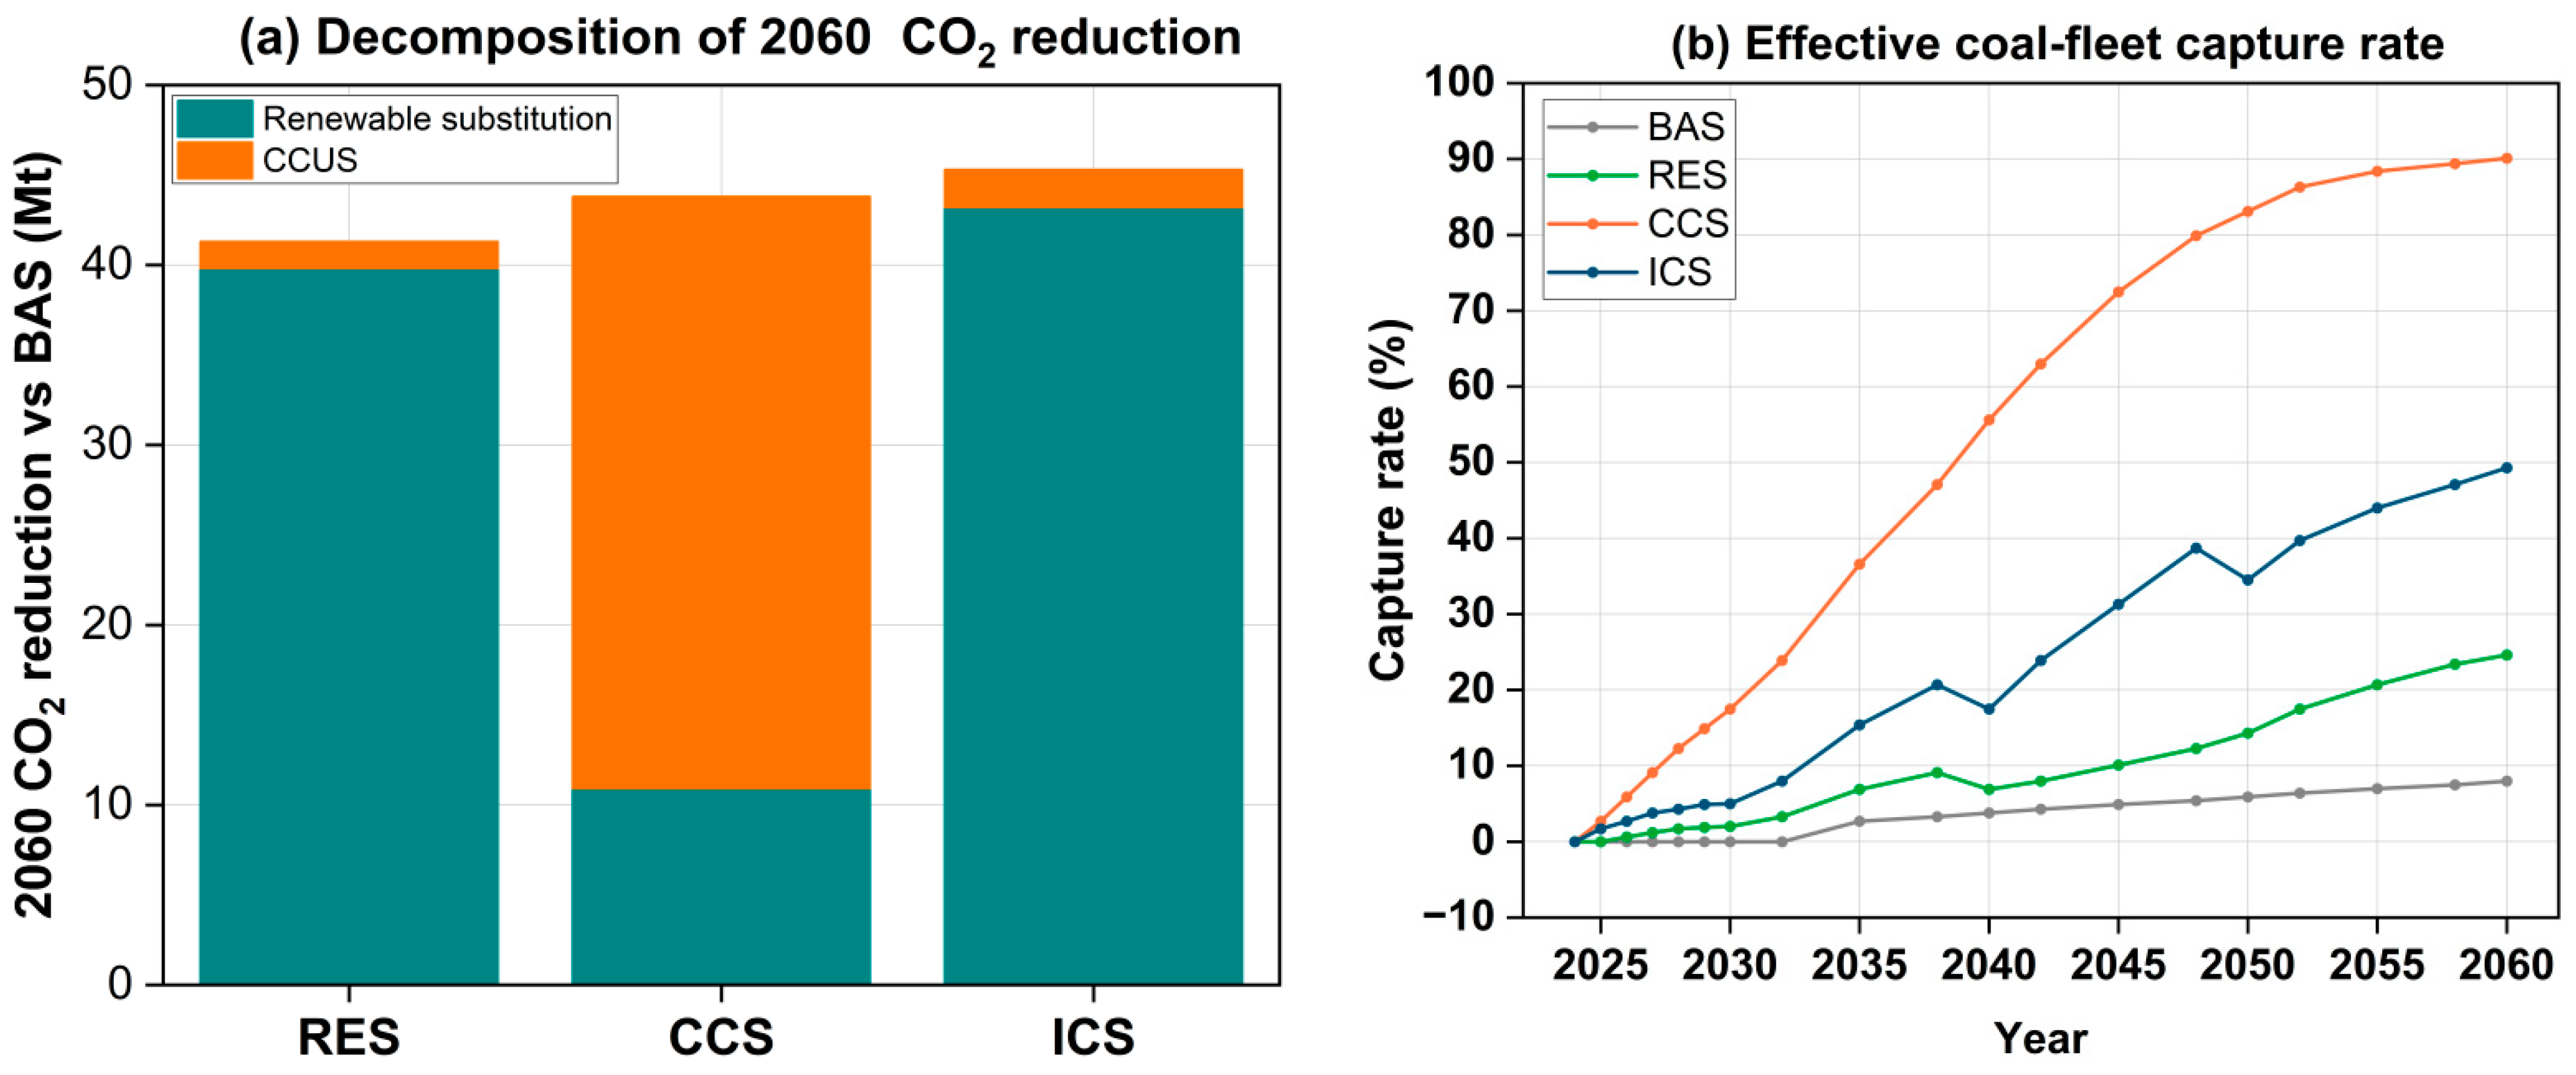
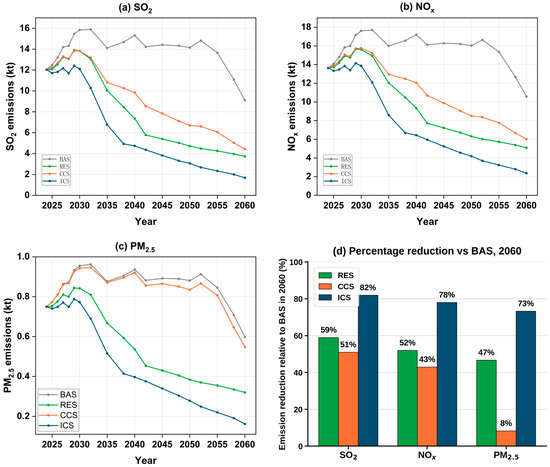
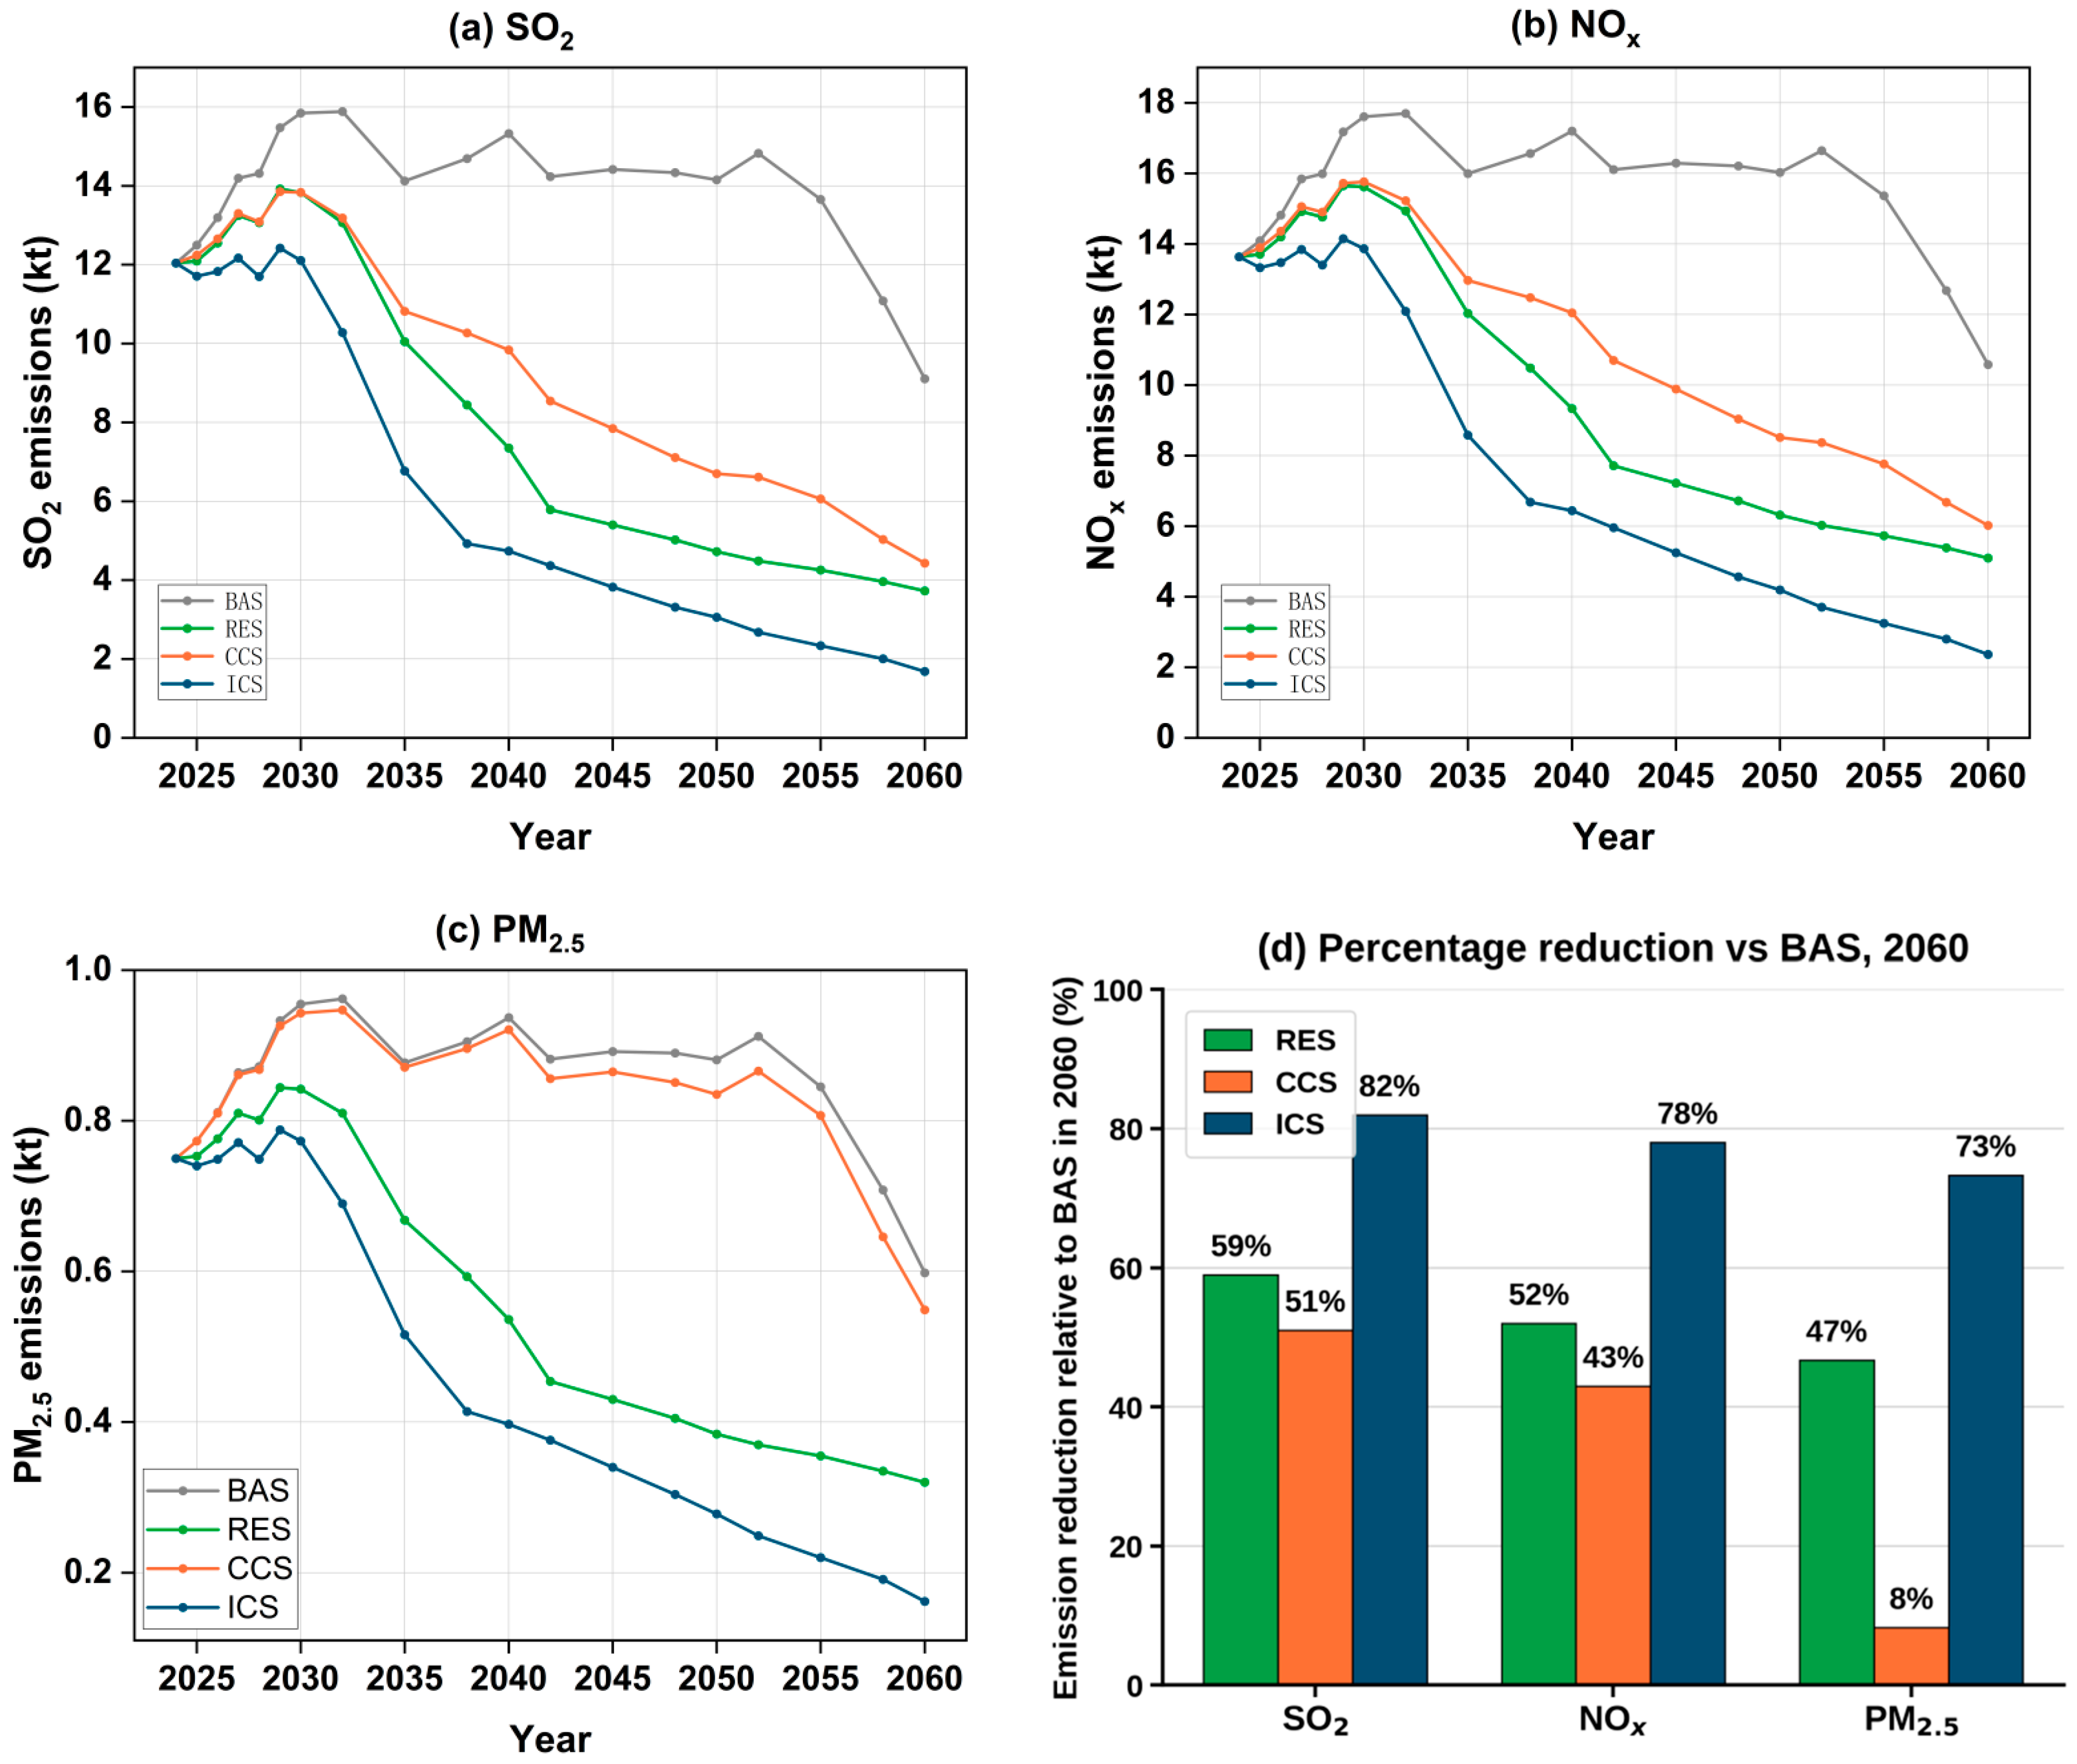
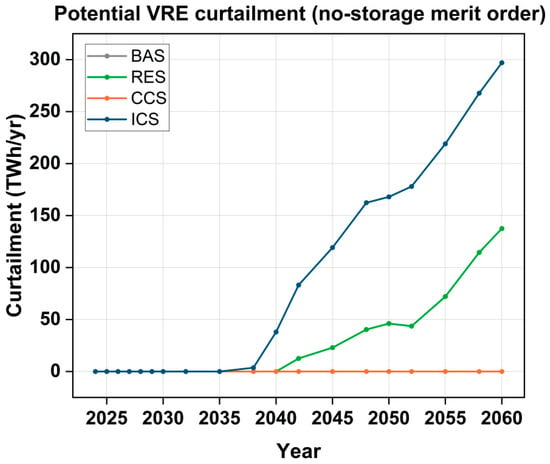
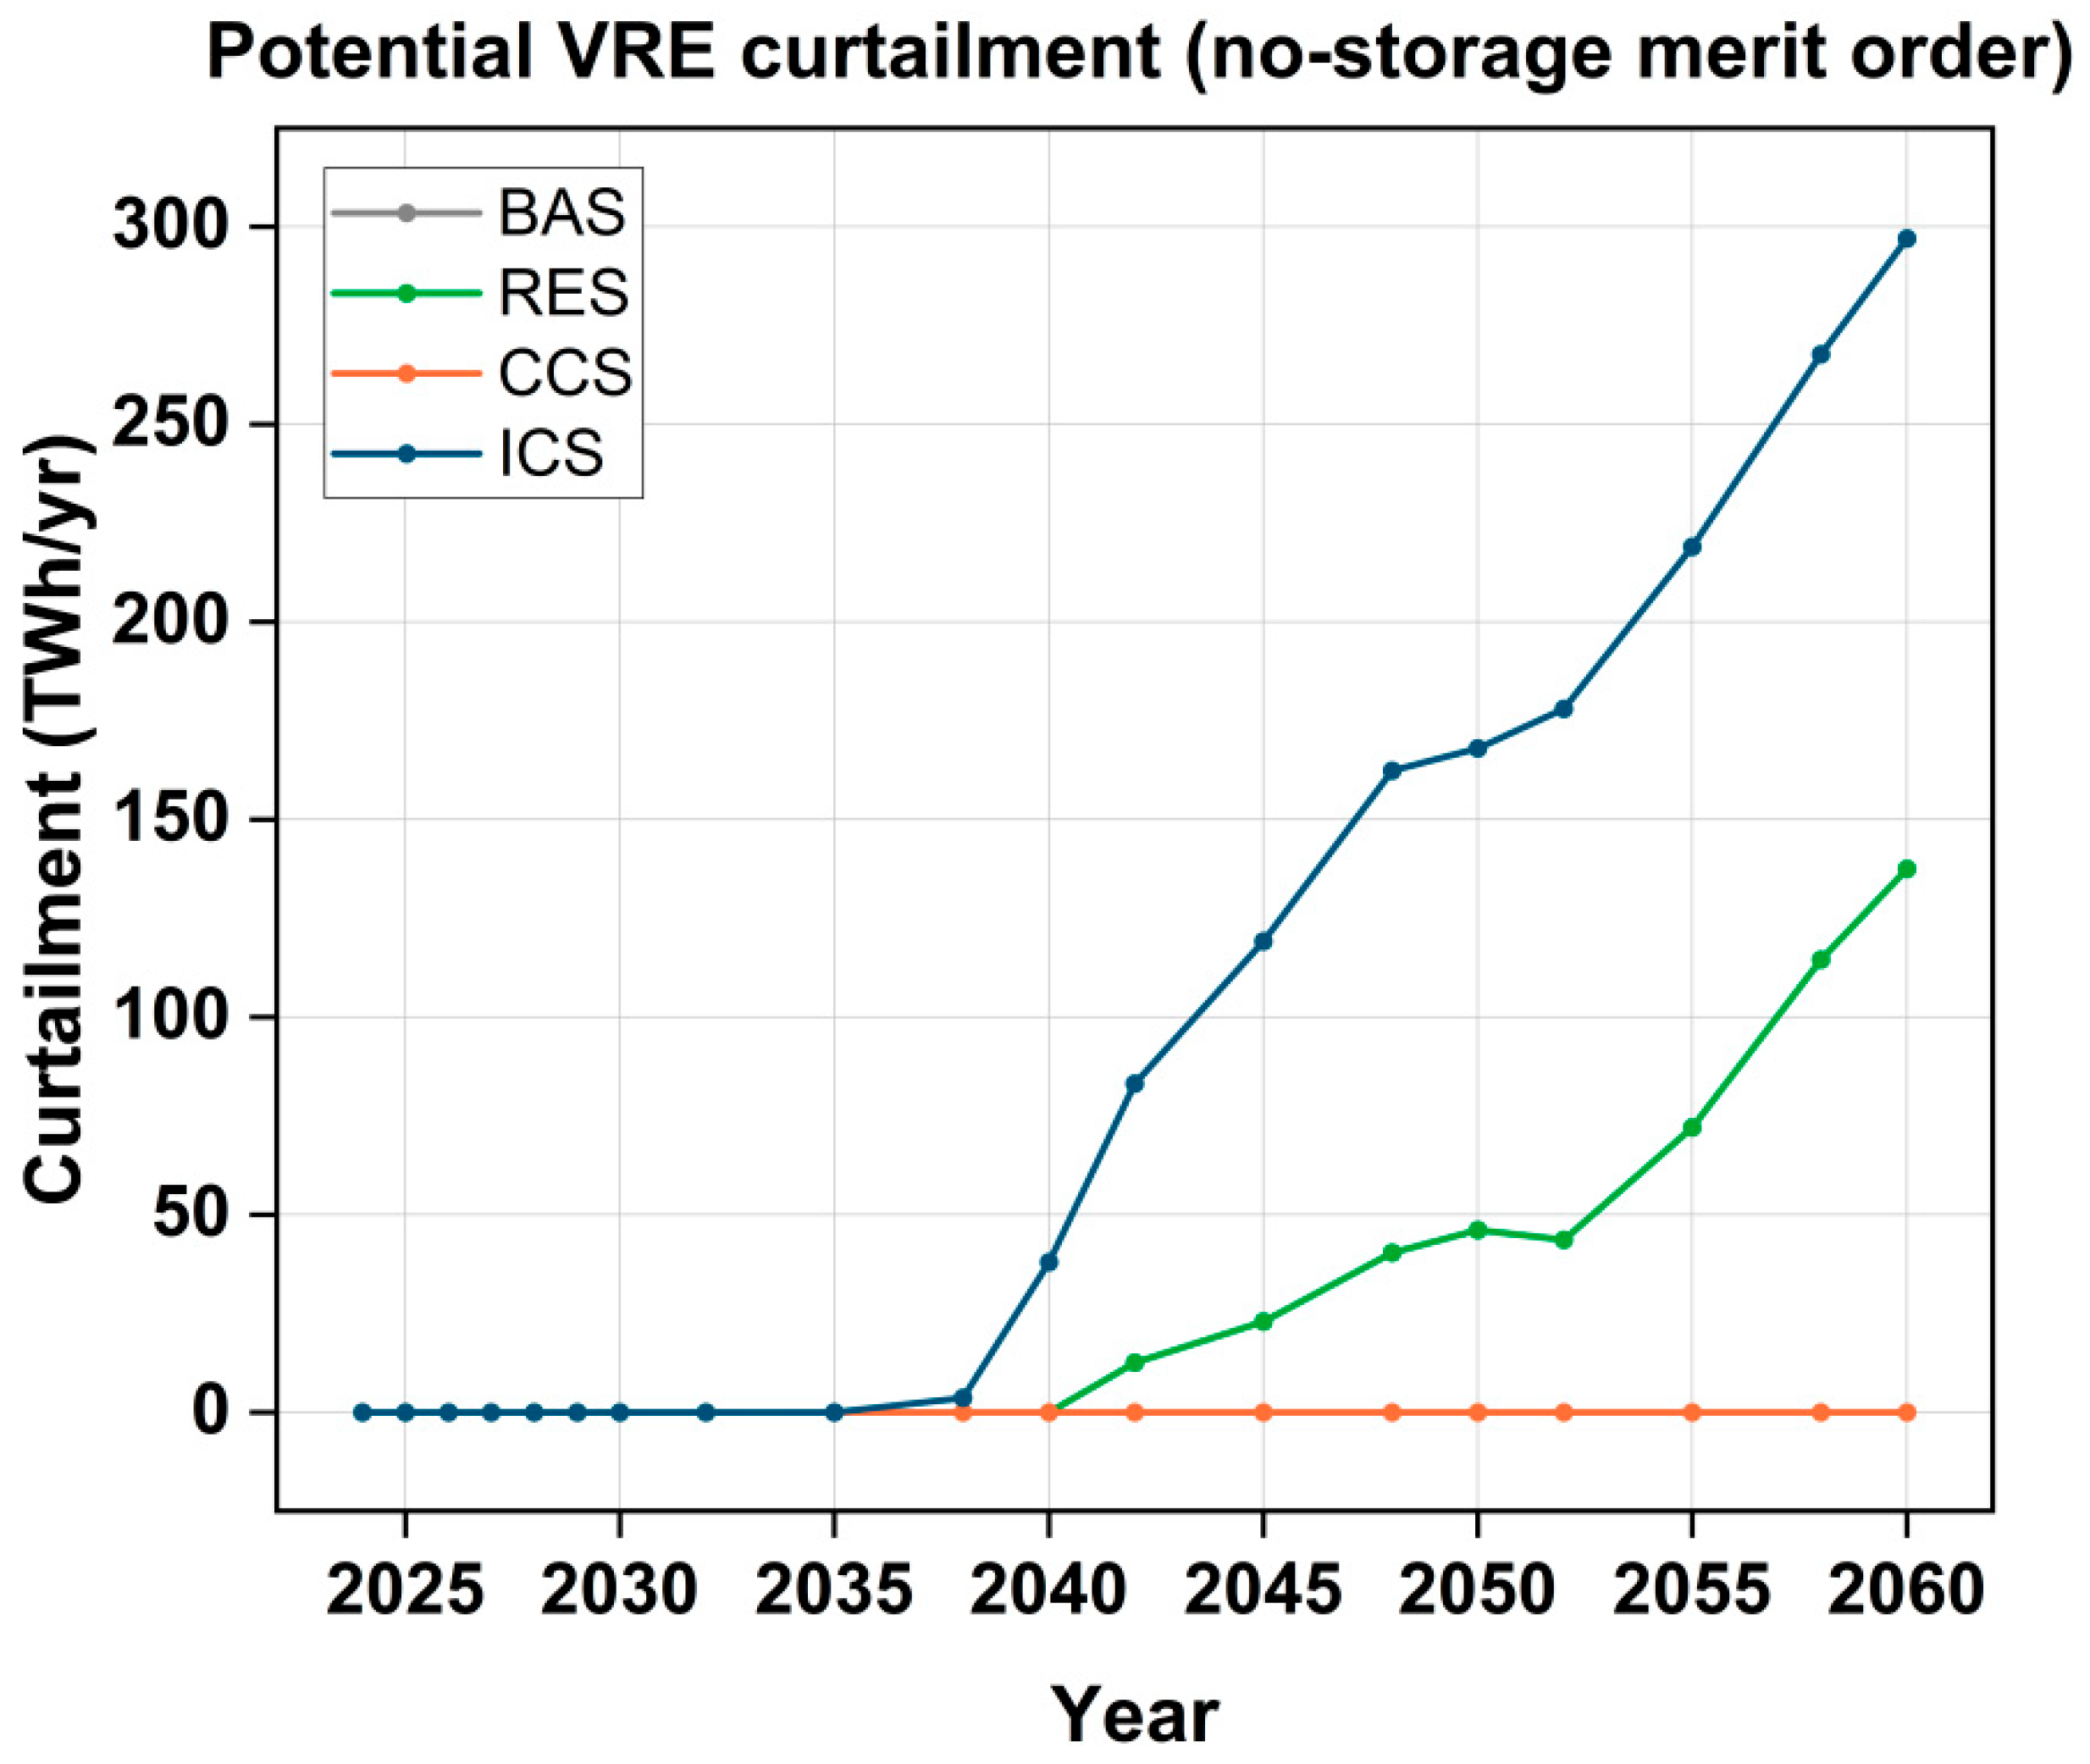
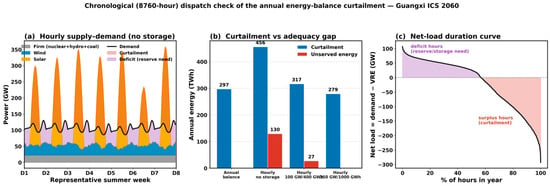
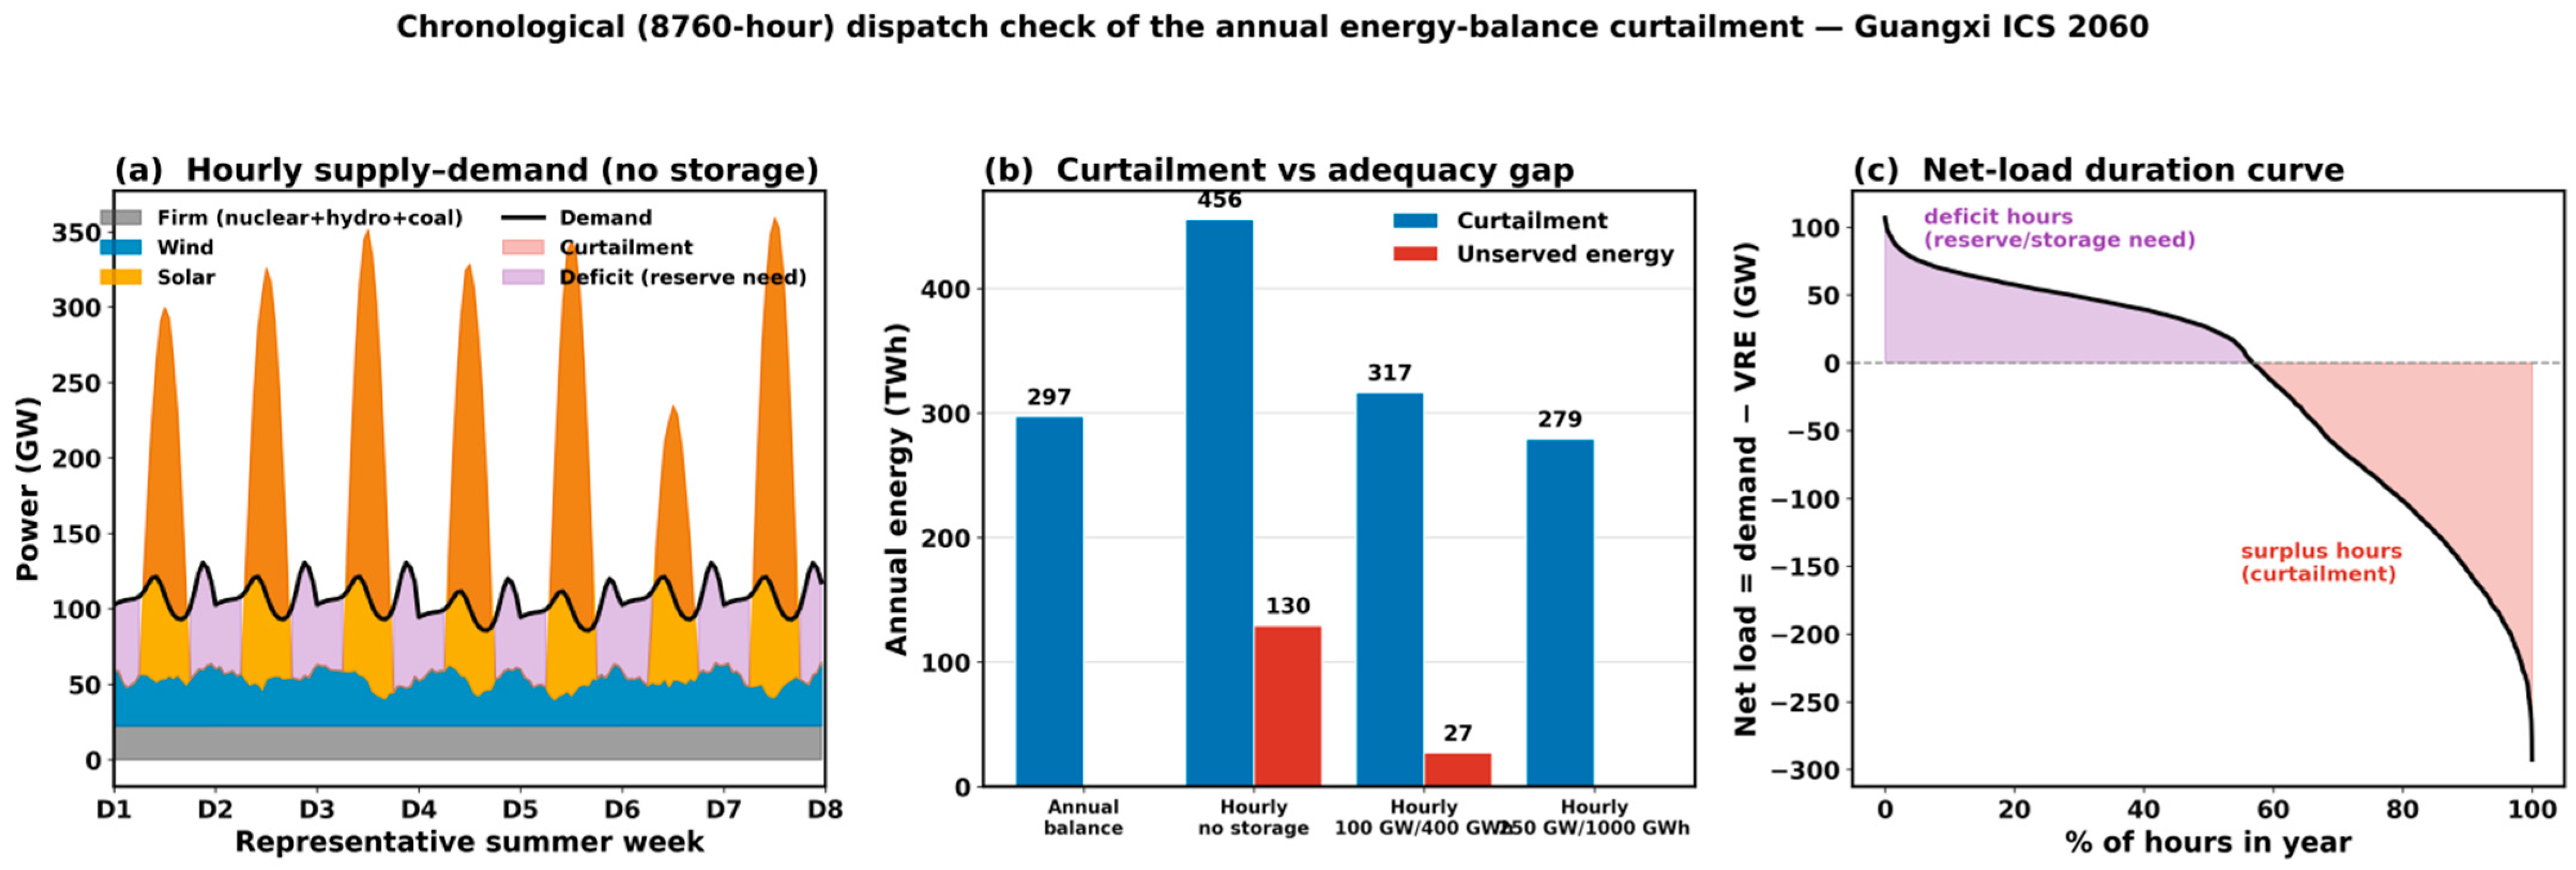
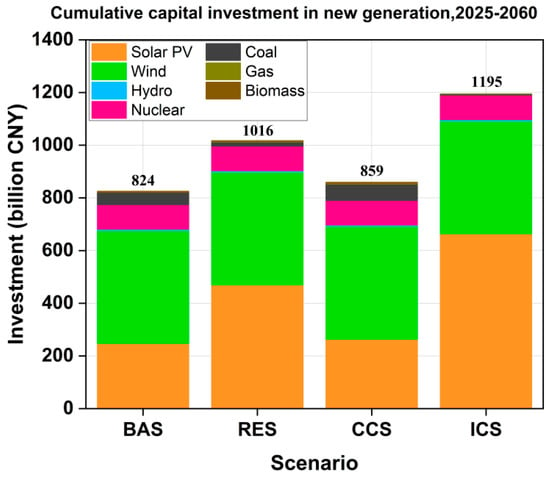
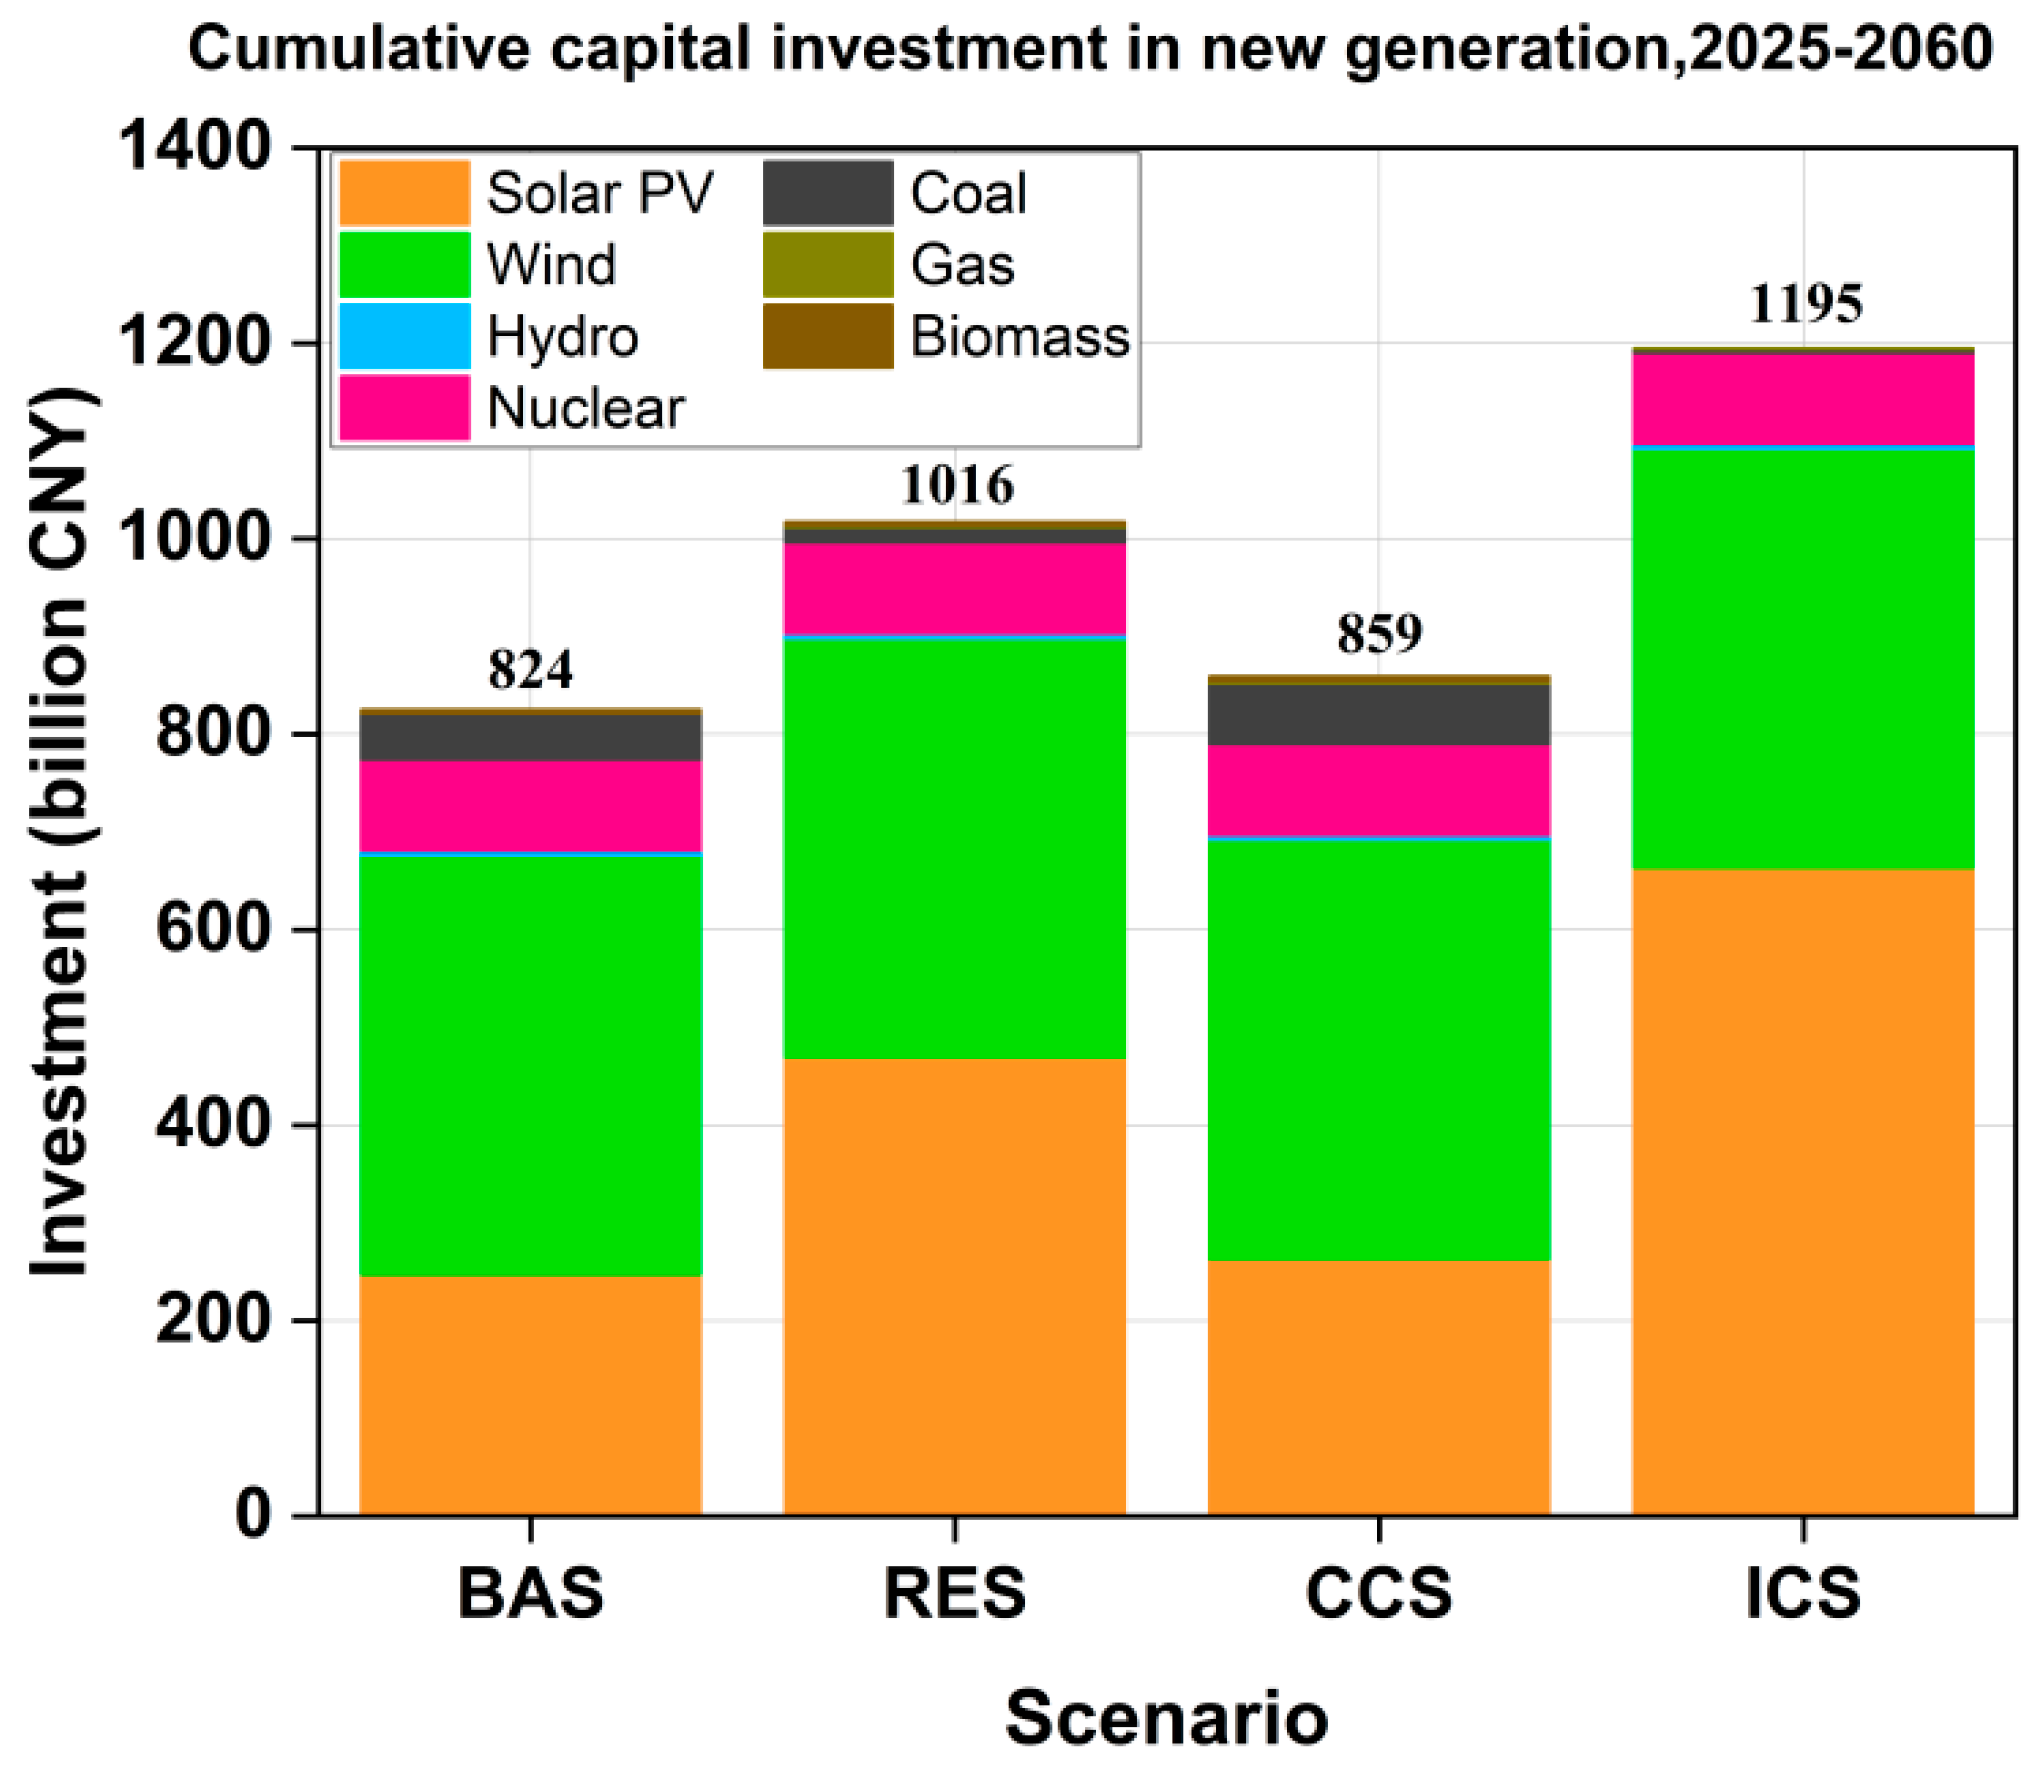
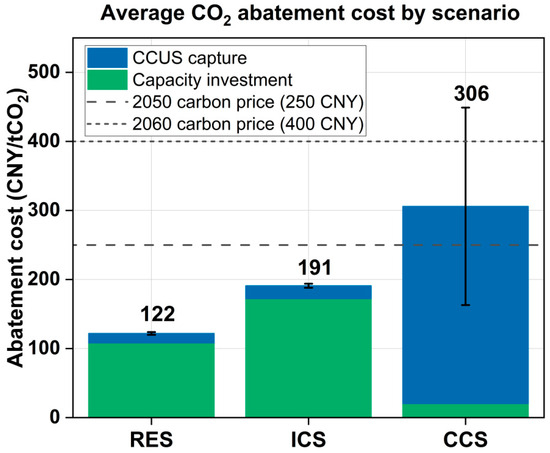
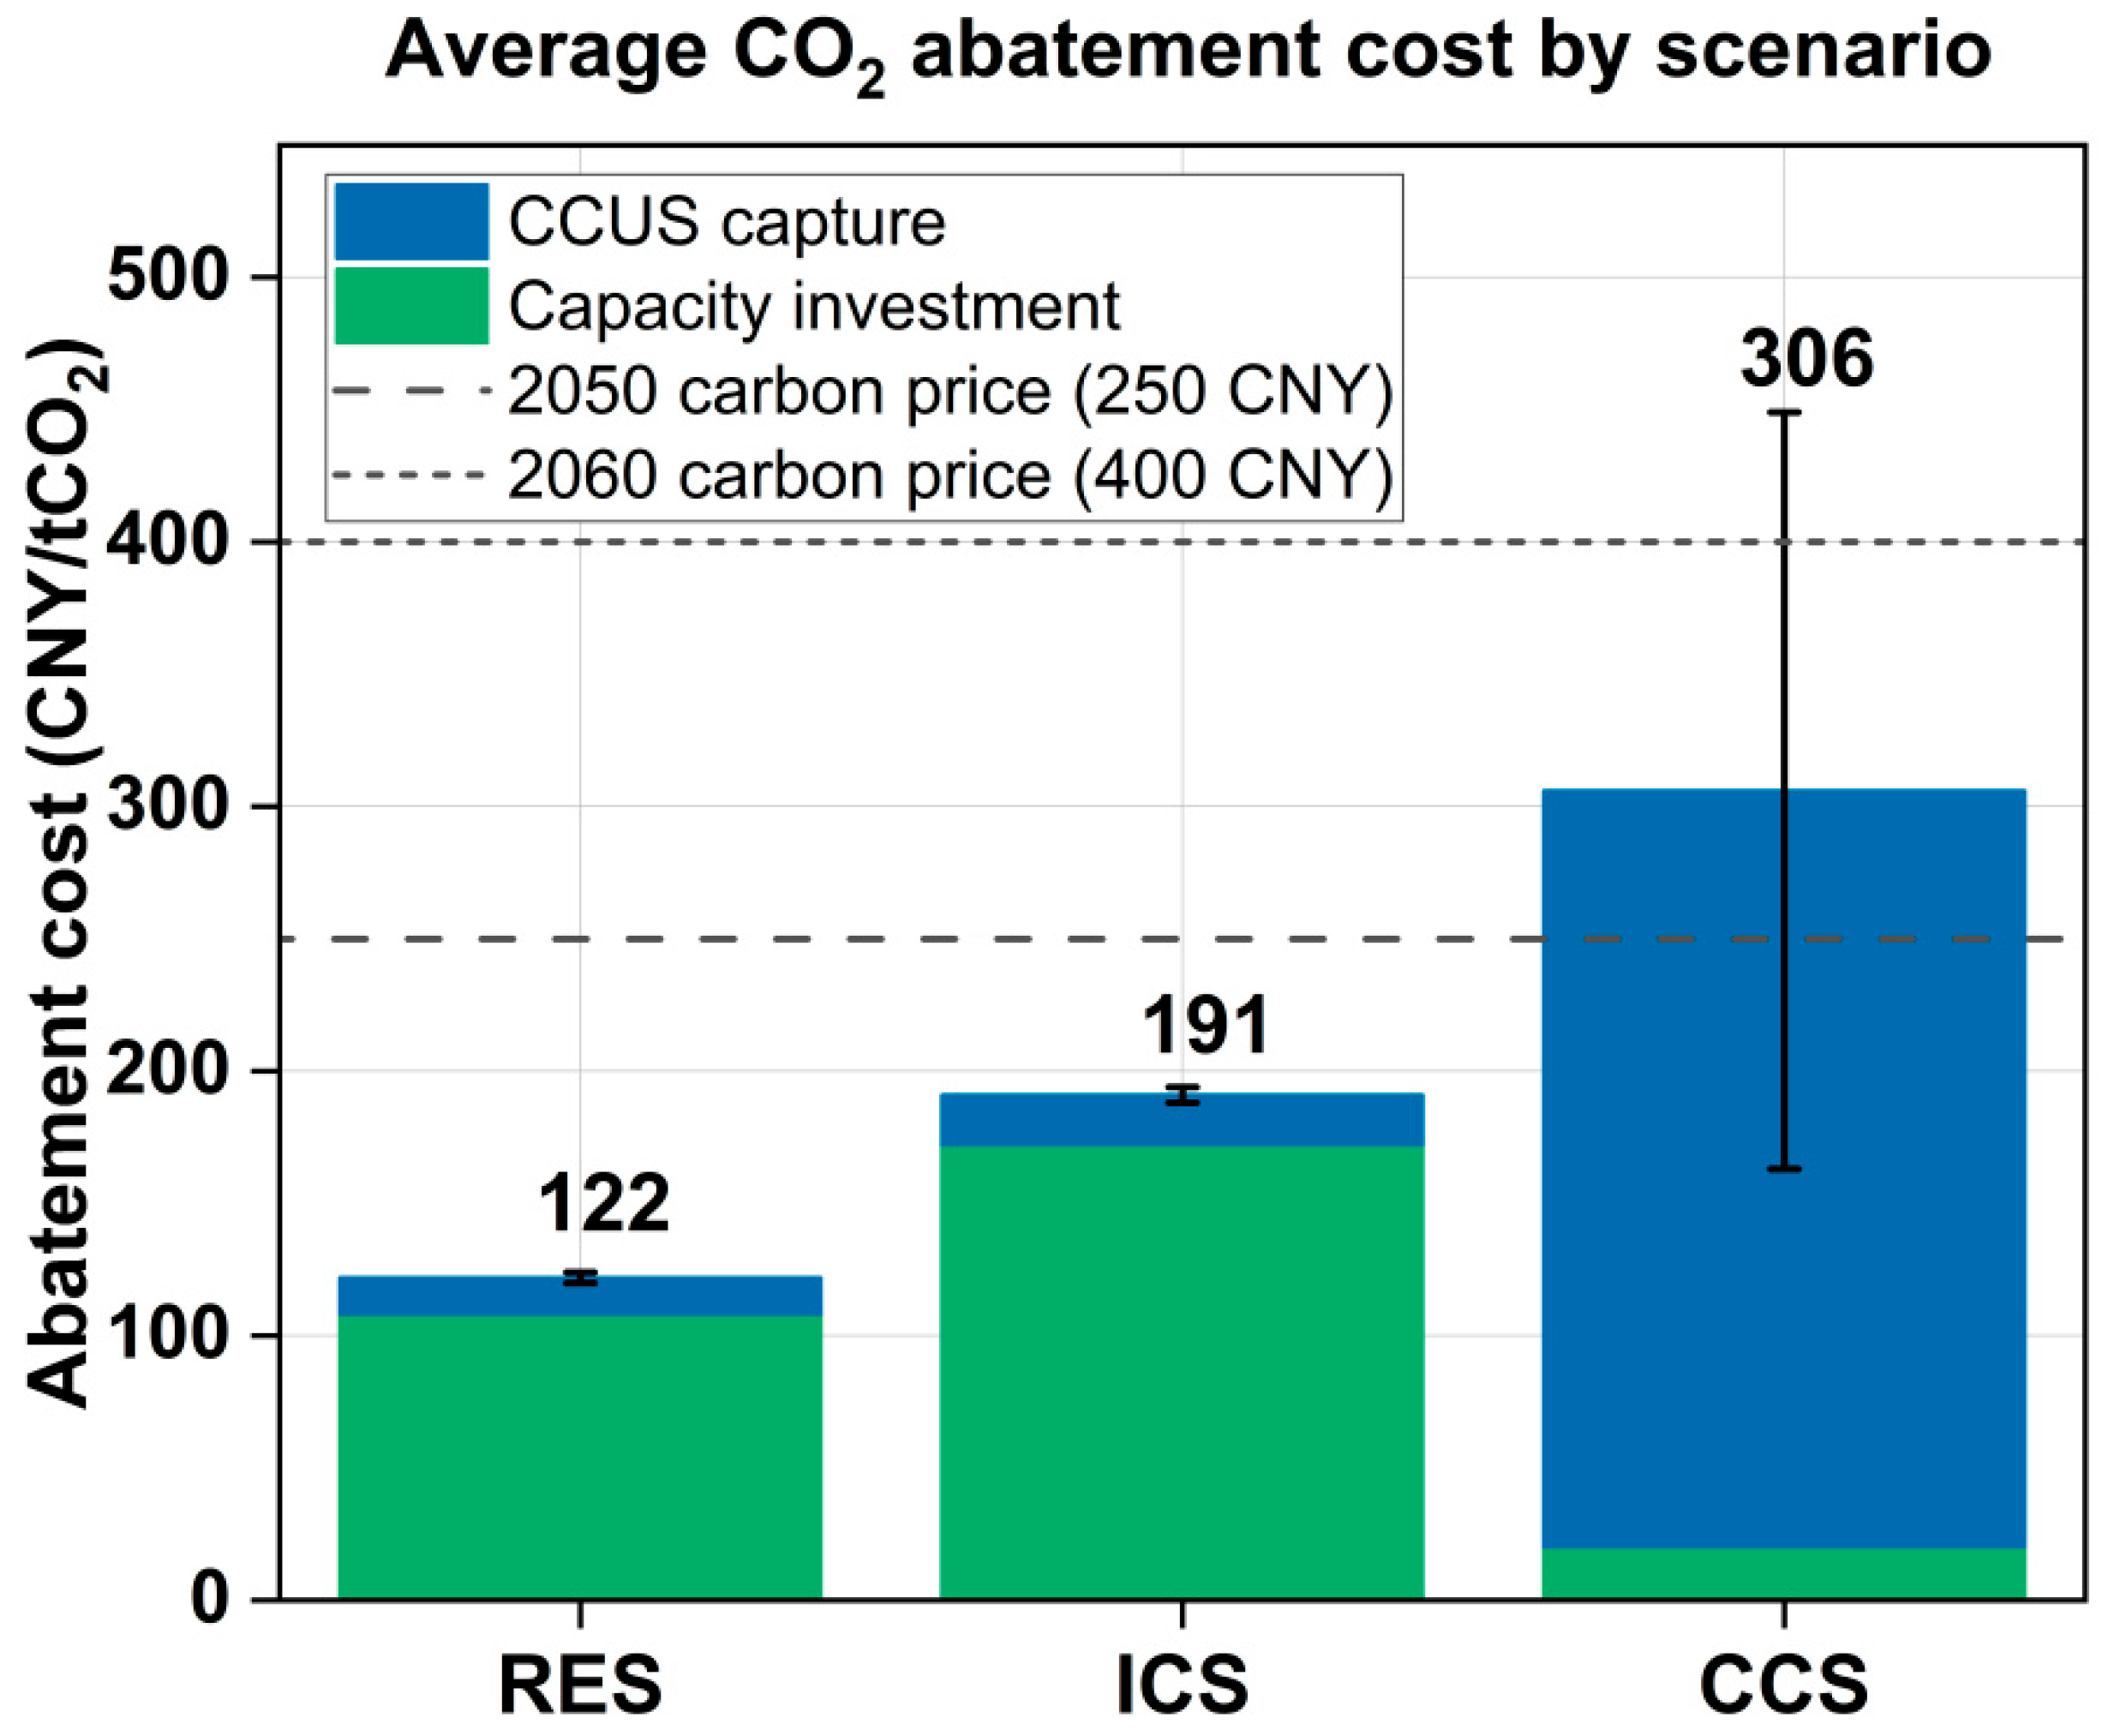
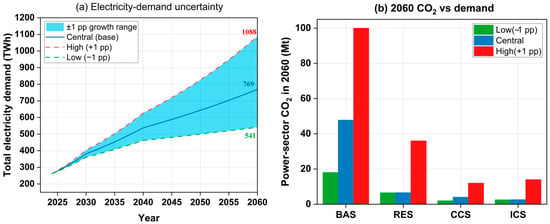
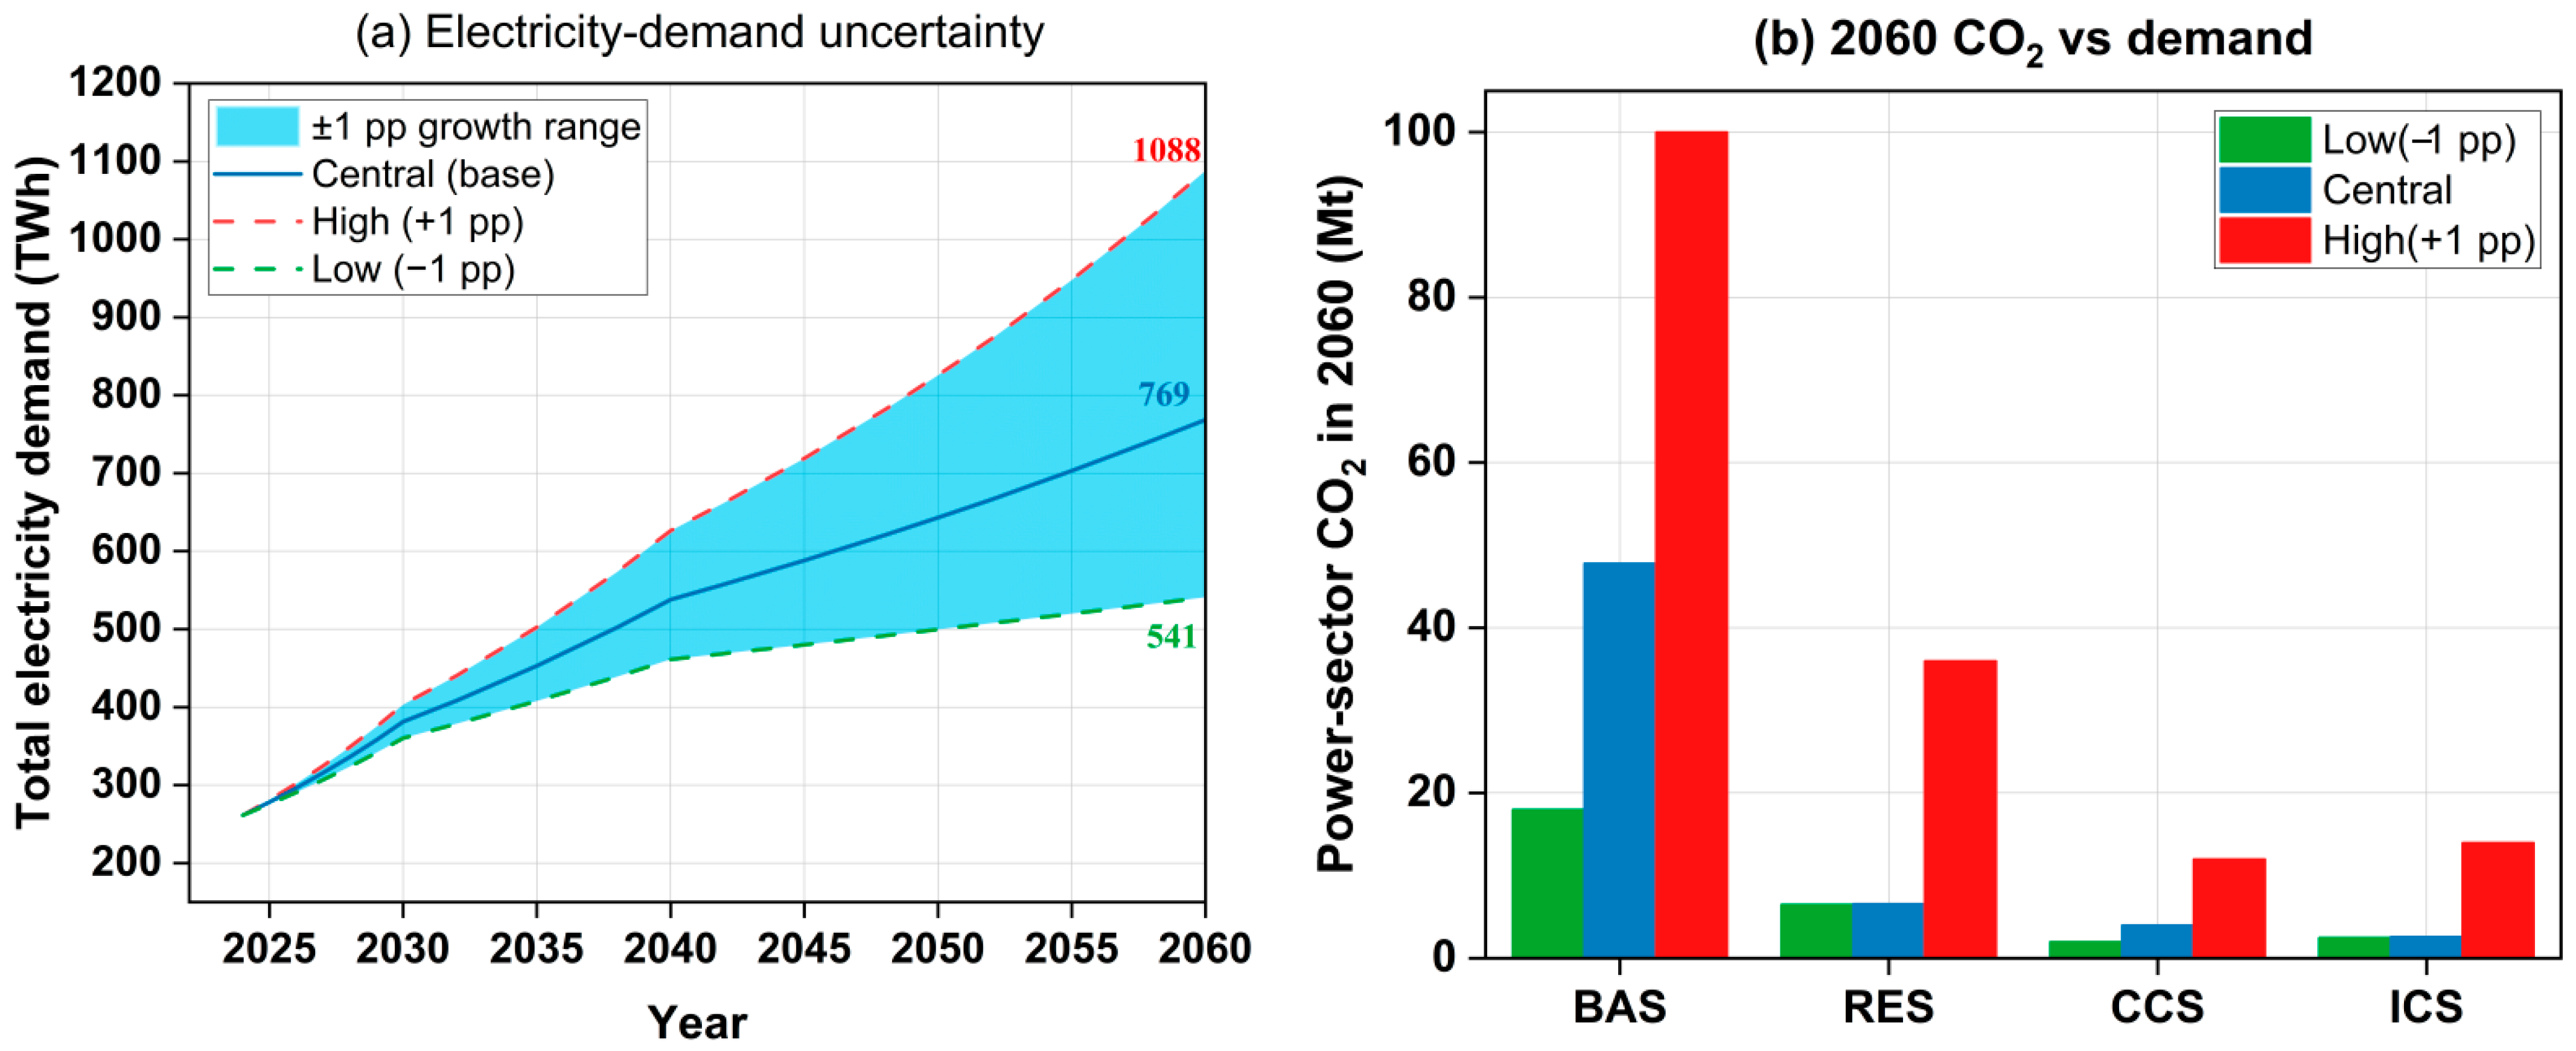
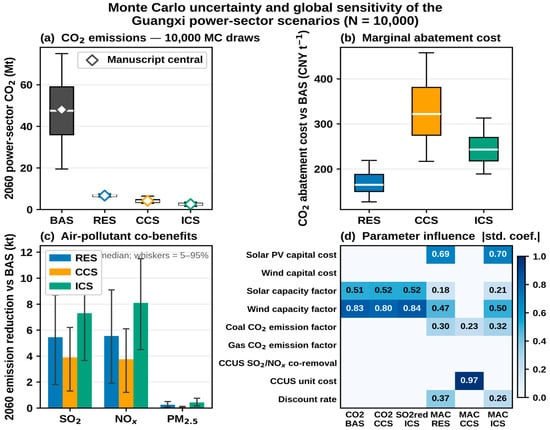
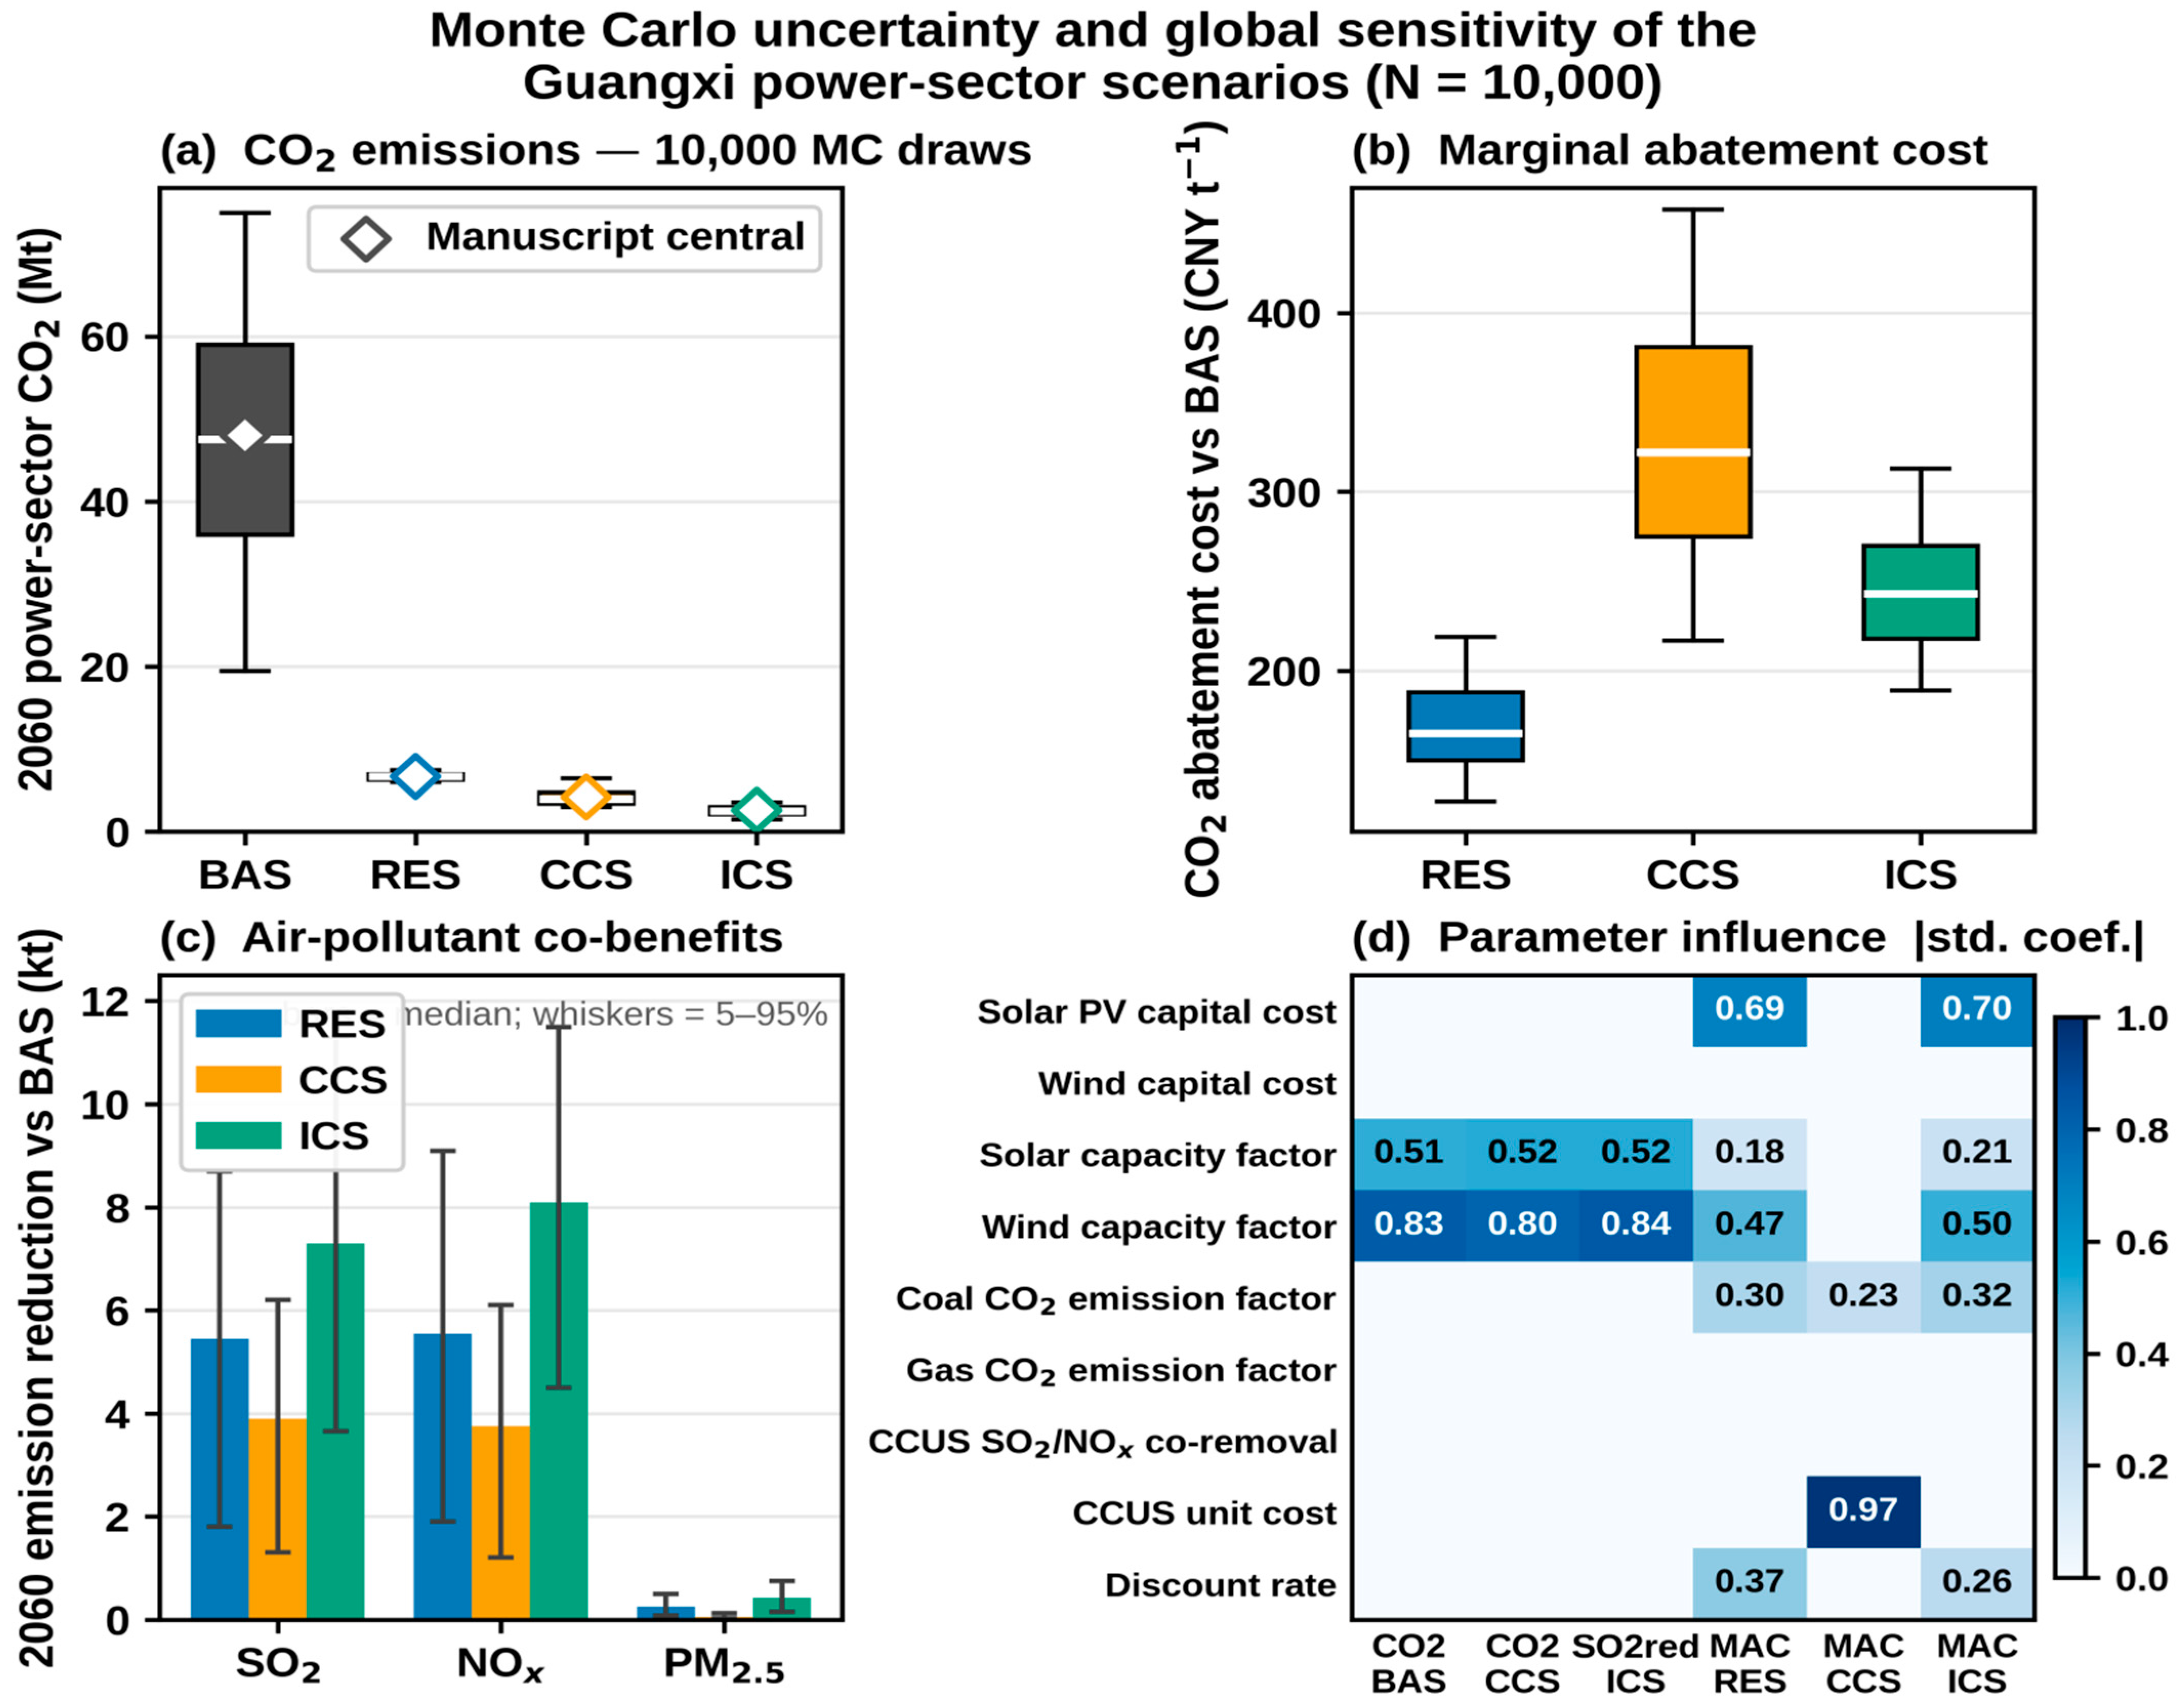

Disclaimer/Publisher’s Note: The statements, opinions and data contained in all publications are solely those of the individual author(s) and contributor(s) and not of MDPI and/or the editor(s). MDPI and/or the editor(s) disclaim responsibility for any injury to people or property resulting from any ideas, methods, instructions or products referred to in the content. |
© 2026 by the authors. Licensee MDPI, Basel, Switzerland. This article is an open access article distributed under the terms and conditions of the Creative Commons Attribution (CC BY) license.