


Abstract
Despite growing scholarly attention to electric vehicle adoption in Southeast Asia, no study has systematically compared battery electric vehicle (BEV) readiness across Thailand, Lao PDR, and Vietnam using a unified demand–supply framework. This paper develops and applies a seven-dimension BEV Country Readiness Assessment framework encompassing supply-side factors (parts and materials sourcing, manufacturing, and after-sales support), demand, and enabling environment (legal and regulatory, government support, and market development), with maturity scores (1–5) assigned across 16 sub-dimensions based on national statistics, industry reports, and primary field research conducted between August 2024 and March 2026. Thailand scores highest overall (3.43/5.0) as a regional production hub with balanced readiness; Vietnam follows (3.26/5.0) with the highest demand score driven by VinFast’s ecosystem; and Lao PDR scores lowest (1.95/5.0) yet exhibits a notably high EV/ICE registration ratio driven by fleet-led adoption in a very small absolute market. The findings reveal complementary rather than competitive roles within the regional BEV value chain, with energy security, supply chain dependency on China, and institutional capacity identified as critical determinants of long-term readiness.
1. Introduction
The transport sector remains among the most carbon-intensive segments of the global economy, accounting for approximately 16% of total greenhouse gas emissions and consuming 95% fossil fuels as its primary energy source [1]. In developing countries, this fossil fuel dependency creates a dual burden: environmental degradation through emissions and macroeconomic vulnerability through fuel import expenditure. Battery electric vehicles (BEVs) offer a potential pathway to address both challenges simultaneously, reducing tailpipe emissions to zero while substituting imported petroleum with domestically generated electricity. However, the readiness of developing countries to adopt BEVs at scale depends on a complex interplay of demand-side factors (purchasing power, consumer behavior, government incentives), supply-side factors (manufacturing capability, component sourcing, after-sales infrastructure), and enabling conditions (regulatory frameworks, energy security, market access). No existing framework systematically integrates these dimensions for comparative cross-country assessment in the Lancang-Mekong context.
The global electric vehicle market has entered a phase of exponential growth. According to the International Energy Agency (IEA), global electric vehicle (EV) sales surpassed 17 million units in 2024, representing approximately 20% of all passenger car sales worldwide [1]. This acceleration has been particularly pronounced in emerging markets, where government incentives, declining battery costs, and the entry of competitive Chinese manufacturers have compressed adoption timelines that took decades in Europe and North America.
Southeast Asia has emerged as a critical frontier in this transition. The Association of Southeast Asian Nations (ASEAN) automotive market—historically dominated by internal combustion engine (ICE) vehicles and anchored by Japanese original equipment manufacturers (OEMs)—is being reshaped by the simultaneous arrival of Chinese battery electric vehicle (BEV) brands, domestic manufacturing ambitions, and climate policy commitments. Among ASEAN economies, Thailand, Lao PDR, and Vietnam occupy distinctive positions within the Lancang-Mekong Cooperation framework, sharing geographic proximity, economic interconnectedness via the China–Laos Railway, and a common dependence on Chinese EV supply chains, yet exhibiting fundamentally different levels of industrial development, market structure, and policy maturity. The selection of these three countries is justified on three grounds: (1) they constitute the core riparian states of the Lancang-Mekong Cooperation framework with established institutional mechanisms for joint research; (2) they represent three distinct archetypes of BEV market development: a mature automotive manufacturing base (Thailand), a domestic OEM-led market (Vietnam), and a pure import market with unique energy endowments (Lao PDR); and (3) primary field data access was available through the Lancang-Mekong Cooperation Special Fund project, enabling direct stakeholder engagement not possible through desk research alone.
Prior research on EV adoption in this region has addressed individual countries or specific dimensions: barriers to adoption in Thailand [2,3], total cost of ownership in ASEAN [4], life cycle assessment of EVs and batteries [5], electric vehicle readiness from a policy perspective in Southeast Asia [6], and consumer purchase intentions in Vietnam [7]. Comparative analyses have examined Malaysia relative to ASEAN peers [8], EV adoption barriers in Cambodia, Myanmar, and the Philippines [9], and industrial policy dimensions involving Thailand and Indonesia [10]. Studies on Vietnam have explored consumer attitudes [11] and strategic roadmaps [12], while a recent study examined the economic viability of electric bus adoption in Thailand using Monte Carlo simulation [13]. Beyond the regional literature, important methodological and empirical foundations have been established in global EV adoption research. A cross-country analysis of EV adoption across 30 countries found that charging infrastructure and financial incentives were the strongest predictors of national EV market share, while broader socio-demographic variables such as income and education were not significant at the country level [14]. Charging infrastructure accessibility—measured through objective, perceived, and prospective dimensions—significantly and substantially influences individual EV adoption intention, highlighting the importance of both physical charger availability and consumer expectations about future infrastructure expansion [15]. A comprehensive fishbone diagram framework categorizing 57 EV adoption factors across four branches—economic and market, technical, policy, and social—and quantitatively correlated these factors with adoption indicators, establishing that financial incentives, charging infrastructure, supportive regulations, driving range improvements, and ecological concern all exhibit strong positive correlations with EV uptake [16]. The integration of the Theory of Consumption Values with the Theory of Planned Behavior has been applied to examine how functional, symbolic, emotional, novelty, and conditional values shape consumer attitudes and EV purchase intentions in Malaysia, finding that attitude and emotional value were the strongest direct predictors while infrastructure readiness did not moderate the attitude–intention relationship [17]. The Japanese Technology Readiness Assessment (J-TRA) has been applied to evaluate EV readiness in Indonesia from a multistakeholder perspective, identifying commercialization, safety, and infrastructure integration as the primary bottlenecks despite high technology development readiness [18]. A panel ARDL model across 20 EU countries has been employed to distinguish short-run and long-run determinants of BEV penetration, demonstrating that the ICE–BEV price gap and diesel prices are the most significant short-run factors, while GDP per capita and CO2 emissions exhibit strong long-run elasticities, suggesting that BEV adoption is a multifaceted process driven by both immediate cost signals and structural economic conditions [19]. However, no study has applied a comprehensive demand–supply readiness framework simultaneously across Thailand, Lao PDR, and Vietnam using current data. Scenario-based modeling approaches, such as the LEAP framework applied to Pakistan’s EV market, have demonstrated the potential for energy savings and emission reductions under varying EV penetration scenarios, but such models assess futures rather than current readiness across multiple dimensions [1].
This paper addresses this gap by developing and applying the BEV Country Readiness Assessment framework, a structured evaluation tool that assesses national preparedness across seven dimensions: (S1) Parts and Materials Sourcing, (S2) Manufacturing, (D3) Demand, (S4) After-Sales Support, (E5) Legal and Regulatory Framework, (E6) Government Support Mechanisms, and (E7) Market Development Support. The framework evaluates BEVs across the three target countries. Each dimension employs a five-level maturity scale supported by both quantitative indicators (registration data, GDP per capita, and energy costs) and qualitative evidence (policy documents, field interviews with industry stakeholders, and perception assessments).
This study makes three distinct scientific contributions. First, it develops a novel seven-dimensional, sixteen-sub-dimension BEV Country Readiness Assessment framework that uniquely integrates demand-side and supply-side factors within a three-layer structure (supply–demand-enabling environment), extending beyond single-dimension approaches such as PEST analysis [6], consumer survey models [7,17], or scenario-based energy modeling [20]. Second, it introduces a dual-evidence scoring methodology that systematically combines quantitative indicators with qualitative field assessments from 32+ organizations across four countries, validated through cross-source triangulation and sensitivity analysis. Third, it provides among the first empirical demand–supply comparison across the Lancang-Mekong subregion, revealing complementary rather than competitive national roles in the emerging regional BEV value chain—a finding with direct implications for regional cooperation policy.
The paper is organized as follows. Section 2 describes the assessment methodology, including the three-layer framework structure and data sources. Section 3 presents the results, beginning with demand-side analysis across the three countries, examining GDP and purchasing power, population and market size, BEV registration trends, consumer perceptions and behavior and government incentive, followed by supply-side dimensions: logistical connectivity with China and EV supply chain context, sourcing and manufacturing capability, after-sales infrastructure, regulatory frameworks, government implementation support, and market development conditions including energy security. Section 4 synthesizes the findings through a comparative readiness radar chart, a demand–supply positioning grid, and discusses complementary roles within the regional value chain. Section 5 concludes with policy implications and research directions.
2. Materials and Methods
2.1. Framework Design
The BEV Country Readiness Assessment framework was developed to evaluate national preparedness for BEV adoption and industry development. The framework comprises seven dimensions and sixteen sub-dimensions, each scored on a five-level maturity scale from Level 1 (no capability/infrastructure) to Level 5 (world-class/optimized). Scores are assigned based on a dual-evidence approach: data/evidence-based scores drawing on quantitative indicators from official statistics, industry databases, and published research, complemented by perception-based scores derived from stakeholder interviews and field assessments conducted during research visits to Thailand, Lao PDR, China, and Vietnam. The final score for each sub-dimension represents the consensus between these two evidence streams.
The seven dimensions are conceptually grouped into three layers, as illustrated in Figure 1. The supply side encompasses upstream sourcing (S1: Parts and Materials Sourcing), midstream production (S2: Manufacturing), and downstream service delivery (S4: After-Sales Support), reflecting the value chain sequence from raw materials to end-user support. The demand side (D3: Demand) captures market pull through registration evidence and EV/ICE adoption ratios, contextualized by macroeconomic factors including GDP per capita, population structure, consumer behavior, government incentives, and logistical connectivity with China. The enabling environment layer (E5: Legal and Regulatory Framework, E6: Government Support Mechanisms, E7: Market Development Support) represents cross-cutting institutional conditions that influence both supply and demand readiness. This three-layer structure allows the framework to distinguish between countries that are strong in production but weak in demand (supply-led), strong in demand but lacking production capacity (demand-led), or constrained by institutional gaps despite favorable supply or demand conditions.
Figure 1.
BEV Country Readiness Assessment framework structure. The seven dimensions are organized across three layers. Each sub-dimension is scored on a 1–5 maturity scale.
The seven dimensions were derived through a two-stage process. First, factors identified in prior EV adoption studies, including financial incentives and charging infrastructure [14], consumption values and attitudes [17], technology readiness and stakeholder perceptions [18], price gaps and macroeconomic conditions [19], and policy-infrastructure-market interactions [1], were systematically mapped onto a supply chain value-chain framework spanning sourcing through end-user adoption. Second, the resulting dimension structure was validated through stakeholder consultations during field research in Lao PDR, Vietnam, and China. Commonly cited EV adoption factors, such as charging infrastructure, are covered within S4 (After-Sales Support, sub-dimension 4.1 Service Network), while grid capacity is addressed within E7 (Market Development Support, sub-dimension 7.2 Energy Coverage). Dimensions are equally weighted in aggregation. Equal weighting was chosen because, in the absence of empirical evidence establishing differential importance across dimensions in the Lancang-Mekong context, it avoids introducing researcher bias. The primary analytical value lies in dimension-level comparisons rather than single aggregate scores. Stakeholder-derived weights via Analytic Hierarchy Process (AHP) are recommended for future refinement. It should be acknowledged that equal weighting may introduce systematic bias: supply-side dimensions (S1, S2) show relatively low variance across countries (all three depend on Chinese imports), while demand-side dimensions (D3) show high variance (range: 2.5–5.0). Equal weighting may therefore understate the practical importance of demand-side differences. The impact of alternative weighting schemes on country scores is examined through sensitivity analysis in Section 4.1.
The framework’s design draws on and extends several established assessment traditions. The multi-parameter, multi-level maturity scoring approach is conceptually informed by the Japanese Technology Readiness Assessment (J-TRA) methodology, which evaluates technology readiness across seven parameters—market, development, integration, verification, safety, commercialization, and cost—and has been applied to assess EV readiness in Indonesia through multistakeholder perception analysis [18]. The present framework adapts this parametric readiness logic to a country-level BEV assessment by expanding the evaluation beyond technology maturity to encompass supply chain capabilities, demand conditions, and enabling institutional environments. The framework also incorporates insights from the European Union’s Smart Readiness Indicator (SRI), which assesses building energy systems across multiple main categories and uses tiered scoring to identify dimensional gaps between current practice and policy targets [21]. The SRI’s approach of revealing misalignment between market-driven improvements and policy-desired outcomes across assessment dimensions parallels the present framework’s ability to identify imbalances between supply-side capabilities and demand-side pull across Thailand, Lao PDR, and Vietnam. Furthermore, the selection and grouping of assessment dimensions is grounded in the empirical EV adoption literature. EV-specific factors—charging infrastructure, financial incentives, and local manufacturing presence—have been shown to be stronger predictors of national adoption rates than broader socio-demographic variables [14], supporting the decision to evaluate infrastructure, manufacturing capability, and government support as distinct dimensions. A total of 57 adoption factors organized across economic and market, technical, policy, and social branches have been identified in the literature [16], reinforcing the multidimensional structure of the present framework. The distinction between short-run market signals (price gaps, fuel price volatility) and long-run structural determinants (income levels, carbon emissions, infrastructure development) of BEV adoption has also been established [20]—a temporal distinction that the five-level maturity scale captures by differentiating between countries exhibiting emerging versus established readiness across each dimension.
Each sub-dimension is scored using a structured protocol. Quantitative indicators are scored first using predefined thresholds: for example, sub-dimension D3.1 (Evidence of Demand) assigns Level 1 for no observable BEV market activity, Level 2 for scattered media interest with fewer than 500 annual registrations, Level 3 for growing fleet adoption with 500–5000 registrations, Level 4 for an established market with more than 5000 registrations and year-on-year growth exceeding 20%, and Level 5 for a mature market where a BEV brand ranks among the top three sellers nationally. Perception-based scores [P] are then assigned independently based on field interview data using the same 1–5 scale. Where the data-based and perception-based scores diverge by more than one point, the evidence is re-examined and the lower score is adopted as a conservative default. This consensus-based approach with a conservative bias was designed to mitigate the subjectivity inherent in maturity assessments. A complete scoring rubric defining Level 1–5 criteria for all 16 sub-dimensions, together with the data-based score, perception-based score, and final assigned score for each country, is provided in Table S1 (Supplementary Materials).
2.2. Data Sources and Temporal Scope
Data were collected from multiple sources current through March 2026. Secondary sources included national statistical offices (Thailand Office of the National Economic and Social Development Council (NESDC), General Statistics Office of Vietnam (Vietnam GSO), Lao Statistics Bureau), international organizations (IMF, World Bank, IEA, OECD), industry associations (Federation of Thai Industries, Vietnam Automobile Manufacturers’ Association), commercial databases (MarkLines, Focus2Move, Statista), investment promotion agencies (The Board of Investment of Thailand (Thailand BOI), Vietnam Ministry of Planning and Investment (MPI)), and published research. Energy data were sourced from national energy planning offices (Energy Policy and Planning Office (EPPO) Thailand, Électricité du Laos (EDL), Vietnam Electricity (EVN)) and validated against Ember Energy and Low Carbon Power databases.
Data reliability was ensured through systematic triangulation. Each key statistic was cross-verified against at least two independent sources; for example, Thailand’s EV registration data were validated across the Federation of Thai Industries, MarkLines, and BOI databases. Temporal consistency was maintained by ensuring all cross-country comparisons used the same reference year (2024 for economic data, 2024–2025 for market data). Specific reliability concerns were documented: Lao PDR lacks consolidated national EV statistics (confirmed during meetings at the National University of Laos), requiring estimation from fleet operator data (LOCA, KOKKOK Move) and import records. Vietnam’s BEV data is dominated by VinFast’s self-reported figures, which were cross-checked against VAMA aggregate statistics. The dual-evidence scoring approach ([D/E] + [P]) further mitigates single-source bias by requiring convergence between independent data streams. The data span multiple reference periods (economic data: 2024; market/registration data: 2024–2025; policy data: current as of March 2026). Where significant structural breaks occurred during the study period—notably Thailand’s transition from EV 3.0 to EV 3.5 subsidies (reducing per-vehicle support from THB 150,000 to THB 100,000) and Vietnam’s extension of registration fee exemptions (Decree 51/2025)—the most recent policy parameters were used for scoring, and the impact of the policy change is discussed in the relevant results section.
Primary data were collected through structured field research conducted between August 2024 and March 2026 across four countries. In Thailand, the research team conducted meetings, interviews, and site visits with government agencies, industry associations, the Federation of Thai Industries, EV assembly plants (passenger car, pickup truck, tractor, and motorcycle), EV repair and conversion garages, a shared electric mobility solution provider, a battery technology and EV platform company, and university research centers. In Lao PDR (August 2024 and May 2025), meetings were held with a national logistics park operator, EDL, the Ministry of Energy and Mines, the national university, a Korean–Lao joint venture ride-hailing platform operator, a domestic EV fleet and charging operator, a regional public university in northern Lao PDR, and private-sector EV conversion workshops. In China (September 2024 and August 2025), the team visited the Royal Thai Consulate-General in Guangzhou, a leading research university, several EV manufacturers in Shenzhen and Guangzhou, EV assembly plants, and battery production facilities. In Vietnam (November 2024 and December 2025), meetings were held with the Office of Commercial Affairs at the Royal Thai Embassy in Hanoi, the Vietnam Automobile Manufacturers’ Association (VAMA), commercial banks, an industrial estate operator, agricultural technology research institutes, an autonomous vehicle start-up, and site visits to a leading domestic EV manufacturer’s showroom and public EV charging stations. These field visits provided first-hand stakeholder perspectives that informed the perception-based scores in the readiness assessment. Across all field visits, a total of 47 semi-structured interviews were conducted using purposive expert sampling, selecting informants based on their institutional role and direct professional involvement in BEV-related policy, operations, or research, with stakeholders from five categories: government agencies and utilities (n = 12), universities and research institutes (n = 10), private-sector EV operators and fleet managers (n = 11), automotive manufacturers and dealers (n = 8), and financial institutions and development organizations (n = 6). Each interview followed a standardized discussion guide aligned with the seven framework dimensions, and stakeholders were asked to assess readiness on a 1–5 scale for dimensions within their expertise. Scores were assigned by two members of the research team independently, with disagreements resolved through discussion and adoption of the lower (conservative) score.
2.3. Validation, Robustness, and Limitations
The framework’s robustness was assessed through sensitivity analysis and external validity checks. Sensitivity analysis tested the stability of country rankings under six scenarios: (1) demand-weighted (D3 weight doubled); (2) supply-weighted (S1, S2, S4 weights doubled); (3) enabling-weighted (E5, E6, E7 weights doubled); (4) expert-judgment weighting (demand 40%, supply 35%, enabling 25%); (5) maximum score perturbation (−1 point on each country’s highest dimension); and (6) baseline equal weighting as reference. These ordinal scores should be interpreted as relative positioning indicators rather than precise measurements.
The quantitative results of the sensitivity analysis, including scores under all six scenarios, are presented in Section 4.1 following the presentation of the baseline assessment results.
External validity was assessed by comparing framework scores against actual BEV adoption outcomes. Vietnam’s D3 score of 5.0 corresponds to its achievement of 26.3% BEV market share—the highest in ASEAN. Thailand’s balanced profile across all dimensions corresponds to its unique position as both a domestic market and an export-oriented production hub. Lao PDR’s low overall score but relatively high E7 (Market Development, 2.67) corresponds to its fleet-led adoption pattern driven by operating cost advantages from hydropower-based electricity. Formal inter-rater reliability testing was not conducted; developing such protocols and tracking scores longitudinally against adoption outcomes are priorities for future research. To partially address this limitation, we report that across the 48 scoring decisions (16 sub-dimensions × 3 countries), the two independent raters agreed within ±1 point on 42 of 48 cases (87.5%). The six cases of larger disagreement (≥2 points) all involved perception-based assessments in Lao PDR, where data scarcity increased subjectivity. In all six cases, the conservative (lower) score was adopted per the scoring protocol. While this does not constitute formal inter-rater reliability testing (e.g., weighted kappa or ICC), it provides evidence of reasonable consistency. Formal reliability protocols with independent external raters are recommended for future applications of the framework.
Despite these validation results, this study has several limitations that should be acknowledged. First, BEV registration data are not consistently reported across the three countries, requiring triangulation from multiple industry sources. Second, while the study incorporates primary field research, the perception-based scores complement rather than replace systematic stakeholder surveys. Third, the five-level maturity scale, while enabling cross-country comparison, necessarily compresses complex realities. Fourth, the rapidly evolving policy landscape means that specific incentive levels may change between manuscript submission and publication.
3. Results
3.1. Demand-Side Analysis
3.1.1. Macroeconomic Context: GDP, Purchasing Power, and Population
The three countries exhibit stark differences in economic scale and purchasing power that fundamentally shape BEV demand potential. Thailand, with a GDP of USD 526.4 billion and per capita income of approximately USD 7347 (2024), represents ASEAN’s second-largest economy and ninth in Asia [22]. Vietnam’s GDP reached USD 476.4 billion with growth of 7.09% in 2024—the fastest in the subregion—and per capita income of approximately USD 4717 [23]. Lao PDR, at USD 16.3 billion and approximately USD 2070 per capita, remains the smallest economy, further constrained by a debt-to-GDP ratio exceeding 100% and cumulative currency depreciation of approximately 140% between 2021 and 2024 [24].
Population structures create distinct demand ceilings. Vietnam’s 98.9 million inhabitants represent the largest potential market, with automobile ownership at only 5.7%—projected to reach 30% by 2030—implying a fivefold expansion opportunity [25]. Thailand’s 66 million population faces demographic headwinds (total fertility rate of 1.0) and elevated household debt at 88.4% of GDP, which constrains credit-dependent vehicle purchases [22]. Lao PDR’s 7.9 million population limits absolute market volume regardless of penetration rates.
These macroeconomic conditions produce fundamentally different demand profiles. In Thailand, demand is shaped by a mature automotive market undergoing structural contraction (total vehicle sales declined 26.2% to 572,675 units and total production fell 19.9% to 1,468,997 units in 2024), where BEV growth occurs against a shrinking ICE base [26,27]. In Vietnam, demand emerges within a rapidly motorizing economy where BEVs compete with first-time vehicle purchases rather than ICE replacements. In Lao PDR, demand is driven primarily by fleet operators for whom BEV economics are compelling despite low consumer purchasing power.
Table 1 presents a comparative overview of BEV and ICE vehicle prices alongside energy costs across the three countries. The data reveal that BEVs have reached or undercut ICE price parity in Thailand, where the BYD Dolphin Standard Range (THB 449,900, approximately USD 13,200) is now priced below the Thai-assembled Toyota Yaris (from THB 559,000, approximately USD 16,400). In Vietnam, the VinFast VF3 starts at approximately USD 9400 without battery (USD 12,700 with battery), well below the imported Toyota Yaris at approximately USD 18,000. In Lao PDR, the Giri Mini at USD 6000–9000 represents the most affordable BEV in the region, though as a micro-EV it is not directly comparable to the Toyota Yaris sedan used as the ICE benchmark. The energy cost differential is particularly striking in Lao PDR, where the petrol-to-electricity price ratio of 25–36× creates the strongest operating cost incentive for BEV adoption in the region, with BEV energy costs per 100 km approximately 91% lower than ICE fuel costs. It should be noted that the entry-level BEV for Lao PDR (LOCA Giri Mini) is a micro-EV, not directly comparable in size, range, or safety features to the sedan-class ICE vehicles listed. The BEV/ICE price ratio of 0.40× for Lao PDR therefore reflects the affordability of the cheapest available BEV rather than same-segment price parity. When comparing within the sedan segment, no domestically available BEV in Lao PDR currently matches imported ICE sedans on price, reinforcing the fleet-led micro-EV adoption pattern observed in the country.
Table 1.
Vehicle price and energy cost comparison across Thailand, Lao PDR, and Vietnam (March 2026).
3.1.2. BEV Registration Trends and EV/ICE Ratios
In this study, BEV market share refers to the share of new battery electric passenger car registrations as a percentage of total new passenger car registrations in each country, unless otherwise stated. Electric motorcycles, micro-EVs (e.g., LOCA Giri Mini), and electric buses are discussed separately and are not included in the headline market share figures. This distinction is important because Lao PDR’s fleet includes a significant proportion of electric motorcycles and micro-EVs that would inflate the BEV share if combined with passenger car data.
The EV/ICE ratio and growth sub-dimension captures the comparative trajectory of BEV adoption. Thailand demonstrates strong growth, rising from near-zero to 17.7% market share within four years. Vietnam exhibits the most rapid trajectory in the study, driven by 26.3% BEV share and the fastest growth rate in ASEAN. Lao PDR shows a notably high ratio, with approximately 25–38% of new car registrations being electric, though this elevated proportion reflects the very small absolute market size. Thailand’s BEV registrations grew from approximately 1943 units in 2021 to 75,715 in 2023 (a CAGR of 524%) before settling at approximately 67,000 in 2024 as subsidy reductions under the EV 3.5 policy and tighter credit conditions moderated growth [28]. Nevertheless, the first seven months of 2025 saw 66,000+ BEV registrations (17.7% market share), nearly matching the full-year 2024 total, suggesting underlying demand resilience [29]. The share of all electrified vehicles (HEV, PHEV, BEV combined) reached 20% in 2024, indicating a structural shift in consumer preferences that continues independent of subsidy levels. Notably, the overall Thai automotive market began showing signs of recovery by late 2025, with October 2025 marking the seventh consecutive month of year-on-year sales growth (+24.8%), and full-year 2025 domestic sales projected at approximately 600,000 units [27].
Vietnam presents the most striking trajectory. VinFast delivered 87,000+ vehicles domestically in 2024 (97,399 globally), growing 192% year-on-year [30]. In 2025, domestic deliveries reached 175,099 units, capturing 34.4% of total vehicle sales and making VinFast the best-selling automotive brand in Vietnam for the third consecutive year [31]. BloombergNEF identified Vietnam as the world’s second-fastest-growing EV market behind Brazil. The electric two-wheeler segment reinforces this momentum, with e-motorcycle share reaching approximately 21.7% in 2025 and VinFast e-bike sales surging 532% [32].
Lao PDR’s smaller scale masks rapid growth. EV registrations (including electric motorcycles) increased from 3201 in 2022 to 4631 in 2023 (+45%) and approximately 8300 in 2024 (+80.1%) [33]. Of the 2023 total, 2592 were electric cars against a total new car market of approximately 11,200 registrations; the EV car share reached approximately 23%, though this elevated percentage reflects the very small absolute market size. Notably, electric motorcycles constitute 44% of EV sales, reflecting price sensitivity at low-income levels. BYD grew 85.6% in 2024 to become the leading EV brand, displacing Hyundai, while ZEEKR (Geely) entered through a domestic EV mobility platform, signaling Chinese manufacturers’ expanding interest in even small markets [34].
Figure 2 illustrates the BEV market share trajectories from 2021 to 2025, revealing divergent growth patterns. Thailand exhibited the earliest acceleration driven by the EV 3.0 subsidy launch in 2022, but growth has plateaued at 13–18% as subsidies were reduced. Vietnam’s trajectory is the steepest, crossing Thailand’s share in 2024 and reaching 26.3% by 2025—the highest in ASEAN—propelled by VinFast’s ecosystem expansion and the approaching ICE ban in Hanoi. When measured on a consistent car-sales-only basis, Lao PDR’s BEV share of new car registrations reached approximately 25% in 2023 and an estimated 38% in 2024—figures that, while proportionally striking, reflect the very small absolute size of the market (approximately 2592 EV cars out of only 11,200 total new car registrations in 2023). This denominator effect means that even modest EV volumes produce proportionally high market shares; by contrast, Thailand’s 11% in 2023 represents approximately 75,700 BEV units.
Figure 2.
BEV market share trends in Thailand, Vietnam, and Lao PDR (2021–2025). Note: All series use BEV share of new car/passenger vehicle registrations (excluding motorcycles). Thailand 2025 value represents H1 2025; Vietnam represents the full year 2025; Lao PDR 2025 data not yet available.
3.1.3. Consumer Perceptions and Behavior
The evidence of demand sub-dimension evaluates quantifiable indicators of market interest and actual BEV uptake. Thailand exhibits strong demand evidence, with substantial registration volumes (75,700 BEVs in 2023), widespread media coverage, and growing fleet adoption. Vietnam demonstrates the strongest demand evidence in the study, reflecting VinFast’s position as the best-selling automotive brand with 175,099 deliveries in 2025 and extensive ecosystem development. Lao PDR shows limited but emerging demand evidence, concentrated among fleet operators rather than individual consumers, with limited media visibility and low general consumer awareness of BEV options. Consumer behavior in the three markets reflects distinct adoption patterns shaped by income levels, urbanization, and cultural factors. In Thailand, BEV adoption concentrates among middle-to-upper-income urban consumers, with home charging as the primary mode. Commercial fleets represent the fastest-growing segment, drawn by energy cost savings of 59–67% (BEV operating costs of 0.72–0.95 THB/km versus 1.82–2.72 THB/km for ICE) [35]. Thai consumers exhibit a “try-before-buy” pattern, often experiencing BEVs through ride-hailing services before personal purchase. Range anxiety has diminished continuously but remains relevant for intercity travel due to insufficient highway charging infrastructure. The top three consumer concerns about EVs in Thailand have been identified as public infrastructure, charge range, and battery life [2]. Using the DEMATEL method to analyze relationships among 14 identified barriers, long charging duration, limited driving range, and insufficient charging stations have been confirmed as the most critical barriers [3].
In Vietnam, a distinctive national brand pride surrounding VinFast creates demand dynamics not observed in the other two countries. VinFast’s ecosystem, comprising 150,000+ charging points, EV taxi services, and battery leasing programs, generates ecosystem lock-in effects where switching costs for existing users are substantial. Notably, field interviews with VAMA confirmed that VinFast’s charging network is exclusive to VinFast vehicles, meaning drivers of other BEV brands cannot access these stations, which is a significant competitive barrier for new market entrants. The company’s taxi service acts as a demand seeding mechanism: consumers first experience BEVs as passengers before purchasing their own. The operating cost advantage is particularly stark at 73% lower than ICE vehicles (USD 2.35 versus USD 8.71 per 100 km), making BEVs economically compelling for high-utilization users such as ride-hailing and delivery operators [36]. Use value has been found to currently outweigh sign value in Vietnamese consumers’ EV adoption decisions, with economic drivers predominating over environmental concerns [11].
Lao PDR’s demand profile is fundamentally different. Individual consumer demand is severely constrained by purchasing power, making fleet-led adoption the primary growth pathway. Field research confirmed the central role of two platform operators. A Korean–Lao joint venture ride-hailing platform reported over 160,000 registered users and more than 340,000 completed trips within six months of operation by mid-2025, projecting expansion to 2000 vehicles, including approximately 1700 electric tuk-tuks. The platform employs a bid-based fare system, enhancing affordability, and operates as a multi-service “mobility super app.” A domestic EV fleet and charging operator manages a fleet of locally branded micro-EVs with retail prices of USD 6000–9000, along with 27 charging stations with plans for nationwide expansion. A Vietnamese EV taxi operator introduced 150 electric taxis in late 2023, entering direct competition in the ride-hailing market by May 2025. The primary demand driver is not environmental consciousness but economic necessity: fuel imports consume approximately 45% of external public debt, and the kip’s depreciation makes dollar-denominated oil imports increasingly unaffordable [37]. Under these conditions, every BEV replacing an ICE vehicle reduces not only individual operating costs but also macroeconomic foreign exchange leakage.
These differentiated consumer profiles across Thailand, Lao PDR, and Vietnam reflect patterns identified in the broader EV adoption literature. Emotional value and consumer attitudes have been identified as the strongest direct predictors of EV purchase intention in an emerging ASEAN market, with functional value operating primarily through attitudinal mediation rather than directly influencing intention [17]—a finding that resonates with Vietnam’s national brand pride around VinFast, where emotional attachment and ecosystem loyalty drive adoption beyond purely economic calculation. In contrast, the predominantly economic rationale driving BEV adoption in Lao PDR aligns with evidence that short-run price signals, particularly the ICE–BEV price gap and fuel price differentials, are the most immediately influential determinants of BEV penetration [20]. The experiential adoption pathway observed in Thailand, where consumers first encounter BEVs through ride-hailing before personal purchase, mirrors evidence that prior EV experience as a driver or passenger is a highly significant predictor of adoption intention among non-EV owners [15]. The cross-country consumer evidence also corroborates the broader finding that EV adoption factors are interdependent rather than isolated [16]: in all three countries, the interaction between operating cost advantages, charging infrastructure availability, and consumer confidence produces adoption dynamics that cannot be explained by any single factor alone.
3.1.4. Government Support and Incentive Structures
The government support dimension evaluates both financial incentives and implementation effectiveness. Thailand has the most comprehensive support framework, reflecting well-established subsidies, tax restructuring, and effective BOI-led implementation. Vietnam offers aggressive demand-side incentives, but with developing implementation capacity. Lao PDR has the most limited government support, with no direct consumer subsidies and constrained fiscal capacity, though international development partners partially compensate for domestic resource limitations. Government support mechanisms vary substantially in scope and sophistication. Thailand’s EV 3.5 policy (2024–2027) provides direct consumer subsidies (THB 100,000 per vehicle in 2024, declining to THB 50,000 by 2027), maintains a reduced 2% excise tax for BEVs, and offers import duty reductions of up to 40% for CBU units priced below THB 2 million [38]. BOI provides corporate income tax exemptions of 3–11 years and machinery import duty waivers, approving 309 projects worth approximately USD 3 billion in 2024–2025. A landmark structural reform took effect on 1 January 2026: the excise tax system shifted from price-based to CO2-emission-based rates, permanently fixing BEV excise at 2% regardless of CO2 level while ICE vehicles emitting above 200 g/km face rates of up to 34% [39]. This structural change, combined with an initial carbon tax of THB 200/ton CO2 and the EU CBAM taking full effect in 2026, creates long-term incentive alignment independent of temporary subsidies.
Vietnam’s support framework is characterized by aggressive demand-side incentives. Decree 10/2022 established 100% registration fee exemption for BEVs, subsequently extended through February 2027 by Decree 51/2025. BEV special consumption tax (SCT) rates of 1–3% contrast sharply with 35–50% for ICE vehicles [40]. The policy roadmap escalates dramatically: Hanoi plans to ban ICE motorcycles within Ring Road 1 from July 2026, extend restrictions to Ring Road 2 and ban ICE passenger cars from January 2028, and target the phase-out of new ICE vehicle sales nationwide by 2040 under Decision 876/QD-TTg [41]. Vietnam’s pilot emissions trading system, launched in June 2025, covers 50% of national CO2 emissions and signals the country’s commitment to green transition financing.
Lao PDR’s government support is more modest but strategically significant given the country’s fiscal constraints. Measures include abolition of EV import quotas (2022), a 30% annual road tax reduction for EVs, and EDL’s waiver of meter fees for charging station operators [42]. There are no direct consumer subsidies or R&D support programs. International development partners fill critical gaps: the Asian Development Bank (ADB) Vientiane Sustainable Urban Transport Project will introduce 50 electric BRT buses across three routes covering 149 km, while PIDG/InfraCo Asia invested USD 2.5 million in a domestic EV fleet operator (December 2025) to expand charging infrastructure to 93 stations nationwide.
3.2. Supply-Side Analysis
3.2.1. Logistical Connectivity with China and EV Supply Chain Context
The significance of logistical connectivity between the three countries and China must be understood in the context of China’s overwhelming dominance in the global EV supply chain. China accounted for over 70% of global EV production in 2024, manufacturing approximately 17 million electric vehicles, of which 11 million were sold domestically and over 1.25 million were exported. In the battery sector, Chinese manufacturers controlled approximately 69% of global EV battery installations in 2025, led by CATL (37.9% global share) and BYD (17.2%), with Chinese firms producing over 75% of global lithium-ion battery output. China’s dominance extends upstream: the country controls approximately 90% of global cathode active material manufacturing capacity, over 97% of anode active material manufacturing capacity, and more than 75% of all key raw materials and refined minerals for both batteries and electric motors. Battery pack prices in China fell to approximately USD 84/kWh for LFP systems in 2025, compared with USD 130/kWh in Western markets, creating a USD 2700 cost advantage per 60 kWh vehicle. China exported 3.43 million vehicles in 2025 (including all powertrains), with Asia remaining the largest destination by volume. For Thailand, Lao PDR, and Vietnam, which import virtually all BEV components and a growing share of finished vehicles from China, the quality and cost of logistical connectivity to Chinese supply chains is therefore a critical determinant of BEV affordability and market development.
The China–Laos Railway (Kunming–Vientiane, 1035 km, opened 2021) has fundamentally altered the logistics landscape for BEV market access (see Figure 3). The railway transported 19.64 million tons of goods in 2024 (+10.6% year-on-year), reducing logistics costs by approximately 40% and enabling BEVs and spare parts from Chinese manufacturers to reach Lao markets at substantially lower cost [43]. Bilateral trade between China and Lao PDR reached USD 8.23 billion in 2024 (+15.9%), with China as the country’s largest foreign investor (USD 18 billion cumulative).
Figure 3.
Logistics connectivity map showing rail corridors and GMS economic corridors linking Thailand, Lao PDR, and Vietnam to China. Note: The China–Laos Railway (operational 2021) and the planned Thai HSR (Phases 1 and 2) will create a continuous Bangkok–Kunming rail corridor by approximately 2031. The GMS North–South Economic Corridor (NSEC R3: Kunming–Chiang Rai–Bangkok) and East–West Economic Corridor (EWEC: Mae Sot–Savannakhet–Da Nang) are shown alongside key logistics hubs and major seaports (Laem Chabang, Haiphong). Thai HSR total investment: THB 520 billion (~USD 15B). China–Laos Railway reduced logistics cost by ~40%. The future Nong Khai–Vientiane section will complete a continuous Bangkok–Kunming rail link.
This connectivity creates a trade pattern characterized by asymmetry: Chinese-manufactured goods, including vehicles, electronics, and machinery, flow into Lao PDR, while Lao exports consist primarily of raw materials and agricultural products [44]. For the BEV market, this means that Chinese brands (BYD, SAIC, Hozon) enjoy structural price advantages in Lao PDR that competing brands from Thailand or Vietnam cannot easily match. The railway effectively transforms Lao PDR into a market overwhelmingly supplied by Chinese BEV products, creating a dependency that differs qualitatively from Thailand’s position, where BOI localization requirements and the scale of the domestic market provide negotiating leverage.
Thailand’s connectivity with China operates differently. Chinese BEV manufacturers (BYD, GWM, GAC Aion, Changan, Chery) have established production bases in Thailand rather than merely exporting to it, driven by BOI incentives and the strategic value of right-hand-drive production for ASEAN, European, and Oceanian export markets. Vietnam occupies a middle position: VinFast sources battery cells from CATL (China) and LG/Samsung (Republic of Korea), while Chery (via Geleximco) is constructing a factory in Hung Yen with 120,000 units/year capacity—the first Chinese–Vietnamese joint manufacturing venture in the BEV space [45].
The North–South Economic Corridor (NSEC) of Greater Mekong Subregion (GMS), running from Kunming through Houayxay and Chiang Rai to Bangkok, and the East–West Economic Corridor (EWEC), connecting Mae Sot (Thailand) through Savannakhet (Lao PDR) to Da Nang (Vietnam), provide the overarching framework within which BEV supply chains operate across the subregion. The logistics connectivity picture will transform further with Thailand’s high-speed rail (HSR) development. The Bangkok–Nong Khai HSR, a flagship project under China’s Belt and Road Initiative, will ultimately complete a continuous rail link from Bangkok through Nakhon Ratchasima and Nong Khai to Vientiane and onward to Kunming via the China–Laos Railway. Phase 1 (Bangkok–Nakhon Ratchasima, 253 km, THB 179 billion) was 52% complete as of January 2026, with operations expected by 2028. Phase 2 (Nakhon Ratchasima–Nong Khai, 357 km, THB 341 billion) was approved by the Thai Cabinet in February 2025, with construction beginning in 2026 and completion targeted for 2031. A railway bridge across the Mekong from Nong Khai to Vientiane is planned to link the two systems. Once operational, this corridor will enable BEV and component shipments from Chinese manufacturers to transit through Lao PDR to Thailand’s production bases in the Eastern Economic Corridor, and vice versa for Thai-assembled BEVs destined for the Chinese market, creating a bidirectional BEV supply chain corridor that does not currently exist. Vietnam’s connection to China operates via the existing Hanoi–Lao Cai–Kunming meter-gauge railway, which carries freight but at lower capacity and speed.
3.2.2. Parts and Materials Sourcing
All three countries share a fundamental vulnerability: 100% import dependency for battery-grade materials (lithium, cobalt, nickel, NMC precursors). Thailand is the most advanced in this dimension owing to emerging domestic battery module assembly; SVOLT–Banpu Next, BMW Gen-5, and ARUN Plus–CATL collaborations have initiated local module production, and Sunwoda’s approved USD 1 billion cell manufacturing facility in Chonburi represents a potential breakthrough [46]. Vietnam occupies a middle position, with VinFast sourcing cells from CATL and LG Energy Solution but possessing no domestic cell production. Lao PDR remains entirely import-dependent, and no foreseeable pathway to domestic production given market scale constraints.
3.2.3. Manufacturing Capability
Thailand demonstrates the strongest manufacturing base in the study, reflecting four decades of automotive industrial development. The Thai automotive industry accounts for 10–11% of GDP with over 850,000 direct jobs and an additional 1.5 million in related supply chains, and Thailand ranks as the world’s 10th largest vehicle producer, 5th in Asia, and 1st in ASEAN [27]. BYD’s Rayong plant—the company’s first wholly-owned, purpose-built, fully-integrated passenger car factory outside China—opened in July 2024 with 150,000 units/year capacity, covering stamping through final assembly, including battery production [47]. By May 2024, 14 BEV passenger car manufacturers had established production facilities in Thailand, with combined planned capacity exceeding 600,000 units per year [27]. Domestic BEV production share rose from 0.2% in 2023 to 14.2% (9688 units) in 2024, and further to 42.6% (23,798 units) in H1 2025. GWM, Neta, SAIC, and GAC Aion also produce locally. However, software expertise (BMS, VCU development) remains limited, and all BEV intellectual property resides with Chinese OEMs.
Vietnam has a developing but increasingly diversified manufacturing capability. VinFast’s Haiphong factory, designed in collaboration with Toyota and Ford, has a target capacity of 250,000 units/year with approximately 30% automation. VinFast’s distinctive strength lies in consumer-facing software integration—AI Mirror Sense, Amazon Alexa, OTA updates—supported by Vietnam’s USD 7 billion IT outsourcing sector [48]. The entry of Chery/Geleximco (Hung Yen factory, 120,000 units/year capacity, construction began in October 2025) diversifies the manufacturing base beyond a single OEM for the first time.
Lao PDR has no domestic manufacturing capability. No BEV manufacturing exists or is anticipated. The country functions as a pure import market, with vehicle imports sourced primarily from Thailand (33%), China (27%), Vietnam (13%), and Australia (8%), and fleet operators rely entirely on Chinese and Vietnamese technical support.
3.2.4. After-Sales Support and Charging Infrastructure
Thailand and Vietnam have comparable after-sales readiness but with different profiles. Thailand had 11,467 charging points in 2658 locations by December 2024, expanding to 3700+ stations with 11,600+ connectors, including 6000+ DC fast chargers by March 2025. The EV-to-charger ratio of 12.3 remains higher (worse) than China’s 6.5, and 40% of EV drivers report inadequate infrastructure [1]. PTT Oil and Retail targets 7000 stations by 2030. Battery leasing and degradation insurance products remain absent.
Vietnam’s charging network is quantitatively impressive—VinFast operates 150,000+ charging points across 34 provinces, the largest private EV network in ASEAN—but is dominated by Level 1/2 chargers, with DC fast charging still developing outside Ho Chi Minh City and Hanoi [49]. VinFast’s 10-year warranty with battery replacement below 70% capacity and battery leasing program represent ownership support advantages absent in the other two countries.
Lao PDR has the most limited after-sales infrastructure, with only 47 charging stations by mid-2025, concentrated in Vientiane. The leading domestic EV operator targets expansion to 93 stations nationwide following a USD 2.5 million investment from PIDG/InfraCo Asia in December 2025. Field research at the domestic EV operator revealed that approximately 95% of EVs in Lao PDR are imported from China using the GB/T charging standard, while the operator designs and custom-modifies its own charging systems with in-house software integration. A critical infrastructure constraint identified during meetings with EDL is that many distribution transformers are undersized for EV charging loads, and EDL currently lacks real-time electricity monitoring capability for EV consumption. The current 22 kV network in Vientiane is estimated to accommodate up to 18,000 EVs before reaching transmission capacity limits. EDL also faces structural financial challenges: domestic tariffs are often below cost recovery, and the utility must purchase power in USD while selling in kip, creating foreign exchange exposure. No specialized EV insurance products exist, and consumers outside the major fleet operator ecosystems lack organized after-sales support.
3.2.5. Legal and Regulatory Framework
Thailand has the most comprehensive regulatory structure among the three countries. EV 3.5 mandates a minimum battery energy density of 150 Wh/kg (accommodating LFP and sodium-ion chemistries), BOI qualification criteria cover ADAS and domestic battery production requirements, and the new CO2-based excise tax structure provides permanent regulatory advantage for BEVs [39]. New model approval takes 1–2 months, though localization requirements add complexity for new entrants.
Vietnam has strong demand-side regulatory incentives, but is developing technical standards. The UN ECE framework serves as the primary type approval basis. BYD encountered delays in domestic production approvals, suggesting that the regulatory system may favor established domestic players [40]. Law No. 66/2025 (effective January 2026) reduces SCT rates for HEVs to attract Japanese and Korean manufacturers, diversifying the market beyond pure BEVs.
Lao PDR has the least developed regulatory framework. NREL/USAID has collaborated with the Ministry of Energy and Mines on draft EV charging standards, and import quotas were abolished in 2022. Field research with the Department of Public Works and Transport confirmed that the vehicle registration and inspection framework currently lacks equipment for EV safety testing, allowing vehicles to pass annual inspections with minimal scrutiny. Efforts to draft legislation addressing EV modification and safety standards are underway, but remain incomplete. Licensing processes require 3–6 months, corresponding to the lowest maturity level in the framework, representing a significant practical barrier [42]. The national university, in collaboration with the Department of Mines and Energy, is drafting legal instruments governing EV charger installation and use, while a southern technical college has initiated a BYD-supported EV technician training program targeting 25 graduates per year.
3.2.6. Market Development Support and Energy Security
Thailand and Vietnam show comparable market development readiness, while Lao PDR lags behind. However, these overall assessments obscure a critical finding: the cost analysis sub-dimension reveals Lao PDR’s strongest structural advantage. Hydropower-based electricity costs of USD 0.05–0.07/kWh—the lowest in Asia according to the IEA—create the most favorable BEV operating economics in the region [50]. NREL/USAID TCO modeling demonstrates that BEVs achieve cost competitiveness with ICE vehicles in Lao PDR from 2024 onward. A micro-EV taxi’s base fare of 29,500 kip (approximately USD 1.35) represents commercially viable BEV fleet operation without government subsidies.
Energy security, however, presents divergent risks across the three countries. Thailand’s electricity grid depends on natural gas (58%) and coal (14–17%), with LNG imports constituting 29% of gas consumption. Every 10% increase in gas prices translates to approximately 3.5% higher electricity costs, directly affecting BEV charging economics [51]. Vietnam faces even greater concerns: coal generates 48% of electricity, the June 2023 power crisis caused approximately USD 1.4 billion in economic damage, and electricity demand is growing 10.5–13% annually [52]. The revised PDP8 (Decision 768/QD-TTg, April 2025) represents ASEAN’s most ambitious energy plan, increasing offshore wind targets from 6000 MW to 17,032 MW (+184%) and battery storage from 300 MW to 10,000–16,300 MW (+5300%), but implementation will require years [53].
Lao PDR’s hydropower dominance (75–83% of generation) provides the lowest carbon factor for EV charging in Asia and the most price-stable energy source. However, field interviews with EDL executives revealed significant operational challenges: electricity tariffs for domestic consumers are often set below cost recovery, EDL suffers from approximately 20% energy loss primarily through long-distance rural transmission lines, and seasonal drought risk can temporarily reduce hydropower output, requiring imports from Thailand and China. The domestic distribution network remains underdeveloped outside Vientiane, and rising demand from cryptocurrency mining and data centers has further strained grid capacity. The national university reported that consolidated national statistics on total EV numbers do not yet exist, hampering evidence-based grid planning for EV integration.
4. Discussion
4.1. Comparative Readiness Scorecard
Figure 4 presents the readiness assessment results aggregated across the seven dimensions of the framework, while Figure 5 further decomposes these into a demand–supply positioning grid that reveals each country’s strategic profile. The complete sub-dimension scores underlying Figure 4 are reported in Table S2 (Supplementary Materials), showing the data-based score, perception-based score, and final assigned score for each of the 16 sub-dimensions across all three countries.
Figure 4.
Radar chart of BEV Country Readiness Assessment scores across seven dimensions.
Figure 5.
Demand–supply readiness positioning grid. Note: Demand readiness (x-axis) = average of D3 sub-dimensions; supply readiness (y-axis) = average of S1, S2, and S4 sub-dimensions. Bubble size reflects the enabling environment score (E5, E6, E7). Arrows indicate projected five-year trajectories.
The radar chart reveals three visually distinct readiness profiles. Thailand (blue) displays the most balanced polygon, with scores ranging from 2.5 (S1: Parts and Materials Sourcing) to 4.0 (D3: Demand and E6: Government Support), reflecting its position as the only country with consistently above-average readiness across all dimensions. Its largest advantage over the other two countries lies in S2: Manufacturing (3.7) and E6: Government Support (4.0), confirming its role as the regional production hub with the most comprehensive policy infrastructure. Vietnam (coral) shows a sharply asymmetric profile dominated by the D3: Demand spike at 5.0—the highest single-dimension score in the study—while its supply-side dimensions (S1: 2.0, S2: 3.0) lag behind Thailand. This asymmetry visually captures the “demand-led” positioning identified in the framework: extraordinary market pull that has not yet been matched by proportional supply-side development. Notably, Vietnam’s E7: Market Development score (3.3) matches Thailand’s, reflecting the strong TCO advantage from low electricity prices and VinFast’s charging ecosystem. Lao PDR (purple) presents the smallest polygon overall but with a notable spike in D3: Demand (3.5), reflecting the country’s notably high EV/ICE registration ratio—approximately 25% of new car registrations in 2023—driven by fleet-led adoption in a very small absolute market. Its other scores cluster between 1.0 and 2.7, with E7: Market Development (2.7) reflecting the structural cost advantage from hydropower-based electricity, while its weakest dimensions, S1 and S2 at 1.0, confirm the complete absence of domestic manufacturing and component sourcing capability. The demand–supply asymmetry in Lao PDR is thus qualitatively different from Vietnam’s: both exhibit demand-led profiles, but Lao PDR’s demand is ratio-driven within a micro-market, whereas Vietnam’s is scale-driven within a rapidly motorizing economy.
Figure 5 further decomposes the seven-dimension scores into a demand–supply positioning grid. The demand readiness score (x-axis) is calculated as the average of D3 sub-dimensions (3.1 Evidence of Demand and 3.2 EV/ICE Ratio and Growth). The supply readiness score (y-axis) is the average of S1, S2, and S4 sub-dimensions—the core supply chain dimensions spanning sourcing, manufacturing, and after-sales support. The bubble size represents the enabling environment score (average of E5, E6, and E7), capturing the institutional and policy infrastructure that supports both supply and demand.
Figure 5 reveals three distinct positioning profiles that correspond to the complementary roles identified in this study. Thailand occupies the upper-right “balanced readiness” quadrant, reflecting its unique position as the only country with both substantial demand and mature supply-side capabilities. Its large bubble—the largest of the three, reflecting an enabling environment score of 3.61—underscores the comprehensive policy and institutional infrastructure provided by BOI, the EV Board, and the new CO2-based excise tax system. Thailand’s trajectory arrow points toward further strengthening in both dimensions, driven by expanding domestic production (BYD, GWM, Toyota Hilux Revo-e) and recovering demand as credit conditions ease.
Vietnam is positioned at the extreme right of the grid, demonstrating the highest demand readiness of any country in the study, but with supply capabilities that lag behind Thailand by 0.4 points. This demand–supply gap is the defining feature of Vietnam’s BEV landscape: VinFast’s ecosystem has generated extraordinary market pull—the highest BEV brand market share (34.4%) in any national automotive market globally—but the manufacturing base, component sourcing, and after-sales infrastructure have not yet scaled proportionally. Notably, Vietnam’s trajectory arrow is oriented predominantly upward rather than rightward, reflecting the expectation that supply-side development (Chery/Geleximco factory at Hung Yen, BYD at Phu Tho, and VinFast’s capacity expansion to 500,000 units/year) will be the primary growth vector over the next five years, as demand is already near the scale ceiling.
Lao PDR sits in the lower-right “demand-led” quadrant, a positioning that was not anticipated prior to the corrected EV/ICE ratio analysis. Its demand readiness score of 3.5, driven by an EV car share of approximately 25% of new registrations in 2023 and an estimated 38% in 2024, places it above Thailand on the demand axis, though this proportional strength must be interpreted alongside the very small absolute market (approximately 2600 EV cars in 2023 versus Thailand’s 75,700). The smallest bubble (enabling environment score 2.22) reflects limited institutional capacity. Lao PDR’s trajectory arrow is oriented predominantly upward, reflecting the expectation that the binding constraint on further BEV development is not demand but supply-side readiness: charging infrastructure expansion beyond Vientiane, development of EV-specific financial products, and regulatory framework maturation. The fleet operators (ride-hailing platforms, EV fleet operators, and EV taxi services) have already demonstrated that demand exists; the challenge is building the ecosystem to sustain and scale it.
The quadrant framework also highlights a critical asymmetry: no country occupies the upper-left “supply-led” quadrant (high supply, low demand). This absence suggests that in the context of Thailand, Lao PDR, and Vietnam, supply-side investment follows demand signals rather than preceding them—a pattern consistent with the FDI-driven nature of BEV manufacturing in the region, where Chinese OEMs establish production bases in response to demonstrated market potential rather than on speculative grounds. Notably, the corrected positioning reveals that Lao PDR has already crossed into the demand-led quadrant alongside Vietnam, suggesting that fleet-led demand has advanced further than previously recognized. The implication is that the primary constraint on Lao PDR’s BEV development is no longer demand generation but supply-side and institutional readiness, charging infrastructure, regulatory frameworks, financial products, and grid capacity, making these the priority areas for policy intervention and development partner support.
Table 2 presents the sensitivity analysis results. Under equal weighting (baseline), overall scores are Thailand 3.43, Vietnam 3.26, and Lao PDR 1.95. Under demand-weighted scenarios (D3 weight doubled), the Thailand–Vietnam gap narrows to near-convergence (Thailand 3.50, Vietnam 3.48, gap = +0.02). Under supply-weighted scenarios (S1, S2, S4 weights doubled), Thailand’s advantage widens (3.32 versus Vietnam’s 3.08, gap = +0.24). Under expert-judgment weighting (demand 40%, supply 35%, enabling 25%), Vietnam overtakes Thailand (3.75 versus 3.57), demonstrating that the TH > VN ranking is sensitive to how demand performance is weighted. When the highest single dimension score for each country is perturbed by −1 point, overall scores change to Thailand 3.29, Vietnam 3.12, and Lao PDR 1.81. In five of six scenarios, the three-tier ranking (TH > VN > LA) is preserved; the expert-judgment scenario reverses Thailand and Vietnam but maintains Lao PDR in third position. The equal weighting approach may introduce systematic bias: supply-side dimensions show relatively low cross-country variance (all three depend on Chinese imports), while demand-side dimensions show high variance (range: 2.5–5.0). Equal weighting may therefore understate the practical importance of demand-side differences, as confirmed by the expert-judgment scenario where Vietnam’s strong demand performance shifts the ranking.
Table 2.
Sensitivity analysis of overall BEV readiness scores under alternative weighting schemes and perturbation scenarios.
4.2. Complementary Roles in the Regional Value Chain
The analysis reveals that the three countries occupy complementary rather than competitive positions within the emerging regional BEV value chain across Thailand, Lao PDR, and Vietnam.
Thailand functions as the Regional Production Hub, creating value through manufacturing employment, tax revenue, and skills development. Its four-decade automotive heritage, comprehensive BOI investment framework, and the strategic significance of BYD’s only operational fully integrated factory outside China position it as the production base for right-hand-drive BEV exports to ASEAN, Europe, and Oceania. The ceiling on Thailand’s long-term value creation, however, depends on progressing from assembly to component-level manufacturing and, ultimately, to R&D capability. Currently, all BEV intellectual property resides with Chinese OEMs—a vulnerability that limits the economy’s capture of higher-value-added activities.
Vietnam serves as the Demand Market and Ecosystem Innovator, creating value through market scale and VinFast’s vertically integrated ecosystem. VinFast’s achievement, becoming the first pure-EV OEM to lead a national automotive market anywhere in the world, represents an unprecedented phenomenon. The self-reinforcing ecosystem of charging infrastructure, taxi services, battery leasing, and consumer software creates switching costs that sustain demand growth independent of government subsidies. The operating cost advantage of 73% over ICE vehicles ensures that high-utilization commercial users adopt BEVs based on economic rationality alone. The primary risk is concentration: VinFast’s financial health is effectively a systemic risk for the entire Vietnamese BEV market, though the entry of BYD and Chery begins to diversify the manufacturing base. A simplified scenario analysis illustrates this concentration risk: if VinFast’s domestic market share were to decline from 34.4% to approximately 15–20% due to increased competition from BYD, Chery, or Hyundai, Vietnam’s D3 Demand score would likely decrease from 5.0 to approximately 3.5–4.0 (as BEV market share would drop but remain substantial from other brands), reducing the overall readiness score from 3.26 to approximately 3.05–3.15, narrowing the gap with Lao PDR rather than with Thailand. This underscores the importance of supply-side diversification for Vietnam’s long-term BEV readiness.
Lao PDR occupies the position of demand-driven adopter, creating value through macroeconomic relief from reduced fuel imports and demonstrating that fleet-led BEV adoption can achieve proportionally high market penetration even in low-income economies. The country’s BEV readiness cannot be understood through aggregate scores alone; the structural economic compulsion, fuel imports consuming 45% of external debt, combined with the world’s lowest EV charging carbon factor and electricity costs, creates an adoption rationale that is more durable than policy-dependent incentives in Thailand or ecosystem-dependent growth in Vietnam. The corrected demand data reveal that Lao PDR’s EV/ICE ratio (~25% of new car registrations in 2023) already exceeds Thailand’s, driven by fleet platforms (ride-hailing services, EV fleet operators, and EV taxi services) that concentrate demand among high-utilization commercial users for whom the operating cost advantage is decisive. The China–Laos Railway amplifies this dynamic by reducing the cost of Chinese BEVs, though it simultaneously deepens supply chain dependency. Lao PDR will not become a BEV manufacturer, but it has demonstrated that a country can achieve demand-led BEV adoption without manufacturing capability, government subsidies, or a large consumer market—a finding with potential implications for other small, resource-constrained economies in ASEAN and beyond.
4.3. Cross-Cutting Themes
Three cross-cutting themes emerge from the comparative analysis. First, energy security is the under-examined variable in BEV readiness. Both Thailand and Vietnam face electricity generation mixes dependent on imported fossil fuels (natural gas and coal, respectively), meaning that BEV charging costs are exposed to global commodity price volatility. This undermines the predictability of TCO advantages that underpin consumer adoption decisions. Lao PDR’s hydropower provides the most price-stable charging source but serves primarily as an export commodity rather than a domestic EV enabler outside Vientiane.
Second, China’s role is pervasive but differentiated. In Thailand, Chinese OEMs invest in production facilities governed by BOI localization requirements—a managed dependency with technology transfer potential. In Vietnam, Chinese cell suppliers underpin VinFast’s operations, while BYD and Chery establish competing production. In Lao PDR, the China–Laos Railway creates a unidirectional flow of Chinese BEVs with no reciprocal mechanism for local value creation. Understanding these differentiated dependency relationships is essential for policy design.
Third, demand for sustainability differs qualitatively. Thailand’s BEV demand growth has been policy-responsive, accelerating under EV 3.0 subsidies and moderating when EV 3.5 reduced them, suggesting that the market has not yet achieved self-sustaining demand. Vietnam’s demand growth appears structurally sustainable, driven by VinFast’s ecosystem and approaching ICE bans. Lao PDR’s fleet-led demand is the most economically rational and has achieved a proportionally high EV/ICE ratio (~25% of new car registrations), though it remains limited in absolute scale by the country’s small total vehicle market. The corrected demand data suggest that Lao PDR has progressed further along the adoption curve than previously recognized, with the binding constraint now being supply-side and institutional readiness rather than demand generation. The long-term trajectory of BEV adoption in the region will be shaped by which of these demand models proves most resilient to external shocks.
Fourth, the assessment dimensions reveal patterns consistent with global EV adoption research while also highlighting dynamics specific to emerging markets. Charging infrastructure has been found to be the strongest predictor of national EV market share across 30 countries, followed by financial incentives and local manufacturing presence [15]. The present framework corroborates this hierarchy: Thailand’s balanced readiness profile is anchored precisely by its strength in manufacturing (S2) and government support (E6), while Vietnam’s demand leadership (D3: 5.0) coexists with lagging charging infrastructure maturity, and Lao PDR’s weakest dimensions are those identified as most critical in the cross-country evidence. However, the findings also extend the global evidence in important ways. Prospective accessibility—consumers’ expectations about future infrastructure expansion—has been demonstrated to significantly influence adoption intention independently of current objective charger availability [15]. This resonates with the observation that Vietnam’s BEV demand continues to accelerate despite the VinFast-exclusive nature of its charging network, suggesting that consumers’ expectations about ecosystem expansion may partially compensate for current infrastructure limitations. The finding that BEV adoption is jointly determined by short-run price signals and long-run structural conditions [20] provides an analytical lens for interpreting the differential readiness trajectories: Thailand’s policy-responsive demand reflects sensitivity to short-run incentive changes, while Lao PDR’s adoption trajectory is driven by long-run structural factors (energy costs, fuel import dependency) that are more durable. A J-TRA analysis of Indonesia—an ASEAN neighbor at a similar development stage—identified commercialization and infrastructure integration as the primary readiness bottlenecks despite mature technology development [18], a pattern strikingly parallel to the findings for Lao PDR, where technology availability (Chinese BEVs via the railway) outpaces the commercialization ecosystem (charging infrastructure, financial products, regulatory frameworks). This cross-regional convergence suggests that emerging ASEAN economies may face a common readiness sequence in which technology supply precedes institutional and commercial readiness, requiring policy interventions that prioritize ecosystem development over technology transfer.
5. Conclusions
This paper has developed and applied a seven-dimensional, sixteen-sub-dimension BEV Country Readiness Assessment framework to Thailand, Lao PDR, and Vietnam, producing one of the first systematic demand–supply comparisons across the three countries. The findings demonstrate that aggregate readiness scores—Thailand 3.43, Vietnam 3.26, Lao PDR 1.95 on a 5.0 scale—mask fundamentally different strengths and vulnerabilities that position the three countries as complementary participants in a regional BEV value chain rather than direct competitors. As the demand–supply positioning grid (Figure 5) illustrates, Thailand achieves balanced readiness across both dimensions, Vietnam leads globally in demand but must close its supply gap, and Lao PDR’s demand-led positioning, with an EV/ICE ratio exceeding Thailand’s despite its far smaller market, reveals that fleet-driven adoption has outpaced institutional and supply-side readiness, creating a distinctive demand–supply asymmetry that requires targeted ecosystem development. These scores should be interpreted as ordinal relative positioning indicators rather than cardinal measurements. The framework’s value lies in identifying dimension-level strengths and weaknesses and in comparing countries’ profiles, not in the precision of the aggregate numbers.
For Thailand, the priority is transitioning from assembly-based value creation to component manufacturing and, ultimately, R&D capability. The CO2-based excise tax restructuring (effective January 2026) represents a positive structural shift, but bridging the intellectual property gap with Chinese OEMs and accelerating renewable energy deployment to reduce LNG-dependent charging cost volatility are essential. For Vietnam, reducing systemic dependence on VinFast while maintaining the ecosystem advantages it has created, and addressing grid reliability and the high coal share in electricity generation, will determine whether the current extraordinary growth trajectory proves sustainable. For Lao PDR, the corrected demand data reveal that fleet-led adoption has already achieved a proportionally high market penetration, shifting the policy priority from demand stimulation to supply-side and institutional development: reducing licensing timelines from Level 1 to Level 2, developing EV-specific financial products appropriate for low per capita income, expanding charging infrastructure beyond Vientiane, and strengthening grid capacity for EV integration—tasks where international development partners can play catalytic roles. These country-specific recommendations are directly derived from the assessment scores: Thailand’s S2 Manufacturing score of 3.67 contrasts with its S1 Sourcing score of 2.5, quantifying the assembly-to-component gap. Vietnam’s D3 Demand score of 5.0 is the highest in the study, but is driven by a single OEM (VinFast) controlling 34.4% of total vehicle sales, creating quantifiable concentration risk. Lao PDR’s S4 After-Sales score of 1.5 versus its E7.3 Cost Analysis score of 4.0 reveals that the structural economic rationale for BEV adoption far exceeds the infrastructure capacity to support it—a gap that international development partners are uniquely positioned to address. For Lao PDR specifically, policy recommendations should account for the low-base effect: the country’s relatively high BEV market share percentage reflects a total market of fewer than 12,000 annual vehicle registrations, meaning that a small number of fleet purchases can significantly move percentage shares. Policy targets for Lao PDR should therefore be framed in absolute units (e.g., number of charging stations, fleet vehicles) rather than percentage-based market share goals.
The practical significance of these results extends to four target audiences. For policymakers, the dimension-level scores identify priority intervention areas: Lao PDR should focus on S4 (After-Sales, score 1.5) and E5 (Legal Framework, score 2.0) before addressing manufacturing (S2, score 1.0), since after-sales infrastructure and regulatory clarity are prerequisites for attracting private investment. For industry investors, the demand–supply positioning grid (Figure 5) identifies market entry opportunities: Vietnam’s demand-led position signals opportunity for charging infrastructure and after-sales service providers, while Thailand’s balanced position favors component manufacturing investments. For international development organizations, the enabling environment scores pinpoint where technical assistance is most impactful—Lao PDR’s E5 Legal score of 2.0 indicates an acute need for regulatory capacity building in EV safety standards and charging protocols. For researchers, the framework is replicable across other ASEAN or developing countries; applying it to Cambodia, Myanmar, and the Philippines would enable a comprehensive regional readiness map. These findings parallel the importance of coordinated policy, infrastructure, and manufacturing development in Pakistan’s EV context, suggesting that developing countries across Asia face structurally similar readiness challenges despite differing national circumstances [1].
Future research should develop primary survey instruments for consumer perception assessment across the three countries, model the macroeconomic impact of fuel import substitution through BEV adoption in Lao PDR, and examine technology transfer mechanisms from Chinese OEM production bases in Thailand. The consumption values framework integrating functional, symbolic, emotional, novelty, and conditional value dimensions with attitudinal mediation [17] offers a promising theoretical basis for such consumer surveys, particularly given the distinct emotional and symbolic dynamics observed in Vietnam (national brand pride) versus the predominantly functional value drivers in Thailand and Lao PDR. The J-TRA multistakeholder readiness assessment methodology [18] could also be adapted to systematically compare stakeholder perception gaps across Thailand, Lao PDR, and Vietnam, as the present framework’s dual-evidence approach (data-based and perception-based scoring) already captures elements of this logic but would benefit from formalized multistakeholder instruments. The panel ARDL methodology employed to decompose short-run and long-run adoption determinants in the EU [19] could be applied to ASEAN panel data to test whether the price gap and fuel price elasticities identified in the European context hold in emerging markets of Thailand, Lao PDR, and Vietnam, characterized by lower per capita income and different energy mixes. The three-dimensional accessibility measurement framework, distinguishing objective, perceived, and prospective charger accessibility [15], provides a methodological template for assessing whether the charging infrastructure gaps identified in the present framework translate into actual adoption barriers at the individual consumer level. Longitudinal tracking of readiness scores as policies evolve would provide a dynamic complement to this cross-sectional assessment.
Supplementary Materials
The following supporting information can be downloaded at: https://www.mdpi.com/article/10.3390/wevj17060280/s1, Table S1. Complete scoring rubric with Level 1–5 criteria for all 16 sub-dimensions and country scores, Table S2. Complete sub-dimension scores and dimension averages for all three countries.
Author Contributions
Conceptualization, S.S. (Salinee Santiteerakul), S.R. and A.S.; Methodology, S.S. (Salinee Santiteerakul), S.R. and A.S.; Formal analysis, S.S. (Salinee Santiteerakul), K.Y.T., P.C., J.W., B.P., S.S. (Suttinee Sawadsitang) and T.S.; Investigation, S.R., A.S., K.Y.T. and P.C.; Resources, P.C., J.W., B.P., S.S. (Suttinee Sawadsitang) and T.S.; Data curation, P.C., J.W., B.P., S.S. (Suttinee Sawadsitang) and T.S.; Writing—original draft, S.R.; Writing—review & editing, S.S. (Salinee Santiteerakul), B.P., S.S. (Suttinee Sawadsitang) and T.S.; Visualization, S.R. and K.Y.T.; Supervision, A.S. and K.Y.T.; Project administration, S.R.; Funding acquisition, S.R. All authors have read and agreed to the published version of the manuscript.
Funding
This research was funded by the Lancang-Mekong Cooperation Special Fund.
Institutional Review Board Statement
Ethical review and approval were waived for this study due to this study consists of qualitative interviews with professional stakeholders. It does not involve sensitive personal data, vulnerable populations, or any interventional procedures. Ethical approval was not required in accordance with the National Research Council of Thailand (NRCT) guidelines, which exempt non-interventional social science and qualitative research of this nature from mandatory ethical review.
Informed Consent Statement
Informed consent was obtained from all subjects involved in the study.
Data Availability Statement
The data presented in this study are available on request from the corresponding author.
Acknowledgments
This work was supported by the Supply Chain and Engineering Management Research Unit, Chiang Mai University.
Conflicts of Interest
The authors declare no conflicts of interest.
Abbreviations
The following abbreviations are used in this manuscript:
| ASEAN | Association of Southeast Asian Nations |
| BEV | Battery Electric Vehicle |
| BOI | Board of Investment (Thailand) |
| BRT | Bus Rapid Transit |
| CBAM | Carbon Border Adjustment Mechanism |
| CO2 | Carbon Dioxide |
| DC | Direct Current |
| EDL | Électricité du Laos |
| EV | Electric Vehicle |
| EWEC | East-West Economic Corridor |
| FDI | Foreign Direct Investment |
| GDP | Gross Domestic Product |
| GMS | Greater Mekong Subregion |
| HSR | High-Speed Rail |
| ICE | Internal Combustion Engine |
| IEA | International Energy Agency |
| kWh | Kilowatt-hour |
| LEAP | Low Emission Analysis Platform |
| MW | Megawatt |
| NSEC | North–South Economic Corridor |
| OEM | Original Equipment Manufacturer |
| SCT | Special Consumption Tax |
| TCO | Total Cost of Ownership |
| THB | Thai Baht |
| USD | United States Dollar |
| VAMA | Vietnam Automobile Manufacturers’ Association. |
References
- IEA. Global EV Outlook 2025; International Energy Agency: Paris, France, 2025. [Google Scholar]
- Kongklaew, C.; Phoungthong, K.; Prabpayak, C.; Chowdhury, M.S.; Khan, I.; Yuangyai, N.; Yuangyai, C.; Techato, K. Barriers to Electric Vehicle Adoption in Thailand. Sustainability 2021, 13, 12839. [Google Scholar] [CrossRef] [Scilit]
- Tsai, J.-F.; Wu, S.-C.; Kathinthong, P.; Tran, T.-H.; Lin, M.-H. Electric Vehicle Adoption Barriers in Thailand. Sustainability 2024, 16, 1642. [Google Scholar] [CrossRef] [Scilit]
- Champeecharoensuk, T.; Saisirirat, P.; Chollacoop, N.; Vithean, K.; Thapmanee, K.; Silva, K.; Champeecharoensuk, A. Total Cost of Ownership (TCO) Analysis of Electric Vehicle in ASEAN. Energy Sustain. Dev. 2025, 85, 101650. [Google Scholar] [CrossRef] [Scilit]
- Champeecharoensuk, T.; Saisirirat, P.; Chollacoop, N.; Vithean, K.; Thapmanee, K.; Silva, K.; Champeecharoensuk, A. Global Warming Potential and Environmental Impacts of Electric Vehicles and Batteries in ASEAN. Energy Sustain. Dev. 2025, 86, 101723. [Google Scholar] [CrossRef] [Scilit]
- Kresnawan, M.R.; Yurnaidi, Z.; Bilqis, A.; Wijaya, T.N.; Suryadi, B. Electric Vehicle Readiness in Southeast Asia: A PEST Policy Review. IOP Conf. Ser. Earth Environ. Sci. 2022, 997, 012001. [Google Scholar] [CrossRef] [Scilit]
- Pham, V.T.; Nguyen, T.P.T.; Le, T.T.L.; Tran, T.L.; Nguyen, T.L.; Hoang, M.T. Factors Influencing Purchasing Intention Toward Electric Vehicle in Vietnam. J. Soc. Commer. 2022, 2, 82–99. [Google Scholar] [CrossRef] [Scilit]
- Abdullah, N.; Wan Razak, W.N.Z.; Azali, N.A.E.; Azman, K.N.; Kharfizi, K.M.; Jansi, S.N.S.; Ibrahim, N.A.; Abdul Rahman, S.; Jabar, S.N. Electric Vehicle Adoption: A Comparative Analysis in Malaysia and ASEAN Countries. Semarak Int. J. Electron. Syst. Eng. 2024, 1, 60–68. [Google Scholar] [CrossRef] [Scilit]
- Lin, O.Z.; Stepanec, L.; Koutroulis, E.; Juchelkova, D.; Aye, H.Y.; de Luna Era, M.; Veng Kheang, P. Barriers to Electric Vehicle Adoption in ASEAN Emerging Economies: Comparative Analysis of Cambodia, Myanmar, and the Philippines. Discov. Sustain. 2025, 6, 725. [Google Scholar] [CrossRef] [Scilit]
- Schröder, M. Towards a New Division of Labour in Southeast Asia: Indonesian and Thai Industrial Policy and the Electric Vehicle Value Chain in ASEAN. Int. J. Automot. Technol. Manag. 2024, 24, 73–99. [Google Scholar] [CrossRef] [Scilit]
- Nguyen, T.; Earl, C. Electric Vehicle Adoption in Vietnam: Usefulness and Pro-environmentalism in an Emerging Market. Contemp. Soc. Sci. 2025, 20, 110–121. [Google Scholar] [CrossRef] [Scilit]
- Nguyen, H.P.; Hoang, A.T.; Le, A.T.; Pham, V.V.; Tran, V.N. Learned Experiences from the Policy and Roadmap of Advanced Countries for the Strategic Orientation to Electric Vehicles: A Case Study in Vietnam. Energy Sources Part A 2024, 46, 15567–15576. [Google Scholar] [CrossRef] [Scilit]
- Ramingwong, S.; Sampattagul, S.; Jintana, J. Economic Viability of Electric Bus Adoption for Public Transportation in Thailand: A Monte Carlo Simulation Approach. Logistics 2025, 9, 60. [Google Scholar] [CrossRef] [Scilit]
- Sierzchula, W.; Bakker, S.; Maat, K.; van Wee, B. The Influence of Financial Incentives and Other Socio-Economic Factors on Electric Vehicle Adoption. Energy Policy 2014, 68, 183–194. [Google Scholar] [CrossRef] [Scilit]
- He, S.Y.; Luo, S.; Sun, K.K. Factors Affecting Electric Vehicle Adoption Intention: The Impact of Objective, Perceived, and Prospective Charger Accessibility. J. Transp. Land Use 2022, 15, 779–801. [Google Scholar] [CrossRef] [Scilit]
- Javadnejad, F.; Jahanbakh, M.; Pinto, C.A.; Saeidi, A. Analyzing Incentives and Barriers to Electric Vehicle Adoption in the United States. Environ. Syst. Decis. 2024, 44, 575–606. [Google Scholar] [CrossRef] [Scilit]
- Mohd Noor, N.A.; Muhammad, A.; Isa, F.M.; Shamsudin, M.F.; Abaidah, T.N.A.T. The Electric Vehicle (EV) Revolution: How Consumption Values, Consumer Attitudes, and Infrastructure Readiness Influence the Intention to Purchase Electric Vehicles in Malaysia. World Electr. Veh. J. 2025, 16, 556. [Google Scholar] [CrossRef] [Scilit]
- Maghfiroh, M.F.N.; Pandyaswargo, A.H.; Onoda, H. Current Readiness Status of Electric Vehicles in Indonesia: Multistakeholder Perceptions. Sustainability 2021, 13, 13177. [Google Scholar] [CrossRef] [Scilit]
- Pavlova, O.; Pavlov, K.; Liashenko, O.; Jamróz, A.; Kopeć, S. Gas in Transition: An ARDL Analysis of Economic and Fuel Drivers in the European Union. Energies 2025, 18, 3876. [Google Scholar] [CrossRef] [Scilit]
- Zulfiqar, M.; Farooq, A.; Usmani, Z.; Zia, U.U.R.; Ullah, S.; Babar, Z.B. Pakistan’s Electric Vehicle Market: Challenges, Opportunities, and Future Pathways. Eng. Proc. 2024, 75, 15. [Google Scholar] [CrossRef] [Scilit]
- Autio, P.; Borgentorp, E.; Pulkka, L.; Junnila, S. Smart Readiness Indicator: Ready for Business? Evidence from a Northern EU Country. Buildings 2024, 14, 3638. [Google Scholar] [CrossRef] [Scilit]
- World Bank. Thailand Economic Monitor: Digital Pathways for Growth; World Bank: Bangkok, Thailand, 2025. [Google Scholar]
- OECD. Economic Surveys: Viet Nam 2025; OECD Publishing: Paris, France, 2025. [Google Scholar]
- World Bank. Lao Economic Monitor, December 2025: Consolidating Recent Reform Momentum for Stability and Growth; World Bank: Washington, DC, USA, 2025. [Google Scholar]
- Euromonitor International. Vietnam’s Automotive and Mobility Market Accelerates Towards Electrification. Available online: https://www.euromonitor.com/article/vietnams-automotive-and-mobility-market-accelerates-towards-electrification (accessed on 1 March 2026).
- Automotive Industry Institute. Thailand Vehicle Production and Sales Statistics; Automotive Industry Institute: Bangkok, Thailand, 2025. [Google Scholar]
- Krungsri Research. Industry Outlook 2024–2026: Automobile Industry; Bank of Ayudhya: Bangkok, Thailand, 2024. [Google Scholar]
- Krungsri Research. Industry Outlook 2024–2026: Electric Vehicle Industry Thailand; Krungsri Research: Bangkok, Thailand, 2024. [Google Scholar]
- Market Research Thailand. Thailand EV Market Accelerates with Record 66K Sales. Available online: https://marketresearchthailand.com/insights/articles/thailand-ev-registrations-surge-past-66k-in-h1-2025 (accessed on 1 March 2026).
- VinFast Auto Ltd. VinFast Reports Preliminary and Unaudited Fourth Quarter and Full Year 2025 Financial Results. Available online: https://vinfastauto.us/newsroom/press-release/vinfast-reports-preliminary-and-unaudited-fourth-quarter-and-full-year-2025 (accessed on 1 March 2026).
- Focus2Move. Vietnamese Vehicles Market: Facts & Data 2025. Available online: https://www.focus2move.com/vietnamese-vehicles-market/ (accessed on 1 March 2026).
- International Council on Clean Transportation. A Sneak Peek at the 2025 Global Electric Two-Wheeler Market. Available online: https://theicct.org/sneak-peek-at-the-2025-global-electric-two-wheeler-market-dec25/ (accessed on 1 March 2026).
- Focus2Move. Lao Vehicles Sales: Facts & Data 2024. Available online: https://www.focus2move.com/lao-vehicles-sales/ (accessed on 1 March 2026).
- Laotian Times. LOCA Sparks EV Revolution in Laos with 40 Fast Charging Stations. Available online: https://laotiantimes.com/2024/12/26/loca-sparks-ev-revolution-in-laos-with-40-fast-charging-stations/ (accessed on 1 March 2026).
- Suttakul, P.; Wongsapai, W.; Fongsamootr, T.; Mona, Y.; Poolsawat, K. Total Cost of Ownership of Internal Combustion Engine and Electric Vehicles: A Case Study of Thailand. Energy Rep. 2022, 8, 545–553. [Google Scholar] [CrossRef] [Scilit]
- InvestVietnam. The Electric Vehicle Industry in Vietnam 2025: Market Dynamics, Growth Trajectories and Strategic Outlook. Available online: https://blog.investvietnam.co/the-electric-vehicle-industry-in-vietnam-2025-market-dynamics-growth-trajectories-and-strategic-outlook/ (accessed on 1 March 2026).
- Credendo. Laos: Eroding Liquidity and Unsustainable Debt Service Outlook Could Lead to Debt Relief Agreement with China. Available online: https://credendo.com/en/knowledge-hub/laos-eroding-liquidity-and-unsustainable-debt-service-outlook-could-lead-debt-relief (accessed on 1 March 2026).
- Board of Investment of Thailand. Investment Promotion for Electric Vehicles; Board of Investment: Bangkok, Thailand, 2024.
- Bangkok Post. Excise Taxes on Cars to Be Restructured. Available online: https://www.bangkokpost.com/business/general/2932440/excise-taxes-on-cars-to-be-restructured (accessed on 1 March 2026).
- Tilleke & Gibbins. Vietnam’s Legal Framework on Electric Vehicles Offers New Opportunities for Investors. Available online: https://www.tilleke.com/insights/vietnams-legal-framework-on-electric-vehicles-offers-new-opportunities-for-investors/ (accessed on 1 March 2026).
- Government of Vietnam. Decision No. 876/QD-TTg: Program on Green Energy Transition, Reduction of Carbon and Methane Emissions of the Transport Sector; Government of Vietnam: Hanoi, Vietnam, 2022.
- US-ASEAN Business Council. Laos to Grow EV Market Fueled by Renewable Energy. Available online: https://www.usasean.org/article/laos-grow-ev-market (accessed on 1 March 2026).
- Laotian Times. Laos-China Railway Surpasses 80 Million Tonnes of Cargo Since Late 2021. Available online: https://laotiantimes.com/2026/03/26/laos-china-railway-surpasses-80-million-tonnes-of-cargo-since-late-2021/ (accessed on 1 March 2026).
- China Briefing. China-Laos Relations: Strategic Cooperation and Development Initiatives. Available online: https://www.china-briefing.com/news/strengthening-china-laos-relations-strategic-cooperation/ (accessed on 1 March 2026).
- KPMG Vietnam. Navigating Vietnam’s EV Landscape; KPMG: Ho Chi Minh City, Vietnam, 2024. [Google Scholar]
- PRNewswire. Thailand’s Supercharged EV Sales Poised for New Surge; PR Newswire: New York, NY, USA, 2024. [Google Scholar]
- BYD. BYD Roll-Off of Its 8 Millionth New Energy Vehicle. Available online: https://www.byd.com/za/news-list/BYD-roll-off-of-lts-8-millionth-new-energy-vehicle (accessed on 1 March 2026).
- Cornell University Emerging Markets Institute. Powering Vietnam’s Future: The Rise of Electric Vehicles; Cornell University: Ithaca, NY, USA, 2024. [Google Scholar]
- Mordor Intelligence. Vietnam Electric Vehicle Market Size, Drivers & Opportunities, Forecast 2031. Available online: https://www.mordorintelligence.com/industry-reports/vietnam-electric-vehicle-market (accessed on 1 March 2026).
- United Nations Economic and Social Commission for Asia and the Pacific (UNESCAP). Promotion of Public Transport Electrification in Lao People’s Democratic Republic; UNESCAP: Bangkok, Thailand, 2022. [Google Scholar]
- Ember. Thailand’s Cost-Optimal Pathway to a Sustainable Economy; Ember: London, UK, 2025. [Google Scholar]
- Vietnam Briefing. Vietnam’s Power Shortage: Impact on Manufacturing and Government Response; Dezan Shira & Associates: Ho Chi Minh City, Vietnam, 2025. [Google Scholar]
- Government of Vietnam. Decision No. 768/QD-TTg: Approving the Adjustment of the National Power Development Plan for the 2021–2030 Period, with a Vision Toward 2050; Government of Vietnam: Hanoi, Vietnam, 2025.
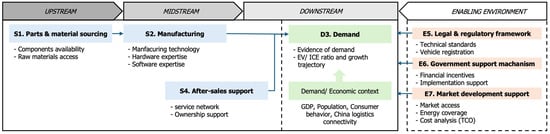
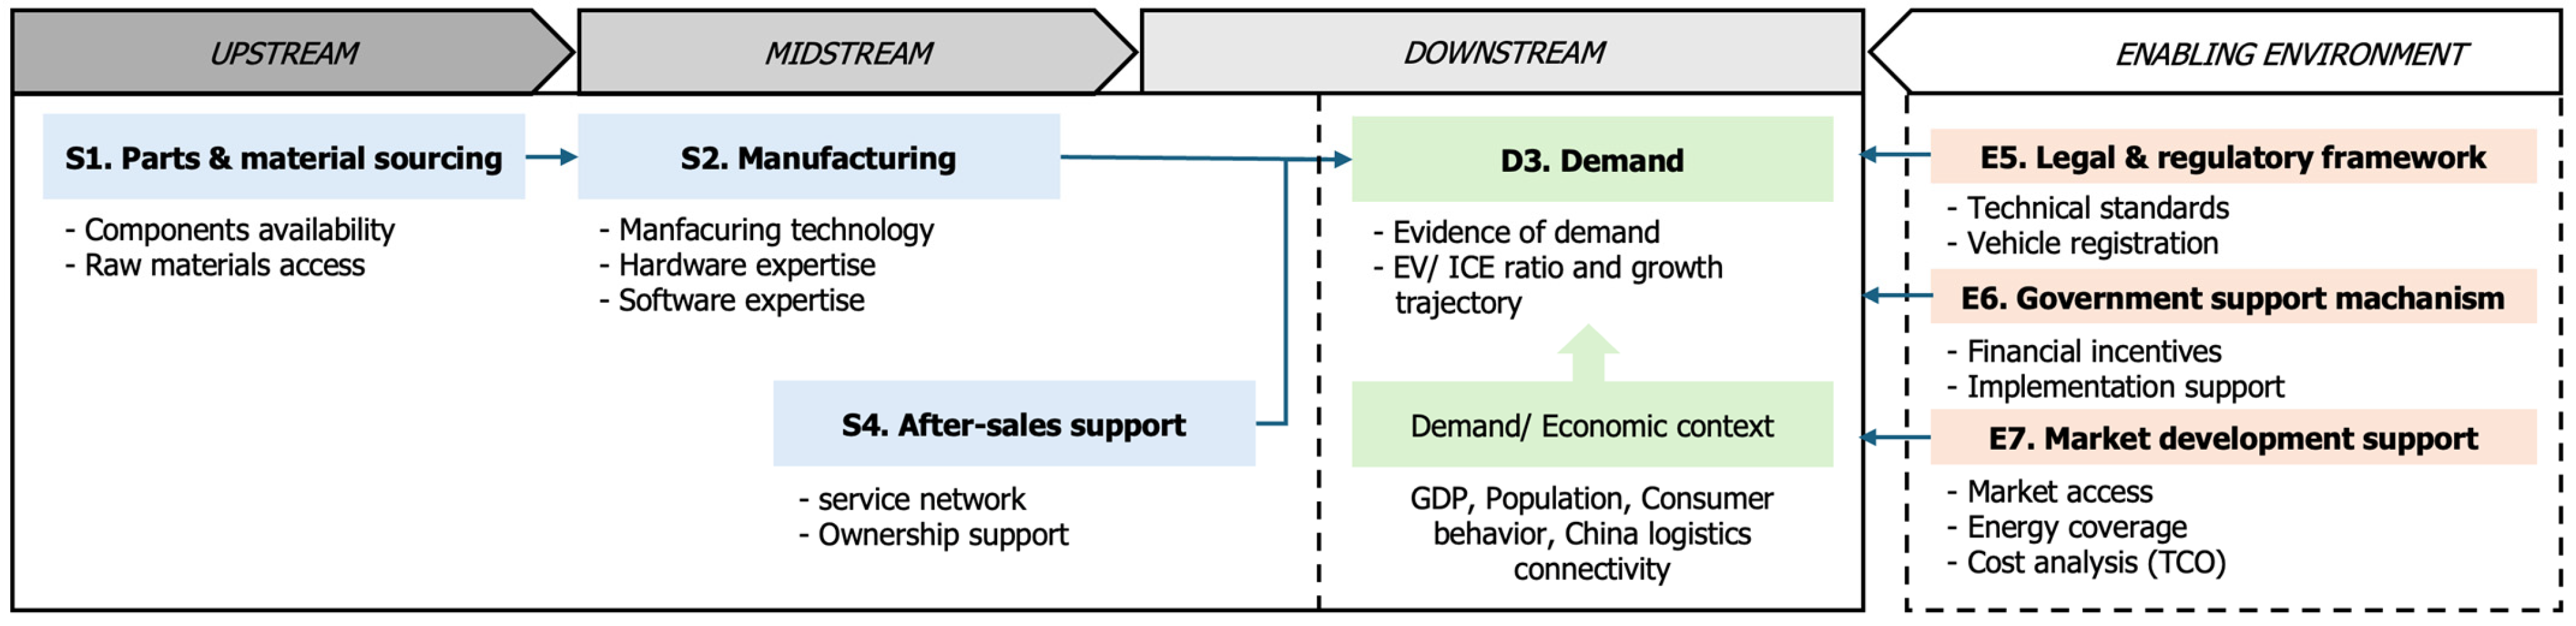
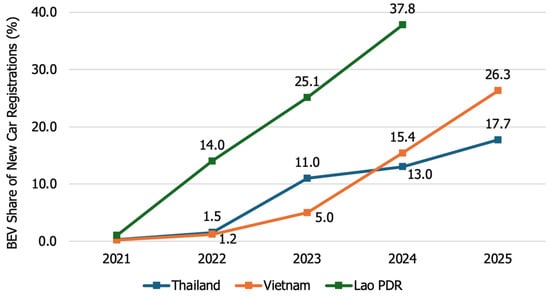
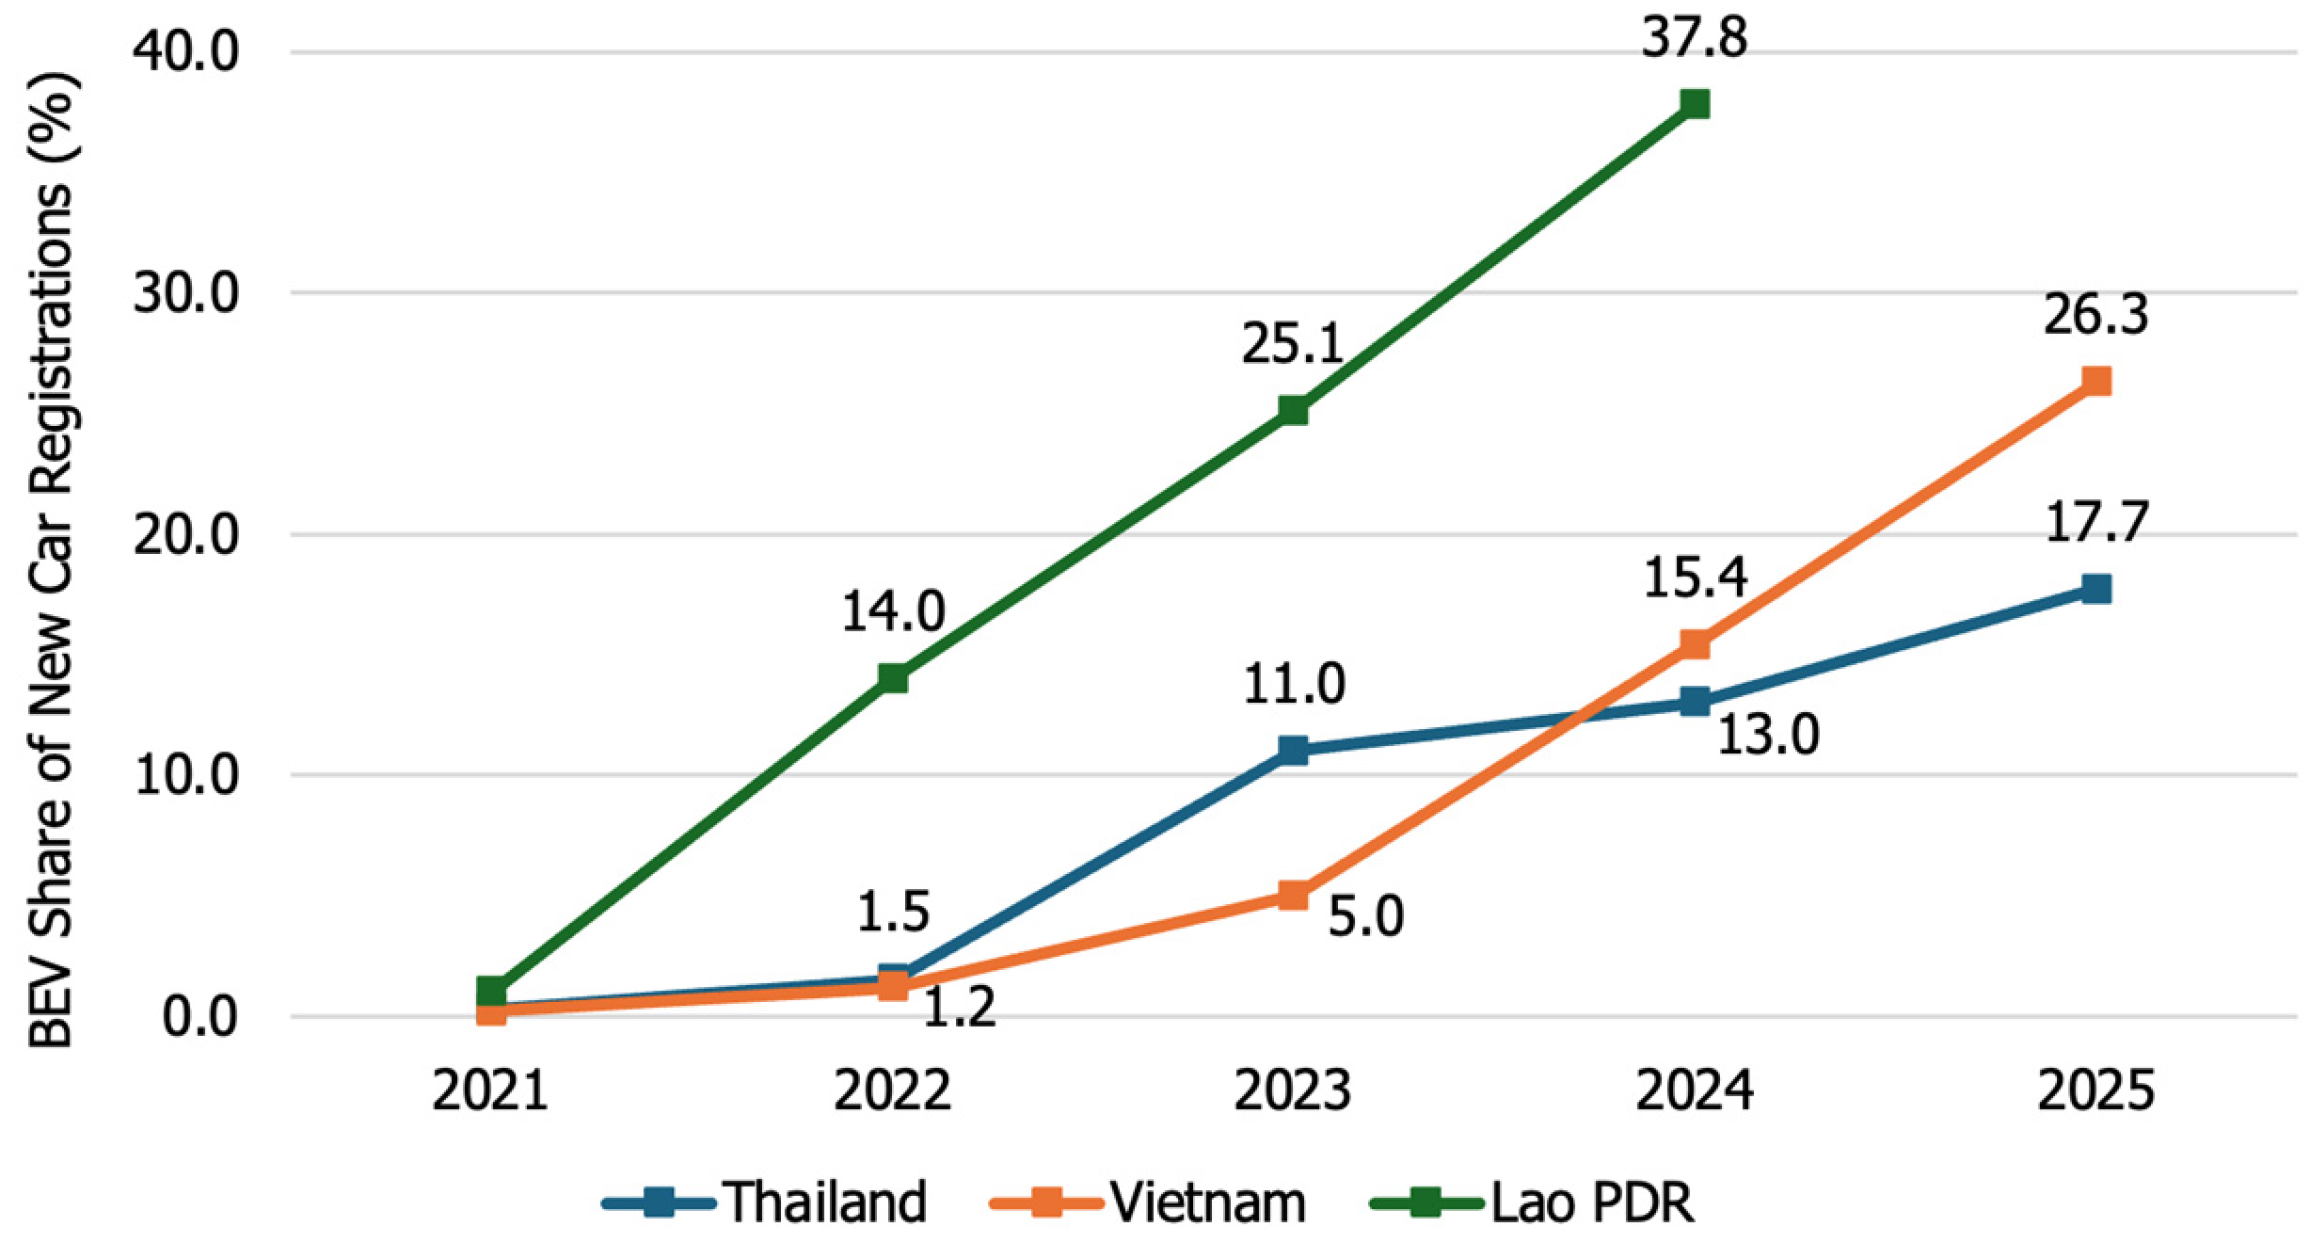
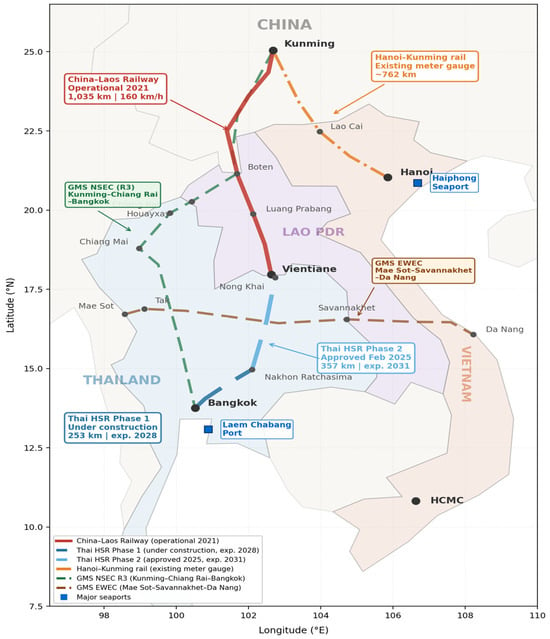
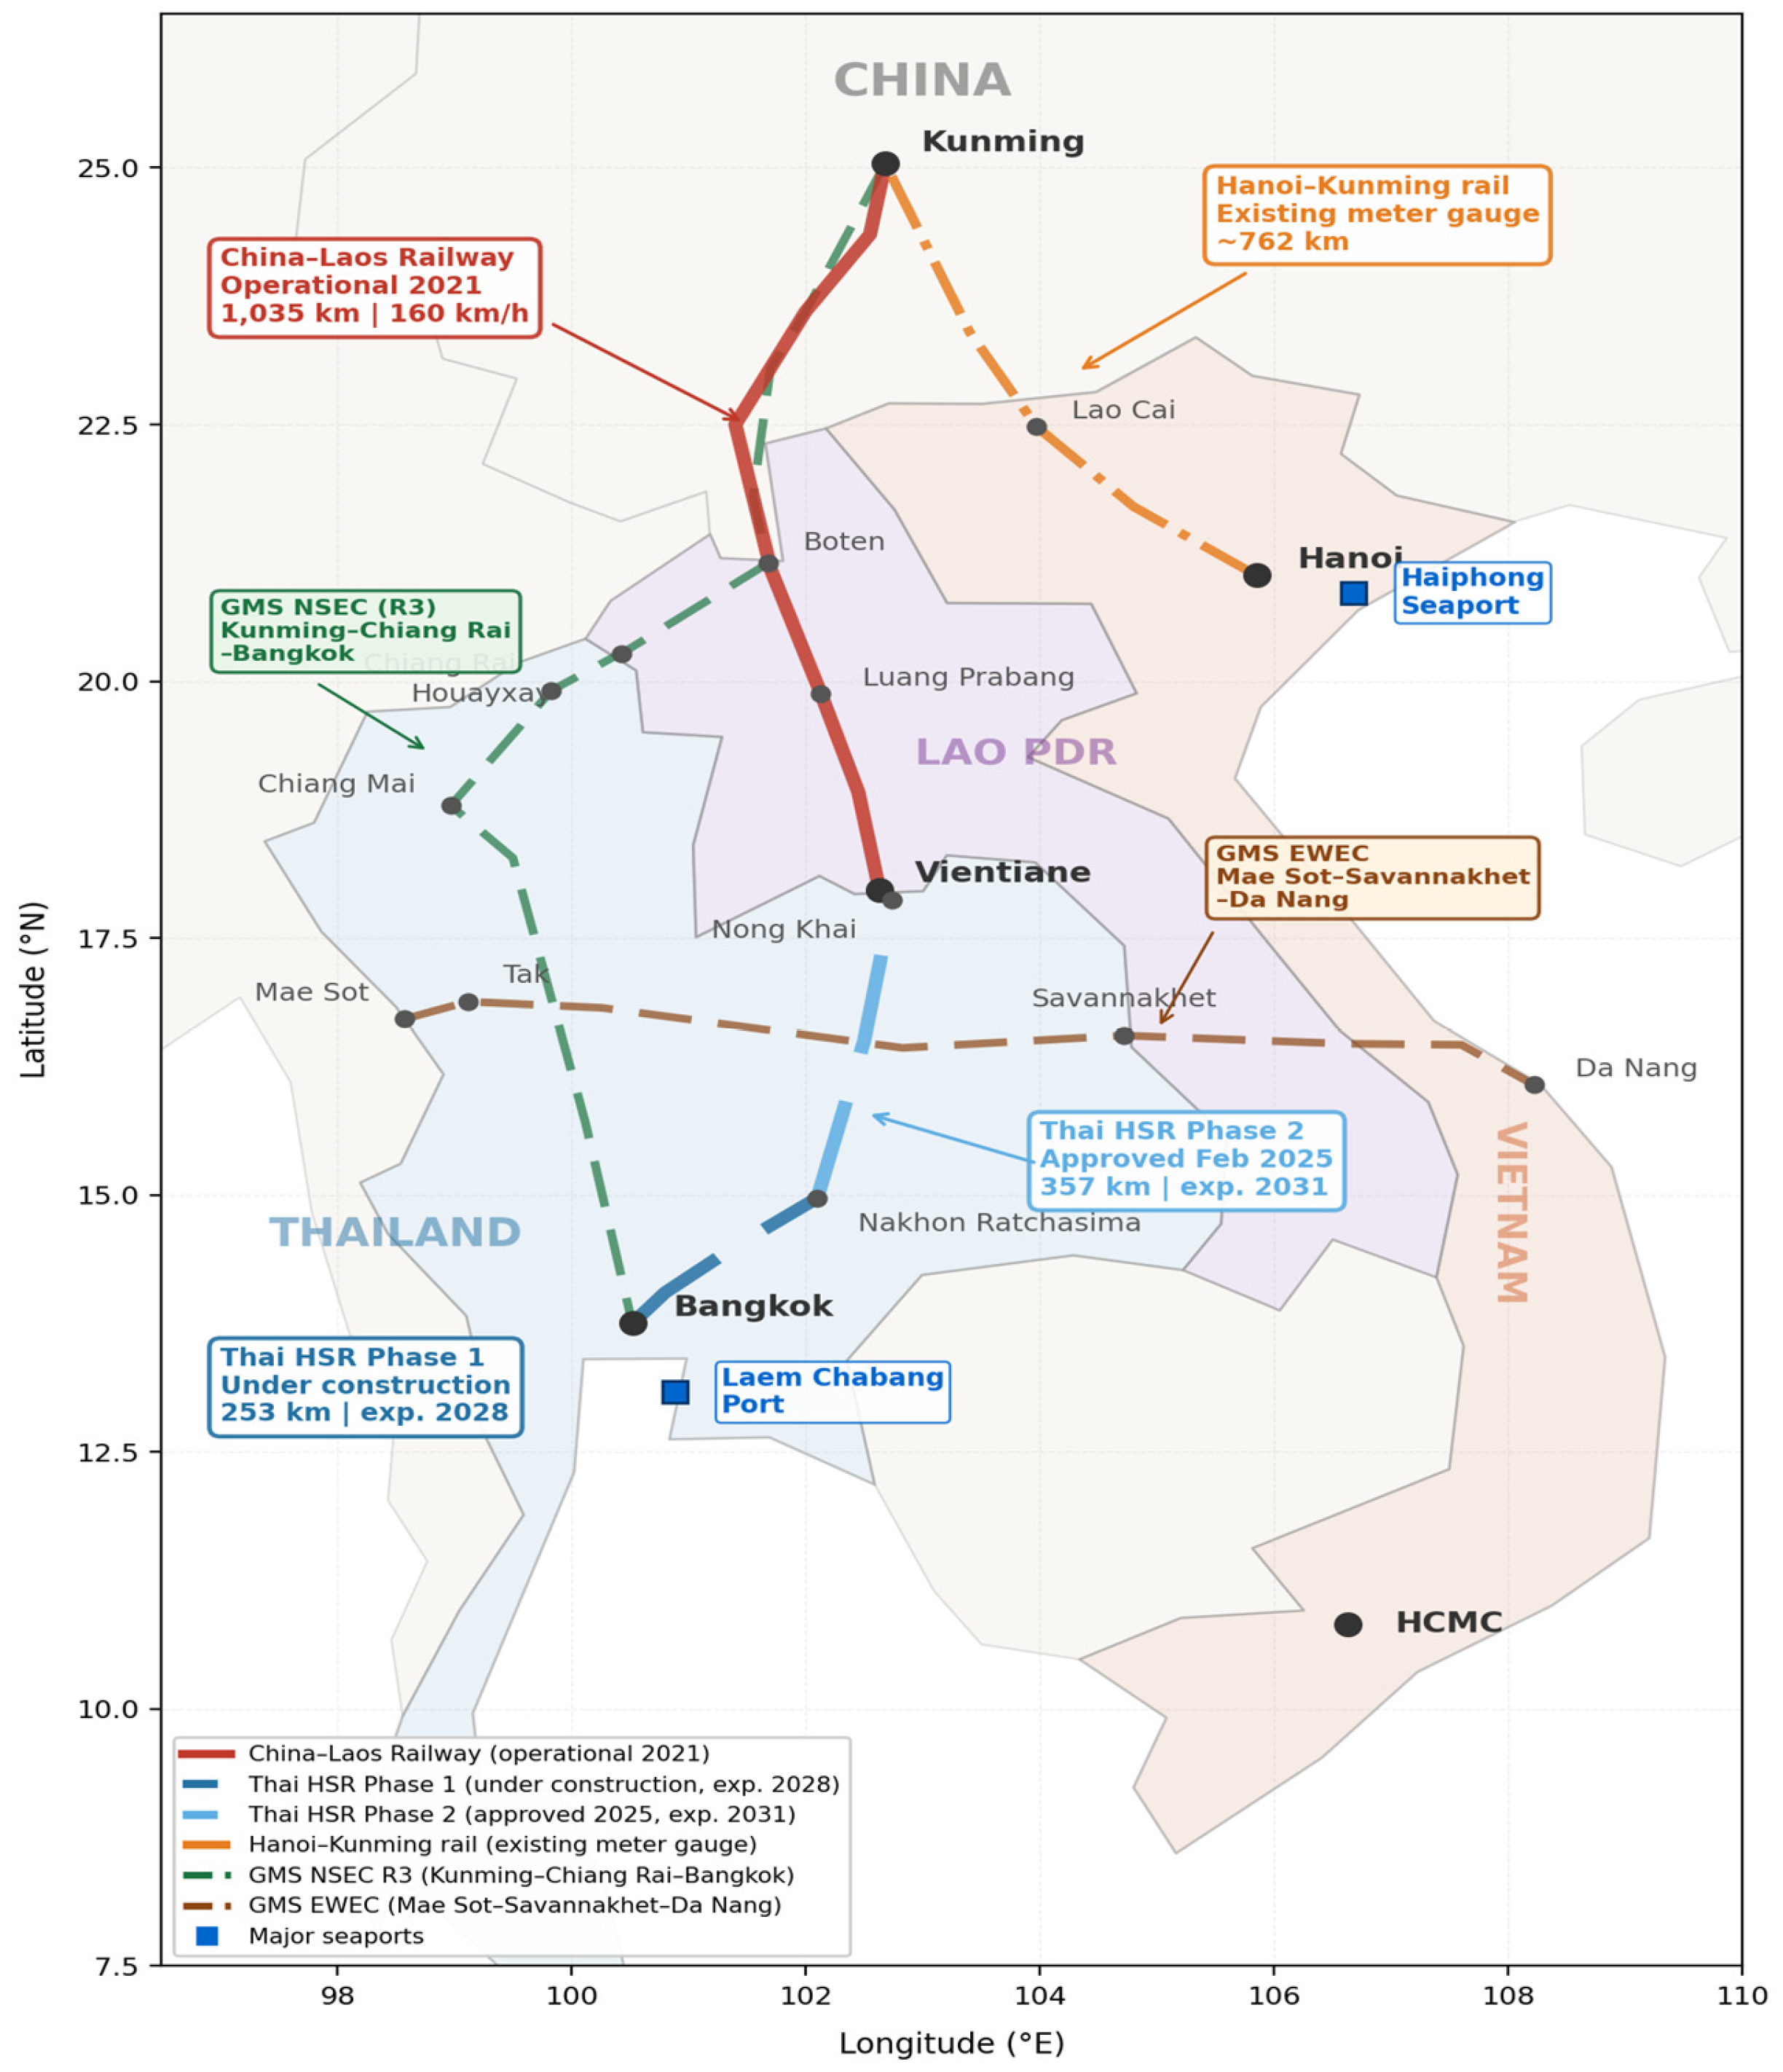
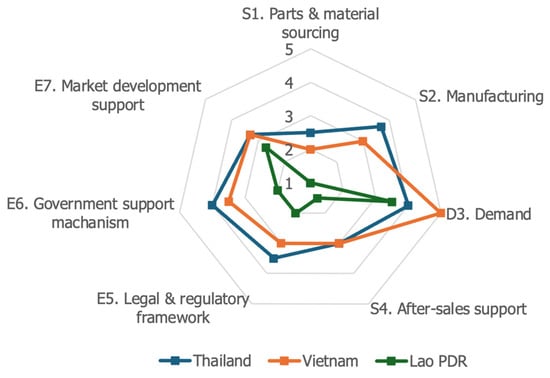
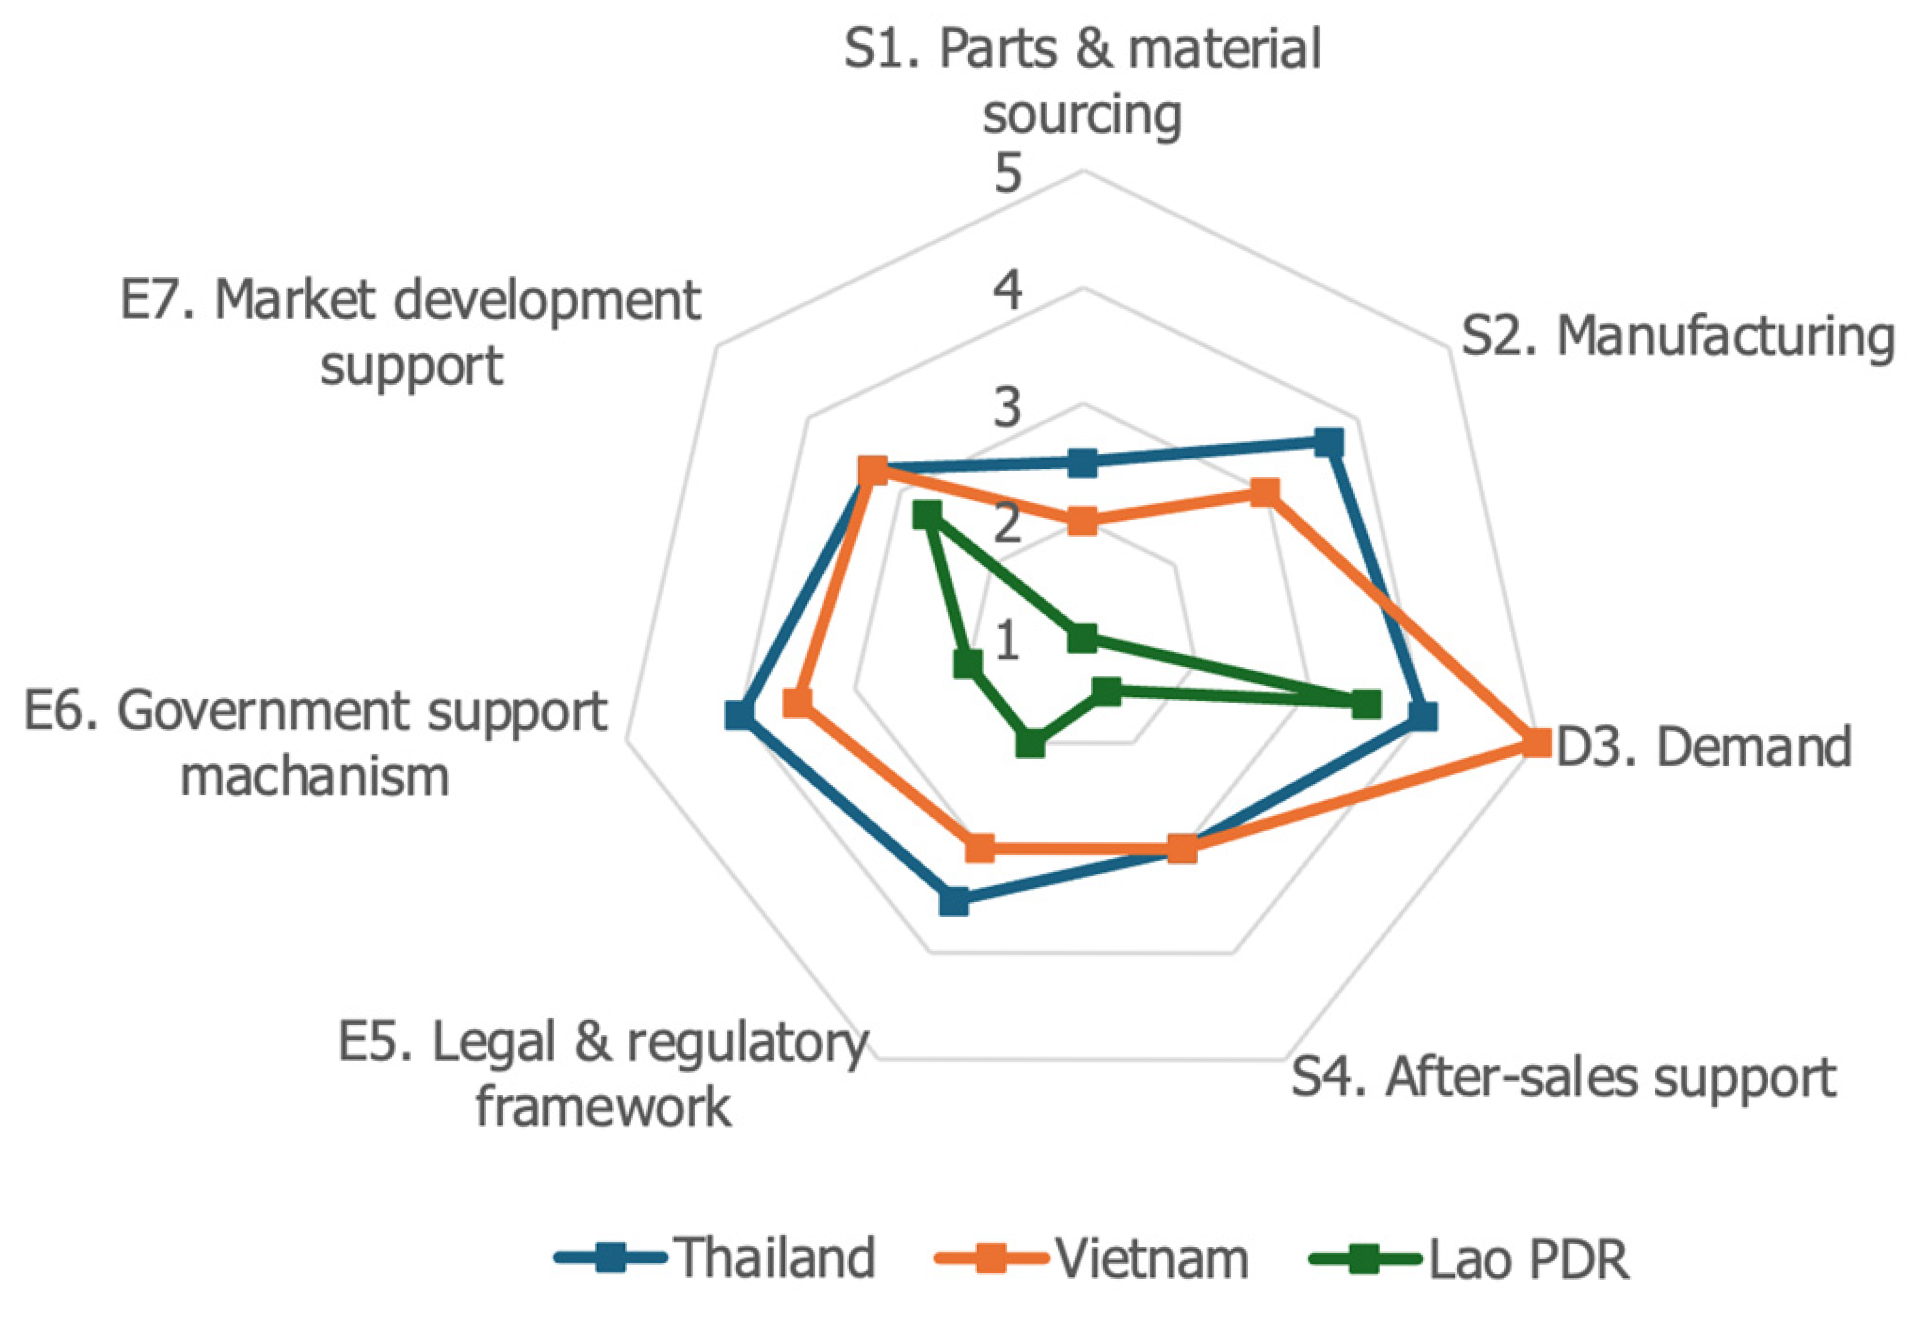
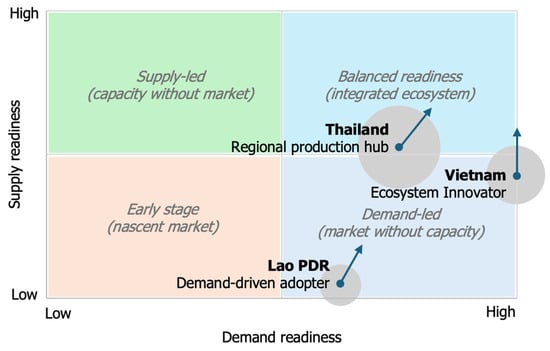
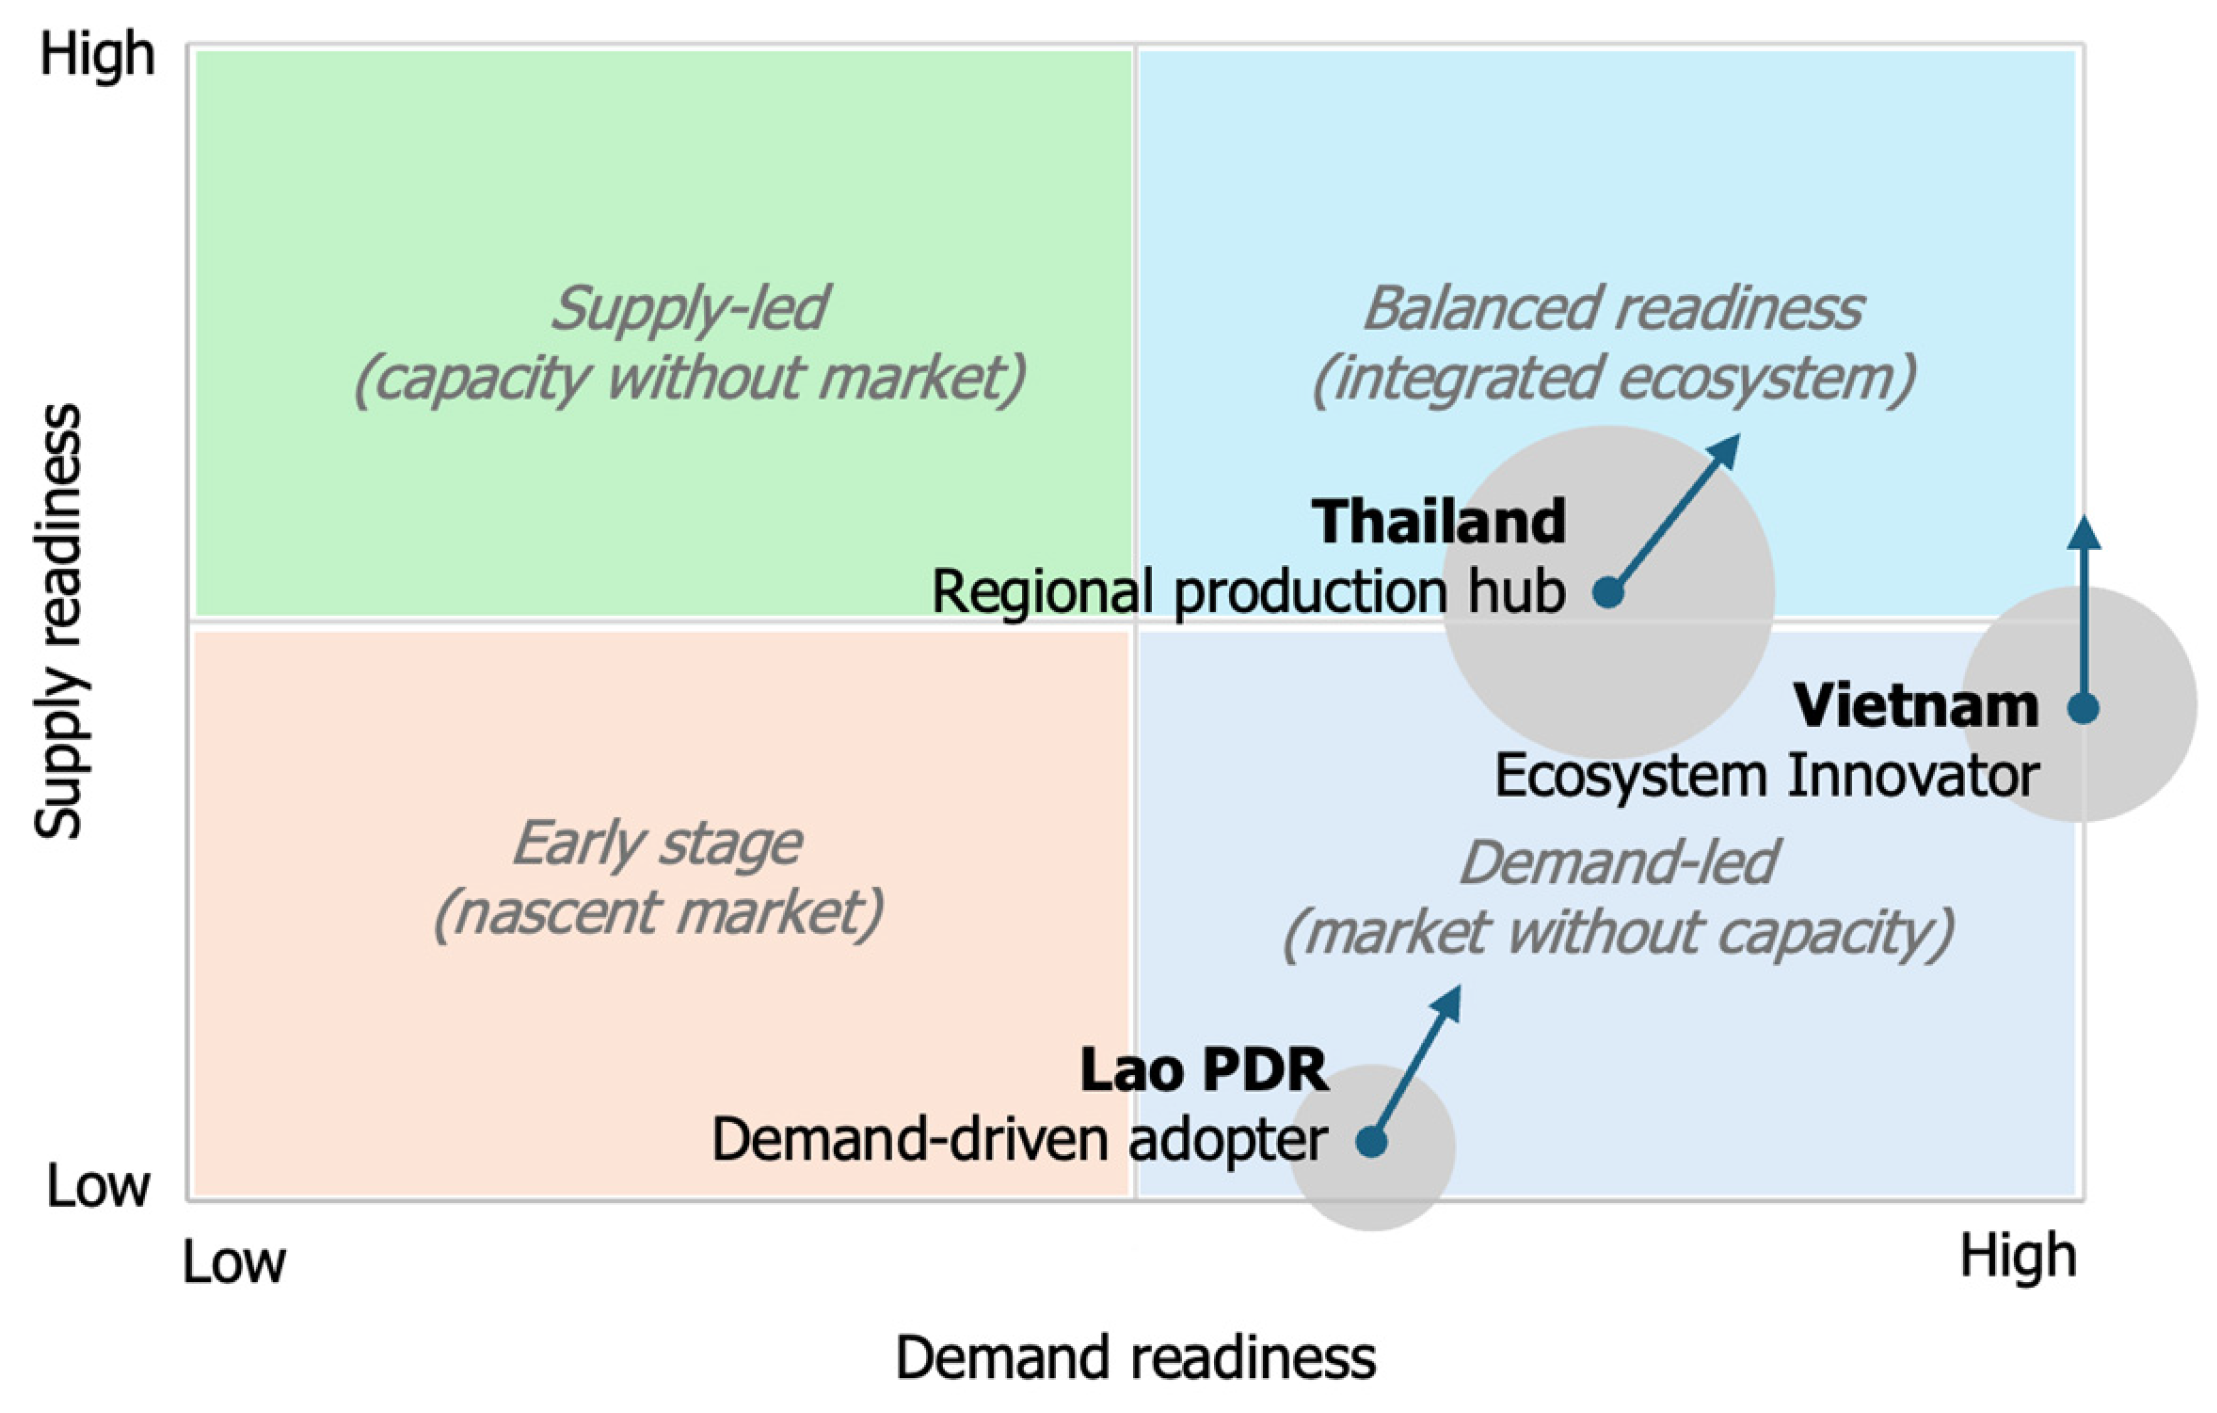

Disclaimer/Publisher’s Note: The statements, opinions and data contained in all publications are solely those of the individual author(s) and contributor(s) and not of MDPI and/or the editor(s). MDPI and/or the editor(s) disclaim responsibility for any injury to people or property resulting from any ideas, methods, instructions or products referred to in the content. |
© 2026 by the authors. Published by MDPI on behalf of the World Electric Vehicle Association. Licensee MDPI, Basel, Switzerland. This article is an open access article distributed under the terms and conditions of the Creative Commons Attribution (CC BY) license.