


Abstract
This study presents a novel methodology for optimizing energy management strategies in heavy-duty Fuel Cell Hybrid Electric Vehicles (FCHEVs) with pantograph charging systems. The approach integrates machine learning (ML) techniques to predict energy demand, optimize the power distribution between the battery and fuel cell, and enhance overall efficiency. The methodology involves clustering vehicle and road data, supervised ML classification, and zonification of routes for adaptive energy management. The proposed system was validated using real-world driving data from five different routes in Germany. The results indicate a significant improvement in hydrogen consumption and fuel cell degradation compared to conventional control strategies. This research establishes a framework for advanced energy management in heavy-duty hydrogen-powered electric vehicles.
1. Introduction
Improving the energy efficiency of electrified road vehicles depends not only on advances at the component level but also on the capability of the Energy Management Strategy (EMS) to adapt power allocation decisions to the driving context. In real operation, traction power demand is determined by the interaction between driver behavior, vehicle dynamics, and route conditions such as traffic, speed variations, and road grade [1,2]. Consequently, EMS approaches based solely on instantaneous signals and fixed heuristics may miss opportunities to improve efficiency and reduce component stress.
In recent years, the rapid evolution of Fuel Cell Hybrid Electric Vehicles (FCHEVs) has been driven by the need to reduce greenhouse gas emissions and improve energy efficiency in transportation systems. Fuel cell systems, when combined with batteries, offer a promising solution for heavy-duty and long-range applications due to their high energy density and fast refueling capabilities [3,4]. However, the hybrid nature of these systems introduces significant challenges in coordinating multiple energy sources under dynamic operating conditions.
These challenges become more significant in heavy-duty Fuel Cell Hybrid Electric Vehicles (FCHEVs), where the EMS must simultaneously minimize hydrogen consumption and mitigate fuel cell degradation caused by transient operation [5,6]. In addition, some heavy-duty electrified architectures incorporate pantograph-based dynamic charging, introducing a third energy source whose availability depends on the road infrastructure. In such systems, the EMS must coordinate fuel cell, battery, and grid power while proactively shaping the battery State-of-Charge (SoC) to exploit electrified road segments [1,7]. This multi-source coordination significantly increases the complexity of energy management.
Recent research trends indicate a transition from purely reactive EMS approaches toward predictive and data-driven strategies. Reinforcement learning, model predictive control, and hybrid ML-based EMS architectures have demonstrated significant improvements in hydrogen consumption and system efficiency [8,9,10,11]. However, these approaches often require extensive training datasets, high computational resources, or full knowledge of future driving conditions, limiting their applicability in real-time heavy-duty scenarios.
The main objective of this work is to develop a predictive Energy Management Strategy for heavy-duty FCHEVs capable of operating under real-world conditions using limited preview information. Specifically, the proposed methodology aims to (i) identify driving patterns through machine learning-based zonification, (ii) enable anticipatory control of the battery State-of-Charge, (iii) coordinate multiple energy sources including fuel cell, battery, and pantograph charging, and (iv) improve hydrogen efficiency while reducing fuel cell degradation.
While recent ML-based EMS approaches, including reinforcement learning and hybrid predictive frameworks, have demonstrated strong performance improvements, they generally rely on large training datasets, high computational resources, or full route knowledge. The proposed methodology distinguishes itself by operating exclusively on two widely available navigation descriptors—mean vehicle speed and road grade—to classify upcoming energetic zones with approximately 92% accuracy. Furthermore, the framework uniquely integrates pantograph-based dynamic charging as a third energy source within a predictive ML-EMS architecture, validated on five real-world heavy-duty routes.
1.1. Limitations of Existing EMS
Energy Management Strategies (EMS) for FCHEVs have evolved significantly in recent years, incorporating rule-based, optimization-based, and learning-based approaches. However, despite these advancements, several fundamental limitations remain, particularly in the context of real-time operation and multi-source energy coordination.
Rule-based and fuzzy logic strategies are widely used due to their simplicity, robustness, and low computational cost. These methods are suitable for real-time implementation but remain inherently reactive, as they rely on instantaneous measurements without anticipating future driving conditions [1,12,13].
Recent studies confirm that deterministic and fuzzy logic EMS approaches provide stable and computationally efficient solutions but lack adaptability under highly dynamic driving conditions [4]. In contrast, real-time implementations of rule-based EMS in experimental vehicles have demonstrated robustness and feasibility but still rely on predefined heuristics without predictive capabilities [14].
Optimization-based approaches such as Dynamic Programming (DP), Pontryagin’s Minimum Principle (PMP), and Model Predictive Control (MPC) can achieve high efficiency but often require full route knowledge and significant computational resources [15,16,17,18].
Recent advances in nonlinear MPC and hierarchical predictive control have demonstrated improved hydrogen economy and enhanced fuel cell lifetime by incorporating system dynamics and degradation constraints into the control formulation [19,20,21]. However, these approaches typically rely on accurate prediction models and impose high computational requirements, limiting their real-time implementation in embedded automotive systems.
Another limitation in the literature is the incomplete integration of fuel cell durability considerations. While hydrogen consumption is frequently optimized, fewer EMS designs explicitly consider degradation mechanisms associated with load cycling and transient operation [22,23,24]. Furthermore, many learning-based EMS studies are validated primarily on standardized driving cycles rather than heterogeneous real-world routes, limiting their generalization capability [1,2].
Learning-based EMS approaches, particularly those based on reinforcement learning and hybrid predictive frameworks, have demonstrated strong potential for adaptive energy management [8,9,10,11]. Nevertheless, these methods often require large datasets, high training complexity, and may exhibit limited interpretability when deployed in real-world applications. In addition, safety-aware and degradation-aware learning strategies remain an active area of research [25,26].
In addition, pantograph-assisted charging is rarely integrated into predictive EMS frameworks. In such systems, the EMS must coordinate fuel cell, battery, and grid power while anticipating both energy demand and charging opportunities along the route [1,7,27]. These limitations motivate the development of predictive and data-driven EMS methodologies capable of using limited route preview information to support real-time decision making.
Heavy-duty fuel cell electric vehicles are currently transitioning from pilot-scale demonstrations to early market deployment. Several industrial initiatives have validated the feasibility of hydrogen-based powertrains for long-haul transport, particularly in applications where battery-electric solutions face limitations due to range and payload constraints.
Major manufacturers such as Daimler Truck, Hyundai, and Toyota have introduced fuel cell-based heavy-duty vehicles in pilot fleets and early commercial programs. These deployments demonstrate the growing interest in hydrogen technologies as a viable solution for decarbonizing heavy-duty transport.
In this context, recent industrial developments further reinforce the relevance of scalable and real-time capable EMS solutions. In particular, projects such as the SeLv initiative led by RWTH Aachen University demonstrate the feasibility of fuel cell-based modular architectures for heavy-duty transport, reinforcing the need for efficient multi-source energy coordination strategies under realistic operating conditions [28].
Table 1 summarizes the main limitations of existing EMS approaches and the contributions addressed in this work.
Table 1.
Overview of EMS families, representative literature, limitations, and contributions addressed by this work.
Building upon these limitations and recent industrial developments, this paper proposes a predictive machine-learning-based methodology that converts limited route preview information—namely road grade and expected vehicle speed—into actionable references for real-time EMS decisions.
The proposed framework is structured in three main stages. First, representative driving patterns are extracted from real-world data using unsupervised learning techniques, allowing the identification of homogeneous energetic behaviors. Second, these patterns are used to train a supervised learning model capable of predicting upcoming energetic zones based on limited preview information. Finally, the predicted zones are integrated into a predictive EMS that coordinates fuel cell, battery, and pantograph energy sources under dynamic operating conditions.
This predictive zoning approach enables anticipatory energy management decisions by incorporating future driving conditions into the control strategy. As a result, the EMS improves hydrogen efficiency, reduces harmful transient operation of the fuel cell, and maintains real-time feasibility under realistic route variability.
1.2. Contributions of the Study
The main contributions of this work can be summarized as follows.
First, a predictive zoning methodology for real driving conditions is introduced. The proposed machine-learning pipeline combines clustering, classification, and segmentation techniques to identify homogeneous energetic zones, enabling anticipatory characterization of route-dependent energy demand.
Second, the proposed framework integrates limited preview information into EMS decision making. By using only two input variables—mean vehicle speed and road grade—the model achieves a classification accuracy of approximately 92%, demonstrating that effective prediction can be achieved with minimal data requirements.
Third, the predictive EMS significantly improves hydrogen economy. Simulation results show a reduction in hydrogen consumption of approximately 26% compared to a heuristic-only controller, highlighting the benefits of anticipatory control.
Fourth, the proposed methodology contributes to reducing fuel cell degradation. By smoothing power demand and avoiding abrupt load variations, the predictive EMS reduces the degradation index by approximately 25%, improving system longevity.
Fifth, the framework is validated using real-world driving data and a heavy-duty FCHEV simulation platform. The machine-learning stage is trained on experimental datasets, while the EMS performance is evaluated across five representative real-world routes.
Sixth, the methodology improves the utilization of pantograph-based charging. The predictive EMS proactively creates battery headroom prior to electrified segments, enabling more effective absorption of grid-supplied energy.
Finally, the proposed approach is controller-agnostic. The predictive module can be integrated with different EMS architectures, including rule-based, heuristic, or optimization-based strategies, enhancing their performance without increasing computational complexity.
2. Methodology Description
2.1. System Overview
Figure 1 summarizes the complete pipeline developed in this work, illustrating how data-driven prediction modules interface with the Energy Management Strategy (EMS) of a heavy-duty FCHEV equipped with a pantograph. The architecture is organized into two main layers: a Machine-Learning (ML) preview layer that converts heterogeneous information into predictive descriptors of the upcoming route, and a predictive EMS layer that uses these descriptors to anticipate energy demand, allocate power sources, and prepare the system for dynamic charging opportunities.
Figure 1.
Integrated ML-based methodology for predictive energy management in fuel cell hybrid electric vehicles.
2.1.1. Machine-Learning Preview Layer
The first stage of the architecture is built from real driving data recorded on representative routes. Vehicle speed, acceleration, road grade, power demand, and geospatial coordinates are processed to construct a high-dimensional representation of the driver–vehicle–environment system. A clustering stage groups road segments based on similarity in energetic behavior, creating three canonical zone types that represent low-, medium-, and high-demand operating conditions. These clusters encode the underlying energetic structure of the route and serve as the foundation for predictive analysis.
Since only partial preview information is available for future road segments—specifically mean speed and road elevation—these two descriptors are used as inputs to an ML classifier. The model assigns each upcoming segment to one of the previously learned energetic zones. This classification acts as a compression mechanism: rather than predicting a full high-resolution power trajectory, the system predicts a discrete zone whose statistical descriptors (mean power, expected energy use, regenerative potential) represent the expected dynamics of the segment. This preserves predictive capability while maintaining computational tractability in real time.
The final element of the preview layer is the construction of a zonified route map, where each future segment is associated with its predicted energetic zone. This map serves as a compact, georeferenced representation of the road ahead and enables the EMS to compute long-horizon strategies without requiring detailed cycle-level forecasts.
2.1.2. Predictive EMS Layer
The lower layer of the architecture integrates the preview information into the EMS. The predicted zone sequence determines two key elements of the controller:
- Dynamic SoC planning: Each zone has an associated expected power profile. High-demand zones lead the EMS to increase fuel cell output or preemptively discharge the battery. Low-demand zones allow charging or power-saving operation. This produces a dynamic SoC reference that adapts to the upcoming route.
- Power-split decision scheduling: Using the predicted zone-level mean power, the controller adjusts the contribution of the fuel cell and battery. In particular, the presence of a pantograph requires creating battery headroom before catenary segments. Preview-based SoC planning enables the controller to pre-discharge the battery so that the maximum possible energy is captured when overhead charging becomes available.
The integration of ML-derived preview and EMS decision making yields a controller capable of anticipating energetic transitions rather than reacting to instantaneous demand. This directly reduces hydrogen consumption, limits fuel cell transients, and improves regenerative braking utilization, as validated experimentally in Section 4.
2.2. Vehicle Architecture and Models
An experimental testing phase was conducted using a Battery Electric Vehicle (BEV) prototype. This vehicle, a modified FAW-G60 at the Center for Automotive Mechatronics Research (CIMA) at Tecnológico de Monterrey in Toluca, Mexico, was used to validate the machine learning phase of the method and evaluate its precision. The BEV features an electric powertrain consisting of a 72-volt three-phase induction motor, a 5-speed gearbox, and a mechanical differential. Detailed information on the motor and battery is provided in a table, and the powertrain architecture is illustrated in a diagram.
Simultaneously, a heavy-duty truck simulation model was developed using real driving data from five routes in Germany to assess the driving cycle of the model. This model calculates the energy requirements and power profile needed, validating the heavy duty truck energy management strategy through simulation and the results of machine learning predictions.
The powertrain parameters listed in Table 2 correspond to a conceptual heavy-duty FCHEV design representative of next-generation hydrogen-powered long-haul trucks. The specifications are consistent with publicly available data from comparable platforms and industrial development programs, including the SeLv project at RWTH Aachen University [28]. These values define a technically plausible and internally coherent configuration used for simulation-based validation.
Table 2.
Main specifications of the heavy-duty truck powertrain using hydrogen fuel cells and pantograph.
Figure 2 presents the layout of the simulated powertrain architecture of heavy-duty trucks. The figure highlights the integration of key components, including hydrogen tanks, fuel cell stacks, battery pack, and electric motor with gearbox. The hydrogen tanks are mounted vertically behind the cab, allowing a total onboard storage capacity of 35 kg, distributed across six 237 L tanks. Fuel cell systems are placed on the chassis frame and work in conjunction with the battery system to power the electric motor. This configuration represents a hybrid electric–hydrogen setup designed to improve range and operational flexibility, particularly for long-haul freight applications where energy demand is high.
Figure 2.
Simulated heavy-duty truck equipped with hydrogen fuel cells, battery system, electric motor, and onboard hydrogen storage tanks.
Table 2 summarizes the main specifications of the heavy-duty truck powertrain architecture based on hydrogen fuel cells and a pantograph-assisted charging system. The vehicle has a gross weight of 8500 kg and features a dynamic wheel radius of 0.507 m with a frontal area of 12 m2, which directly affects aerodynamic resistance. The powertrain includes a 360 kWh battery with a nominal voltage of 630 V, supplying up to 250 kW of power. The hydrogen system consists of two fuel cell stacks delivering a combined 180 kW, with a total hydrogen storage capacity of 35 kg distributed across six 237 L tanks. Additionally, the pantograph system provides 40 kW of power at 620 V to support partial dynamic charging. The electric motor is rated at 140 kW, drawing a peak current of 225 A. These specifications provide the foundation for modeling and simulating vehicle performance, energy management strategies, and range estimation under different operating conditions.
Figure 3 illustrates the efficiency map of the electric motor operating at a nominal voltage of 750 V. The map presents the efficiency as a function of motor speed (rpm) and torque (Nm). The highest efficiency regions, exceeding 90%, are concentrated in the mid-to-high speed and low-to-moderate torque zones, which correspond to typical operating conditions during steady-state cruising. Conversely, efficiency drops below 70% at very low speeds and high torque demands. This contour map is essential for optimizing energy consumption in real-time control strategies and drive cycle simulations.
Figure 3.
Electric motor efficiency map at 750 V operating voltage.
Figure 4 shows the characteristic curves of the hydrogen fuel cell, depicting both the system efficiency and hydrogen consumption rate as a function of power output. The fuel cell exhibits a peak efficiency of approximately 42% around 20–30 kW and maintains relatively stable performance up to 45 kW, after which efficiency begins to decline. The hydrogen consumption rate increases non-linearly, reaching approximately 1.12 g/s at 60 kW. These curves are crucial for accurately modeling the fuel consumption and thermal management requirements of the hydrogen-based powertrain under various load conditions.
Figure 4.
Characteristic curves of a hydrogen fuel cell showing the system efficiency and hydrogen consumption rate as a function of power output.
The fuel cell model employed in this study is based on a semi-empirical efficiency map that relates FC output power to hydrogen mass flow rate, as illustrated in Figure 4. The model captures the key nonlinearities of PEM fuel cell operation: peak efficiency of approximately 42% at 20–30 kW, and declining performance at higher loads due to increased ohmic and mass-transport losses.
While this formulation does not resolve the internal electrochemical dynamics described by voltage-based models incorporating activation, ohmic, and concentration overpotentials [29], it provides sufficient fidelity for supervisory EMS design and energy balance evaluation. The key model parameters—nominal stack voltage (630 V), maximum current (280 A per stack), and rated power (90 kW per stack)—are consistent with commercially available 90 kW PEM stack configurations and are listed in Table 2.
Vehicle/EMS-Mode Simulation Environment
The vehicle model is composed of several interconnected modules, each with a specific role: the route data input (1), the longitudinal driver model (2), the vehicle dynamics model (3), the machine-learning predictions data input (4), the pantograph module (5), the fuel cell, battery, and power-split controllers (6), the energy models and power distribution module (7), and the data recording and export module (8). Figure 5 illustrates the full development of this simulation environment implemented in MATLAB/ Simulink® version R2022b, where each module is represented as a functional block within the system-level modeling framework.
Figure 5.
Vehicle/EMS-model simulation environment in Simulink® developed for this work.
The simulation starts with Module 1, where route data—including a time-based speed profile and a position-based road-grade profile—is loaded. The road grade is obtained through a lookup table based on the vehicle’s traveled distance, allowing the simulation to determine the corresponding slope at each position. For validation of the proposed energy prediction and management strategy, five different real-world routes were used.
Next, Modules 2 and 3 compute the instantaneous power requirements based on vehicle dynamics and driver behavior, determining the torque and speed demanded by the electric motor. These mechanical values are then converted into electrical power using motor efficiency maps and characteristic curves, see Figure 3. The simulated system represents a heavy-duty truck, enabling the evaluation of the energy management system’s performance under various operational scenarios.
2.3. Data Sources and Routes
The proposed methodology was evaluated using real-world driving data collected from an instrumented heavy-duty FCHEV operating on public roads. The dataset integrates synchronized information from the vehicle CAN bus, onboard sensors, and navigation systems. All measurements were timestamp-aligned to enable consistent machine learning processing and EMS evaluation.
2.3.1. Vehicle Signals
The dataset includes physical, energetic, and geospatial signals obtained from the vehicle CAN bus and the onboard data acquisition platform. These variables provide the input domain for clustering, classification, energy prediction, and EMS analysis.
- Vehicle speed;
- Longitudinal acceleration;
- Road grade (from GPS/altimetry);
- Traction motor power;
- Fuel cell power;
- Battery power;
- Battery State of Charge (SoC);
- Hydrogen consumption rate;
- Regenerative braking power;
- GPS position (latitude, longitude);
- Timestamp.
These signals allow the ML models to characterize the energetic behavior of the driver–vehicle–environment system and serve as the basis for clustering and zonification.
2.3.2. Route Information
For future (unseen) road segments, only two preview descriptors are available: the average vehicle speed obtained from the navigation service and the elevation profile derived from map-based altitude data.
The selection of mean vehicle speed and road grade as the sole preview descriptors is grounded in longitudinal vehicle dynamics theory. Traction power demand is primarily governed by aerodynamic drag, which scales quadratically with speed, and gravitational resistance, which is linearly proportional to road grade. These two variables therefore capture the dominant energetic contributions of any road segment. Furthermore, both descriptors are consistently available from commercial navigation systems for future, unseen road segments, unlike instantaneous on-board signals that are inaccessible for preview.
Although this preview information has relatively low resolution, it contains sufficient structure to classify upcoming segments into energetic zones and estimate expected power demand. This approach avoids the need for high-fidelity long-horizon predictions typically required in classical look-ahead EMS frameworks [30,31], while still enabling anticipatory control.
2.3.3. Test Routes
The dataset includes five representative real-world routes driven multiple times to ensure statistical robustness. As shown in Figure 6, these routes exhibit diverse traffic conditions, speed profiles, and topographic variations, allowing the ML models and EMS to be evaluated under heterogeneous operating scenarios.
Figure 6.
Germany routes studied.
Figure 7 presents the speed-time profiles for the five test routes used in this study. Key speed statistics are annotated for each route, including mean speed, maximum speed, and standard deviation. Route 1 (Aachen–Frankfurt, 280 km) exhibits a mean speed of approximately 78 km/h with peaks up to 90 km/h during highway segments. Route 5 (Aachen–Weisweiler, 35 km) shows lower mean speed (∼42 km/h) and higher variability, representative of urban driving. These profiles confirm the diversity of operating conditions used for ML training and EMS validation.
Figure 7.
Speed-time profiles for the five test routes, with annotated mean speed, maximum speed, and standard deviation values for each route.
The selected routes represent typical operating conditions encountered by long-haul heavy-duty trucks in Western Germany, including urban traffic, highway cruising, and routes with significant elevation changes.
2.3.4. Description of Test Routes
Route 1: Aachen–Dortmund–Kassel–Frankfurt
A long-distance corridor combining urban exits, extended highway cruising, and mountainous terrain. The route includes significant grade variations and sustained driving segments, making it suitable for evaluating fuel cell performance under high demand.
Route 2: Aachen–Bremen
A predominantly highway-based route characterized by long steady-speed segments and moderate traffic density. It allows evaluation of energy efficiency during steady-state operation.
Route 3: Frankfurt–Koblenz–Cologne–Aachen
A mixed urban–intercity route including the Rhine Valley corridor, characterized by moderate grades and frequent speed variations. It provides a representative scenario for evaluating ML-based zone classification.
Route 4: Aachen–Cologne–Aachen
A medium-length loop connecting two major urban areas. The route combines suburban roads, highway sections, and dense urban traffic.
Route 5: Aachen–Weisweiler
A short regional route including suburban traffic and moderate elevation variations. Despite its shorter length, it provides useful insight into short-term energetic fluctuations.
Table 3 summarizes the main characteristics of the routes considered in this study.
Table 3.
Summary of real-world test routes.
The diversity of these routes ensures that the ML models and EMS are evaluated across different driving conditions, including stop-and-go traffic, highway cruising, and varying topography. The combination of high-resolution vehicle measurements and low-resolution preview information enables reproducible ML training and robust evaluation of the proposed predictive EMS methodology.
Regarding the diversity of driving conditions and geographical scope, the experimental test drives were strategically conducted within the North Rhine Westphalia and Rhineland Palatinate regions of Germany. While these areas are topographically characterized as relatively flat, the dataset was specifically designed to prioritize the evaluation of energy management under high frequency transient demands. Specifically, Routes 3 and 5 included significant urban segments through the cities of Aachen, Weisweiler, Mainz, and Koblenz, capturing the impact of urban congestion and stop and go patterns on the fuel cell system efficiency. The logistical constraints of operating a heavy duty prototype limited the broader testing to these regions, but the proposed methodology relying on a zone-based classification architecture is inherently terrain-agnostic. This ensures that the framework can be generalized to more aggressive elevation profiles, such as steep mountain slopes, by integrating the corresponding topographical features into the predictive model.
2.4. Feature Engineering and Preprocessing
The preprocessing pipeline transforms raw vehicle signals into a compact and physically meaningful representation suitable for clustering and classification. The process incorporates temporal windowing, normalization, and dimensionality reduction. Figure 8 and Figure 9 illustrate the structure and variance properties of the engineered feature space.
Figure 8.
Variance analysi and dimensionality reduction results. (a) Pareto chart showing the percentage of variance explained by the principal components obtained from PCA using normalized data. (b) Pareto distribution of eigenvalues obtained from classical multidimensional scaling (MDS), indicating the contribution of each dimension in the transformed multidimensional space. (c) Variance explained by the principal components obtained from PCA applied to the unnormalized dataset.
Figure 9.
Dimensionality reduction and clustering analysis of the driving dataset. (a) Three-dimensional visualization of the first three principal component scores obtained from Principal Component Analysis (PCA) applied to the unnormalized dataset. (b) Clustering results using a Gaussian Mixture Model (GMM) after dimensionality reduction with PCA, showing the separation of the data into three clusters. (c) k-Means clustering results applied to the PCA-transformed data, illustrating the distribution of samples among clusters in the reduced feature space. (d) Cluster visualization obtained with k-Means after PCA dimensionality reduction, highlighting the grouping of driving patterns into low-, medium-, and high-power clusters. (e) Histograms of vehicle energy performance (Wh/m) corresponding to the three identified zone types. (f) Boxplot of watt-hour per meter values for the three zone types showing the statistical distribution of energy consumption.
2.4.1. Temporal Windowing
Raw measurements—vehicle speed, acceleration, road grade, traction power, fuel cell power, battery power, SoC, braking energy, and GPS position—are segmented into sliding temporal windows. Each window produces statistical descriptors such as mean, standard deviation, extrema, and energy-related aggregates. For a signal , window-level features are computed as:
This representation captures short-term driving dynamics while smoothing high-frequency noise, enabling the ML models to generalize across routes.
2.4.2. Normalization
Because the engineered features possess different magnitudes and units, normalization is applied to stabilize the learning algorithms. Each feature is standardized as:
This ensures that high-amplitude variables, such as traction power, do not overshadow lower-scale signals, such as jerk or grade, during clustering and PCA.
2.4.3. Dimensionality Reduction with PCA and MDS
After normalization, the dataset remains highly correlated. To reveal its structure and reduce redundancy, both Multidimensional Scaling (MDS) and Principal Component Analysis (PCA) are applied.
Figure 8 shows the MDS eigenvalue Pareto distribution, demonstrating that only a small number of dimensions capture meaningful variance. Also, it presents the percentage of total variance explained by the first PCA components, confirming that most of the information lies in a very low-dimensional subspace.
Most notably, Figure 8 shows that the first PCA component explains 99.9% of the variance, indicating extreme correlational structure in the dataset and providing theoretical justification for using low-dimensional clustering and classification.
Finally, Figure 9 visualizes the data in the first three PCA dimensions, revealing clear separability between operating patterns and validating the suitability of PCA for subsequent clustering.
Together, the feature engineering steps produce a stable, compact, and interpretable dataset that enables accurate clustering, robust classification, and reliable prediction of energy demand. The dimensionality analyses in Figure 8 and Figure 9 demonstrate that the dataset is fundamentally low-dimensional, allowing the ML pipeline to achieve strong predictive performance with minimal computational overhead.
2.5. Unsupervised Learning (Clustering)
After normalization and dimensionality reduction, the preprocessed dataset is analyzed through unsupervised learning to discover natural structure in the vehicle’s energetic behavior. The goal of this stage is to group instantaneous driver–vehicle states according to similarity in their energetic characteristics, enabling the definition of meaningful “zone types’’ that serve as the basis for subsequent classification and prediction tasks.
2.5.1. Gaussian Mixture Model (GMM)
The primary clustering method evaluated is the Gaussian Mixture Model (GMM), implemented as a Gaussian Mixture Distribution Model (GMDM). GMM was selected for its ability to model heterogeneous, non-spherical clusters and accommodate the wide range of magnitudes present in the feature space. To avoid ill-conditioned covariance matrices, the data was preprocessed to reduce correlation.
The resulting clustering is shown in Figure 9. The GMM consistently identifies three dominant classes:
- Low/zero-speed samples: Represent standstill or negligible motion.
- Low–medium power samples: Cover moderate driving and flat terrain.
- High-power samples: Correspond to acceleration events or high slope demand.
These clusters partition the energetic operating domain into interpretable categories linked to the vehicle’s instantaneous energy use.
2.5.2. Cluster Count and Selection
Both GMM and k-Means were tested using the same PCA-reduced feature set. The k-Means results, shown in Figure 9, also converge consistently to three clusters. This agreement across two fundamentally different algorithms reinforces the physical validity of the grouping.
The index separation is strongly driven by the mean power dimension, which dominates the PCA projection. As a result, the natural number of clusters aligns with three fundamental energetic regimes: low, medium, and high power.
2.5.3. Clustering Hyperparameters and Quality Validation
For the Gaussian Mixture Model (GMM), the number of components was set to K = 3, selected based on the Bayesian Information Criterion (BIC) and the Akaike Information Criterion (AIC), both of which reached a minimum at K = 3 after evaluating K ∈ 2, 3, 4, 5.
The covariance type was set to ‘full’ to allow unconstrained cluster shapes, and the model was initialized using k-means++ to improve convergence. For k-Means clustering, the Euclidean distance metric was used in the PCA-reduced feature space, with k = 3 clusters and 10 random restarts to avoid local minima. Cluster quality was assessed using the Silhouette Coefficient (SC) and the Davies-Bouldin Index (DBI).
The GMM configuration achieved SC = 0.74 and DBI = 0.48, confirming well-separated and compact clusters. The consistency of results between GMM and k-Means, shown in Figure 9, further validates the robustness of the three-cluster solution.
2.5.4. Physical Interpretation of Clusters
A key advantage of clustering is the ability to project the labels back onto the geographical route, revealing contiguous segments with similar energetic characteristics. These segments form the basis of the concept of “zones”.
Each cluster corresponds to consistent ranges of:
- Average power demand;
- Energy-per-distance performance;
- Terrain and speed patterns.
Figure 9 shows the distribution of energy efficiency and mean power for each cluster class. The median values naturally separate into Low-power zone, Medium-power zone, and High-power zone.
This structure confirms that the clustering captures physically meaningful patterns rather than statistical artifacts.
2.5.5. Definition of a “Zone Type”
A zone type is defined as a contiguous segment of the route whose samples belong to the same cluster class. Because adjacent samples frequently fall into the same cluster, zones emerge naturally along the spatial trajectory of the vehicle.
Each zone type is characterized by:
- Representative mean power level;
- Representative energy-per-distance value;
- Consistent local driving scenario (urban stop-and-go, cruise, steep ascent).
These attributes are later used as base values for predicting future energy demand when only road grade and average route speed are available.
2.6. Supervised Learning (Prediction)
Once the clusters are defined during the unsupervised learning stage, they are used to train a supervised classifier capable of predicting the zone type of the upcoming road using only road grade and expected speed; these two variables are selected because they are readily available from commercial navigation services, making the prediction framework deployable in real-world FCHEVs.
2.6.1. Final Classification Algorithm
A total of 19 supervised learning algorithms were benchmarked using the preprocessed and clustered dataset. Each algorithm was trained to map {road grade, speed} to a zone-type label, which encapsulates characteristic power and energy performance for that segment of the route.
Although several models achieved high performance, the top-performing classifier was a custom ensemble of decision trees (Bagged Trees), followed closely by weighted KNN variants. The supervised classification stage is responsible for predicting the energetic context of the future road and enabling the EMS to adjust its behavior proactively.
2.6.2. Inference Time (Prediction Speed)
Because the EMS requires fast, continuous predictions during operation, inference speed is a critical metric. The thesis reports prediction speeds across several orders of magnitude, depending on model complexity. Among all methods, weighted KNN achieved the fastest performance:
- Prediction speed = 43,000 observations/s;
- Training time = 1.08 s.
Bagged Trees also exhibit excellent prediction speed (57,542 obs/s), making them suitable for real-time onboard implementation.
To further support the real-time feasibility of the proposed predictive module, additional computational performance metrics were evaluated. On the host test platform, an ASUS ROG Zephyrus GA401Q, the trained Custom Tree classifier, achieved a prediction throughput of 974,515 observations/s, corresponding to an average inference latency of approximately 1.03 μs per sample. Although direct deployment on a production automotive ECU was outside the scope of this study, the memory demand of the single-tree classifier is estimated to be in the range of only a few tens of kilobytes, remaining below 100 kB. This memory requirement is substantially lower than the resources typically available in embedded automotive controllers. These results indicate that the proposed predictive module has very low computational demand and is suitable for real-time implementation.
2.7. Zonification
The transition from pointwise machine-learning predictions to actionable inputs for an EMS requires converting instantaneous class labels into coherent, spatially continuous segments along the route. This segmentation process constitutes a key bridge between data-driven prediction and control-oriented decision making.
2.7.1. From Pointwise Predictions to Route Segments
After the supervised classifier assigns a zone-type label to each sample along the upcoming route (based on the available preview descriptors), the predicted label sequence is projected onto the geographical trajectory. Because consecutive samples often share the same class, extended homogeneous stretches emerge naturally; the zonification algorithm detects these stretches and groups them into zones, as illustrated in Figure 10.
Figure 10.
Zonified routes.
Operationally, zonification converts the pointwise prediction vector into a compact piecewise-constant representation by:
- Scanning the predicted class sequence in order;
- Detecting class-change boundaries;
- Aggregating consecutive samples with the same label into a segment; and
- Assigning representative energetic descriptors to each segment (expected mean power and energy-per-distance).
This reduces thousands of sample-level predictions into a small number of segments that preserve the energetic structure relevant to control.
2.7.2. Why Zonification Matters for EMS
Zonification provides two control-critical advantages:
- Stability and noise rejection. Sample-wise predictions may exhibit local fluctuations, particularly near transitions; zonification filters these fluctuations by enforcing spatial continuity, yielding robust, high-confidence descriptors at the segment level.
- Predictive actionability. Each zone supplies representative base values that the EMS can use to plan ahead of time. Rather than reacting to instantaneous power demand, the EMS can schedule fuel cell loading and battery SoC shaping across entire upcoming zones, enabling anticipatory behavior using only partial preview information.
2.8. EMS Compared
Optimization-based methods such as Dynamic Programming (DP) and Model Predictive Control (MPC) were not included as direct comparators in this study for the following reasons. DP requires complete a priori knowledge of the driving cycle and is therefore non-causal, making it unsuitable for real-time implementation under limited-preview conditions. MPC, while causal, requires an accurate prediction model and imposes significantly higher computational requirements than the proposed heuristic + ML approach.
The comparative framework in this work focuses specifically on the benefit of integrating ML-based route prediction into a real-time-feasible EMS architecture. The positioning of the proposed approach relative to DP and MPC in terms of performance and computational requirements is discussed in Section 5.2 and summarized in Table 4.
Table 4.
Route-averag EMS performance metrics across the five real-world routes.
The energy management evaluation includes four controllers implemented and tested over five real driving routes. Each controller is defined by the way it allocates power between the fuel cell (FC) and the battery, and by how it reacts to the traction power demand. In all cases, the power balance of the hybrid system is given by
where is the demanded traction power, is the fuel cell power, and is the battery power. The battery state-of-charge () dynamics are approximated by
where is the battery efficiency and is the nominal battery energy. In all controllers, the FC power is subject to saturation limits and a ramp-rate limiter in order to represent physical and dynamic constraints of the system.
2.8.1. EMS 1: Load-Follower Controller
The first controller operates as a pure load-follower, supplying propulsion power by prioritizing the fuel cell and relying on the battery only when the fuel cell cannot meet transient peaks. This strategy keeps the battery minimally involved, acting mainly as a buffer.
In this approach, the commanded FC power is directly set equal to the traction power demand:
The actual FC power is then obtained by applying saturation and ramp-rate limits, and the battery supplies the remaining power required by the drivetrain according to the balance in Equation (1).
The load-follower does not incorporate predictive elements, does not regulate the SoC over a horizon, and does not use any anticipated route information. As a consequence, the SoC is not explicitly controlled and may drift depending on the driving cycle.
2.8.2. EMS 2: PID SoC Controller
The second controller regulates the battery SoC using a PID-based feedback loop. It attempts to maintain a fixed SoC reference and adjusts the FC power to compensate deviations, while still satisfying the power balance in Equation (1) and the SoC dynamics in Equation (2).
The SoC tracking error is defined as
and the corrective power term generated by the PID controller is
where , , and are the proportional, integral, and derivative gains, respectively. The commanded FC power is then computed as
After applying saturation and ramp-rate limits, the battery supplies the remaining power.
Although this strategy improves SoC stability, it causes more frequent FC power fluctuations and generally increases hydrogen consumption. In addition, the controller may generate excessive FC power during transient conditions, which can lead to additional energy dissipation in the braking resistor.
2.8.3. EMS 3: Heuristic Controller
The third controller applies a heuristic energy management strategy based on instantaneous operating conditions. Unlike EMS 1 and EMS 2, which rely on direct load-following or feedback regulation, this strategy uses a set of rule-based decisions to allocate power between the fuel cell and the battery according to the current energetic state of the vehicle, while still satisfying the power balance and SoC dynamics defined in Equations (1) and (2).
In EMS 3, the commanded FC power is computed through a heuristic mapping:
where represents a set of rule-based functions depending on the instantaneous power demand, battery SoC, and selected operating variables such as vehicle speed v and drivetrain speed . The main objectives of these rules are to (i) avoid unnecessary FC loading at low and medium power levels, (ii) exploit battery support during transient events, and (iii) keep the SoC within a predefined operating window.
The resulting commanded power is subjected to saturation and ramp-rate limitations, and the battery supplies the remaining power. Compared with EMS 1 and EMS 2, this heuristic strategy improves hydrogen consumption by preventing inefficient FC operation and by making better use of the battery during medium-power events. However, it still lacks anticipatory capabilities, since all decisions are based solely on instantaneous variables and no route preview or predicted power demand is considered.
2.8.4. EMS 4: Heuristic + ML Predictive Controller
The fourth controller extends the heuristic strategy by incorporating machine-learning-based route predictions. Using the zone-type classification and the corresponding predicted energy demand, EMS 4 modifies the heuristic rules through a predictive scheduling mechanism, while still satisfying the power balance and SoC dynamics defined in Equations (1) and (2).
In this case, the commanded FC power is computed as
where denotes the predicted route zone type (e.g., urban, suburban, or high-load segment) and represents the predicted energy demand over the upcoming segment. These predictive variables effectively implement a zone-dependent scheduling of the FC operating point and a dynamic adjustment of the target SoC trajectory.
As in the previous controllers, physical constraints such as saturation and ramp-rate limits are enforced on the FC power, and the battery supplies the remaining power. Thanks to the predictive information, EMS 4 is able to proactively pre-discharge or preserve the battery before specific route segments and to redistribute FC power more efficiently along the route. This anticipatory behavior leads to a more efficient energy management compared with EMS 3.
To improve reproducibility and provide a clearer understanding of the supervisory control logic, the rule structure of EMS 3 and EMS 4 is summarized in the control flowchart shown in Figure 11.
Figure 11.
Supervisory control logic of the heuristic EMS strategies. (a) EMS 3 uses instantaneous variables and fixed supervisory references. (b) EMS 4 uses ML-based route predictions to dynamically update the fuel cell operating point and battery SoC reference, including preparation for regenerative braking and pantograph-assisted charging.
Both controllers share a common physical implementation layer. The traction power demand is first evaluated, and a supervisory rule set determines the commanded fuel cell power. This command is then subjected to saturation and ramp-rate limits, and the remaining power is supplied by the battery according to the system power balance.
The key difference lies in the supervisory references. EMS 3 uses fixed setpoints for the fuel cell base operation and battery SoC, relying exclusively on instantaneous variables. In contrast, EMS 4 dynamically updates these references using machine-learning-based predictions of route zone type, expected energetic demand, and anticipated charging opportunities. As illustrated in Figure 11, this predictive adaptation enables anticipatory energy management by adjusting both the fuel cell operating point and the battery SoC trajectory ahead of upcoming driving conditions.
2.8.5. Common Implementation Aspects of the EMS Strategies
Although the four EMS strategies differ in the way the fuel cell (FC) power command is generated, they all share a common implementation structure. In all cases, the final FC power is obtained by applying physical constraints to the commanded value, including saturation limits and a ramp-rate limiter, in order to represent the dynamic and operational limitations of the real system.
Independently of the selected strategy, the FC power is therefore computed as
where is the power command generated by the corresponding EMS (load-following, PID-based, heuristic, or predictive heuristic). The saturation block enforces the minimum and maximum admissible FC power, while the ramp-rate limiter constrains the maximum allowable power variation rate.
Once the actual FC power is determined, the battery power is implicitly obtained from the power balance defined in Equation (1). Consequently, the battery naturally absorbs fast transients and compensates for the limitations imposed on the FC, regardless of the selected EMS strategy.
This common structure ensures a fair comparison among the four controllers, since all of them are subject to the same physical constraints and differ only in the way the FC power command is generated.
The EMS strategies presented in this work operate exclusively at the supervisory control level, generating power reference signals for the fuel cell and battery subsystems. The inner-loop regulation of fuel cell stack voltage, current dynamics, and bus voltage stability addressed by dedicated power electronics and state-observer-based controllers is assumed to be handled at the hardware level and is not modeled in this study.
The supervisory EMS interacts with the component models through saturation and ramp-rate limiters that enforce the physical constraints of the real system, as described in Section 2.8.5. This hierarchical separation is consistent with standard vehicle system simulation practice and ensures that the EMS evaluation focuses on energy allocation performance rather than component-level electrical dynamics.
2.9. Performance Metrics
The evaluation of the EMS relies on a set of quantitative metrics that capture hydrogen usage, fuel cell degradation behavior, and energy dissipation across the five real-world test routes. These metrics enable a fair, controller-agnostic comparison of performance.
- Total H2 Consumption: Hydrogen consumption is computed from the fuel cell’s power demand using standard mass–rate relations, where instantaneous mass flow is proportional to output power and inversely proportional to fuel cell efficiency. This metric reflects the overall energy economy of each EMS and forms the primary indicator of how effectively each controller allocates fuel cell power throughout the drive cycle.
- Normalized H2 Consumption: To allow comparisons between routes of unequal length and duration, hydrogen use is also expressed as a normalized index. Each route’s total consumption is scaled to the performance of the worst-performing controller on that same route, producing a dimensionless ratio in the range . This normalized metric enables consistent cross-route evaluation and reveals relative efficiency trends independent of route scale.
- Fuel Cell Degradation Index: Fuel cell degradation is assessed using a transient-sensitivity index derived from the variance of the fuel cell power rate-of-change . denotes the open-circuit voltage of the battery, and represents its nominal charge capacity. The parameters , , and are tunable gains. Specifically, governs the contribution of the load-following term, while weights the SoC-sustaining action. The constraint in (12) applies a rate limit on the fuel cell power, restricting its time derivative to ensure smooth transients and protect the system from excessive dynamic loading. Fuel cell degradation in PEM systems is driven by multiple interacting mechanisms, including membrane chemical and mechanical degradation induced by hygrothermal cycling, platinum catalyst dissolution and agglomeration under load cycling, and start-stop effects that accelerate carbon corrosion [22,23,32].Fuel cells will experience a gradual decline in performance during long-term operation. This performance degradation is caused by a variety of complex factors, including the degradation of electrode materials, a loss of catalysts, mechanical damage to the membrane electrode assembly, and fluctuations in operating conditions [33]. Performance degradation not only affects the efficiency and output power of fuel cells, but also shortens their service life and increases maintenance and replacement costs.Transient load variations are particularly damaging because they impose rapid humidity and temperature gradients across the membrane-electrode assembly, accelerating ionomer degradation and gas diffusion layer fatigue. The degradation index used in this work captures these effects through the integral of the squared fuel cell power derivative, which serves as a proxy for the intensity and frequency of transient loading. This formulation is consistent with the principles discussed in recent degradation modeling literature [32], which identifies load cycling amplitude and rate as primary lifetime-limiting factors in PEM fuel cell systems.The Fuel Cell Degradation Index (FCDI) is formally defined as:where is the instantaneous rate of change of fuel cell output power and T is the total duration of the driving cycle. High values of correspond to abrupt load transitions that are known to accelerate stack aging. This index does not directly model start-stop cycles or platinum dissolution, but serves as a computationally tractable proxy for EMS-level comparison of degradation potential across controllers.High-frequency fluctuations accelerate mechanical and chemical wear in the stack, decreasing overall lifetime. The degradation index follows the integral formulation described in (10), where the squared power derivative is weighted and accumulated over time.
- Dissipated Energy (Optional Auxiliary Metric): Although not a primary optimization target, dissipated energy in the braking resistor provides causal insight into hydrogen consumption behavior. High dissipation implies missed regeneration opportunities or excessive fuel cell power allocation.
Together, these metrics offer a comprehensive multi-objective evaluation framework; this set forms the basis for the comparative analysis of the EMS variants presented.
3. Experimental Setup
The evaluation of the four Energy Management Strategies (EMS) is performed using a high-fidelity simulation environment developed in Simulink®, integrating the full powertrain, control architecture, and route data. The complete simulation structure, where the driver model, vehicle dynamics, fuel cell system, battery, pantograph subsystem, and EMS modules are connected through a unified real-time computation flow, is presented.
3.1. Simulation Environment
The simulation framework loads route information—including speed profile and road-grade profile—through a dedicated interface block. The driver model and longitudinal dynamics compute the traction power request at every time step, which is then mapped into electrical power through the motor and inverter characteristics.
Pantograph availability is evaluated by checking the vehicle’s longitudinal position against predefined catenary-line segments. When overhead charging is available, pantograph power is injected directly into the DC link and used to recharge the battery whenever space is available. The remaining power required for propulsion is sourced by the fuel cell and battery according to the controller under test.
3.2. Initial Conditions and System Parameters
All controllers are evaluated under identical initial conditions to ensure fairness. The vehicle model configuration (fuel cell maximum power, ramp-rate limits, battery capacity, charging/discharging efficiencies, and converter constraints) remains fixed across all simulations. The State-of-Charge (SoC) is initialized to the same value for every experiment, and the corresponding electrical/thermal states of the fuel cell and battery are held constant at startup. These shared conditions guarantee that differences in performance arise from EMS logic rather than component asymmetries.
3.3. Comparison Protocol
A strict comparison protocol guarantees that the four EMS variants are tested under exactly the same conditions, each controller receives the same:
- Traction power demand sequence produced from the route data;
- Pantograph availability profile;
- Component limits (FC, battery, converters);
- Route duration and sampling time.
Fuel cell constraints—maximum power, ramp limits, and dynamic behavior—are enforced identically for all controllers. No controller is granted access to future route information except for EMS 4, which explicitly incorporates ML-based predictions as part of its design.
4. Results
4.1. Clustering and Prediction
The first stage of the proposed framework evaluates how the vehicle’s instantaneous energetic behavior can be grouped into representative operating patterns. These clusters serve as the basis for defining predictive zones that are later used by the EMS.
The results presented in Figure 12, Figure 13 and Figure 14 demonstrate that the clustering and prediction stages provide a consistent and physically interpretable representation of vehicle operation, enabling reliable anticipatory control.
Figure 12.
Clustered data from all five test routes.
Figure 13.
Accuracy comparison of classification algorithms.
Figure 14.
Prediction speed comparison of classification algorithms.
4.1.1. Cluster Distribution Across All Routes
The clustering process groups samples according to power-related features, identifying consistent operating regimes across the five real driving routes.
As shown in Figure 12, the dataset is clearly separated into three main classes, primarily along the power axis. These classes correspond to low-power (idle or stop), medium-power cruising, and high-power acceleration or uphill operation. The separation confirms that the clustering process captures the underlying energetic structure of the driving data.
4.1.2. Spatial Distribution of Zones
Mapping the cluster labels back to their GPS coordinates reveals that consecutive samples tend to belong to the same class, forming extended segments referred to as zones.
Figure 10 shows that these zones appear as contiguous segments along the route, providing a compact representation of the driving profile. This zonification process reduces data complexity while preserving essential energetic information, enabling the transition from sample-level analysis to route-level prediction.
4.1.3. Classification Accuracy
The supervised learning stage predicts zone types using only road grade and mean speed, both of which are readily available from standard navigation systems.
As shown in Figure 13, several algorithms achieve high predictive performance, with the best models reaching approximately 92% classification accuracy. This result demonstrates that a reduced set of input variables is sufficient to infer future energetic conditions, making the approach suitable for real-time implementation.
To assess the robustness of the classification stage, Table 5 presents the confusion matrix and per-class performance metrics for the best-performing Bagged Trees classifier under 5-fold cross-validation. The results confirm that classification performance is consistently high across all three zone types, with the most frequent misclassifications occurring between Zone 1 (low power) and Zone 2 (medium power), which exhibit the most overlapping energetic characteristics.
Table 5.
Performance metrics by zone.
As expected, misclassifications occur predominantly between adjacent zones, which is consistent with the findings discussed in Section 4.1.4 and Section 5.1.3 regarding the limited impact of classification errors on overall EMS performance. Furthermore, the high accuracy confirms that the cluster-defined zones represent well-separated and meaningful operational states.
4.1.4. Prediction Speed
Real-time applicability requires low computational cost during inference. The prediction speed of the evaluated models is therefore analyzed.
Figure 14 shows that several models achieve prediction rates exceeding 100,000 observations per second, with sub-millisecond inference times. This confirms that the ML-based prediction stage can be deployed in embedded systems without compromising real-time operation.
Despite the high classification accuracy, occasional misclassifications have a limited impact on overall EMS performance. Most prediction errors occur between adjacent zones with similar energetic characteristics, resulting in only minor deviations in control actions. This indicates that the proposed zonification framework is inherently robust and suitable for real-time applications under uncertain conditions.
4.2. EMS Performance
The performance of the four EMS variants is evaluated across five real driving routes, allowing a comprehensive comparison of hydrogen consumption, battery utilization, fuel cell degradation, and dissipated energy.
The comparison between controllers highlights the benefits of incorporating predictive capabilities into EMS design. While conventional rule-based and heuristic strategies operate reactively, the predictive EMS anticipates future driving conditions, enabling improved energy allocation. In contrast to optimization-based approaches requiring full route knowledge, the proposed method operates using limited preview information while maintaining real-time feasibility.
To clarify the statistical robustness of the reported improvements, the reductions in hydrogen consumption and fuel cell degradation were evaluated through a route-level paired comparison across the five real-world test routes. Since the Simulink-based vehicle and EMS model is deterministic under fixed inputs, repeated simulations of the same route-controller configuration produce identical outputs; therefore, reproducibility was assessed across heterogeneous route conditions rather than through repeated stochastic runs. All EMS controllers were evaluated using the same speed profiles, road-grade profiles, pantograph availability, initial conditions, component constraints, and sampling time. Under this paired comparison, the heuristic + ML predictive controller consistently outperformed the heuristic-only controller across the five routes, achieving an average hydrogen consumption reduction of approximately 26% and an average fuel cell degradation index reduction of approximately 25%. In addition, the risk of overfitting in the ML prediction stage was mitigated through 5-fold cross-validation of the best-performing Bagged Trees classifier, which achieved weighted average precision, recall, and F1-score values of approximately 0.927. These results indicate that the reported improvements are not isolated outcomes from a single simulation case, but reproducible trends observed across multiple real-world routes and supported by cross-validated ML prediction performance.
4.2.1. Energy Split Across Controllers
Figure 15 shows the proportion of energy delivered by the fuel cell and battery for each controller.
Figure 15.
Delivered energy proportion by source for all controllers across all routes.
The results indicate that EMS 1 and EMS 3 rely predominantly on the fuel cell, whereas EMS 2 and EMS 4 increase battery utilization. This reflects the underlying control strategies and highlights the role of battery management in improving system efficiency.
4.2.2. Hydrogen Consumption
Hydrogen consumption results are presented in Figure 16, showing a consistent performance hierarchy across all routes.
Figure 16.
Total H2 consumption for all controllers across all routes.
EMS 4 achieves the lowest hydrogen consumption, with an average reduction of approximately 26% relative to EMS 3 and significantly lower consumption compared to EMS 2. These results confirm that anticipatory battery management reduces reliance on the fuel cell by better exploiting regenerative and stored energy.
The magnitude of hydrogen savings varies across routes depending on their dynamic characteristics. Routes with higher variability in power demand and elevation changes exhibit greater improvements, whereas steady-state routes show smaller gains. This confirms that route-dependent dynamics influence the effectiveness of predictive EMS strategies.
4.2.3. Dissipated Energy
Figure 17.
Total dissipated energy for all controllers across all routes.
Figure 18.
Normalized dissipated energy for all controllers across all routes.
EMS 2 exhibits the highest dissipation due to its strict SoC regulation, which limits the ability to store regenerative energy. In contrast, EMS 4 consistently minimizes dissipated energy by reserving battery capacity for upcoming regeneration events.
4.2.4. Fuel Cell Degradation
Fuel cell degradation results are presented in Figure 19.
Figure 19.
Normalized degradation index for all controllers across all routes.
The results show that EMS 4 achieves the lowest degradation index, reducing degradation by approximately 25% relative to EMS 3 and significantly outperforming EMS 2. This improvement is attributed to smoother power demand and reduced transient operation enabled by predictive control.
The reduction in degradation achieved by the predictive EMS is primarily attributed to the effective smoothing of the fuel cell load, which mitigates harmful transient operations. This macroscopic benefit is theoretically supported by the microscopic relationship between operating conditions and internal state durability. As demonstrated by Tang et al. [34], the health state of a PEMFC exhibits adaptive sensitivity to operating temperature; by stabilizing power fluctuations, the proposed strategy prevents rapid thermal transitions that accelerate the degradation of internal components, thereby preserving the stack’s structural integrity and extending its lifespan.
Overall, the results confirm that the integration of machine learning into EMS design enables a transition from reactive to anticipatory energy management. This approach improves energy utilization, reduces fuel cell stress, and enhances system robustness under real-world driving conditions.
5. Discussion
5.1. Why the Predictive EMS Outperforms Traditional Approaches
The superior performance of the predictive EMS results from a combination of complementary mechanisms: reduced energy dissipation, anticipatory battery management, smoother fuel cell operation, and route-aware control adaptation. These effects can be directly observed in the braking resistor power, SoC trajectories, and fuel cell power profiles, and are further influenced by the characteristics of the driving route.
The effectiveness of the proposed predictive EMS depends strongly on route characteristics. Routes with significant elevation variations and transient driving conditions provide the greatest opportunity for anticipatory energy management, resulting in higher hydrogen savings. In contrast, highway-dominated routes with quasi-steady operation exhibit lower relative improvements due to reduced variability in power demand. This observation confirms that road gradient and dynamic load variations are key factors influencing the benefits of predictive EMS strategies.
5.1.1. Reduced Dissipated Energy
Figure 17 and Figure 18 show that non-predictive controllers, particularly EMS 2 (PID SoC), dissipate the largest amount of energy through the braking resistor. This occurs because the battery is maintained near its reference SoC, leaving limited capacity for storing regenerated energy during deceleration or downhill segments. Consequently, recoverable energy is frequently dissipated as heat rather than stored.
In contrast, EMS 4 anticipates upcoming regenerative opportunities and intentionally reduces the battery SoC before entering low-demand zones. This creates sufficient headroom for energy recovery, allowing braking energy to be stored rather than dissipated. The resulting improvement in regeneration utilization directly reduces the energy demand placed on the fuel cell, contributing to lower hydrogen consumption over the route.
5.1.2. Anticipatory Battery Management
The SoC trajectory shown in Figure 20 highlights a second key mechanism: predictive SoC shaping based on the energetic characteristics of upcoming route segments.
Figure 20.
Propagated effects of abrupt section-transition in the Heuristic + ML controller.
Before high-power regions, the controller maintains sufficient battery charge to support traction demand and avoid excessive fuel cell loading. Conversely, before regenerative or catenary-powered sections, the controller reduces SoC to maximize energy absorption from braking and pantograph charging.
The interaction between predictive SoC control and pantograph energy recovery represents a key mechanism of the proposed EMS. When pantograph charging is available, the injected power can only be effectively utilized if sufficient storage capacity exists in the battery. Therefore, the predictive EMS anticipates upcoming electrified segments and reduces the battery SoC in advance, creating headroom for energy absorption.
This behavior contrasts with non-predictive controllers, which typically maintain the battery near a fixed SoC reference and therefore cannot fully exploit pantograph charging opportunities. As a result, part of the available external energy may be underutilized. The results demonstrate that predictive SoC shaping significantly increases the utilization of pantograph energy, particularly in routes with intermittent electrification.
Because EMS 1–3 operate purely reactively, they cannot prepare the battery for these upcoming events. Predictive SoC shaping therefore becomes a primary driver of the experimentally observed 26% reduction in hydrogen consumption.
5.1.3. Smoother Fuel Cell Operation
A third mechanism appears in the fuel cell power profiles and degradation index shown in Figure 19. Controllers lacking prediction produce sharper fuel cell power transients, particularly EMS 2, where the PID loop forces the stack to respond aggressively to deviations in SoC.
EMS 4 mitigates this behavior by aligning fuel cell loading with the expected energetic characteristics of upcoming zones. By scheduling fuel cell output according to predicted demand levels, the controller reduces both the magnitude and frequency of power fluctuations. As a result, the fuel cell degradation index decreases to 53% of EMS 2 and 25% below EMS 3, indicating significantly smoother stack operation.
The impact of classification accuracy on EMS performance is inherently limited by the structure of the zonification approach. Misclassifications typically occur between adjacent zones with similar energy demand levels, resulting in minimal deviation in control actions. Additionally, since the EMS relies on aggregated zone characteristics rather than instantaneous predictions, the overall system behavior remains robust, preserving both hydrogen savings and fuel cell degradation benefits.
5.1.4. Integrated Effect and Comparison with Other EMS Approaches
Together, these mechanisms explain the superior performance of the predictive EMS. Rather than reacting to instantaneous states, the ML-enhanced controller reorganizes energy flow across the route using predicted contextual information. This anticipatory capability improves regeneration efficiency, reduces hydrogen consumption, and simultaneously mitigates fuel cell degradation.
Compared to conventional rule-based strategies, the predictive EMS introduces anticipatory control capabilities that improve energy allocation and reduce hydrogen consumption. While optimization-based approaches such as dynamic programming and model predictive control can achieve near-optimal solutions, they typically require full route knowledge and high computational effort. In contrast, the proposed method operates with limited preview information while maintaining real-time feasibility, making it particularly suitable for heavy-duty applications.
5.2. Comparison with Recent Literature
Recent research on energy management strategies for fuel cell hybrid vehicles increasingly integrates predictive and learning-based approaches to overcome the limitations of reactive control policies. Existing studies can broadly be grouped into four methodological directions:
- Driving-condition recognition combined with predictive control;
- Driving behavior or velocity prediction for look-ahead EMS;
- Degradation-aware predictive energy management;
- Route-based or mission-level optimization.
Several works integrate driving-condition recognition with model predictive control (MPC). Li et al. combine LSTM-based condition recognition with dual-model predictive control to improve controller robustness under varying driving patterns [35]. Similarly, Zheng et al. propose a variable-horizon MPC enhanced with velocity prediction and driving-pattern recognition [19]. While these approaches demonstrate the benefits of contextual prediction, they do not explicitly consider route-dependent charging opportunities such as pantograph-based dynamic charging.
Other studies focus on driving behavior identification and speed forecasting to improve predictive EMS performance. Fu et al. integrate behavior recognition with LSTM-based speed prediction to support a predictive EMS framework [36]. These methods improve robustness under traffic interaction scenarios but generally assume conventional FC-battery architectures without accounting for route-segment energy intake events such as catenary charging.
Durability-aware EMS strategies represent another important research direction. Hou et al. develop a hierarchical MPC framework incorporating degradation-related objectives to improve the trade-off between hydrogen consumption and fuel cell lifetime [20]. Ferrara and Hametner investigate predictive activation strategies for multi-module fuel cell systems in heavy-duty trucks [37]. Although these approaches emphasize fuel cell health, they typically focus on fuel cell–battery coordination and do not incorporate dynamic charging infrastructure.
Finally, route-based mission optimization has been explored through predictive control maps. Kofler et al. generate optimal control maps using dynamic programming based on mission-level route information [38]. While this approach also exploits route preview, it assumes full route knowledge and does not integrate machine-learning-based zonification using partial route descriptors.
Gap Addressed by This Work
Although recent studies demonstrate that predictive EMS improves vehicle efficiency, the combined integration of the following elements remains limited in the literature:
- Partial route preview information;
- Machine-learning-based zonification of energetic route segments;
- Pantograph-based dynamic charging as a third energy pathway.
This work addresses these gaps by transforming partial route descriptors into predicted energetic zones and embedding these predictions within an EMS capable of coordinating fuel cell, battery, and pantograph power flows. A comparison with recent predictive and learning-based EMS studies is presented in Table 6, highlighting the specific methodological gap addressed in this work.
Table 6.
Comparison with representative predictive and learning-based EMS literature (2023–2025).
5.3. Limitations
Despite the improvements achieved by the predictive EMS, several limitations remain.
Dependence on limited preview information. The prediction stage relies only on mean speed and road grade descriptors. While these variables are commonly available through navigation systems, they limit the ability of the EMS to capture short-term traffic fluctuations and driver-behavior variability.
Data availability constraints. The methodology assumes access to historical vehicle telemetry and route descriptors. In practice, large-scale datasets and connected-vehicle infrastructures may not always be available, which may affect model generalization.
Cluster resolution trade-off. The clustering stage employs three energetic classes to ensure stable classification performance. Increasing the number of clusters could improve energetic resolution but would also increase misclassification risk and reduce prediction robustness.
Simulation-based validation. All results are obtained using high-fidelity Simulink simulations. Real-time implementation may introduce additional uncertainties such as sensor noise, communication delays, and computational constraints that are not captured in the simulation environment.
Infrastructure assumptions. The methodology assumes reliable knowledge of pantograph locations and full availability of overhead charging infrastructure. In early deployment stages, incomplete infrastructure coverage may limit the benefits of predictive SoC planning.
An additional limitation concerns the transferability of the trained ML models across different vehicle architectures. The clustering and classification models were developed using data from a Battery Electric Vehicle (BEV) prototype and applied to a simulated heavy-duty FCHEV. Although the zone structure captures physically interpretable energetic patterns based on traction power demand, the absolute power levels and efficiency characteristics differ between platforms.
Direct transfer of the trained models to significantly different architectures—such as vehicles with different mass, drivetrain configurations, or powertrain ratings—may require recalibration of the clustering boundaries and retraining of the classifier. Future work will investigate transfer learning and domain adaptation strategies to improve cross-platform generalization.
5.4. Practical Implications
The results demonstrate that integrating machine-learning-based route insight into an EMS can provide significant operational benefits for heavy-duty FCHEVs.
Energy efficiency without hardware modification. The predictive EMS improves regeneration utilization and reduces hydrogen consumption without requiring modifications to the powertrain hardware. This highlights the potential of software-based optimization to enhance vehicle efficiency.
Reduced hydrogen cost and improved durability. By smoothing fuel cell power trajectories and reducing transient loads, the predictive controller decreases stack degradation. The degradation index under predictive control reaches only 53% of the PID-based controller and is 25% lower than the heuristic baseline.
Scalability for fleet operations. The method relies on widely available signals such as vehicle speed, road grade, and onboard telemetry. This makes it suitable for fleet-level deployment where route data and historical driving information are already available.
Compatibility with existing EMS architectures. The ML module acts as a prediction layer that provides dynamic setpoints to the underlying EMS. This modular architecture enables integration with existing OEM control strategies with minimal redesign.
Synergy with advanced driver assistance systems. More predictable speed profiles generated by systems such as Adaptive Cruise Control (ACC) could further improve zone prediction accuracy and strengthen the effectiveness of predictive EMS strategies.
6. Conclusions
This work demonstrates that the integration of machine-learning-based route prediction into energy management strategies enables significant improvements in the operation of fuel cell hybrid electric vehicles. The proposed predictive EMS framework was evaluated across five real-world routes and consistently outperformed conventional heuristic controllers under varying operating conditions.
The results confirm that the objectives of this study have been successfully achieved. The proposed methodology enables predictive energy management using limited preview information, allowing anticipatory control of battery State-of-Charge and improved coordination of fuel cell, battery, and pantograph energy sources.
The integration of ML-based route prediction into the EMS reduces hydrogen consumption by approximately 26% compared to heuristic-only control, while simultaneously decreasing the fuel cell degradation index by approximately 25%. These improvements are primarily attributed to smoother fuel cell load profiles, improved power allocation, and enhanced utilization of regenerative energy.
As part of future research to transition this methodology toward safety-critical industrial applications, the integration of a data-fusion stage, such as Extended Kalman Filters (EKF), into the data acquisition process is proposed. This addition would minimize errors in the vehicle’s state-estimation, further enhancing the predictive performance and ensuring the high reliability required for real-time automotive control systems.
The proposed approach leverages information already available in modern vehicle systems, including on-board telemetry and route descriptors such as road grade and speed. By anticipating future energy demand, the EMS maximizes braking-energy recuperation and ensures adequate battery headroom for both regenerative braking and pantograph charging, thereby improving overall energy efficiency without requiring modifications to the powertrain hardware.
The results highlight the advantages of predictive, data-driven EMS designs over conventional rule-based or short-horizon control strategies. The integration of ML-based zoning enables the controller to anticipate upcoming high-demand and high-regeneration segments, effectively extending the planning horizon beyond instantaneous control approaches.
Additionally, the effectiveness of the proposed EMS is influenced by route characteristics, with greater performance improvements observed in routes exhibiting higher variability in power demand and elevation profiles. This confirms that route-dependent dynamics play a key role in the benefits of predictive energy management.
The proposed framework demonstrates strong modularity and scalability. The predictive module can be integrated into different EMS architectures, including rule-based, heuristic, and optimization-based controllers, facilitating its adoption in industrial applications.
The main contribution of this work lies in bridging the gap between predictive control and real-time applicability by introducing a lightweight machine-learning-based EMS framework capable of coordinating multi-source energy systems using limited preview information. This approach enables practical implementation in heavy-duty vehicles without requiring full route knowledge or high computational resources.
Future Work
Future work will focus on validating the proposed methodology under real-time operational conditions through hardware-in-the-loop and experimental testing, considering practical constraints such as computation delays and communication uncertainties.
Another promising direction involves the development of shared cloud-based datasets and fleet-level learning strategies, enabling collaborative optimization of energy management across multiple vehicles operating on recurring routes. These approaches have the potential to further enhance prediction accuracy, system efficiency, and scalability in commercial heavy-duty transport applications.
Author Contributions
Conceptualization, M.I.Q.-M., J.M.S.-S., J.d.C.J.-R. and E.A.L.-C.; methodology, J.d.C.J.-R., D.S.P.-B. and S.M.A.-S.; software, J.d.C.J.-R., D.S.P.-B. and S.M.A.-S.; validation, J.d.C.J.-R., S.M.A.-S. and M.I.Q.-M.; formal analysis, J.d.C.J.-R., D.S.P.-B. and J.M.S.-S.; investigation, J.d.C.J.-R. and D.S.P.-B.; resources, E.A.L.-C. and J.d.C.J.-R.; data curation, J.d.C.J.-R. and D.S.P.-B.; writing—original draft preparation, J.d.C.J.-R. and D.S.P.-B.; writing—review and editing, J.d.C.J.-R., P.S.G.-R., S.M.A.-S., D.S.P.-B., M.I.Q.-M., J.M.S.-S. and E.A.L.-C.; visualization, P.S.G.-R. and E.A.L.-C.; supervision, E.A.L.-C. and D.S.P.-B.; project administration, E.A.L.-C. All authors have read and agreed to the published version of the manuscript.
Funding
This research received no external funding.
Institutional Review Board Statement
Not applicable.
Informed Consent Statement
Not applicable.
Data Availability Statement
The original contributions presented in this study are included in the article. Further inquiries can be directed to the corresponding authors.
Acknowledgments
We thank the UISEK University in Ecuador for the valuable collaboration, and the RWTH Aachen University for providing the facilities and support to conduct this research.
Conflicts of Interest
The authors declare no conflicts of interest.
Abbreviations
The following abbreviations are used in this manuscript:
| BEV | Battery Electric Vehicle |
| CAN | Controller Area Network |
| DP | Dynamic Programming |
| EMS | Energy Management Strategy |
| FC | Fuel Cell |
| FCHEV | Fuel Cell Hybrid Electric Vehicle |
| GPS | Global Positioning System |
| ML | Machine Learning |
| MPC | Model Predictive Control |
| PMP | Pontryagin’s Minimum Principle |
| SoC | State-of-Charge |
References
- Rudolf, T.; Schurmann, T.; Schwab, S.; Hohmann, S. Toward Holistic Energy Management Strategies for Fuel Cell Hybrid Electric Vehicles in Heavy-Duty Applications. Proc. IEEE 2021, 109, 1094–1114. [Google Scholar] [CrossRef] [Scilit]
- Zhao, X.; Wang, L.; Zhou, Y.; Pan, B.; Wang, R.; Wang, L.; Yan, X. Energy management strategies for fuel cell hybrid electric vehicles: Classification, comparison, and outlook. Energy Convers. Manag. 2022, 270, 116179. [Google Scholar] [CrossRef] [Scilit]
- Guo, J.; He, H.; Jia, C.; Guo, S. Energy Management Strategies for Fuel Cell Electric Vehicles: An Overview and Future Directions. World Electr. Veh. J. 2025, 16, 542. [Google Scholar] [CrossRef] [Scilit]
- Essoufi, M.; Benzaouia, M.; Hajji, B.; Rabhi, A.; Calì, M. Advancing Energy Management Strategies for Hybrid Fuel Cell Vehicles: A Comparative Study of Deterministic and Fuzzy Logic Approaches. World Electr. Veh. J. 2025, 16, 444. [Google Scholar] [CrossRef] [Scilit]
- Ferrara, A.; Jakubek, S.; Hametner, C. Energy management of heavy-duty fuel cell vehicles in real-world driving scenarios: Robust design of strategies to maximize the hydrogen economy and system lifetime. Energy Convers. Manag. 2021, 232, 113795. [Google Scholar] [CrossRef] [Scilit]
- Anselma, P.G.; Spano, M.; Capello, M.; Misul, D.; Belingardi, G. Calibrating a Real-time Energy Management for a Heavy-Duty Fuel Cell Electrified Truck towards Improved Hydrogen Economy. SAE Int. J. Adv. Curr. Pract. Mobil. 2023, 5, 1012–1023. [Google Scholar] [CrossRef] [Scilit]
- Mareev, I.; Sauer, D.U. Energy Consumption and Life Cycle Costs of Overhead Catenary Heavy-Duty Trucks for Long-Haul Transportation. Energies 2018, 11, 3446. [Google Scholar] [CrossRef] [Scilit]
- Li, J.; Liu, J.; Yang, Q.; Wang, T.; He, H.; Wang, H.; Sun, F. Reinforcement learning based energy management for fuel cell hybrid electric vehicles: A comprehensive review. Renew. Sustain. Energy Rev. 2025, 213, 115450. [Google Scholar] [CrossRef] [Scilit]
- Kang, X.; Wang, Y.; Chen, Z. A reinforcement learning energy management strategy considering driving condition classification. Sustain. Energy Grids Netw. 2024, 38, 101298. [Google Scholar] [CrossRef] [Scilit]
- Han, R.; He, H.; Wang, Y.; Wang, Y. Reinforcement learning based energy management strategy for fuel cell hybrid electric vehicles. Chin. J. Mech. Eng. 2025, 38, 66. [Google Scholar] [CrossRef] [Scilit]
- Su, Q.; Huang, R.; Zhang, Z.; He, H.; Kang, L. Enhanced energy management integrating reinforcement learning with data augmentation. J. Power Sources 2026, 665, 239081. [Google Scholar] [CrossRef] [Scilit]
- Wang, Y.; Sun, Z.; Chen, Z. Rule-based energy management strategy of a lithium-ion battery, supercapacitor and PEM fuel cell system. Energy Procedia 2019, 158, 2555–2560. [Google Scholar] [CrossRef] [Scilit]
- Snoussi, J.; Ben Elghali, S.; Benbouzid, M.; Mimouni, M.F. Auto-Adaptive Filtering Based Energy Management Strategy for Fuel Cell Hybrid Electric Vehicles. Energies 2018, 11, 2118. [Google Scholar] [CrossRef] [Scilit]
- Raceanu, M.; Bizon, N.; Iliescu, M.; Carcadea, E.; Marinoiu, A.; Varlam, M. Real-Time Energy Management of a Dual-Stack Fuel Cell Hybrid Electric Vehicle. World Electr. Veh. J. 2026, 17, 8. [Google Scholar] [CrossRef] [Scilit]
- Li, X.; Wang, Y.; Yang, D.; Chen, Z. Adaptive energy management strategy for fuel cell/battery hybrid vehicles using Pontryagin’s Minimal Principle. J. Power Sources 2019, 440, 227105. [Google Scholar] [CrossRef] [Scilit]
- Pereira, D.F.; Lopes, F.D.C.; Watanabe, E.H. Nonlinear Model Predictive Control for the Energy Management of Fuel Cell Hybrid Electric Vehicles in Real Time. IEEE Trans. Ind. Electron. 2021, 68, 3213–3223. [Google Scholar] [CrossRef] [Scilit]
- Liu, W.; Dou, J.; Wang, P. An energy management strategy based on genetic algorithm for fuel cell hybrid yard truck. In Proceedings of the 2022 IEEE International Conference on Mechatronics and Automation (ICMA); IEEE: New York, NY, USA, 2022; pp. 852–857. [Google Scholar] [CrossRef] [Scilit]
- Zhu, D.; Pritchard, E.; Dadam, S.R.; Kumar, V.; Xu, Y. Optimization of rule-based energy management strategies for hybrid vehicles using dynamic programming. Combust. Engines 2022, 184, 3–10. [Google Scholar] [CrossRef] [Scilit]
- Zheng, W.; Ma, M.; Xu, E.; Huang, Q. An energy management strategy for fuel-cell hybrid electric vehicles based on model predictive control with a variable time domain. Energy 2024, 312, 133544. [Google Scholar] [CrossRef] [Scilit]
- Hou, S.; Chen, H.; Liu, X.; Cui, J.; Zhao, J.; Gao, J. Hierarchical model predictive control for energy management and lifespan protection in fuel cell electric vehicles. Energy 2025, 319, 134968. [Google Scholar] [CrossRef] [Scilit]
- Aronis, A.N.; Bares, P.; Novella, R.; Pla, B. Optimal energy management strategy for fuel cell hybrid vehicles via SVD-based model order reduction and non-linear MPC. Control Eng. Pract. 2026, 172, 106880. [Google Scholar] [CrossRef] [Scilit]
- Dafalla, A.M.; Jiang, F. Stresses and their impacts on proton exchange membrane fuel cells: A review. Int. J. Hydrogen Energy 2018, 43, 2327–2348. [Google Scholar] [CrossRef] [Scilit]
- Singh, Y.; Orfino, F.P.; Dutta, M.; Kjeang, E. 3D Failure Analysis of Pure Mechanical and Pure Chemical Degradation in Fuel Cell Membranes. J. Electrochem. Soc. 2017, 164, F1331–F1341. [Google Scholar] [CrossRef] [Scilit]
- Ferrara, A.; Okoli, M.; Jakubek, S.; Hametner, C. Energy Management of Heavy-Duty Fuel Cell Electric Vehicles: Model Predictive Control for Fuel Consumption and Lifetime Optimization. IFAC-PapersOnLine 2020, 53, 14205–14210. [Google Scholar] [CrossRef] [Scilit]
- Li, F.; Li, M.; Wu, Y.; Li, H.; Song, Y.; Huang, Z. Safe reinforcement learning energy management for hybrid electric vehicles. J. Clean. Prod. 2026, 544, 147720. [Google Scholar] [CrossRef] [Scilit]
- Waghmare, A.V.; Singh, V.P.; Varshney, T.; Sanjeevikumar, P. A systematic review of reinforcement learning-based control for microgrids. Discov. Appl. Sci. 2025, 7, 939. [Google Scholar] [CrossRef] [Scilit]
- Zendegan, S.; Ferrara, A.; Jakubek, S.; Hametner, C. Predictive Battery State of Charge Reference Generation Using Basic Route Information for Optimal Energy Management of Heavy-Duty Fuel Cell Vehicles. IEEE Trans. Veh. Technol. 2021, 70, 12517–12528. [Google Scholar] [CrossRef] [Scilit]
- RWTH Aachen University—PEM. SELV Project: Sustainable Electric Vehicle Concepts. 2024. Available online: https://www.pem.rwth-aachen.de/cms/pem/forschung/projekte/vergangene-forschungsprojekte/~llkkf/selv/?lidx=1 (accessed on 6 April 2026).
- Mei, J.; Meng, X.; Tang, X.; Li, H.; Hasanien, H.; Alharbi, M.; Dong, Z.; Shen, J.; Sun, C.; Fan, F.; et al. An Accurate Parameter Estimation Method of the Voltage Model for Proton Exchange Membrane Fuel Cells. Energies 2024, 17, 2917. [Google Scholar] [CrossRef] [Scilit]
- Hellström, E.; Åslund, J.; Nielsen, L. Design of an efficient algorithm for fuel-optimal look-ahead control. Control Eng. Pract. 2010, 18, 1318–1327. [Google Scholar] [CrossRef] [Scilit]
- Kamal, M.A.S.; Mukai, M.; Murata, J.; Kawabe, T. Ecological vehicle control on roads with up-down slopes. IEEE Trans. Intell. Transp. Syst. 2011, 12, 783–794. [Google Scholar] [CrossRef] [Scilit]
- Meng, X.; Liu, M.; Mei, J.; Li, X.; Grigoriev, S.; Hasanien, H.M.; Tang, X.; Li, R.; Sun, C. Polarization loss decomposition-based online health state estimation for proton exchange membrane fuel cells. Int. J. Hydrogen Energy 2025, 157, 150162. [Google Scholar] [CrossRef] [Scilit]
- Meng, X.; Mei, J.; Tang, X.; Jiang, J.; Sun, C.; Song, K. The Degradation Prediction of Proton Exchange Membrane Fuel Cell Performance Based on a Transformer Model. Energies 2024, 17, 3050. [Google Scholar] [CrossRef] [Scilit]
- Tang, X.; Yang, M.; Shi, L.; Hou, Z.; Xu, S.; Sun, C. Adaptive state-of-health temperature sensitivity characteristics for durability improvement of PEM fuel cells. Chem. Eng. J. 2024, 491, 151951. [Google Scholar] [CrossRef] [Scilit]
- Li, F.; Wang, X.; Bao, X.; Wang, Z.; Li, R. Energy Management Strategy for Fuel Cell Vehicles Based on Online Driving Condition Recognition Using Dual-Model Predictive Control. Sensors 2024, 24, 7647. [Google Scholar] [CrossRef] [Scilit] [PubMed]
- Fu, Z.; Li, M.; Tao, F.; Zhu, L.; Wang, J. Predictive energy management strategy based on driving behavior identification for fuel cell hybrid electric vehicle in car-following scenario. Int. J. Hydrogen Energy 2025, 176, 151486. [Google Scholar] [CrossRef] [Scilit]
- Ferrara, A.; Hametner, C. Predictive Activation Strategy for Health-Conscious Energy Management of Multi-Module Fuel Cell Systems in Heavy-Duty Long-Haul Electric Trucks. In 16th International Conference on Engines & Vehicles for Sustainable Transport (ICE-2023), Capri, Italy; SAE Technical Paper Series; SAE International: Warrendale, PA, USA, 2023. [Google Scholar] [CrossRef] [Scilit]
- Kofler, S.; Jakubek, S.; Hametner, C. Predictive energy management strategy with optimal stack start/stop control for fuel cell vehicles. Appl. Energy 2025, 377, 124513. [Google Scholar] [CrossRef] [Scilit]
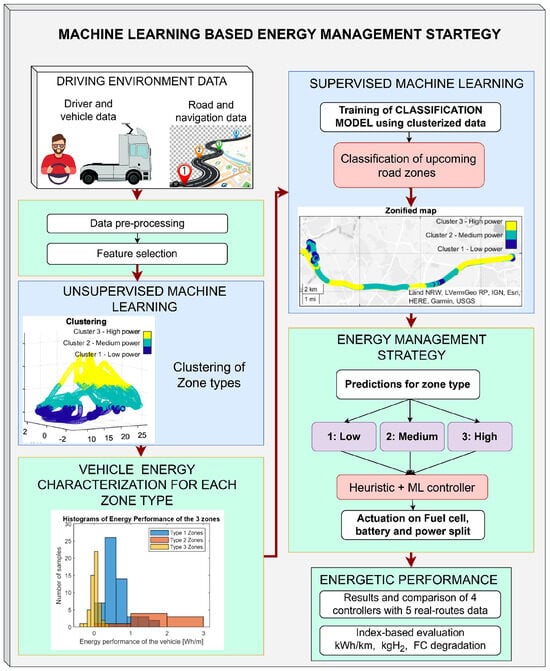
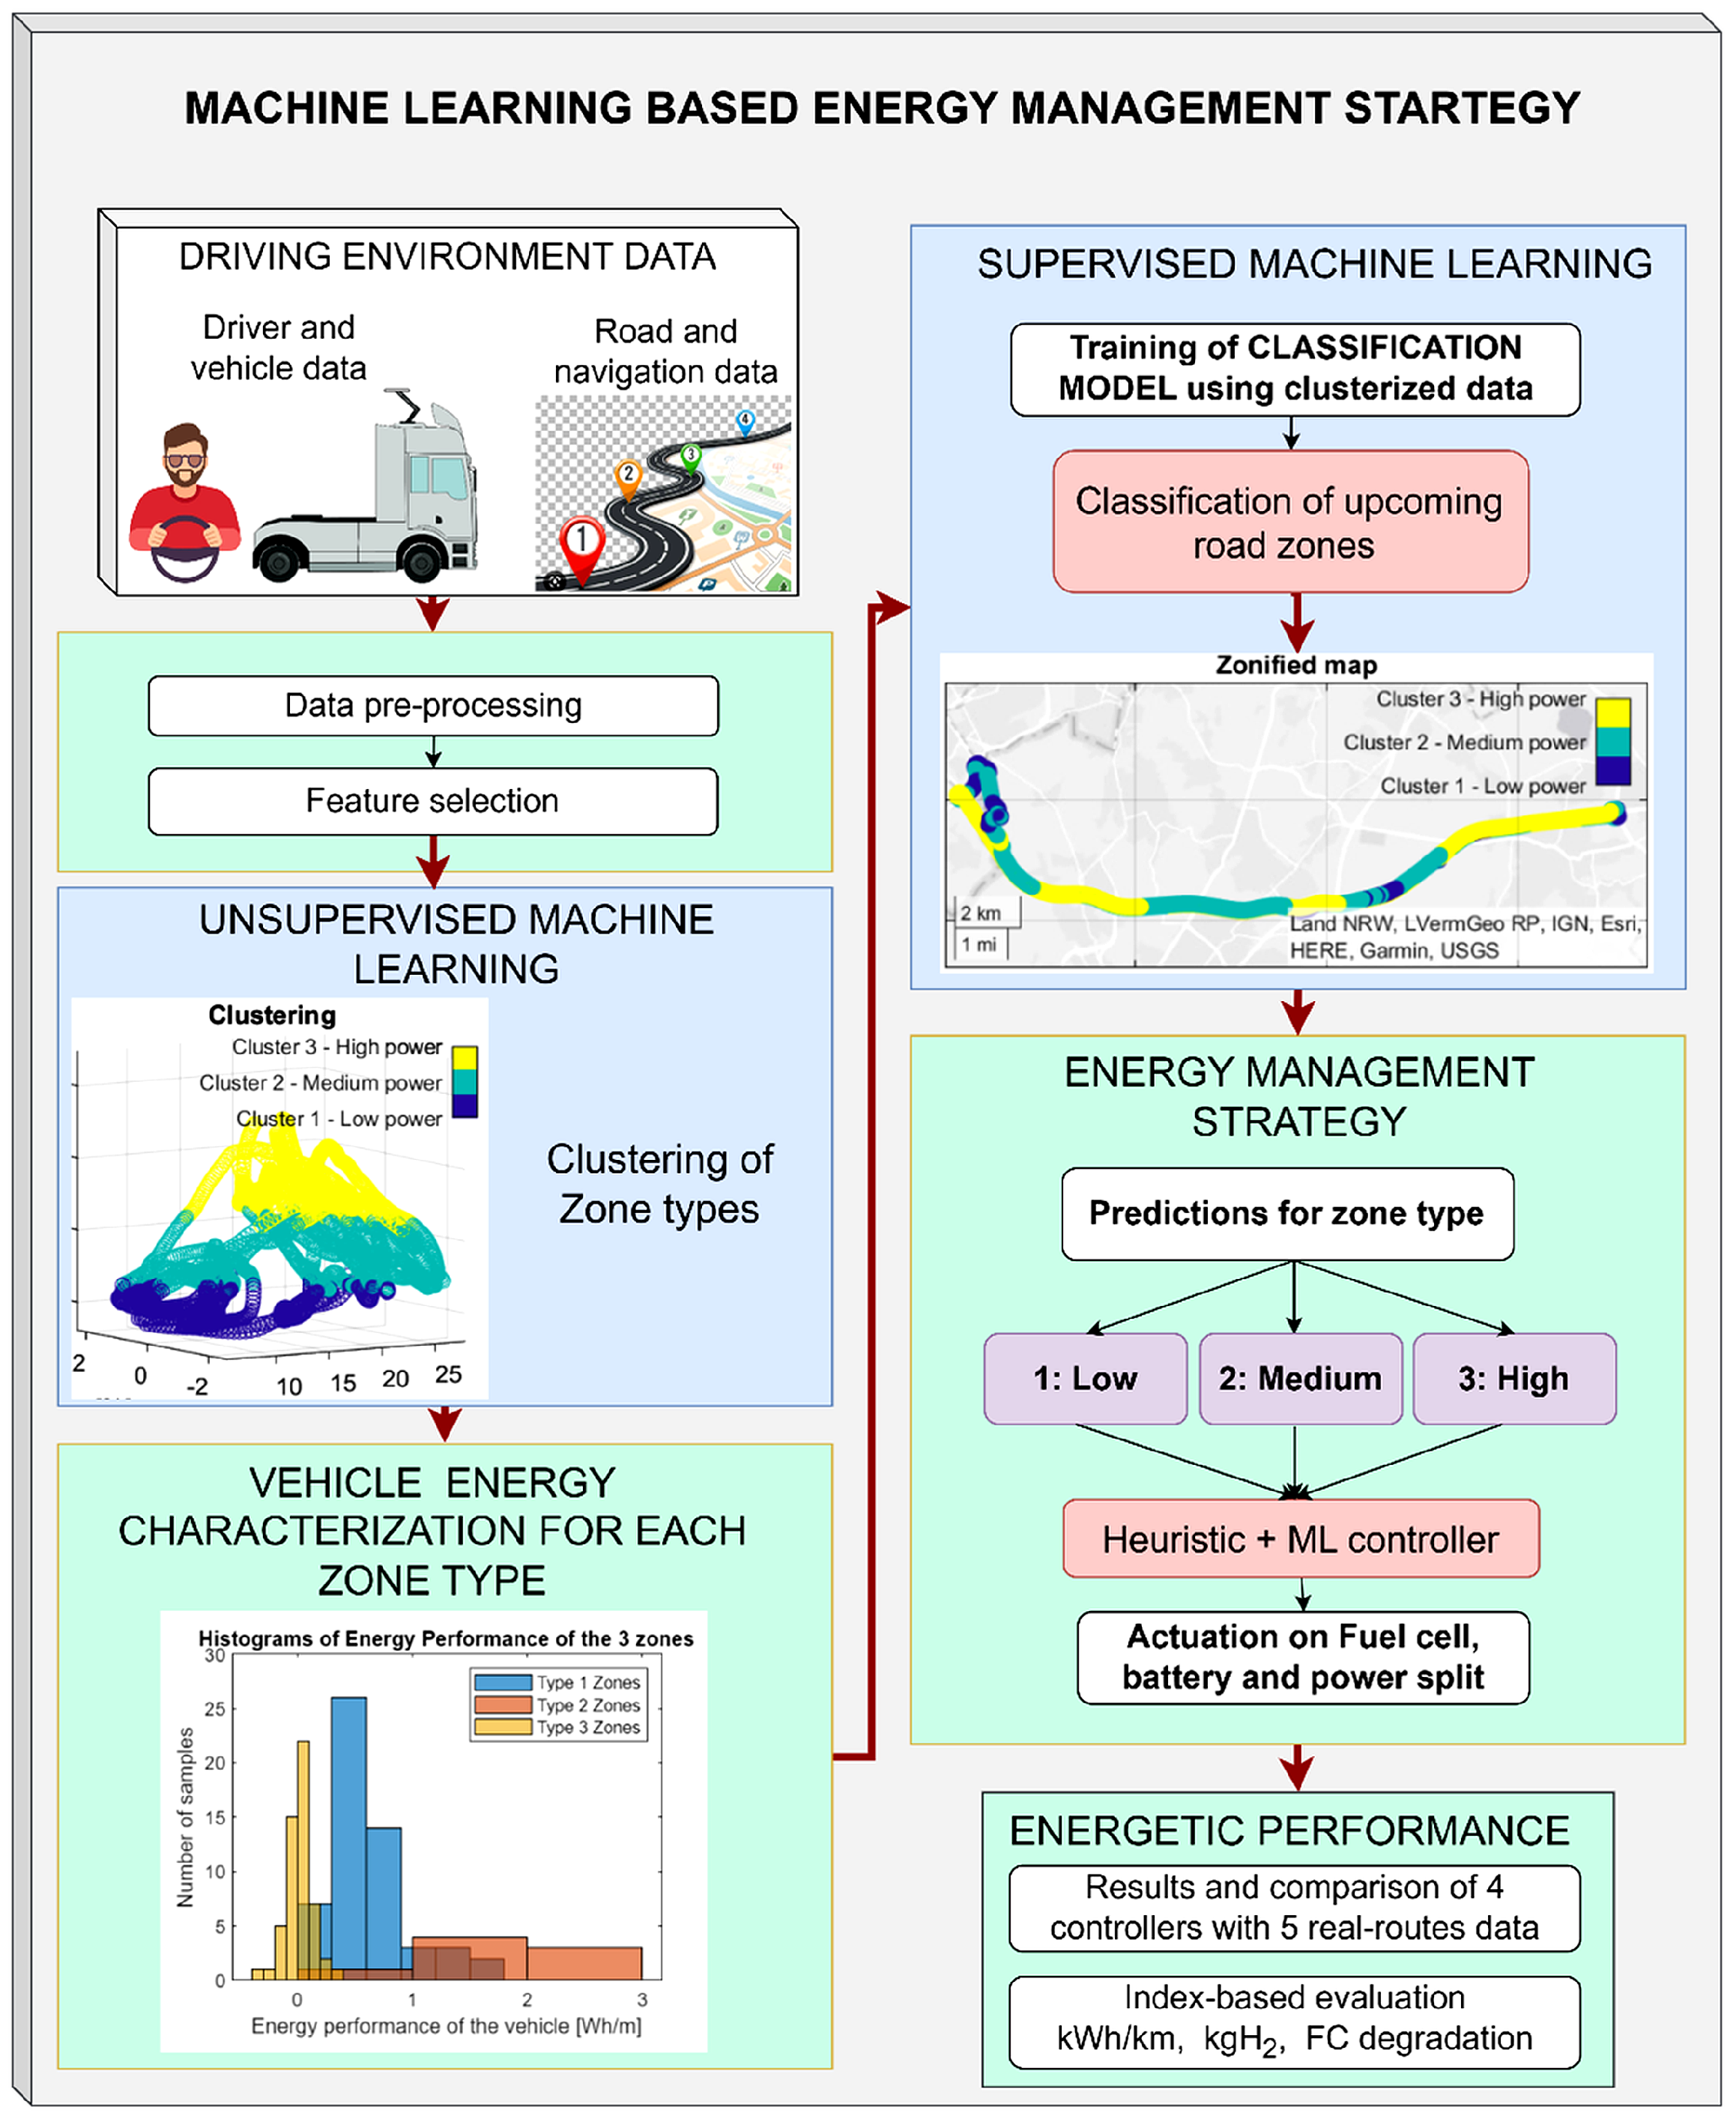
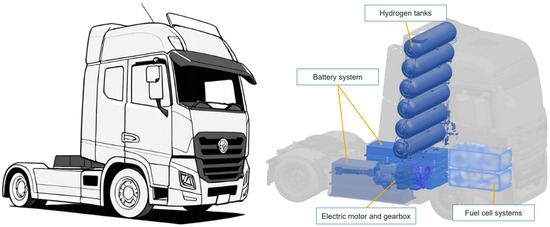
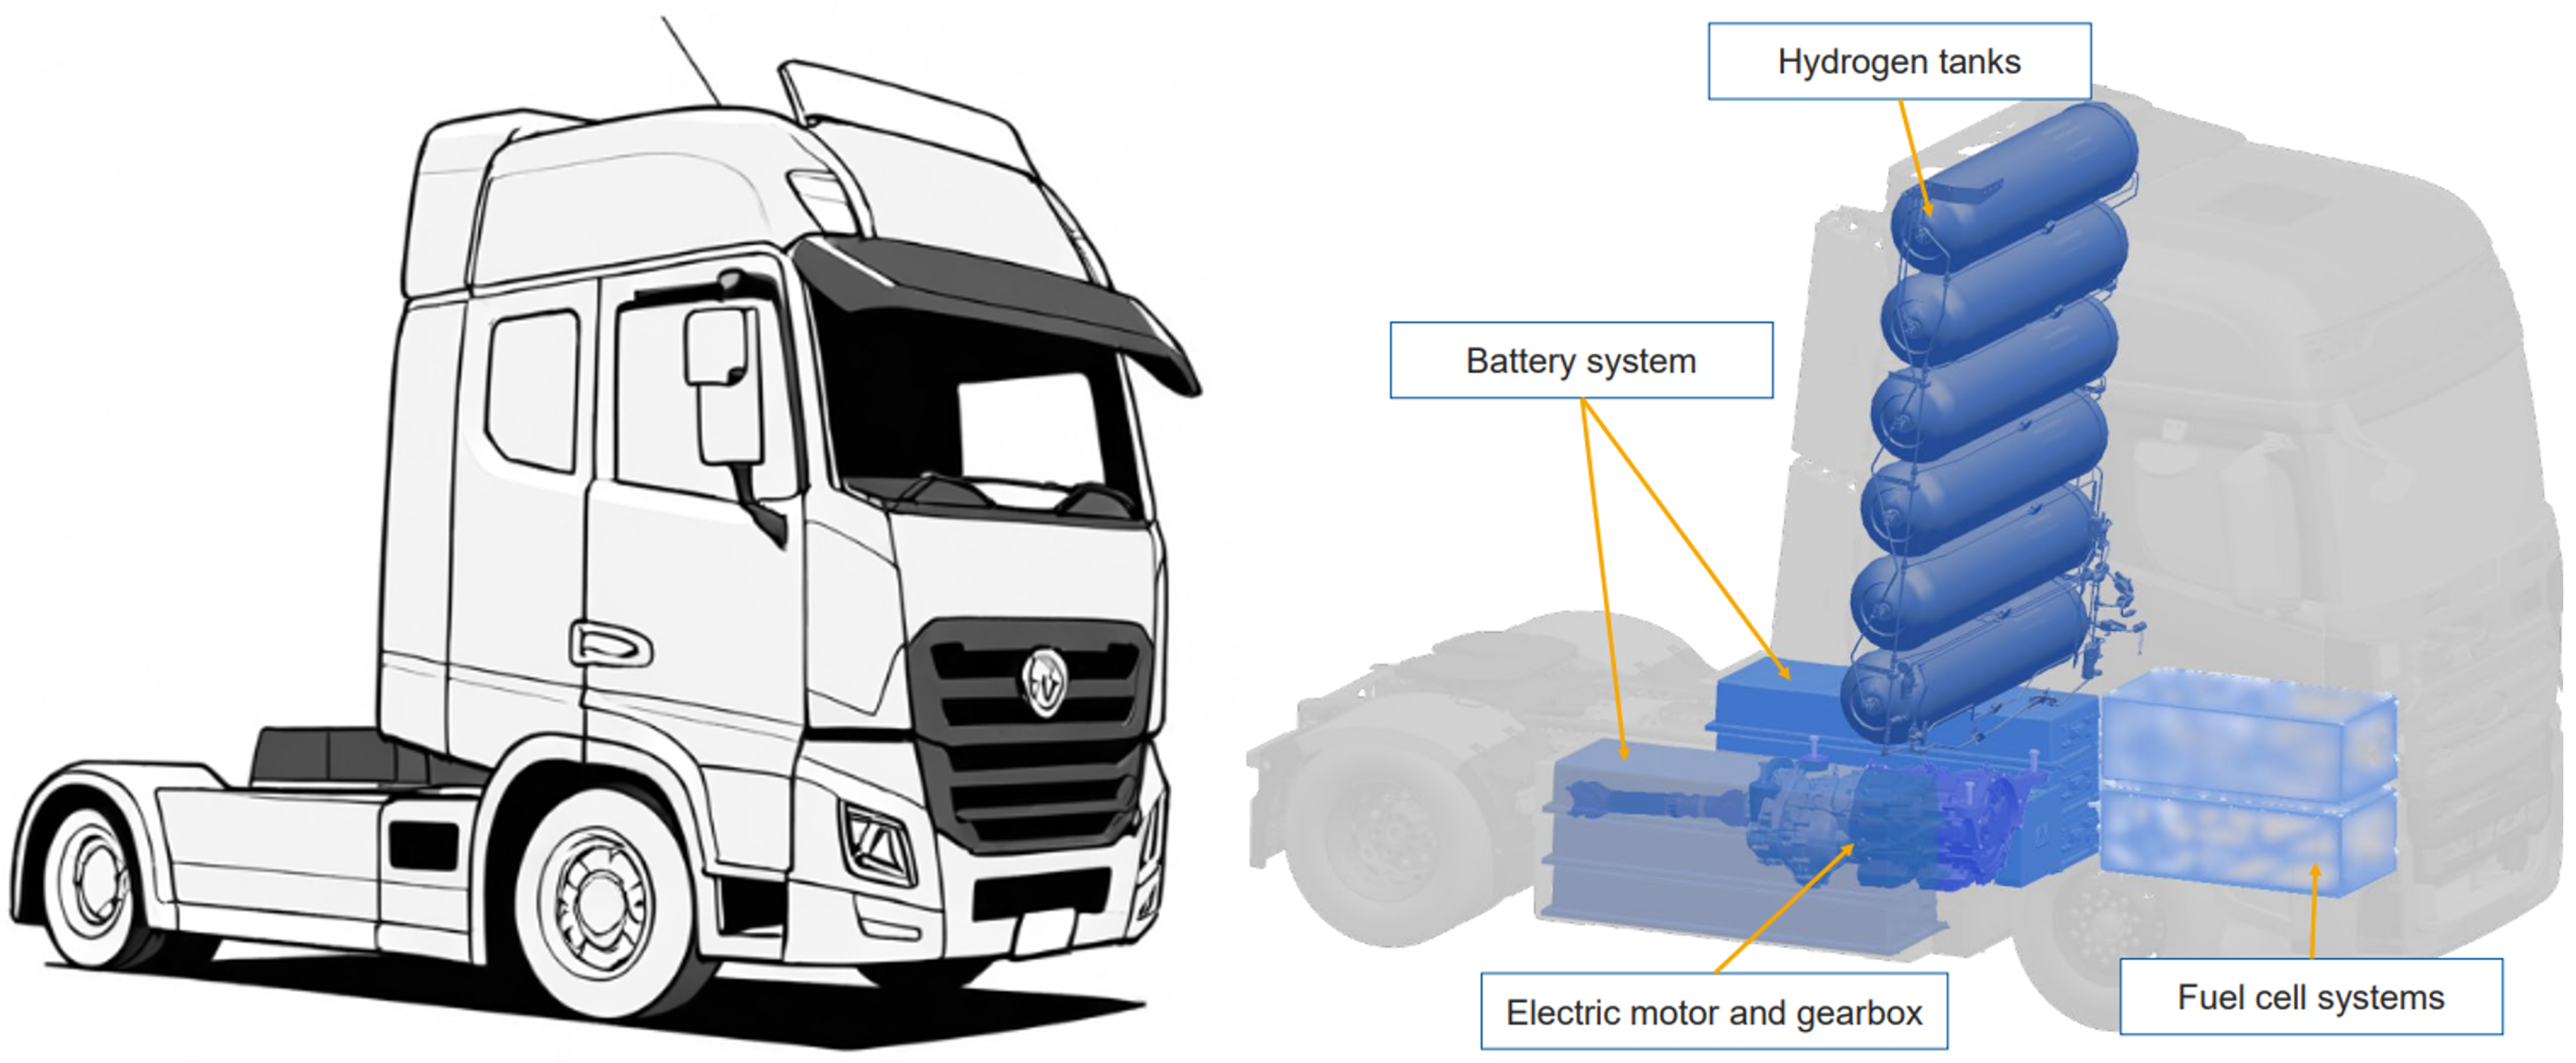
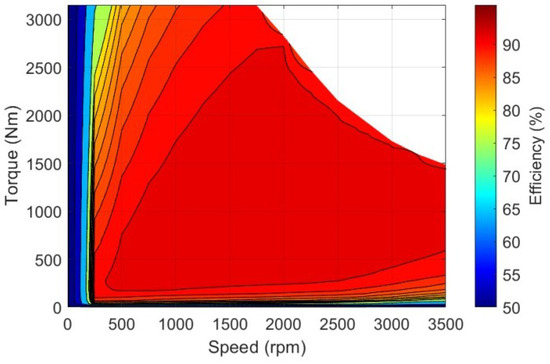
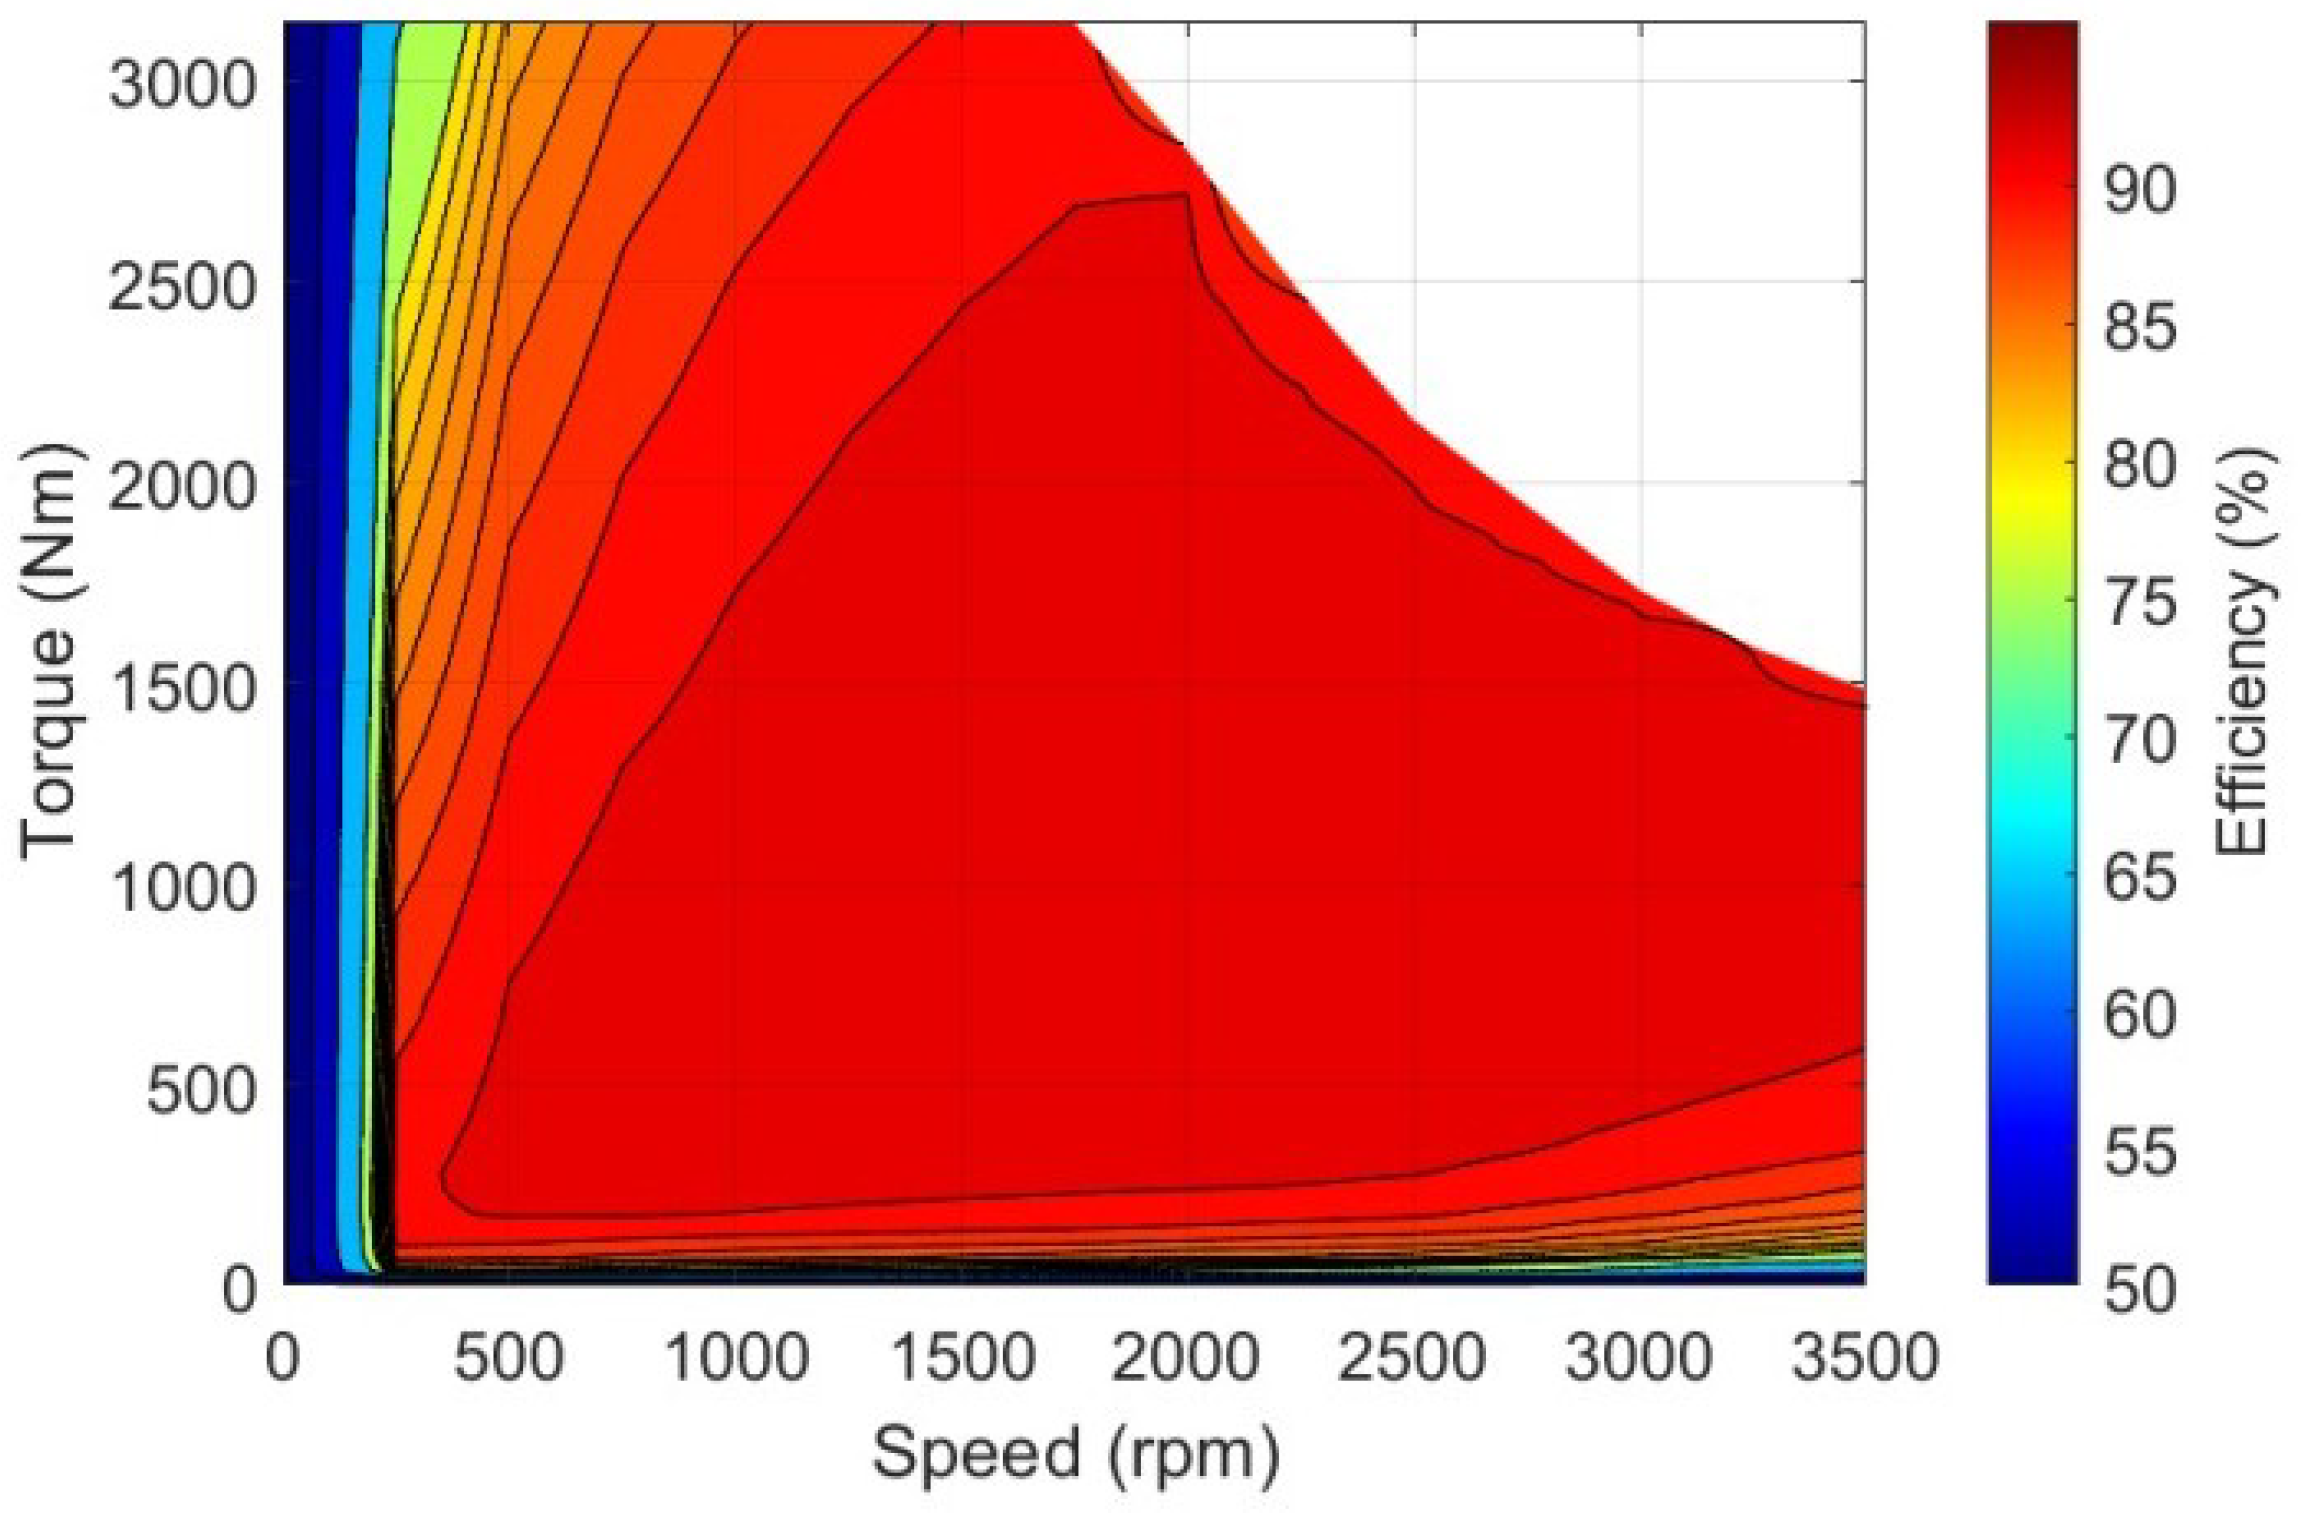
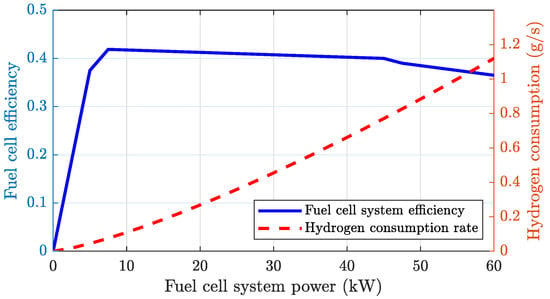
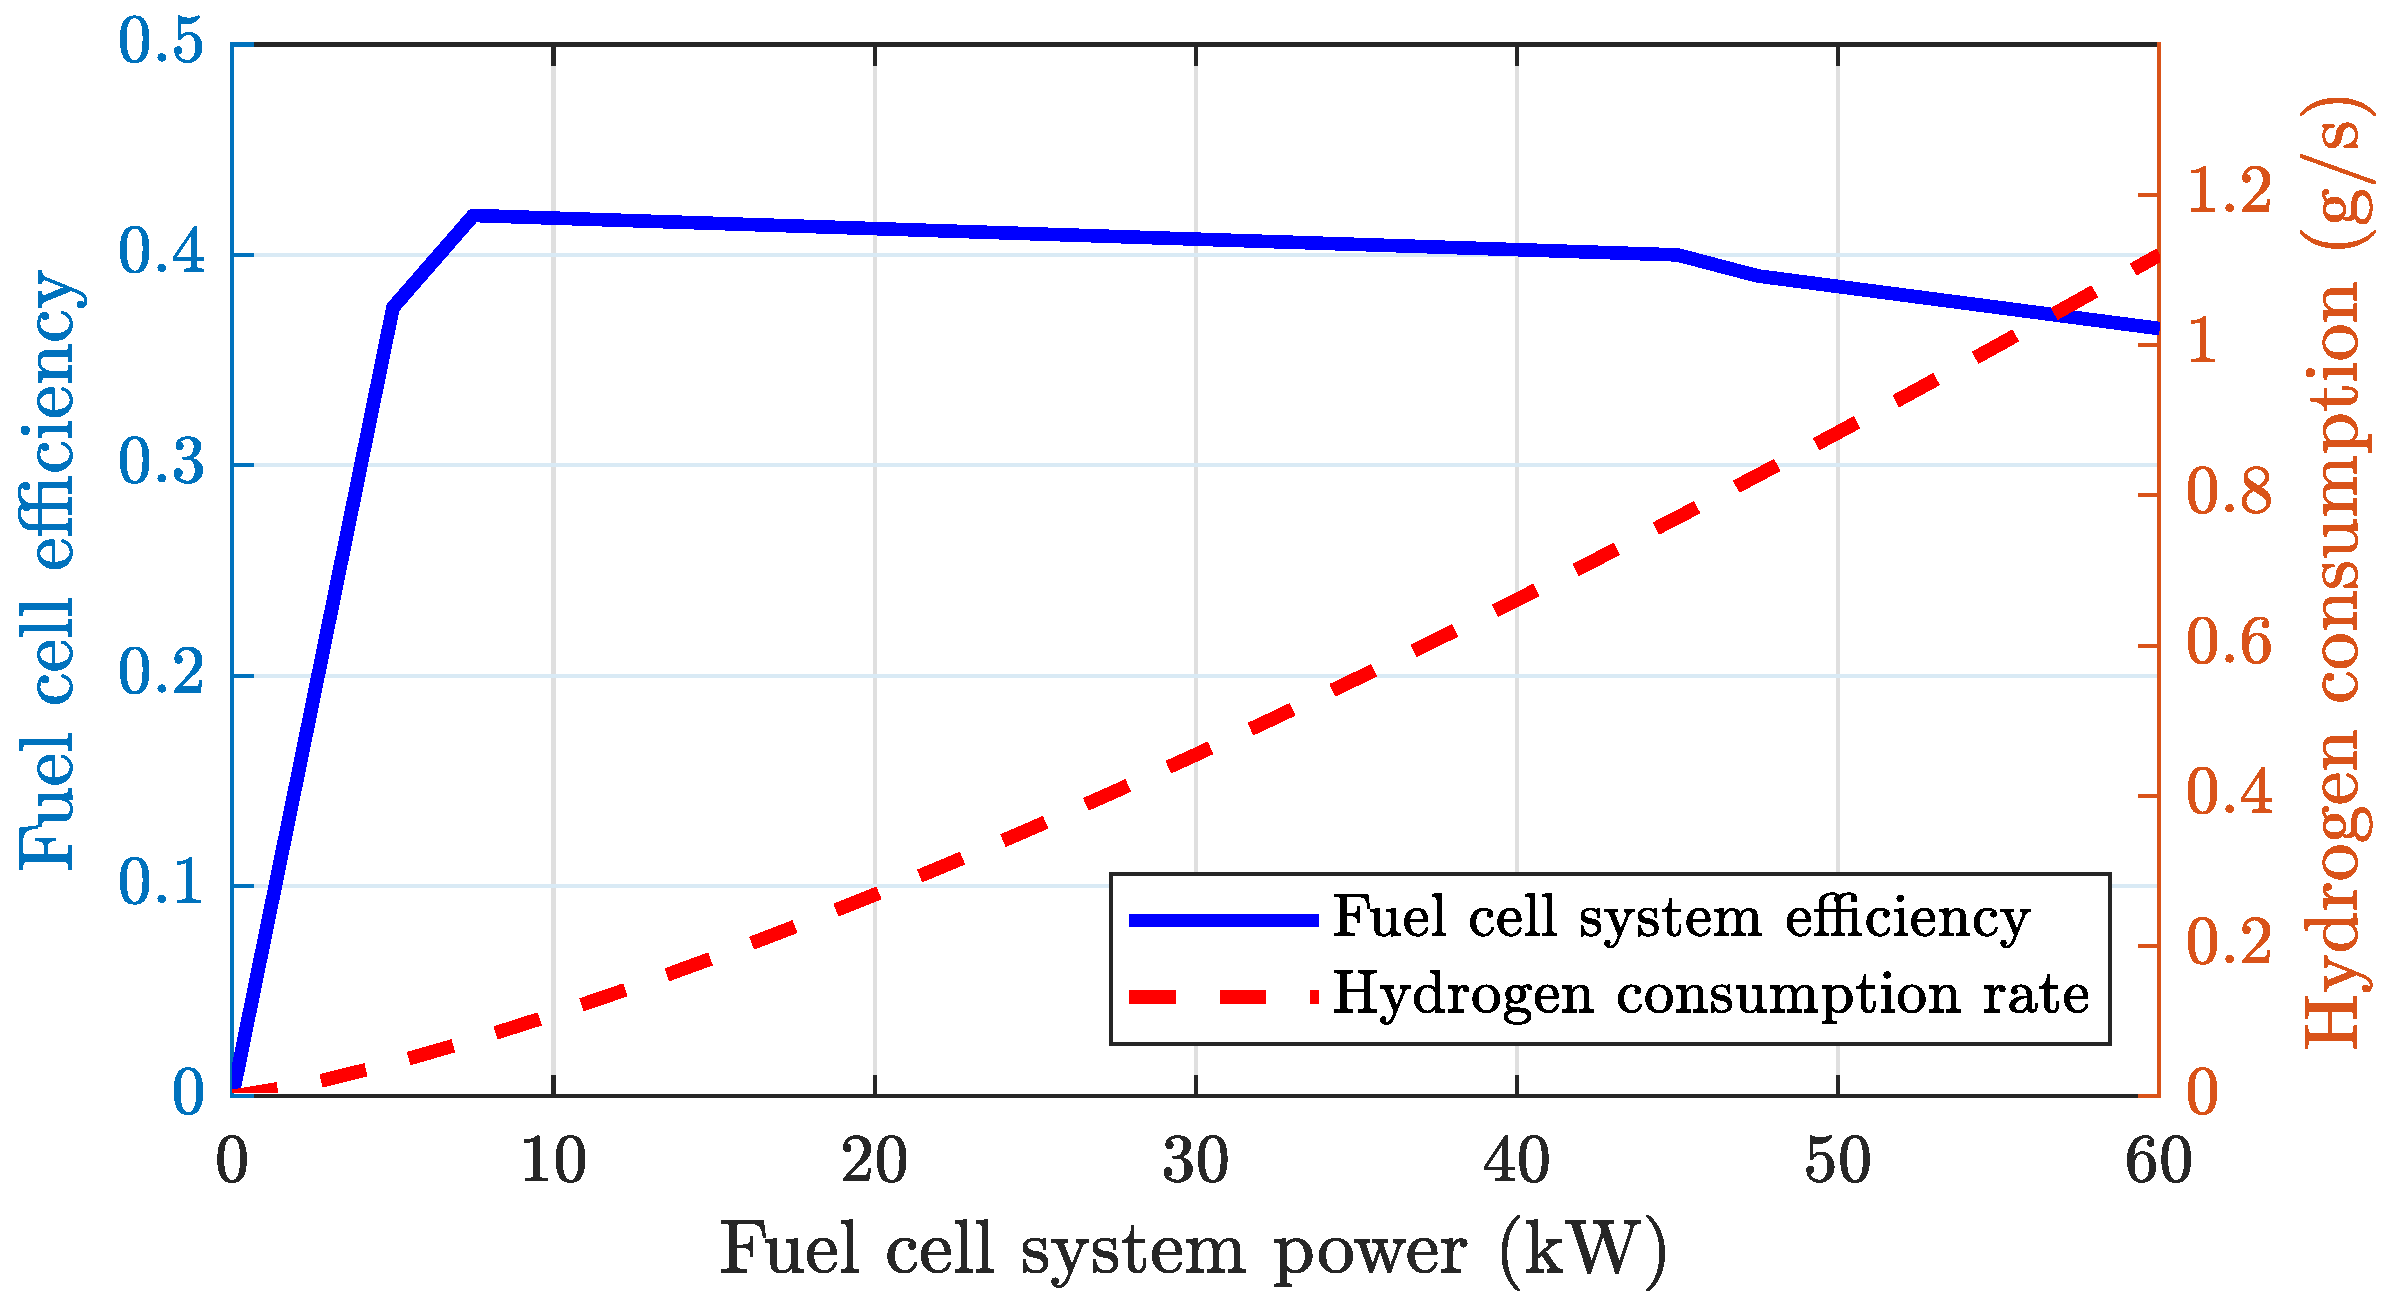
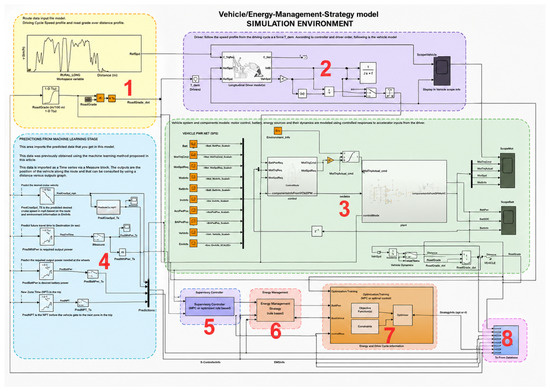
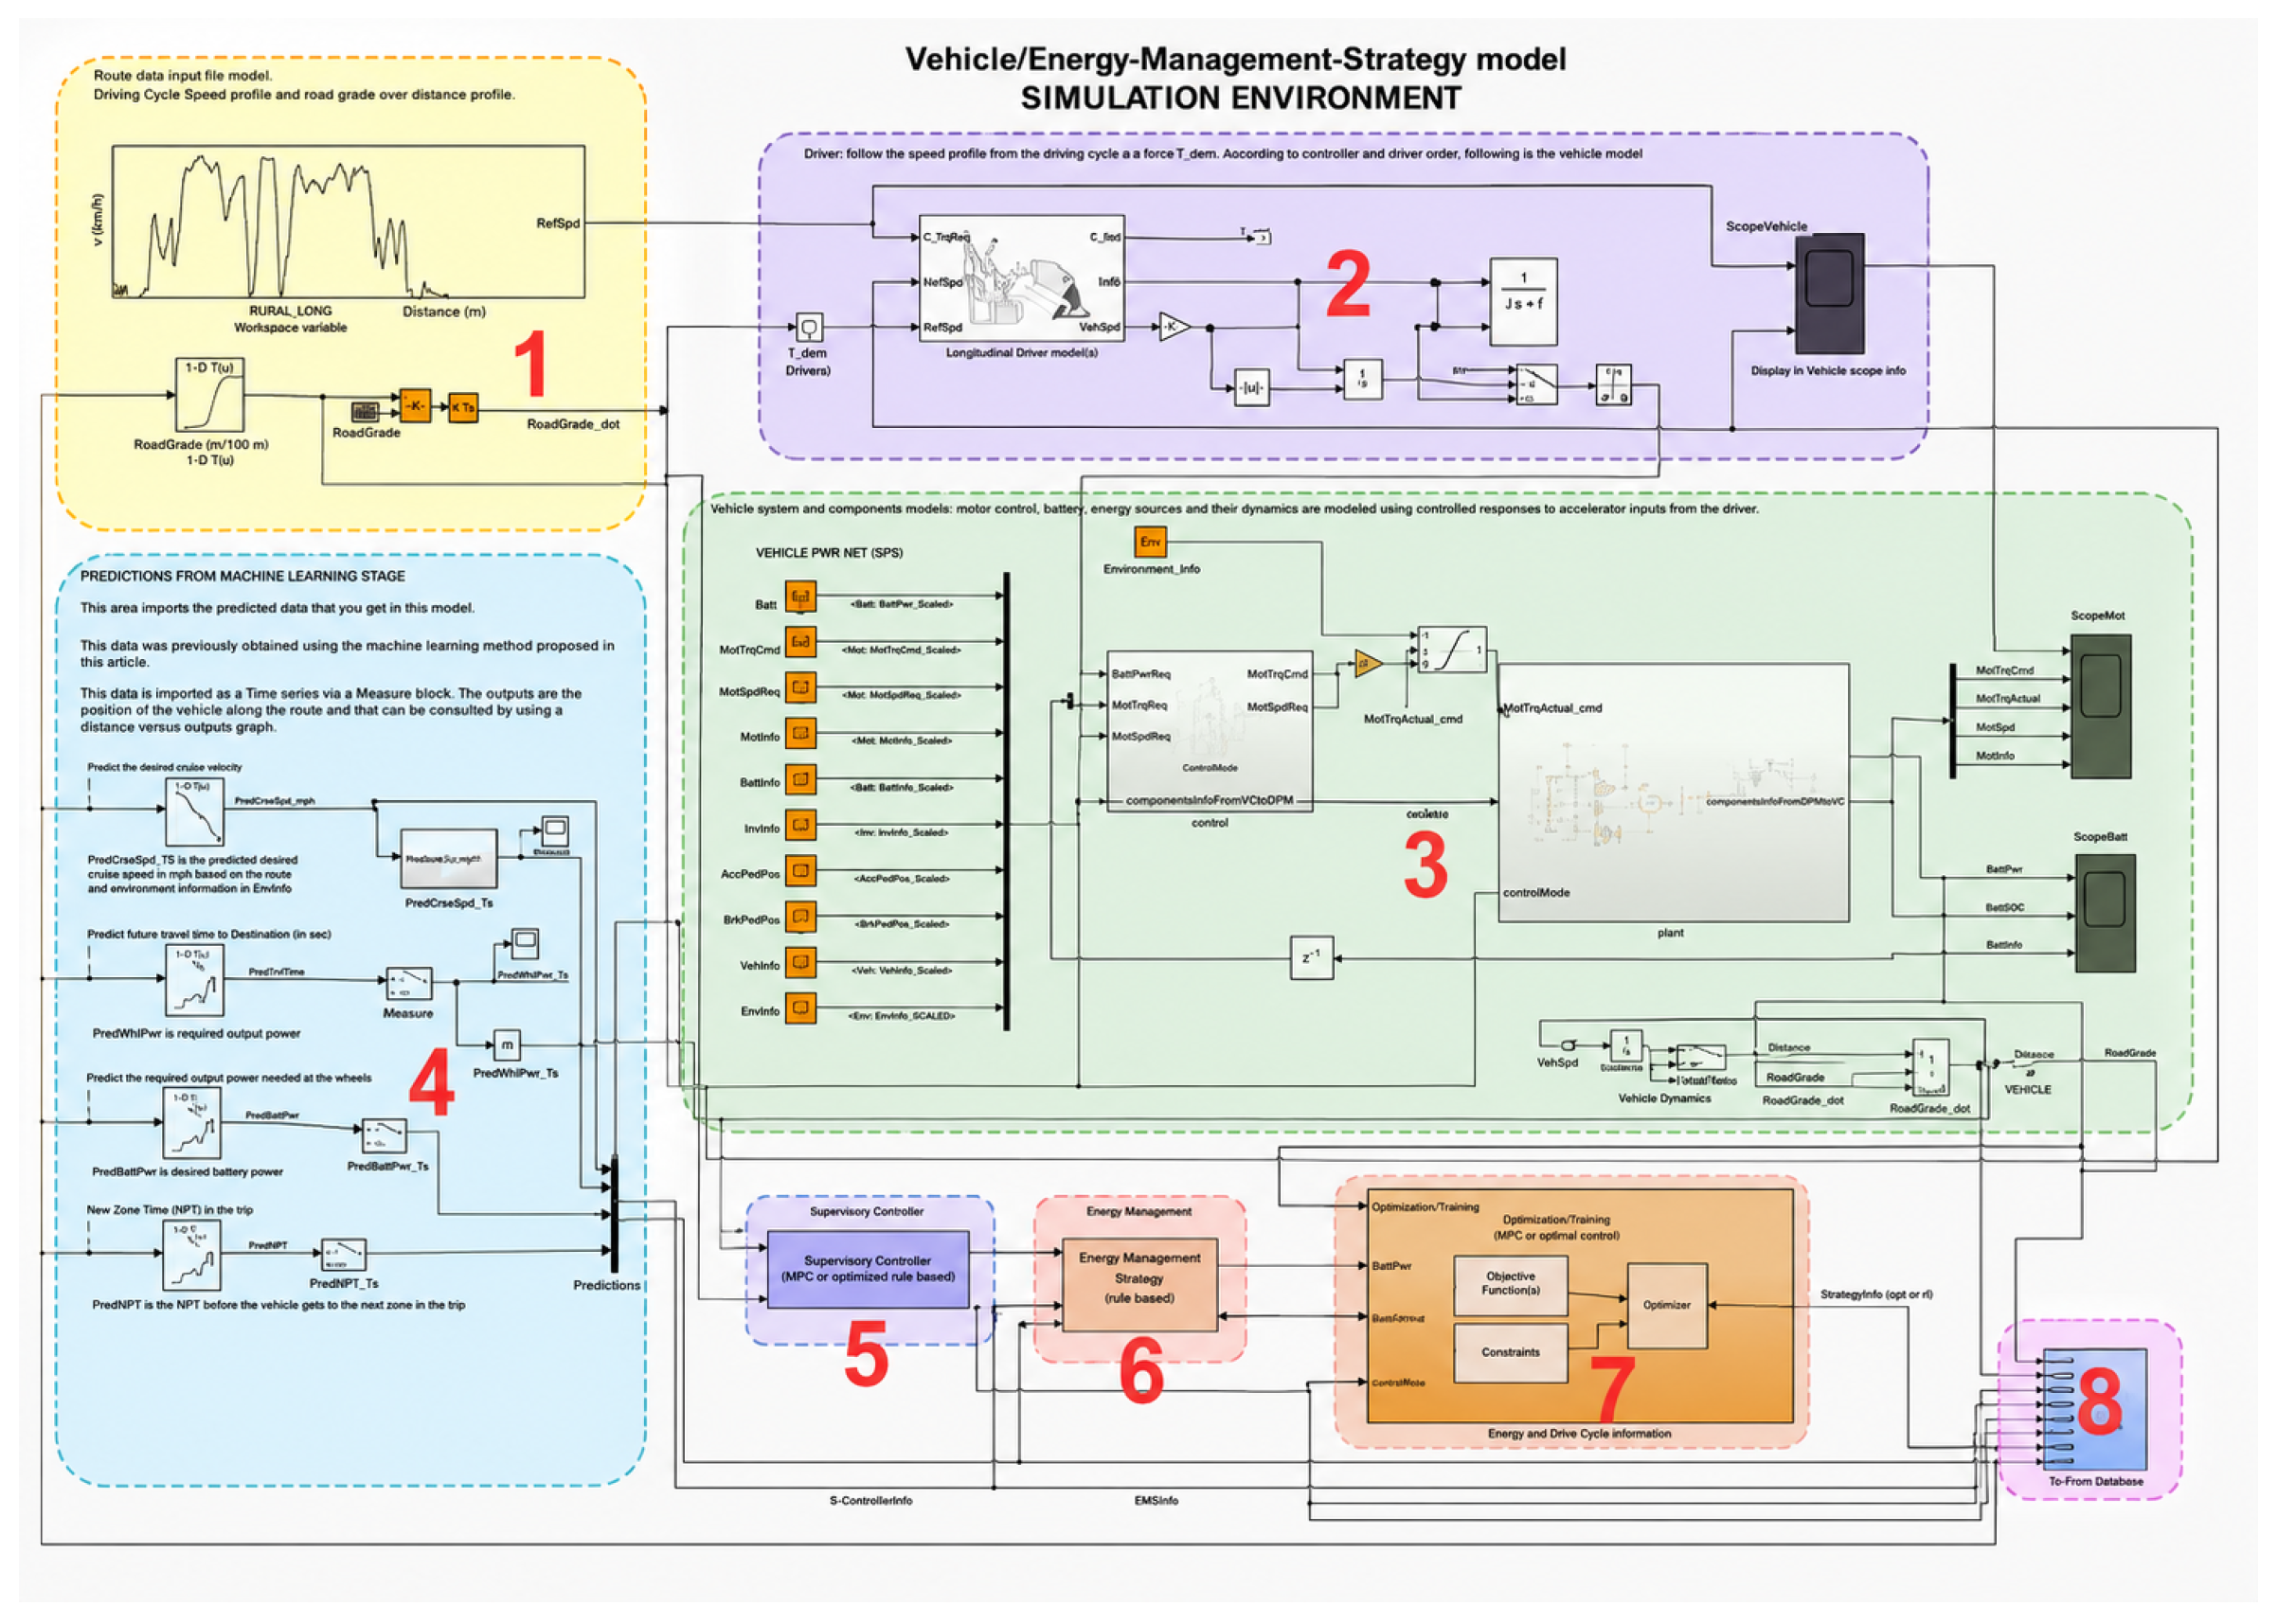
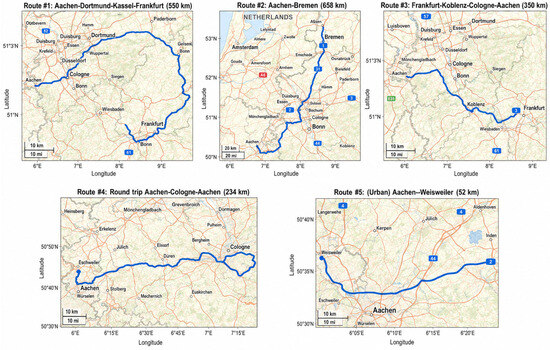
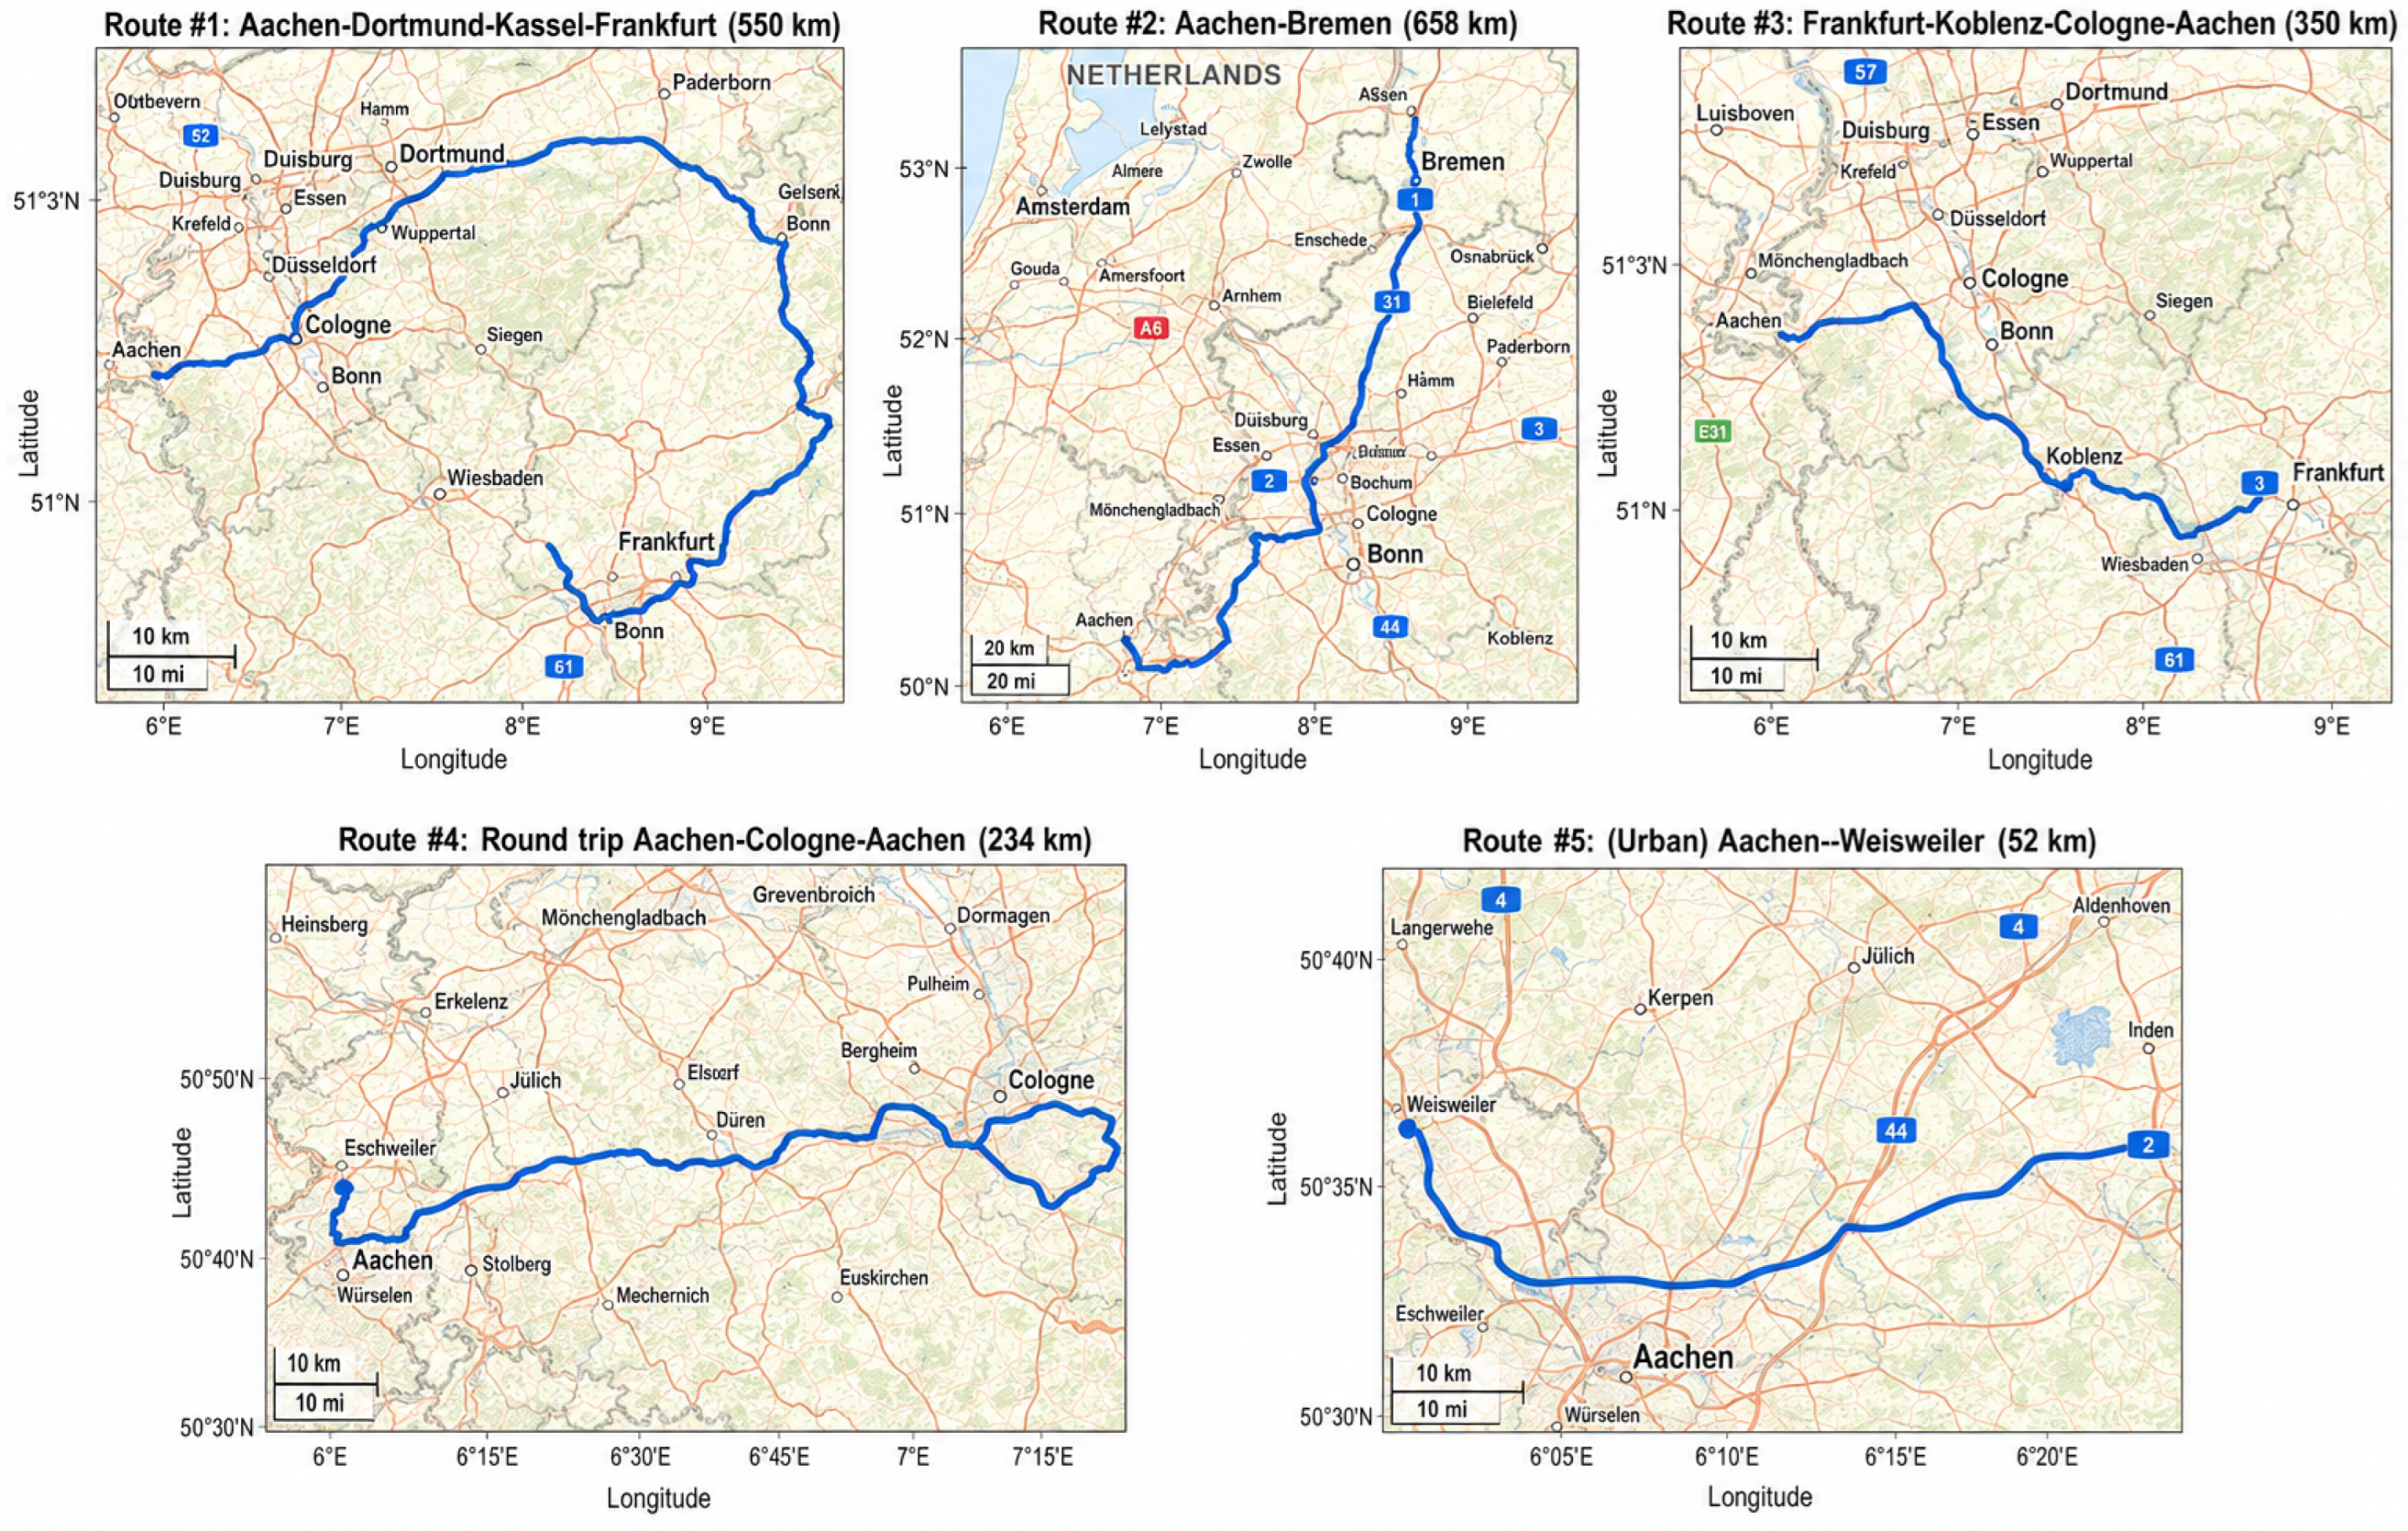
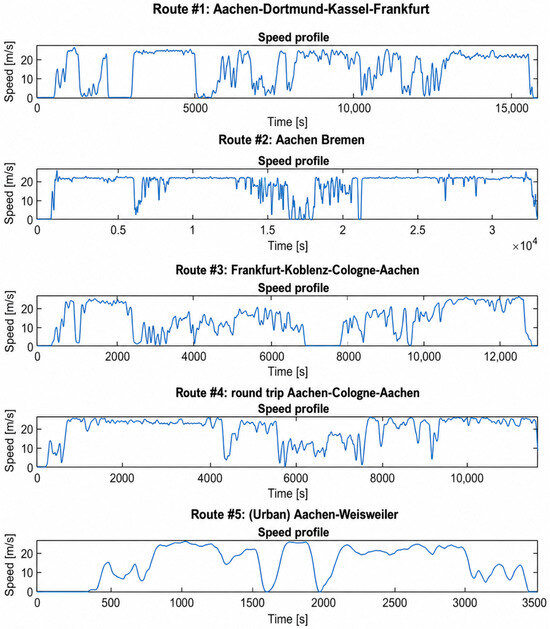
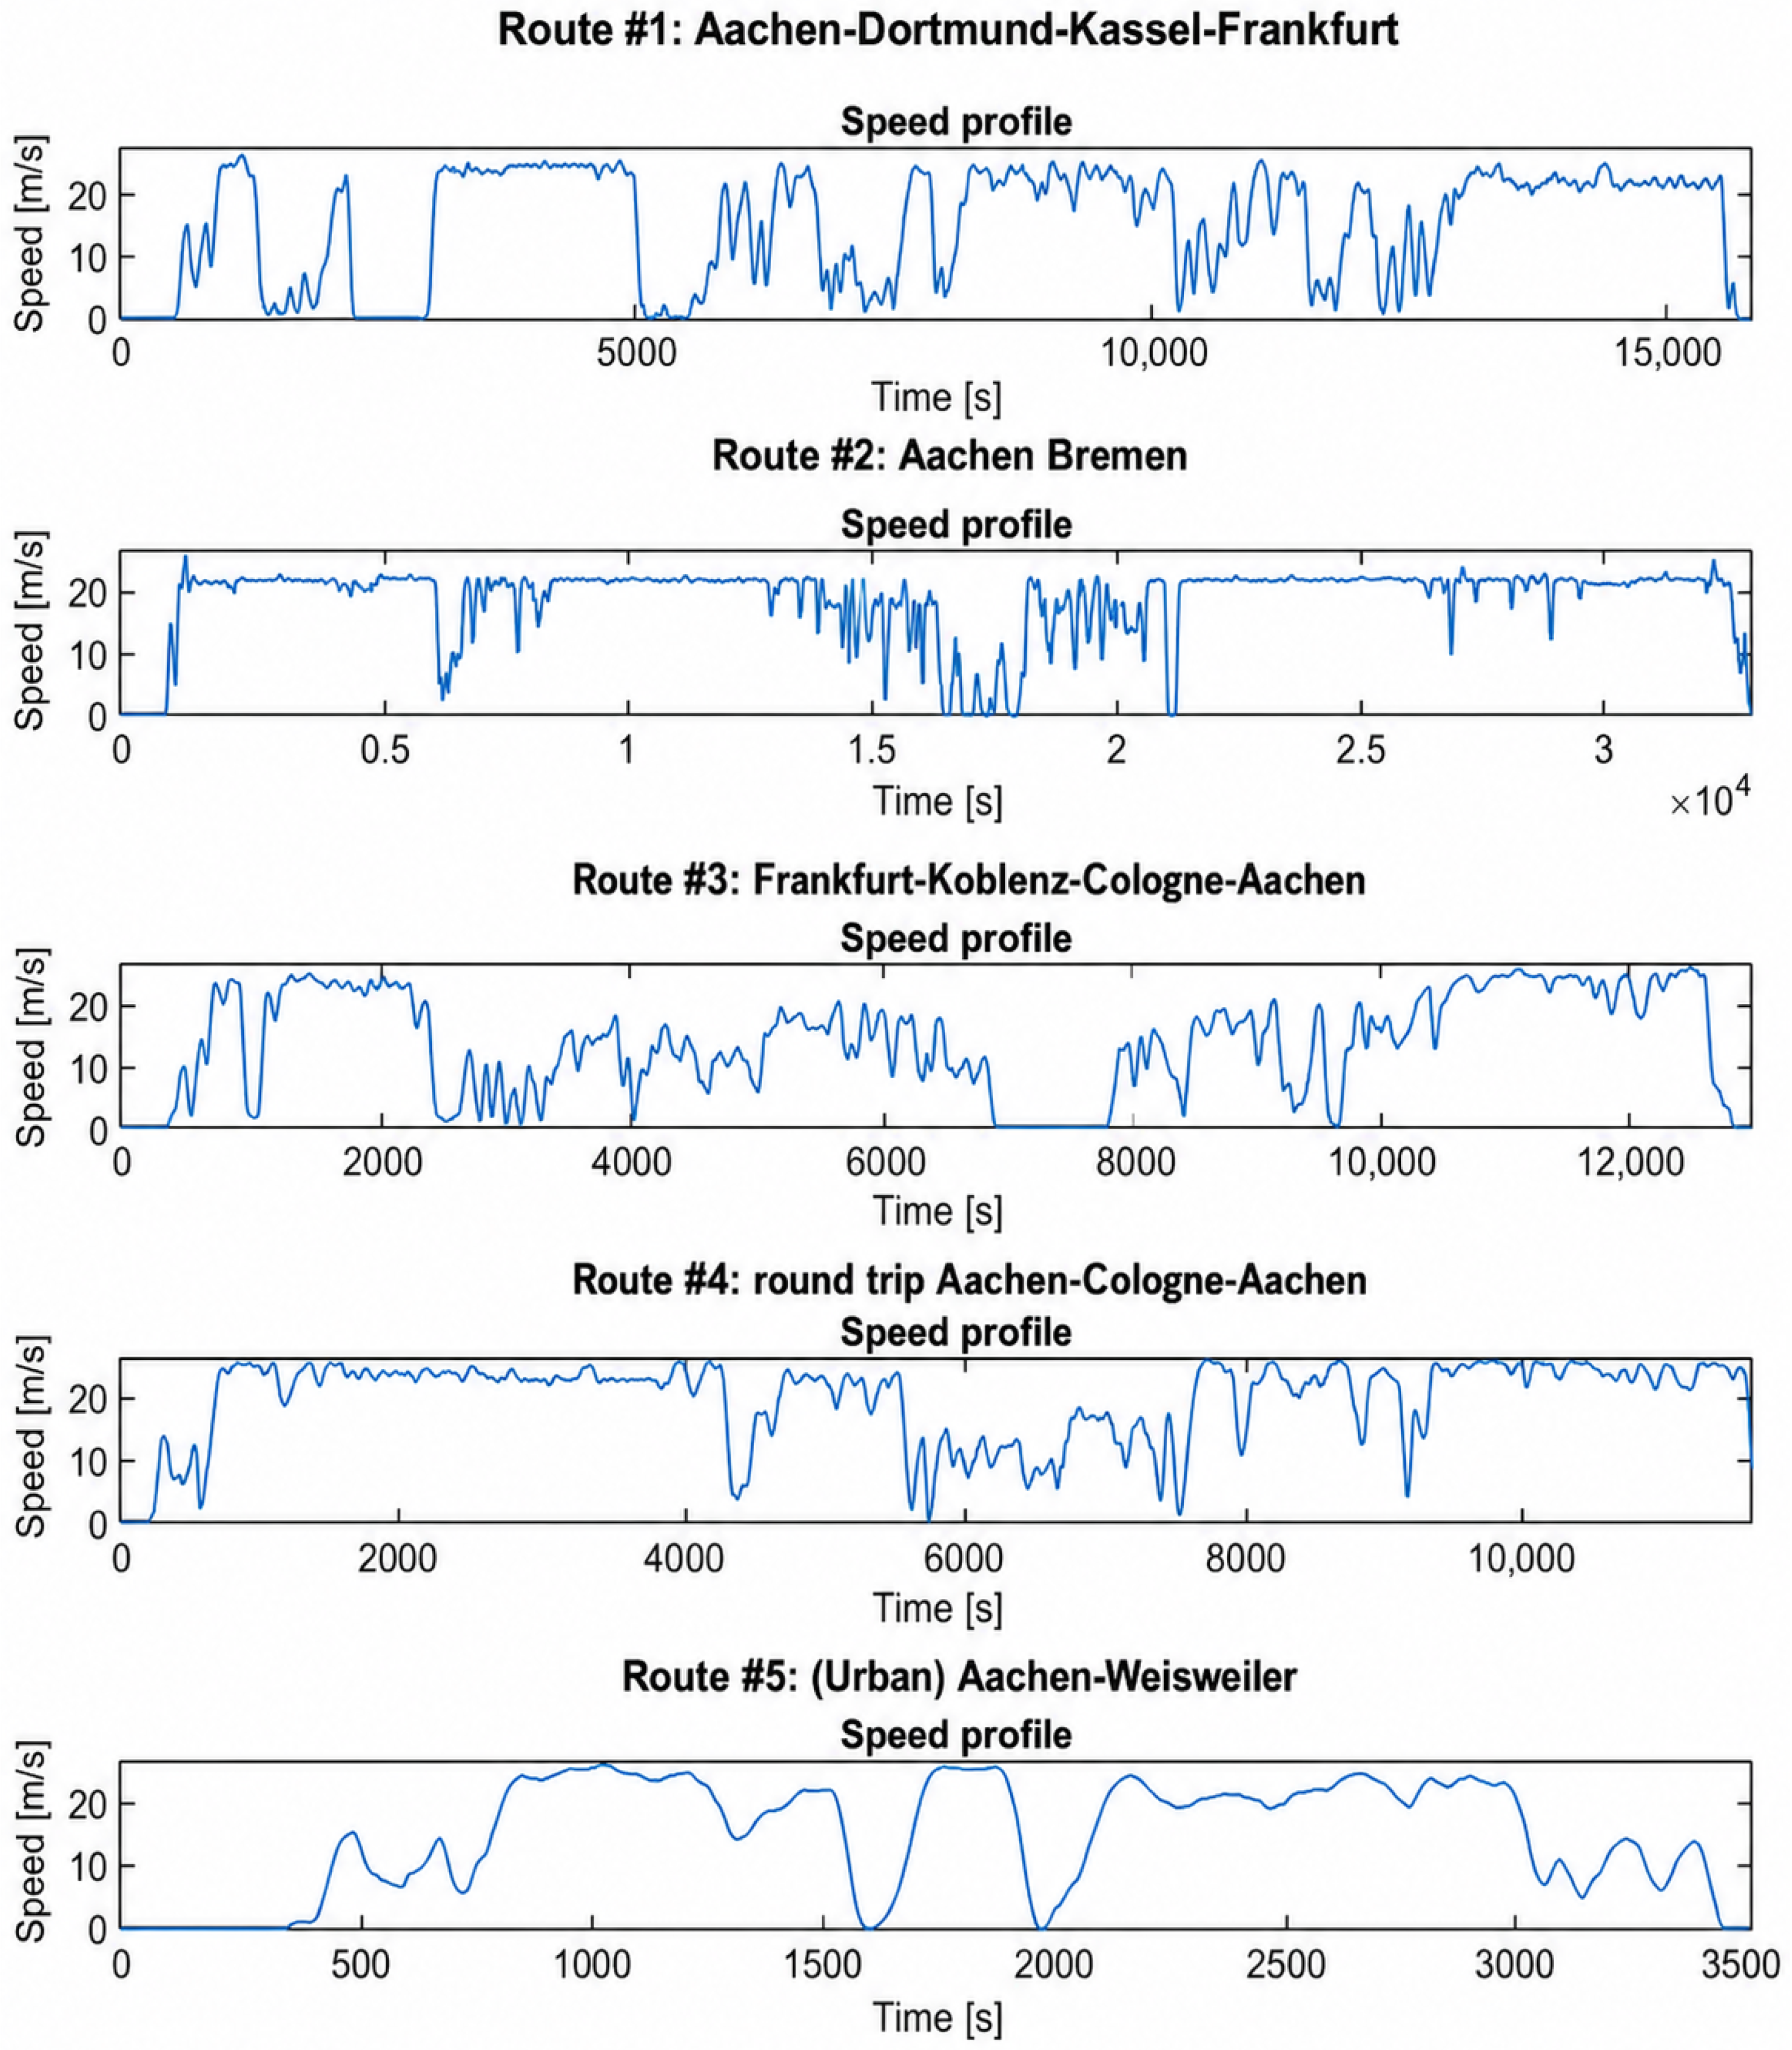
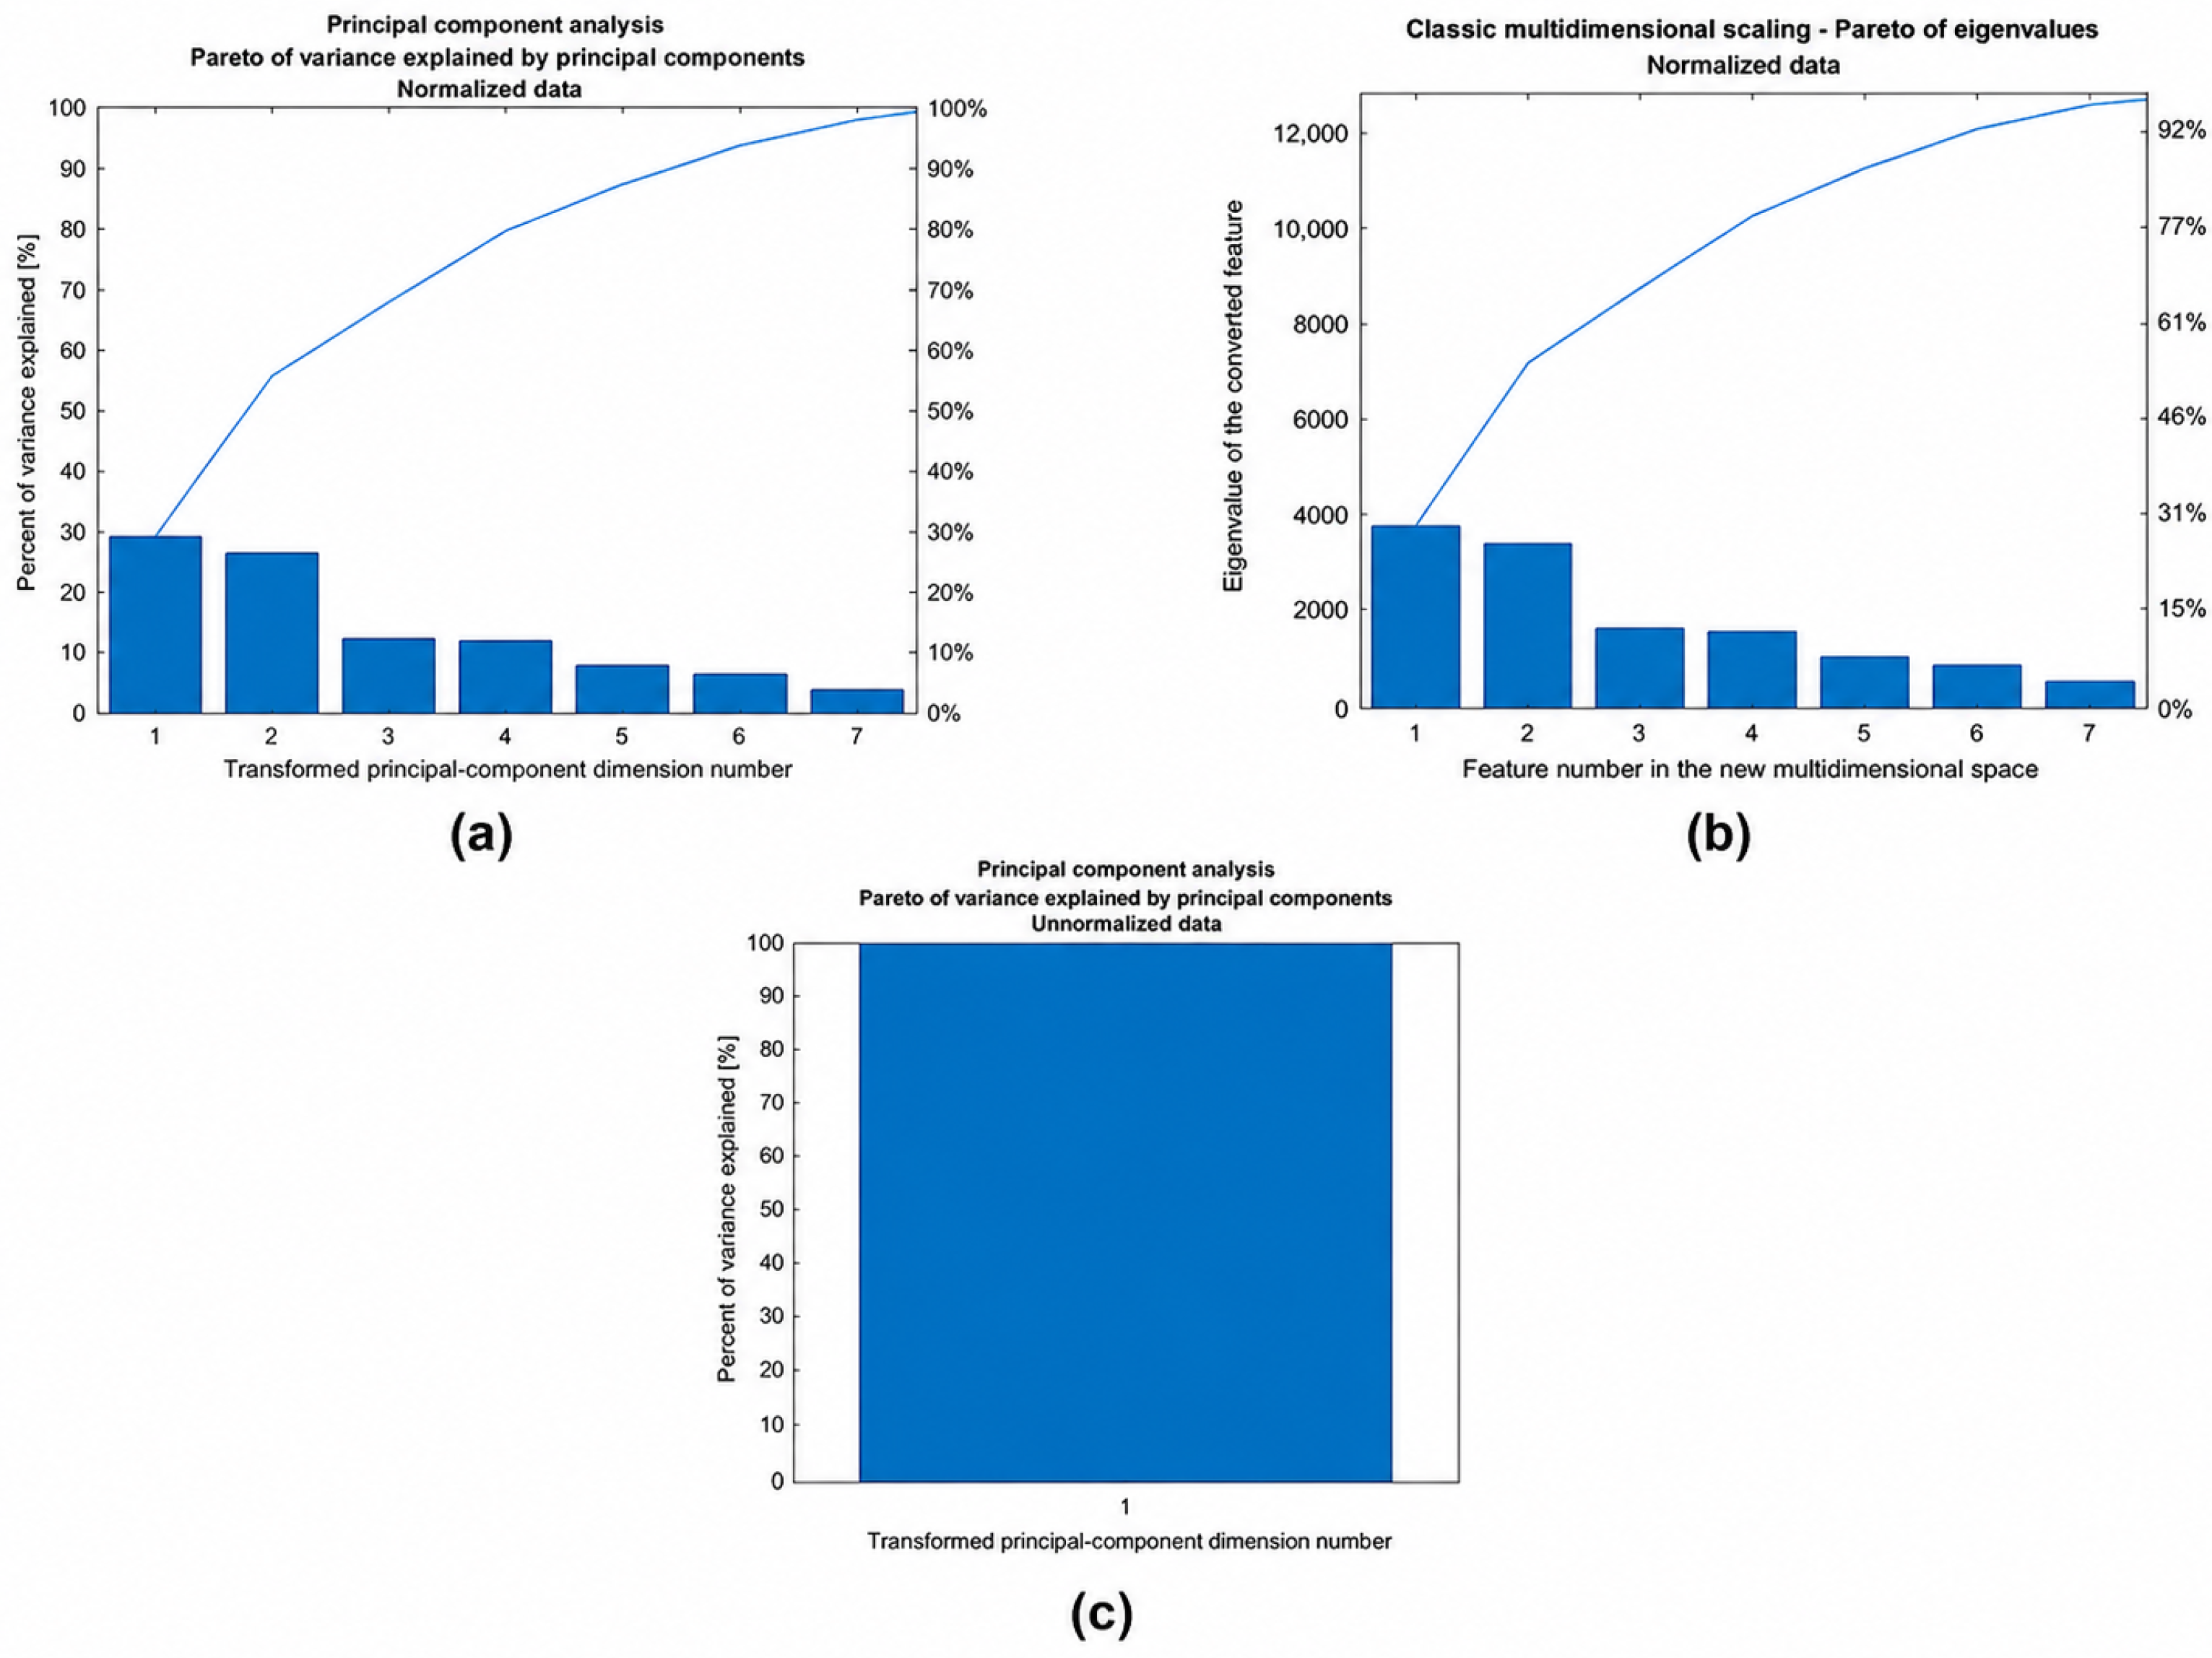
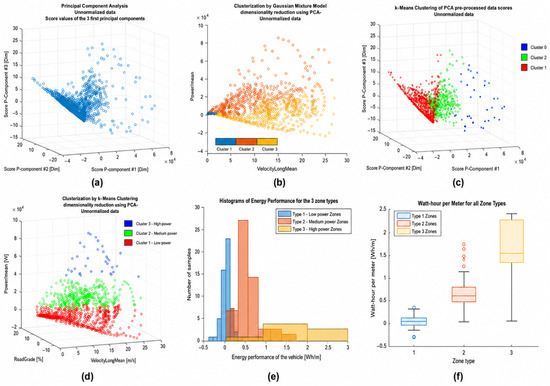
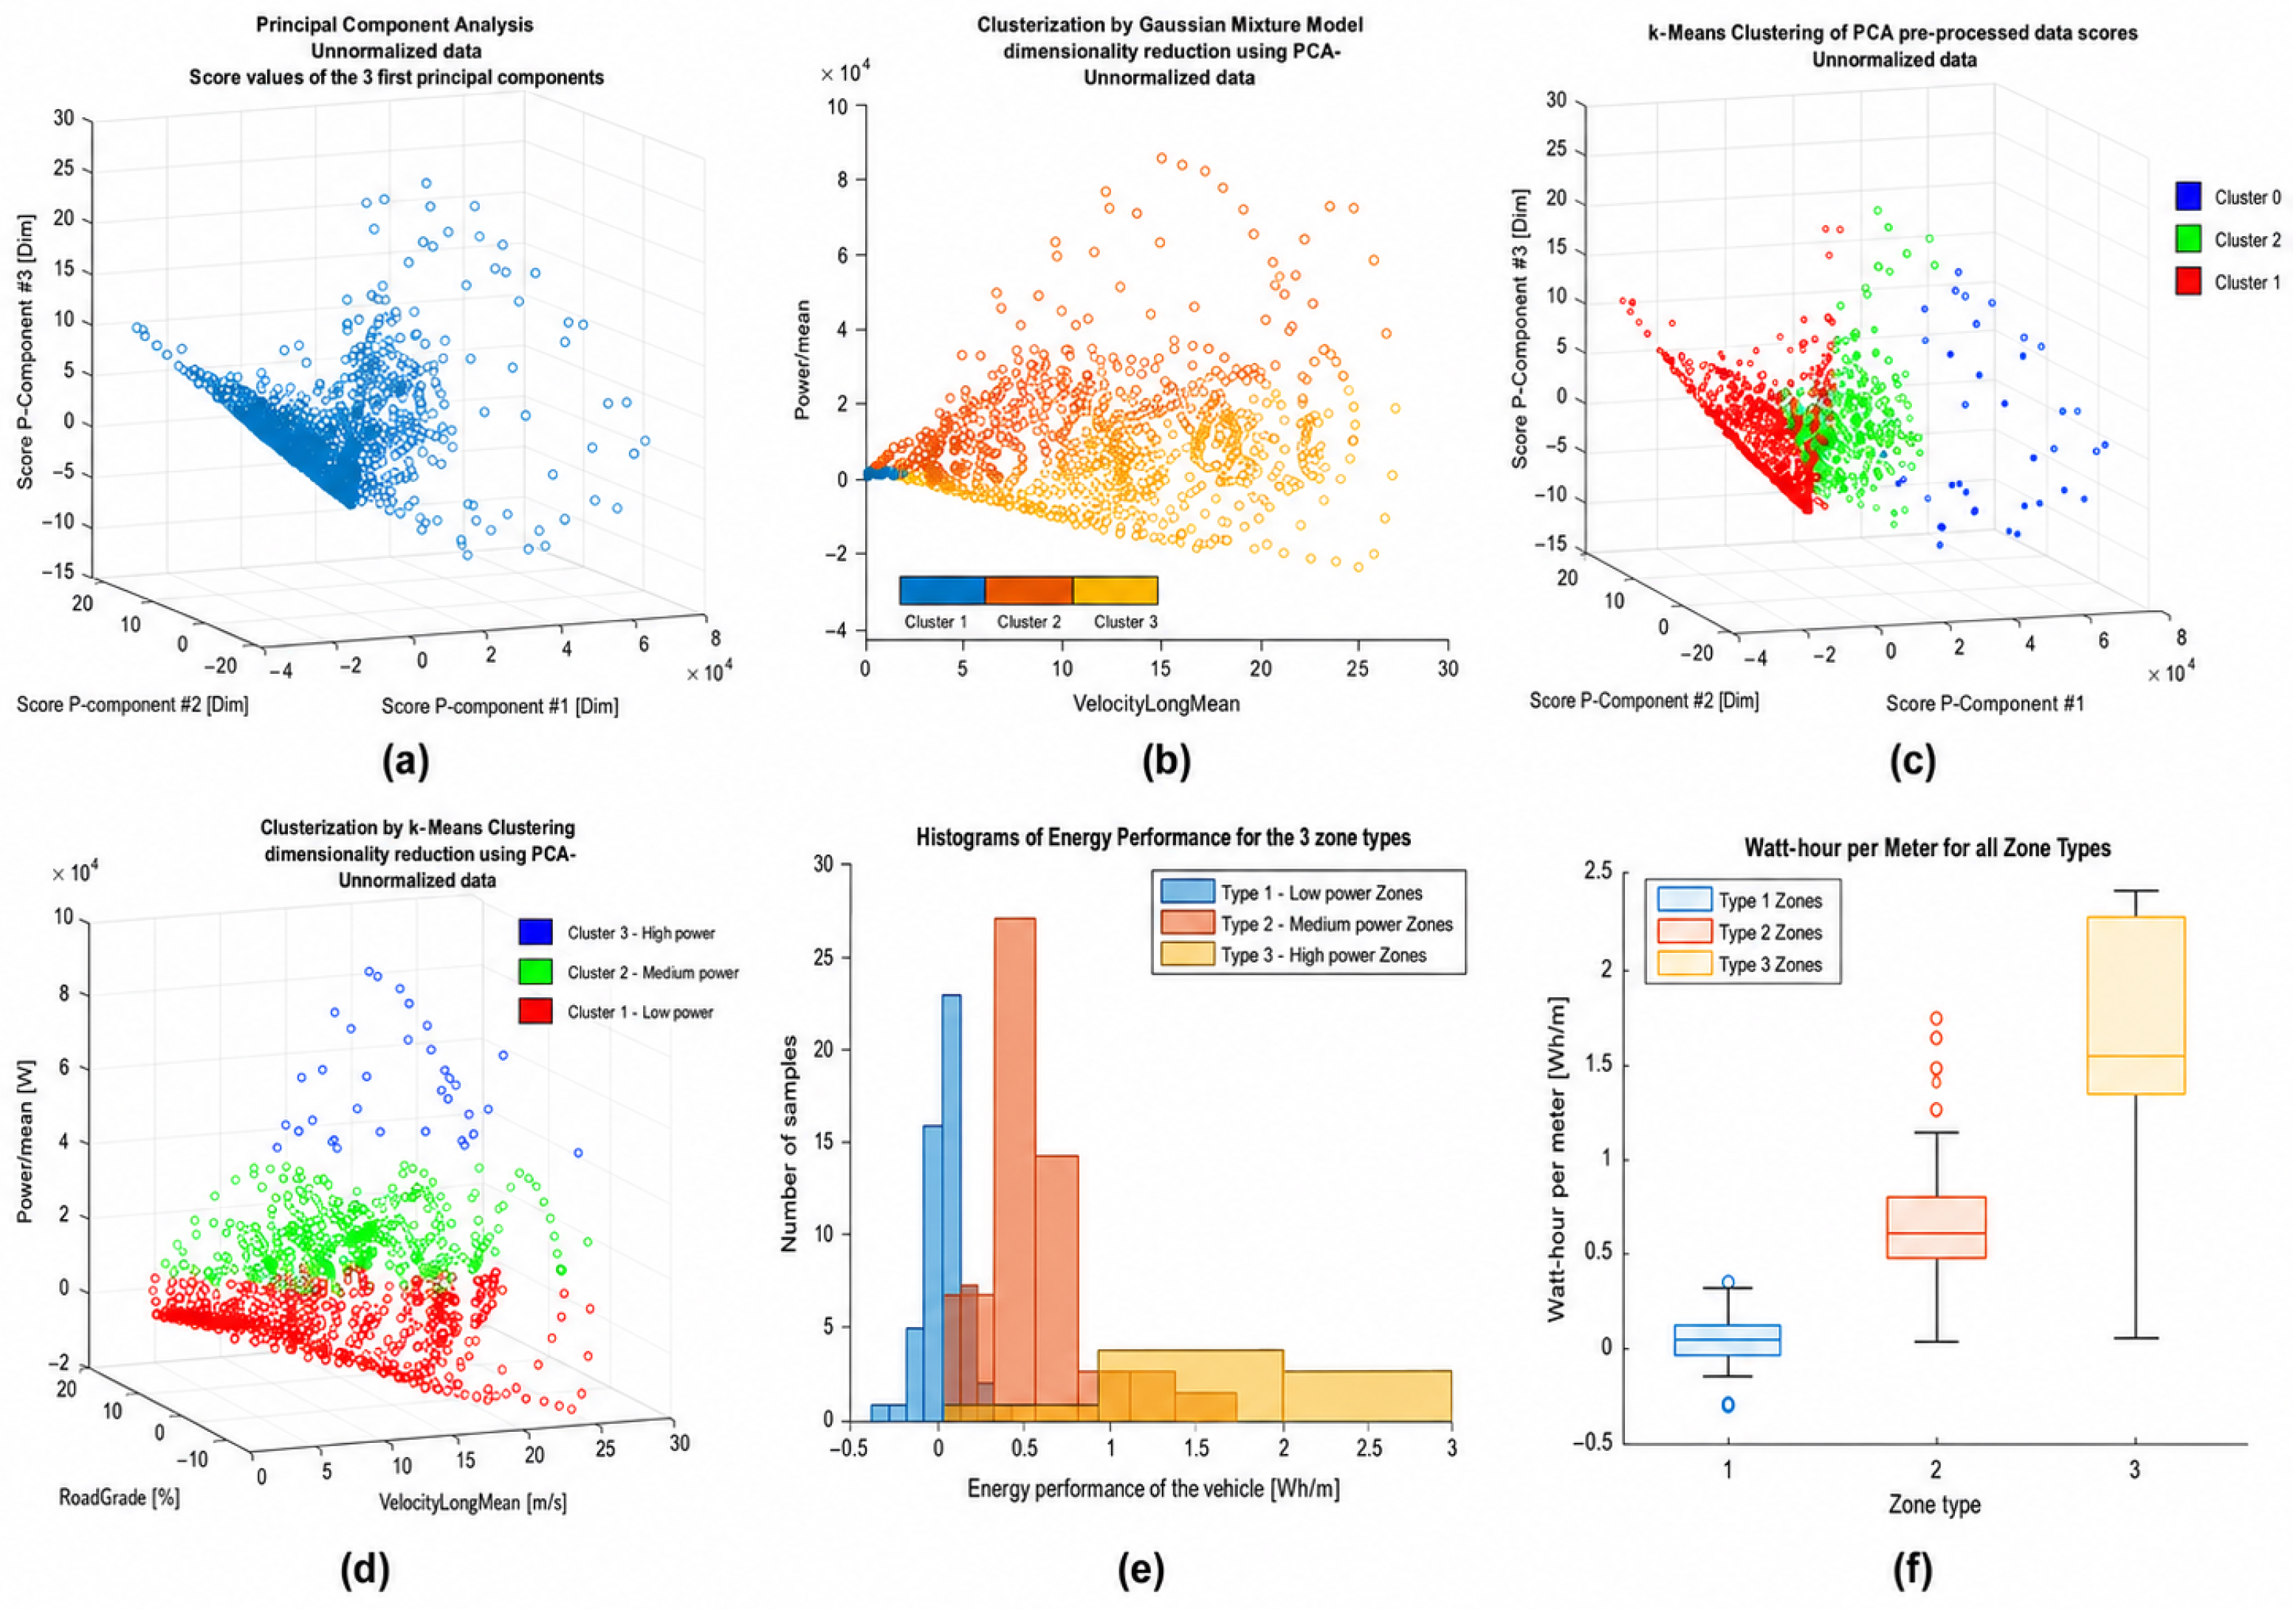
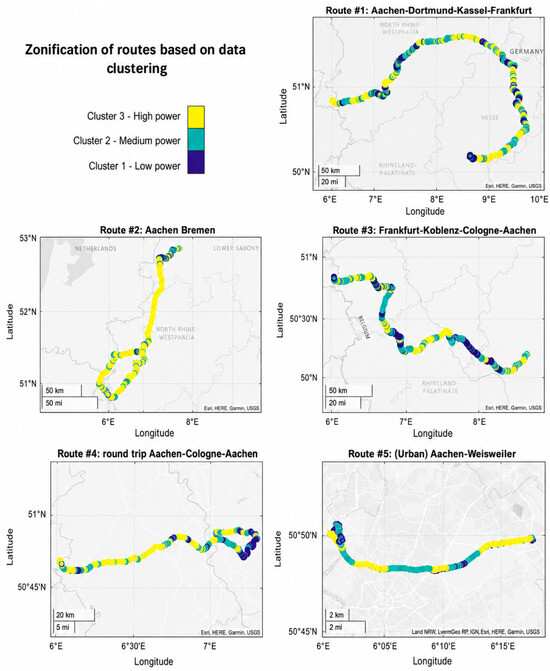
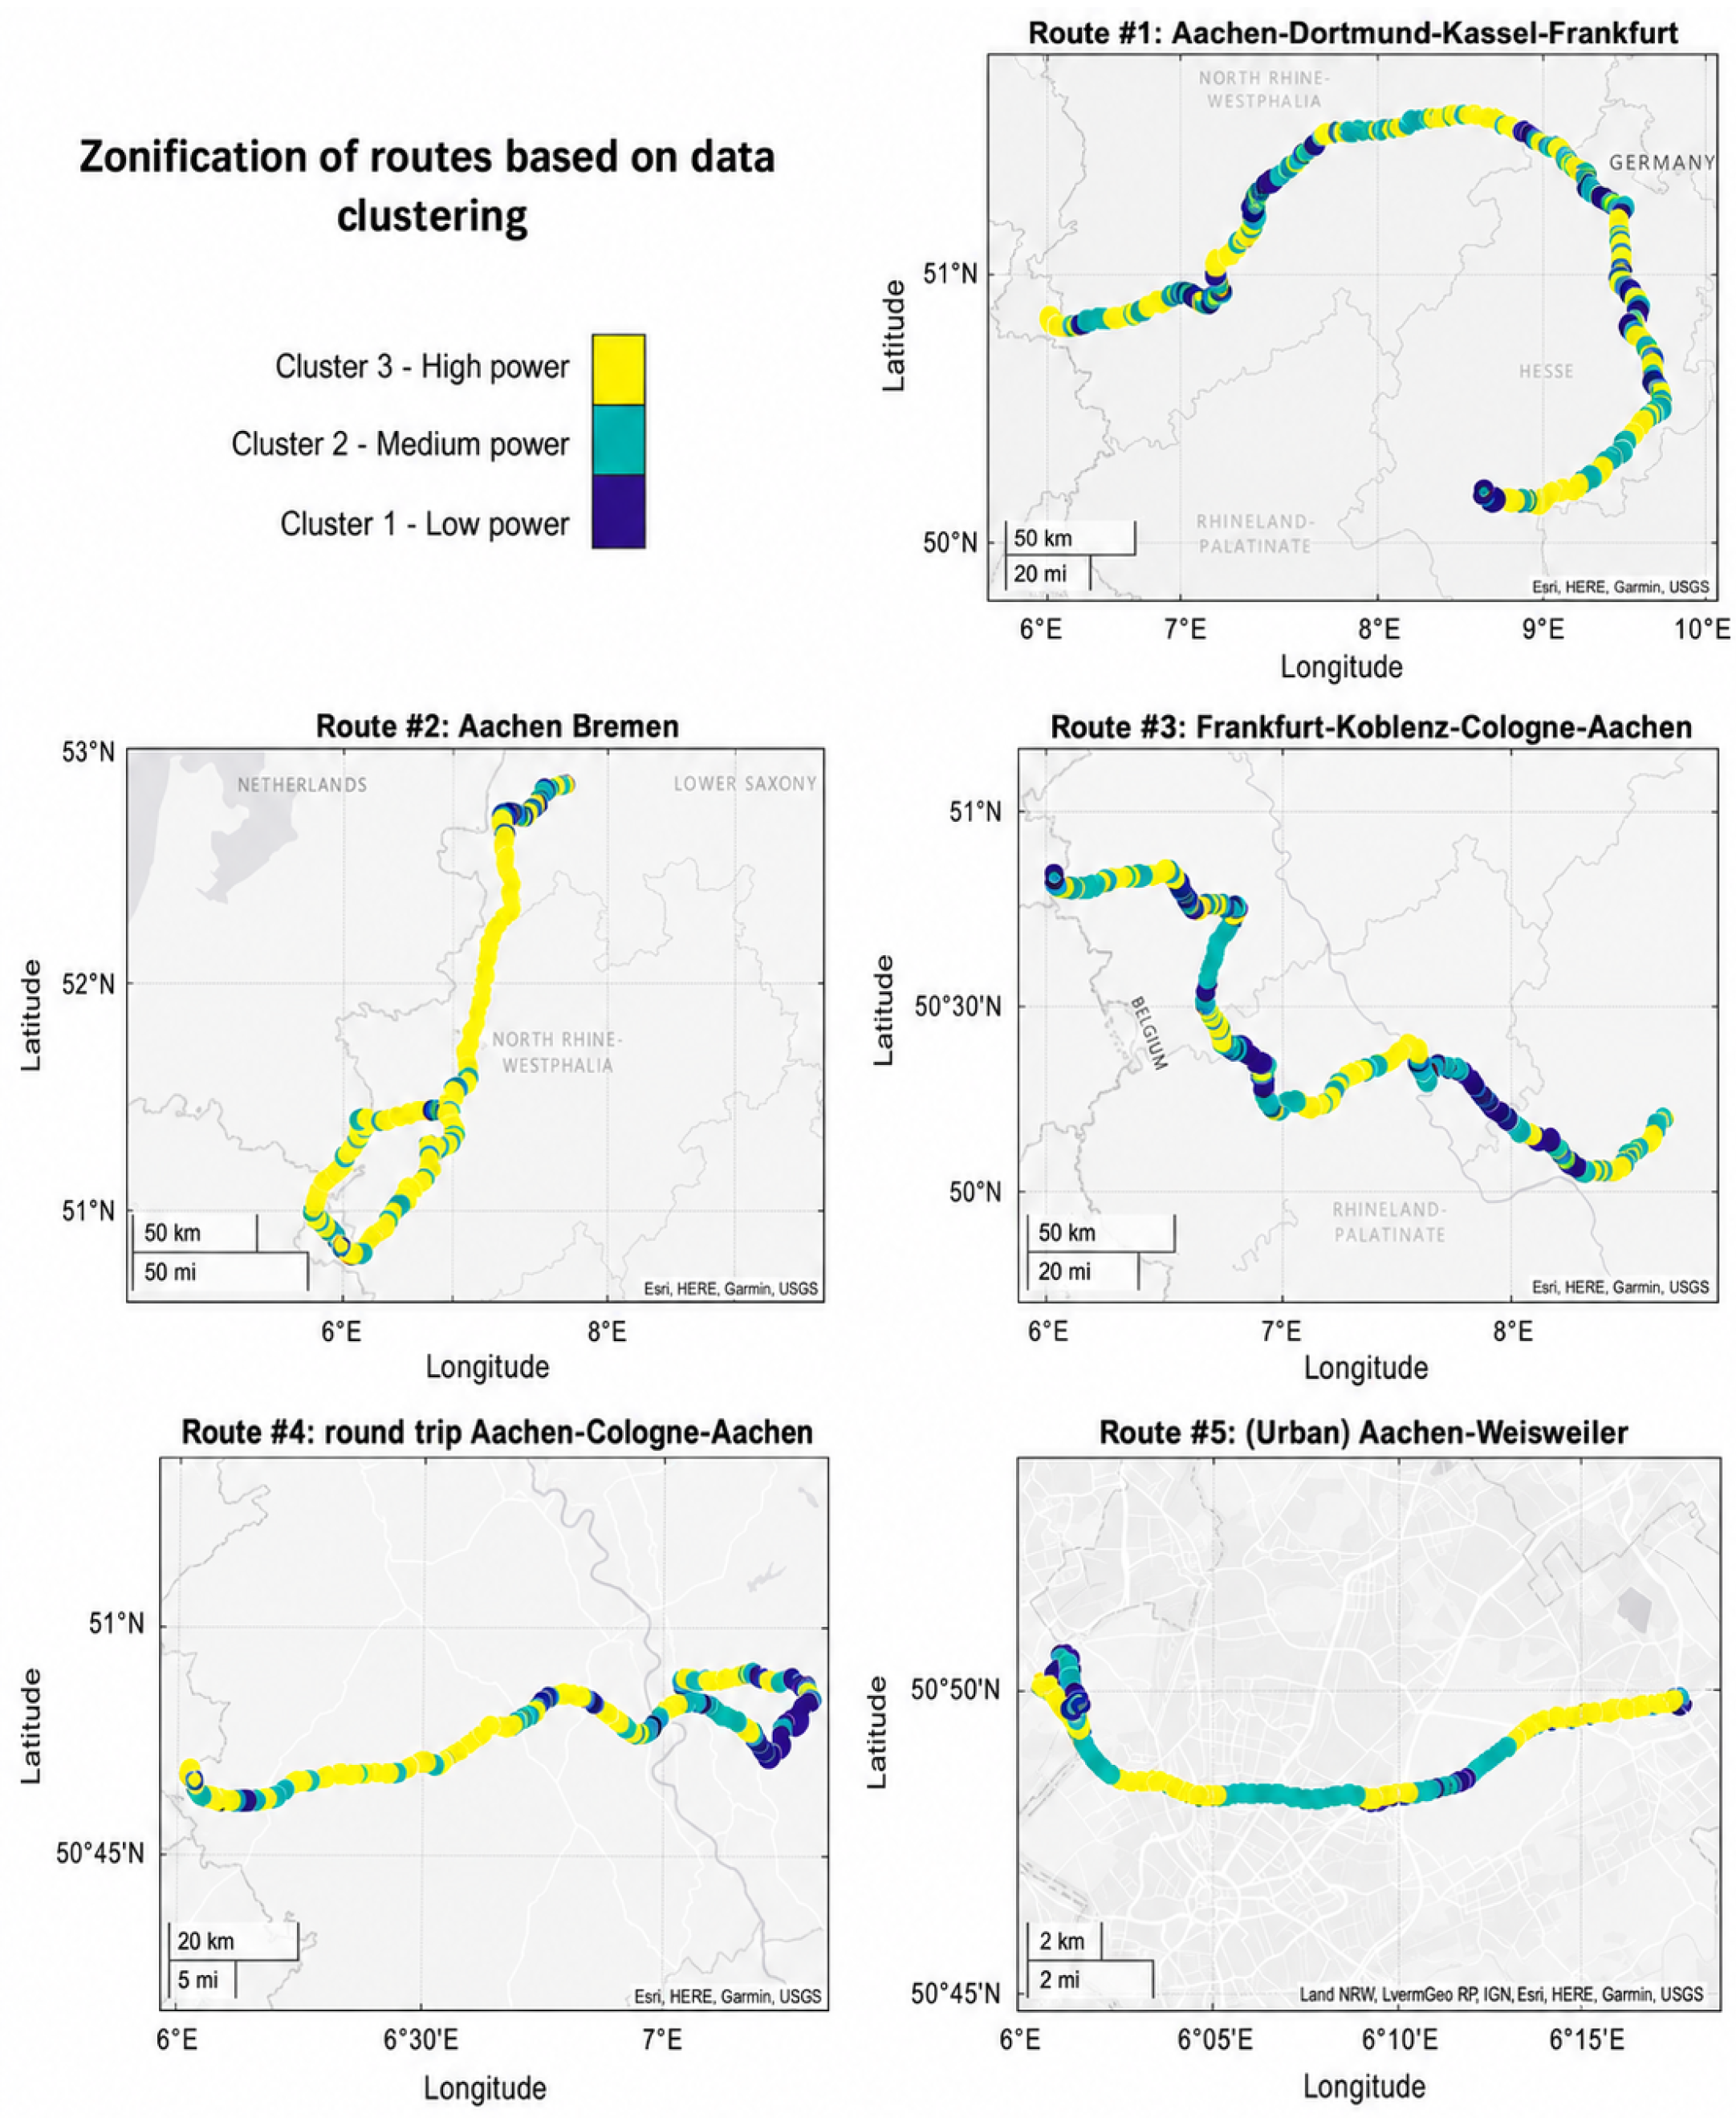
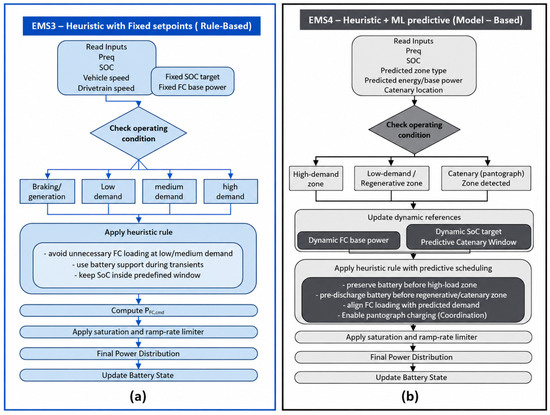
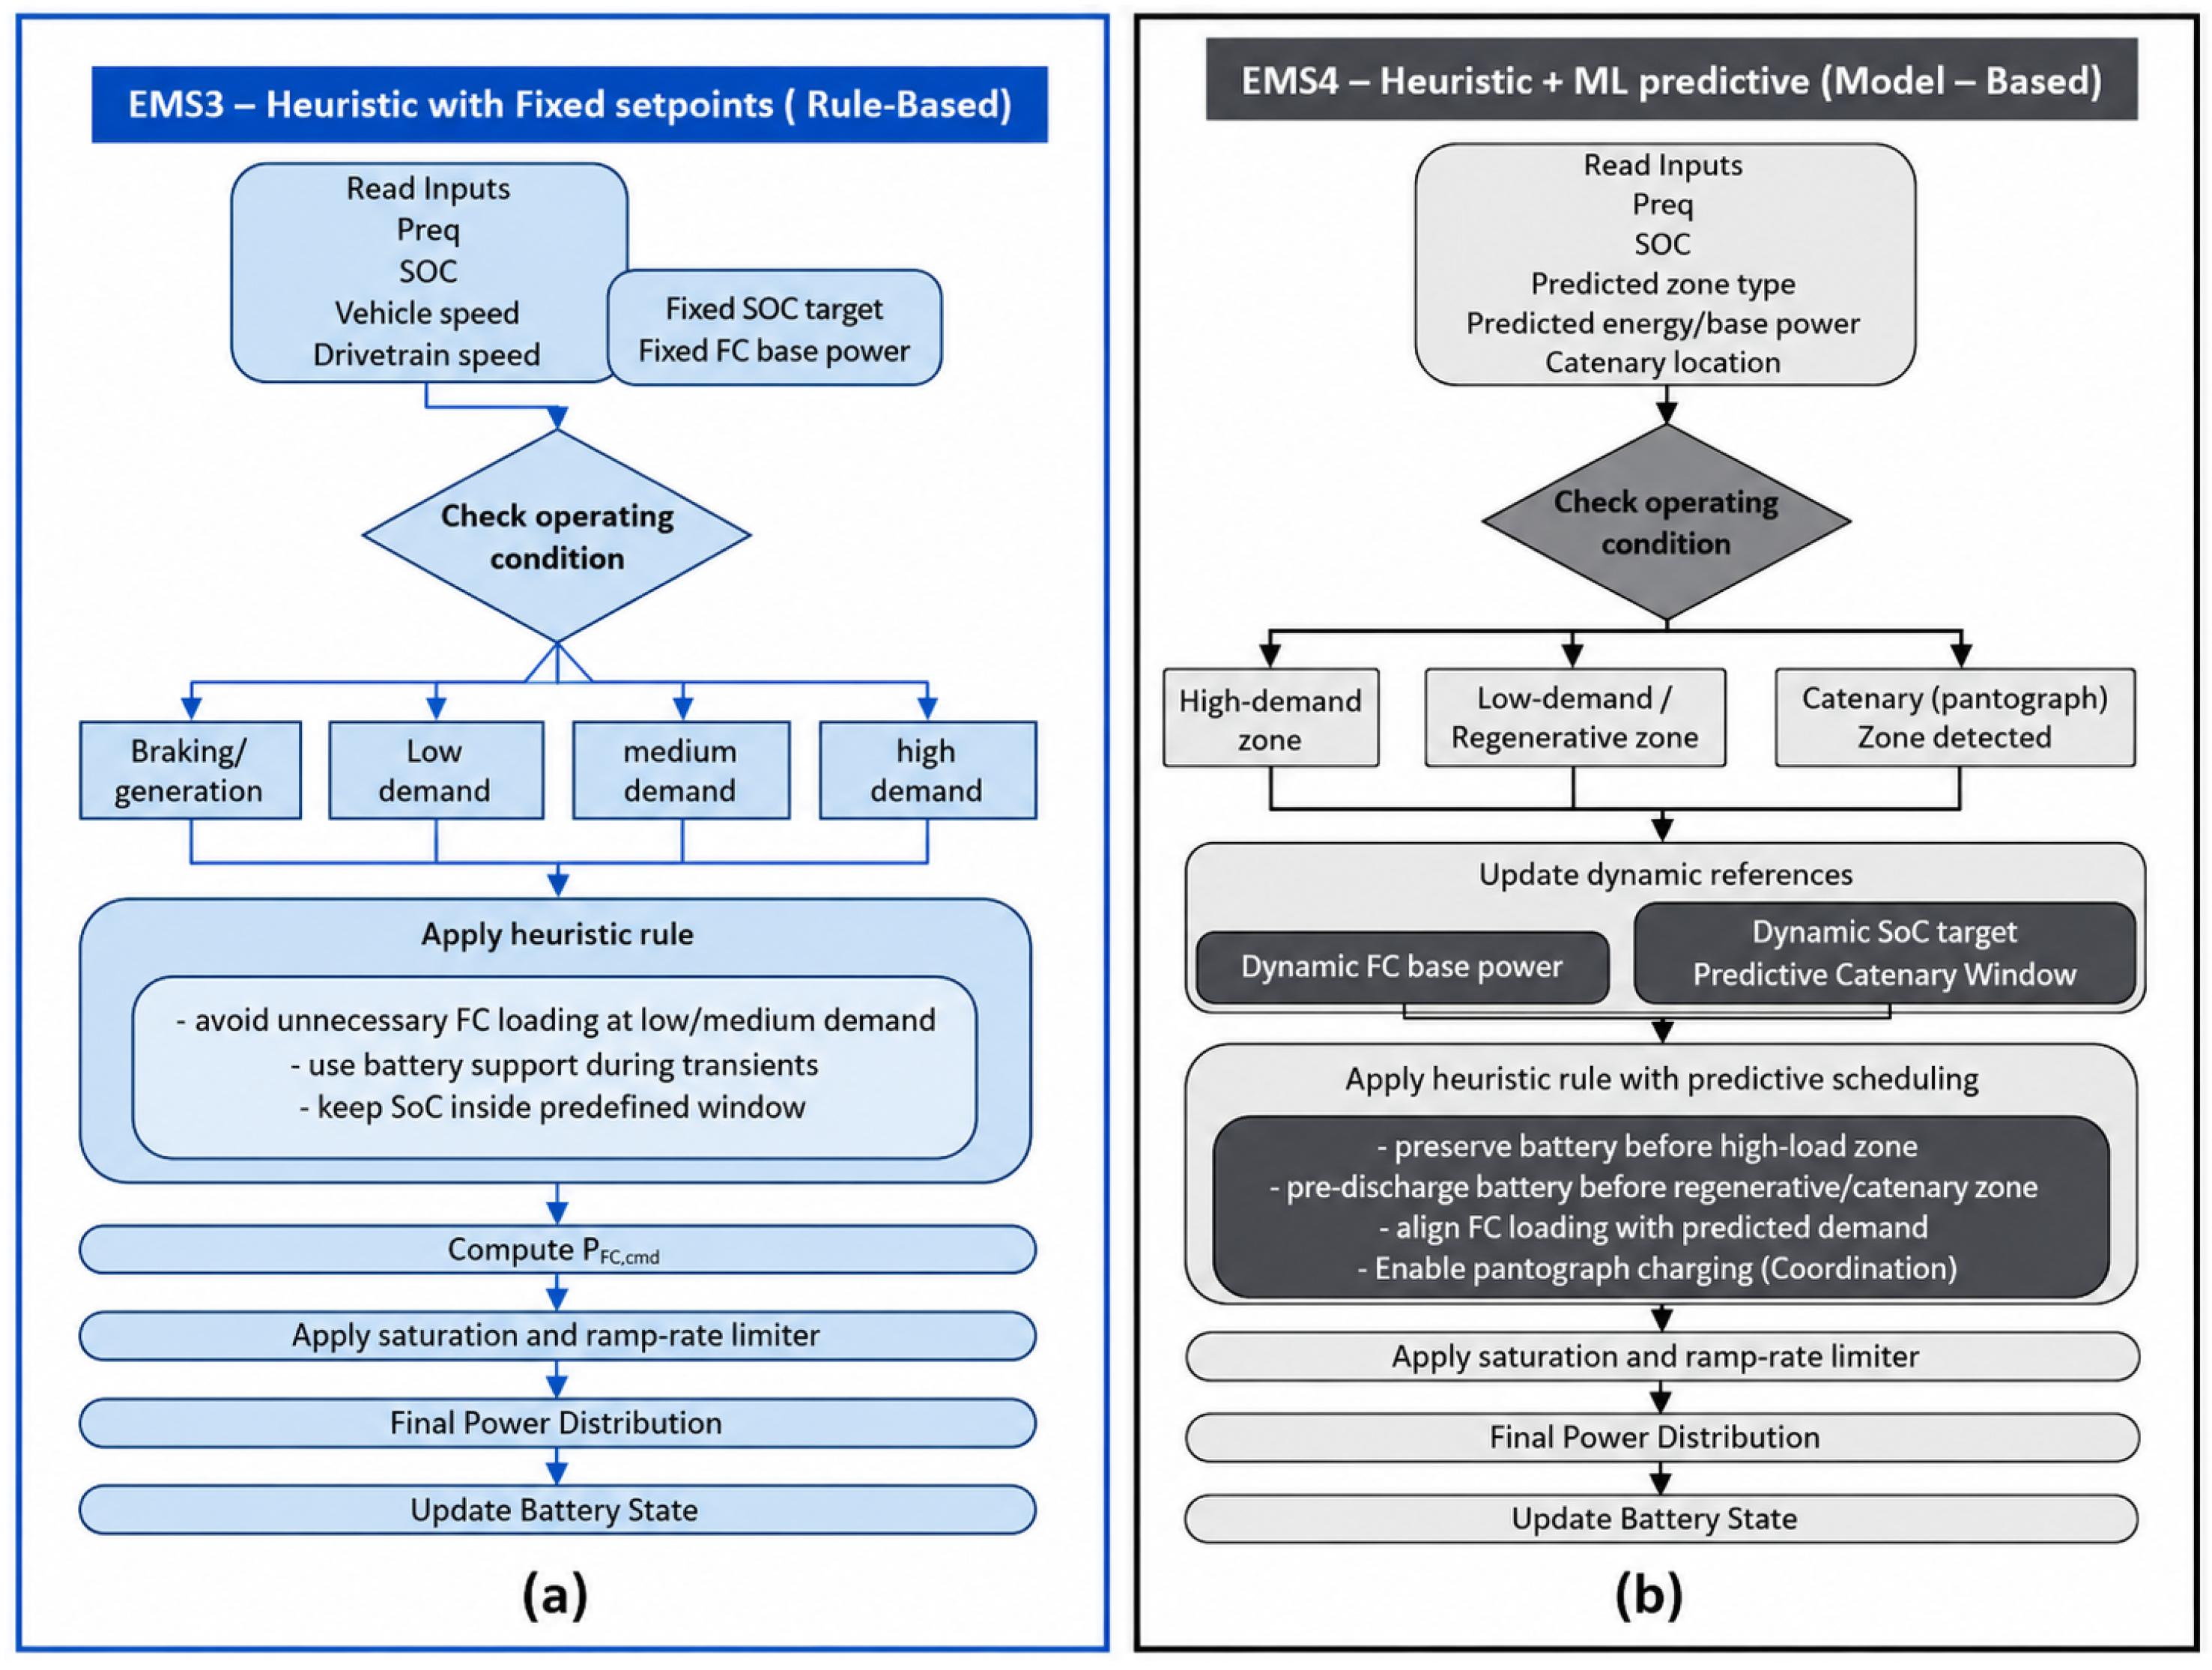
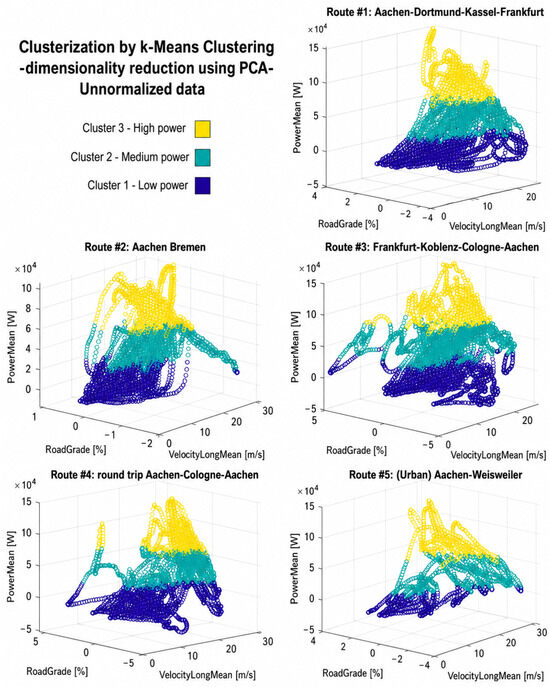
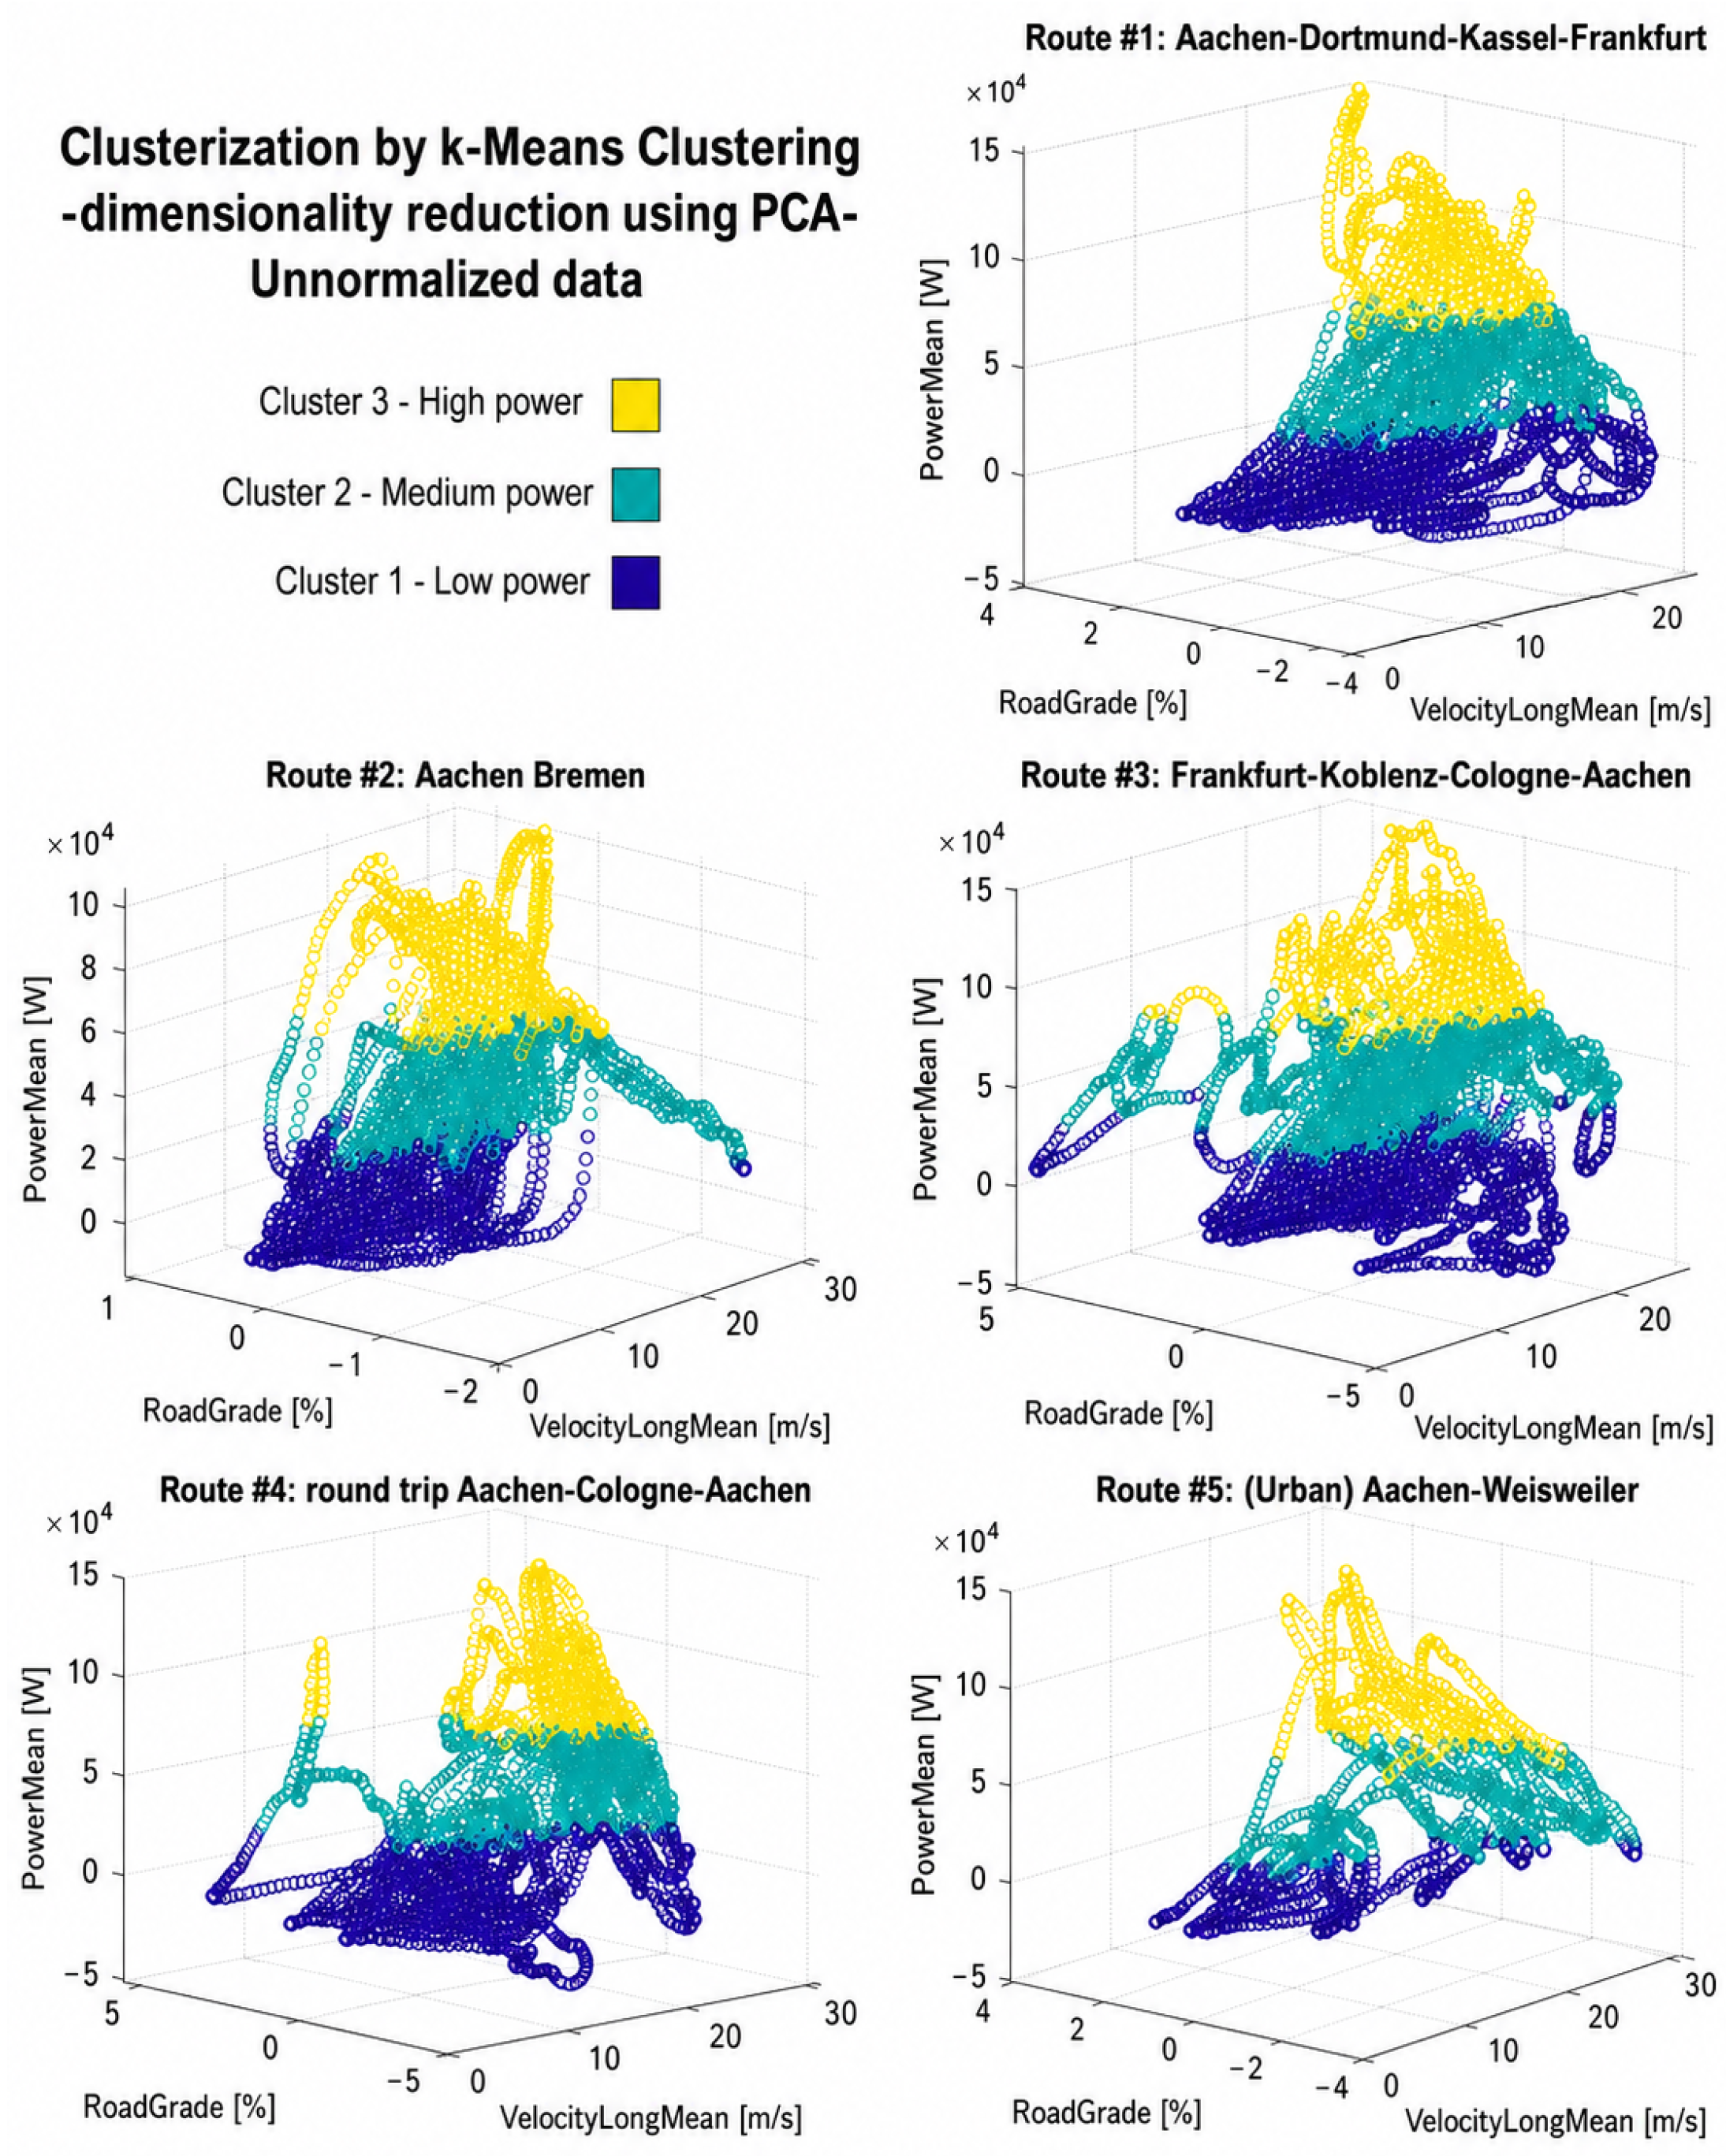
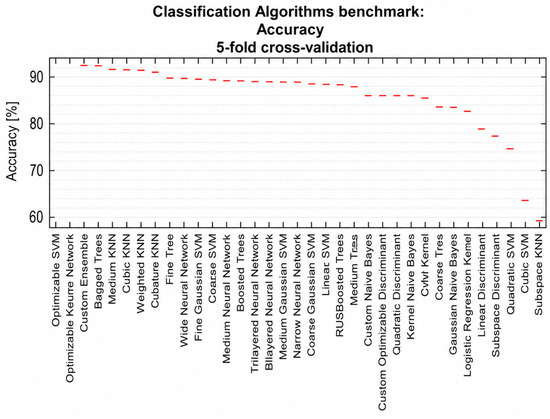
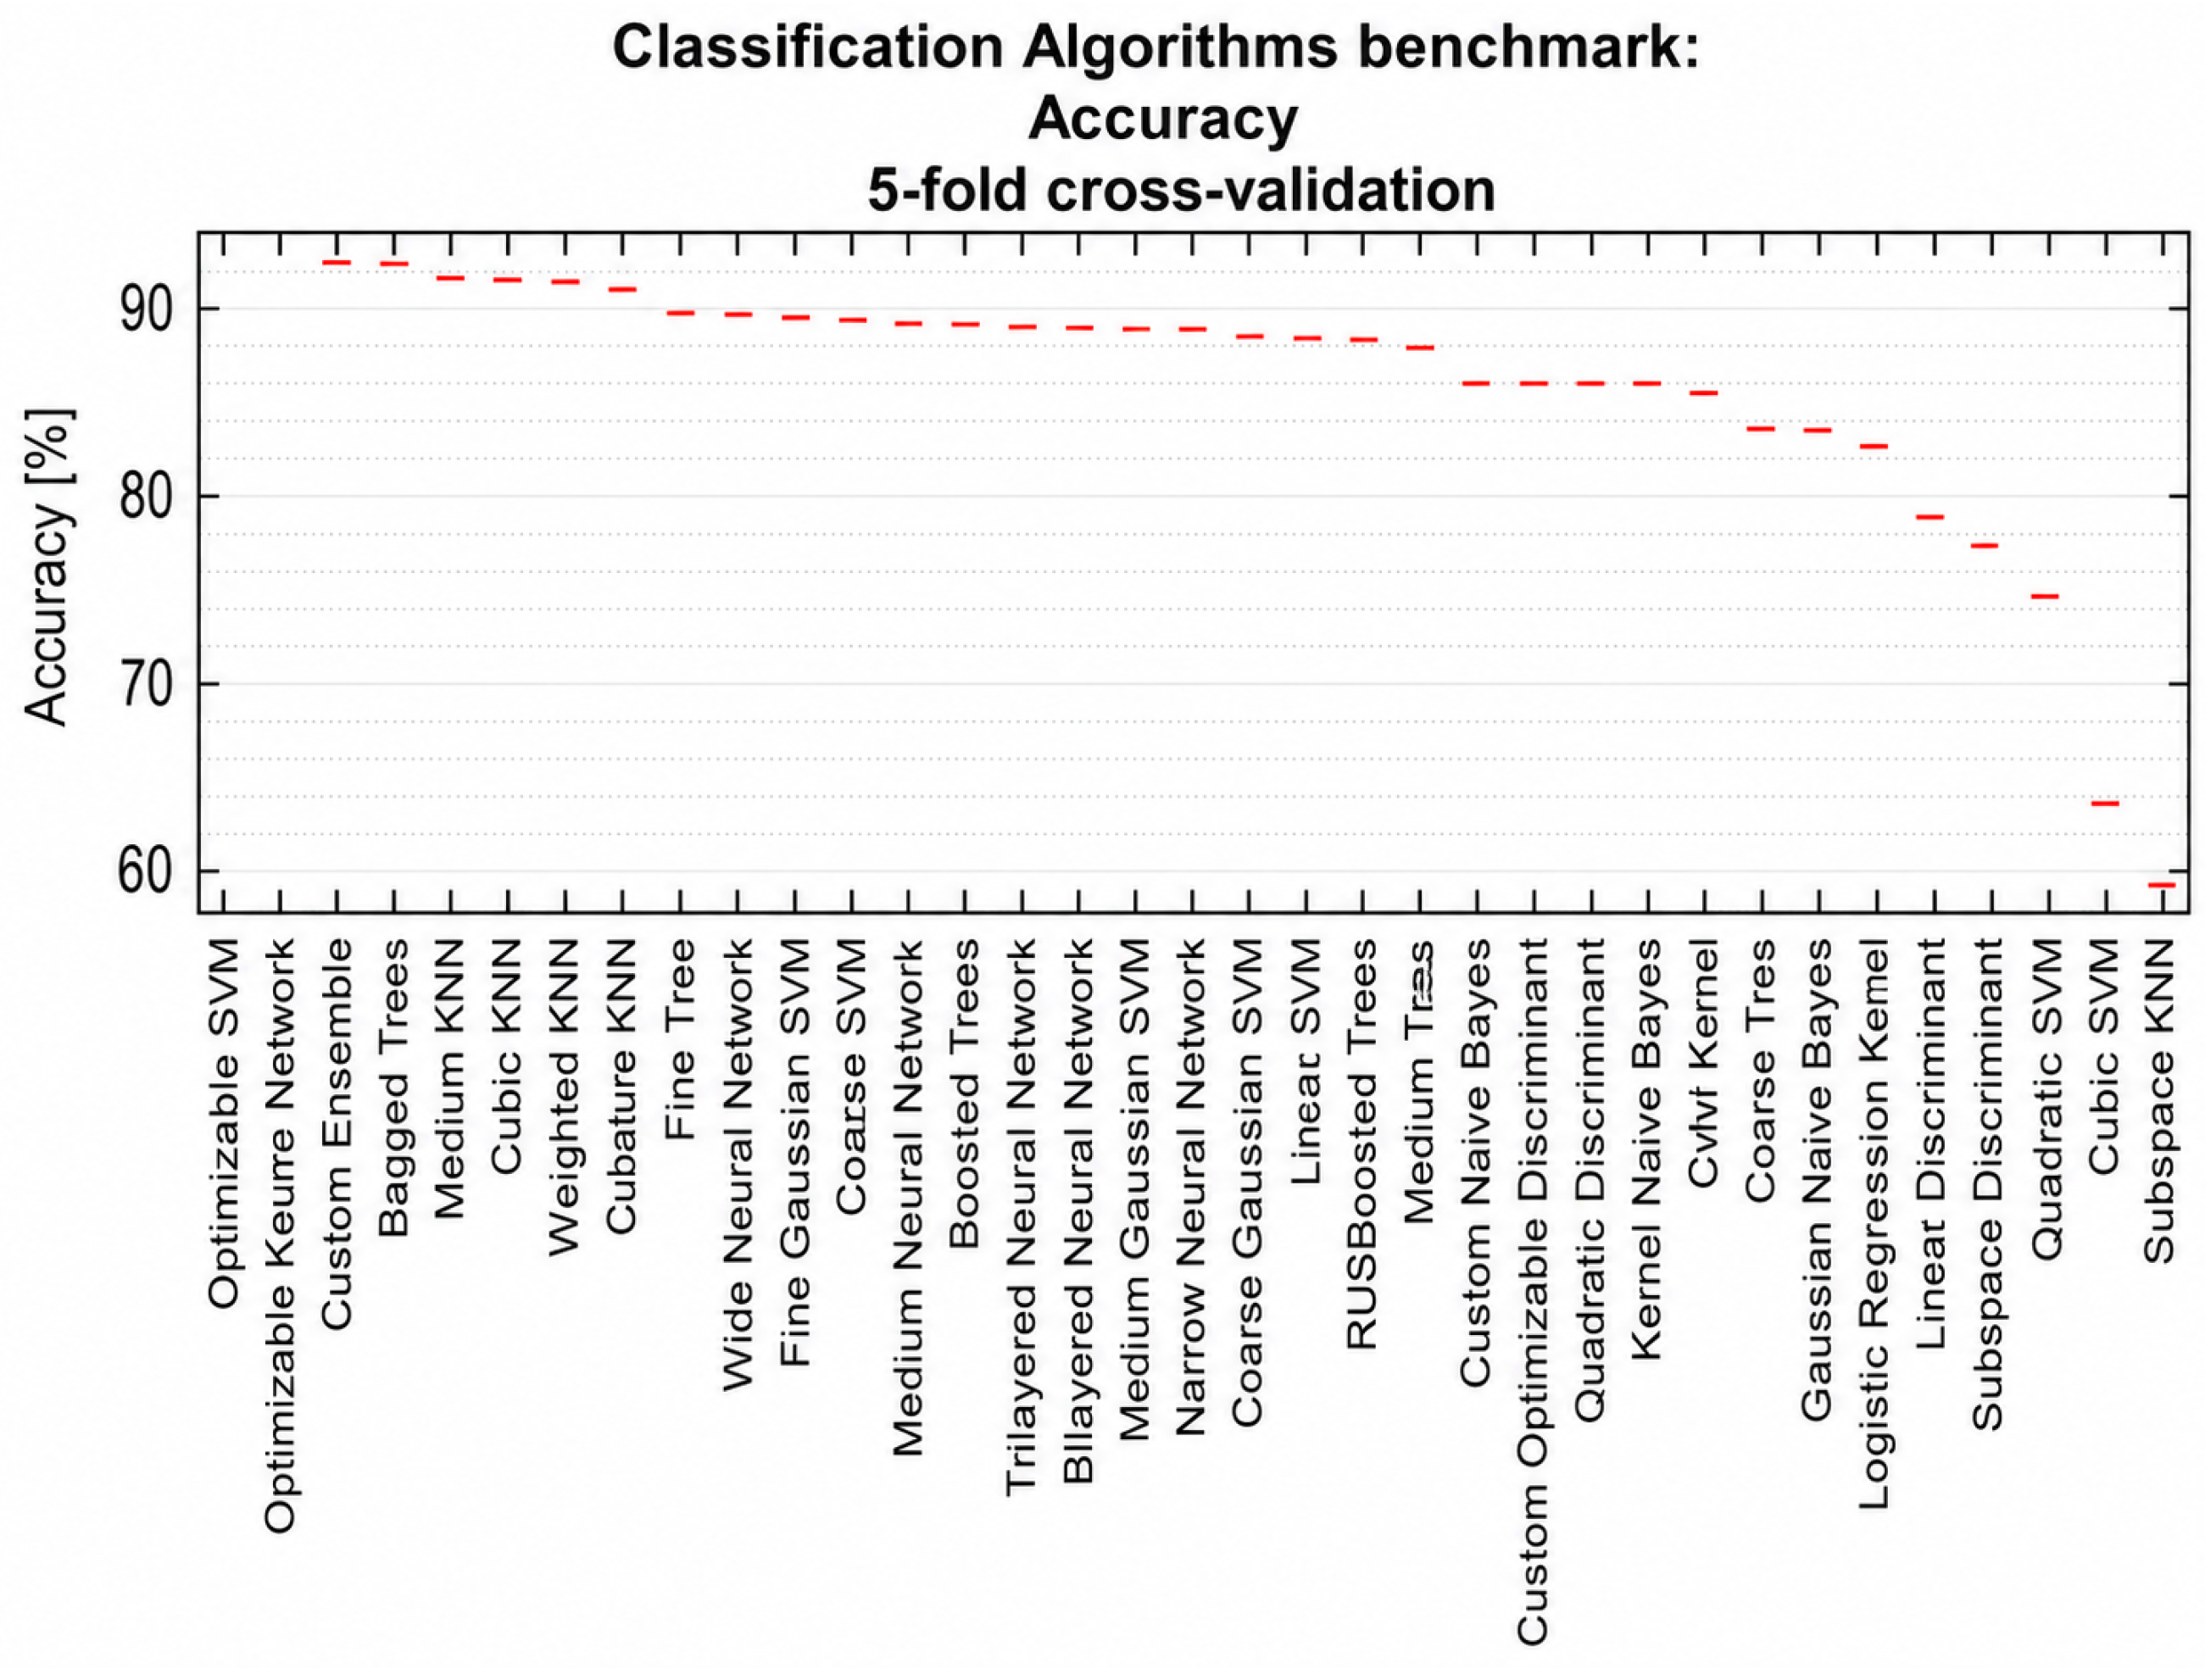
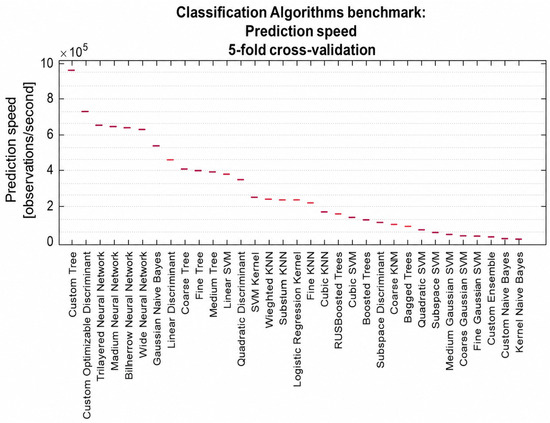
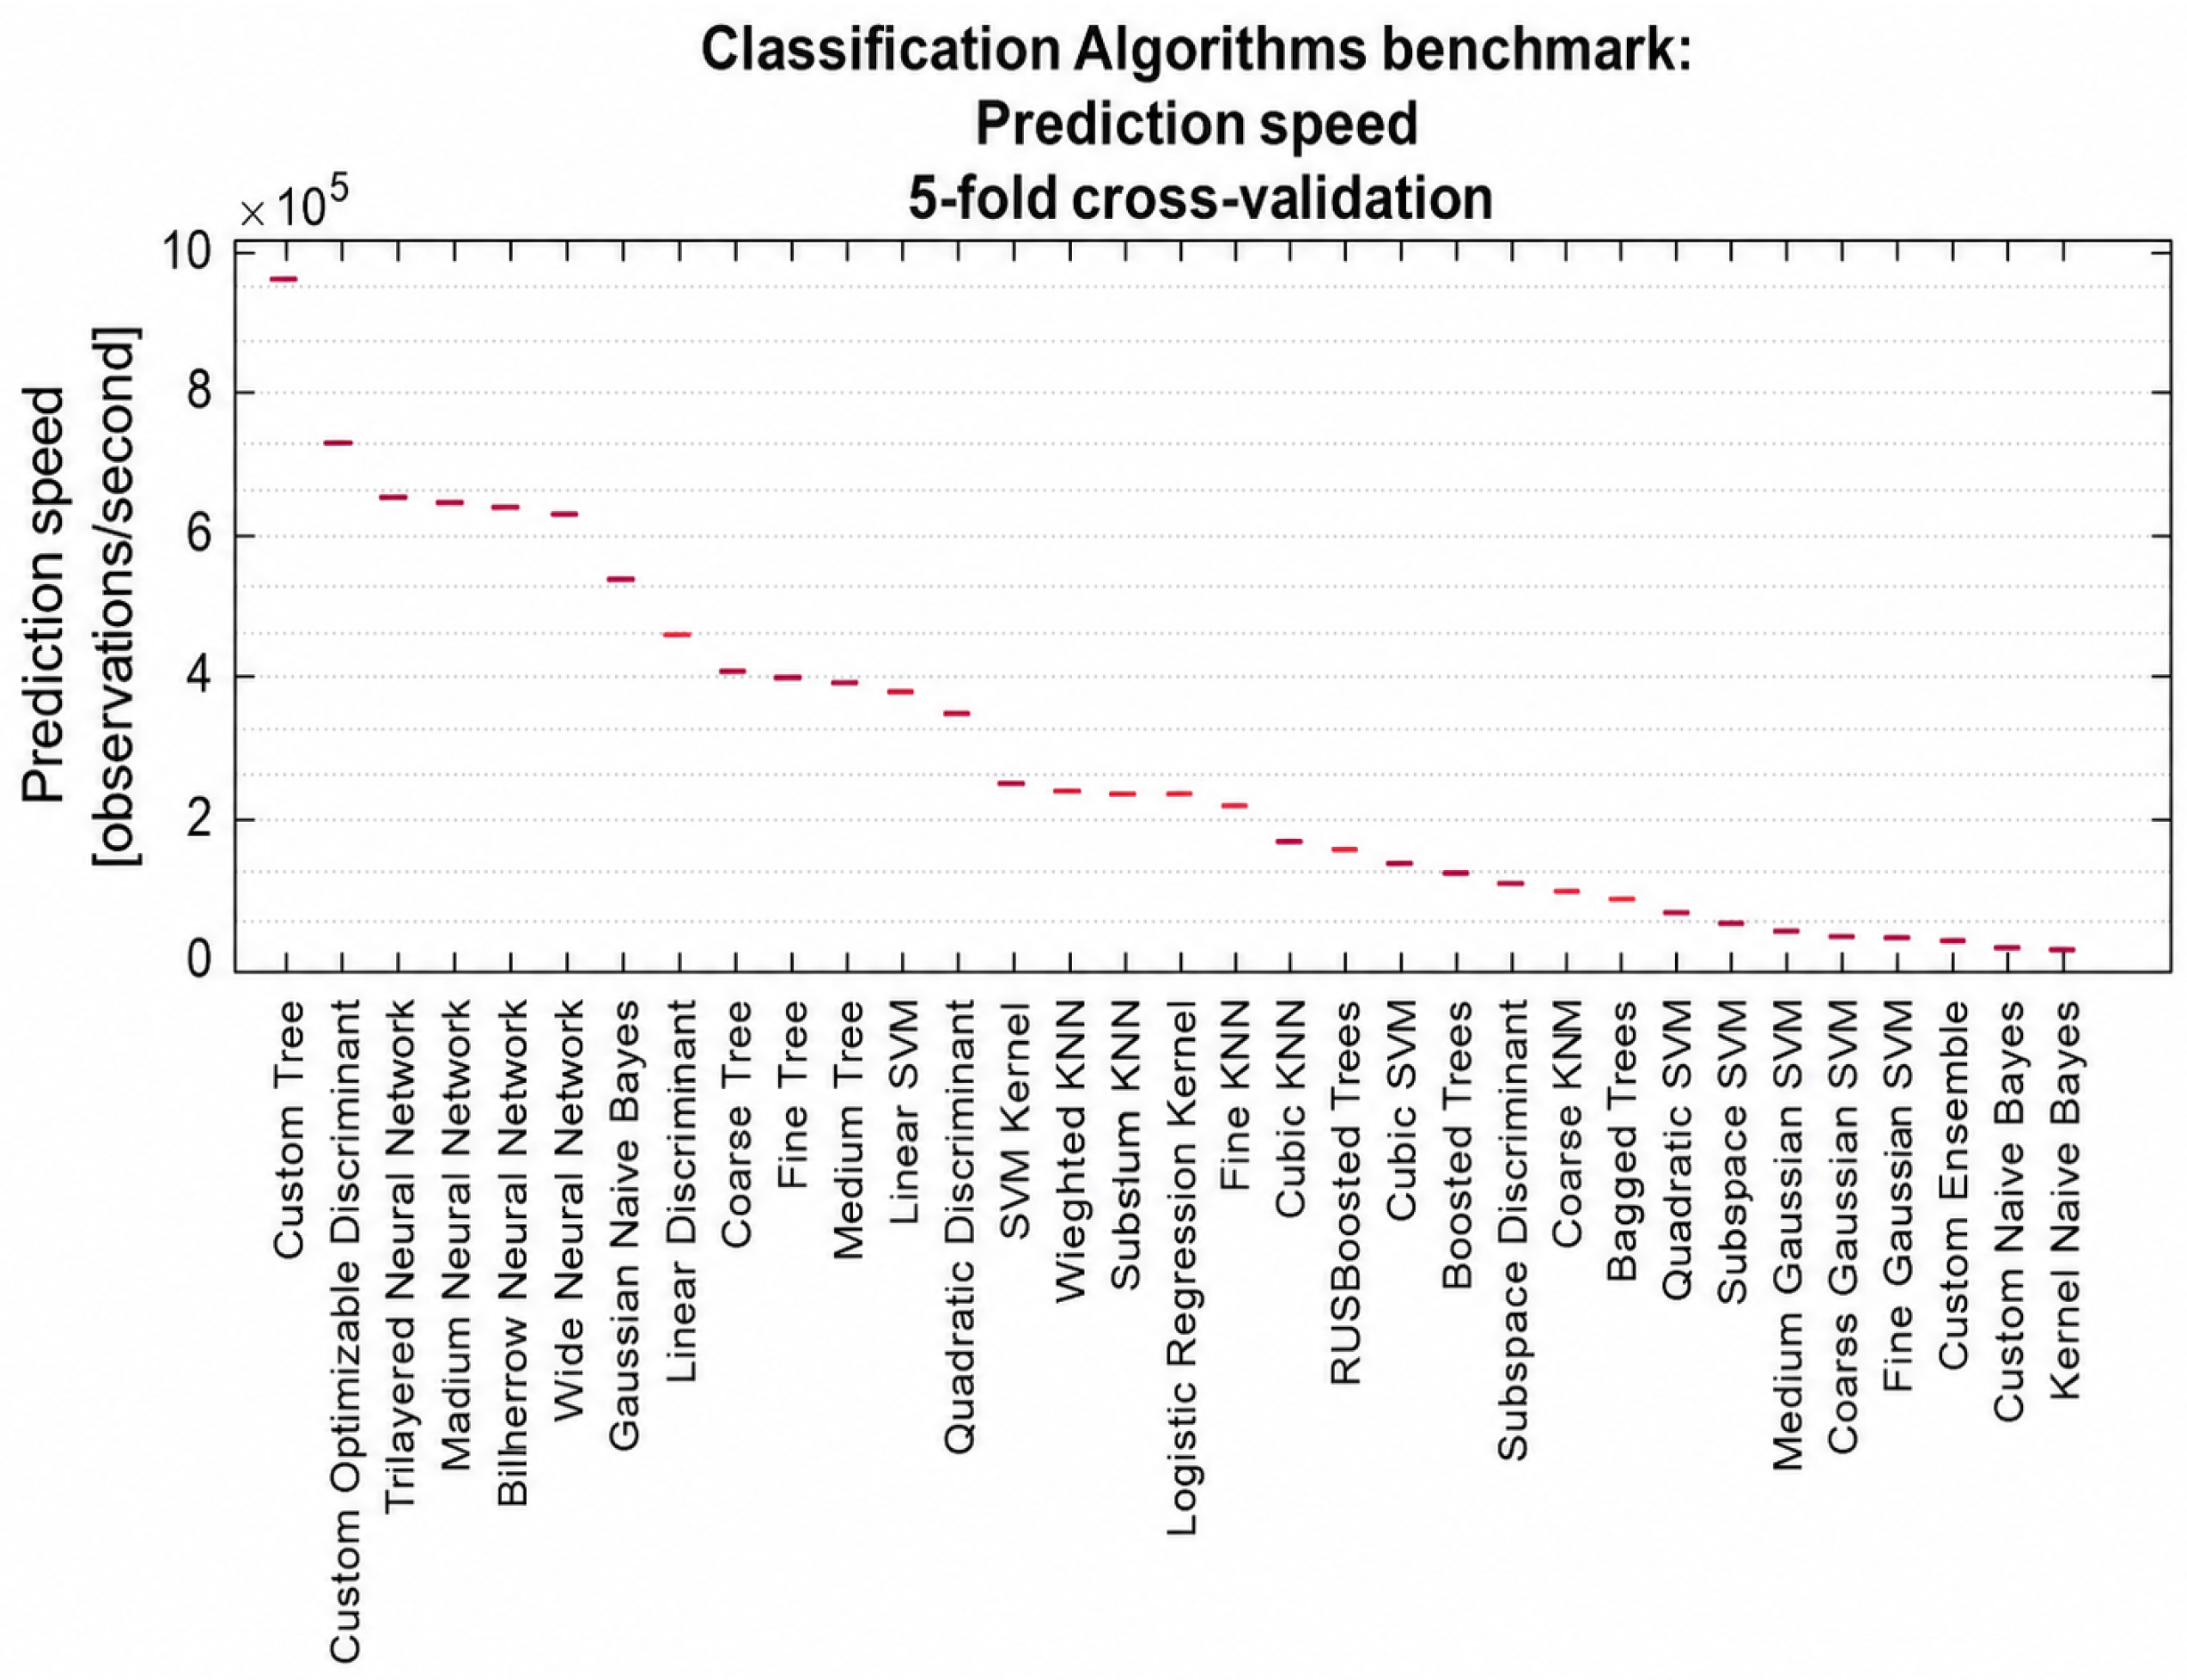
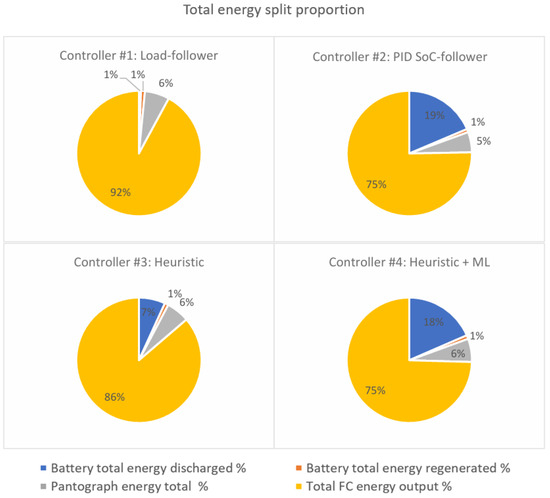
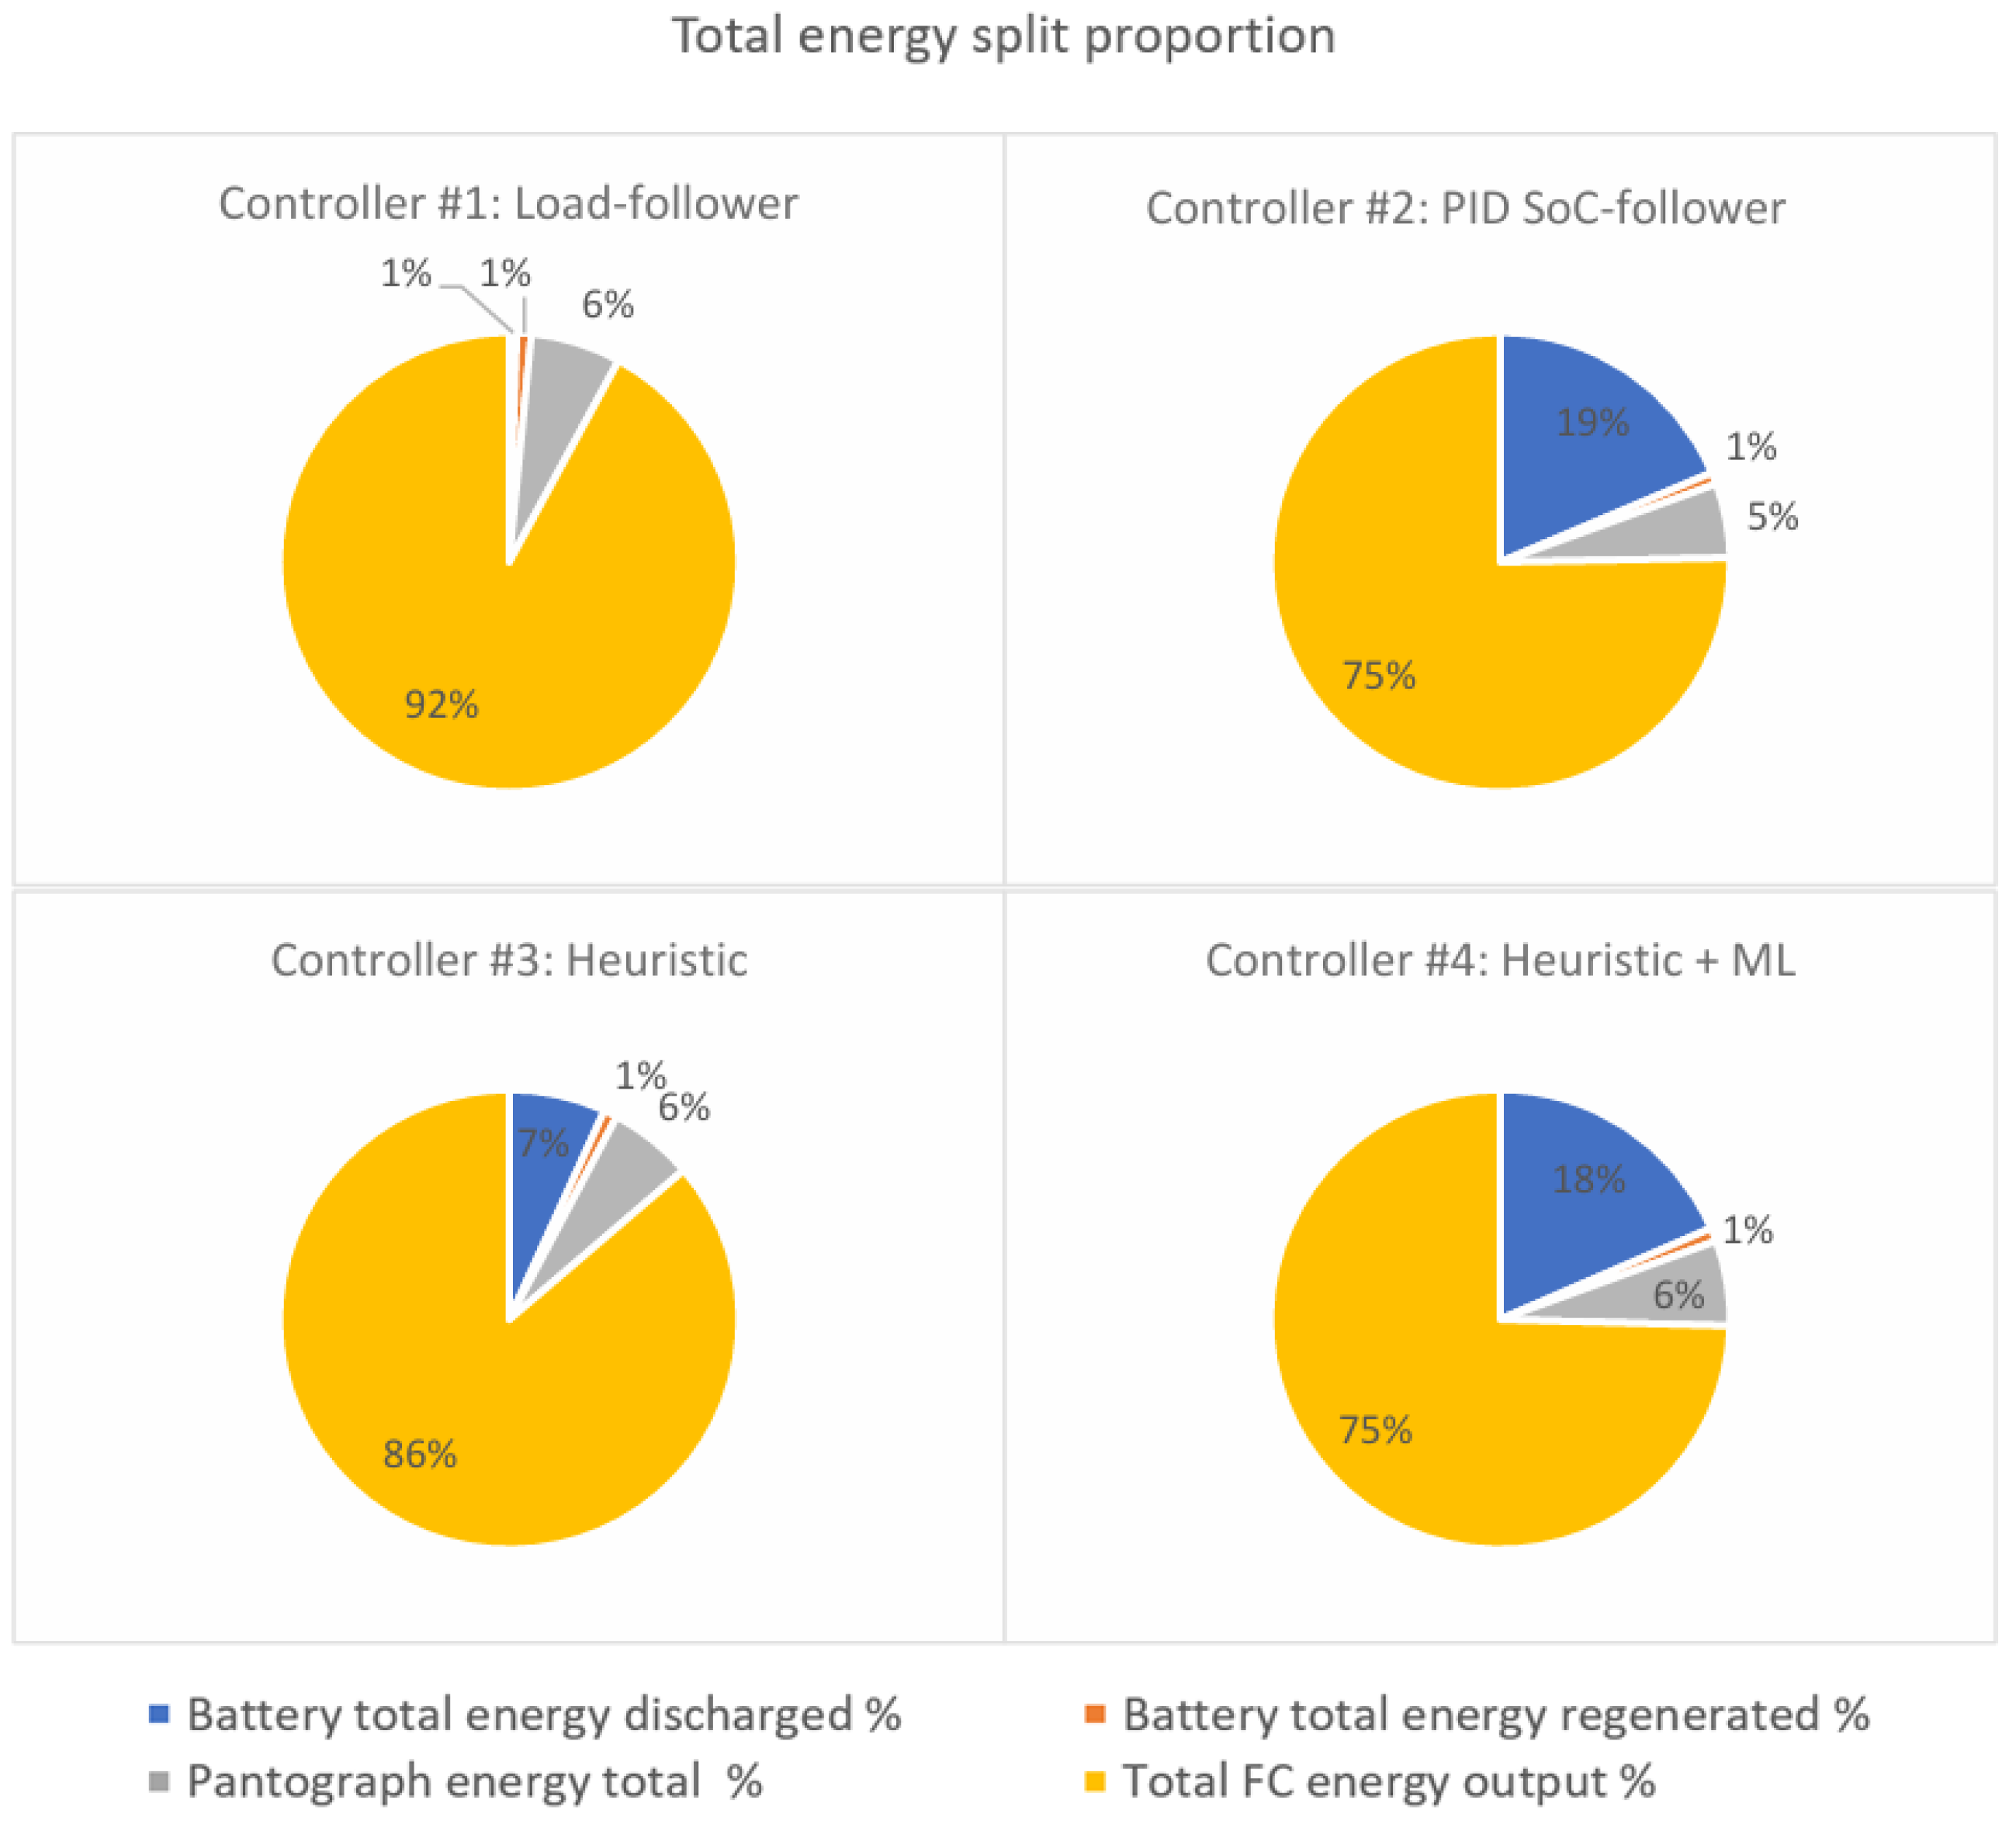
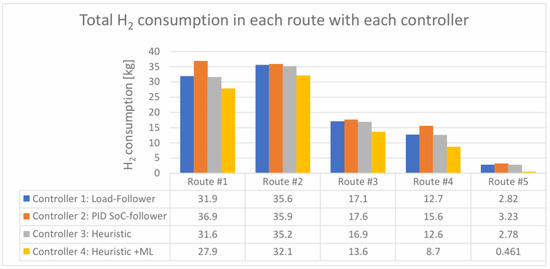
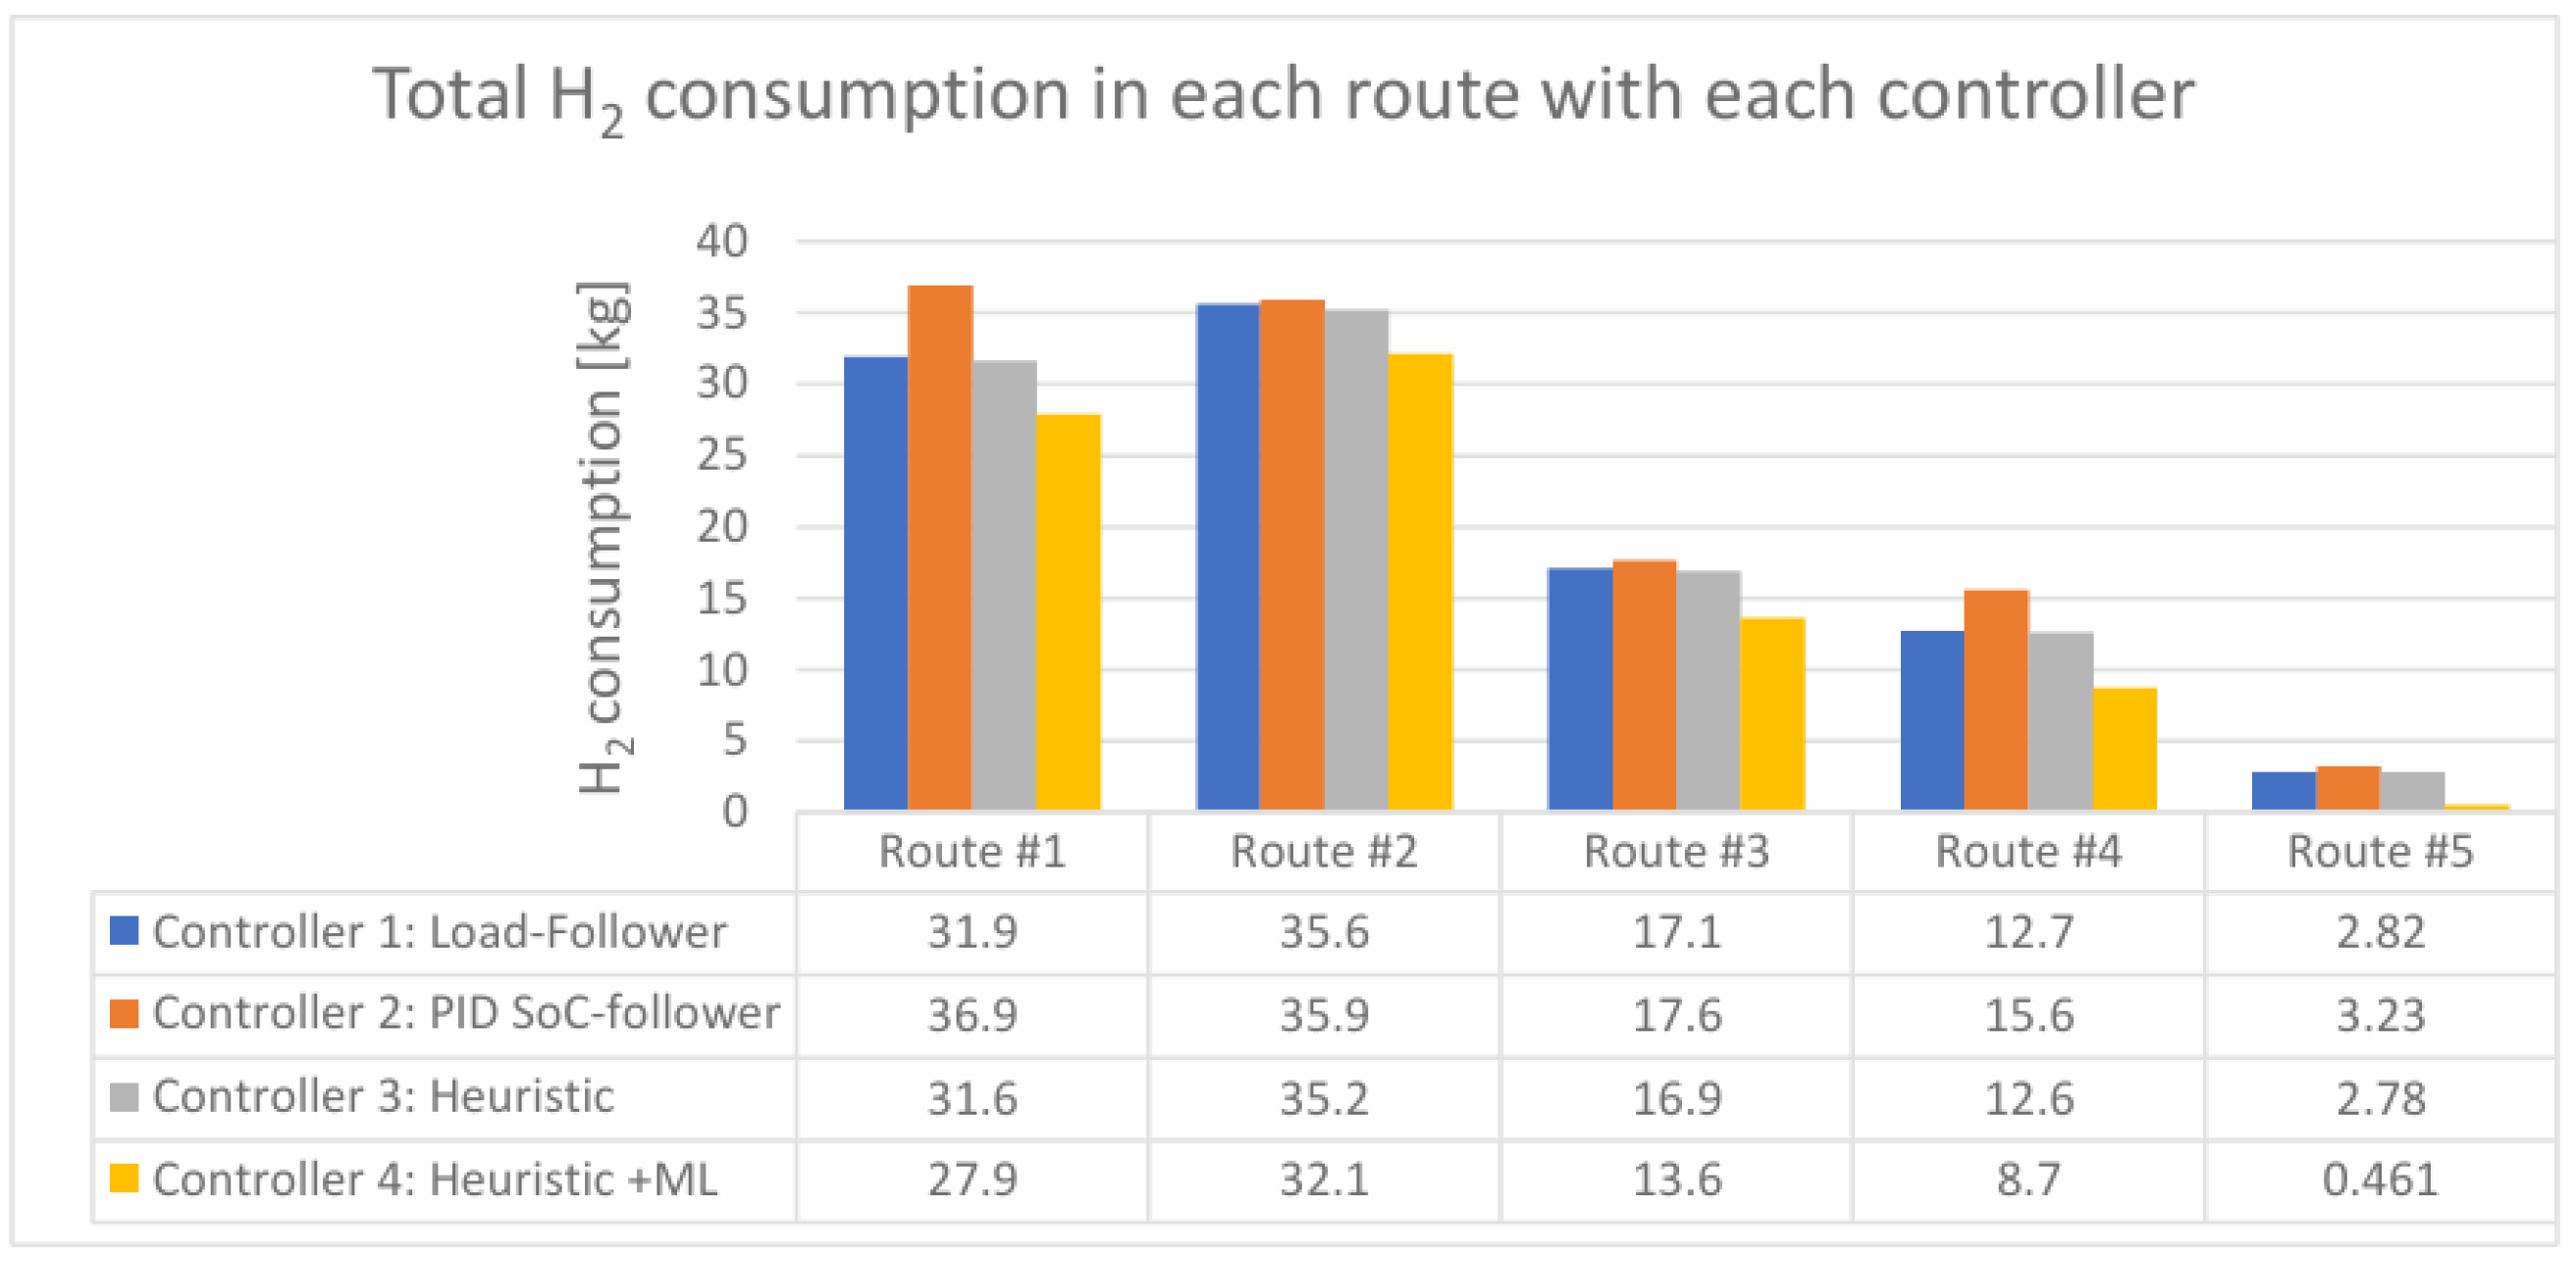
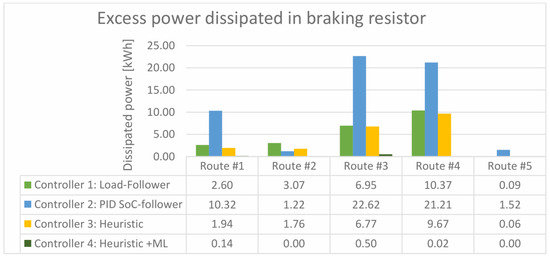
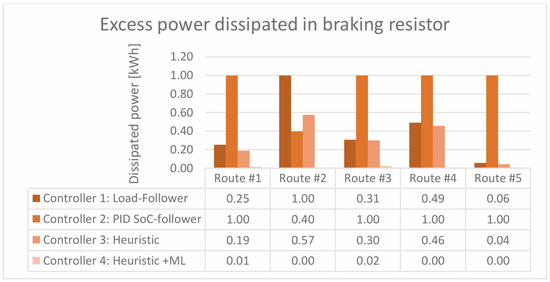
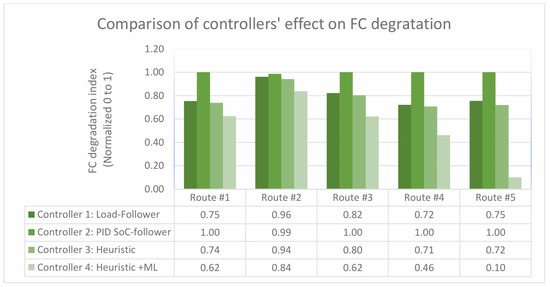
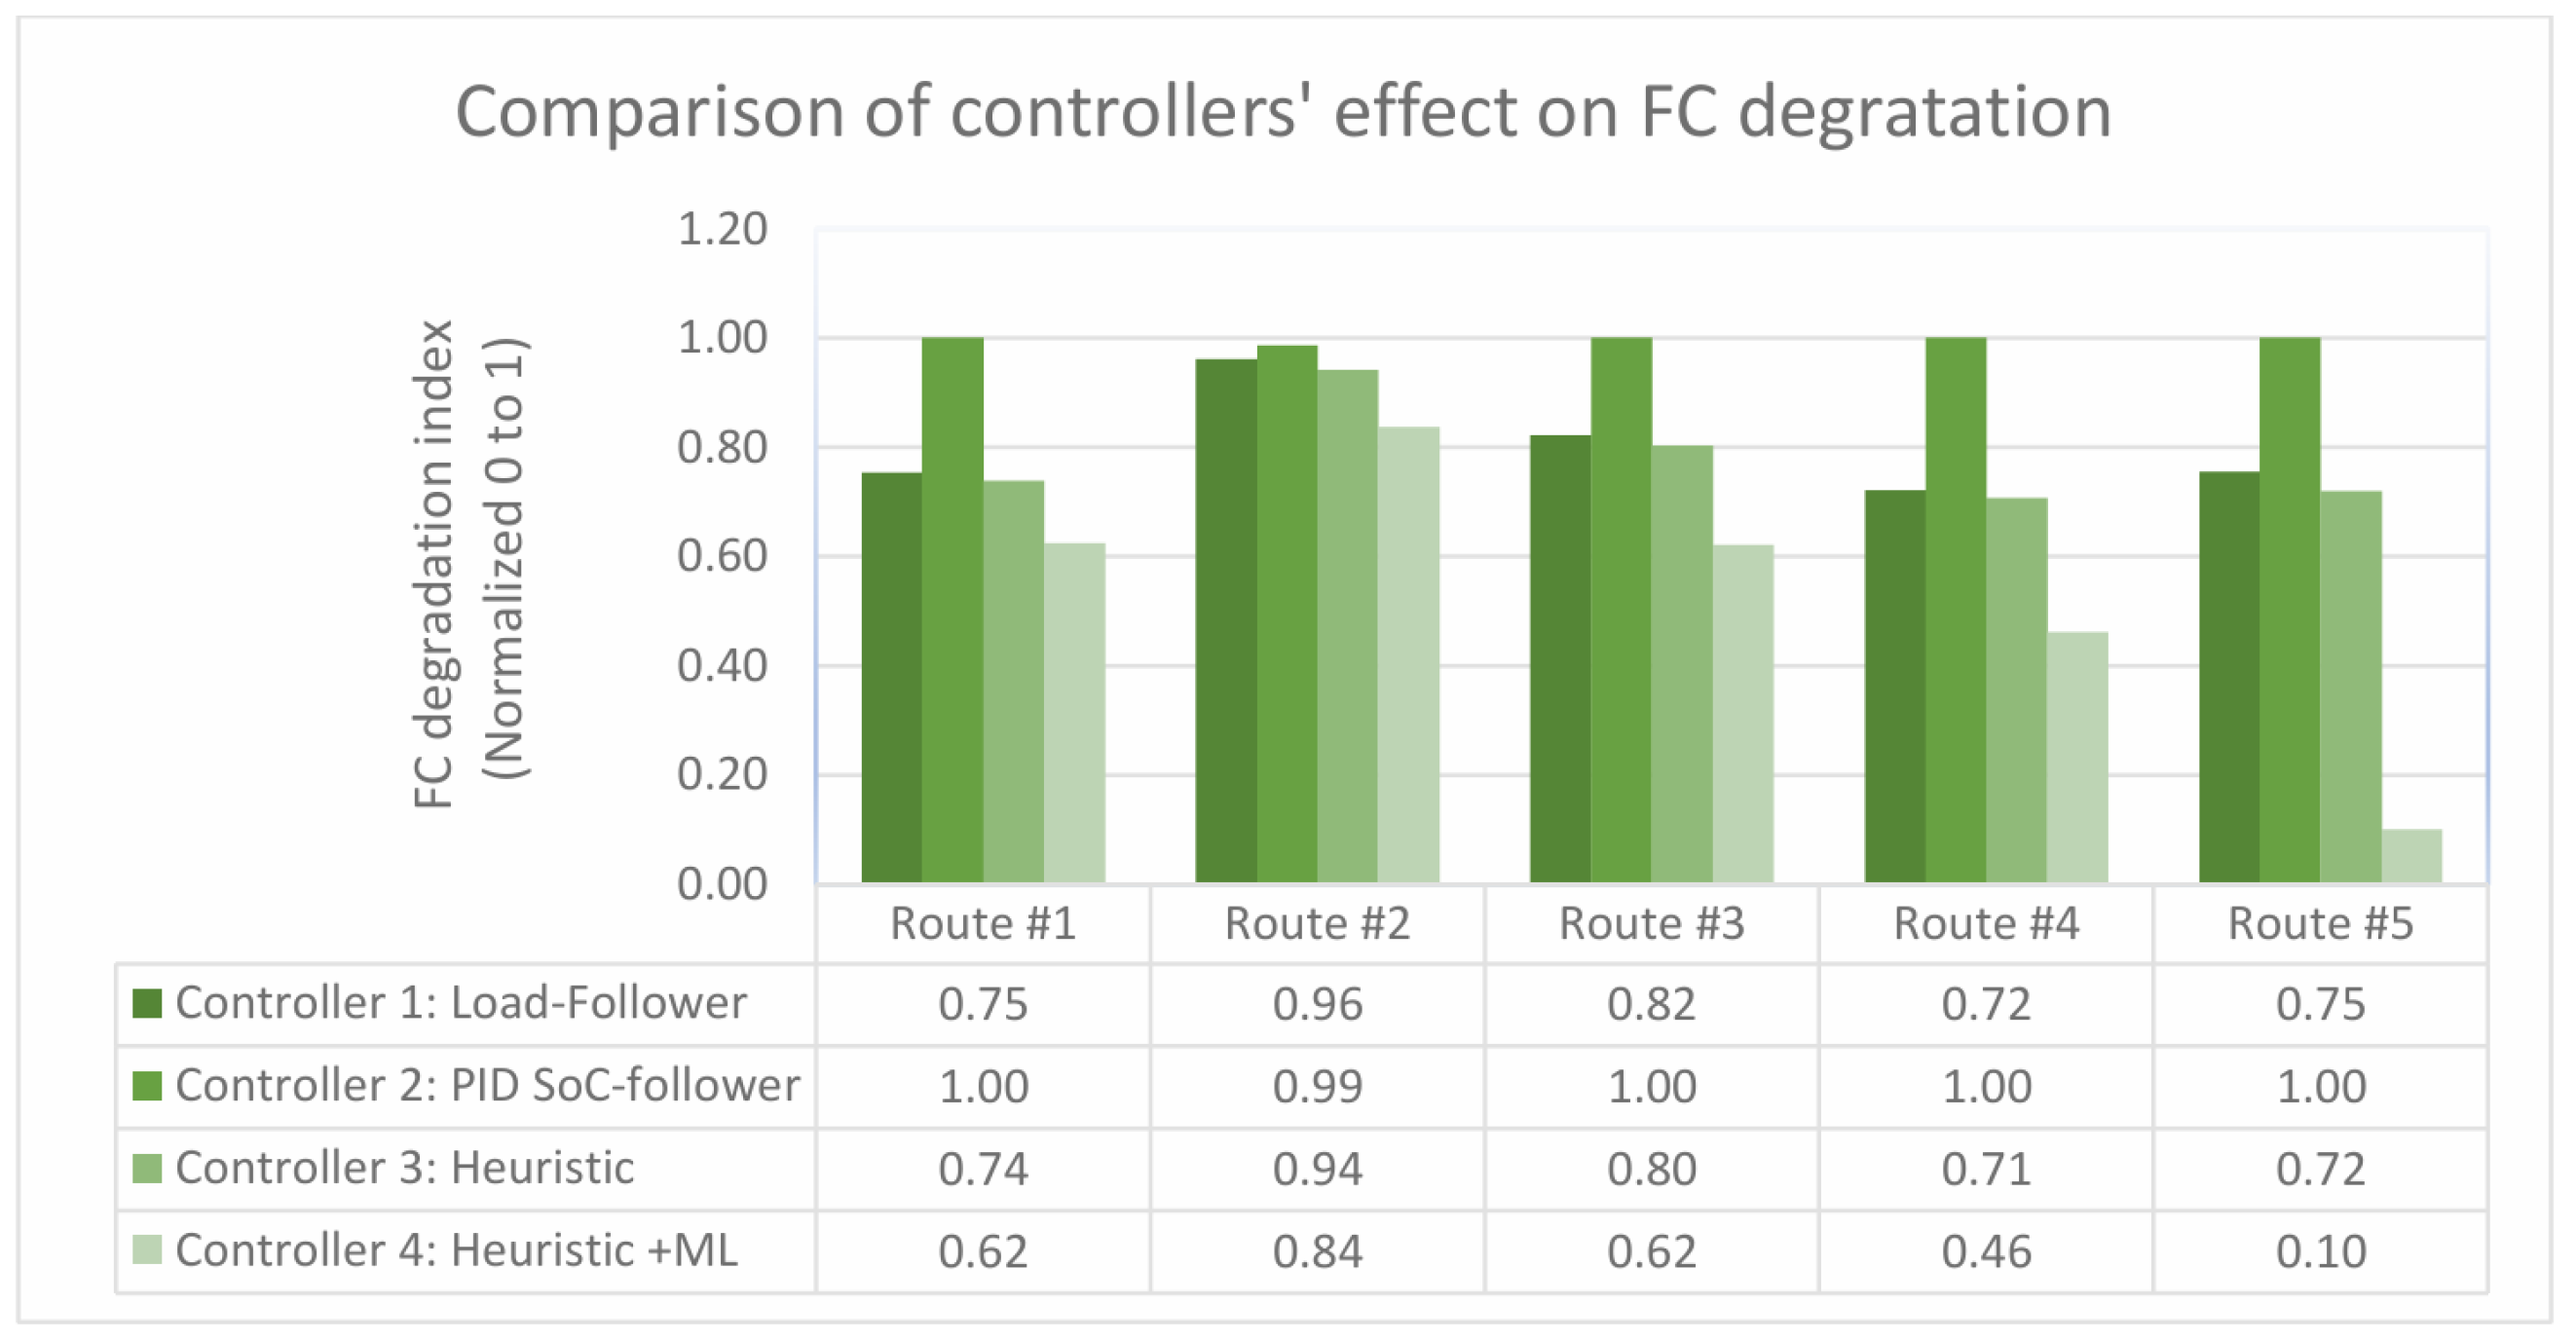
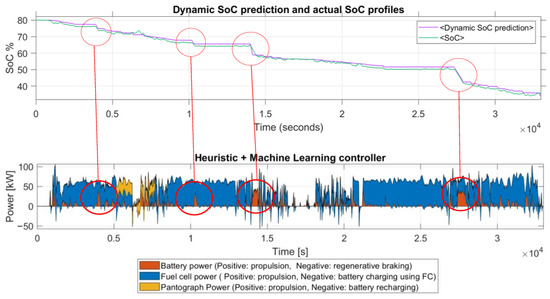
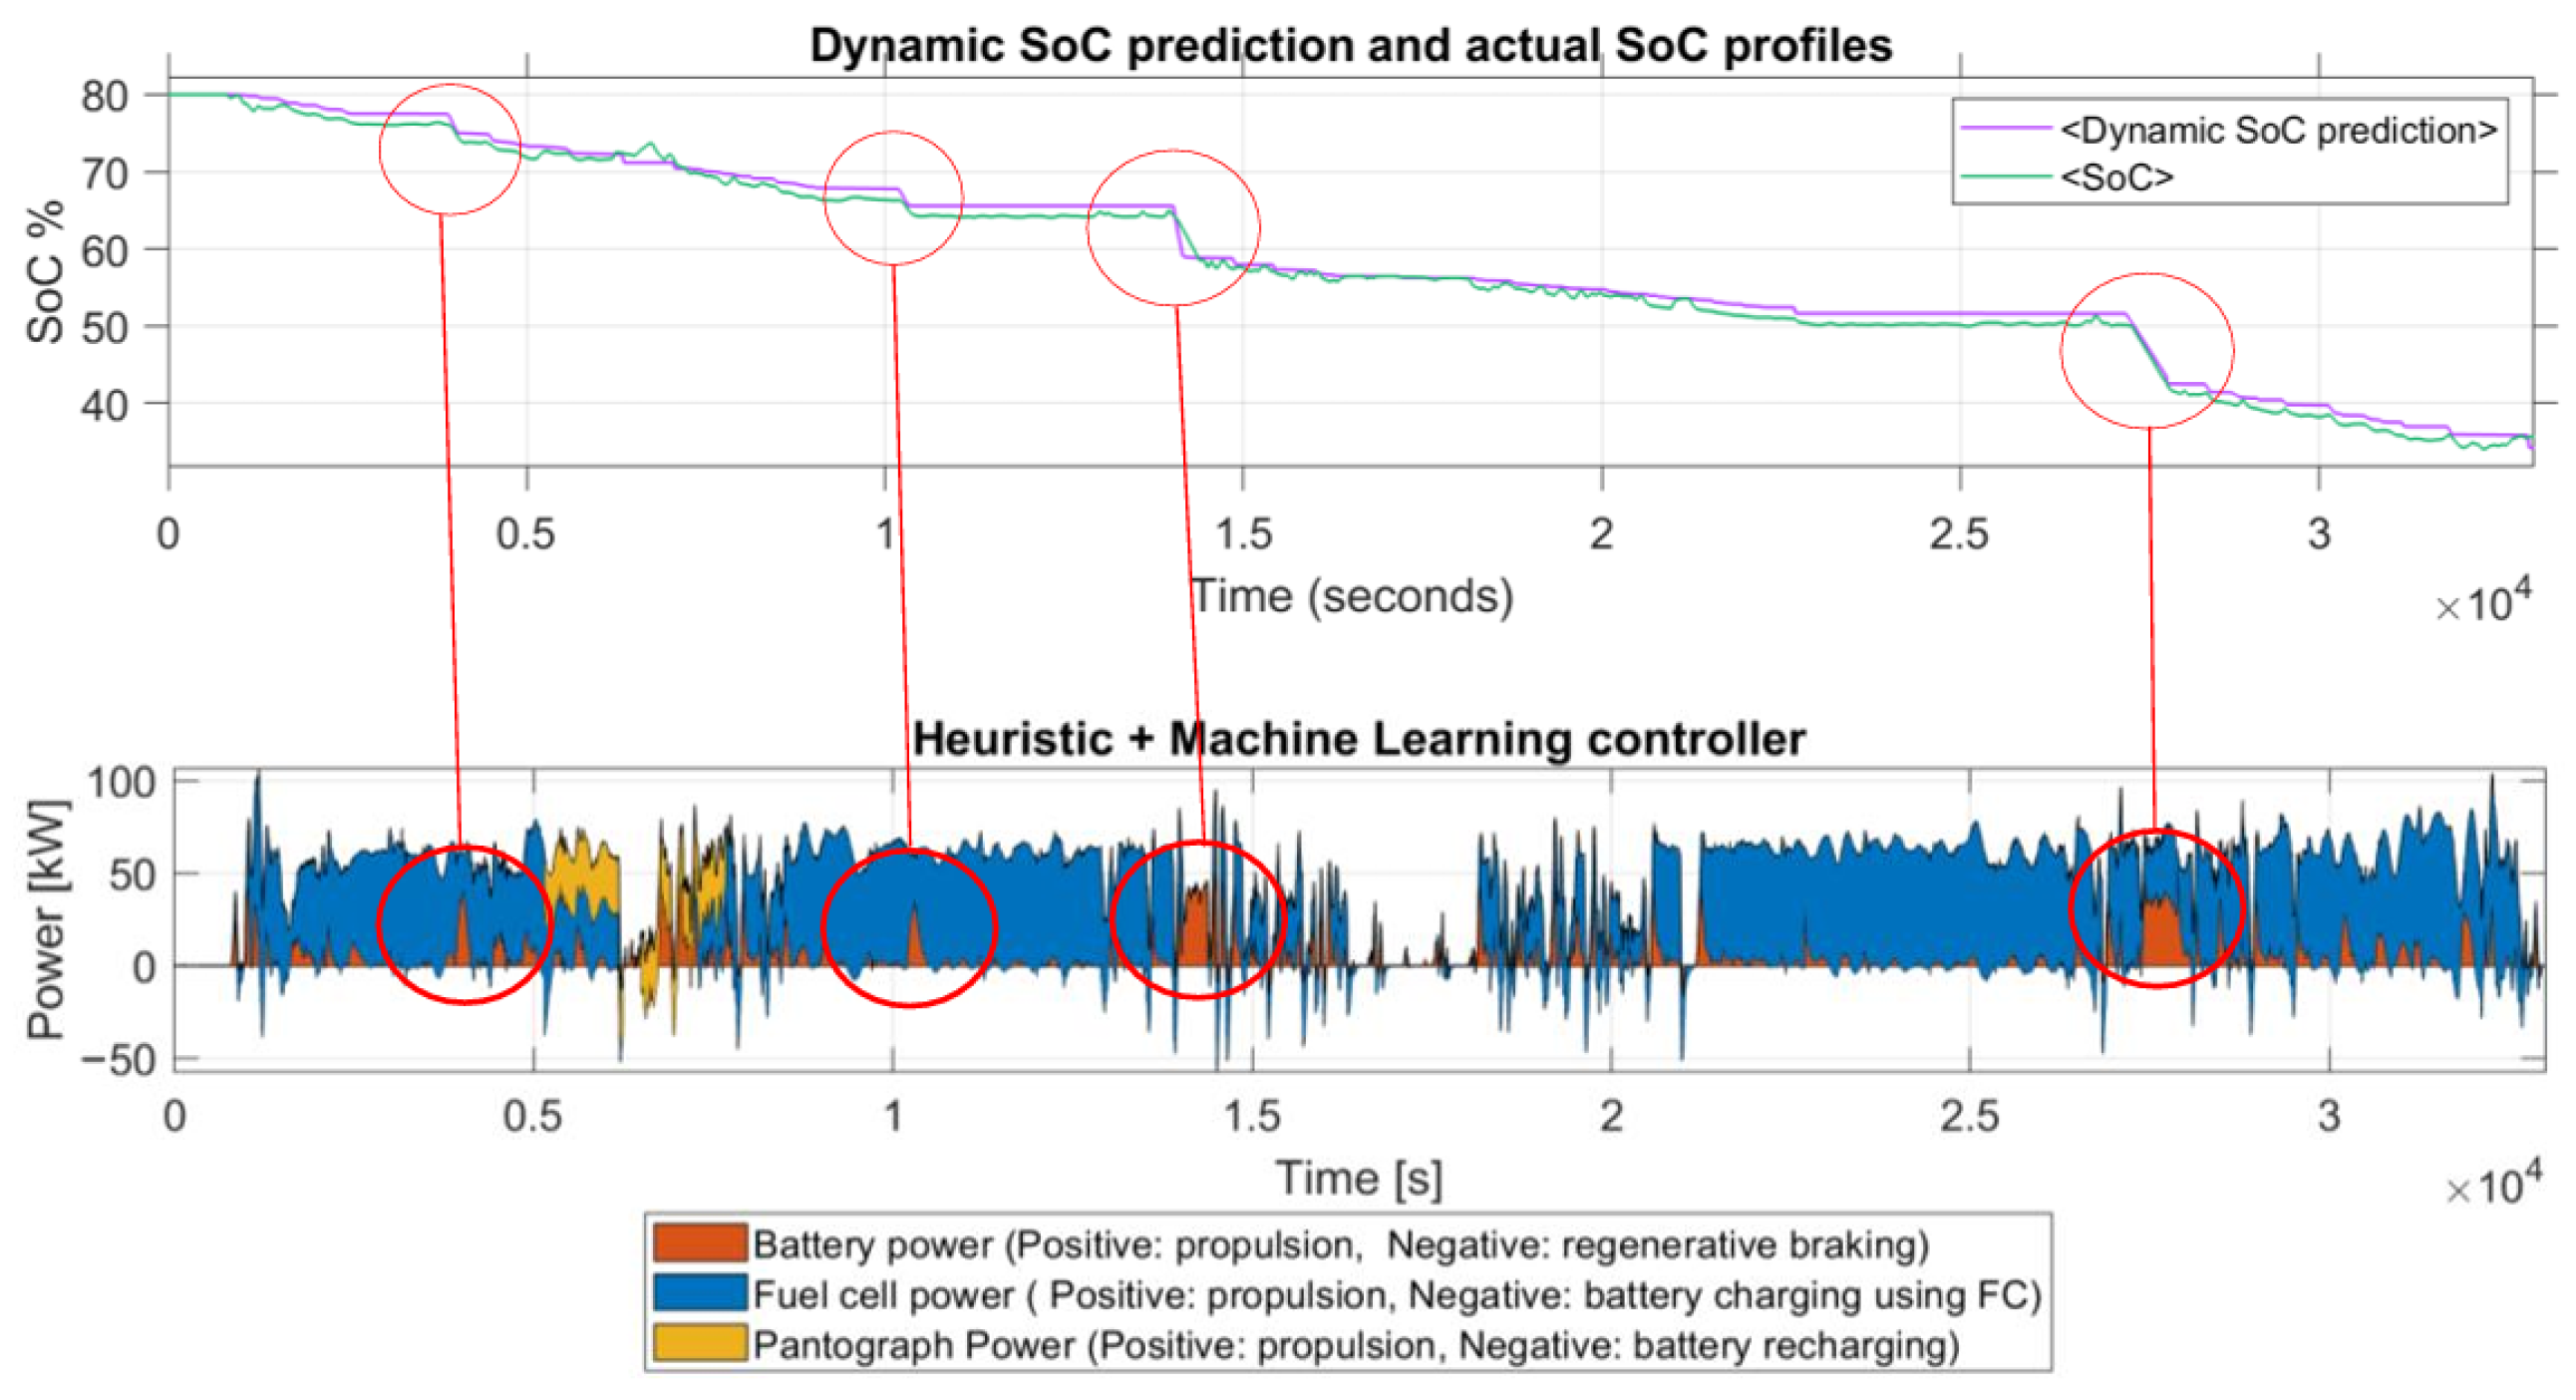

Disclaimer/Publisher’s Note: The statements, opinions and data contained in all publications are solely those of the individual author(s) and contributor(s) and not of MDPI and/or the editor(s). MDPI and/or the editor(s) disclaim responsibility for any injury to people or property resulting from any ideas, methods, instructions or products referred to in the content. |
© 2026 by the authors. Published by MDPI on behalf of the World Electric Vehicle Association. Licensee MDPI, Basel, Switzerland. This article is an open access article distributed under the terms and conditions of the Creative Commons Attribution (CC BY) license.