Article

Multi-Stack Efficiency Optimization Strategies for Fuel Cell Systems

School of Automation, Central South University, Changsha 410083, China
*
Author to whom correspondence should be addressed.
World Electr. Veh. J. 2026, 17(6), 281; https://doi.org/10.3390/wevj17060281
Submission received: 16 April 2026 / Revised: 20 May 2026 / Accepted: 22 May 2026 / Published: 26 May 2026
(This article belongs to the Section Storage Systems)

Abstract

With the in-depth advancement of the “dual carbon” strategy, Proton Exchange Membrane Fuel Cells (PEMFCs), as efficient and clean energy conversion devices, show great potential in the fields of transportation power and stationary power generation. For multi-stack fuel cell systems, a hierarchical optimization strategy based on Pareto decoupling and real-time correction is presented to achieve system efficiency improvement and balanced management of stack aging. Firstly, the Forgetting Factor Recursive Least Square (FFRLS) method is adopted to online identify the parameters of the system’s net output power-efficiency curve. Furthermore, in the steady-state layer, the Arithmetic Optimization Algorithm (AOA) is used to construct an efficiency-optimal candidate solution set. The Dijkstra algorithm is combined to search for the optimal power gradient path, generating a reference power table. In the dynamic layer, with the reference power table as the basis, the AOA algorithm is used to take efficiency optimization as the goal. Load fluctuations are suppressed in real time through strong constraints, realizing the balance between dynamic efficiency and operational stability. This method ensures the stable operation of the system and significantly improves the overall economy and adaptability of power allocation. Simulation results show that this strategy can effectively improve the overall operating efficiency of the system, slow down the stack aging rate, and ensure the stable operation of the system.

1. Introduction

With the growing severity of the global energy crisis and environmental problems, the demand for clean and renewable energy sources has been continuously increasing [1,2]. As a highly efficient and environmentally friendly energy conversion technology [3], fuel cells can directly convert the chemical energy of fuels such as hydrogen into electrical energy. They exhibit advantages including high energy density, low emissions, and rapid refueling, and have therefore attracted extensive attention in transportation, distributed power generation, and energy storage applications [4]. Especially in automotive, power, and communication industries, fuel cells are regarded as one of the key technologies to replace conventional fossil energy sources and have become an important driving force for sustainable development [5,6].
Although fuel cells present numerous advantages, their efficient operation is still restricted by various challenges. The maximum power point tracking (MPPT) algorithm has been adopted in several studies to maintain fuel cells at their optimal operating points [7,8]. An improved drift-free MPPT algorithm is presented in [9]. By introducing current variation (ΔI) information, the misjudgment caused by rapid changes under dynamic conditions, which is encountered in the conventional perturb and observe (P&O) method, is overcome. Consequently, the energy harvesting capability of the fuel cell system under fluctuations in temperature and pressure is enhanced. In [10], a machine learning classification-based MPPT control strategy is proposed, which formulates MPPT as a supervised classification task. Models such as decision trees, SVM, KNN, and ensemble learning are adopted to output duty-cycle commands, achieving fast and stable maximum power point tracking under dynamic fuel flow variations.
However, the complexity of fuel cell systems is considerably greater than the power output of a single stack. In addition to the fuel cell stack, multiple auxiliary components are integrated into the system [11,12]. While these components ensure stable system operation, additional parasitic power losses are also introduced [13]. Therefore, the sole pursuit of maximum output power is not regarded as an optimal strategy. In [14], sliding mode variable structure control (SMVSC) based on exponential reaching law and a maximum net power regulator is designed. The power optimization issues caused by nonlinearity and uncertainties in fuel cell systems are effectively solved, and the net output power of PEMFC systems is thereby improved.
Unlike other renewable energy systems, such as photovoltaic and wind power systems, fuel cells are energy conversion devices driven by fuels, including hydrogen [15]. Their efficiency is thus determined not only by power output but also by fuel utilization [16]. In [17], an online efficiency monitoring method based on model-guided extremum seeking and active disturbance rejection control is presented. Uncertainties such as variations in operating conditions and component degradation are effectively handled, and real-time optimal tracking of system efficiency is achieved. A hierarchical performance enhancement control strategy (HPECS) is presented in [18]. Multi-objective optimization based on dynamic weighting factors is adopted in the upper layer, and data-driven constraint-adaptive predictive control is employed in the lower layer. The trade-off between net power and efficiency in fuel cell systems is thereby coordinated.
However, in practical applications of fuel cell systems, most existing studies are focused on single fuel cell stacks [19]. Nevertheless, single-stack fuel cell systems exhibit several inherent drawbacks. The output power is limited, making it difficult to satisfy high-power demands. The efficiency fluctuates significantly, which destabilizes energy utilization. Load adaptability is insufficient, leading to unsatisfactory performance under frequently varying loads. These issues become particularly prominent in high-power or variable-load applications [20]. To address these shortcomings, multi-stack fuel cell systems are regarded as an effective solution. Multiple fuel cell stacks are connected in series or parallel [21]. This configuration not only increases the total output power but also improves operational stability and load regulation capability. As a result, the stability, adaptability, and overall performance of the system are enhanced [22,23].
At present, studies on the efficiency optimization of multi-stack fuel cell systems remain relatively limited. In [24], a coordinated optimal power allocation strategy based on the maximum efficiency range (MER) is presented for multi-stack fuel cell systems (MFCS). An MFCS model consisting of three fuel cell systems is established. The impacts of different altitudes on system performance are considered, and efficiency analyses are conducted. The MER-based coordination scheme achieves optimized power distribution among multiple stacks. For dual-stack proton exchange membrane fuel cell (PEMFC) systems, a real-time power allocation strategy is introduced in [25]. Polarization curves and hydrogen consumption data are collected and processed in real time. Power allocation between individual stacks is adjusted dynamically. In [26], a coordinated control strategy for multi-stack PEMFC and battery energy storage in shipboard microgrids is proposed, which combines master-slave control and droop control. Four operation modes are designed according to load power and battery SOC, keeping fuel cells operating in the highest efficiency range while suppressing load fluctuations, thus improving system efficiency and significantly reducing hydrogen consumption. However, the evolution of fuel cell aging characteristics is neglected in these studies [27], which may degrade the long-term stability and reliability of the system. In addition, real-time acquisition of actual polarization curves remains challenging, which limits the effectiveness of such strategies in practical applications.
In practical applications, multi-stack fuel cell systems are often composed of multiple stacks with different performance states. During long-term operation, the efficiency characteristics of individual stacks change continuously due to different aging rates, resulting in degraded overall system performance. At present, the optimal control of multi-stack systems usually relies on static models. Such models can hardly reflect the dynamic characteristics of stacks and lack real-time performance and adaptability. Meanwhile, most optimization strategies only take efficiency as the objective and ignore the evolution of aging states. Thus, long-term performance maintenance of the system cannot be achieved. In addition, conventional methods generally assume consistent performance among stacks. The imbalance caused by actual performance differences between stacks is not fully considered. To improve the comprehensive performance of multi-stack systems and reduce the influence of aging imbalance on system lifetime, it is urgent to develop a control strategy for multi-stack fuel cell systems. The strategy should support real-time model updating, dynamic aging state perception, and collaborative optimization considering both efficiency and lifetime characteristics, so as to achieve long-term stability and high efficiency in system operation.
As shown in Table 1, a dual-time-scale hierarchical optimal control strategy is presented for multi-stack fuel cell systems in this paper. The strategy aims to achieve collaborative optimization between overall system efficiency improvement and balanced stack aging management. First, based on the system mechanism model, the characteristic curves of net output power and efficiency are identified online using the forgetting factor recursive least square (FFRLS) method.
On this basis, the Pareto optimality principle is introduced to realize the decoupling of the dual-objective optimization conflict between system efficiency and aging suppression. Within the steady-state planning layer, the full operating load range is discretized first. Taking system efficiency maximization as the optimization goal, the Arithmetic Optimization Algorithm (AOA) is employed to obtain a series of non-dominated solutions and further construct the Pareto optimal front. To avoid frequent and abrupt power switching, the minimum power transient variation is selected as the path evaluation index. The Dijkstra algorithm is then utilized to search for the globally smooth optimal power scheduling path, whereby a standard reference power distribution table is established. In the dynamic execution layer, relying on the established Pareto reference solution set, AOA is adopted to implement short-time-scale real-time optimization. By constraining the allowable range of power fluctuation, real-time correction of load disturbance is realized. This hierarchical Pareto-based decoupling strategy effectively balances high system efficiency and operational stability, and also suppresses the aging degradation of the fuel cell stack.

2. PEMFC System Design and Modeling

Fuel cells are high-efficiency energy conversion devices that can directly convert chemical energy into electrical energy. They are characterized by high energy density, low emissions, and long service life. The working principle involves the transfer of protons between the anode and cathode through an electrolyte membrane, and the generation of an electric current in the external circuit.
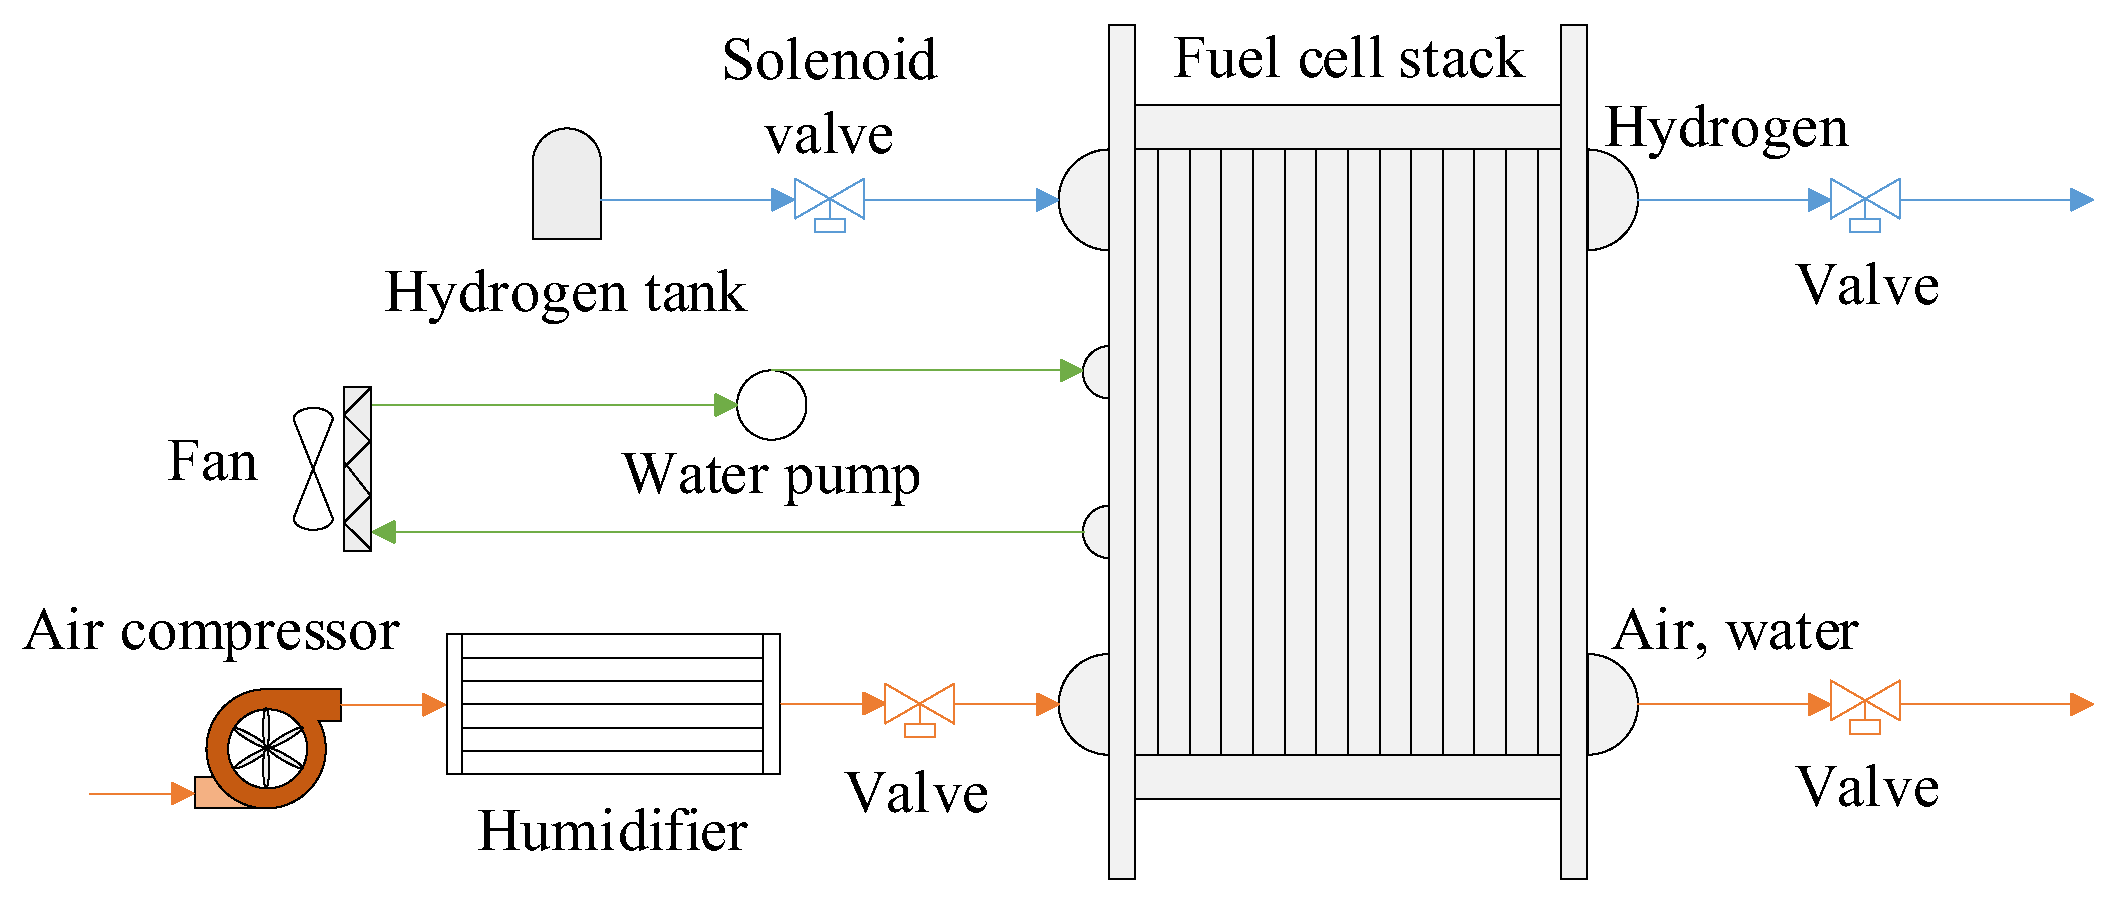
As shown in Figure 1, a fuel cell system is a complex system composed of multiple highly coupled components. Its main parts include the fuel cell stack, anode subsystem, cathode subsystem, and cooling subsystem. These components interact and cooperate with each other, which jointly determine the overall performance of the system. Variations in the performance and state of each component affect the output voltage, efficiency, and stability of the entire system. Therefore, the complex coupling relationships among components must be fully considered in the modeling of fuel cell systems [28].
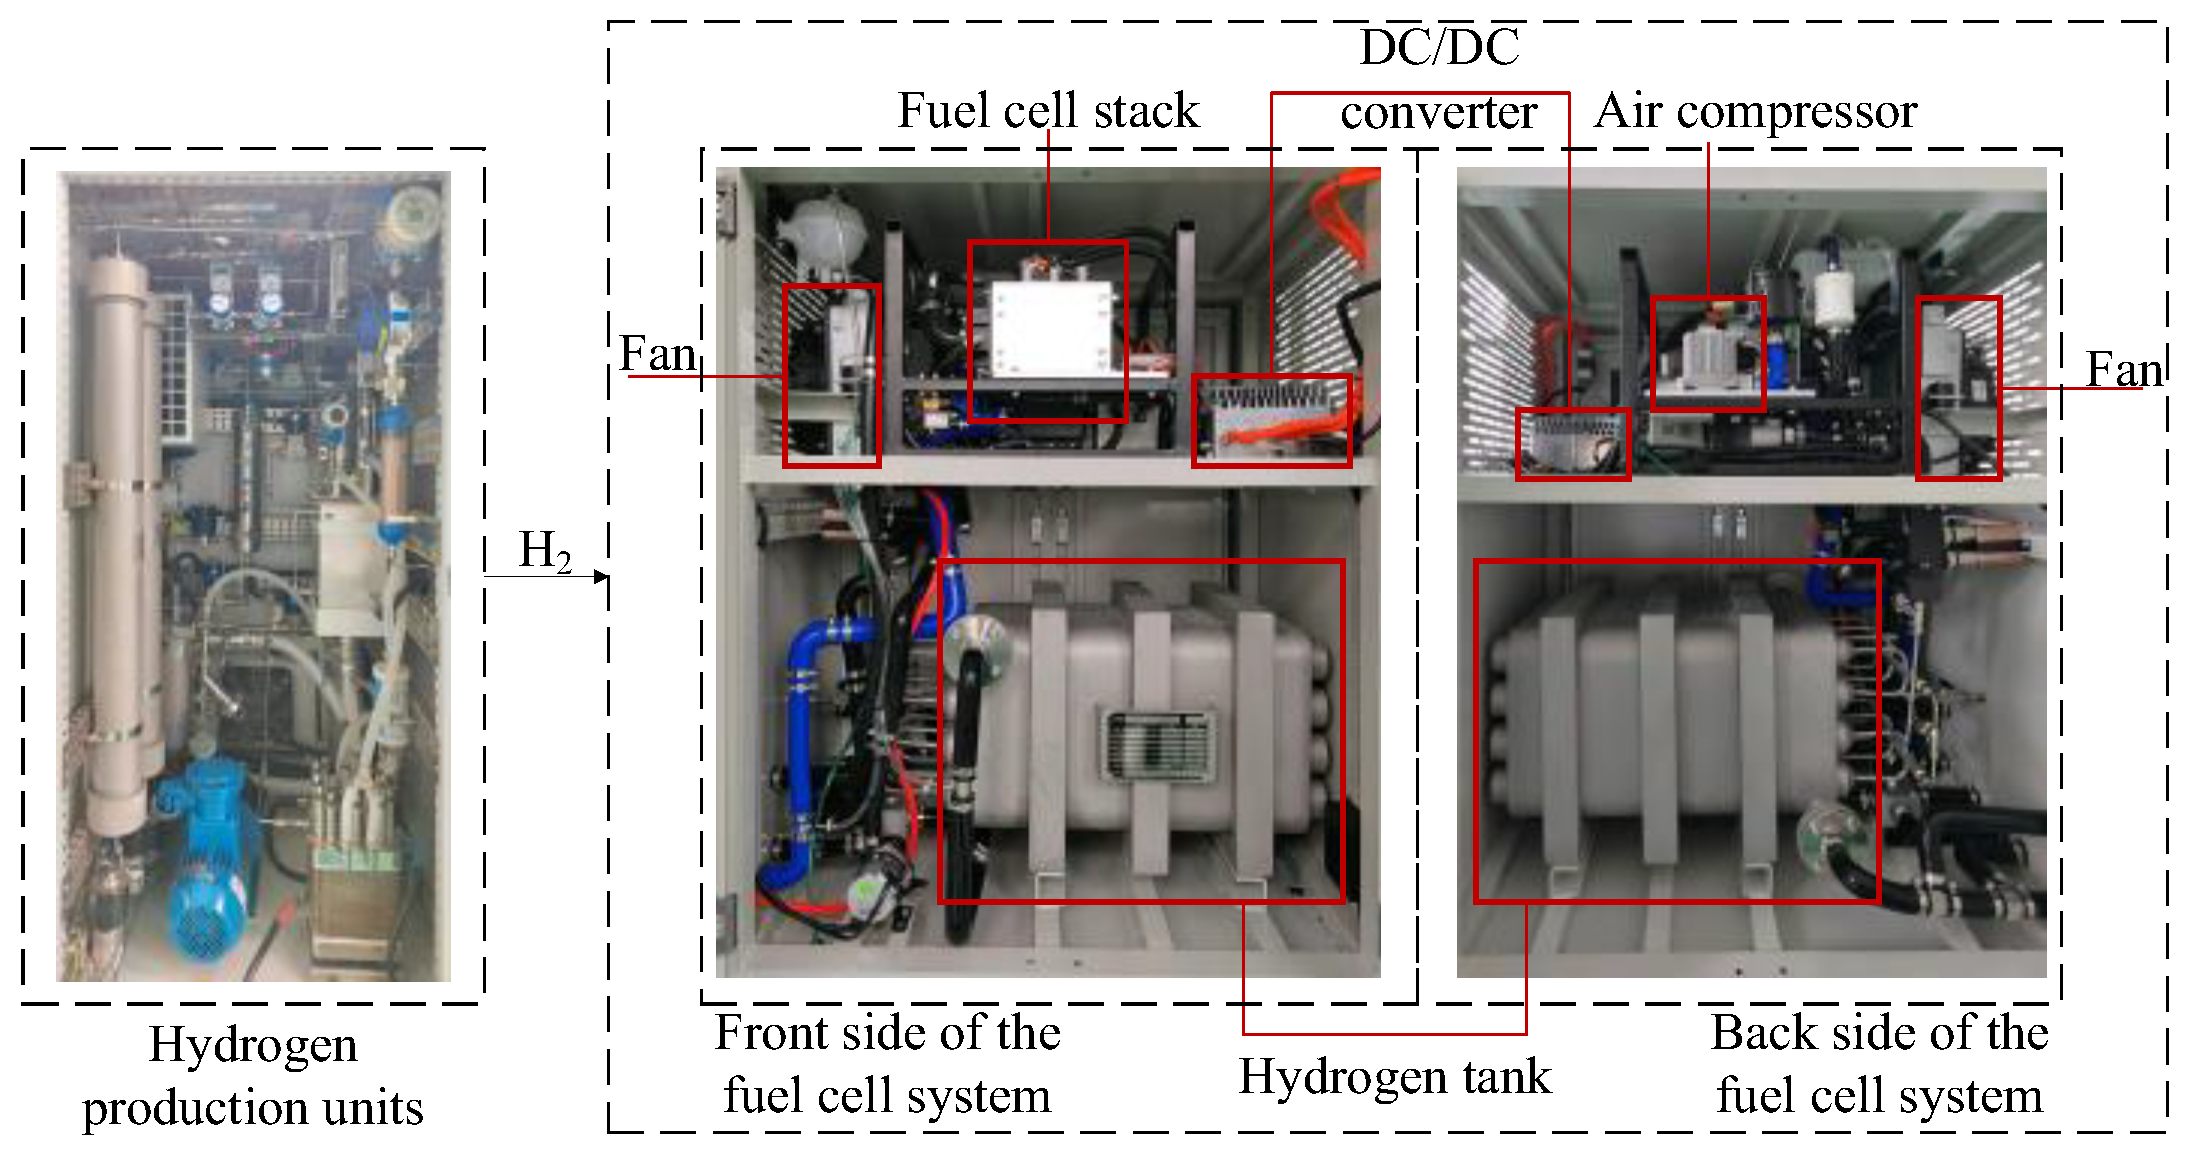
In this section, the modeling method for fuel cell systems is introduced. A fuel cell model is established based on the experimental setup shown in Figure 2. This model provides a solid foundation for further efficiency optimization and control strategy design.

2.1. Modeling of the PEMFC Unit

The output characteristics of fuel cells are nonlinear and are affected by parameters such as cell temperature, oxygen partial pressure, hydrogen partial pressure, and membrane water content. The output voltage characteristics of fuel cells are given as follows [29]:
V c e l l i n = E n e r V a c t V o h m V c o n
V c e l l i n represents the initial output voltage of a single fuel cell. E n e r , V a c t , V o h m , and V c o n denote the Nernst voltage, activation voltage drops, ohmic voltage loss, and concentration voltage loss, respectively. In general, a fuel cell stack can be regarded as an assembly of numerous ideal unit cells. Thus, the initial output voltage V f c i n of a fuel cell stack consisting of N cells is given as follows:
V f c i n = N × V c e l l i n
In practical applications, performance degradation of fuel cell systems is often induced by start-stop cycles, instantaneous load variations, and operation under low or high load conditions [30]. An empirical model can be adopted to simulate fuel cell degradation.
Δ V by evaluating the voltage decay associated with the four operating conditions mentioned above:
Δ V = T l o w O l o w 3600 + T h i g h O h i g h 3600 + N t r O t r + N s t O s t
T l o w and T h i g h represent the operating durations under low load and high load, respectively, with the unit of seconds. N t r stands for the number of instantaneous load transitions, and N s t denotes the number of start-stop cycles. The coefficients O l o w , O h i g h , O t r , and O s t are provided in Table 2.
The voltage degradation index D f c is widely adopted as an indicator of fuel cell degradation. As operating time increases, the fuel cell voltage V f c gradually decreases compared with the initial voltage V f c i n , which affects output power and efficiency.
D f c = V f c V f c i n = V f c i n Δ V V f c i n
In fuel cell system modeling, models for other key components must be established in addition to the output voltage model of the fuel cell stack [32]. In practical applications, the air compressor is regarded as an essential auxiliary component, and its modeling is considered critical. The main function of the air compressor is to supply the required oxygen or air to the fuel cell stack. Its power consumption is usually treated as an important factor influencing the overall system efficiency. Power consumption of the air compressor is closely related to operating pressure, mass flow rate, and efficiency.
P c o m = 1004 T c o m p ¯ 0.286 1 W c o m η c o m
Here, T c o m denotes the air compressor temperature, W c o m represents the air mass flow rate through the compressor, η c o m is the motor efficiency of the compressor, and p ¯ stands for the average air pressure.
In this study, the air compressor is considered the main source of auxiliary power consumption [33], and its power consumption is incorporated into the calculation of system efficiency.
As listed in Table 3, the PEMFC used in this work has a rated output power of 3.5 kW and is composed of 40 single cells connected in series. The fuel cell stack was simulated at a room temperature of 25 °C and an ambient relative humidity of 40%, with a hydrogen partial pressure of 2.6 bar, an oxygen partial pressure of 0.3 bar, a hydrogen flow rate of 1 Nm3/h, and an oxygen flow rate of 0.5 Nm3/h.
The steady-state response test is described as follows: Ten operating points were uniformly selected within the operating range of the generator, covering typical operating conditions from light load to near-rated load. After the thermal initialization process, the system was maintained at the idling state for 10 s. Subsequently, the load was smoothly adjusted to each preset operating point following the specified loading procedure. Each operating point was kept running for no less than three minutes to ensure that the system reached a stable output state. The relevant experimental data are summarized in Table 4.
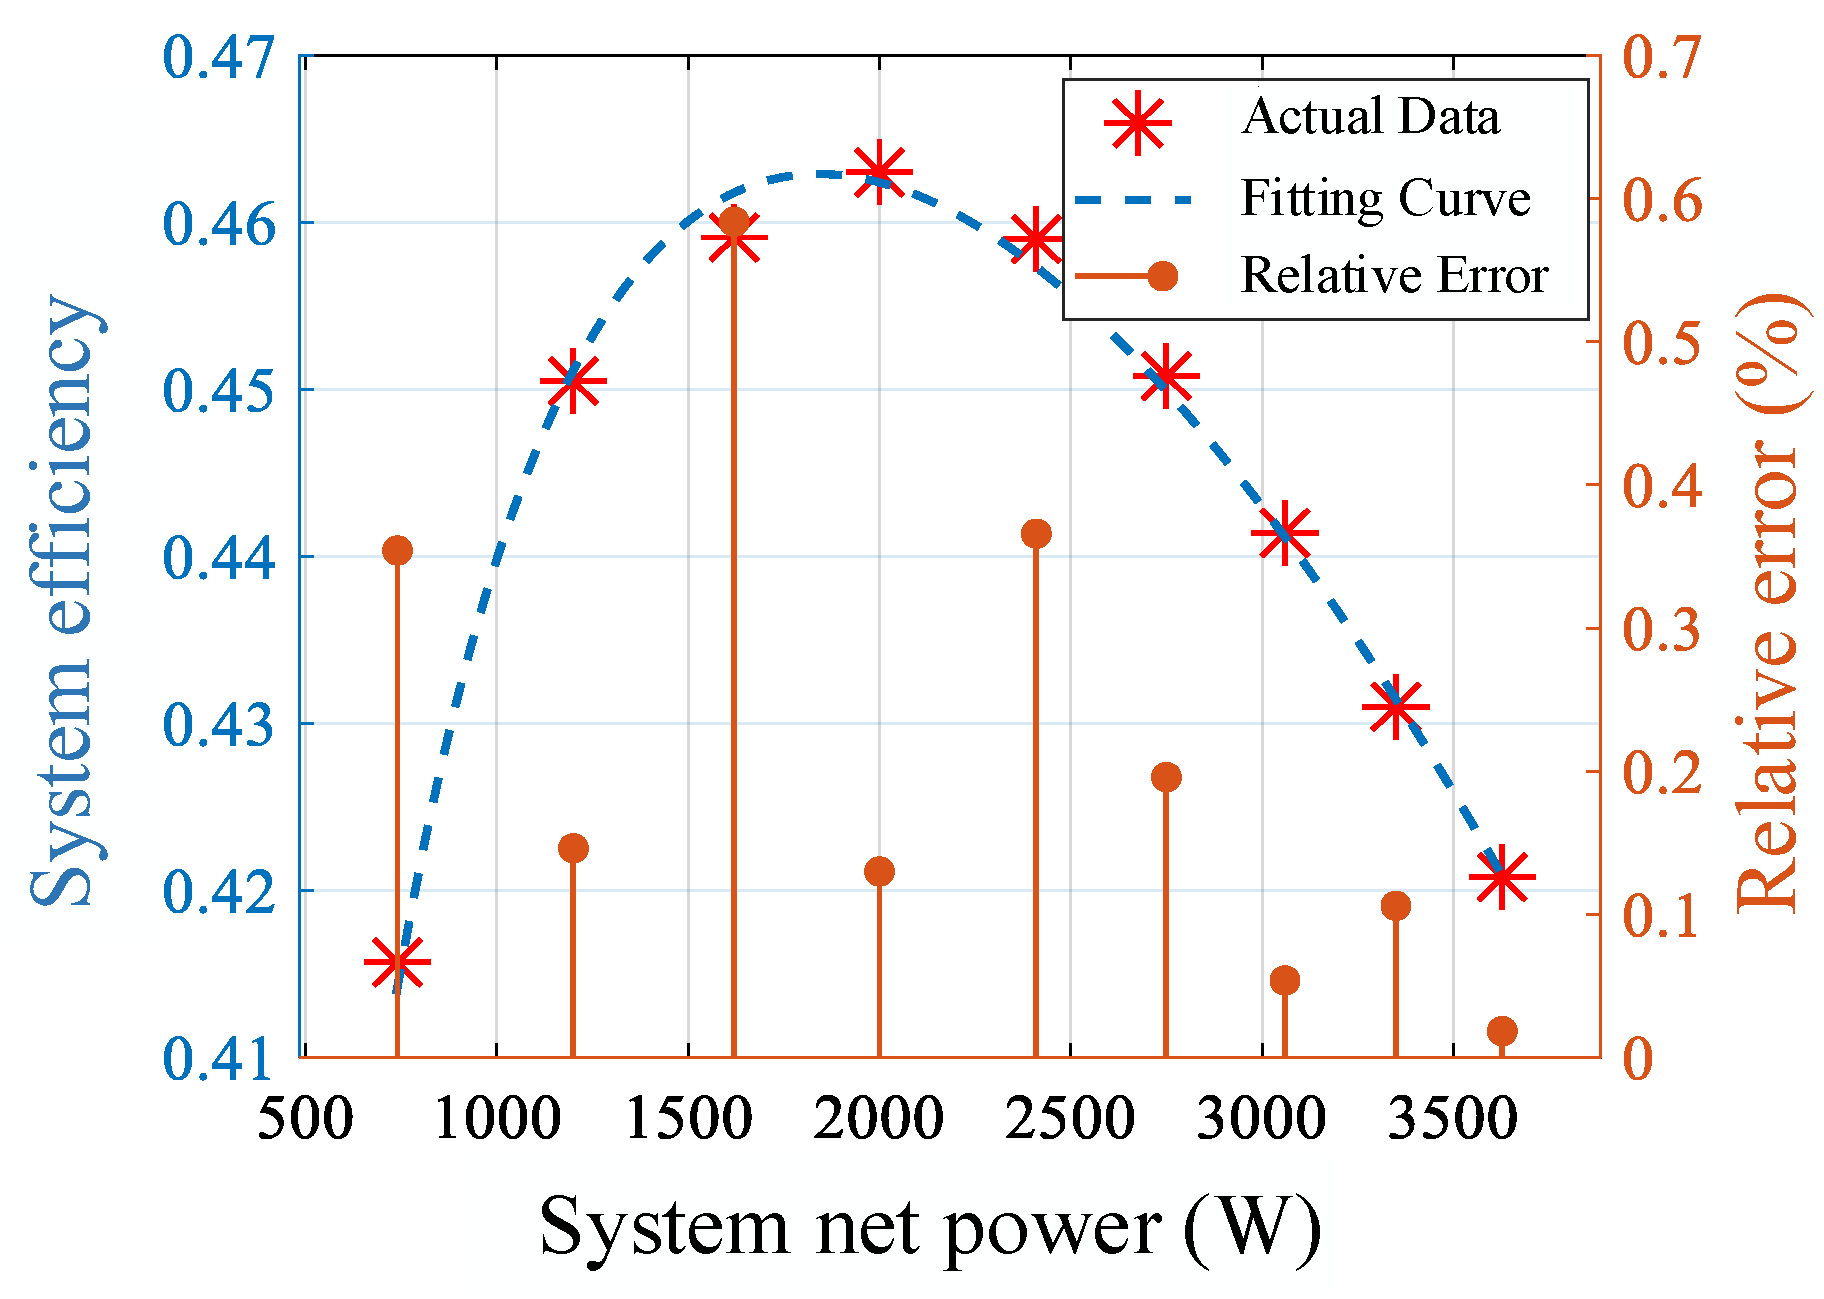
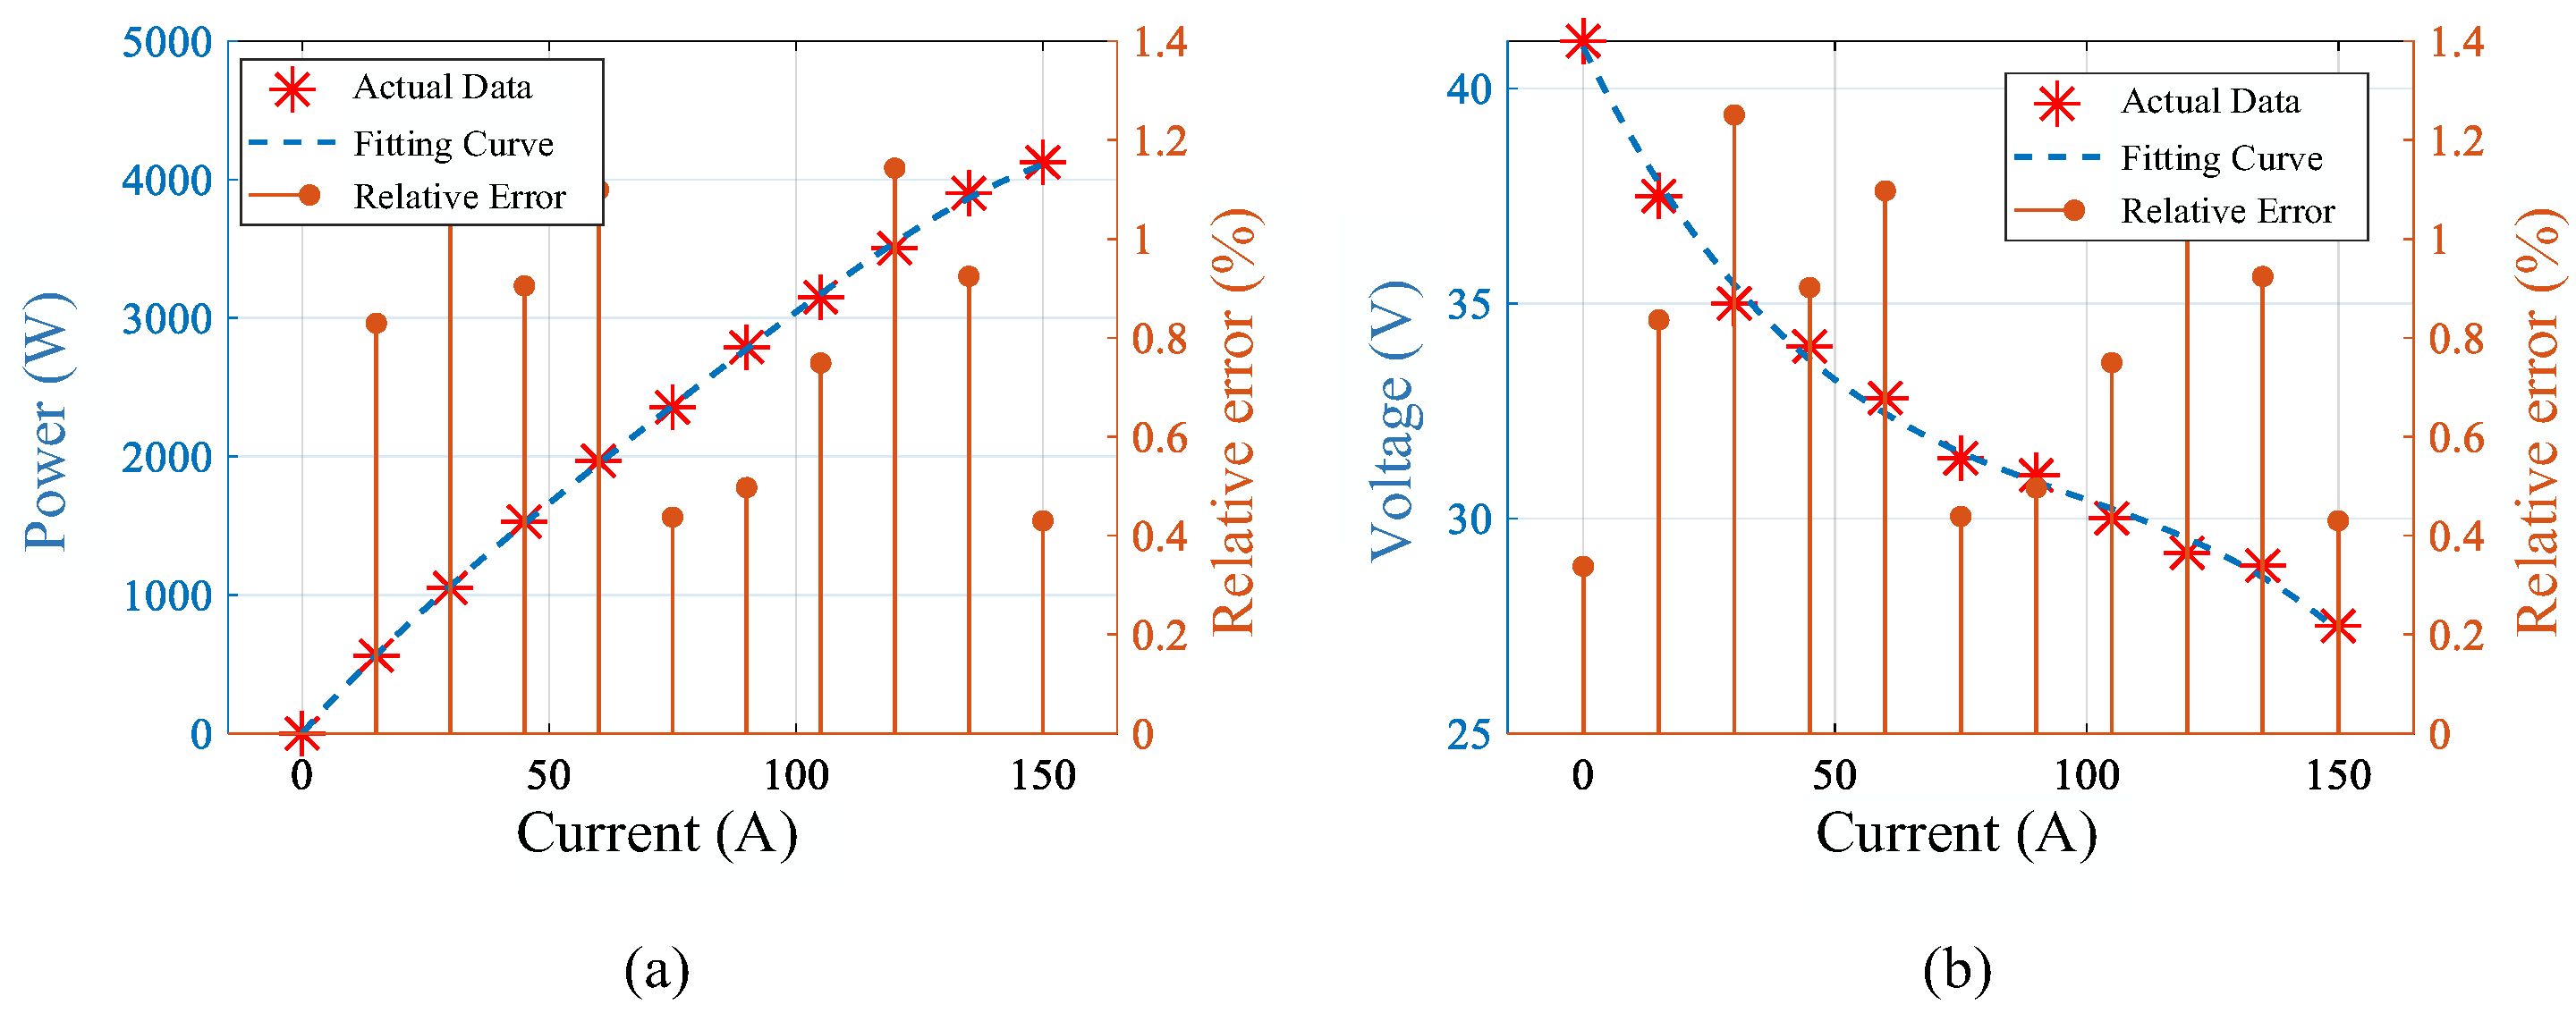
A comparison between the measured polarization curve and the simulated results of the presented model is presented in Figure 3 and Figure 4. It can be observed that the established model is in good agreement with experimental data, and the deviation is relatively small.

2.2. PEMFC System Efficiency

Efficiency calculation is regarded as one of the important indicators for evaluating fuel cell system performance. The theoretical efficiency of the fuel cell stack η f c is defined as the ratio of the electrical energy P f c generated by the stack to the chemical energy P t o t a l of the supplied hydrogen fuel.
η f c = P f c P t o t a l = V f c I f c P t o t a l × 100 %
Here, V f c and I f c represent the output voltage and current of the fuel cell stack, respectively. The chemical energy of the supplied hydrogen fuel P t o t a l is calculated using the following expression:
P t o t a l = Δ H N I f c 2 μ f c F
where Δ H is the heating value of hydrogen combustion, N is the number of unit cells in the stack, μ f c is the molar mass of hydrogen, and F is the Faraday constant. Based on the above equations, the efficiency of the fuel cell stack η f c can be further derived [34]:
η f c = V f c 1.48 N × 100 %
In addition, the electrical efficiency η e l e of a fuel cell is defined as the ratio of the net output electrical power of the fuel cell stack to the total generated electrical power. The calculation is expressed as follows:
η e l e = P f c P a u x P f c = P n e t P f c × 100 %
P a u x denotes the power consumption of auxiliary components. Such components typically include, but are not limited to, air compressors, power conditioning units, and control systems. These devices are considered critical in fuel cell systems to guarantee normal operation and stability. The net output power P n e t refers to the actual electrical power delivered by the fuel cell system after deducting the power consumption of all auxiliary components. This power represents the energy available for external loads.
By combining the stack efficiency and electrical efficiency, the overall efficiency η s y s of a single-stack fuel cell system can be calculated using the following equation:
η s y s = η f c × η e l e × 100 %
In multi-stack fuel cell systems, the overall system efficiency η m s y s requires a weighted consideration of the efficiency of each individual stack. The efficiency of each stack may vary due to operating conditions, load levels, and other factors. Therefore, the calculation of overall system efficiency must integrate the performance of all stacks. Its formula is given as follows:
P m n e t = i = 1 n P n e t i P m t o t a l = i = 1 n P n e t i η s y s i η m s y s = P m n e t P m t o t a l × 100 %
where P n e t i and η s y s i represent the net output power and system efficiency of each individual fuel cell stack, respectively; P m n e t denotes the sum of the net output power of all fuel cell stacks, and P m t o t a l refers to the total chemical energy of all fuel cell stacks. After the completion of fuel cell stack modeling, a Boost DC/DC converter is adopted as the interface between the fuel cell and the DC bus. The Boost converter is a DC step-up circuit that elevates the low and dynamic output voltage of the fuel cell to a stable voltage range required by the system [35]. Furthermore, the Boost converter features a simple structure and flexible duty-cycle control. For these reasons, the Boost converter is employed as the power interface in this work.

2.3. Modeling of the Energy Storage Unit

Owing to the limited response speed of multi-stack fuel cell systems under sudden load changes or environmental disturbances, along with the tendency of output power fluctuations, it is difficult to satisfy short-term power demands and maintain bus voltage stability by relying solely on fuel cell stacks. Therefore, energy storage units are introduced to enhance the dynamic performance of the system. The energy storage unit is composed of an electrochemical battery pack and a bidirectional DC/DC converter.

3. Efficiency Optimization Strategy for Multi-Stack Fuel Cell Systems

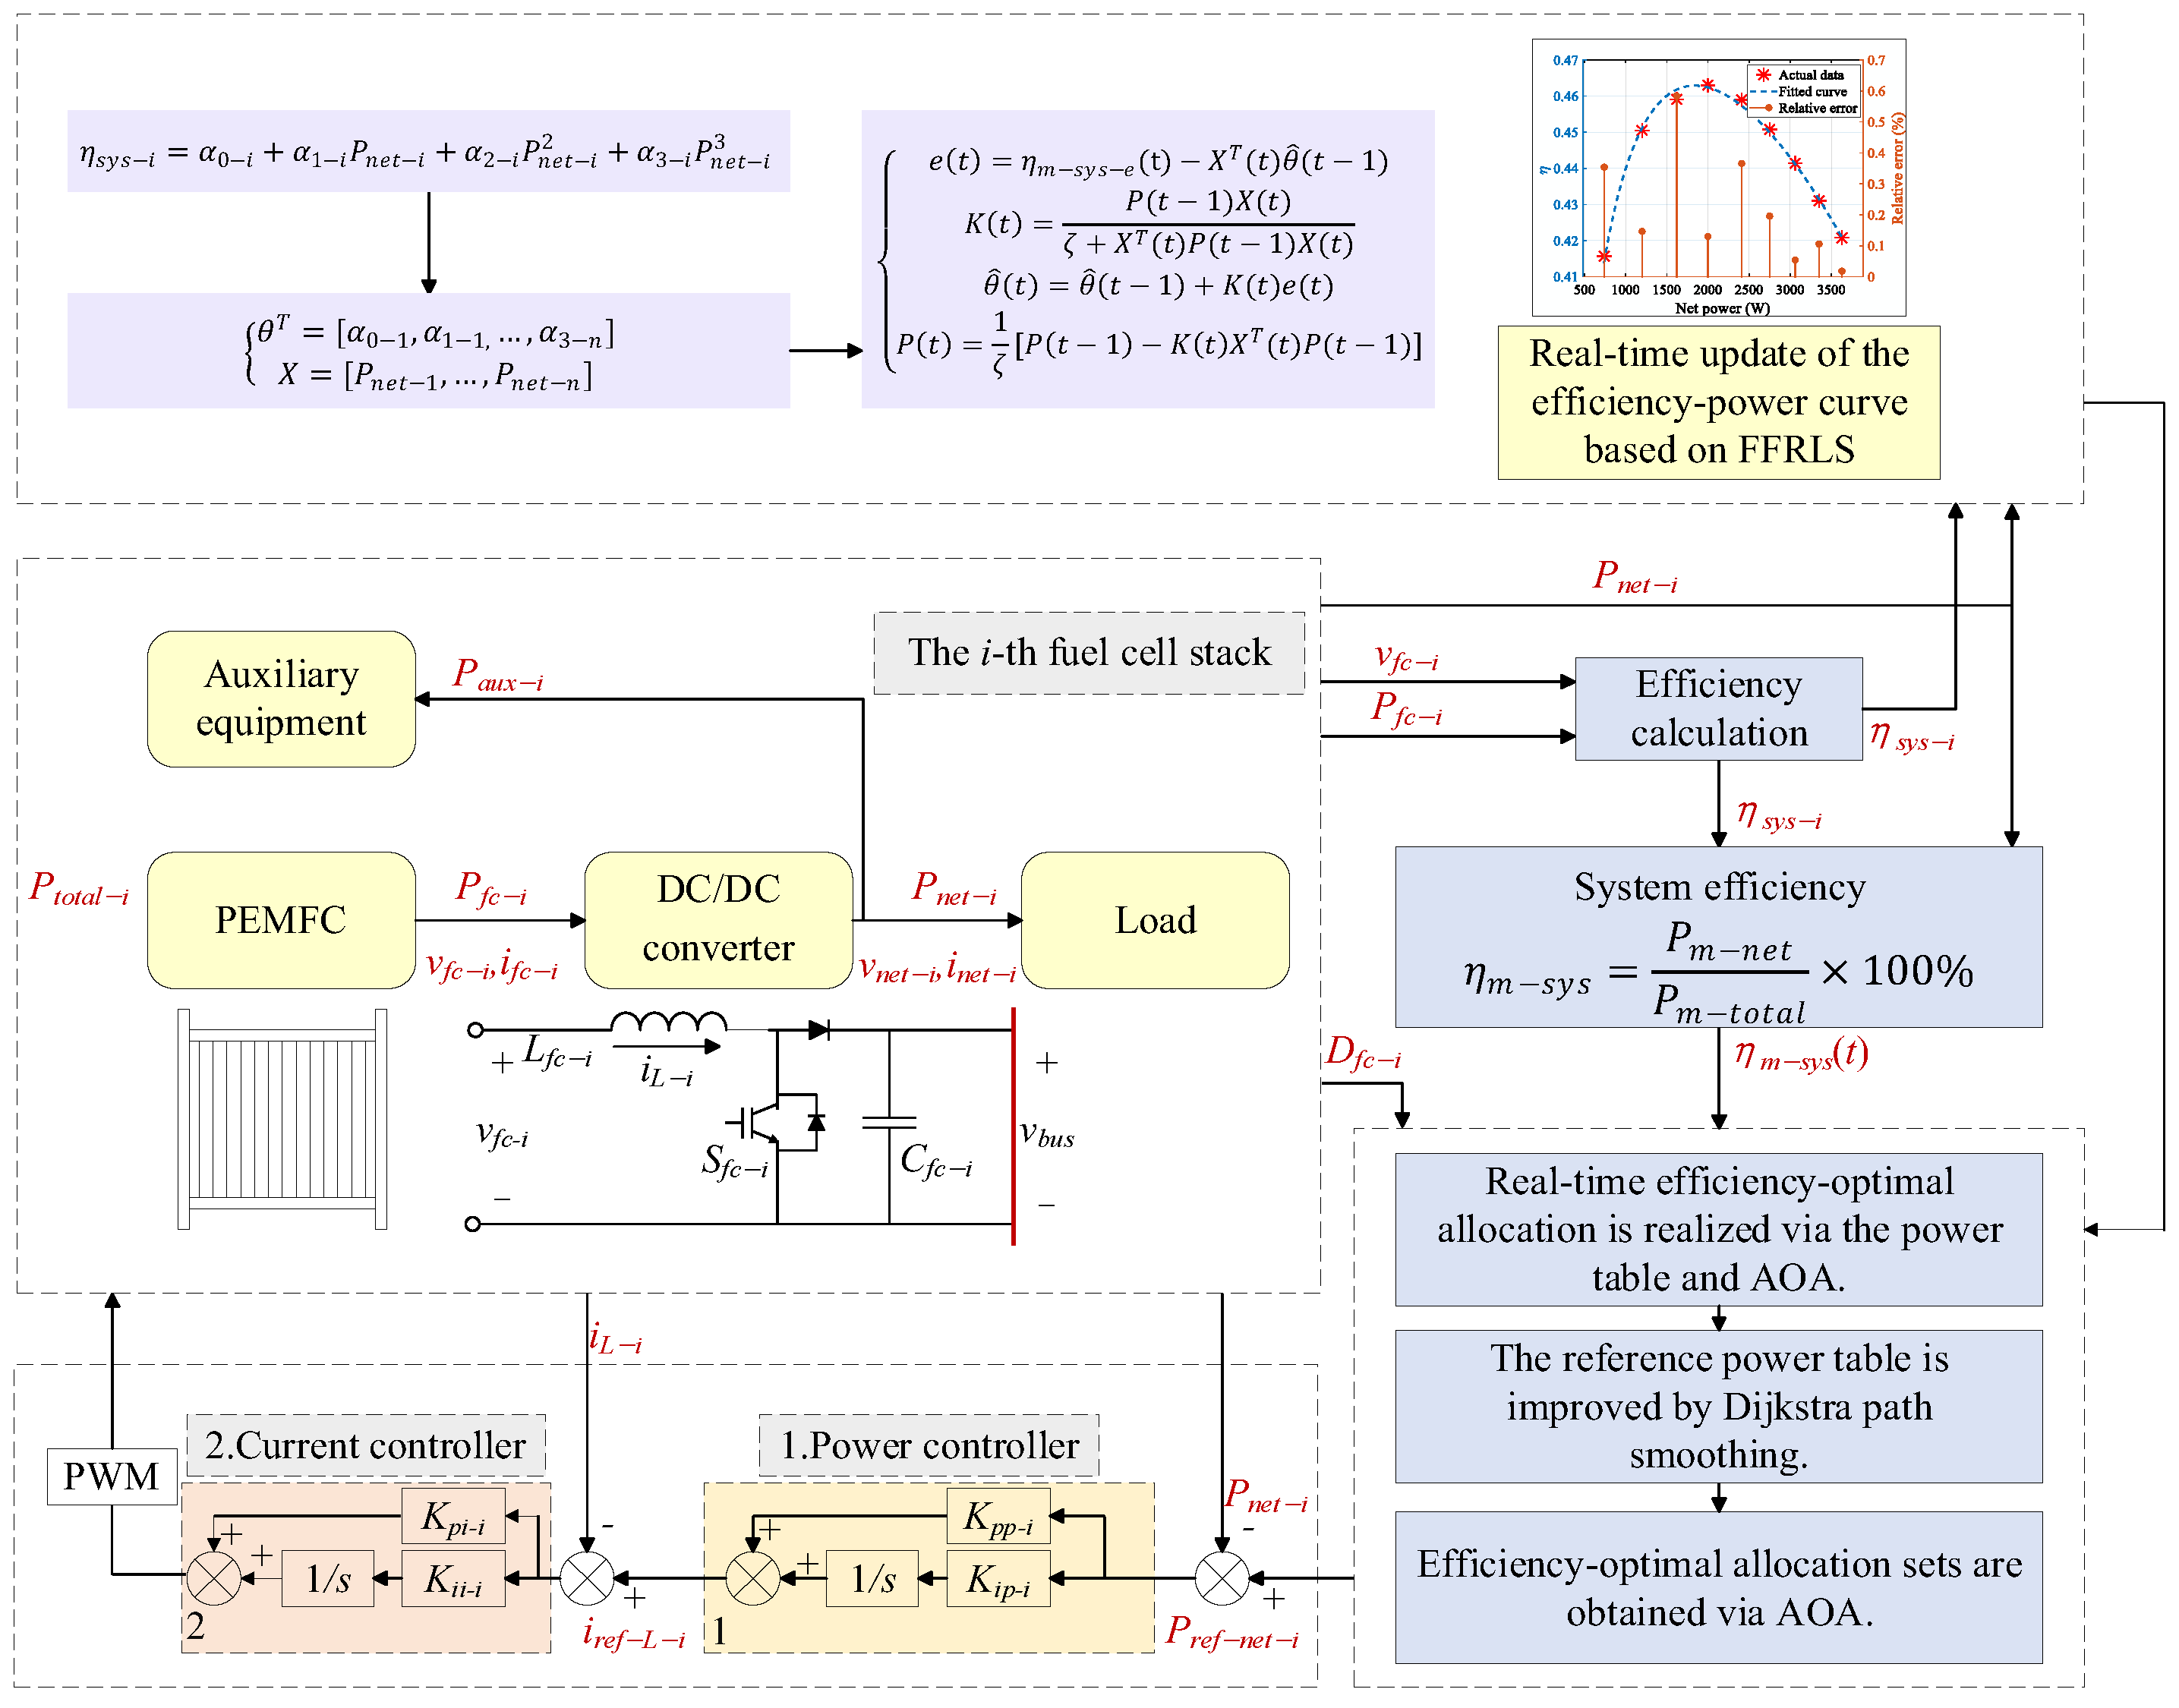
As illustrated in Figure 5, to overcome this technical bottleneck, an innovative dual-time-scale power distribution optimization framework is presented. This framework integrates the global optimization capability of the Arithmetic Optimization Algorithm (AOA) and the advantages of the Dijkstra algorithm in shortest-path planning. From the perspective of time scale, the power distribution process is divided into two cooperative layers. Global optimization is implemented at a long-time scale, while continuous local correction is conducted at a short time scale. The core idea is to periodically compensate for relatively stable aging trends using the global search ability of global optimization algorithms. Meanwhile, real-time compensation for short-term disturbances or minor deviations is achieved via high-speed local optimization strategies. In this way, more robust and dynamically adaptive power scheduling is realized.

3.1. Online Update of Efficiency-Power Curves Based on FFRLS

Based on the above theoretical analysis, a third-order formula can be adopted to fit the nonlinear relationship between the net output power and efficiency of fuel cells:
η s y s i = α 0 i + α 1 i P n e t i + α 2 i P n e t i 2 + α 3 i P n e t i 3
According to Equation (10), the net output power of a fuel cell can be measured, while the unknown parameters α 0 i , α 1 i , α 2 i , and α 3 i must be obtained through parameter estimation. To realize online updating of the voltage model, the model is rewritten as the following linear parametric equation, where X represents known quantities and θ denotes the parameters to be identified.
θ T = [ α 0 1 , α 1 1 , , α 3 n ] X = [ P n e t 1 , , P n e t n ]
Based on the above equation, online parameter identification is performed using the least squares method with a forgetting factor, and the objective function is defined as follows:
M = i n η m s y s e η m s y s c 2
η m s y s e is the measured overall efficiency and η m s y s c is the calculated overall efficiency derived from the model.
The FFRLS algorithm continuously updates model parameters to minimize errors between observed data and model outputs [36]. The FFRLS method has the advantages of low computational cost, fast convergence speed, superior stability, and convenient engineering implementation. It can fully meet the real-time and high-reliability requirements of online parameter identification for fuel cell system control. The purpose of this method is to adjust parameters in real time with each new data input, so that the model can better adapt to dynamic changes of the system. The introduction of the forgetting factor ζ ensures that the influence of earlier data on current parameter updates is gradually weakened, thus improving adaptability to recent data. The FFRLS algorithm is implemented by the following equations:
e t = η m s y s e ( t ) X T ( t ) θ ^ ( t 1 ) K t = P ( t 1 ) X ( t ) ζ + X T ( t ) P ( t 1 ) X ( t ) θ ^ t = θ ^ t 1 + K ( t ) e ( t ) P t = 1 ζ [ P t 1 K t X T ( t ) P ( t 1 ) ]
e t is the error at the current time step and θ ^ ( t 1 ) is the estimated parameter vector obtained at the previous step. X T ( t ) is the input vector at the current time. The forgetting factor ζ is an important parameter that controls the memory length of the system, and its value is generally set between 0.95 and 1. K ( t ) is the gain vector at the current time step, and θ ^ t is the updated parameter vector based on the current error. P ( t ) is the covariance matrix at the current time step, which reflects the uncertainty of parameter estimation. As time steps progress, the covariance matrix converges gradually to ensure stable parameter estimation.

3.2. Long-Time-Scale Multi-Stack Power Allocation Method Considering Degradation Factors

Fuel cell degradation is regarded as the main cause of performance decay and reduced service life, and is affected by multiple factors. Operation at low power, high power, and frequent load fluctuations are all likely to accelerate fuel cell degradation. Specifically, low-power operation may lead to catalyst poisoning or water management issues. High-power operation may cause overheating and degradation of the membrane electrode assembly. Frequent load fluctuations exacerbate thermal cycling fatigue and electrochemical reaction failure of cells.
In the engineering practice of multi-stack fuel cell systems, power allocation strategies serve as a critical link between system control and stack operating conditions. The overall efficiency, service life, and life-cycle economy of the system are directly influenced by such strategies. Traditional fixed allocation schemes are usually designed based on initial performance parameters. Such schemes can hardly adapt to the differentiated performance decay of individual stacks during operation.
As operating time accumulates, the degree of performance mismatch among stacks increases gradually. Fixed allocation patterns cause some stacks to operate under non-optimal conditions for a long term, which accelerates overall system aging. Therefore, an intelligent power allocation method that achieves both global optimality and dynamic adaptability is urgently required. This method is expected to improve system efficiency while extending the overall service life.
Specifically, three fuel cell stacks are considered in this work. At the long-time scale, the Arithmetic Optimization Algorithm is adopted to generate the optimal efficiency solution set under each load point. The shortest path principle in graph theory is used to search for the globally smoothest power allocation path. Assume that the total system load ranges within [ P l o a d m i n , P l o a d m a x ] . This range is discretized into K equally spaced points as follows:
τ = s k P l k | k = 1 , , K P l k = { P l m k | m = 1 , , M } P l m k = { P m n e t 1 k , P m n e t 2 k , P m n e t 3 k }
Specifically, the objective function is formulated to maximize the overall system efficiency η m s y s k :
max J P l m k = η m s y s k
An efficiency maximization model is established for each discrete load point. On the premise of satisfying the load demand s k , the net output power P m n e t i k of each fuel cell stack should be maintained within the high-efficiency power range as much as possible.
i = 1 3 P m n e t i k = s k P m i n P m n e t k P m a x
Here, P m i n and P m a x represent the lower and upper limits of the low-power (0 W) and high-power (3500 W) operating ranges of the fuel cell stack, respectively. This constrained interval lies within the overall system simulation power range of [0, 4130 W], ensuring that all optimized operating points are within a safe and feasible range. Operation within this power range ensures that the fuel cell stack works at a relatively high efficiency and slows down the aging process.
As described in Algorithm 1, the Arithmetic Optimization Algorithm (AOA) is a novel metaheuristic optimization method presented by Mirjalili in 2021 [37]. Its core concept is to simulate arithmetic operators (addition, subtraction, multiplication, and division) for position updates in the search space. AOA is equipped with two core control functions to regulate global search (multiplication and division) and local exploitation (addition and subtraction).
Algorithm 1 Pseudo-code of the AOA algorithm
1: Initialize parameters
2: for each agent s K do
3:         Satisfy the constraints given in Equation (18)
4:         Evaluate the objective function in Equation (17).
5: for t n o w = 1 to t m a x do
6:         Calculate the MOA value according to Equation (19).
7:         Calculate the MOP value according to Equation (20).
8:         for each agent j do
9:                 for i = 1 to n do
10:                        r 1 , r 2 , r 3 [ 0,1 ]
11:                        if r 1 > M O A then
12:                              if r 2 > 0.5 then
13:                                  Apply the division-based exploration strategy in Equation (21).
14:                              else
15:                                  Apply the multiplication-based exploration strategy in Equation (22).
16:                        else
17:                              if r 3 > 0.5 then
18:                                  Apply the subtraction-based exploitation strategy in Equation (23).
19:                              else
20:                                  Apply the addition-based exploitation strategy in Equation (24).
21:                  end for
22:                  Satisfy the constraints given in Equation (18)
23:                  Evaluate the objective function in Equation (17).
24:                  if J P l t n o w k J P l b e s t k ,
25:                         η s y s k = J P l t n o w k
26:                         P l b e s t k = P l t n o w k
27:                         P l m k = P l t n o w k
28:                         m++
29:         end for
30: end for
31: for j = 1   to j = m do
32:      if J P l m k = = η s y s k
33:      P l k = { P l k , P l m k }
34: end for
35: return P l k
Search behavior control function is defined as:
M O A ( t ) = M i n + t n o w t m a x ( M a x M i n )
where M i n denotes the minimum ratio with a recommended value of 0.2, M a x denotes the maximum ratio with a recommended value of 1, t n o w is the current iteration number, and t m a x is the maximum number of iterations. Intensity control function is expressed as:
M O P ( t ) = 1 t n o w 1 / β t m a x 1 / β
where β controls the decay rate with a recommended value of 5. Specifically, the division-based search strategy is described as follows:
P l t n o w k = P l b e s t k ( P m a x P m i n γ + P m i n ) M O P + ε
This operator is applied for wide-area exploration in the search space, where ε is a small constant to avoid division by zero, and γ is a normalized perturbation factor used to adjust perturbation intensity. Multiplication-based search strategy:
P l t n o w k = P l b e s t k M O P ( P m a x P m i n γ + P m i n )
The multiplication strategy retains the current global optimal direction and introduces an expansion factor based on variable bounds to achieve multiplicative perturbation search in the solution space. Subtraction-based exploitation strategy:
P l t n o w k = P l b e s t k M O P ( P m a x P m i n γ + P m i n )
This strategy is used for fine search near the current optimal solution and is suitable for local exploitation in the convergence stage. Addition-based exploitation strategy:
P l t n o w k = P l b e s t k + M O P ( P m a x P m i n γ + P m i n )
This strategy is symmetric to the subtraction strategy and is adopted to search for potentially better regions around the optimal solution, forming a bidirectional local perturbation mechanism.
After achieving the optimal efficiency objective, the aging rate of fuel cells is further reduced. Considering that fuel cell aging is mainly related to operating range, transient rate, and start-stop cycles, the power range of each stack has already been restricted in the previous AOA implementation. Therefore, the reduction of the aging rate is mainly achieved by decreasing the transient rate of the fuel cell operating curve, which can be transformed into a problem of smoothing the operating curve, namely, the shortest path problem.
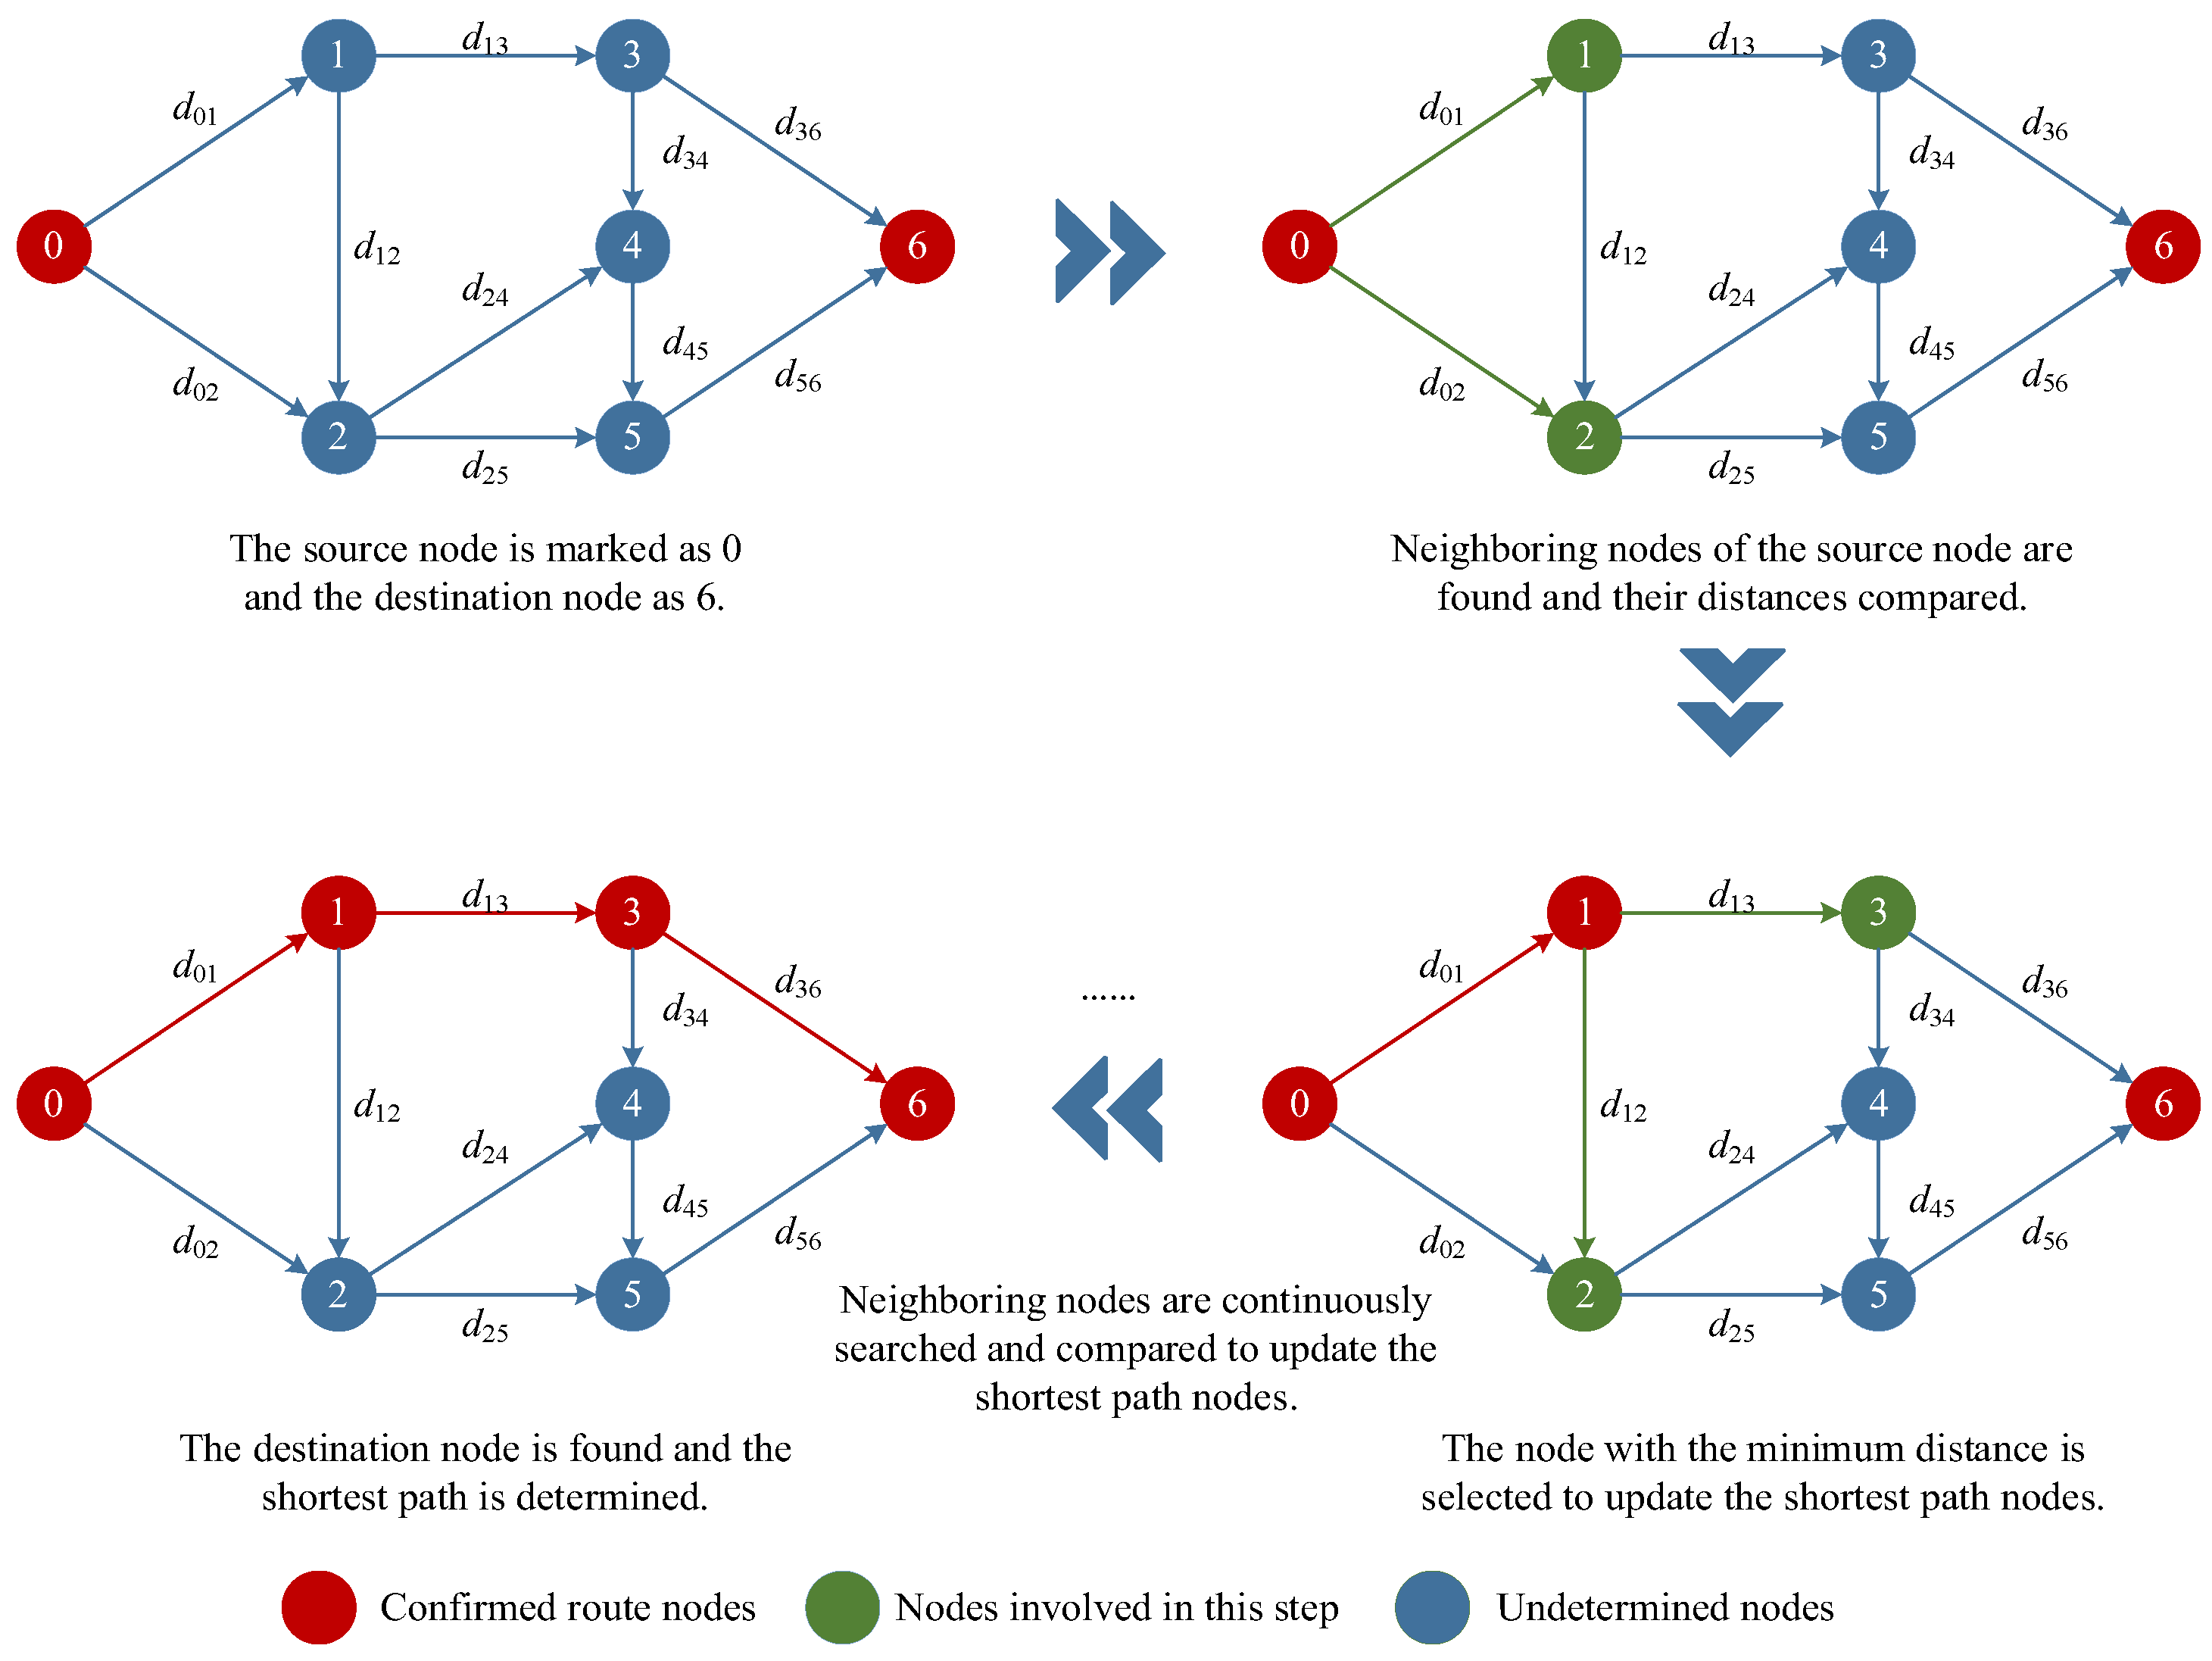
As shown in Figure 6, Dijkstra’s algorithm is a classic method for solving shortest-path optimization problems. Its core goal is to compute the shortest path from a single source node to a destination node in a weighted directed or undirected graph. The algorithm is derived from the fundamental assumption that all edge weights are non-negative and achieves efficient solutions by integrating a greedy strategy and dynamic programming.
During execution, a distance array is maintained to record the current estimated shortest distance from the source node to each node. Initially, only the distance from the source to itself is set to zero, while all others are set to infinity. In each iteration, the node with the minimum estimated distance is selected from the set of nodes with undetermined shortest paths, and its distance value is fixed as the permanent shortest distance. This greedy selection guarantees optimality based on the non-negativity of edge weights. Subsequently, the algorithm checks whether the path to neighboring nodes through the current node is shorter than the existing estimate. If so, the distance values of the neighbors are updated. The above process is repeated until all reachable nodes are processed. Finally, the shortest path length and corresponding route from the source to the destination node are obtained.
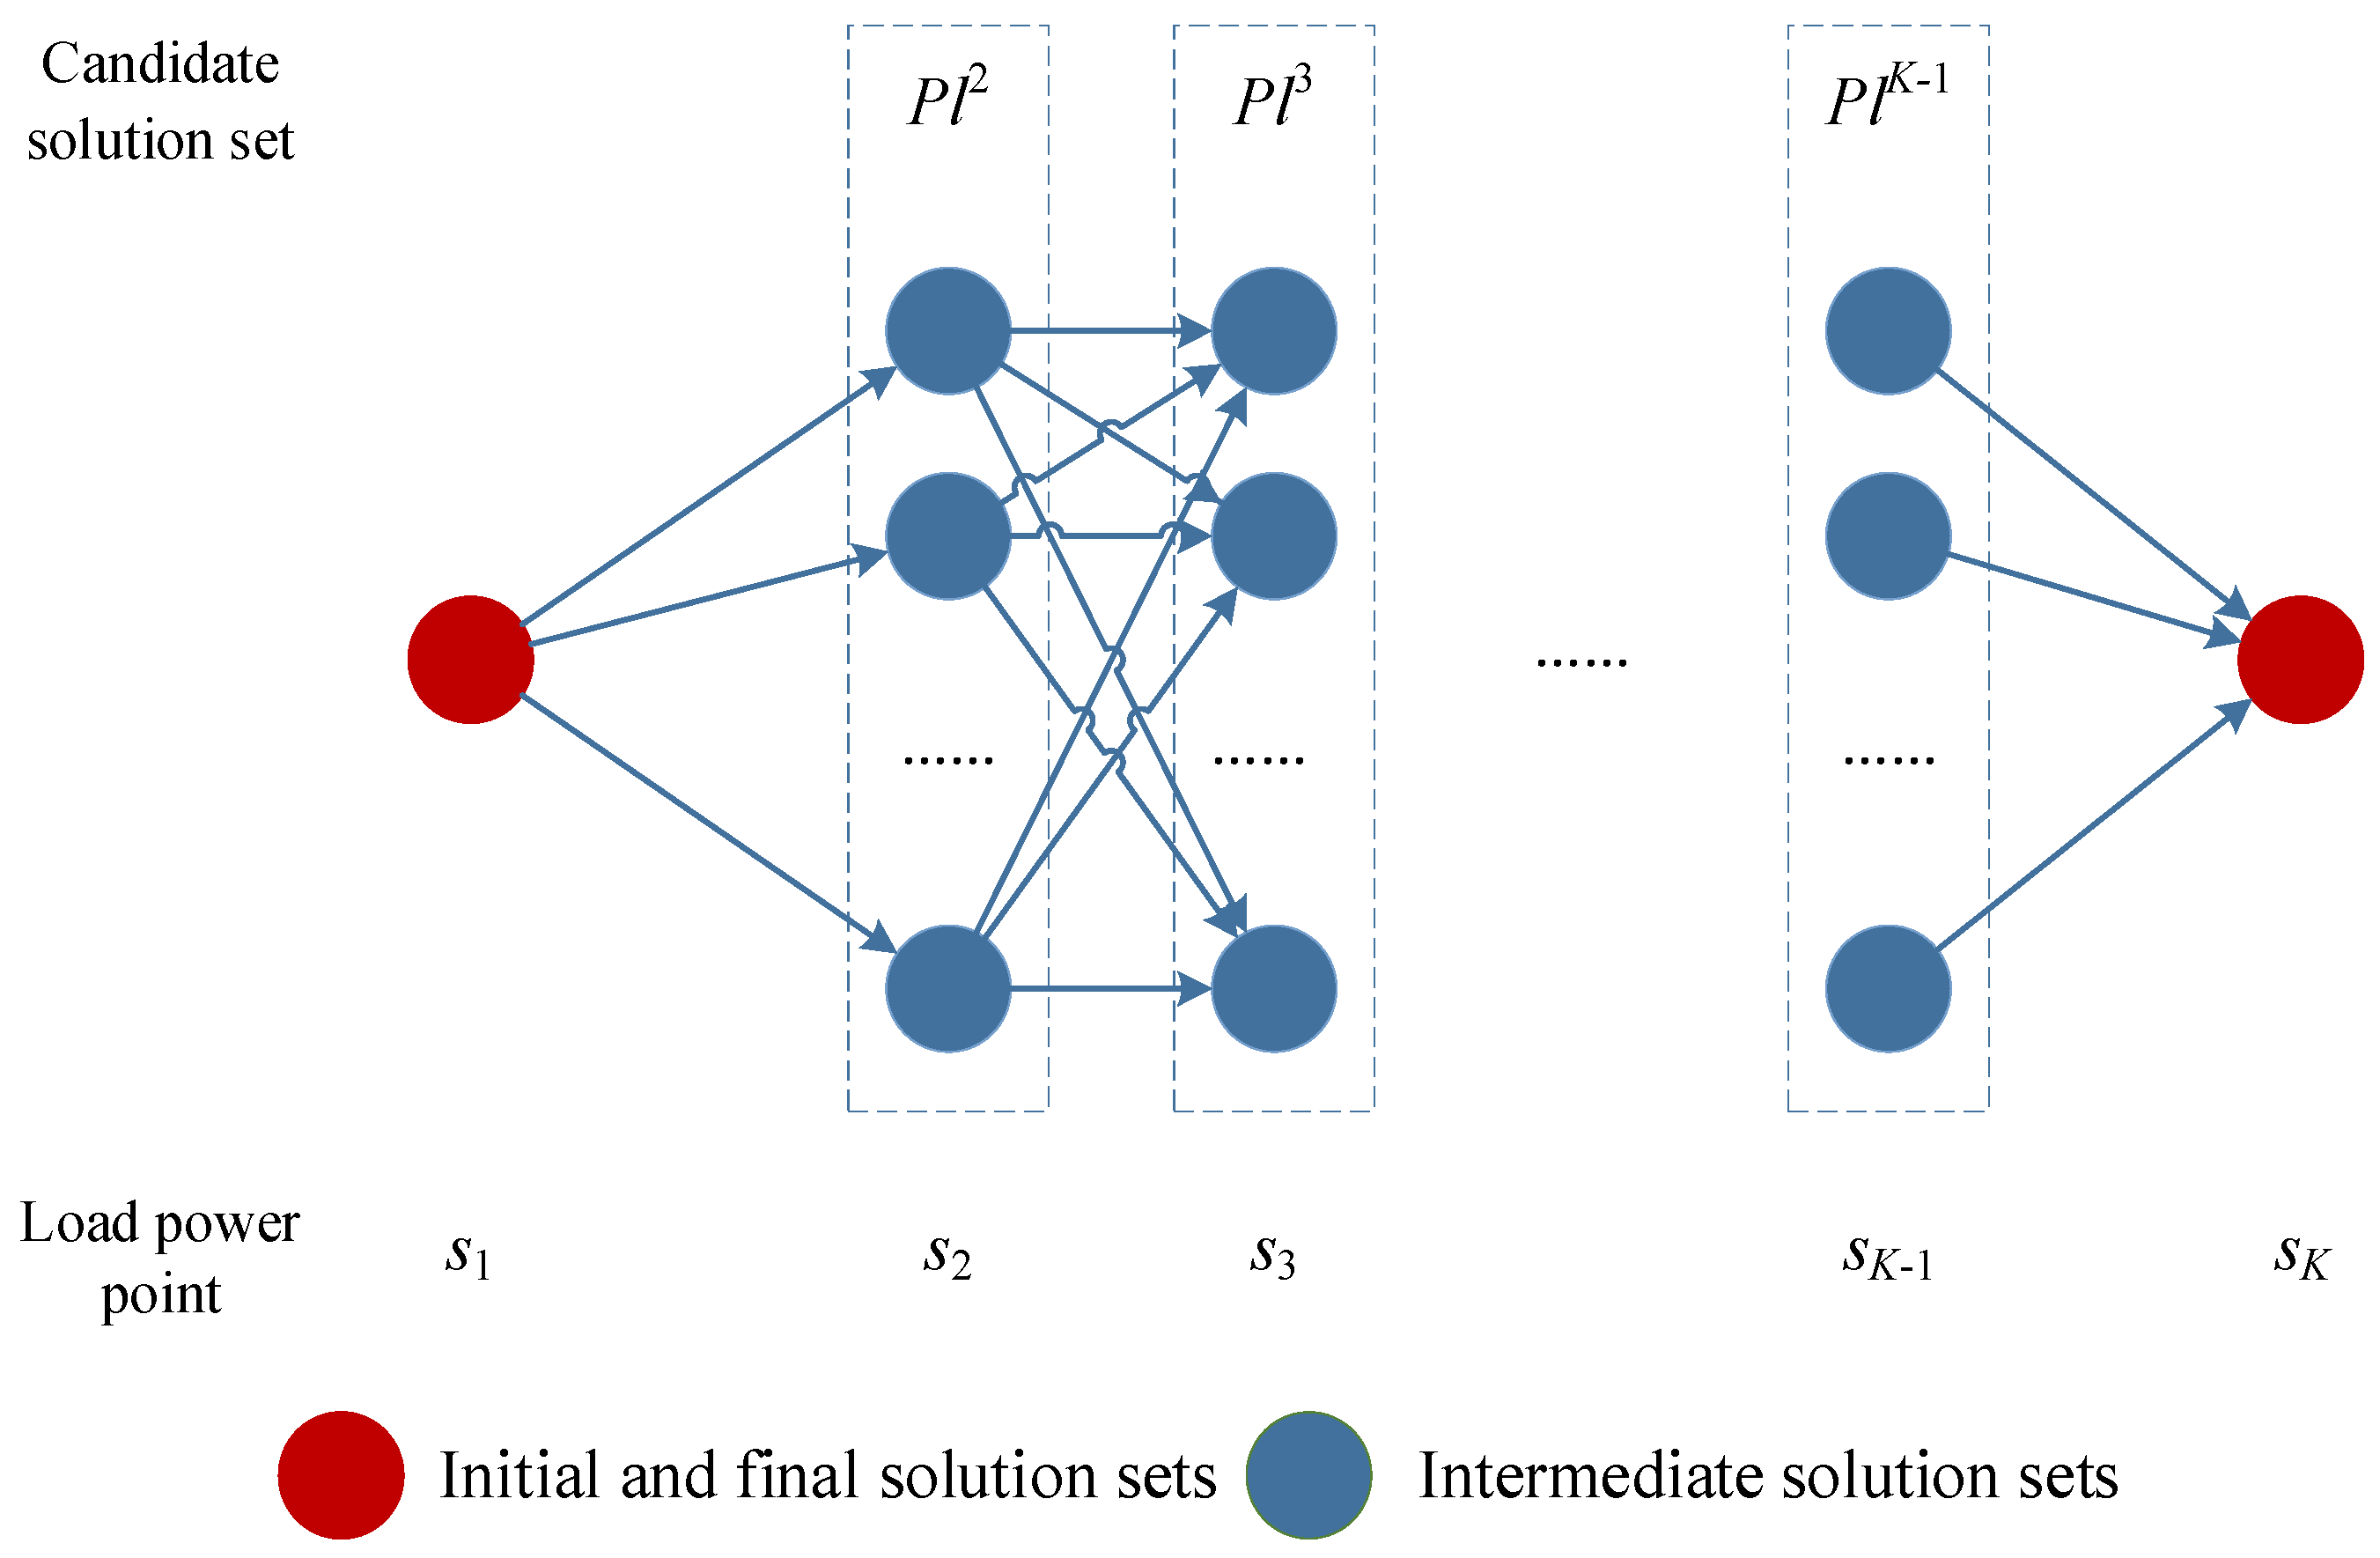
For the problem studied in this paper, as illustrated in Figure 7, a candidate solution set τ of optimal power allocation schemes under each load level s k is obtained based on the aforementioned AOA results. According to AOA optimization, equal power allocation yields the highest efficiency when the load power is in the high-power range. Therefore, the candidate solution sets for s 1 and s K both contain only one solution.
The maximum absolute power variation between two power allocation schemes P l e k , P l f k + 1 at adjacent load points is defined as the distance d P l e k , P l f k + 1 :
Δ P = | P e n e t 1 k P f n e t 1 k + 1 | | P e n e t 2 k P f n e t 2 k + 1 | | P e n e t 3 k P f n e t 3 k + 1 | d P l e k , P l f k + 1 = m a x ( Δ P )
This variation directly reflects the fluctuation amplitude of single-stack power switching and indirectly reflects the overall fluctuation of three-stack power switching. This definition is adopted to avoid situations where the total variation is small, but the power variation of an individual stack is large.
In the initial stage of the algorithm, two core arrays are constructed: the total node cost array D and the predecessor node array P r e . The total node cost array D ( q ) is used to record the total cost from the source node to node q . Initially, the value of the source node is set to 0, since no pre-switching stage exists, and the power variation is zero. The values of D for all other stage nodes are set to infinity. The predecessor node array P r e is used to record the preceding node of node q in the optimal path. Initially, all elements in P r e are set to for subsequent path backtracking.
During the iterative update process, an unvisited node set U is constructed, which contains nodes of all load stages. In each iteration, the node u with the minimum total cost D is selected from U . Node u is then removed from U and marked as visited to avoid repeated calculations. Subsequently, all neighboring nodes v of node u are traversed. Node u corresponds to the power allocation scheme P l e k , and node v corresponds to the power allocation scheme P l f k + 1 . The temporary total cost T e m p is calculated as follows:
T e m p = D ( u ) + d P l e k , P l f k + 1
This temporary cost represents the cumulative total cost from the source node to node v via node u . If T e m p < D ( v ) , the path to node v through node u is regarded as superior. In this case, D ( v ) is updated to T e m p , and P r e ( v ) is updated to u simultaneously to record the better predecessor node. The above iteration is repeated until the unvisited node set U becomes empty, and the total costs of all nodes are fully updated.
Since the destination node is unique (only one solution exists in the candidate set for s K ), backward traversal is directly performed from the destination node using the predecessor array P r e . Optimal nodes are determined sequentially, and the complete optimal path from the source node to the destination node is finally obtained. Each node on this path corresponds to the efficiency-optimal solution at the respective load stage, which ensures the optimal overall system efficiency throughout the operating range. Meanwhile, the minimum total cost of the path indicates that the smoothness of power switching between adjacent stages is globally optimized. Through the design of the cost function, large fluctuations in the power of individual stacks are effectively suppressed.
AOA generates the constrained Pareto-optimal solution set, which provides valid nodes for Dijkstra’s algorithm. Dijkstra then searches this solution set for the optimal path using the minimum power transient index, thereby unifying steady-state optimality and dynamic smoothness.

3.3. Short-Time-Scale Multi-Stack Power Allocation Method Considering Degradation Factors

To further enhance the system response to dynamic environmental disturbances and model uncertainties, a local optimization mechanism operating at a short time scale is designed based on the global optimization strategy. An improved constrained optimization algorithm is adopted at the short time scale to achieve real-time efficiency optimization within a limited variation range.
Specifically, the AOA is further employed for real-time power allocation. In contrast to the long-time-scale procedure, the aging rate of fuel cells is relatively slow over a short period. The reference values obtained from the aforementioned global optimization provide high-quality initial points for subsequent extremum seeking and narrow the search range. Therefore, several modifications are made to the AOA to meet the requirements of real-time optimization.
First, the initial population is randomly generated within the neighborhood centered on the solution set from the reference power table to accelerate the convergence process. Meanwhile, the constraints are revised to reduce the variation range. An external penalty function is adopted to handle the amplitude constraints, and an augmented objective function is constructed as follows:
F P n e t i = η m s y s λ max 0 , P n e t i P n e t i r e f 2 Δ m a x 2
where λ denotes the penalty coefficient. After each iteration, a projection operation is performed on the generated candidate solutions to ensure that power balance and boundary constraints are satisfied. In addition, an early-stopping mechanism is introduced. The algorithm is terminated in advance if no improvement is observed in the optimal solution for several consecutive generations. If the computation time exceeds a predefined threshold, a backup strategy is activated. The reference allocation and the previous allocation are compared, and the optimal scheme is selected. Thus, strict variation constraints are imposed in the short-time-scale optimization. The AOA is utilized to achieve optimal efficiency within a limited adjustment space, which ensures stable system operation and improves computational efficiency.
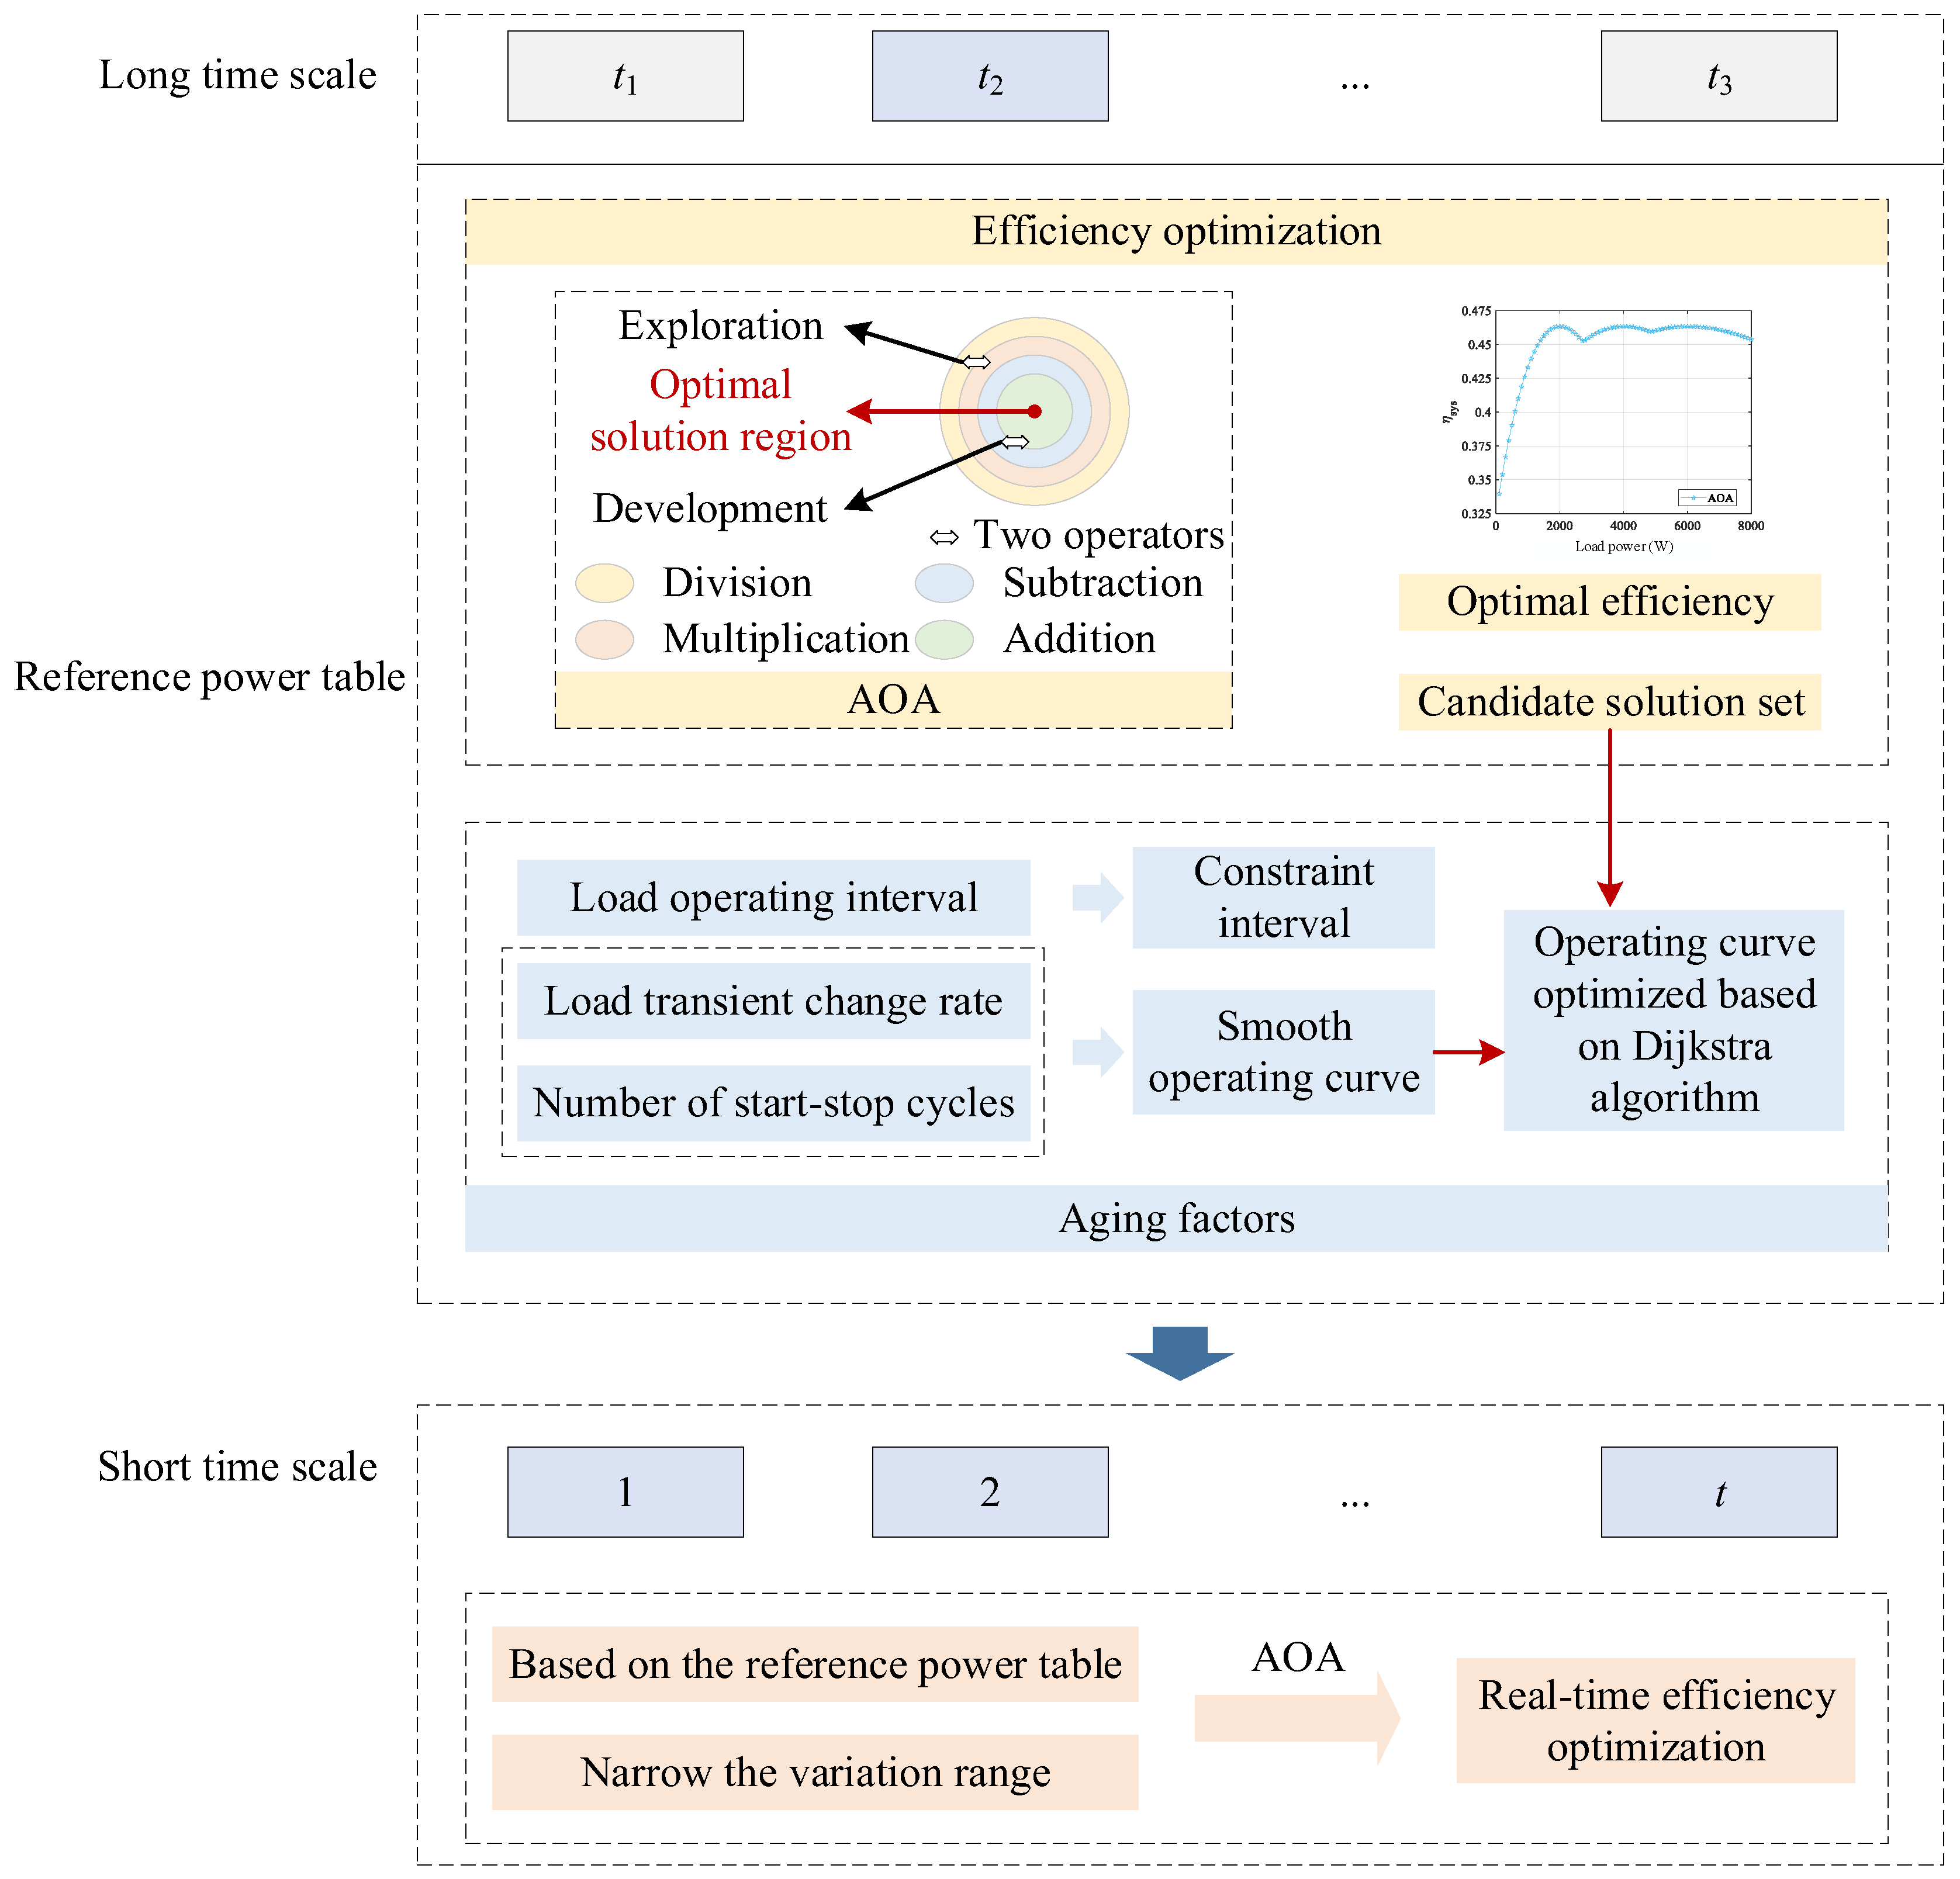
As illustrated in Figure 8, an innovative dual-time-scale optimization framework is presented. The complex multi-objective optimization problem is decoupled and reconstructed in the time domain. For the two optimization objectives of efficiency improvement and aging mitigation, traditional multi-objective optimization methods suffer from three major drawbacks. First, the weighting method requires predefined objective weights, which are usually determined empirically without theoretical support. Fixed weights are difficult to adapt to dynamic system changes. Second, although the Pareto front method provides a set of non-dominated solutions, an extra decision-making mechanism is required to select the final implementation in real-time control, which increases control complexity. Third, most existing methods handle multiple objectives at the same time scale, resulting in high-dimensional optimization problems and heavy computational burdens, which can hardly meet the requirements of real-time control.
The proposed dual-time-scale decoupling structure offers the following theoretical advantages. First, objective decoupling mitigates the curse of dimensionality. The long-time-scale stage solves for the Pareto-optimal efficiency solution set offline, while the short-time-scale stage performs fast optimization within a constrained neighborhood. Second, stability is guaranteed. The short-time-scale optimization conducts a neighborhood search centered at the global optimization result, and the power variation is strictly bounded by Δ m a x   . The closed-loop system thus satisfies Lipschitz stability, avoiding abrupt power jumps. Third, convergence is assured. The global search of AOA in the long-time-scale stage guarantees Pareto optimality. In the short-time-scale stage, the early-stopping mechanism and projection operator ensure convergence to a feasible optimum within a finite number of steps, achieving a faster convergence rate than conventional hierarchical methods.
In comparison, the presented dual-time-scale optimization framework offers the following theoretical advantages: First, objective decoupling and hierarchical optimization. The two objectives of efficiency improvement and aging mitigation are separated in the time dimension. At the long-time scale, efficiency is treated as the priority objective, and global optimality is guaranteed through offline computation. At the short time scale, fine-tuning of efficiency is conducted within a limited variation range to indirectly achieve aging reduction. Such hierarchical processing avoids arbitrary weight assignment among objectives while maintaining the solvability of the optimization problem.
Second, an indirect aging optimization mechanism. Aging mitigation is realized indirectly by optimizing the smoothness of power allocation. Compared with direct optimization of aging indicators, this approach does not require an accurate aging model, reduces dependence on model precision, and improves the robustness of the method.
Third, balanced computational efficiency and real-time performance. Long-time-scale optimization is implemented via offline calculation, which is not restricted by real-time requirements and allows full exploration of the solution space. Short-time-scale optimization performs rapid searching within a constrained search space to satisfy real-time control demands. This collaborative computational architecture ensures optimization quality while meeting the real-time requirements of engineering applications.

4. Experiments and Results Analysis

To verify the effectiveness of the presented method, simulations are carried out in MATLAB/Simulink R2021b.

4.1. Performance Comparison of Different Optimization Algorithms

Through a comprehensive comparative study of power allocation strategies for multi-stack fuel cell systems, the comprehensive performance of two conventional allocation methods (equal allocation and daisy-chain allocation) and four intelligent optimization algorithms (Grey Wolf Optimizer (GWO), Multi-Verse Optimizer (MVO), Genetic Algorithm (GA), and Arithmetic Optimization Algorithm) is systematically evaluated. This investigation aims to select the most suitable underlying optimizer for the subsequent optimization framework from the two dimensions of system efficiency characteristics and algorithmic computational efficiency.
The traditional power allocation methods mainly include average allocation and daisy-chain allocation. In the average allocation scheme, the total power demand is equally divided among each fuel cell unit. Each unit operates in parallel through independent converters and outputs the same power share. After the load demand is monitored, equal power commands are sent to each unit. This method is simple to implement, and generally, the system efficiency is low at low power and high at high power. The daisy-chain allocation adopts a sequential activation and reverse deactivation mechanism: the stacks are activated in numerical order with increasing load, and the last activated stack is deactivated first with decreasing load. To avoid frequent switching, a hysteresis rule with a proper load switching dead zone is introduced. The switching is determined by load thresholds and hysteresis conditions. The daisy-chain allocation can maintain high system efficiency at low power, but relatively low efficiency at high power. Meanwhile, this method may also aggravate the performance inconsistency of the fuel cell system.
Genetic Algorithm (GA) [38] is a classic global stochastic optimization method inspired by biological natural selection and genetic evolution. Population individuals are iteratively optimized through selection, crossover, and mutation operations to obtain optimal solutions. Grey Wolf Optimizer (GWO) [39] is an efficient metaheuristic algorithm established based on the hierarchical hunting mechanism of grey wolf groups. Global exploration and local exploitation are realized via the position update of wolf individuals at different levels. Featuring few control parameters, fast convergence, and high optimization accuracy, GWO is suitable for solving complex nonlinear optimization problems. Multi-Verse Optimizer (MVO) [40] is a novel optimization algorithm derived from the multi-verse theory. A reasonable balance between global exploration and local exploitation is achieved through the interaction of white holes, black holes, and worm holes. This algorithm can effectively avoid local optimum stagnation.
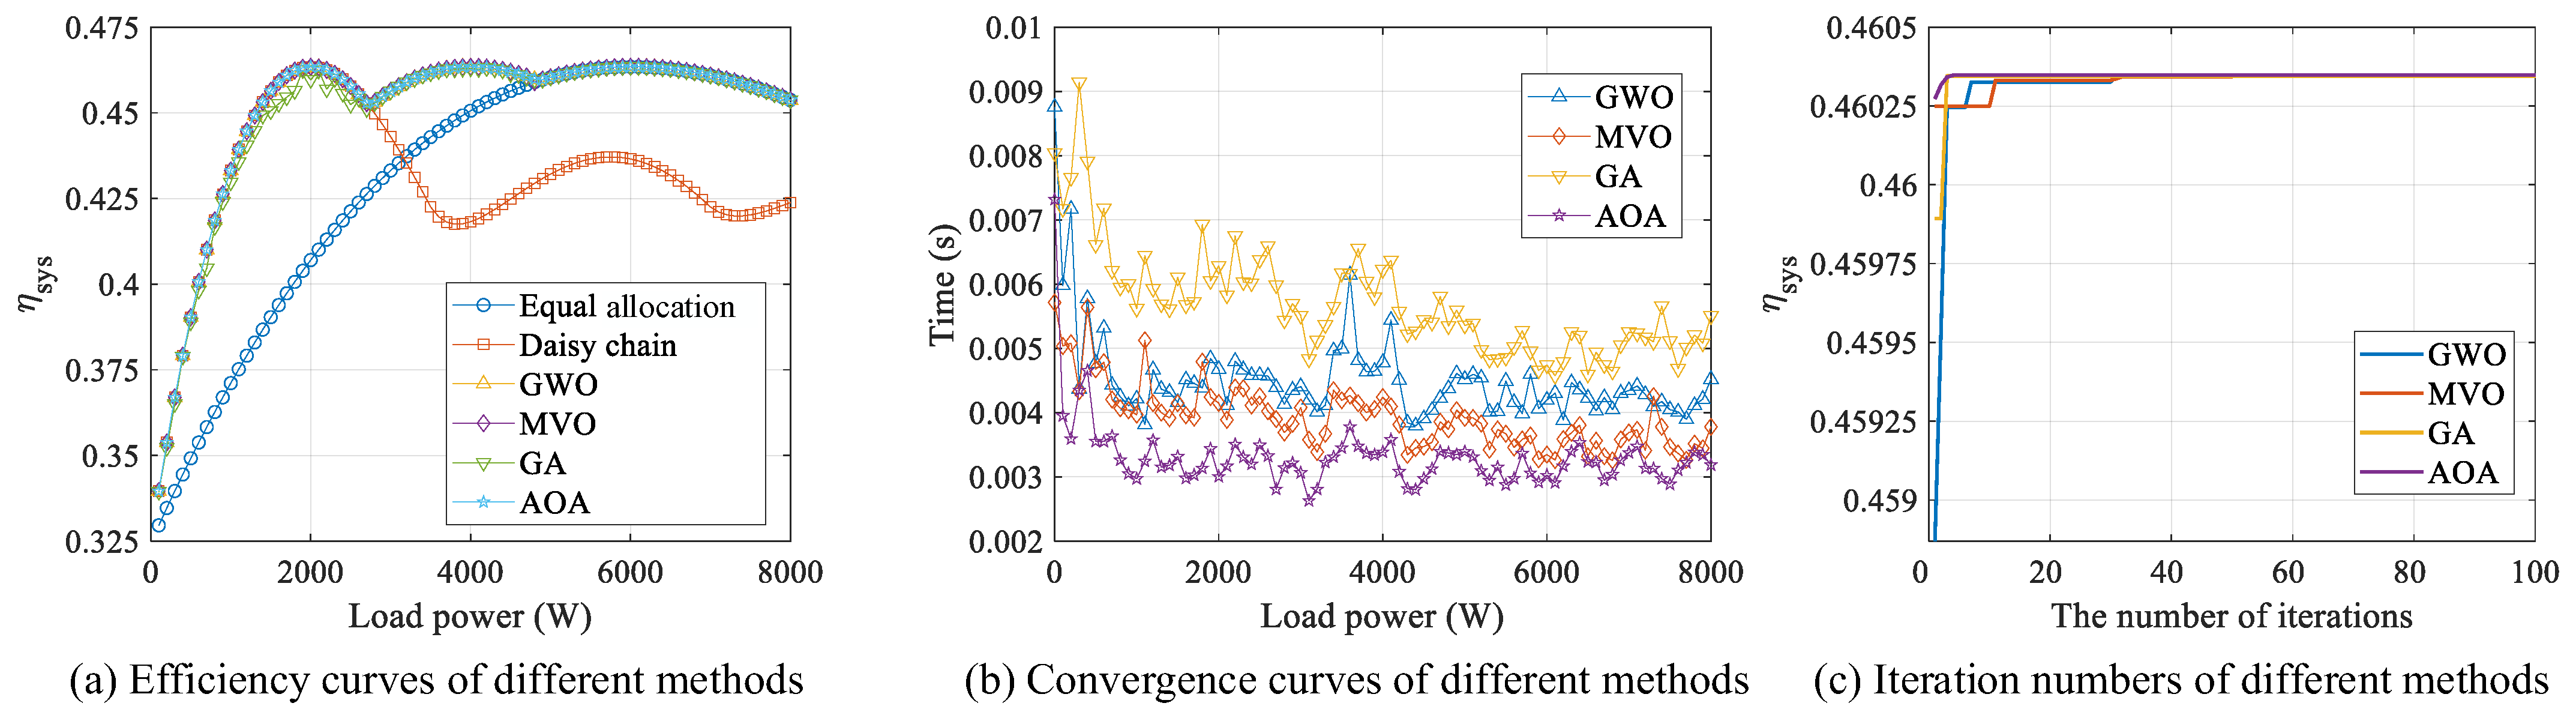
As shown in Figure 9a, regular differences are observed between conventional methods and optimization algorithms in terms of system efficiency characteristics. The average allocation strategy yields the lowest efficiency in the low-load range, since all stacks are forced to operate in low-efficiency regions far from their rated points. In contrast, the daisy-chain strategy activates only a single stack under low load, allowing operation within a high-efficiency range and thus resulting in optimal efficiency performance. However, as load increases, subsequently connected stacks may operate under non-ideal conditions, and the efficiency advantage is gradually weakened.
It is found in this study that intelligent optimization algorithms, including GWO, MVO, GA, and AOA, can effectively integrate the advantages of the two conventional methods. In the low-load range, these algorithms tend to mimic the daisy-chain strategy by concentrating load on a small number of stacks to improve operating efficiency. In the high-load range, near-average yet non-uniform optimized allocation is achieved through global search to maintain high overall system efficiency. Notably, all optimization algorithms exhibit significant efficiency improvements over conventional methods in the medium-load range, which is critical to the overall energy efficiency performance of the system. Further comparison among optimization algorithms reveals that AOA, GWO, and MVO maintain excellent efficiency optimization across the entire load range, whereas GA shows inferior searching performance in the low-power range, with slightly lower solution quality and stability than the other three algorithms.
Regarding the algorithm computational performance, the convergence speed and time consumption of GWO, MVO, GA, and AOA are compared as depicted in Figure 9b,c. To eliminate the randomness caused by algorithm initialization, all four algorithms adopt unified parameter settings and convergence accuracy as the termination criterion, and 30 independent repeated experiments are conducted for each method. The iteration number and computational time presented in the figures are the statistical average values of multiple runs.
Statistical results show that AOA achieves an average iteration number of about 12 with a standard deviation of 1.2. By contrast, GWO and MVO require 18 and 20 average iterations with standard deviations of 2.1 and 2.3, respectively, while GA needs up to 35 average iterations with a standard deviation of 3.8. In terms of computational time, AOA also presents the smallest standard deviation, demonstrating both fast convergence and high stability.
Comprehensive comparison indicates that AOA requires the fewest iterations and the shortest single optimization runtime, achieving the optimal convergence speed and computational efficiency. GWO and MVO have moderate computational performance, whereas GA consumes much longer execution time due to the inherent complexity of selection, crossover, and mutation operations. The statistical variance of repeated experiments further verifies that AOA can steadily maintain high system efficiency and low computational cost under full load conditions, showing remarkable superiority over other comparative algorithms.
Based on comprehensive evaluation results of system efficiency characteristics and algorithmic computational performance, the Arithmetic Optimization Algorithm (AOA) provides high-efficiency optimization over the full load range while achieving the fastest convergence and lowest computational cost. Therefore, AOA is selected as the core algorithm for long-time-scale global optimization in the presented dual-time-scale framework. This selection aims to establish a high-performance foundation that balances optimization quality and solution efficiency for the system.

4.2. Efficiency Comparison of Different Power Allocation Methods

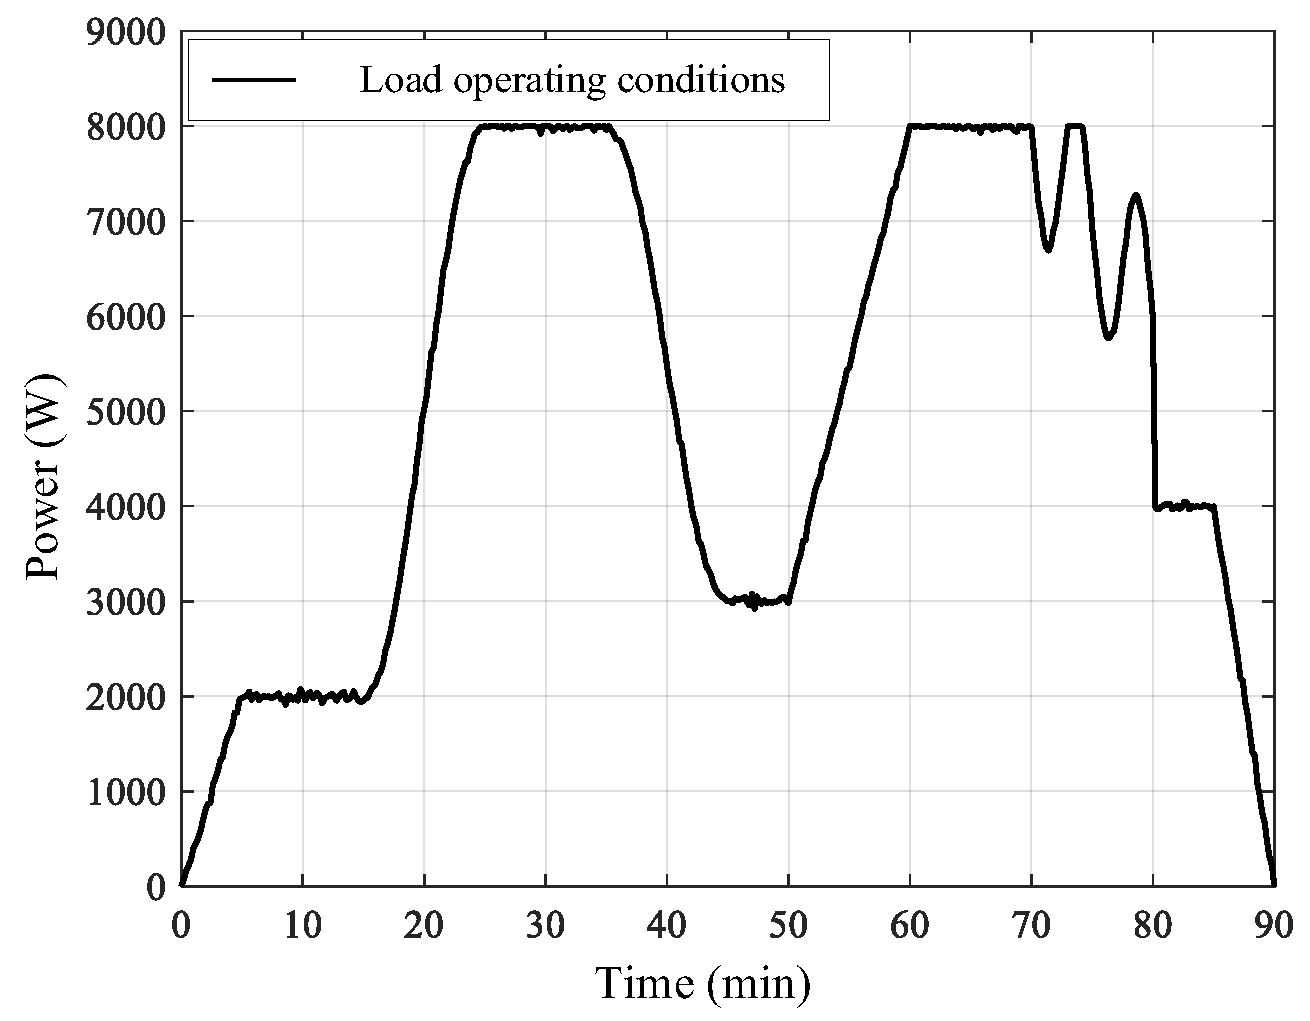
To verify the effectiveness of the efficiency optimization method presented in this paper, simulation experiments are carried out in the MATLAB/Simulink environment based on the fuel cell model established earlier. Three fuel cell stacks with the same initial state are set up in the experiment, and the average allocation method, the daisy-chain allocation method, and the power allocation method presented in this paper are compared and analyzed. The experimental load condition is shown in Figure 10, with the power fluctuating between 0 W and 8000 W and a cycle of approximately 90 min.
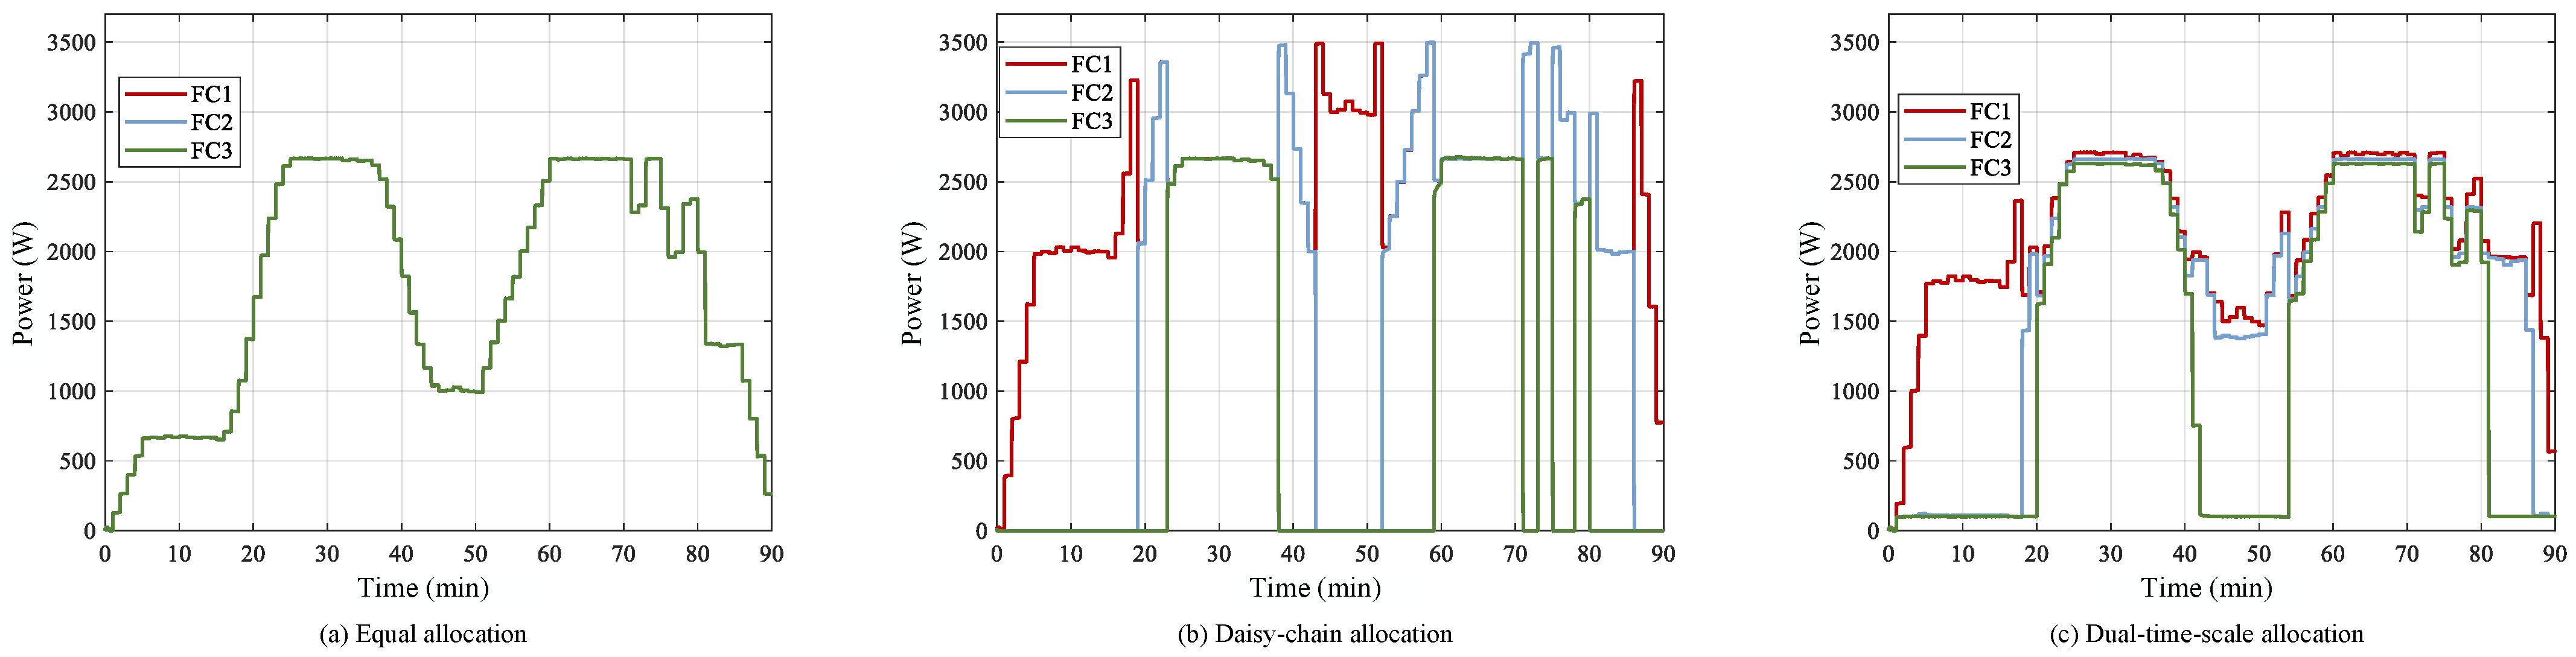
Figure 11 shows the output power curves of each stack under different allocation methods. In the average allocation strategy, the output power of each stack is the same, so the three curves completely overlap. For the daisy-chain allocation method, stacks are started in the order of their numbers: FC1 is put into operation first and bears the main load most of the time, while FC2 and FC3 are started sequentially in the later stage. This leads to a significantly longer operating time for FC1 and excessive idle time for FC3, resulting in unbalanced load distribution. In contrast, the method presented in this paper dynamically allocates power among the three stacks based on the principle of maximum efficiency. It combines the load balance of average allocation with the structural simplicity of daisy-chain allocation, making the power curve of each stack more stable and smoother, which is consistent with the theoretical analysis.
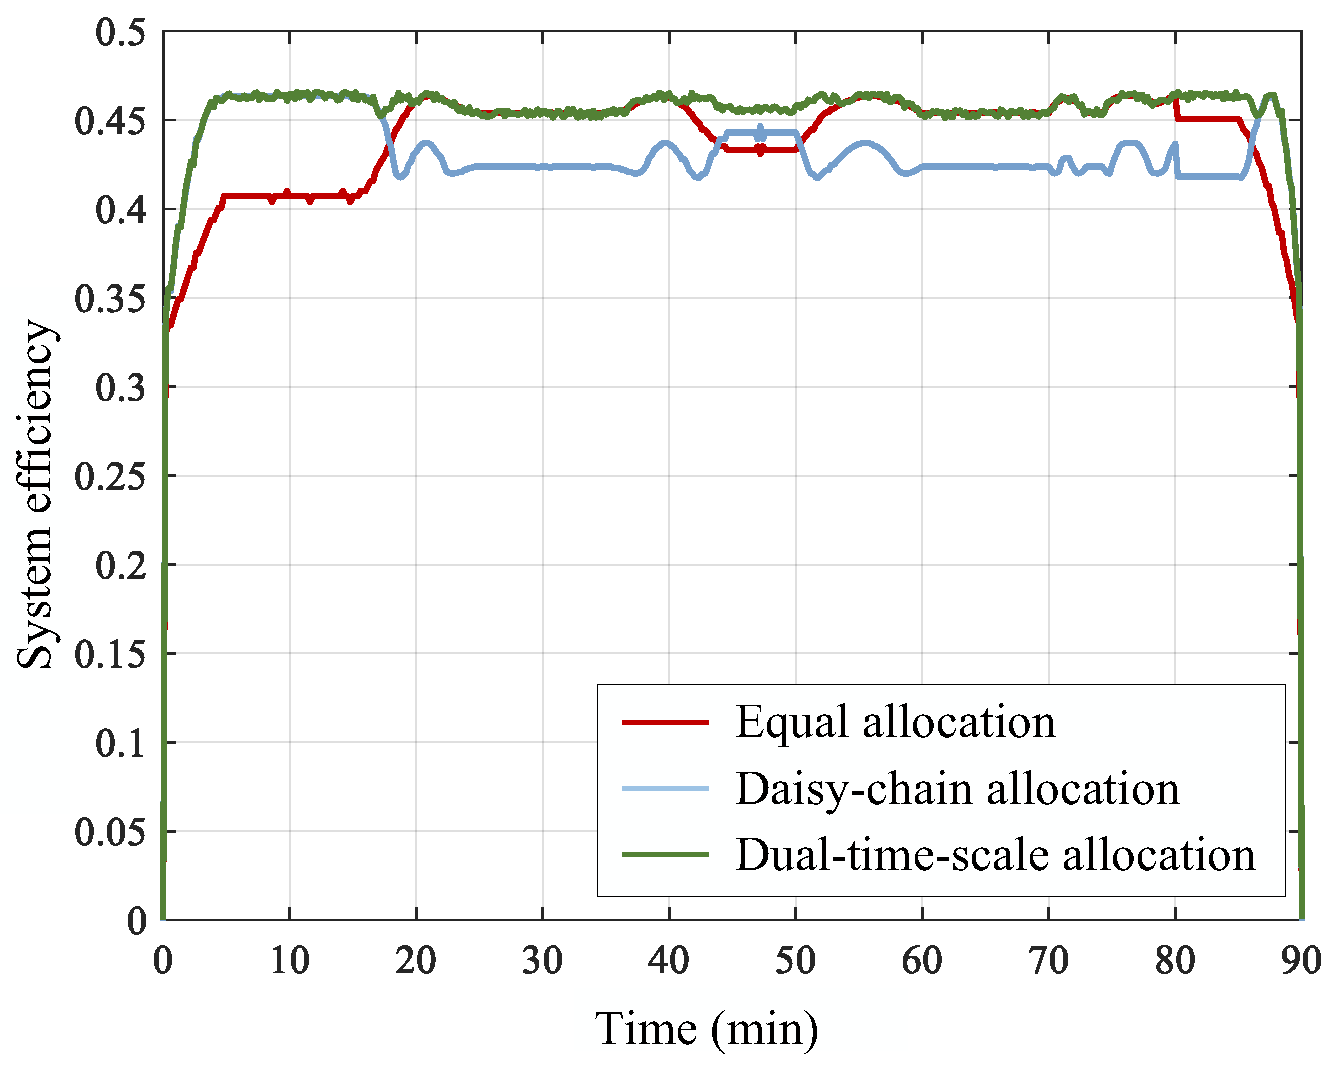
Figure 12 shows the overall efficiency changes of the multi-stack fuel cell system under three strategies: average allocation, daisy-chain allocation, and dual-time-scale allocation. In general, the dual-time-scale allocation method achieves the highest system efficiency, with an average efficiency of 45.28%, which is better than the daisy-chain allocation and average allocation methods. This result is consistent with expectations because the strategy achieves dual optimization of steady-state and dynamic performance through two-layer optimization, ensuring that each stack operates in the high-efficiency interval, thus improving the overall energy efficiency of the system.

4.3. Aging Comparison of Different Power Allocation Methods

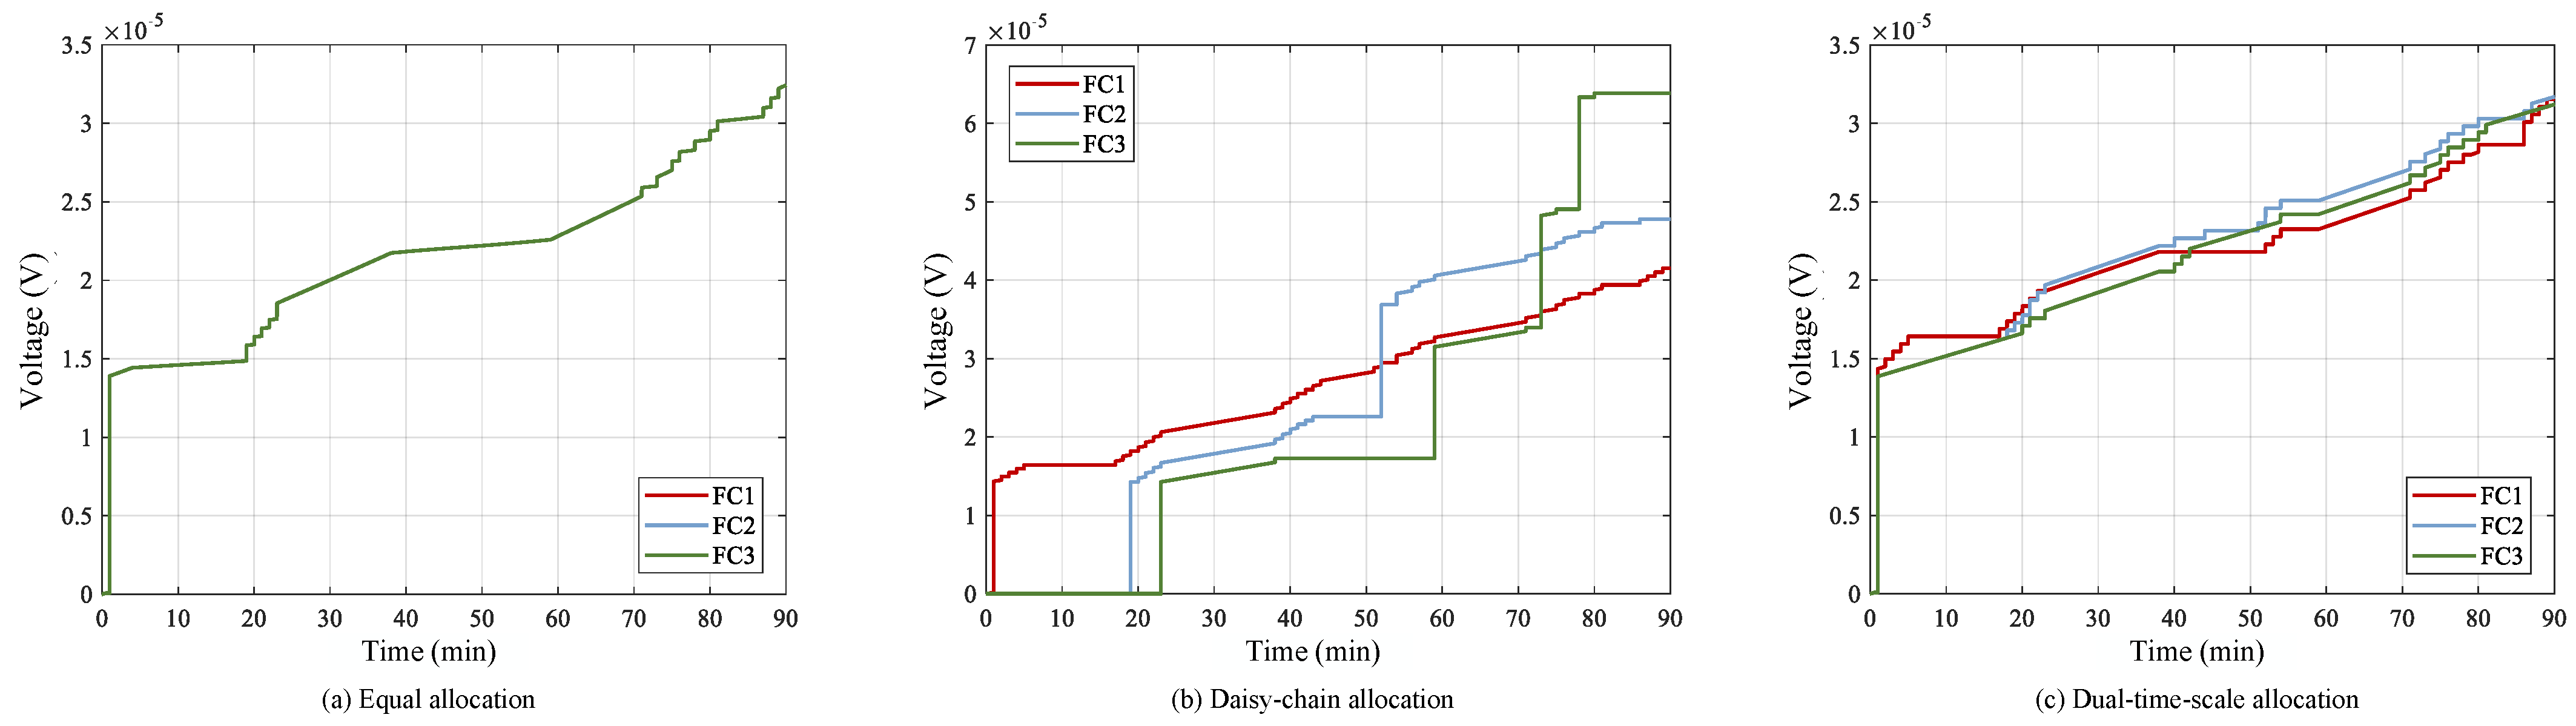
The influence of different power allocation methods on the aging behavior of fuel cell stacks is shown in Figure 13 and Table 5. The results indicate that the allocation method significantly affects the voltage decay trend and amplitude of each stack.
Under the equal allocation strategy, the load of each stack is balanced, and the degree of voltage degradation is basically consistent, with an average single-stack decay of 32.43 μV. The daisy-chain allocation strategy shows obvious unbalanced decay: FC1 has the most significant voltage decay, reaching 64.25 μV, due to long-term high-load operation. The decays of FC2 and FC3 are 48.32 μV and 42.37 μV, respectively, reflecting large differences in aging rates among stacks under this strategy.
In contrast, although the dual-time-scale allocation strategy has a similar decay trend to the daisy-chain allocation, it effectively reduces the decay amplitude of each stack through dynamic power allocation optimization, with values of 32.52 μV, 32.15 μV, and 32.79 μV, respectively. More importantly, this method makes the decay levels of each stack closer, which is similar to that of the average allocation method. It indicates that while improving the overall system efficiency, this method can also significantly alleviate the aging problem caused by load changes, which is conducive to extending the overall system life and maintenance cycle.
As shown in Table 6, the proposed dual-time-scale optimization strategy exhibits favorable computational efficiency and real-time feasibility, meeting the requirements for embedded system implementation. In the steady-state planning layer, the construction of the Pareto solution set and optimal path search are offline pre-computation processes, which are executed only once during system initialization or model parameter updates, with a typical execution time of 200–300 ms and no impact on real-time control cycles. In the dynamic execution layer, the pre-generated reference power table significantly narrows the online search range, and the single real-time optimization time of AOA is only 1.2–2.5 ms, which is much shorter than the conventional control period of 10–20 ms for fuel cell systems. Meanwhile, the FFRLS online identification has extremely low computational overhead, with a single iteration time of approximately 0.1 ms, which is negligible for system resource occupation. Overall, the proposed method has a low computational cost and strong real-time performance.
Simulation results show that under dynamic load conditions, the average system efficiency of the proposed dual-time-scale hierarchical optimization strategy is approximately 45.28%, representing an improvement of about 5.18 percentage points compared with the traditional equal allocation method (about 40.10%) and 1.98 percentage points compared with the daisy-chain allocation method (about 43.30%). The proposed strategy maintains higher and more stable operating efficiency across the entire operating range. Meanwhile, the average voltage degradation rates of the three methods are as follows: 32.43 μV for the equal allocation method, 51.65 μV for the daisy-chain allocation method, and 32.49 μV for the dual-time-scale optimization strategy. It can be observed that the voltage degradation of the proposed strategy is comparable to the optimal equal allocation method, and is reduced by approximately 37.10% compared with the daisy-chain allocation method. The proposed method effectively slows down stack aging, achieving collaborative optimization of efficiency improvement and aging balancing while maintaining high efficiency performance.
Furthermore, to assess the robustness of the proposed method against uncertainty in the empirical aging coefficients, we varied all four degradation coefficients ( O l o w , O h i g h , O t r , O s t ) simultaneously by ±30% and re-evaluated the system performance. Under the +30% scenario, the average voltage degradation of the proposed dual-time-scale method increased from 32.49 μV to 35.20 μV (+8.3%), while that of the daisy-chain method increased from 51.65 μV to 64.50 μV (+24.9%), and that of the equal allocation method increased from 32.43 μV to 34.20 μV (+5.5%). Under the –30% scenario, the degradation of the proposed method decreased to 30.20 μV (–7.0%), compared with 43.12 μV (–16.5%) for the daisy-chain method and 30.80 μV (–5.0%) for the equal allocation method. These results demonstrate that the proposed method is significantly less sensitive to variations in aging coefficients than the daisy-chain method. Compared with the equal allocation method, the proposed method exhibits a slightly larger variation in degradation, but the absolute differences remain small.

5. Conclusions

To address the power allocation optimization problem of multi-stack fuel cell systems, a hierarchical control strategy based on Pareto decoupling and rolling optimization is presented in this paper. This method decomposes the optimization problem into two layers: steady-state planning and dynamic execution.
At the steady-state layer, the system efficiency characteristics are identified online using the recursive least square method with a forgetting factor, and the arithmetic optimization algorithm is adopted to construct the Pareto optimal solution set. Combined with the Dijkstra algorithm, the optimal power gradual change path is searched to generate a steady-state reference power allocation table.
At the dynamic layer, rolling optimization is performed based on this reference table. Load fluctuations are suppressed in real time by strictly constraining the amplitude of power adjustment, achieving a dynamic balance between optimal efficiency and stable operation.
Simulation results show that compared with the traditional average allocation and daisy-chain allocation methods, the presented strategy achieves a significant improvement in overall system efficiency under the same operating conditions. The voltage decay of each stack is more balanced, which effectively alleviates the asynchronous aging problem. While ensuring stable dynamic response of the system, this hierarchical architecture provides a feasible optimal control path for the long-term, efficient, and coordinated operation of multi-stack systems.
The authors acknowledge that the current validation is limited to simulation only. The authors are committed to conducting hardware-in-the-loop (HIL) experiments for fuel cell control in future work, and a HIL testbed is currently under development.

Author Contributions

Conceptualization, X.Z. and C.W.; methodology, X.Z.; software, X.Z.; validation, X.Z., C.W. and B.L.; formal analysis, B.L.; investigation, X.H.; resources, X.H.; data curation, X.H.; writing—original draft preparation, X.H.; writing—review and editing, X.Z.; visualization, X.H.; supervision, X.H.; project administration, X.H.; funding acquisition, B.L. All authors have read and agreed to the published version of the manuscript.

Funding

This research was funded by the 2026 Annual Research and Innovation Project for Graduate Students at Central South University, grant numbers 2026ZZTS0928 and 2026ZZTS0845.

Data Availability Statement

The original contributions presented in the study are included in the article; further inquiries can be directed to the corresponding author.

Conflicts of Interest

The authors declare no conflicts of interest.

References

  1. Li, Z.; Mao, Q.; Wu, H.; Chong, J.Y.; Zhang, P. Uncertainty analysis for the design, operation, and management of proton exchange membrane fuel cells. J. Power Sources 2026, 666, 239142. [Google Scholar] [CrossRef] [Scilit]
  2. Alshaikh, R.; Al-Othman, A.; Tawalbeh, M.; Nancarrow, P.; Shamayleh, A. A review of optimization techniques for PEM fuel cells for enhanced performance and efficiency. Comput. Ind. Eng. 2026, 214, 111889. [Google Scholar] [CrossRef] [Scilit]
  3. Xu, H.; Qadir, A.; Zeng, X.; Ahmed, S.; Hassan, M. Toward next-generation PEM fuel cells: Recent progress in materials, design, and commercialization. J. Environ. Chem. Eng. 2026, 14, 122737. [Google Scholar] [CrossRef] [Scilit]
  4. Wang, S.; Liu, X.; Cai, S.; Tu, Z. Recent development in the design of proton exchange membrane fuel cell stack: Theory, integration and prospective. Fuel Process. Technol. 2026, 284, 108423. [Google Scholar] [CrossRef] [Scilit]
  5. Gotmare, A.; Patil, R.B.; Dhale, A.; Vasudevan, H.; Al-Dahidi, S.; Roy, A. A bibliometric review of hydrogen fuel cell research: Trends in safety, reliability, and performance analysis (2020–2024). Int. J. Sustain. Energy 2026, 45, 2637991. [Google Scholar] [CrossRef] [Scilit]
  6. Al Kurdi, B.; Alzaabi, M.; Almarzooqi, M.; Esmaeili, Y.; Al-Othman, A.; Ka’ki, A.; Sabri, M.; Tawalbeh, M. Application of fuel cells. Renew. Energy 2026, 3, 63–85. [Google Scholar]
  7. Ashraf, H.; Mae, M.; Matsuhashi, R. Advancements in green hydrogen production: A comprehensive review of system integration, power grid applications, and cost optimization. Int. J. Energy Res. 2025, 2025, 5321698. [Google Scholar] [CrossRef] [Scilit]
  8. Aboukhris, A.B.O.; Kolamroudi, M.K.; Kavalcıoğlu, C. Optimizing energy management strategies in grid-connected hybrid PV-battery-supercapacitor systems: A comprehensive review. Gazi Univ. J. Sci. 2025, 38, 1892–1920. [Google Scholar] [CrossRef] [Scilit]
  9. Büyük, M.; İnci, M. Improved drift-free P&O MPPT method to enhance energy harvesting capability for dynamic operating conditions of fuel cells. Energy 2023, 267, 126543. [Google Scholar]
  10. Kocalmış Bilhan, A.; Haydaroğlu, C.; Kılıç, H.; Özdemir, M.T. Machine Learning–Driven MPPT Control of PEM Fuel Cells with DC–DC Boost Converter Integration. Electronics 2026, 15, 701. [Google Scholar] [CrossRef] [Scilit]
  11. Zhu, K.Q.; Ding, Q.; Xu, J.H.; Yang, C.; Zhang, J.; Zhang, Y.; Huang, T.M.; Wan, Z.M.; Wang, X.D. Dynamic performance for a kW-grade air-cooled proton exchange membrane fuel cell stack. Int. J. Hydrogen Energy 2022, 47, 35398–35411. [Google Scholar] [CrossRef] [Scilit]
  12. Yue, H.; He, H.; Han, M.; Gong, S. Active disturbance rejection control strategy for PEMFC oxygen excess ratio based on adaptive internal state estimation using unscented Kalman filter. Fuel 2024, 356, 129619. [Google Scholar] [CrossRef] [Scilit]
  13. Gong, C.; Xing, L.; Liang, C.; Tu, Z. Modeling and dynamic characteristic simulation of air-cooled proton exchange membrane fuel cell stack for unmanned aerial vehicle. Renew. Energy 2022, 188, 1094–1104. [Google Scholar] [CrossRef] [Scilit]
  14. Li, Q.; Yang, W.; Yin, L.; Chen, W. Real-time implementation of maximum net power strategy based on sliding mode variable structure control for proton-exchange membrane fuel cell system. IEEE Trans. Transp. Electrif. 2020, 6, 288–297. [Google Scholar] [CrossRef] [Scilit]
  15. Hidayat, E.F.; Zain, S.M.; Noviyanti, A.R. Advances in proton exchange membrane fuel cell (PEMFC) materials: A review of developments from 2021 to 2025. J. Power Sources 2025, 657, 238124. [Google Scholar] [CrossRef] [Scilit]
  16. Nurdin, H.I.; Benmouna, A.; Zhu, B.; Chen, J.; Becherif, M.; Hissel, D.; Fletcher, J. Maximum efficiency points of a proton-exchange membrane fuel cell system: Theory and experiments. Appl. Energy 2024, 359, 122629. [Google Scholar] [CrossRef] [Scilit]
  17. Yin, L.; Li, Q.; Breaz, E.; Chen, W.; Gao, F. Model guided extremum seeking and active disturbance rejection control for efficiency real-time optimization of PEMFC system. IEEE Trans. Ind. Electron. 2023, 71, 5905–5919. [Google Scholar] [CrossRef] [Scilit]
  18. Li, Q.; Yin, L.; Yang, H.; Wang, T.; Qiu, Y.; Chen, W. Multiobjective optimization and data-driven constraint adaptive predictive control for efficient and stable operation of PEMFC system. IEEE Trans. Ind. Electron. 2020, 68, 12418–12429. [Google Scholar] [CrossRef] [Scilit]
  19. Othman, A.M.; El-Fergany, A.A. Optimal dynamic operation and modeling of parallel connected multi-stacks fuel cells with improved slime mould algorithm. Renew. Energy 2021, 175, 770–782. [Google Scholar] [CrossRef] [Scilit]
  20. Yakut, Y.B. A new control algorithm for increasing efficiency of PEM fuel cells–based boost converter using PI controller with PSO method. Int. J. Hydrogen Energy 2024, 75, 1–11. [Google Scholar] [CrossRef] [Scilit]
  21. Lu, X.; Du, B.; Zhou, S.; Zhu, W.; Li, Y.; Yang, Y.; Xie, C.; Zhao, B.; Zhang, L.; Song, J.; et al. Optimization of power allocation for wind-hydrogen system multi-stack PEM water electrolyzer considering degradation conditions. Int. J. Hydrogen Energy 2023, 48, 5850–5872. [Google Scholar] [CrossRef] [Scilit]
  22. Zhou, S.; Fan, L.; Zhang, G.; Gao, J.; Lu, Y.; Zhao, P.; Wen, C.; Shi, L.; Hu, Z. A review on proton exchange membrane multi-stack fuel cell systems: Architecture, performance, and power management. Appl. Energy 2022, 310, 118555. [Google Scholar] [CrossRef] [Scilit]
  23. Ma, R.; Chai, X.; Geng, R.; Xu, L.; Xie, R.; Zhou, Y.; Wang, Y.; Li, Q.; Jiao, K.; Gao, F. Recent progress and challenges of multi-stack fuel cell systems: Fault detection and reconfiguration, energy management strategies, and applications. Energy Convers. Manag. 2023, 285, 117015. [Google Scholar] [CrossRef] [Scilit]
  24. Wang, Y.; Chen, W.; Li, Q.; Han, Y.; Guo, A.; Wang, T. Coordinated optimal power distribution strategy based on maximum efficiency range of multi-stack fuel cell system for high altitude. Int. J. Hydrogen Energy 2024, 50, 374–387. [Google Scholar] [CrossRef] [Scilit]
  25. Lipuzhin, I.; Shalukho, A.; Bedretdinov, R.; Shuvalova, Y. Development and research of energy management strategy to minimize hydrogen consumption of dual stack PEMFC system. Int. J. Hydrogen Energy 2024, 110, 514–524. [Google Scholar] [CrossRef] [Scilit]
  26. Aziz, M.; Trinh, P.H.; Hudaya, C.; Chung, I.Y. Coordinated control strategy for hybrid multi-PEMFC/BESS in a shipboard power system. Electr. Power Syst. Res. 2025, 243, 111495. [Google Scholar] [CrossRef] [Scilit]
  27. Li, X.; Li, Q.; Wang, T.; Chen, W.; Zhang, S. Adaptive power transient smoothing control considering performance degradation for multi-stack fuel cell hybrid power systems. IEEE Trans. Transp. Electrif. 2023, 10, 7501–7512. [Google Scholar] [CrossRef] [Scilit]
  28. Ding, Y.; Wang, M.; Chen, D.; Xu, N.; Xu, K.; Hu, S.; Xu, X.; Pei, P. A comprehensive review of thermal management subsystems for automotive fuel cell systems: Configuration, modeling and control strategies. Appl. Therm. Eng. 2026, 288, 129685. [Google Scholar] [CrossRef] [Scilit]
  29. Yan, Y.; Wang, B.; Wang, C.; Zhao, D.; Xiao, C. Adaptive maximum power point tracking based on Kalman filter for hydrogen fuel cell in hybrid unmanned aerial vehicle applications. Int. J. Hydrogen Energy 2023, 48, 25939–25957. [Google Scholar] [CrossRef] [Scilit]
  30. Zhou, Y.; Ravey, A.; Péra, M.C. Real-time cost-minimization power-allocating strategy via model predictive control for fuel cell hybrid electric vehicles. Energy Convers. Manag. 2021, 229, 113721. [Google Scholar] [CrossRef] [Scilit]
  31. Gao, Q.; Lei, T.; Yao, W.; Zhang, X.; Zhang, X. A health-aware energy management strategy for fuel cell hybrid electric UAVs based on safe reinforcement learning. Energy 2023, 283, 129092. [Google Scholar] [CrossRef] [Scilit]
  32. Deng, Z.; Miao, B.; Chen, Q.; Chen, J.; Tong, C.; Liu, H.; Deendarlianto; Suwarno; Wang, H.; Chan, S.H. Degradation prediction and remaining useful life estimation of PEMFCs: Mechanisms, methods, datasets, and challenges. Renew. Sustain. Energy Rev. 2026, 229, 116598. [Google Scholar] [CrossRef] [Scilit]
  33. Chen, F.; Tong, G.; Chi, X.; Zhang, B.; Li, R. Innovative design and decoupling control of an efficient, simplified MFCS air supply system for renewable hydrogen-powered stacks. Renew. Energy 2025, 256, 124283. [Google Scholar] [CrossRef] [Scilit]
  34. Saadaoui, F.; Kobibi, Y.I.D.; Sereir, B.B.; Mammar, K.; Gasbaoui, B. Comparative analysis of two different energy management strategies of a PEMFC emergency hybrid power system based on hydrogen consumption minimization (aircraft application). J. Power Sources 2025, 658, 238321. [Google Scholar] [CrossRef] [Scilit]
  35. Kart, S.; Demir, F.; Kocaarslan, İ.; Genc, N. Increasing PEM fuel cell performance via fuzzy-logic controlled cascaded DC-DC boost converter. Int. J. Hydrogen Energy 2024, 54, 84–95. [Google Scholar] [CrossRef]
  36. Hao, X.; Wang, S.; Fan, Y.; Xie, Y.; Fernandez, C. An improved forgetting factor recursive least square and unscented particle filtering algorithm for accurate lithium-ion battery state of charge estimation. J. Energy Storage 2023, 59, 106478. [Google Scholar] [CrossRef] [Scilit]
  37. Abualigah, L.; Diabat, A.; Mirjalili, S.; Elaziz, M.A. The arithmetic optimization algorithm. Comput. Methods Appl. Mech. Eng. 2021, 376, 113609. [Google Scholar] [CrossRef] [Scilit]
  38. Katoch, S.; Chauhan, S.S.; Kumar, V. A Review on Genetic Algorithm: Past, Present, and Future. Multimed. Tools Appl. 2021, 80, 8091–8126. [Google Scholar] [CrossRef] [Scilit]
  39. Mirjalili, S.; Saremi, S.; Mirjalili, S.M.; Coelho, L.S. Multi-Objective Grey Wolf Optimizer: A Novel Algorithm for Multi-Criterion Optimization. Expert Syst. Appl. 2016, 47, 106–119. [Google Scholar] [CrossRef] [Scilit]
  40. Mirjalili, S.; Mirjalili, S.M.; Hatamlou, A. Multi-Verse Optimizer: A Nature-Inspired Algorithm for Global Optimization. Neural Comput. Appl. 2016, 27, 495–513. [Google Scholar] [CrossRef] [Scilit]
Figure 1. Schematic Diagram of the Fuel Cell System.
Wevj 17 00281 g001
Figure 2. Proton Exchange Membrane Fuel Cell System.
Wevj 17 00281 g002
Figure 3. Fitting curves and relative errors of fuel cell stack power (a) and stack voltage (b).
Wevj 17 00281 g003
Figure 4. Fitting curve and relative error of fuel cell system efficiency.
Wevj 17 00281 g004
Figure 5. Framework diagram of a multi-stack fuel cell efficiency optimization control system.
Wevj 17 00281 g005
Figure 6. Shortest path solution based on the Dijkstra algorithm.
Wevj 17 00281 g006
Figure 7. Candidate solution set and corresponding load points.
Wevj 17 00281 g007
Figure 8. Dual-time-scale optimization method.
Wevj 17 00281 g008
Figure 9. Performance comparison of different optimization algorithms.
Wevj 17 00281 g009
Figure 10. Load operating conditions.
Wevj 17 00281 g010
Figure 11. Output power curves of each stack under different power allocation methods.
Wevj 17 00281 g011
Figure 12. System efficiency under different power allocation methods.
Wevj 17 00281 g012
Figure 13. System aging under different power allocation methods.
Wevj 17 00281 g013
Table 1. Classification of the literature review.
Ref.Fuel Cell ScaleOptimization ObjectivesFuel Cell
Modeling
Computational BurdenAlgorithm/Control Strategy
[9]Single stackOutput powerOfflineLowDrift-free P&O
[10]Single stackOutput powerOnlineModerateClassification-based ML MPPT
[24]Single stackNet power and efficiencyOfflineLowMER-based power distribution
[25]Dual stackNet power and efficiencyOnlineLow-moderateReal-time hydrogen-saving optimization
[26]Multi-stackEfficiencyOnlineLow-moderateMaster-slave & droop coordinated control
[27]Multi-stackNet power, efficiency, and lifetimeOnlineModerateAdaptive virtual inertia smoothing control
This paperMulti-stackEfficiency and lifetimeOnlineModerateDual-time-scale optimization
Table 2. PEM fuel cell degradation rates.
Operating ConditionsSymbolDegradation RateData Source
Low power (not exceeding 20% of the rated power) O l o w 8.66 μ V/h[30]
High power (not less than 80% of the rated power) O h i g h 10.00 μ V/h
Transient loading O t r 0.4815 μ V/(kW/s)[31]
Start/stop O s t 13.79 μ V/cycle
Table 3. Parameters of PEMFC.
ParameterValue
Rated output power (kW)3.5
Peak power (kW)3.7
Cooling methodLiquid cooling
Operating voltage range (V)26.88–42.00
Operating temperature range (°C)−15–75
Number of single cells40
Table 4. Steady-State Response Characteristic Experimental Results.
Fuel Cell StackSystem Auxiliary Power (W)System Net Power (W)System Efficiency (%)
Current (A)Voltage (V)Power (W)
041.10000
1537.556318837539.68
3035.0105031074041.57
4534.01530330120045.05
6032.81970350162045.91
7531.42355355200046.30
9031.02790380241045.90
10530.03150400275045.08
12029.23500440306044.14
13528.93902552335043.10
15027.54130500363042.08
Table 5. The voltage degradation of different methods.
MethodFC1FC2FC3
Equal allocation Method32.43 μV32.43 μV32.43 μV
Daisy-Chain allocation Method64.25 μV48.32 μV42.37 μV
Dual-time-scale allocation Method32.52 μV32.15 μV32.79 μV
Table 6. Comprehensive numerical comparison table.
MethodOffline Computation TimeReal-Time Optimization TimeAverage System EfficiencyAverage Voltage Decay
Equal allocation Method//40.1%32.43 μV
Daisy-Chain allocation Method//43.3%51.65 μV
Dual-time-scale allocation Method0.2 s0.002 s45.28%32.49 μV
Disclaimer/Publisher’s Note: The statements, opinions and data contained in all publications are solely those of the individual author(s) and contributor(s) and not of MDPI and/or the editor(s). MDPI and/or the editor(s) disclaim responsibility for any injury to people or property resulting from any ideas, methods, instructions or products referred to in the content.