2.1. Study Area
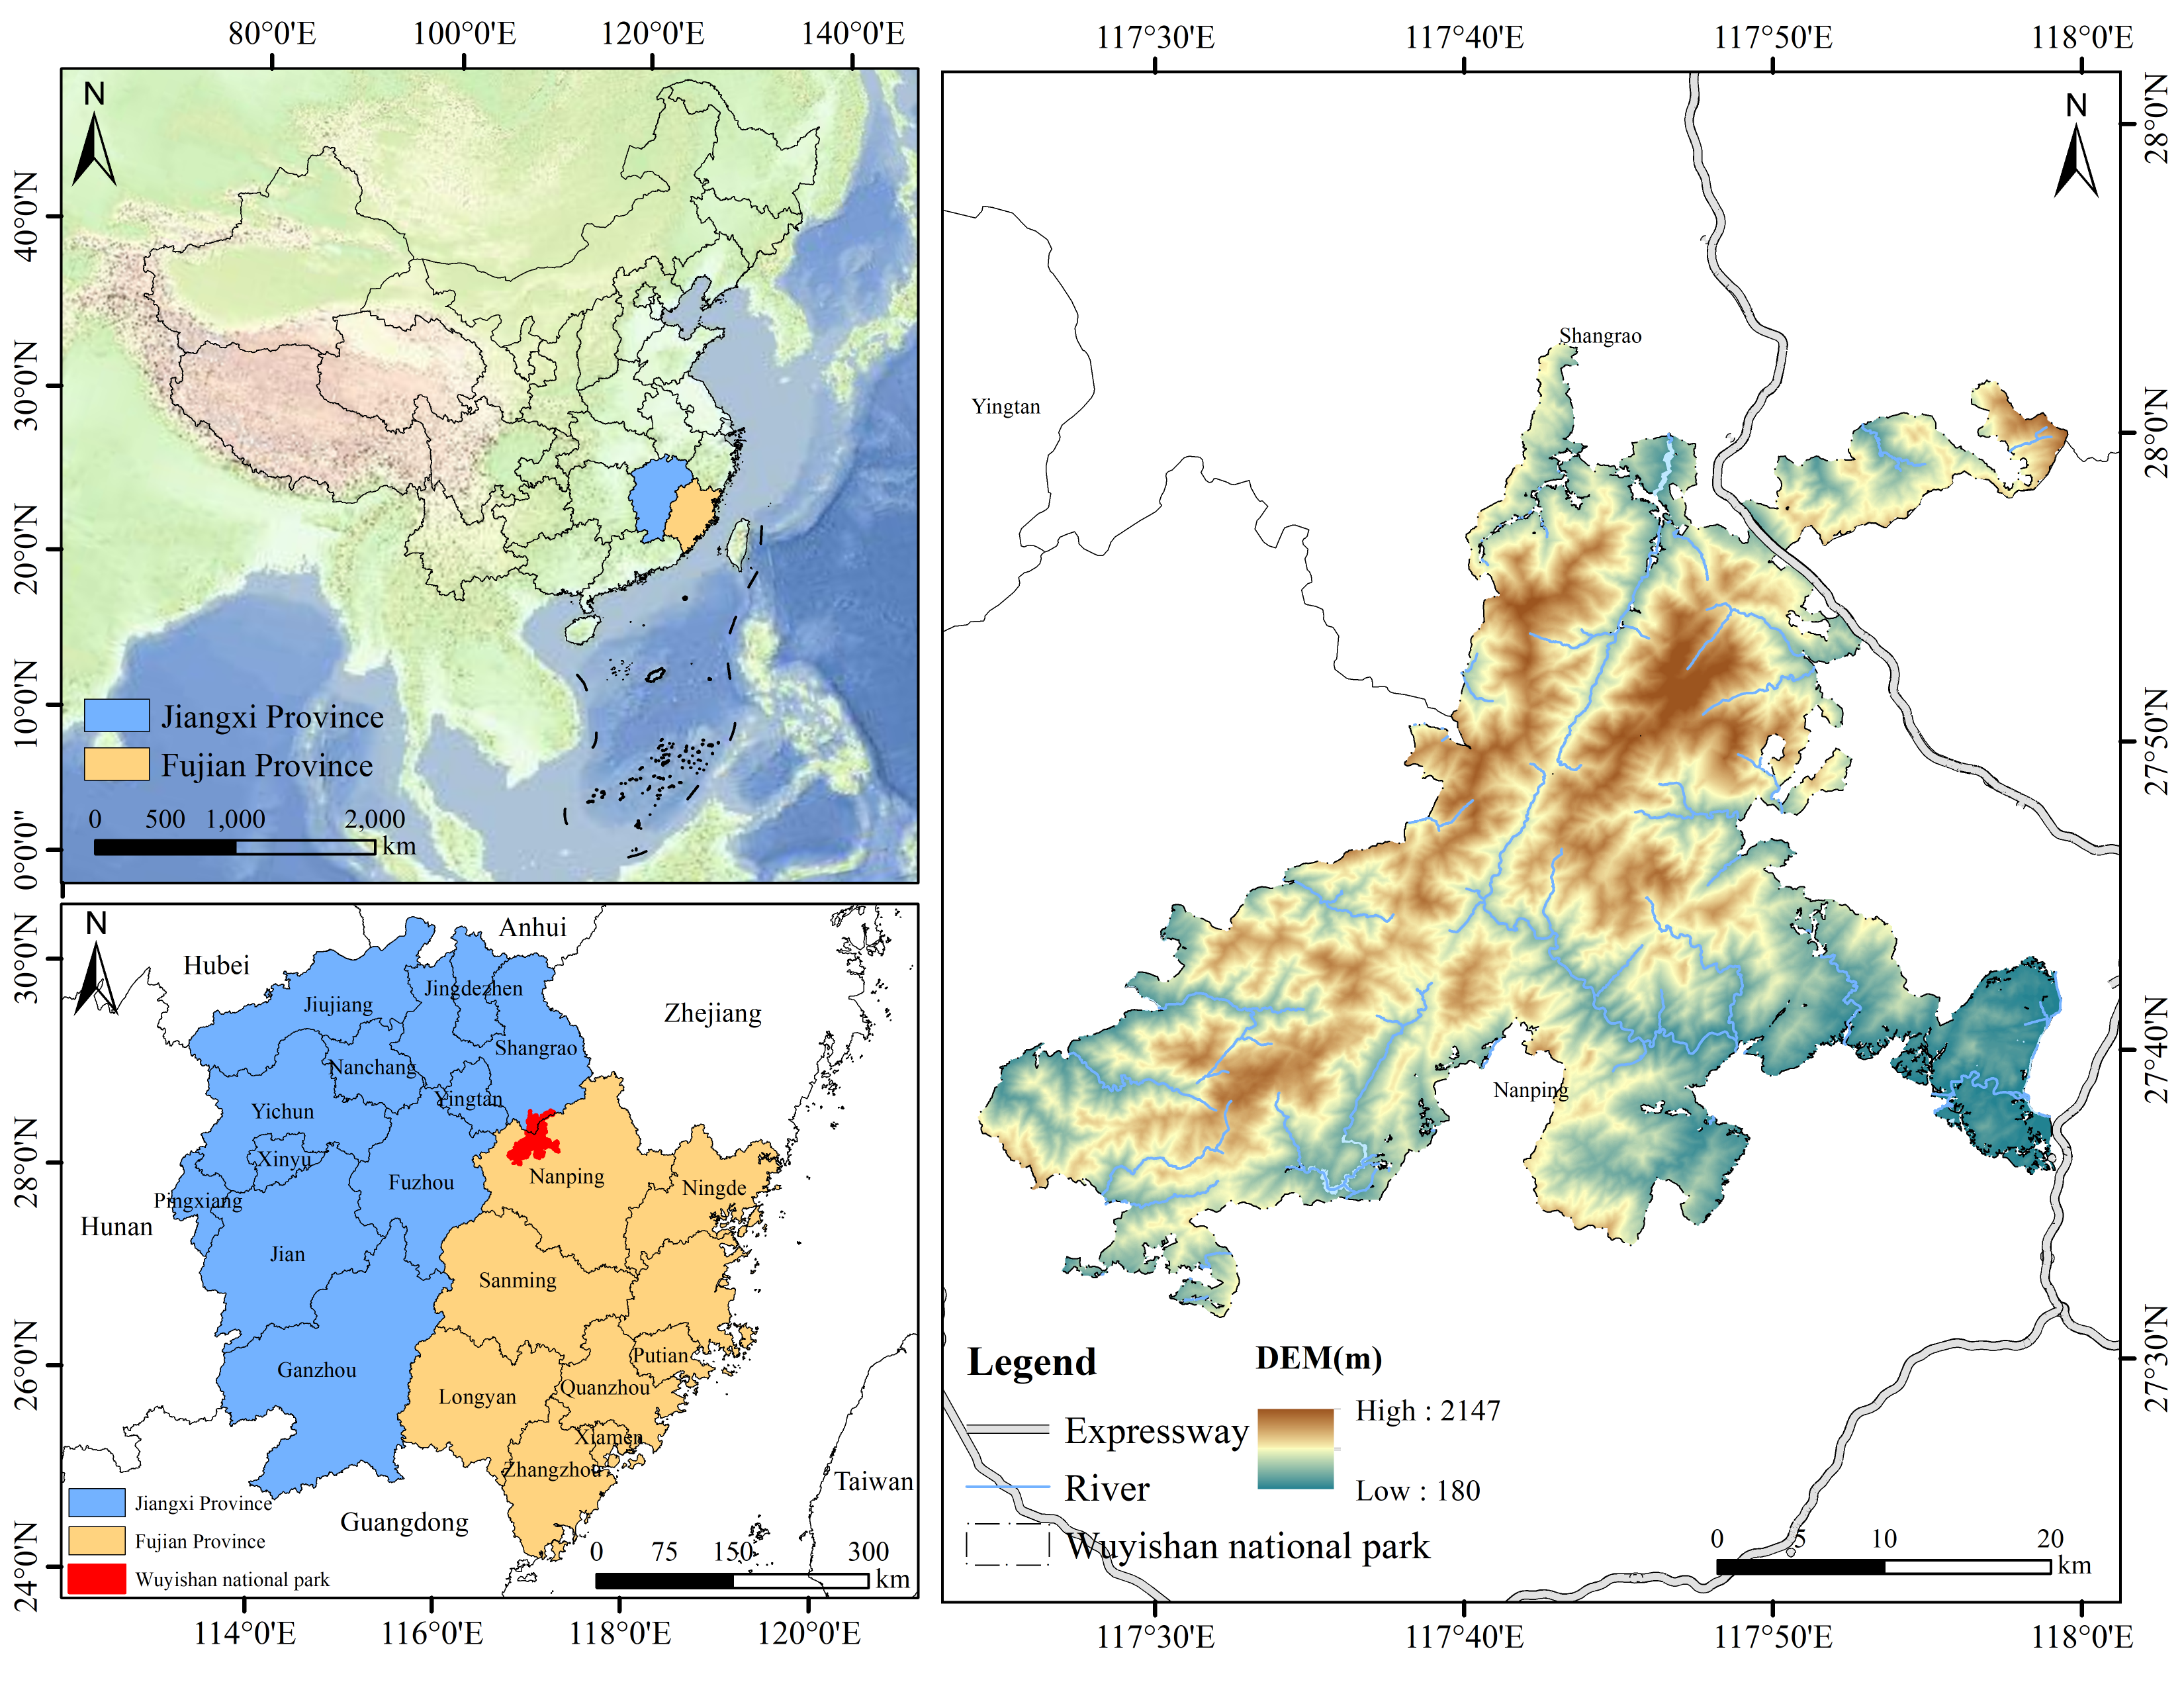
Wuyishan National Park is one of the first five national parks, spanning the provinces of Fujian and Jiangxi (
Figure 1). Wuyishan contains the largest and best-preserved mid-subtropical primary forest ecosystem at the same latitude globally, serving as a representative example of this ecological system. Because of its natural and cultural significance, Wuyishan has been recognized as a World Heritage Site by the United Nations Educational, Scientific, and Cultural Organization [
38].
Among the first batch of established national parks in China, Wuyishan National Park was formerly the Wuyishan Scenic and Historic Interest Area and has long maintained a well-established system of tourism pricing and management. Compared to other national parks, Wuyishan National Park implemented a generally standardized, scientific, and complete national park concession system relatively early, and the tourism concessions include tourism services, supervision, and management. The key concession projects include bamboo rafting on the Nine-Bend Stream and eco-friendly sightseeing buses. According to official information released by Wuyishan National Park, during the peak season, the entrance fee is ¥140 per person, compared with ¥120 in the off-season; a one-day sightseeing bus ticket costs ¥70 per person, and a bamboo rafting ticket costs ¥130 per person. For an average adult tourist, the total cost of a one-day visit with ecological experience consumption in Wuyishan during the peak season is approximately ¥340. To fully reflect the public welfare nature of China’s national parks, Wuyishan National Park implements free admission policies for its core scenic area during multiple periods. Tourists can enter Wuyishan National Park for free, but ecological experiences require additional payment (such as bamboo rafting, sightseeing bus rides, etc.). Therefore, Wuyishan National Park provides a relatively ideal research environment, which helps to guide tourists to understand the difference between hypothetical ecological compensation payments and general ticket expenditures while weakening the interference of traditional ticket prices. At the same time, it deepens the understanding of the user-pays principle, thereby more accurately identifying tourists’ true willingness to pay ecological compensation.
2.2. Theoretical Analysis Framework
Empirical studies based on value–belief–norm (VBN) theory have shown that awareness of consequences, ascription of responsibility, and personal norms are key factors in explaining individuals’ environmentally responsible behavior [
39,
40,
41,
42], a finding also validated in the tourism research area [
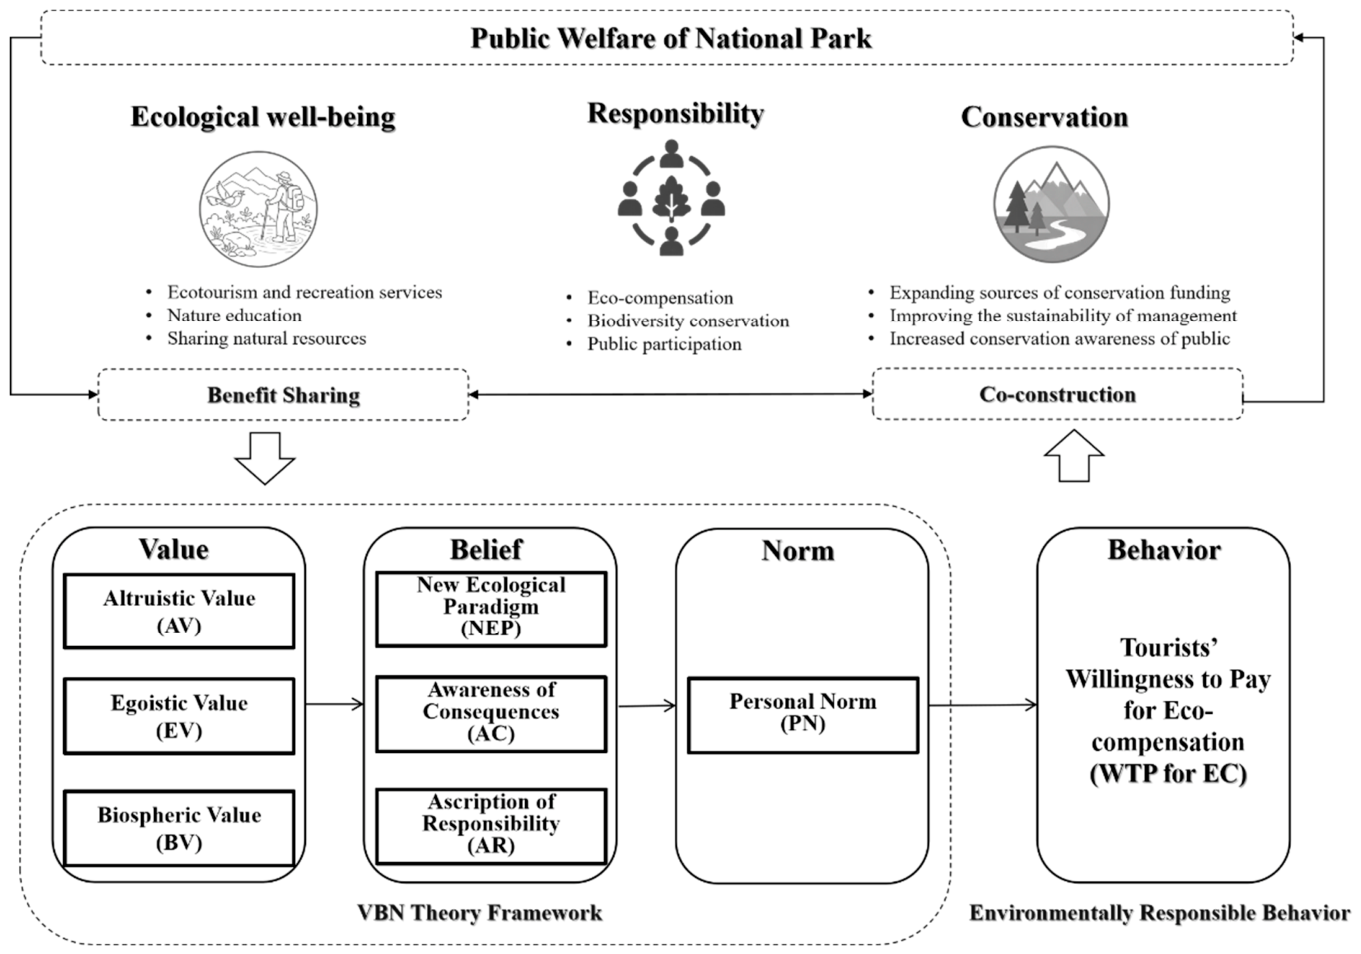
43]. In the context of the public-welfare development of national parks, tourists first form basic judgments about the relationship between humans and nature based on their ecological value orientations and, on this basis, recognize the ecological consequences that tourism activities may generate. When tourists further ascribe the relevant conservation responsibility to themselves, external requirements for ecological conservation may be transformed into internal moral obligations and manifested in stronger personal norms. Personal norms therefore become an important link between environmental responsibility cognition and WTP for eco-compensation. Accordingly, this study constructs a chain model linking values, beliefs, and personal norms to examine tourists’ WTP for eco-compensation and its influencing factors in Wuyishan National Park (
Figure 2).
In this mechanism model, the public welfare of national parks means that, while tourists enjoy the resource value of ecological public goods, they should also assume corresponding responsibilities for ecological conservation. Specifically, value–belief–norm (VBN) theory posits that people take action when they value something, perceive it as threatened, and believe that their actions can restore its value [
44,
45]. Personal values refer to the principles or motivations that propel individual behavior, such as pro-environmental behavior [
41], and include altruistic values (AV), biospheric values (BV), and egoistic values (EV). Altruistic values (AV) are based on a deep concern for the well-being of others [
46]. The moral satisfaction generated by tourists’ payments for biodiversity conservation and environmental protection reflects altruistic behavior [
47,
48]. Biospheric values (BV) relate to care for other species and the overall environment and may also refer to the biosphere or non-living things [
44,
49]. Egoistic values (EV) concern self-interest, such as wealth, dominance, and influence over others [
44]. The more individuals endorse egoistic values, the more reluctant they are to adopt pro-environmental behaviors that are costly, effortful, or uncomfortable [
39,
50]. The beliefs in the VBN framework comprises three factors: the new ecological paradigm (NEP), awareness of consequences (AC), and ascription of responsibility (AR). Together, they capture the cognitive processes involved in forming pro-environmental attitudes and behaviors [
51]. NEP addresses the overarching belief in the need to protect the environment and its universal values [
52]. Awareness of consequences (AC) refers to individuals’ understanding of the consequences of environmental harm [
41,
53]. Ascription of responsibility (AR) recognizes that human intervention can either mitigate or exacerbate potential environmental damage and emphasizes individuals’ recognition of their personal responsibility in mitigating environmental damage [
44]. Personal norms are defined as “feelings of moral obligation to perform or refrain from specific actions” [
54]. VBN theory explains the formation of pro-environmental behavior through a theoretical framework in which personal values shape beliefs, leading to norms that guide behavior [
55,
56]. Based on the proposed theoretical framework, this study argues that tourists’ environmental values, beliefs, and personal norms are associated with their stated WTP for eco-compensation.
2.4. Data Collection and Processing
This study designed the questionnaire based on the VBN theoretical framework and the MBDC format. Before completing the questionnaire, respondents were provided with a brief explanation of tourist eco-compensation and the temporary free admission policy implemented in Wuyishan National Park. First, respondents were asked whether they were willing to assume a certain degree of compensatory responsibility for the potential ecological pressure generated by tourism activities and for the costs of maintaining the national park ecosystem. Second, the MBDC format was used to collect data on eco-compensation payment amounts, with bid levels ranging from ¥0–¥1000, response options varying from “Definitely No” and “Probably No” to “Not Sure”, “Probably Yes” and “Definitely Yes”. Third, the constructs of the VBN framework were measured using a five-point Likert scale ranging from 1 (strongly disagree) to 5 (strongly agree). Finally, basic characteristics of respondents were collected. The names, descriptions, and values of the variables are shown in
Table 1. The items measuring the dimensions of the VBN theory were adapted from Stern et al. [
44] and Kiatkawsin and Han [
43]. The NEP was initially proposed by Dunlap et al. [
52] and primarily focuses on the overall adverse effects of environmental degradation. The questionnaire was administered in Chinese, and the original items were translated and contextually adapted to national park tourism. General environmental statements were reformulated to refer to tourism-related pollution, wildlife habitat disturbance, inappropriate tourist behavior, and tourists’ responsibility for the environmental impacts of tourism activities. Previous research found that factors such as age, income level, gender, and education level influence one’s pro-environmental attitude and behaviors [
60,
61]. In particular, young people, the highly educated, and women were found to exhibit a positive attitude towards the environment [
62,
63,
64,
65]. These demographic variables help account for observable individual heterogeneity in tourists’ WTP and provide a clearer estimate of the associations between the VBN variables and WTP. Therefore, this study uses VBN theory variables as the core explanatory variables and demographic characteristics as control variables to control for the potential effects of individual heterogeneity on tourists’ WTP for eco-compensation.
Throughout 2024, the park adopted a full ticket exemption policy, charging only for bamboo rafting and sightseeing bus services, while ecological self-driving activities along Scenic Route No. 1 were also free. Against this background of ticket exemption, this study investigates tourists’ WTP for eco-compensation in Wuyishan National Park. The survey was conducted in September 2024, using a combination of on-site and online questionnaires to broaden respondent coverage and increase the sample size. Respondents were adult tourists in Wuyishan National Park during the free admission period in 2024. The on-site survey employed convenience sampling at major recreation nodes (entrance, tourist center, Huxiao Rock, Nine-Bend Stream, Da Hong Pao, etc.), where trained investigators approached eligible tourists and invited them to participate voluntarily. The online questionnaire was distributed via the online platform Wenjuanxing in China to facilitate more tourists responding at a convenient time. A total of 630 questionnaires were distributed, including 400 on-site and 230 online. Of these, 358 on-site and 224 online questionnaires were valid. Overall, 582 valid questionnaires were retained, yielding a valid response rate of 92.38%.
In contingent valuation surveys, some respondents refuse to pay for ecological compensation. Such protest responses are usually excluded because they do not reflect true preferences [
66]. During the investigation, we interviewed tourists to understand why they refused to pay and analyzed these reasons separately in subsequent studies. Accordingly, 40 refusal-to-pay responses were excluded during the on-site survey process. In addition, following the MBDC data processing procedure proposed by Wang et al. [
67], the questionnaires were further screened for validity. We removed five questionnaires exhibiting invariant payment likelihoods across all bid levels and three questionnaires with incomplete responses. The final sample included 582 valid responses (
Table 2). Among them, females accounted for 52.41% and males accounted for 47.59%. The respondents were mainly young and middle-aged, with the 18–29 age group accounting for the highest proportion (35.05%), followed by the 30–39 age group (23.20%) and the 40–49 age group (23.02%), while those aged 60 and above accounted for 4.47%. Monthly income was mainly concentrated in the middle range, with 2001–4000 (26.63%) and 4001–6000 (23.37%) as the largest groups, and 12.37% earning above 8000. Most respondents had a relatively high level of education, with bachelor’s degrees (42.10%) and associate degrees (21.31%) being the most common, and 16.67% holding postgraduate degrees. In addition, descriptive comparisons further showed broadly similar demographic distributions between the on-site and online subsamples, suggesting that the two survey modes covered generally similar groups of tourists.
Table 2.
Socio-demographic characteristics of the tourists.
Table 2.
Socio-demographic characteristics of the tourists.
| Demographic Variable | Item | On-Site (n = 358) | Online (n = 224) | Total (n = 582) |
|---|
| Frequency | Percentage | Frequency | Percentage | Frequency | Percentage |
|---|
| Gender | Male | 171 | 47.77% | 106 | 47.32% | 277 | 47.59% |
| Female | 187 | 52.23% | 118 | 52.68% | 305 | 52.41% |
| Age | 18–29 | 136 | 37.99% | 68 | 30.36% | 204 | 35.05% |
| 30–39 | 73 | 20.39% | 62 | 27.68% | 135 | 23.20% |
| 40–49 | 88 | 24.58% | 46 | 20.54% | 134 | 23.02% |
| 50–59 | 41 | 11.45% | 42 | 18.75% | 83 | 14.26% |
| ≥60 | 20 | 5.59% | 6 | 2.68% | 26 | 4.47% |
| Monthly income (RMB per month) | ≤2000 | 63 | 17.60% | 46 | 20.54% | 109 | 18.73% |
| 2001–4000 | 102 | 28.49% | 53 | 23.66% | 155 | 26.63% |
| 4001–6000 | 74 | 20.67% | 62 | 27.68% | 136 | 23.37% |
| 6001–8000 | 79 | 22.07% | 31 | 13.84% | 110 | 18.90% |
| ≥8001 | 40 | 11.17% | 32 | 14.29% | 72 | 12.37% |
| Education level | Elementary or junior high school | 26 | 7.26% | 9 | 4.02% | 35 | 6.01% |
| High school | 41 | 11.45% | 40 | 17.86% | 81 | 13.92% |
| Associate degree | 85 | 23.74% | 39 | 17.41% | 124 | 21.31% |
| Bachelor’s degree | 141 | 39.39% | 104 | 46.43% | 245 | 42.10% |
| Postgraduate degree | 65 | 18.16% | 32 | 14.29% | 97 | 16.67% |
In
Table 3, descriptive statistics showed that altruistic values, ecological environmental beliefs, and personal norms had relatively high mean scores of 4.04, 4.01, and 3.98, respectively, indicating that the surveyed tourists generally possessed strong ecological conservation awareness and a pronounced sense of environmental responsibility. The mean score for biospheric values was 3.91, while awareness of consequences and ascription of responsibility had mean scores of 3.88 and 3.78, respectively, both of which were also at relatively high levels. By contrast, the mean score for egoistic values was 2.954, which was substantially lower than those of the other dimensions. This suggests that, in the context of eco-compensation in national parks, tourists’ judgments were not primarily driven by self-interest but were more likely influenced by environmental values, ecological beliefs, and moral norms. The Cronbach’s alpha coefficients for all VBN dimensions exceeded the recommended threshold of 0.70, demonstrating acceptable internal consistency. The KMO value was 0.859, and Bartlett’s test of sphericity was significant, χ
2 (325) = 2909.068,
p < 0.001, indicating that the questionnaire data were suitable for factor analysis.
Table 3.
Descriptive Statistics and Reliability Test Results for the VBN Variables.
Table 3.
Descriptive Statistics and Reliability Test Results for the VBN Variables.
| Dimension | Variables | Items | Mean | SD | Cronbach’s α |
|---|
| Value | Altruistic Value (AV) | 4 | 4.04 | 0.43 | 0.768 |
| Egoistic Value (EV) | 4 | 2.95 | 0.61 | 0.734 |
| Biospheric Value (BV) | 3 | 3.91 | 0.65 | 0.733 |
| Belief | New Ecological Paradigm (NEP) | 6 | 4.01 | 0.45 | 0.769 |
| Awareness of Consequences (AC) | 3 | 3.88 | 0.58 | 0.761 |
| Ascription of Responsibility (AR) | 3 | 3.78 | 0.63 | 0.817 |
| Norm | Personal Norm (PN) | 3 | 3.98 | 0.67 | 0.722 |
2.5. Measurement
2.5.1. Estimation Model for Tourists’ Willingness to Pay for Eco-Compensation
This study adopts the Wang and He two-step approach to estimate tourists’ WTP by deriving the individual cumulative distribution function and the corresponding bid prices. When estimating individual WTP, redundant bid points were removed for each respondent. Specifically, lower bid levels preceding the last “Definitely Yes” response were deleted, as were higher bid levels following the first “Definitely No” response. Within the MBDC format, respondents’ uncertainty is transformed into subjective probabilities. The five response categories, i.e., “Definitely No” “Probably No” “Not Sure” “Probably Yes” and “Definitely”, assigned acceptance probabilities of 0.01, 0.25, 0.50, 0.75, and 0.99, respectively. It should be noted that the zero-bid option represents the probability that respondents would accept the eco-compensation scheme in the absence of any additional eco-compensation payment. Based on the MBDC data obtained from the survey, these probability assignments allow the construction of an individual-level WTP distribution. The model then uses this information to estimate the acceptance of different bid levels and to derive the corresponding WTP measures.
Assume that the acceptable eco-compensation for tourist
i in a national park is
, which is a random variable with a cumulative distribution function
F(t). The mean value of
is
, and the standard deviation is
, and
σ reflects the degree of dispersion or uncertainty in the change in an individual’s acceptance probability across different bid levels. The WTP model of tourist
i can be written as follows,
where
is a random term with a mean of zero. The
i represents different tourists; the
j represents different bid values (different prices). The
tij is the independent variable, corresponding to the various bid values presented in the questionnaire; it is also a continuous variable.
Pij is the dependent variable, representing the response of the
ith tourist to the
jth bid value; it is a continuous variable taking values between 0 and 1, reflecting the probability that tourist
i is willing to pay when the price increases to
j. Its value can be derived by converting the results of a MBDC model into numerical probability estimates. When given a price
tij for which the subscript
j denotes the
jth bid level given in the MBDC matrix, the probability of the tourist
i choosing “yes” to the offered
tij will be
Pij, the formula is:
where
is an error term with a mean of 0 and a variance of
δ2. The
δ can be constant for respondent
i but will be different for different respondents. If a specific functional form for
F(t) is assumed with a normal distribution, a mean
μi and a standard deviation
i, i.e.,
, then the model (2) becomes,
The primary purpose of this model is to estimate and analyze μi and i, which is explained by a function of personal characteristics. Two potential approaches can be used to estimate Equation. Assuming that λi follows a Logistic distribution, the two-stage approach is applied to perform the following equation.
First step: Estimate Equation (3) for each tourist
i. To estimate the outcome for each tourist, assuming
has a normal distribution. Then,
, the log-likelihood function is:
where
is a standard normal distribution probability density function. This function is equivalent to a least squares nonlinear estimation, and
δ has no influence on the estimation if the distribution is normal.
Second step: With the log-likelihood function (4),
μi and
σi can be estimated for each tourist
i. Analyze the determinants of
μi and
σi. Once
μi and
σi are obtained for each tourist, models can be constructed to analyze their determinants. One simple example is to use the following linear functional forms:
where
xi and
zi are individual specific characteristics;
β and
v are coefficients to be estimated; and
e1 and
e2 are random errors.
2.5.2. Analysis of Factors Influencing Tourists’ Willingness to Pay
To examine the determinants of tourists’ WTP for eco-compensation, this study employed a hierarchical OLS regression approach based on the VBN framework, with lnWTP as the dependent variable, to test the incremental explanatory power of different groups of variables on tourists’ WTP for eco-compensation. Here, lnWTP denotes the individual log willingness-to-pay parameter estimated from the MBDC model. For each respondent, the individual willingness-to-pay distribution was estimated on the basis of certainty responses across different bid levels, and the estimated
μi was then used as lnWTP in the regression model. First, demographic variables, including gender, age, income, and education level, were entered into the baseline model as control variables. Subsequently, variables were introduced sequentially according to the chained progression of values, beliefs, and norms in the VBN framework, in order to assess the incremental explanatory power of variables at different theoretical levels for tourists’ WTP for eco-compensation. Specifically, the values dimension included altruistic values (AV), egoistic values (EV), and biospheric values (BV); the beliefs dimension included the New Ecological Paradigm (NEP), awareness of consequences (AC), and ascription of responsibility (AR); and the norms dimension included personal norms (PN).
In the model, WTPi represents tourist (i)’s WTP for eco-compensation, which was estimated using the Wang–He two-stage approach. Because relatively high or low bid level in the MBDC format could affect the accuracy of the estimates, WTP was log-transformed to reduce the potential influence of heteroskedasticity. VBN denotes the variables corresponding to each dimension of the VBN framework. Xi represents the control variables, including demographic and socioeconomic characteristics. β0 is the constant term, while β0, β1, β2, β3, and γ are the parameters to be estimated, is the random error term.