


Abstract
This study aimed to detect growth stress at the individual-tree level in chestnut (Castanea crenata Sieb. et Zucc.) plantations using UAV-based RGB orthomosaic and multispectral imagery and to determine an optimal NDVI threshold for stress classification. UAV surveys were conducted over a 21 ha chestnut orchard located in Gongju, Chungcheongnam-do, Republic of Korea. NDVI was calculated and analyzed at the individual-tree level using multispectral imagery. Based on field observations, 100 healthy trees and 23 stressed trees were selected for statistical analysis. The mean NDVI value was 0.900 ± 0.012 for healthy trees and 0.816 ± 0.013 for stressed trees, showing a highly significant difference (p < 0.001). ROC analysis showed excellent classification performance with an AUC of 1.00. The optimal NDVI threshold determined using Youden’s index was 0.855. Independent validation in another chestnut plantation approximately 1 km away achieved high classification accuracy using the same threshold. These results indicate that UAV-based multispectral imagery combined with NDVI analysis provides an effective approach for early detection of growth stress and precision monitoring at the individual-tree level in chestnut plantations. This study provides a practical and efficient approach for the early detection of growth stress at the individual-tree level, enabling early intervention against potential declines in tree vitality and proactive management in chestnut orchards. The proposed NDVI threshold-based method offers a simple yet robust tool that can be readily applied in precision forestry and smart agriculture to support large-scale monitoring and informed management decisions for maintaining orchard productivity, enabling cost-effective early intervention at the individual-tree level, which is difficult to achieve using conventional ground-based surveys in complex mountainous orchards.
1. Introduction
Chestnut trees (Castanea crenata Sieb. et Zucc.) are a representative forest product in mountainous regions of East Asia and play an important role in local economies. The growth condition of chestnut orchards directly affects both yield and fruit quality. However, in recent years, growth heterogeneity within chestnut plantations has increased due to various environmental factors, including abnormal heat events associated with climate change and the spread of pests and diseases. In the Republic of Korea, most chestnut orchards are located in steep mountainous areas, making large-scale and continuous field surveys labor-intensive and time-consuming. In addition, conventional ground-based assessments often rely on subjective judgment and field experience, which limits the objectivity and quantitative evaluation of tree growth conditions.
To address these limitations, remote sensing-based vegetation monitoring has been widely applied. Among various vegetation indices, the Normalized Difference Vegetation Index (NDVI), originally proposed by Rouse et al. [1], is one of the most widely used indicators, as it is closely related to photosynthetic activity and chlorophyll content and has been extensively utilized for assessing vegetation health and stress in both forestry and agricultural applications [2,3]. With the recent advancement of unmanned aerial vehicles (UAVs), it has become possible to acquire high-resolution imagery at the centimeter level. UAV-based remote sensing provides significantly higher spatial resolution than satellite imagery, enabling more detailed analysis of canopy structure and vegetation conditions, and has been increasingly applied in precision forestry and precision agriculture [3,4]. Previous studies in South Korea and neighboring East Asian regions have demonstrated the applicability of UAV-based remote sensing for various forestry applications, including forest fire damage assessment, monitoring of pine wilt disease, and tree species classification in complex mountainous terrains [5].
In this context, chestnut trees were specifically selected for this study due to their high economic importance in the Republic of Korea, where chestnuts are a major non-timber forest product accounting for a significant share of forest-based agricultural income. Moreover, chestnut trees are highly sensitive to environmental stressors, which directly affect canopy condition and chlorophyll activity. As chestnut trees mature, canopy overlap becomes increasingly pronounced, making individual-tree-level assessment difficult using conventional ground-based surveys.
Despite the growing demand for efficient monitoring techniques to support precision management, most previous studies have focused on plot- or stand-level assessments using averaged vegetation indices. Such broad-scale approaches often fail to capture the within-orchard variability caused by differences in tree age, micro-topography, and soil conditions. Therefore, high-resolution analysis at the individual-tree level is essential for accurate monitoring and effective decision-making, providing a practical basis for sustainable orchard management.
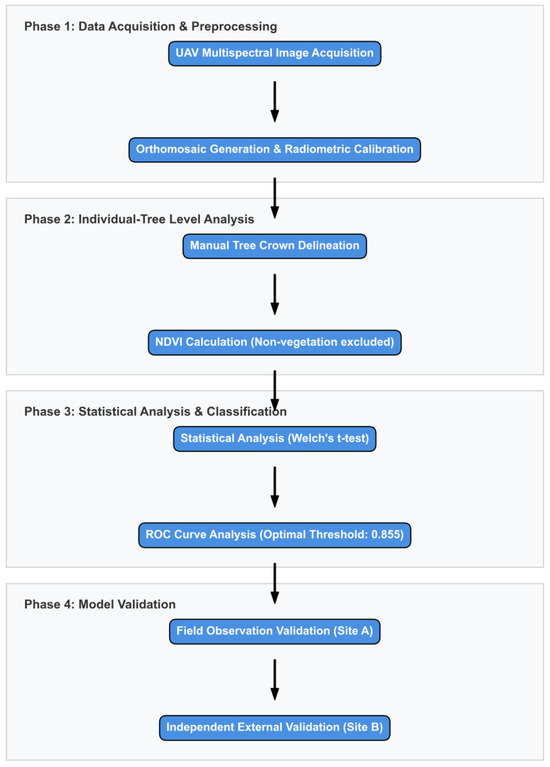
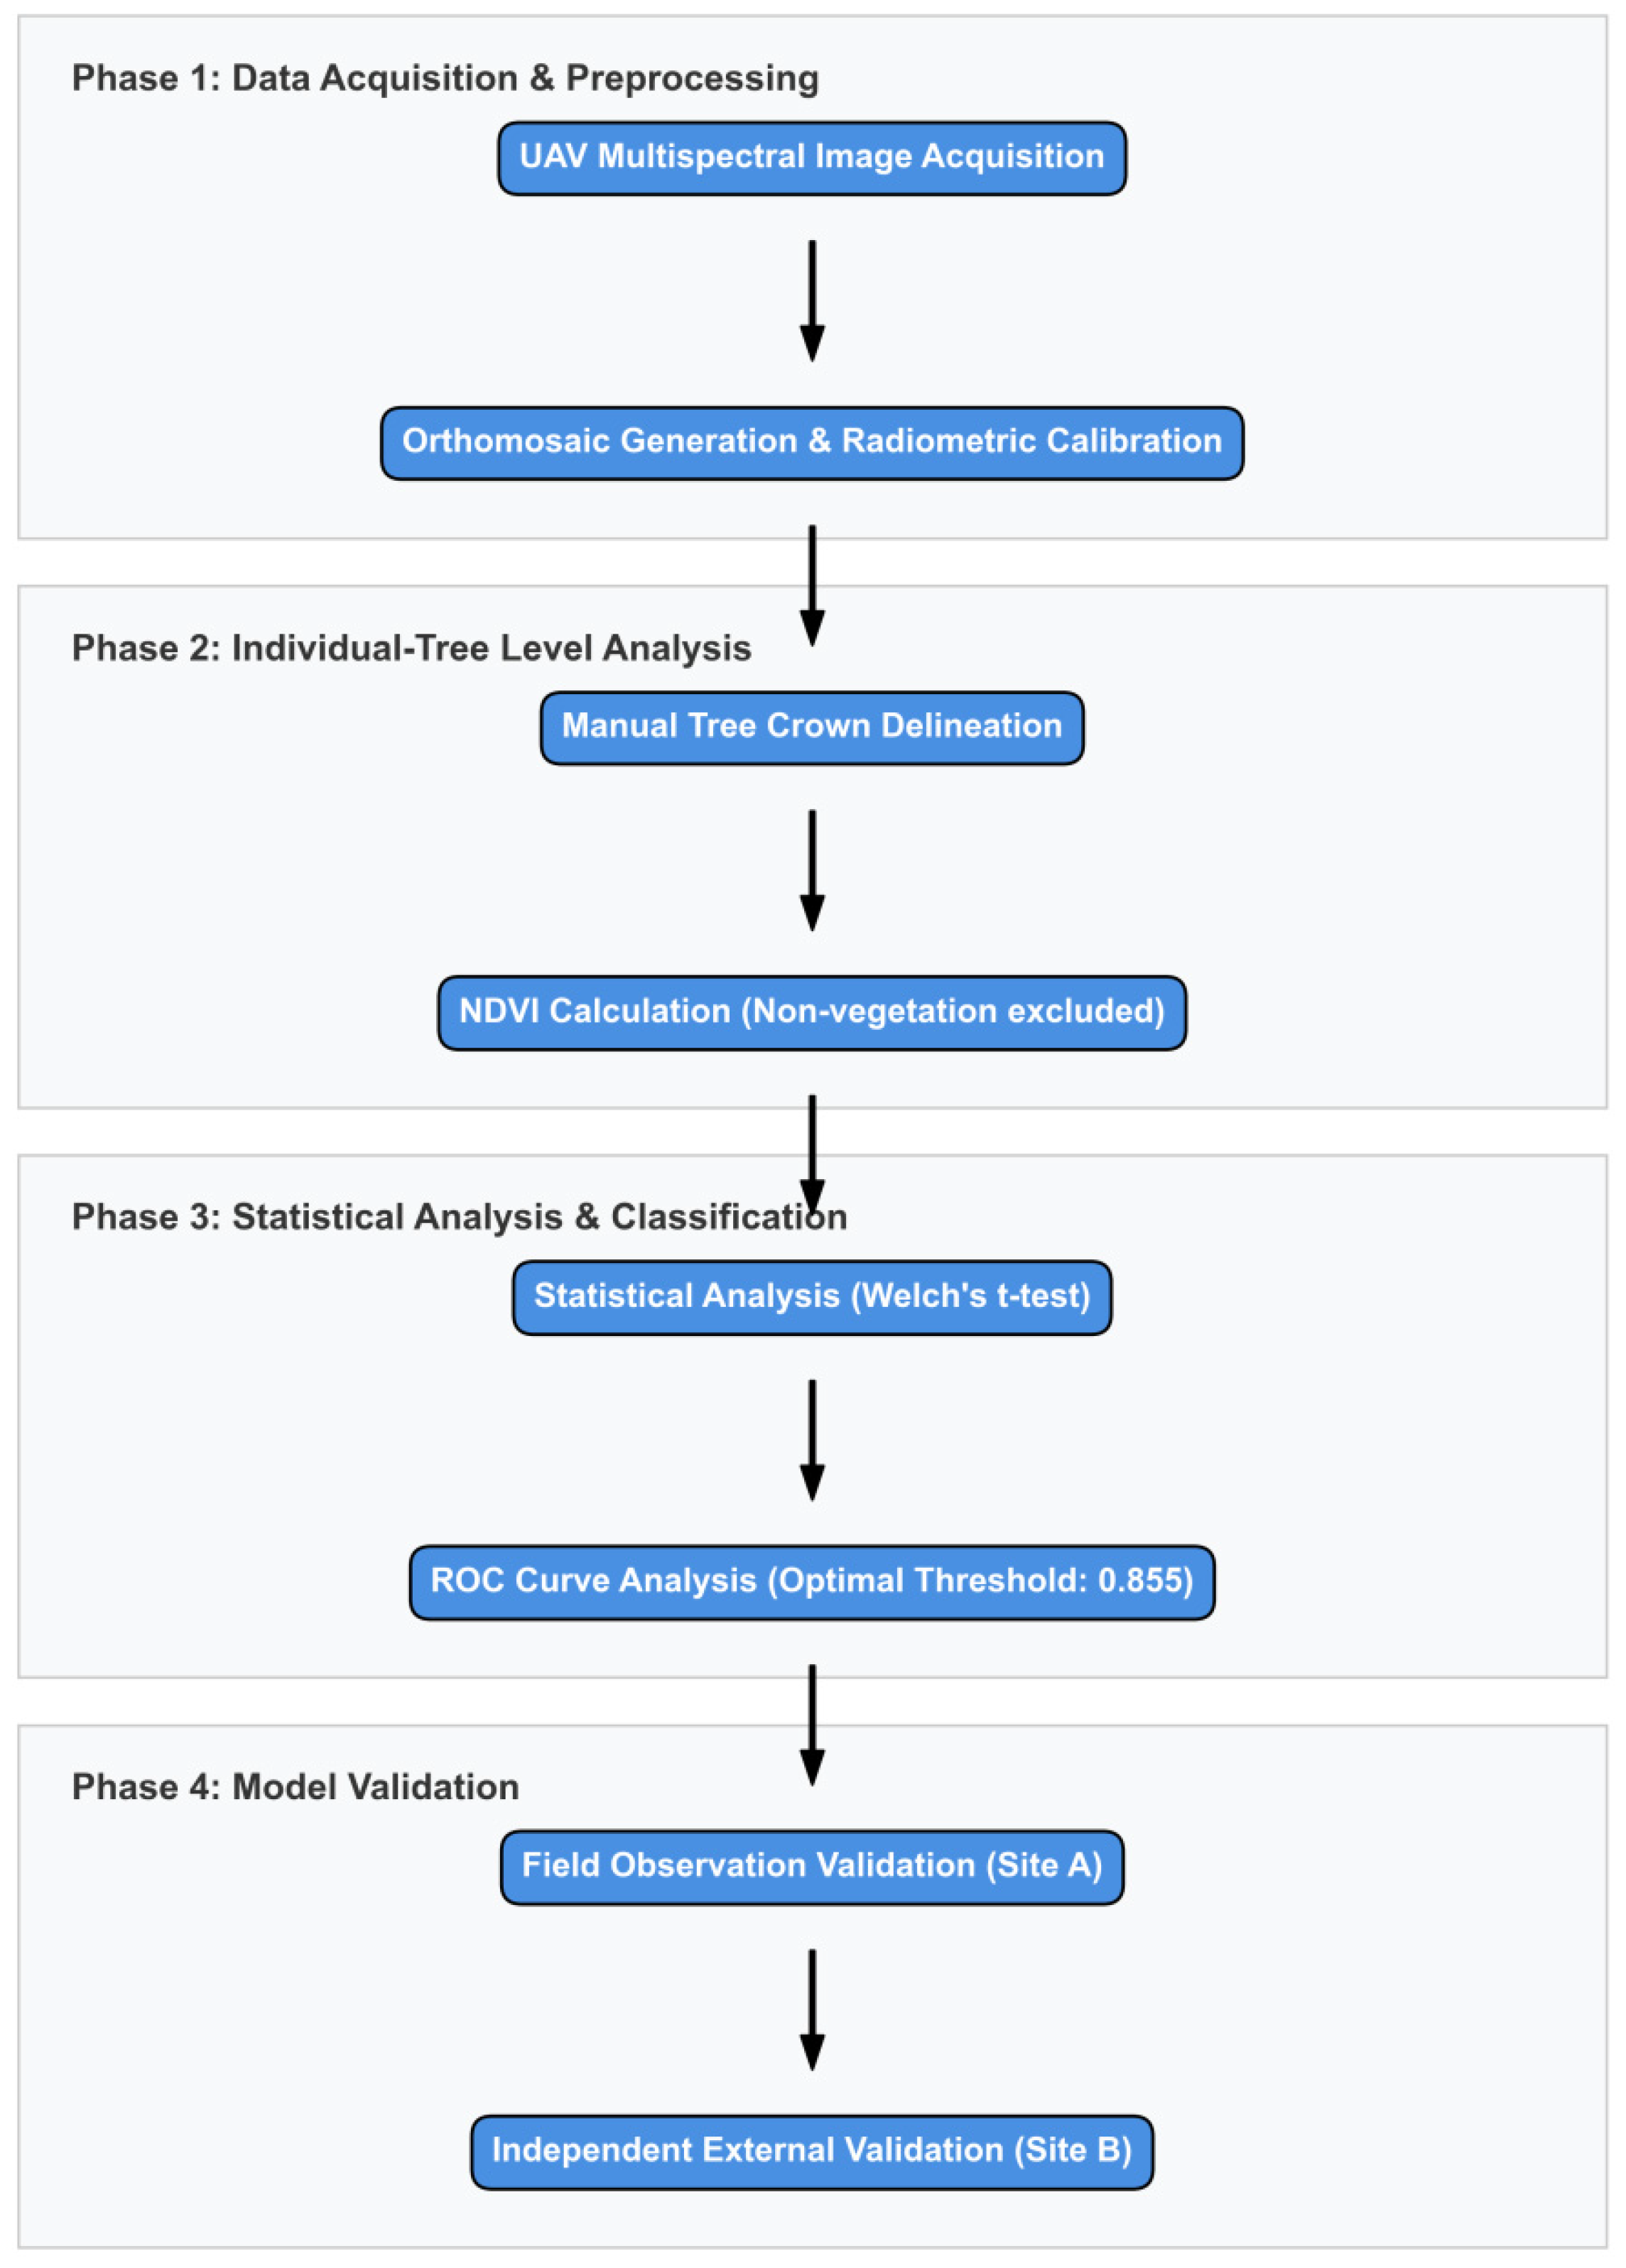
Accordingly, the objectives of this study are as follows: (1) to analyze NDVI distribution characteristics at the individual-tree level using UAV-based high-resolution RGB and multispectral imagery; (2) to statistically evaluate the differences in NDVI between healthy and stressed trees and determine an optimal NDVI threshold using receiver operating characteristic (ROC) analysis; and (3) to assess the applicability of the proposed NDVI-based classification through independent validation in a separate chestnut orchard. The overall workflow of the study is illustrated in Figure 1.
Figure 1.
Workflow of the UAV-based NDVI analysis for tree-level stress detection.
2. Materials and Methods
This section describes the integrated approach used to detect growth stress in chestnut trees, combining UAV-based data acquisition with field-based validation. The study involved multispectral imagery acquisition, individual-tree level NDVI analysis, and the determination of an optimal threshold for stress classification. The overall research workflow, from data acquisition to independent validation, is illustrated in Figure 1.
2.1. Study Area and Field Survey
The study area is a chestnut (Castanea crenata) orchard located in Jeongan-myeon, Gongju, Republic of Korea. The orchard, known as Geumjeong Albam Farm, covers approximately 21 ha and consists of more than 1000 chestnut trees with similar age and management conditions, providing a relatively homogeneous environmental background.
At the time of the survey, the orchard was generally well managed; however, some trees exhibited visible symptoms of growth stress, such as reduced canopy density and leaf chlorosis. This spatial variability in tree condition is presumed to be associated with environmental heterogeneity caused by micro-topography and localized pest or disease damage. Similar patterns have been reported in previous remote sensing studies of orchards and chestnut plantations [6,7].
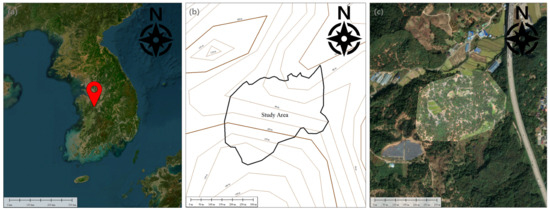
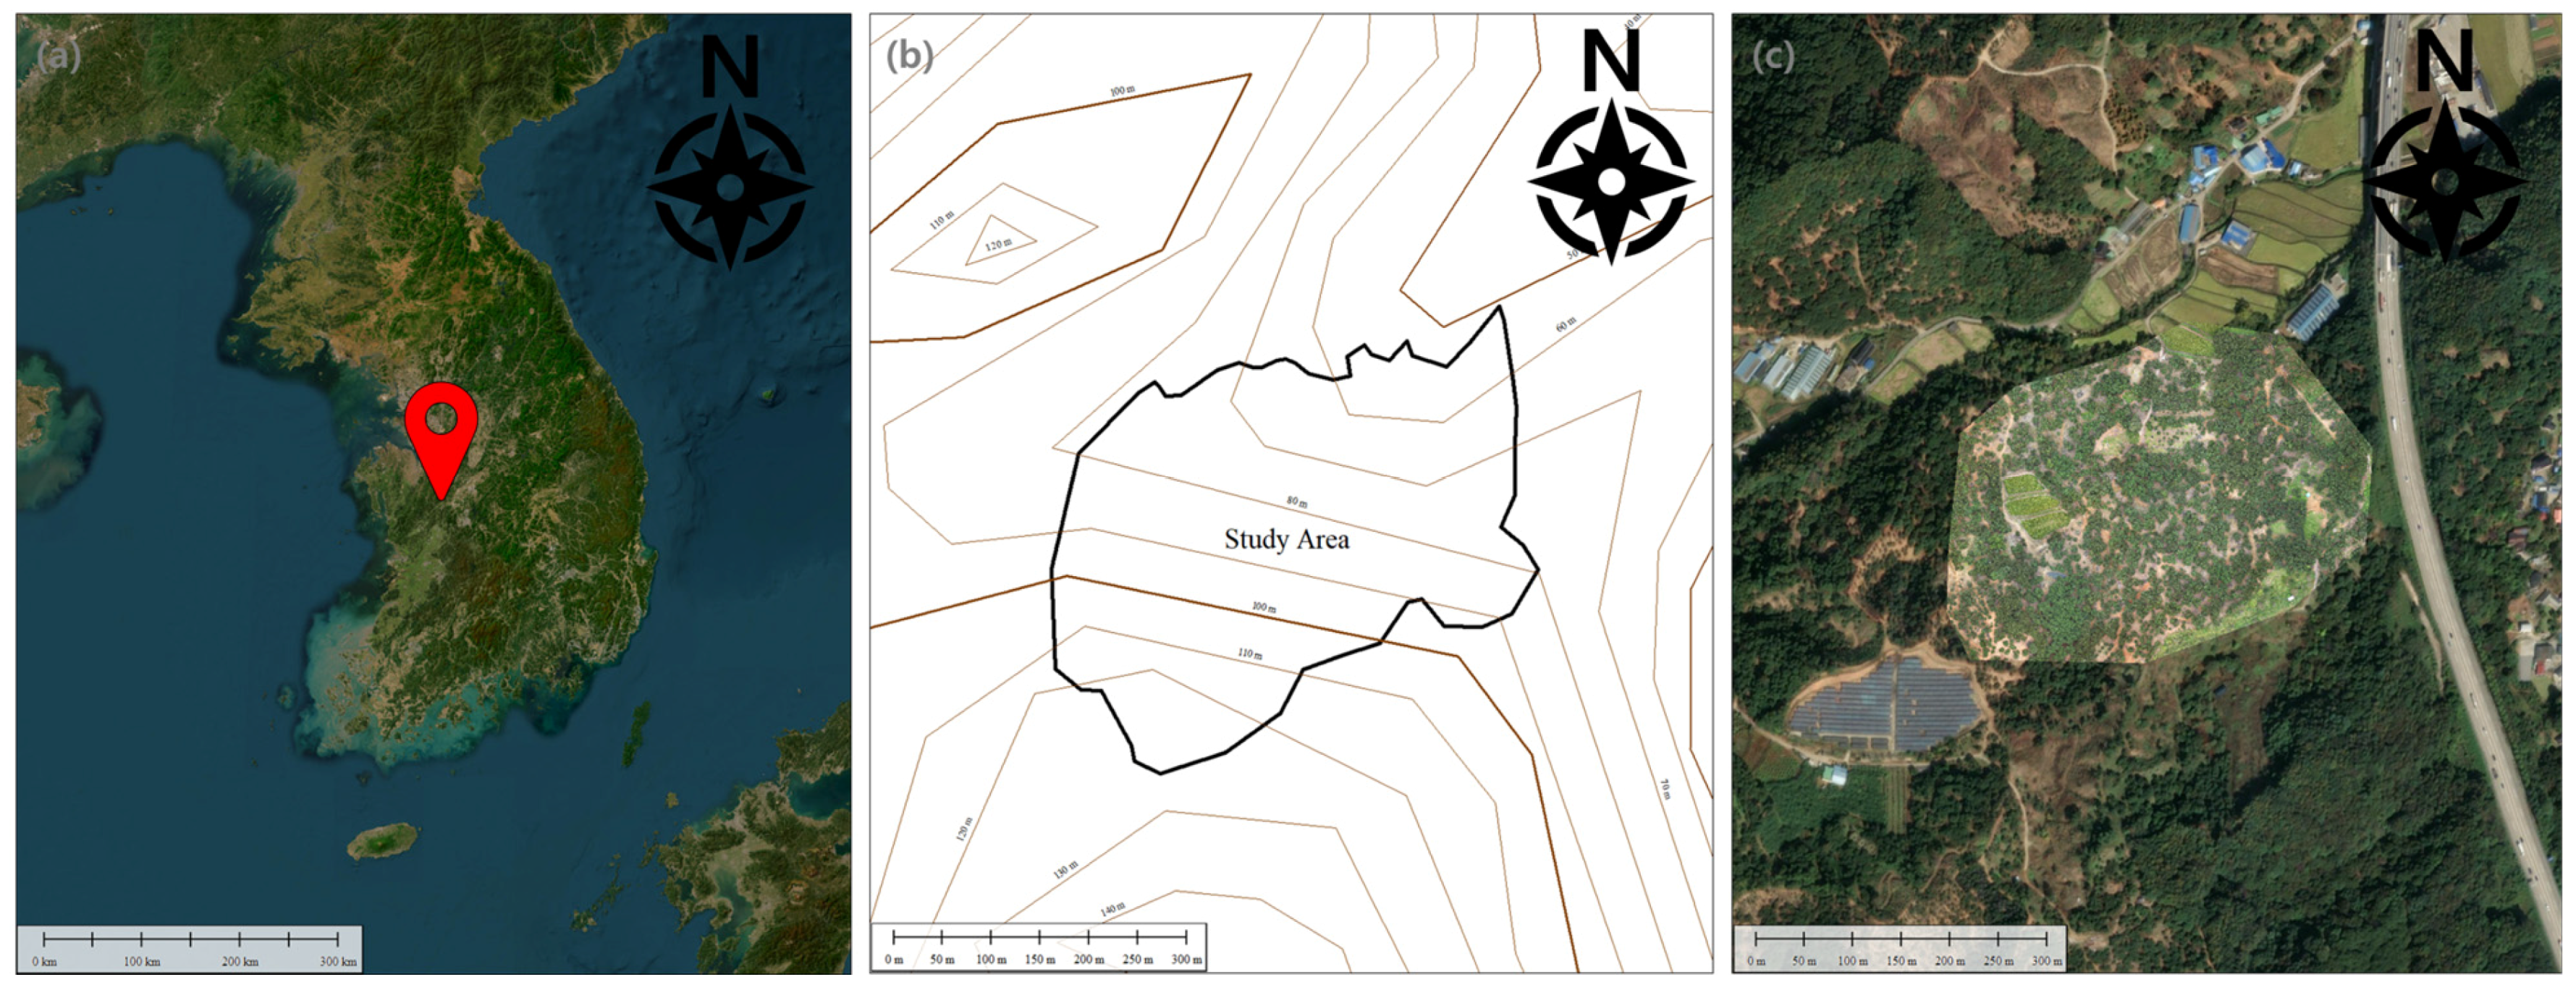
The geographic location of the study area is presented in Figure 2 (36°33′31.71″ N, 127°06′32.74″ E).
Figure 2.
Study area overview: (a) Location of the study area in the Republic of Korea; (b) Topographic characteristics of the study area represented by contour lines; (c) UAV-based orthomosaic image of the chestnut orchard.
Field surveys were conducted concurrently with UAV data acquisition to validate the vegetation index analysis. The orchard contains approximately 1000 individual trees, and canopy conditions were assessed through visual inspection by an experienced observer.
Trees showing clear symptoms of growth stress—such as defoliation (sparse crown), chlorosis, and reduced vigor—were classified as stressed. A total of 23 trees were identified as stressed individuals, and all of them were included in the analysis due to their limited number.
For the control group, 100 trees with dense canopy structure and healthy growth conditions were randomly selected and classified as healthy. Consequently, a total of 123 trees (100 healthy and 23 stressed) were used to construct the ground-truth dataset for subsequent analysis.
To ensure reliable ground-truth classification, field observations were conducted in collaboration with the orchard manager. Stressed trees were identified based on distinct leaf browning, chlorosis, and poor nut development. These visible symptoms, which are associated with reduced chlorophyll content and physiological activity, provided a robust basis for identifying growth-stressed trees.
The study area is located in a typical mountainous region in central South Korea, characterized by topographic variations ranging from gentle to steep slopes (Figure 2). These terrain conditions reflect the general environmental characteristics of chestnut orchards, which are typically established on well-drained slopes.
Geologically, the area belongs to a typical bedrock environment commonly found in the inland mountainous regions of central South Korea, and the soils are mainly composed of forest soils formed through weathering processes. These soil conditions provide suitable aeration and drainage, which are essential for chestnut tree growth. Climatically, the region exhibits a temperate monsoon climate, with hot and humid summers and cold winters. Seasonal precipitation is concentrated during the summer, which may influence localized variability in soil moisture.
From a hydrological and environmental perspective, this study was conducted within a single orchard where environmental conditions, including soil characteristics, moisture availability, and solar exposure, are relatively uniform. Therefore, the observed differences in individual tree growth conditions are unlikely to be primarily driven by large-scale environmental factors. Instead, the localized occurrence of growth stress in specific trees suggests the influence of biological factors, such as pest or disease incidence, or subtle micro-environmental variations. This context highlights the importance of individual-tree-level monitoring for effective and precise orchard management.
2.2. UAV Image Acquisition and Preprocessing
In this study, two UAV platforms were used to acquire high-resolution RGB and multispectral imagery. For multispectral data acquisition, a DJI Matrice 300 RTK UAV (DJI, Shenzhen, China) equipped with a MicaSense RedEdge-MX (MicaSense Inc., Seattle, WA, USA) was employed. The platform provides centimeter-level positioning accuracy through a built-in real-time kinematic (RTK) system, which is essential for ensuring precise image alignment at the individual-tree level.
The MicaSense RedEdge-MX sensor captures five spectral bands, including blue (475 nm), green (560 nm), red (668 nm), red edge (717 nm), and near-infrared (840 nm), enabling effective detection of vegetation physiological conditions such as photosynthetic activity and chlorophyll content [2,8]. The main specifications of the UAV platforms and the sensor are summarized in Table 1.
Table 1.
Specifications of UAV platforms and the multispectral sensor.
For RGB orthomosaic acquisition, a DJI Matrice 30 UAV was used. The RGB imagery served as a high-resolution reference for individual tree crown delineation.
Image acquisition was conducted on 18 September 2025, corresponding to the late growing season and pre-harvest stage when the chestnut canopy was fully developed. During this period, nut size and yield potential can be clearly distinguished, and physiological differences between healthy and stressed trees are most pronounced. This makes the timing particularly suitable for detecting stress-related variations in chlorophyll content and canopy structure.
Under these flight conditions, the ground sampling distance (GSD) was approximately 8 cm, which is sufficient for analyzing individual tree canopy structure and growth conditions. To minimize variations in spatial resolution caused by complex terrain, a terrain-following flight strategy based on a digital elevation model (DEM) was applied.
The acquired imagery was processed using Pix4Dmapper (Pix4D SA, Lausanne, Switzerland, version 4.7.5). The processing workflow included image alignment, dense point cloud generation, digital surface model (DSM) construction, and orthomosaic generation. A total of 507 RGB images (301 from the primary site and 206 from the validation site) and 12,258 multispectral images (6233 and 6025, respectively) were acquired and processed to generate the orthomosaic datasets used in this study.
Radiometric calibration of the multispectral imagery was performed using reflectance panels captured before and after the flight [2,9]. The calibrated reflectance-based orthomosaics were subsequently used for vegetation index calculation and analysis of tree growth conditions. Spatial analysis, including contour generation and map visualization, was performed using Global Mapper (Blue Marble Geographics, Hallowell, ME, USA, version 24).
2.3. Individual Tree Delineation and NDVI Calculation
Individual tree delineation (ITD) was performed based on high-resolution RGB orthomosaic imagery acquired using a DJI Matrice 30 UAV. Trees with clearly distinguishable canopy boundaries were manually digitized, and the crown area of each tree was defined as a polygon-based region of interest (ROI).
In cases where tree crowns are adjacent or partially overlapping, automated crown delineation algorithms may produce boundary detection errors, such as over-segmentation or under-segmentation [10]. Therefore, to ensure delineation accuracy and minimize errors in subsequent analyses, a manual delineation approach was adopted [9]. While this approach is time-consuming, it provides a reliable reference for precise analysis. Future work will focus on developing and applying AI-based methods for automated crown detection.
The generated crown polygons were spatially co-registered with the multispectral orthomosaic constructed in the same coordinate system. Zonal statistics were then applied to extract pixel values within each crown polygon, and the mean reflectance values were used to calculate vegetation indices at the individual-tree level. To reduce variability caused by shadows and internal canopy structure, the mean value of pixels within each crown was used, which is a widely adopted approach in individual-tree-level vegetation analysis [8,11]. An example of individual tree delineation is shown in Figure 3.
Figure 3.
Example of individual tree delineation using RGB orthophoto.
The Normalized Difference Vegetation Index (NDVI) was calculated to quantitatively assess vegetation growth conditions. NDVI is defined using the near-infrared (NIR) and red spectral bands as follows [1]:
NDVI = (NIR − Red)/(NIR + Red).
NDVI was calculated using Equation (1). To minimize the influence of soil and non-vegetation areas, pixels with NDVI values lower than 0.2 were considered non-vegetation and excluded from the analysis. This threshold is widely used to distinguish vegetation from bare soil and background noise, as low NDVI values typically correspond to non-vegetated surfaces such as soil, shadows, or built areas [12,13].
2.4. Statistical Analysis and Threshold Determination
Statistical analyses were conducted to evaluate differences in NDVI between healthy and stressed trees. The normality of NDVI distributions for both groups was first assessed using the Shapiro–Wilk test. Differences in mean NDVI between the two groups were tested using Welch’s independent two-sample t-test, which accounts for unequal variances and is widely used in ecological data analysis [14]. The significance level was set at α = 0.05 for all statistical tests. In addition, Cohen’s d was calculated to quantify the effect size of the difference between the two groups [15].
To evaluate the classification performance of NDVI for distinguishing healthy and stressed trees, receiver operating characteristic (ROC) curve analysis was performed. The area under the ROC curve (AUC) was used as a measure of classification accuracy, and the optimal NDVI threshold was determined using Youden’s index, which maximizes the sum of sensitivity and specificity [16].
All statistical analyses and visualizations were performed using R software (Foundation for Statistical Computing, Vienna, Austria, version 4.1.0) and SPSS (IBM Corp., Armonk, NY, USA, version 26.0).
2.5. External Validation Design
To evaluate the generalizability of the NDVI-based classification threshold derived in this study, an independent validation site was selected in addition to the main study area. The validation site is a separate chestnut (Castanea crenata) orchard located approximately 1 km from the main site and managed by the same operator. Both sites maintain similar fertilization and pest management practices, providing comparable environmental conditions. To ensure data consistency, the same UAV platform and multispectral sensor used in the main study area were applied to the validation site. The flight conditions were also kept identical, with an altitude of approximately 100 m above ground level (AGL), a forward overlap of 85%, and a side overlap of 80% [6,17].
The acquired imagery was processed using the same workflow, including radiometric calibration, to generate multispectral orthomosaics. The optimal NDVI threshold derived from the main study area was then applied to the validation dataset to evaluate classification performance. Independent validation is a critical step for assessing the spatial transferability of remote sensing-based classification models in new areas. Therefore, this study further evaluates the practical applicability and robustness of the proposed NDVI-based classification approach through independent external validation.
2.6. Disclosure of Generative AI Usage
ChatGPT (OpenAI, San Francisco, CA, USA; version GPT-5) was used solely for English translation, language editing, and minor assistance in the preparation of the graphical abstract. AI was not used for study design, data collection, analysis, interpretation, or the generation of scientific results. All scientific content, analyses, and conclusions were developed and validated by the authors, who take full responsibility for the integrity of the work.
3. Results
3.1. NDVI Distribution and Group Comparison
NDVI values derived from UAV-based multispectral imagery were used to analyze vegetation vigor at the individual-tree level in the chestnut (Castanea crenata) orchard. The results revealed clear differences in NDVI distribution between healthy (n = 100) and stressed (n = 23) trees. The mean NDVI of healthy trees was 0.900 ± 0.012, indicating consistently high vegetation vigor across the canopy, whereas stressed trees exhibited a lower mean NDVI of 0.816 ± 0.013. Welch’s t-test confirmed that the difference in mean NDVI between the two groups was statistically significant (p < 0.001), with a very large effect size (Cohen’s d = 5.3). The distribution of NDVI values for individual trees is shown in Figure 4, and the descriptive statistics for both groups are summarized in Table 2.
Figure 4.
Distribution of NDVI values for individual Castanea crenata Sieb. et Zucc. trees.
Table 2.
Comparison of NDVI between healthy and stressed trees.
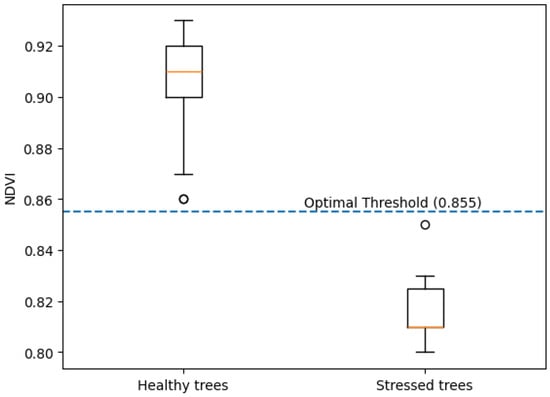
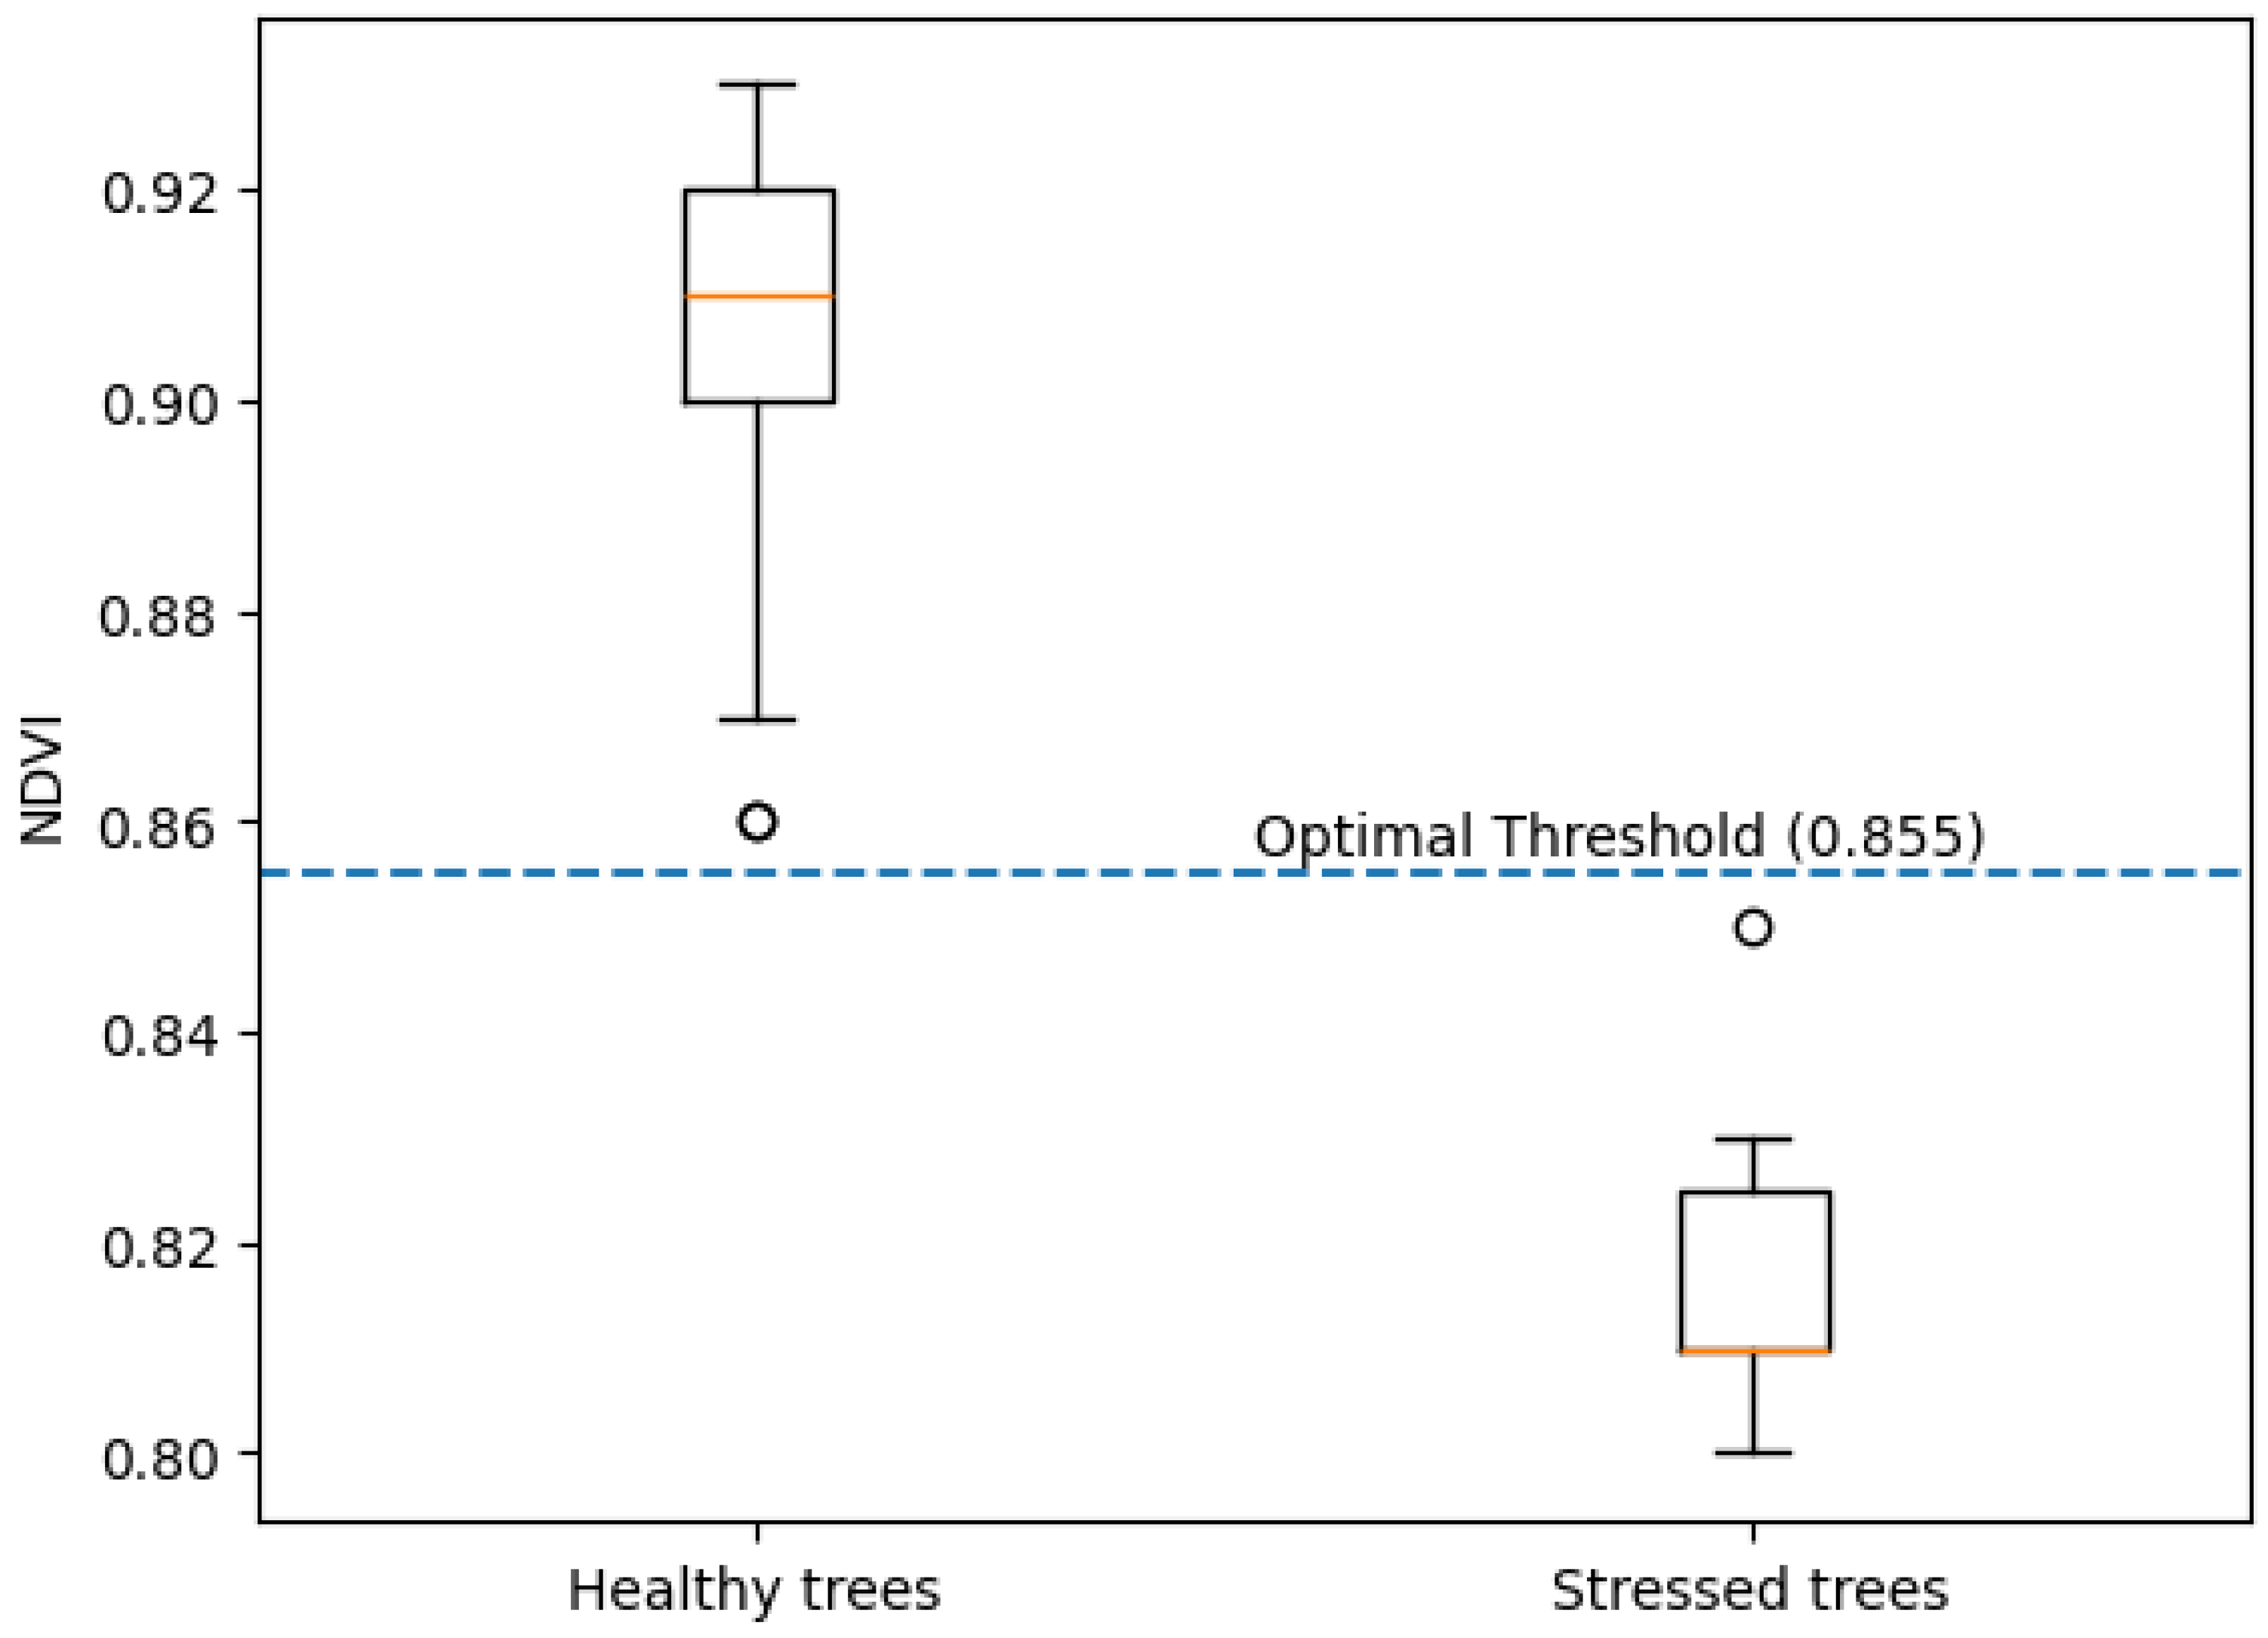
To further compare the NDVI distributions visually, boxplots were generated (Figure 5). Healthy trees were predominantly distributed within a higher NDVI range, whereas stressed trees showed a lower NDVI distribution, indicating a clear separation between the two groups.
Figure 5.
Boxplots of NDVI values for healthy and stressed chestnut trees. The central line represents the median, the box indicates the interquartile range, the whiskers represent the data range, circles indicate outliers, and the dashed line represents the optimal NDVI threshold (0.855).
3.2. ROC Analysis and Optimal NDVI Threshold Determination
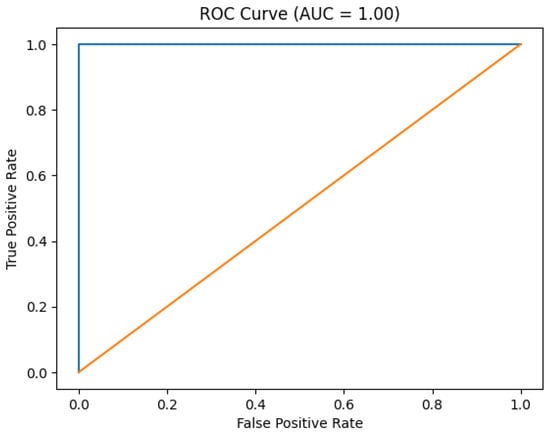
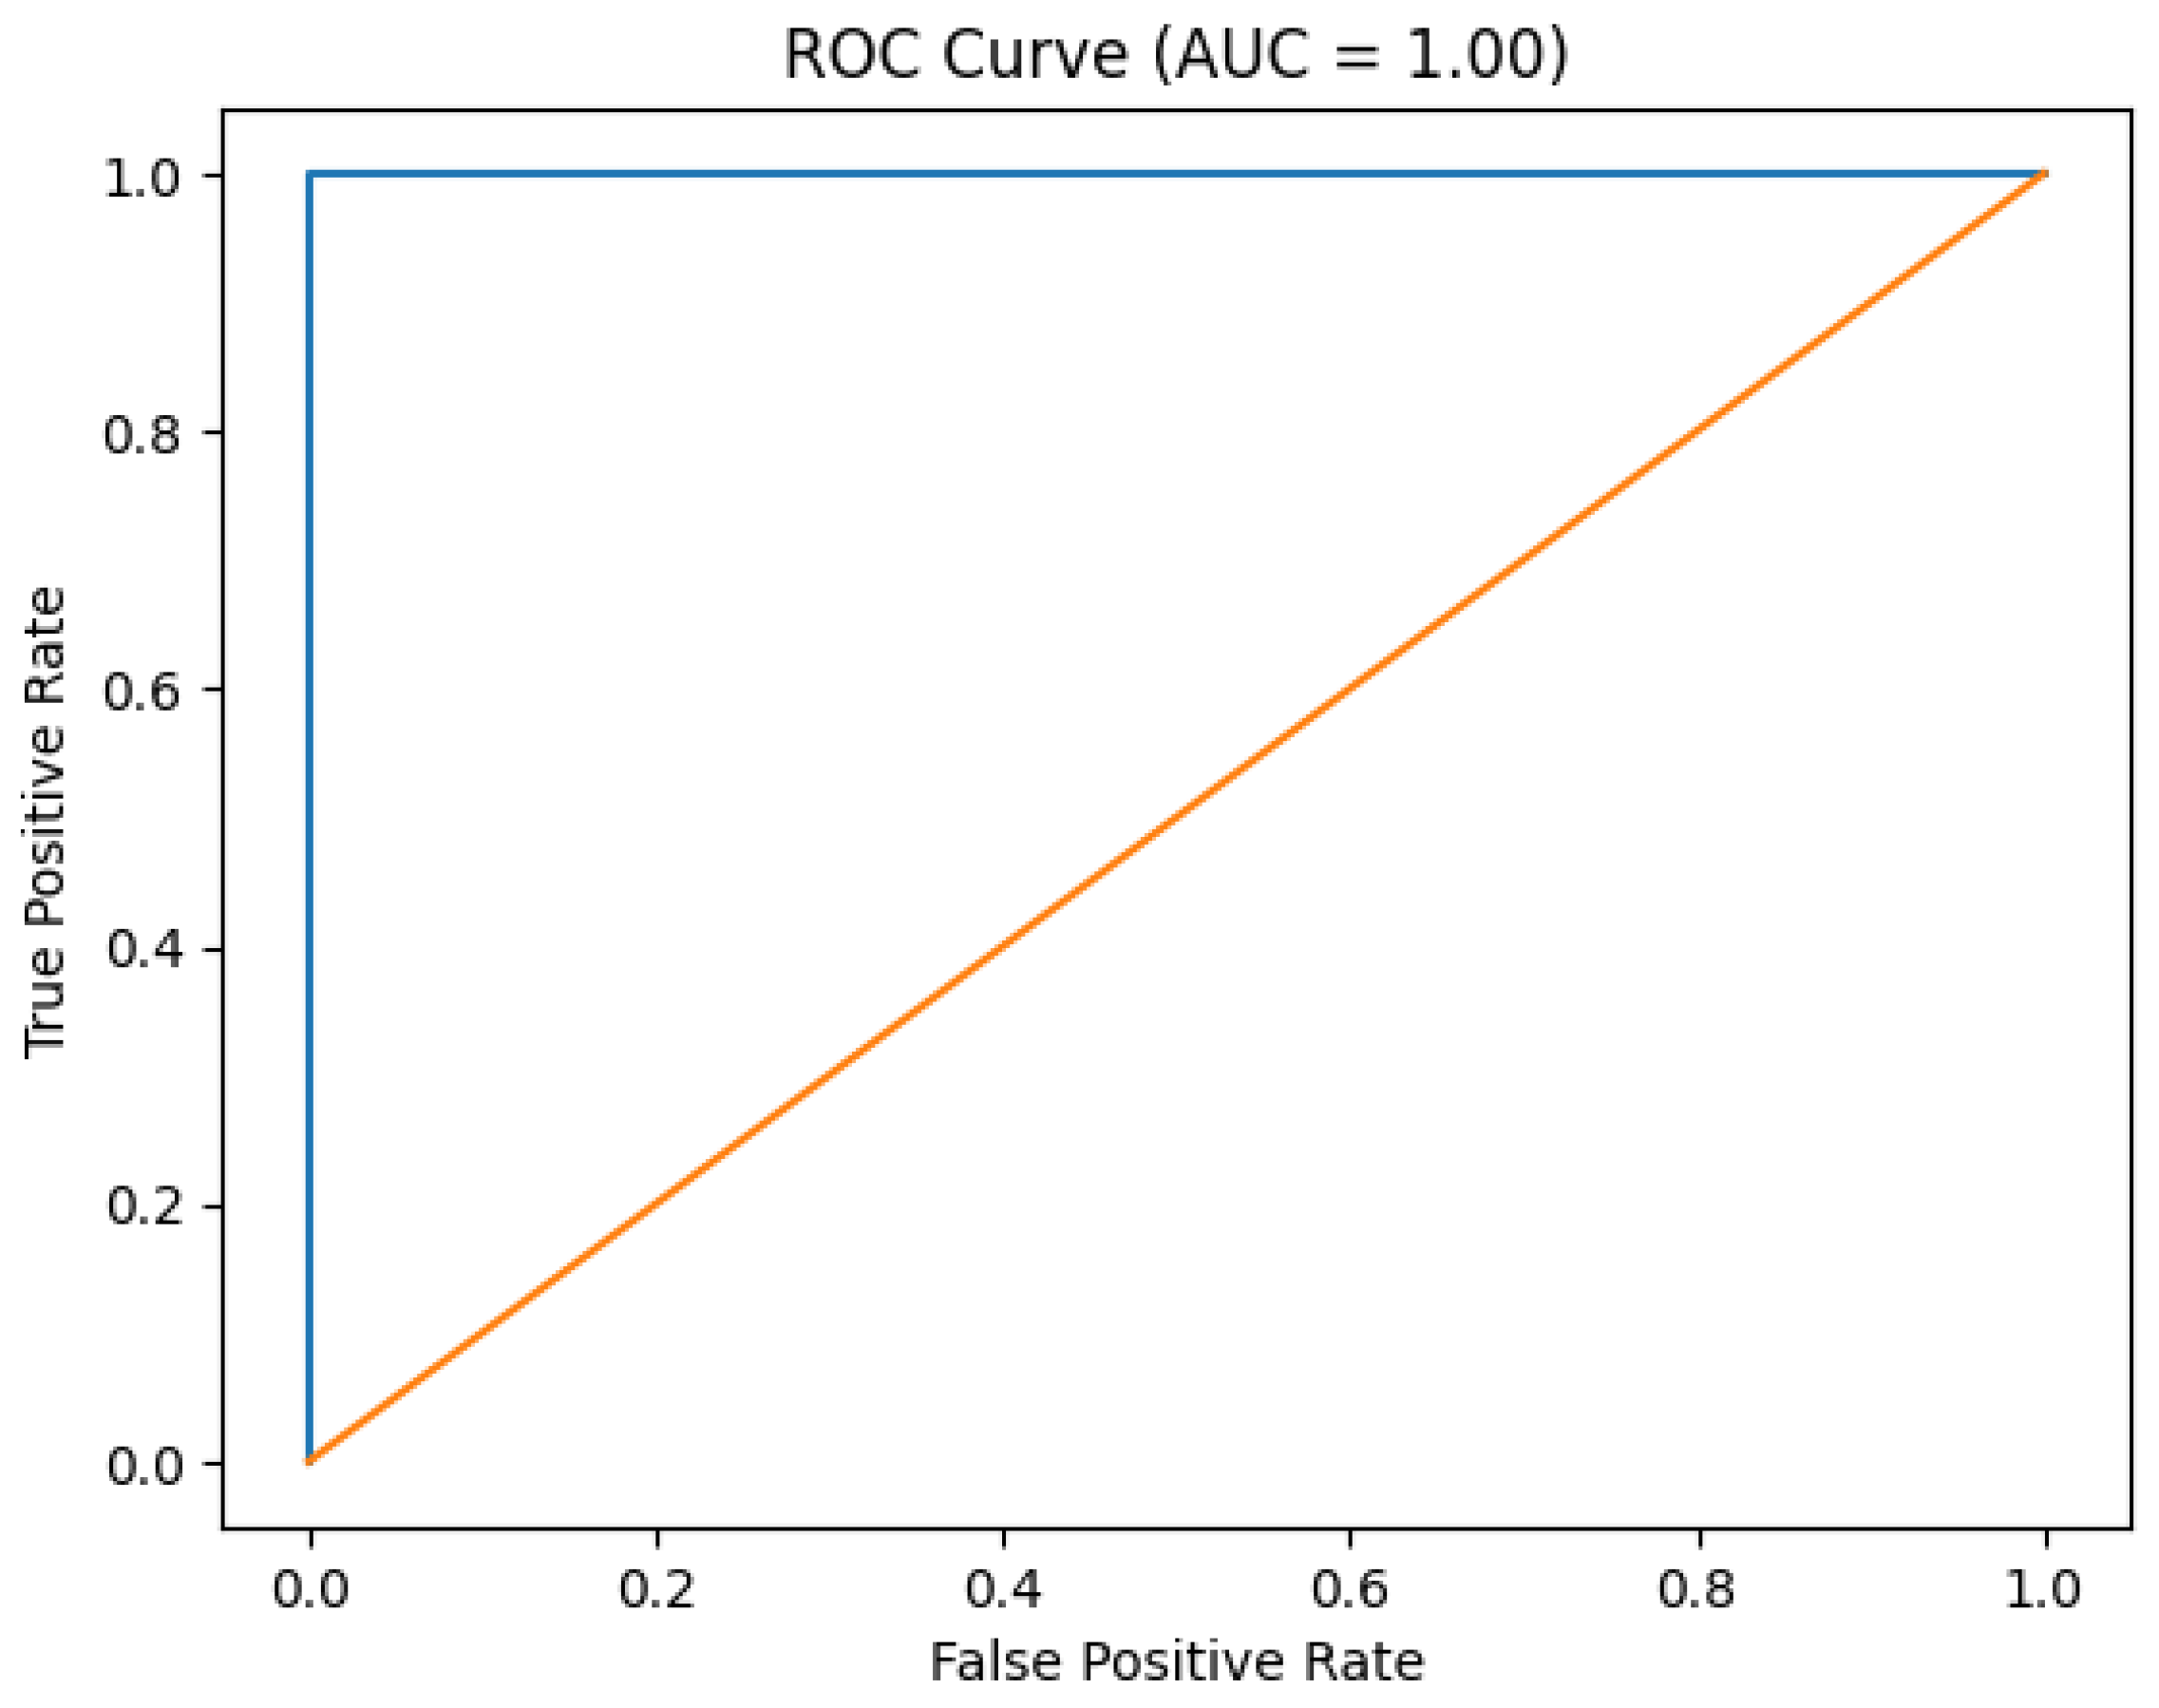
Receiver operating characteristic (ROC) curve analysis was performed to quantitatively evaluate the discriminative performance of NDVI in classifying healthy and stressed trees. The results showed that the area under the curve (AUC) was 1.00, indicating near-perfect classification performance. The optimal NDVI threshold was determined to be 0.855 using Youden’s index, which maximizes the combination of sensitivity and specificity.
Using this threshold, the classification achieved a sensitivity of 1.00 for stressed trees and a specificity of 1.00 for healthy trees, demonstrating perfect separation between the two groups. The ROC curve for the NDVI-based classification is presented in Figure 6.
Figure 6.
ROC curve of NDVI for classifying healthy and stressed chestnut trees.
The ROC analysis yielded an AUC value of 1.00, indicating perfect classification performance. This result is primarily attributed to the clear separation between NDVI values of healthy and stressed trees observed in the dataset, with no overlap between the two groups.
It should be noted that the number of stressed samples (n = 23) is relatively limited compared to the healthy samples (n = 100), which may have influenced the ideal AUC value. However, this result is also consistent with the strong sensitivity of multispectral reflectance to variations in chlorophyll content and vegetation condition.
To further address potential concerns regarding overfitting or sample size bias, the same NDVI threshold was applied to an independent dataset from a separate chestnut orchard located in Gongju-si, Republic of Korea. The consistently high classification accuracy observed in this independent validation supports the robustness of the model and suggests that the AUC of 1.00 reflects the strong discriminative capability of NDVI under the given conditions rather than a statistical artifact.
3.3. Spatial Distribution of NDVI and Detection Results
The spatial distribution of NDVI derived from UAV-based multispectral imagery clearly revealed physiological differences between healthy and stressed chestnut (Castanea crenata) trees at the individual-tree level. Across the study area (approximately 21 ha), most trees exhibited NDVI values higher than 0.88, indicating high canopy vigor and active photosynthesis. These healthy trees appeared as relatively homogeneous high-NDVI regions in the imagery, with clearly distinguishable crown boundaries.
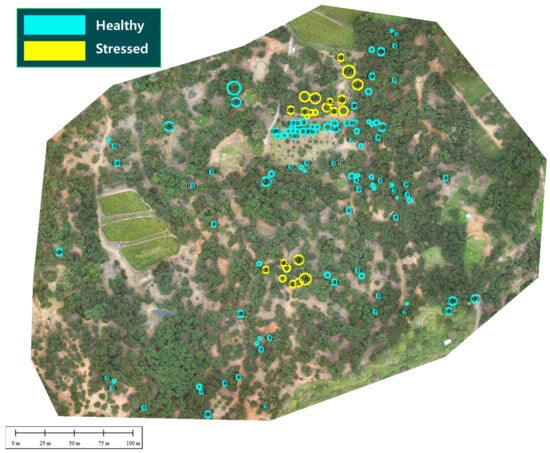
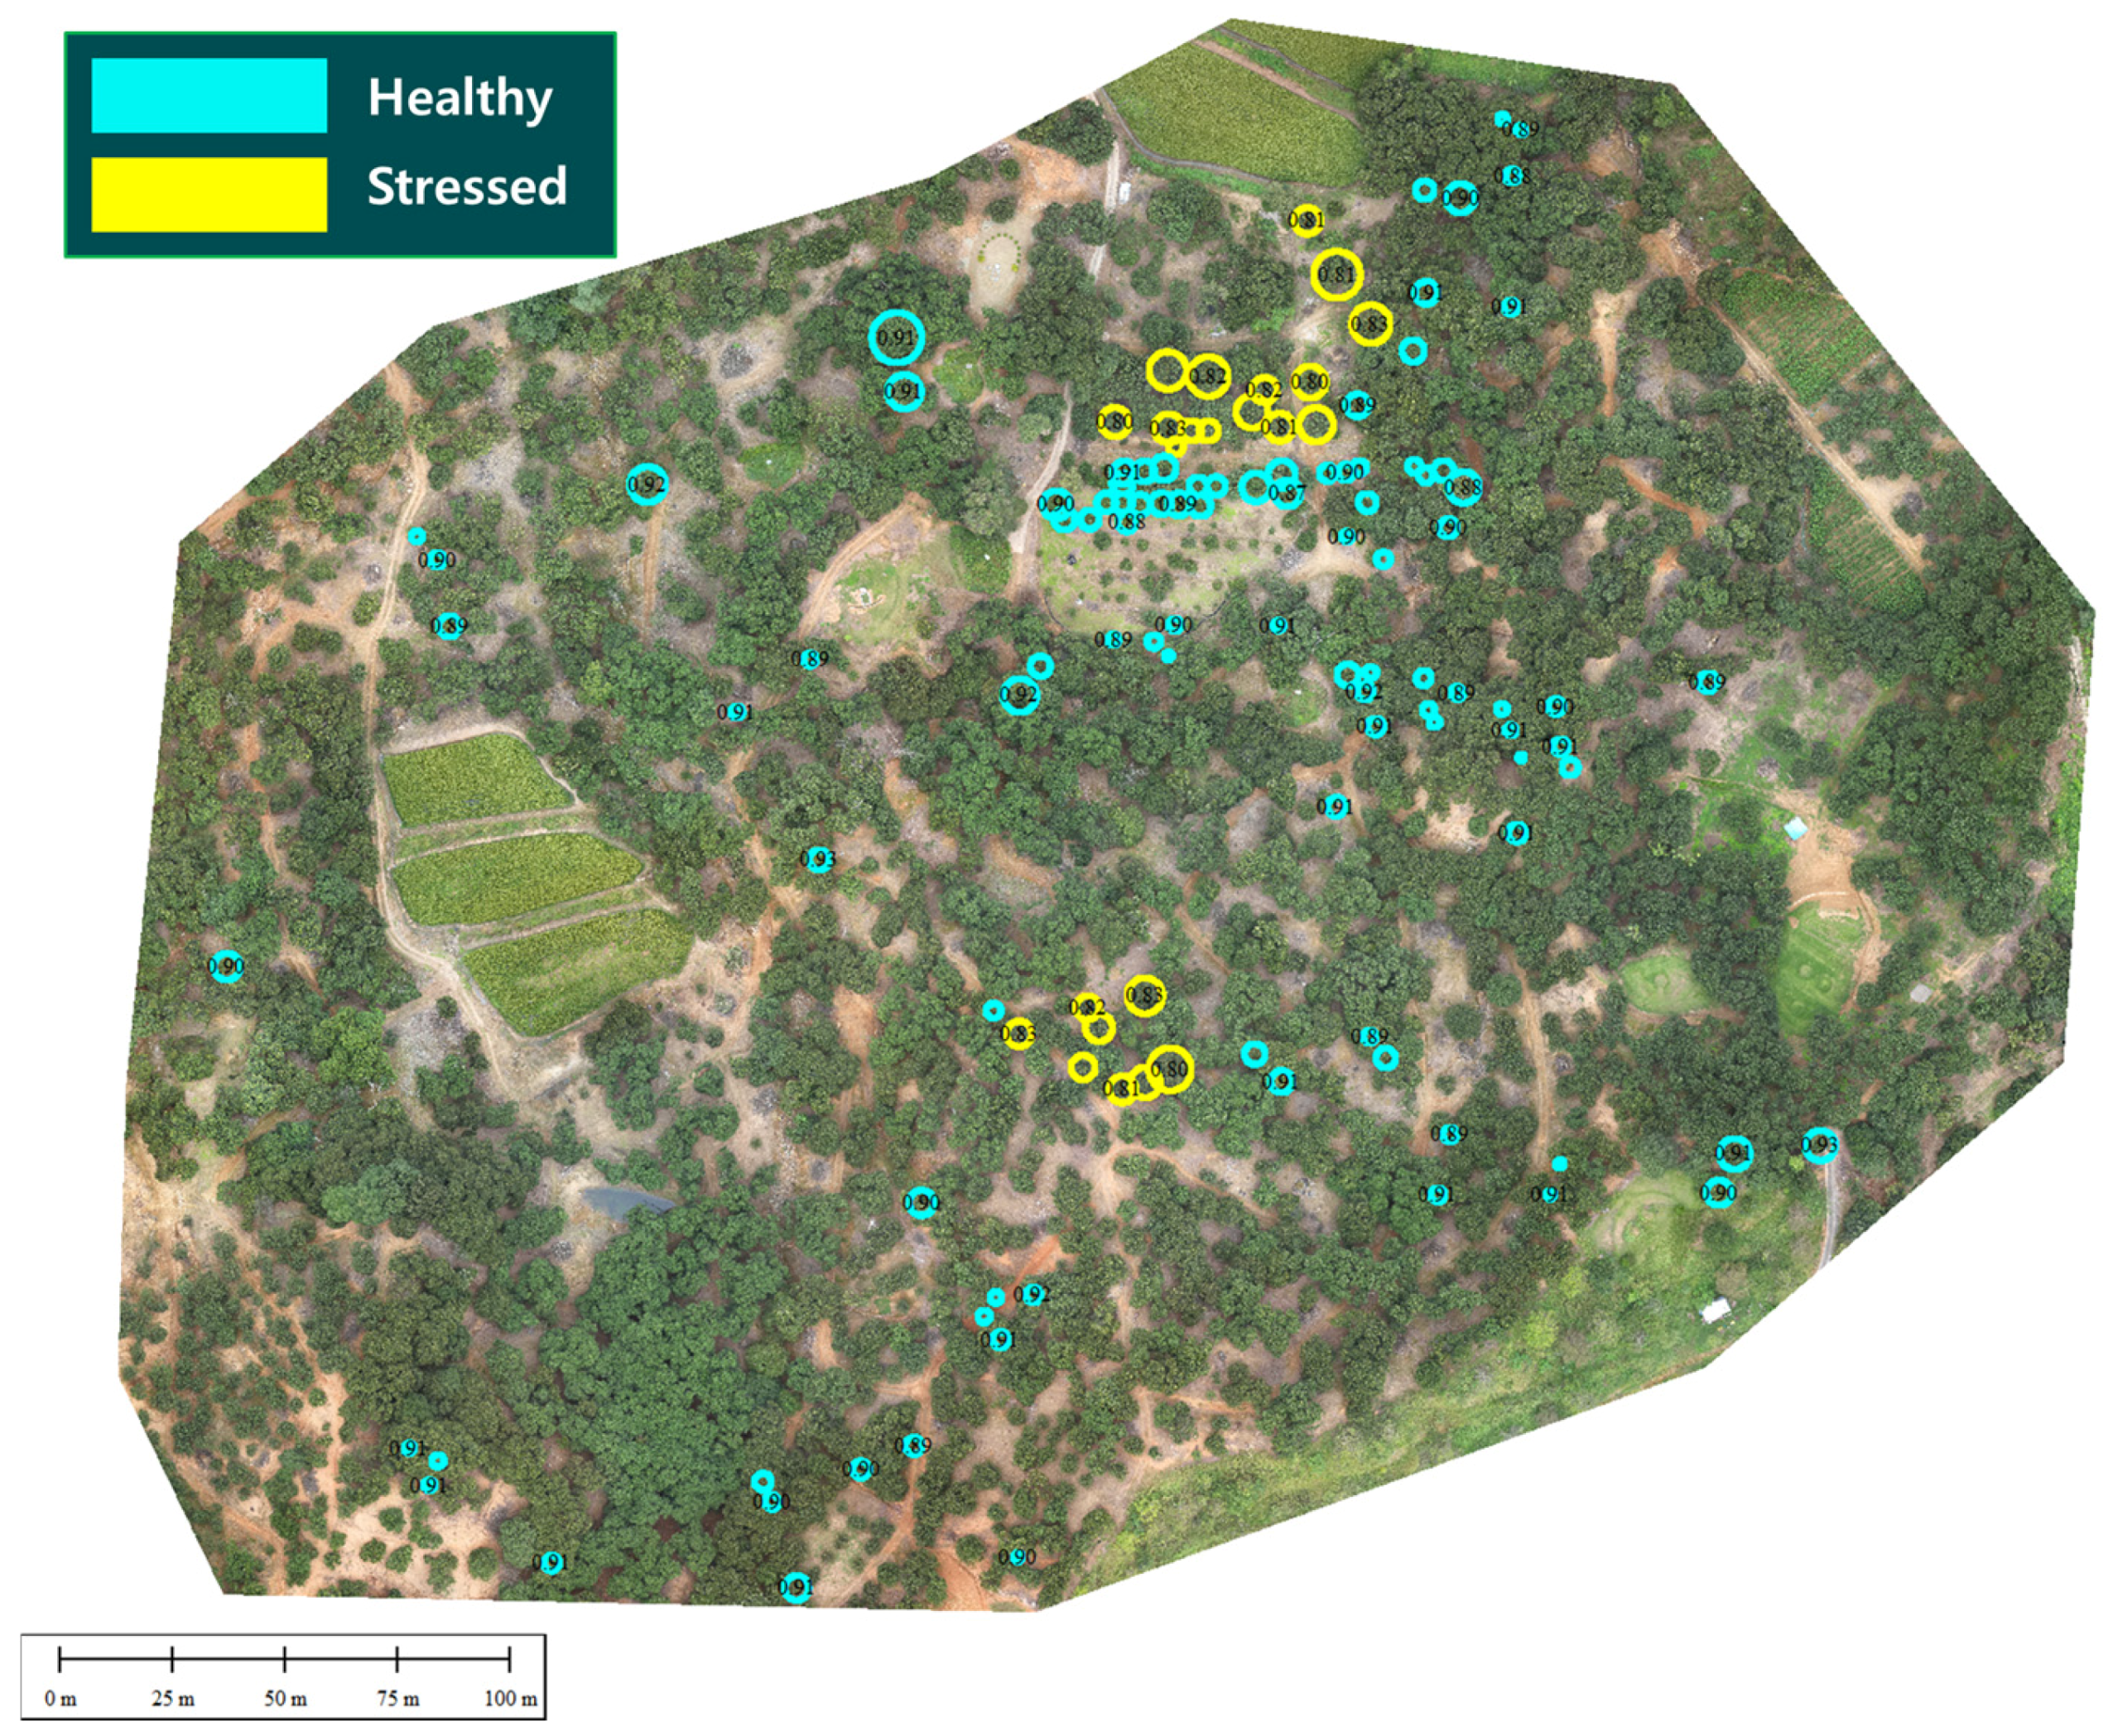
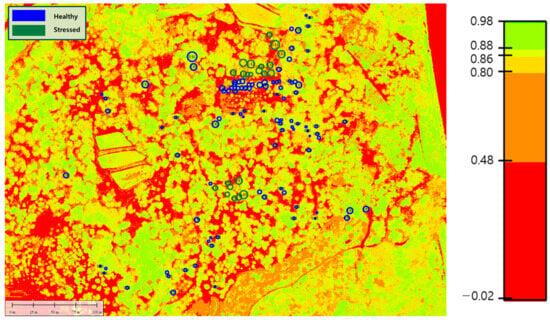
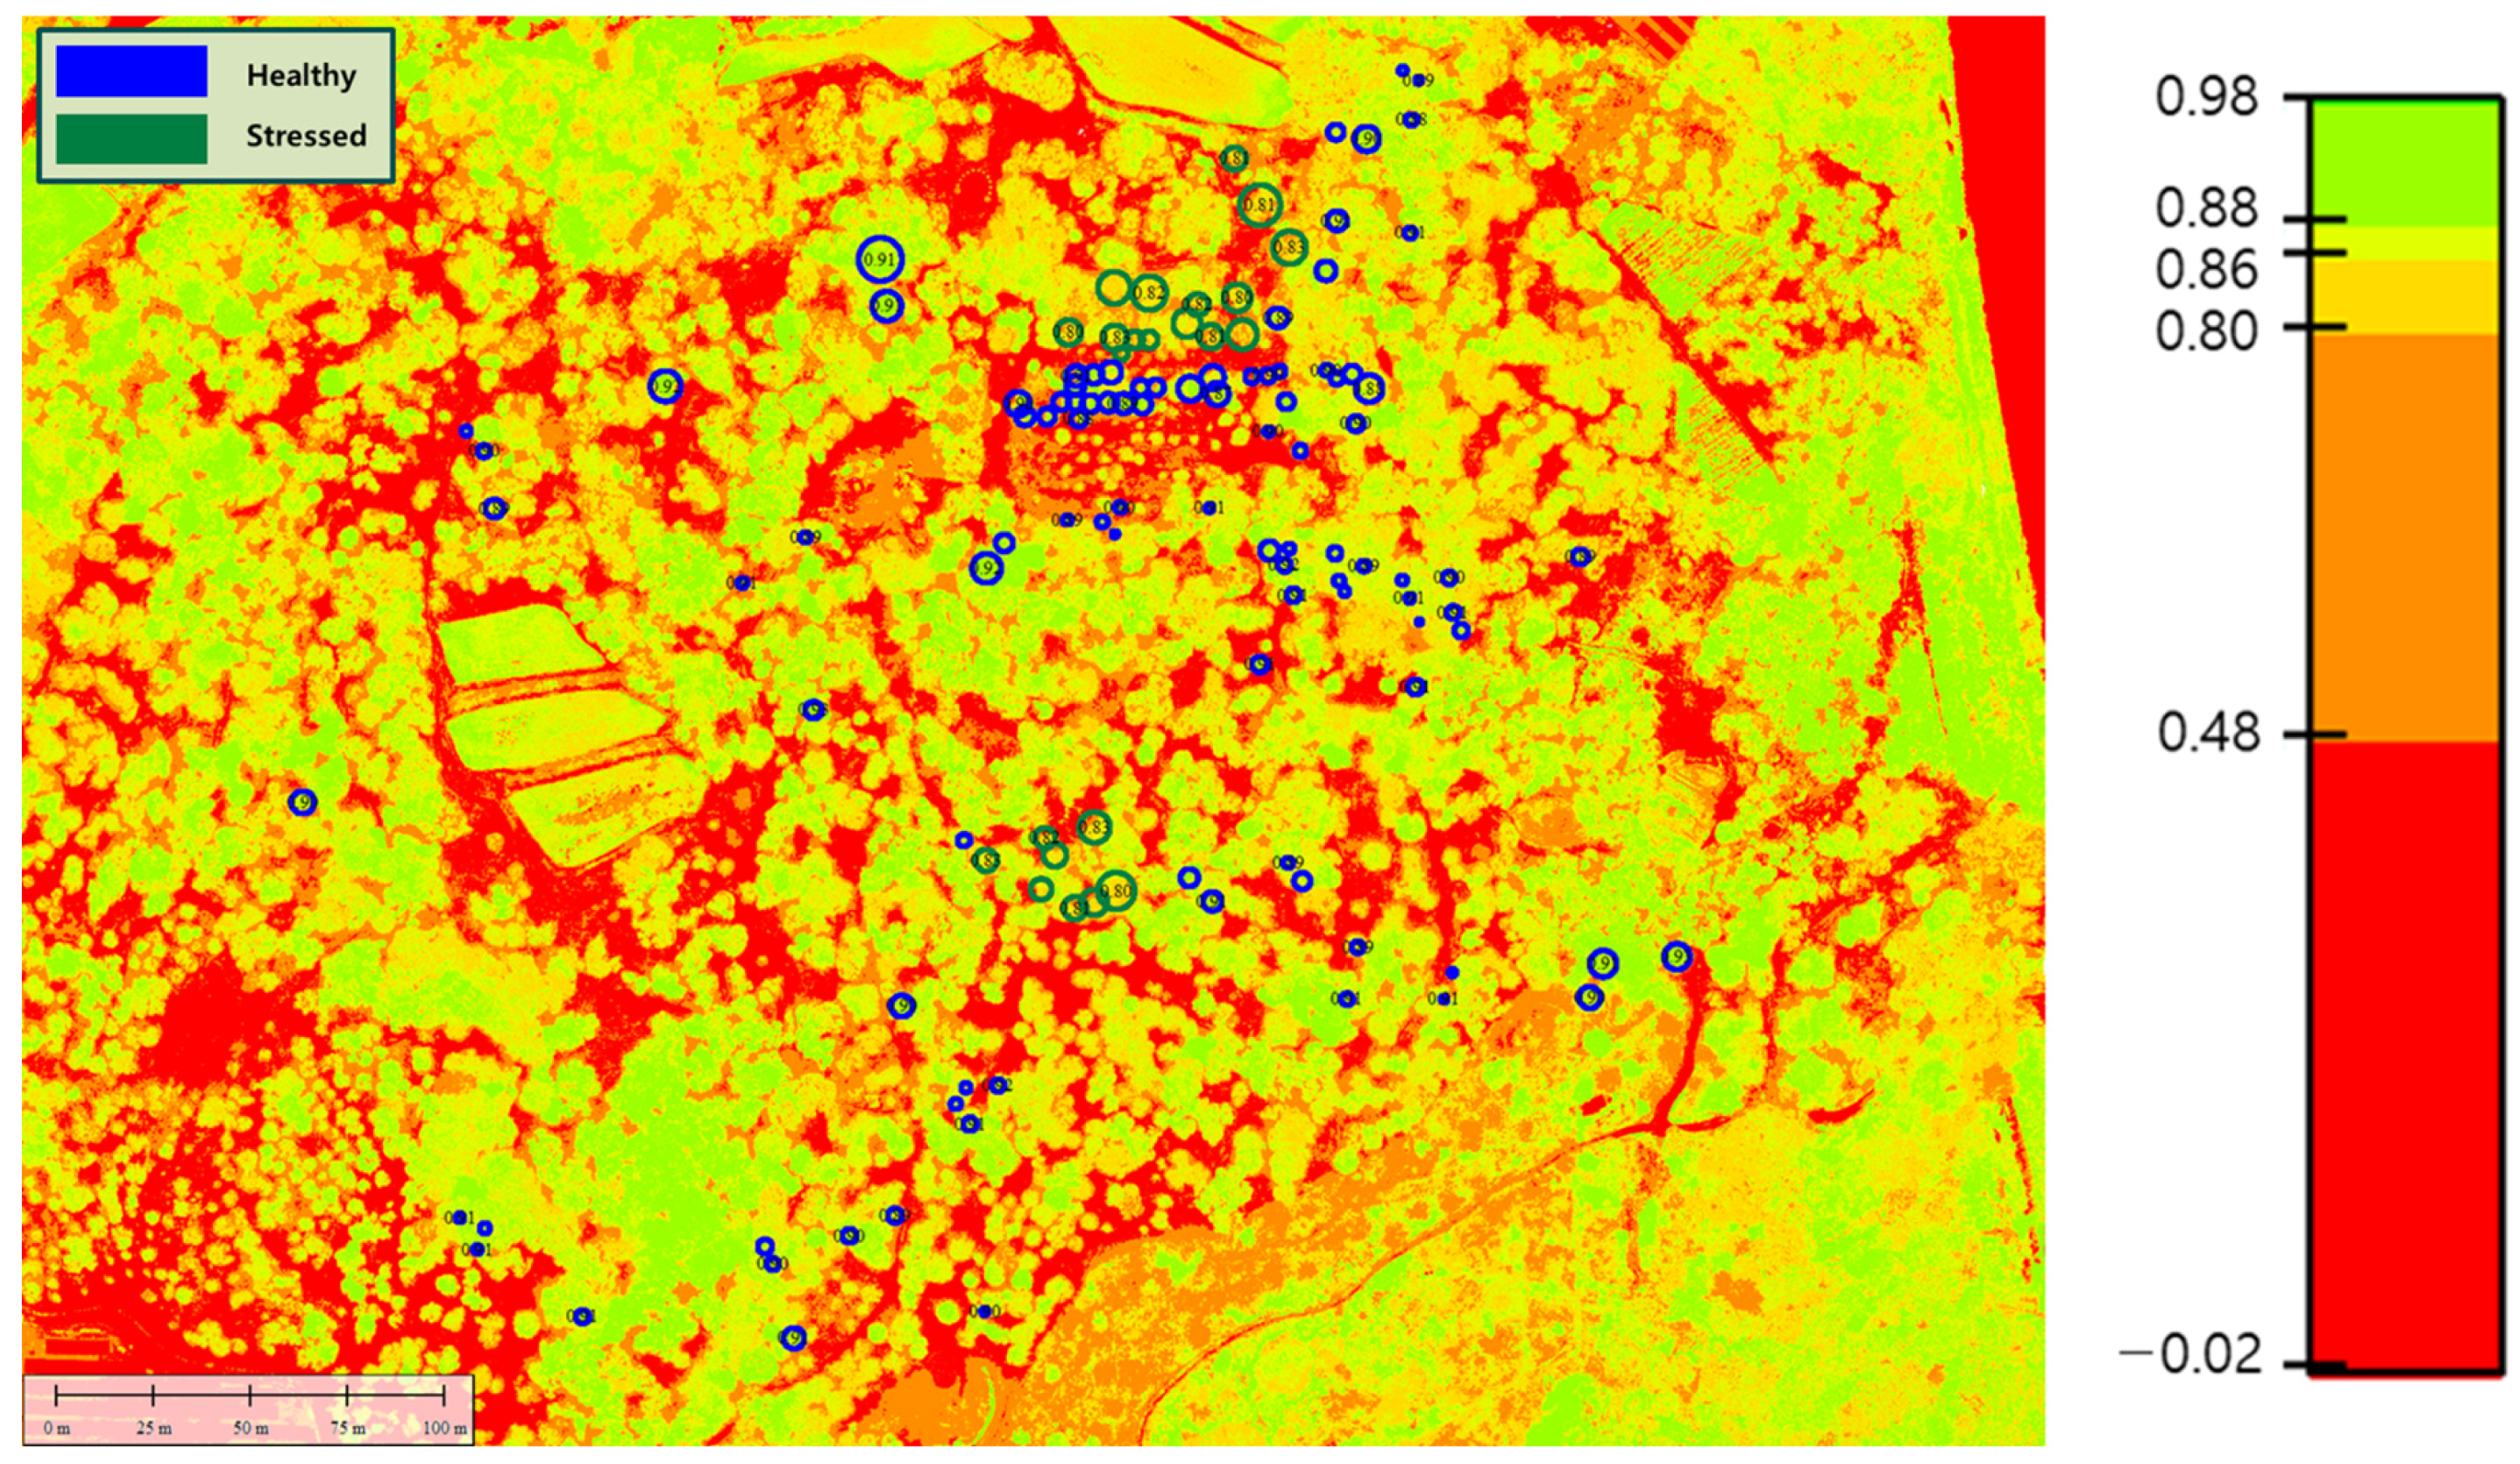
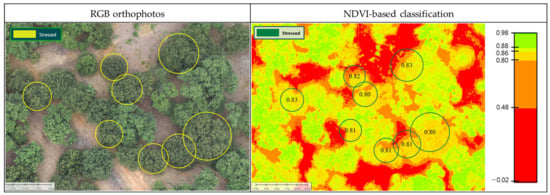
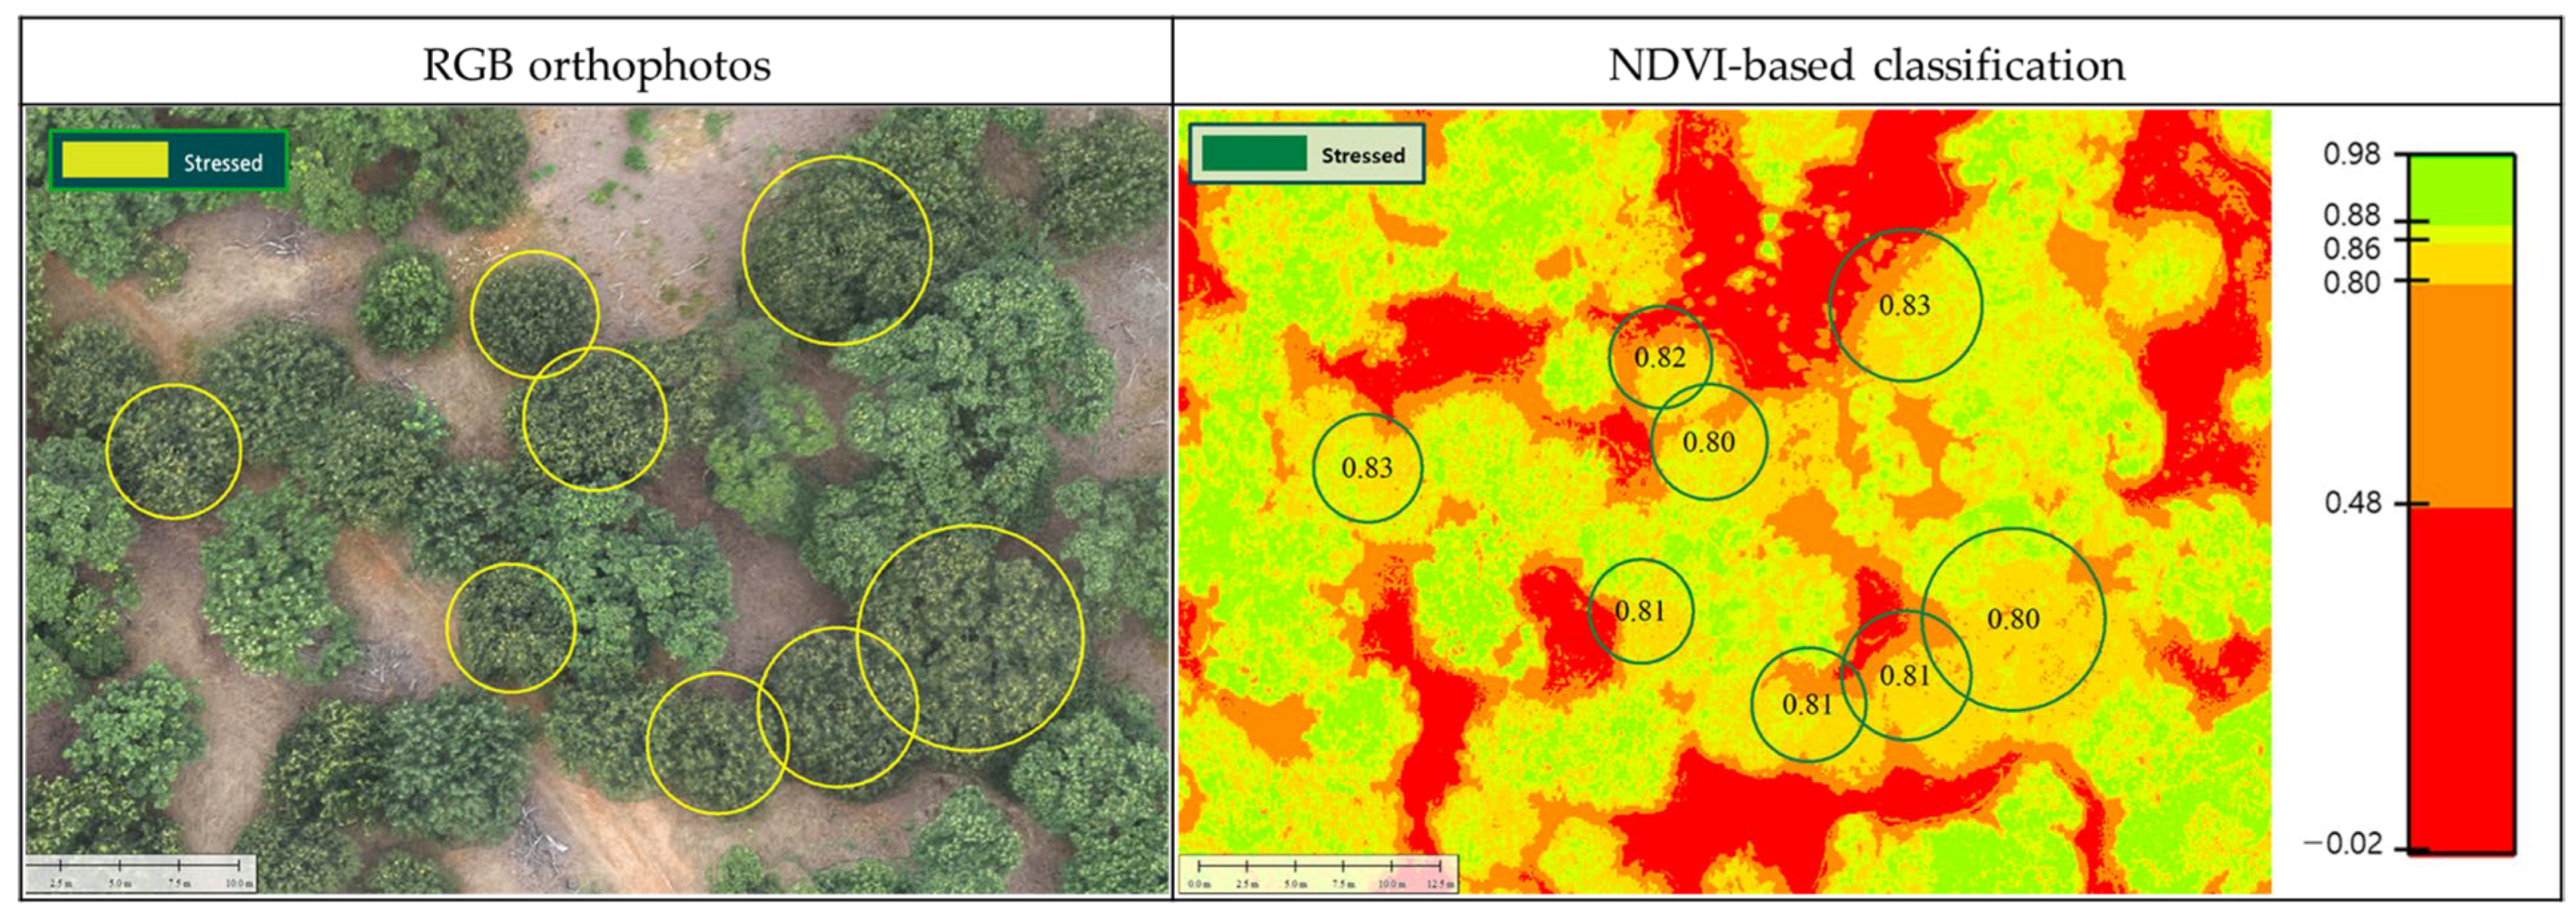
In contrast, trees identified as stressed during field surveys consistently showed lower NDVI values. All stressed trees (n = 23) were distributed below the optimal NDVI threshold of 0.855 (range: 0.80–0.85) derived from ROC analysis. No overlap in NDVI values was observed between healthy trees (0.86–0.93) and stressed trees, indicating complete separability between the two groups. This pattern is further supported by the comparison between RGB orthomosaics and NDVI-based classification results shown in Figure 7, where trees exhibiting chlorosis or reduced canopy density in RGB imagery correspond spatially to areas with lower NDVI values. These results demonstrate that UAV-based NDVI analysis can effectively identify growth-stressed trees at the individual-tree level.
Figure 7.
Comparison between RGB orthomosaic imagery and NDVI-based classification results for identifying growth-stressed trees.
3.4. Independent External Validation Result
To evaluate the generalizability of the NDVI-based classification threshold derived in this study, independent external validation was conducted at a separate chestnut (Castanea crenata) orchard (Site B) located approximately 1 km from the main study area. NDVI values at the individual-tree level were extracted using the same UAV multispectral sensor and identical image processing workflow applied in the main study area.
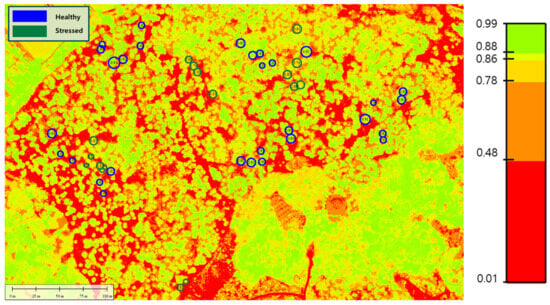
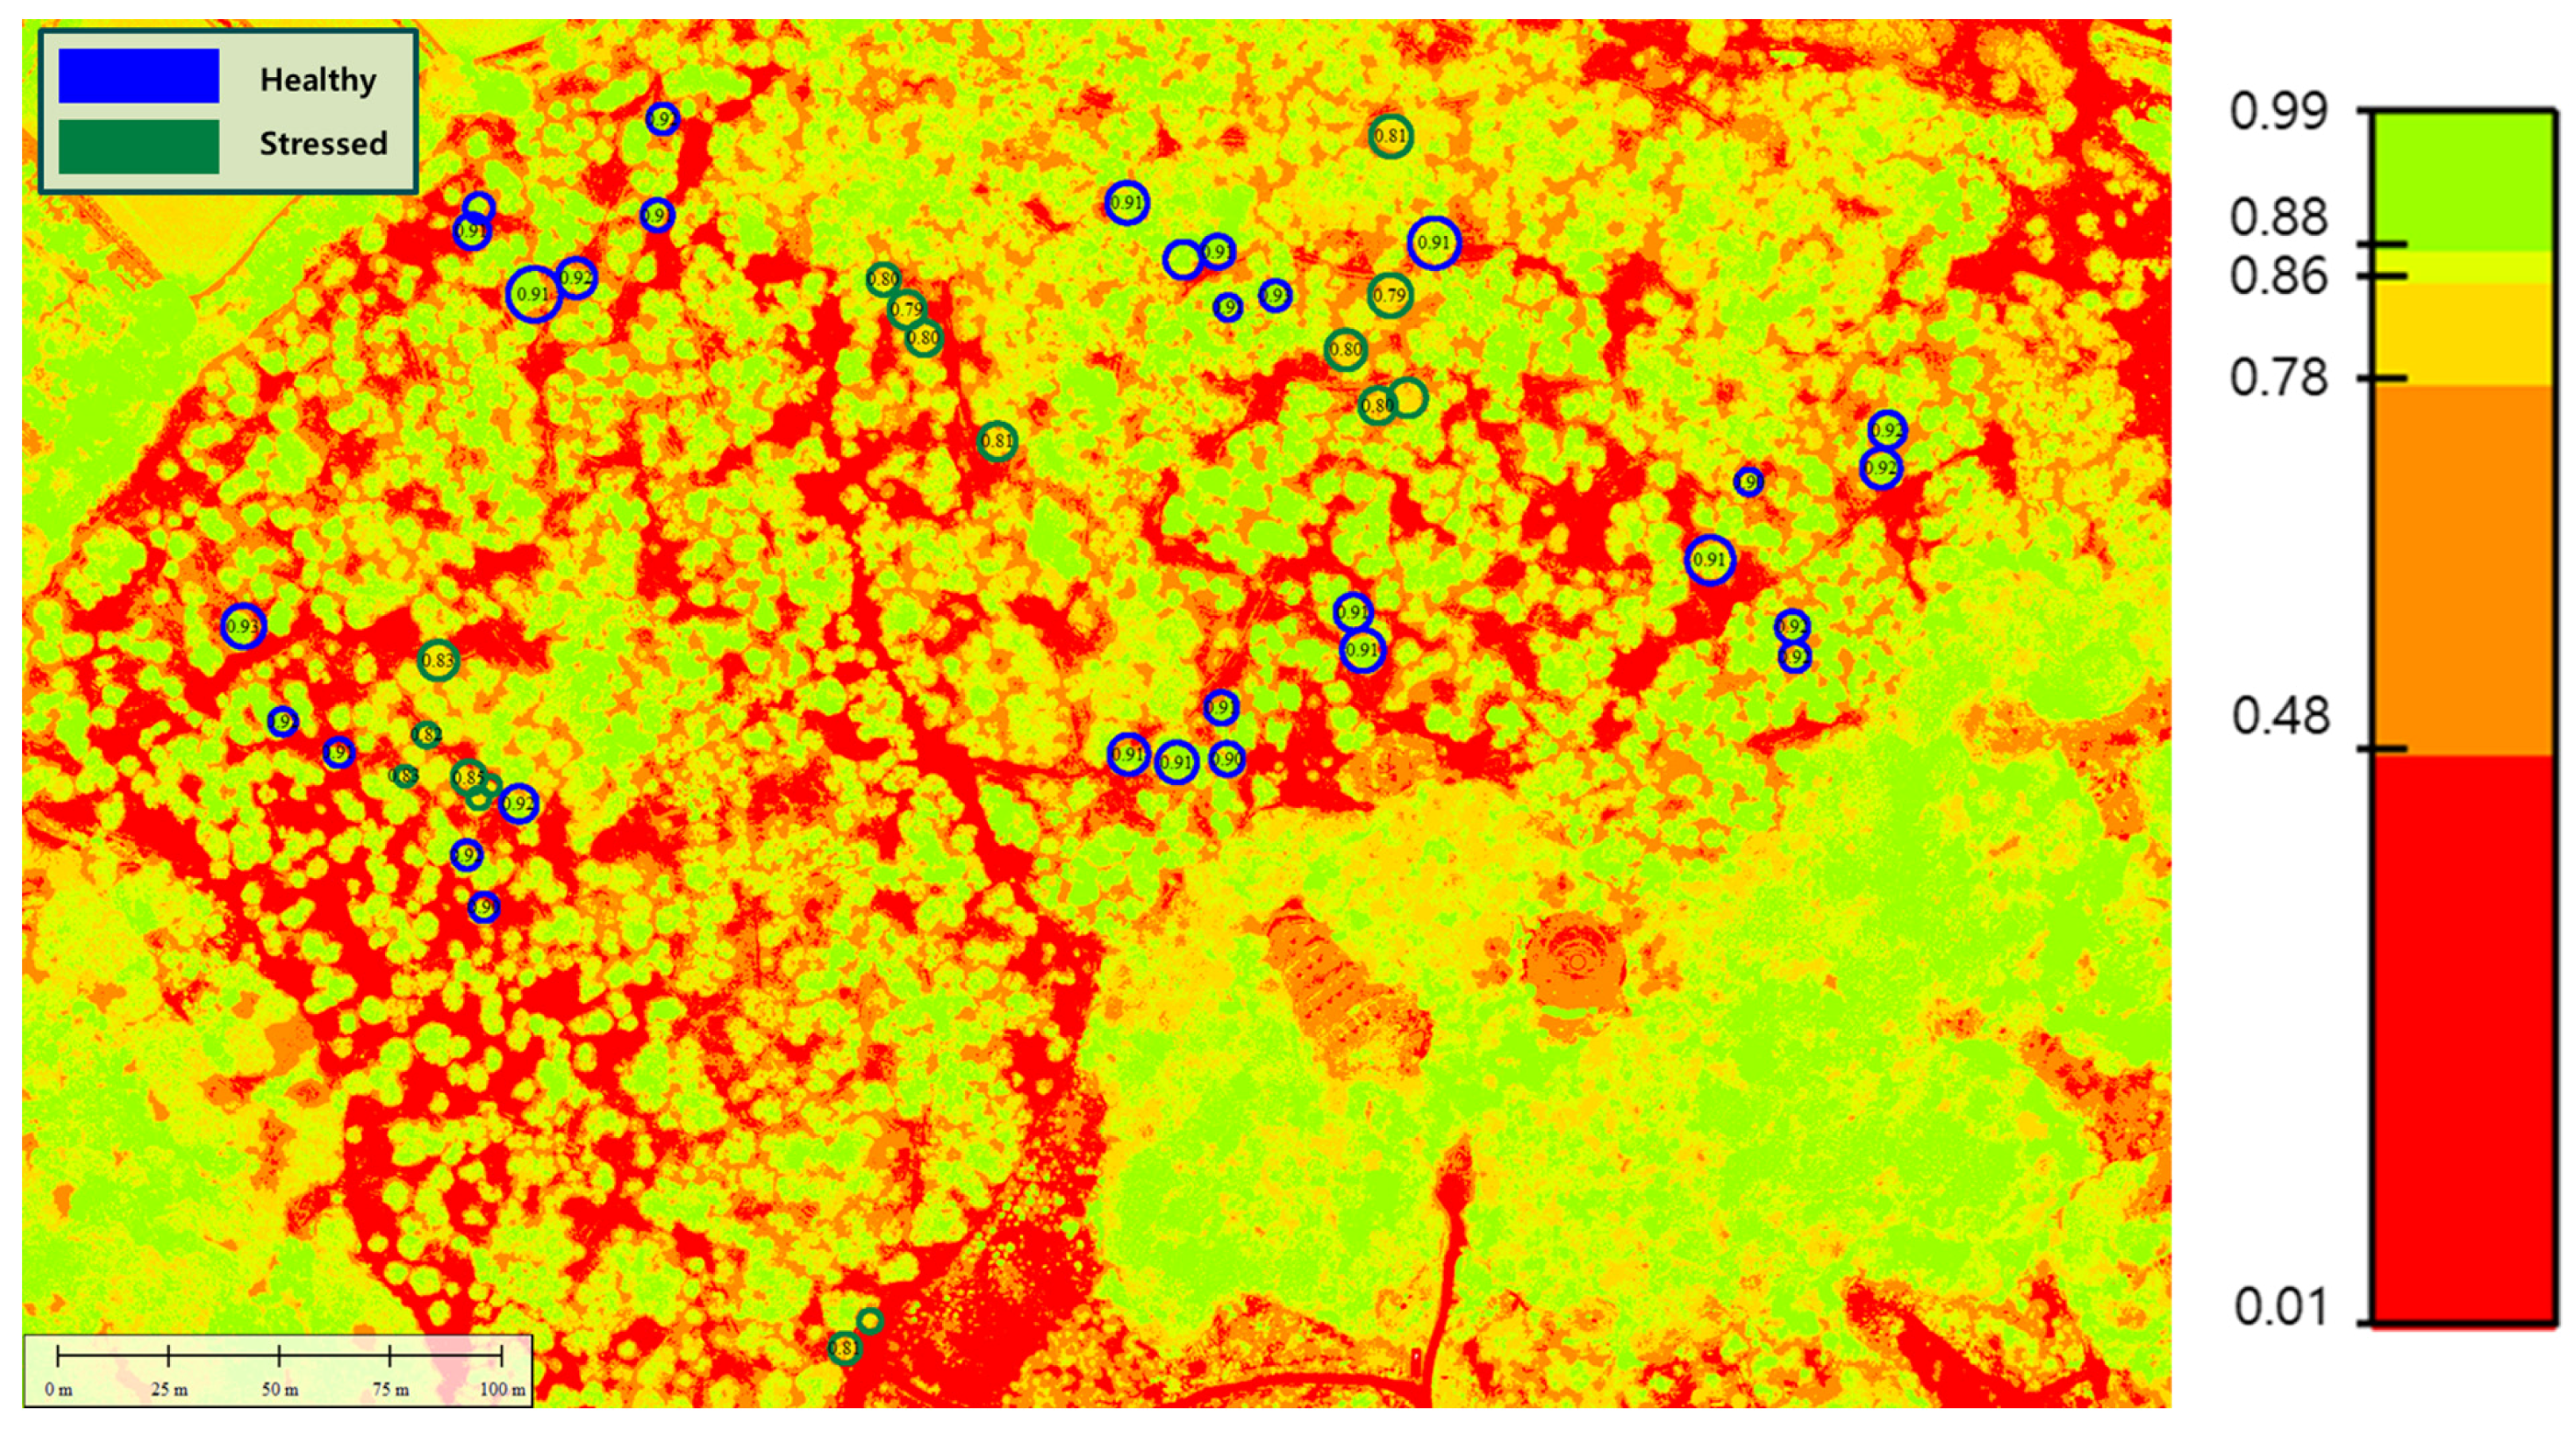
A total of 47 trees, including 30 healthy and 17 stressed individuals, were randomly selected for validation. The NDVI distributions of the two groups exhibited patterns consistent with those observed in the main study area. Healthy trees showed NDVI values in the range of 0.90–0.93, whereas stressed trees were distributed within the range of 0.79–0.85, indicating a clear separation between the two groups, as illustrated in Figure 8. When the optimal NDVI threshold of 0.855 derived from the main study area was applied, all trees were correctly classified without misclassification. Stressed trees consistently exhibited NDVI values below the threshold, while healthy trees showed values above the threshold, with no overlap observed between the two groups.
Figure 8.
Distribution of NDVI values for individual Castanea crenata trees in Site B.
As summarized in the confusion matrix (Table 3), the classification achieved an overall accuracy of 100%. These results demonstrate that the proposed NDVI threshold is robust and can be reliably applied to independent orchards under similar environmental and management conditions.
Table 3.
Confusion matrix for independent external validation using the optimal NDVI threshold.
3.5. Qualitative Validation Based on Field Observations
To evaluate how accurately the NDVI-based classification reflects actual growth conditions in the orchard, field canopy observations were conducted in conjunction with UAV image interpretation. A total of 35 trees, including 20 healthy and 15 stressed individuals randomly selected based on the NDVI classification results, were examined. For each tree, canopy density and leaf color were carefully assessed and compared with the digital classification results.
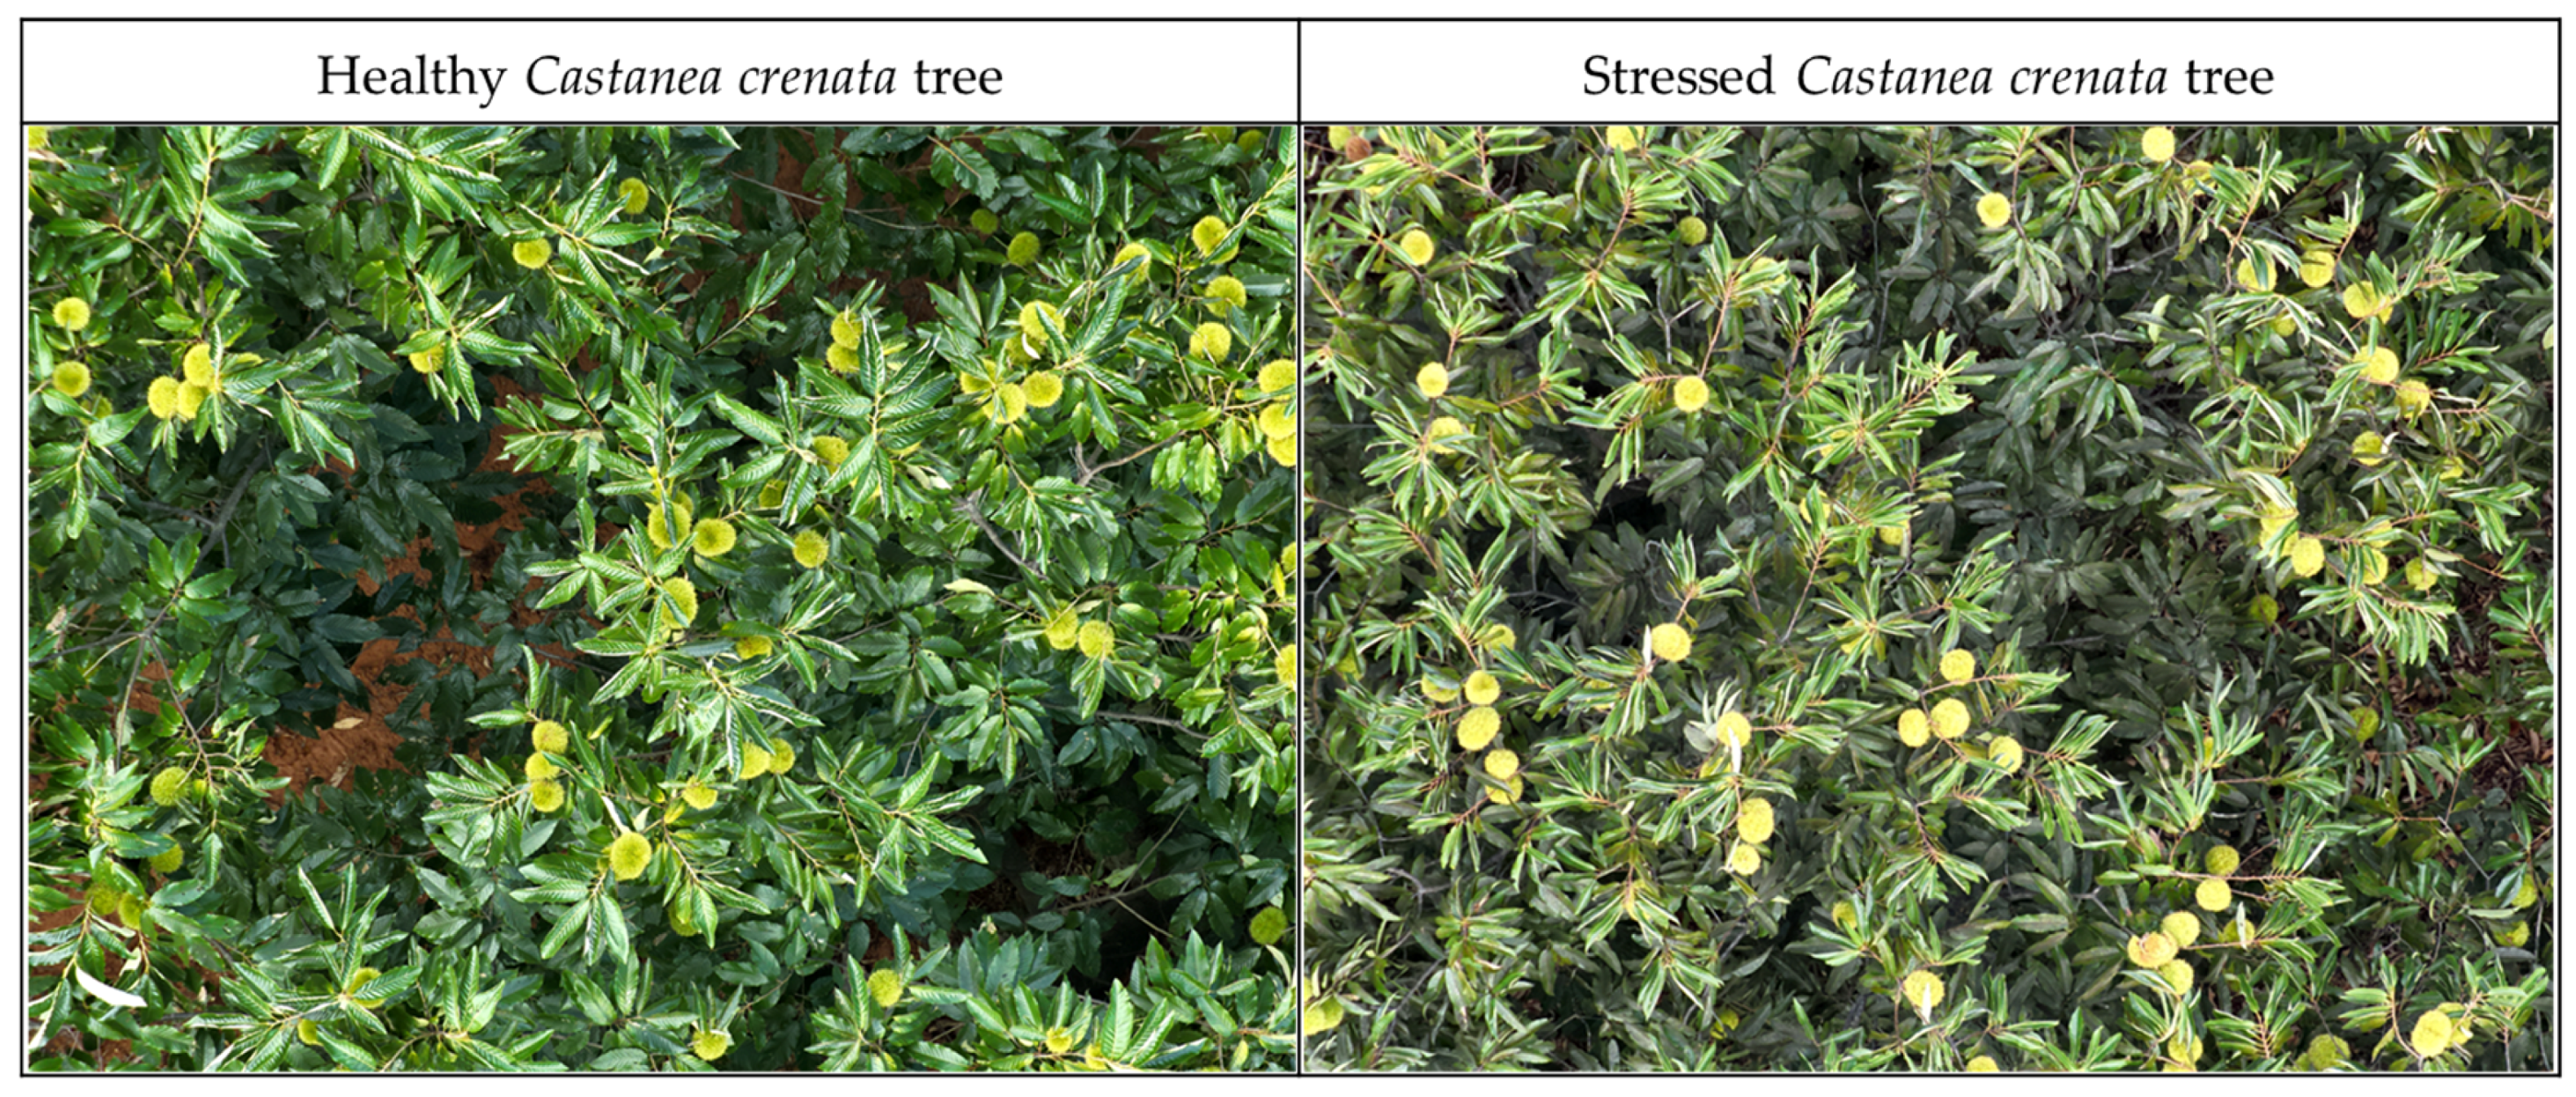
As shown in Figure 9, trees classified as healthy exhibited dense canopies and dark green foliage, indicating vigorous growth, whereas stressed trees showed reduced canopy density and clear symptoms of leaf chlorosis. A confusion matrix comparing the NDVI-based classification with field observations is presented in Table 4. All 35 trees were correctly classified without misclassification, resulting in an overall accuracy of 100%. These results indicate that the NDVI threshold of 0.855 provides a highly reliable criterion for distinguishing the growth conditions of chestnut (Castanea crenata) trees in real orchard environments.
Figure 9.
UAV aerial photographs of healthy and stressed Castanea crenata trees.
Table 4.
Confusion matrix comparing NDVI-based classification with field observations.
4. Discussion
The results of this study demonstrate that UAV-based multispectral imagery is a highly effective tool for the quantitative detection of growth stress at the individual-tree level in chestnut (Castanea crenata) orchards. The marked difference in NDVI between healthy (0.900 ± 0.012) and stressed trees (0.816 ± 0.013), supported by a very large effect size (Cohen’s d = 5.3), indicates a clear physiological distinction. These findings confirm that NDVI can serve as a robust quantitative indicator for identifying early-stage growth stress in chestnut trees. These findings are also consistent with previous studies demonstrating the effectiveness of UAV-based high-resolution imagery for individual tree analysis and stress detection in orchard environments [18,19]. In particular, recent studies have shown that UAV-based approaches can accurately detect tree-level variations using both traditional and deep learning-based methods.
This strong discriminative capability is further evidenced by the ROC analysis (AUC = 1.00) and the consistent 100% classification accuracy across both internal and independent external validations. While the classification performance achieved near-perfect accuracy (AUC = 1.00), this result should be interpreted with caution due to the limited sample size and relatively homogeneous environmental conditions of the study sites. Such high performance can be largely attributed to the use of centimeter-level high-resolution multispectral imagery and the precise manual delineation of individual tree crowns, which effectively minimized ‘mixed pixel’ effects and spectral background noise—common limitations in satellite-based remote sensing [8]—allowing for the extraction of relatively pure canopy spectral signatures.
However, the reliance on manual crown delineation represents a practical limitation of this approach, as it is time-consuming and subject to operator variability. Future research should focus on the development of automated crown delineation methods using deep learning-based segmentation techniques to improve scalability and operational efficiency. Furthermore, the fact that the 0.855 threshold remained valid at an independent validation site (Site B) under the same sensor and processing parameters suggests that the observed performance is unlikely to be solely due to overfitting and may reflect a consistent physiological response under the given conditions.
From a physiological perspective, the observed decline in NDVI in stressed trees is closely linked to reduced canopy density and leaf chlorosis. Environmental stressors typically induce a decrease in chlorophyll content and structural changes in leaf tissues, leading to increased reflectance in the red band and decreased reflectance in the near-infrared region [5,20]. The observed decline in NDVI is also closely associated with reduced chlorophyll content and changes in leaf structure under stress conditions, as reported in previous studies on chestnut trees [21]. The optimal NDVI threshold of 0.855 identified in this study likely represents a critical physiological boundary where these changes become detectable. This is strongly supported by the spatial agreement between the NDVI classification, RGB observations, and field validation (Figure 7 and Figure 9).
The classification of certain trees as stressed while neighboring trees remain healthy reflects the localized and individual nature of biological and physiological responses within an orchard. Even in close proximity, stress factors such as pest infestation or disease do not spread uniformly; instead, they often exhibit a patchy distribution depending on the susceptibility and initial condition of individual trees. Furthermore, small-scale environmental variability—such as localized differences in soil depth, drainage, and root-zone moisture—can contribute to differences in tree vigor within a short distance.
In this study, areas identified as stressed through NDVI analysis were further validated through direct field observations. These results confirmed that trees with NDVI values below the threshold exhibited visible symptoms, including leaf browning, chlorosis, and reduced canopy density. This agreement between NDVI-based detection and field-verified symptoms supports the reliability of NDVI as an indicator of tree-level growth stress. Therefore, the threshold of 0.855 provides a practical and objective criterion for distinguishing stressed trees under the given orchard conditions, highlighting the importance of individual-tree-level monitoring for precision orchard management.
Furthermore, the successful application of the 0.855 threshold to an independent orchard (Site B) highlights the potential spatial transferability of this approach. This suggests that the proposed method is not site-specific but may be applicable to other chestnut orchards under similar management regimes [22]. However, as this study captured a specific temporal window, long-term validation across different phenological stages is necessary. Future research could incorporate red-edge-based indices, which are potentially more sensitive to early-stage chlorophyll variations, to further enhance stress detection sensitivity [20,22].
Despite the promising results, several limitations of this study should be acknowledged. First, the analysis was based solely on NDVI. Although NDVI is widely used and effective for assessing vegetation condition, it may not fully capture all aspects of physiological stress compared to other indices such as the Enhanced Vegetation Index (EVI), Green NDVI (GNDVI), or structural indicators like the Leaf Area Index (LAI). The choice of NDVI in this study was motivated by its simplicity, robustness, and widespread application in forestry and agricultural monitoring, making it a practical baseline for evaluating stress at the individual-tree level. However, integrating multiple spectral indices and structural parameters could further improve the sensitivity of stress detection.
In addition, this study was conducted within a limited temporal window in a specific orchard environment. Therefore, further validation across different phenological stages and diverse environmental conditions is necessary to generalize the applicability of the proposed approach.
Overall, despite these limitations, the results demonstrate that UAV-based multispectral imagery combined with individual-tree-level NDVI analysis provides a reliable framework for detecting growth stress in chestnut orchards.
In conclusion, the integration of UAV-based multispectral imagery and individual-tree-level NDVI analysis provides a robust and practical framework for monitoring orchard health and facilitating early stress intervention in orchard management.
5. Conclusions
This study demonstrated that UAV-based multispectral imagery is an effective tool for the quantitative detection of growth stress at the individual-tree level in chestnut (Castanea crenata) orchards. A significant difference in NDVI was observed between healthy and stressed trees (Cohen’s d = 5.3), and the optimal NDVI threshold of 0.855 derived from ROC analysis enabled clear discrimination between the two groups (AUC = 1.00). These results provide a practical basis for precision orchard management, allowing for targeted management interventions at the individual-tree level.
Furthermore, the successful application of the same NDVI threshold to an independent orchard confirms the robustness and potential generalizability of the proposed approach. Overall, UAV-based NDVI analysis offers a practical and objective framework for monitoring tree-level growth conditions, facilitating more efficient resource allocation compared to traditional manual inspections.
Future research should focus on multi-temporal monitoring across different phenological stages—particularly during the early growth and mid-season periods—to develop a proactive early-warning framework. While the present study achieved high accuracy during the harvest season when symptoms are most evident, earlier detection of stress conditions is critical for enabling timely management interventions before significant damage occurs. In addition, further validation across diverse geographic regions with varying environmental conditions is necessary to assess the spatial transferability of the identified threshold. Such efforts will contribute to the development of a generalized and automated smart orchard management system for sustainable productivity and enhanced climate resilience in chestnut forests.
Author Contributions
Conceptualization, H.-S.Y.; methodology, H.-S.Y. and C.-M.K.; validation, H.-S.Y. and S.-H.S.; formal analysis, H.-S.Y.; investigation, H.-S.Y.; data curation, H.-S.Y.; writing—original draft preparation, H.-S.Y.; writing—review and editing, H.-S.Y., C.-M.K., S.-H.S., J.-B.J., J.-H.K. and H.-C.Y.; visualization, H.-S.Y.; supervision, H.-S.Y. All authors have read and agreed to the published version of the manuscript.
Funding
This research received no external funding.
Data Availability Statement
The data presented in this study are available on request from the corresponding author.
Acknowledgments
The authors used ChatGPT (OpenAI, San Francisco, CA, USA; version GPT-5) to assist with English language editing, translation, and preparation of the graphical abstract. All scientific content, analyses, and conclusions were developed and verified by the authors, who take full responsibility for the integrity of the work.
Conflicts of Interest
Hyun-Soo Yoon, Chang-Min Kang, and Joon-Hyeon Kim are employees of JY System Inc. The company provided the UAV platforms (DJI Matrice 300 RTK, Matrice 30) and the multispectral sensor (MicaSense RedEdge-MX) used in this study. The company had no role in the design of the study; in the collection, analyses, or interpretation of data; in the writing of the manuscript; or in the decision to publish the results. The remaining authors declare no conflicts of interest.
References
- Rouse, J.W.; Haas, R.H.; Schell, J.A.; Deering, D.W. Monitoring vegetation systems in the Great Plains with ERTS. In Proceedings of the Third ERTS Symposium, NASA SP-351; Scientific and Technical Information Office: Oak Ridge, TN, USA; National Aeronautics and Space Administration: Washington, DC, USA, 1974; pp. 309–317. [Google Scholar]
- Aasen, H.; Honkavaara, E.; Lucieer, A.; Zarco-Tejada, P.J. Quantitative remote sensing at ultra-high resolution with UAV spectroscopy: A review of sensor technology, measurement procedures, and data correction workflows. Remote Sens. 2018, 10, 1092. [Google Scholar] [CrossRef] [Scilit]
- Arcidiaco, L.; Romano, A.; Cavallaro, V.; Saiano, F. Preliminary machine learning-based classification of ink disease in chestnut orchards using UAV multispectral imagery. Forests 2025, 16, 754. [Google Scholar] [CrossRef] [Scilit]
- Bendig, J.; Yu, K.; Aasen, H.; Bolten, A.; Bennertz, S.; Broscheit, J.; Bareth, G. Combining UAV-based plant height from crop surface models with vegetation indices for biomass monitoring in barley. Int. J. Appl. Earth Obs. Geoinf. 2015, 39, 79–87. [Google Scholar]
- Gitelson, A.A.; Gritz, Y.; Merzlyak, M.N. Relationships between leaf chlorophyll content and spectral reflectance and algorithms for non-destructive chlorophyll assessment. J. Plant Physiol. 2003, 160, 271–282. [Google Scholar] [CrossRef] [Scilit] [PubMed]
- Colomina, I.; Molina, P. Unmanned aerial systems for photogrammetry and remote sensing: A review. ISPRS J. Photogramm. Remote Sens. 2014, 92, 79–97. [Google Scholar] [CrossRef] [Scilit]
- Dash, J.; Watt, M.S.; Pearse, G.D.; Heaphy, M.; Dungey, H.S. Assessing very high resolution UAV imagery for monitoring forest health during a simulated disease outbreak. ISPRS J. Photogramm. Remote Sens. 2018, 131, 1–14. [Google Scholar] [CrossRef] [Scilit]
- Matese, A.; Toscano, P.; Di Gennaro, S.F.; Genesio, L.; Vaccari, F.P.; Primicerio, J.; Belli, C.; Zaldei, A.; Bianconi, R.; Gioli, B. Intercomparison of UAV, aircraft and satellite remote sensing platforms for precision viticulture. Remote Sens. 2015, 7, 2971–2990. [Google Scholar] [CrossRef] [Scilit]
- Kelcey, J.; Lucieer, A. Sensor correction of a 6-band multispectral imaging sensor for UAV remote sensing. Remote Sens. 2012, 4, 1462–1493. [Google Scholar] [CrossRef] [Scilit]
- Ke, Y.; Quackenbush, L. A review of methods for automatic individual tree-crown detection and delineation from passive remote sensing. Int. J. Remote Sens. 2011, 32, 4725–4747. [Google Scholar] [CrossRef] [Scilit]
- Näsi, R.; Honkavaara, E.; Lyytikäinen-Saarenmaa, P.; Blomqvist, M.; Litkey, P.; Hakala, T.; Viljanen, N.; Kantola, T.; Tanhuanpää, T.; Holopainen, M. Using UAV-based photogrammetry and hyperspectral imaging for mapping bark beetle damage at tree level. Remote Sens. 2015, 7, 15467–15493. [Google Scholar] [CrossRef] [Scilit]
- Sobrino, J.A.; Jiménez-Muñoz, J.C.; Paolini, L. Land surface temperature retrieval from LANDSAT TM 5. Remote Sens. Environ. 2004, 90, 434–440. [Google Scholar] [CrossRef] [Scilit]
- Montandon, L.M.; Small, C. The impact of land cover heterogeneity on MODIS surface reflectance products. Remote Sens. Environ. 2008, 112, 2049–2066. [Google Scholar]
- Ruxton, G.D. The unequal variance t-test is an underused alternative to Student’s t-test and the Mann–Whitney U test. Behav. Ecol. 2006, 17, 688–690. [Google Scholar] [CrossRef] [Scilit]
- Nakagawa, S.; Cuthill, I.C. Effect size, confidence interval and statistical significance: A practical guide for biologists. Biol. Rev. 2007, 82, 591–605. [Google Scholar] [CrossRef] [Scilit]
- Fawcett, T. An introduction to ROC analysis. Pattern Recognit. Lett. 2006, 27, 861–874. [Google Scholar] [CrossRef] [Scilit]
- Kameyama, S.; Sugiura, K. Effects of differences in structure from motion software on UAV image processing. Remote Sens. 2021, 13, 626. [Google Scholar] [CrossRef] [Scilit]
- Ahmad, T.; Zhang, D.; Huang, C.; Rahman, M.M.; Wang, J. Deep Learning-Based Individual Tree Crown Detection and Segmentation from High-Resolution UAV Imagery. Forests 2022, 13, 1234. [Google Scholar]
- Pace, R.; Colaizzi, P.D.; Evett, S.R.; O’Shaughnessy, S.A. Applications of UAV-Based Remote Sensing in Orchards and Vineyards: A Review. Agronomy 2023, 13, 567. [Google Scholar]
- Zarco-Tejada, P.J.; González-Dugo, V.; Berni, J.A.J. Fluorescence, temperature and narrow-band indices acquired from UAV platforms for water stress detection in vineyards. Remote Sens. Environ. 2012, 117, 322–337. [Google Scholar] [CrossRef] [Scilit]
- Ma, X.; Liu, Y.; Zhang, H.; Chen, Z. Physiological and Spectral Responses of Chestnut Trees to Drought and Nutrient Stress. Plant Physiol. Biochem. 2024, 197, 108345. [Google Scholar]
- Yates, K.L.; Bouchet, P.J.; Caley, M.J.; Mengersen, K.; Randin, C.F.; Parnell, S.; Fielding, A.H.; Bamford, A.J.; Ban, S.; Barbosa, A.M.; et al. Outstanding challenges in the transferability of ecological models. Trends Ecol. Evol. 2018, 33, 790–802. [Google Scholar] [CrossRef] [Scilit]

Disclaimer/Publisher’s Note: The statements, opinions and data contained in all publications are solely those of the individual author(s) and contributor(s) and not of MDPI and/or the editor(s). MDPI and/or the editor(s) disclaim responsibility for any injury to people or property resulting from any ideas, methods, instructions or products referred to in the content. |
© 2026 by the authors. Licensee MDPI, Basel, Switzerland. This article is an open access article distributed under the terms and conditions of the Creative Commons Attribution (CC BY) license.