


Abstract
The decision-making procedure to develop and manage a production strategy is challenging because it requires a high investment and is performed under uncertainty. Heavy-oil reservoirs present low mobility and a high production of water under waterflooding. However, intelligent wells with ICVs (inflow control valves) and polymer flooding can improve the field’s performance. This work proposes a decision analysis to select the best strategy for the development of a heavy-oil field, evaluating and comparing the feasibility of waterflooding, polymers, and ICVs. We complement the nominal optimization accomplished for the base case in previous works by considering a probabilistic procedure with uncertainties, which includes the following: the generation of uncertain scenarios, the initial risk evaluation, the optimization of production strategies, a risk curve analysis, and the selection of the best strategy. A model-based reservoir simulation is used to perform the procedure, with the Expected Monetary Value (EMV) quantifying the economic returns. The case study is a sandstone heavy-oil reservoir (13° API) that represents a real Brazilian offshore field. Based on the EMV, we selected the polymer flooding strategy for this case study. However, since better water management was achieved with small differences to the polymer strategy, the option of using the ICVs in combination with polymer could be attractive depending on the various objectives of an oil field.
1. Introduction
The decision-making procedure to select a production strategy for the development and management of an oil field is very complex. Strategy implementation requires high-investment and high-risk decisions that affect the decades-long operations usually seen in oil production [1,2]. Life cycle optimization is used to help in the selection of production strategies, but the process is complex because it involves several optimization variables that can impact the objective function (OF) [3,4,5,6].
The available data to plan the development and management of an oil reservoir is generally limited, and new information is only collected after the field comes into operation. Thus, the selection of a production strategy is conducted under considerable uncertainty [7]. Typically, the combination of a reservoir, operational, and economic uncertainties generates uncertain scenarios (represented by simulation models) that an oil field project must consider [8,9]. Reservoir uncertainties involve reserves and fluid characteristics in the porous medium, operational uncertainties refer to system availability, and economic uncertainties relate to market variables, capital expenditure (CAPEX), and operational expenditure (OPEX). Moreover, poor or risky decisions may lead to significant losses if a production strategy is not flexible and adaptable enough when facing unexpected models and new data achievements [10,11,12].
Oil displacement by water injection and other reservoir stimulation techniques are key areas of research in reservoir science and production management, which play an important role in facing the challenges in the world’s energy supply security [13,14]. However, to address this issue, field development under risky conditions must be carried out while considering effective oil production by reducing the operation and energy requirements related to water management.
Heavy-oil reservoirs are characterized by low oil recovery factors (ORFs) because of low mobility [15,16,17,18]. This condition causes problems in the reservoir when an oil recovery technique such as waterflooding is applied. Poor sweep efficiency, a high water–oil mobility ratio, early breakthrough, and a high production of water are mostly presented under this technique [19,20,21].
More advanced EOR methods and field management operations are then necessary to improve the performance of a heavy-oil field. Polymer flooding and the use of intelligent wells equipped with inflow control valves (ICVs) are suitable alternatives to increase the oil recovery and deal with the problems faced under waterflooding.
Adding soluble polymer renders more viscous injection water, reducing the water–oil mobility ratio and the water fractional flow, thus increasing oil recovery and improving sweep efficiency [22,23]. Recent studies have indicated that the oil recovery increase is achieved by the mixture of viscous fingering and mainly viscous crossflow effects (VX) [24,25,26,27]. Intelligent wells have downhole devices installed, such as inflow control valves (ICVs), that allow for the remote monitoring and control of completed intervals without well interventions. The ICVs can control multiple production or injection zones, thereby accelerating oil production and managing the reservoir pressure, as well as reducing the production and injection of water [28,29,30,31,32].
The implementation of polymer flooding or intelligent wells is challenging because more complexity to the optimization problem is added by studying further decision variables. Generally, the extra variables are polymer concentration and slug sizes for polymer strategies [33,34], and the number, location, and controls of the ICVs in the strategies with intelligent wells [35,36,37,38,39,40,41]. There are also some physical phenomena/effects present in polymer flooding caused by the polymer-rocks properties and the non-Newtonian behavior. Retention, rheology (viscosity and polymer concentration), degradation, inaccessible pore volume (IPV), salinity, and permeability reduction are some of the effects that impact the response of this technique. The evaluation of these effects is essential because the polymer injection usually requires higher field investments for the testing, implementation, and management of the operation [42,43,44,45,46].
Very few works in the literature combine waterflooding, polymers, and ICVs with similarities to the model in this work [47,48,49]. These studies suggest that polymers improve oil recovery with better water management compared to water injection. Furthermore, ICVs help to reduce injected and produced water, as well as polymers, and they mitigate poor performance caused by incorrect well positioning.
Model-based reservoir simulation is a powerful, cost-effective, and time-efficient tool used in decision analysis to find suitable solutions to the problem of production strategy selection. Indeed, model-based nominal optimization for the selection of production strategies evaluated in this case study was concluded for a base case [50,51,52]. The previous research on the base case showed that the strategy of polymer flooding with ICVs (PF + ICV) was the best over waterflooding (WF), waterflooding with ICVs (WF + ICV), and polymer flooding (PF). The highest net present value (NPV) and ORF with the lowest production and injection of water, and an efficient reservoir pressure management were responsible for this result. Nevertheless, the differences in terms of NPV between PF and PF + ICV were not significant compared to WF against WF + ICV, indicating that the ICVs are more useful when injecting only water instead of polymers. Consequently, one must evaluate the strategies’ performance under uncertainties to support the selection of the best strategy through a decision analysis.
Model-based decision analysis has been applied to support the development and management of production strategy selection under uncertainty [47,53,54,55]. In this way, a production strategy response is evaluated across several uncertain models, supporting a decision-maker in the selection by identifying the potential gains and risks. Thus, the goal of the decision analysis is to complete the selection of a production strategy that is flexible and adaptable enough for uncertain models, therefore maximizing economic returns and reducing risks.
This work is based on the knowledge of a model-based field development and management procedure that has 12 steps divided into colors [56]. Our research study can be located in the blue steps where the development and management of an oil field is achieved through life cycle production optimization under uncertainty. However, we made some practical modifications from some of the blue steps, specifically described in the methodology section of this study.
In a general overview, our decision analysis involves the generation of uncertain models [57], the initial risk evaluation of the optimized strategies for the base case WF, WF + ICV, PF and PF + ICV, production strategy optimization for an optimistic case (P10) and pessimistic case (P90) [11,58], and the final decision to select the production strategy.
We also use the Expected Monetary Value (EMV) to select the strategies under uncertainty, and the NPV as the OF for optimization procedures considering long-term approaches. The optimization variables are categorized into G1 and G2L [59]. G1 refers to project or design variables that represent infrastructure, such as well number and platform capacities, before the start of field development. G2L are control variables used in the management of the equipment over time, such as operational specifications of well flow rates or ICV controls.
Objective
The objective of this work is to present a methodology to guide the selection of production strategy, complementing a decision analysis under uncertainty for the development and management of a heavy-oil reservoir, considering waterflooding (WF), waterflooding with ICVs (WF + ICV), polymer flooding (PF), and polymer flooding with ICVs (WF + ICV), and using model-based reservoir simulation under uncertain geological, operational, and economic conditions to evaluate the usefulness of polymers and intelligent wells.
2. Materials and Methods
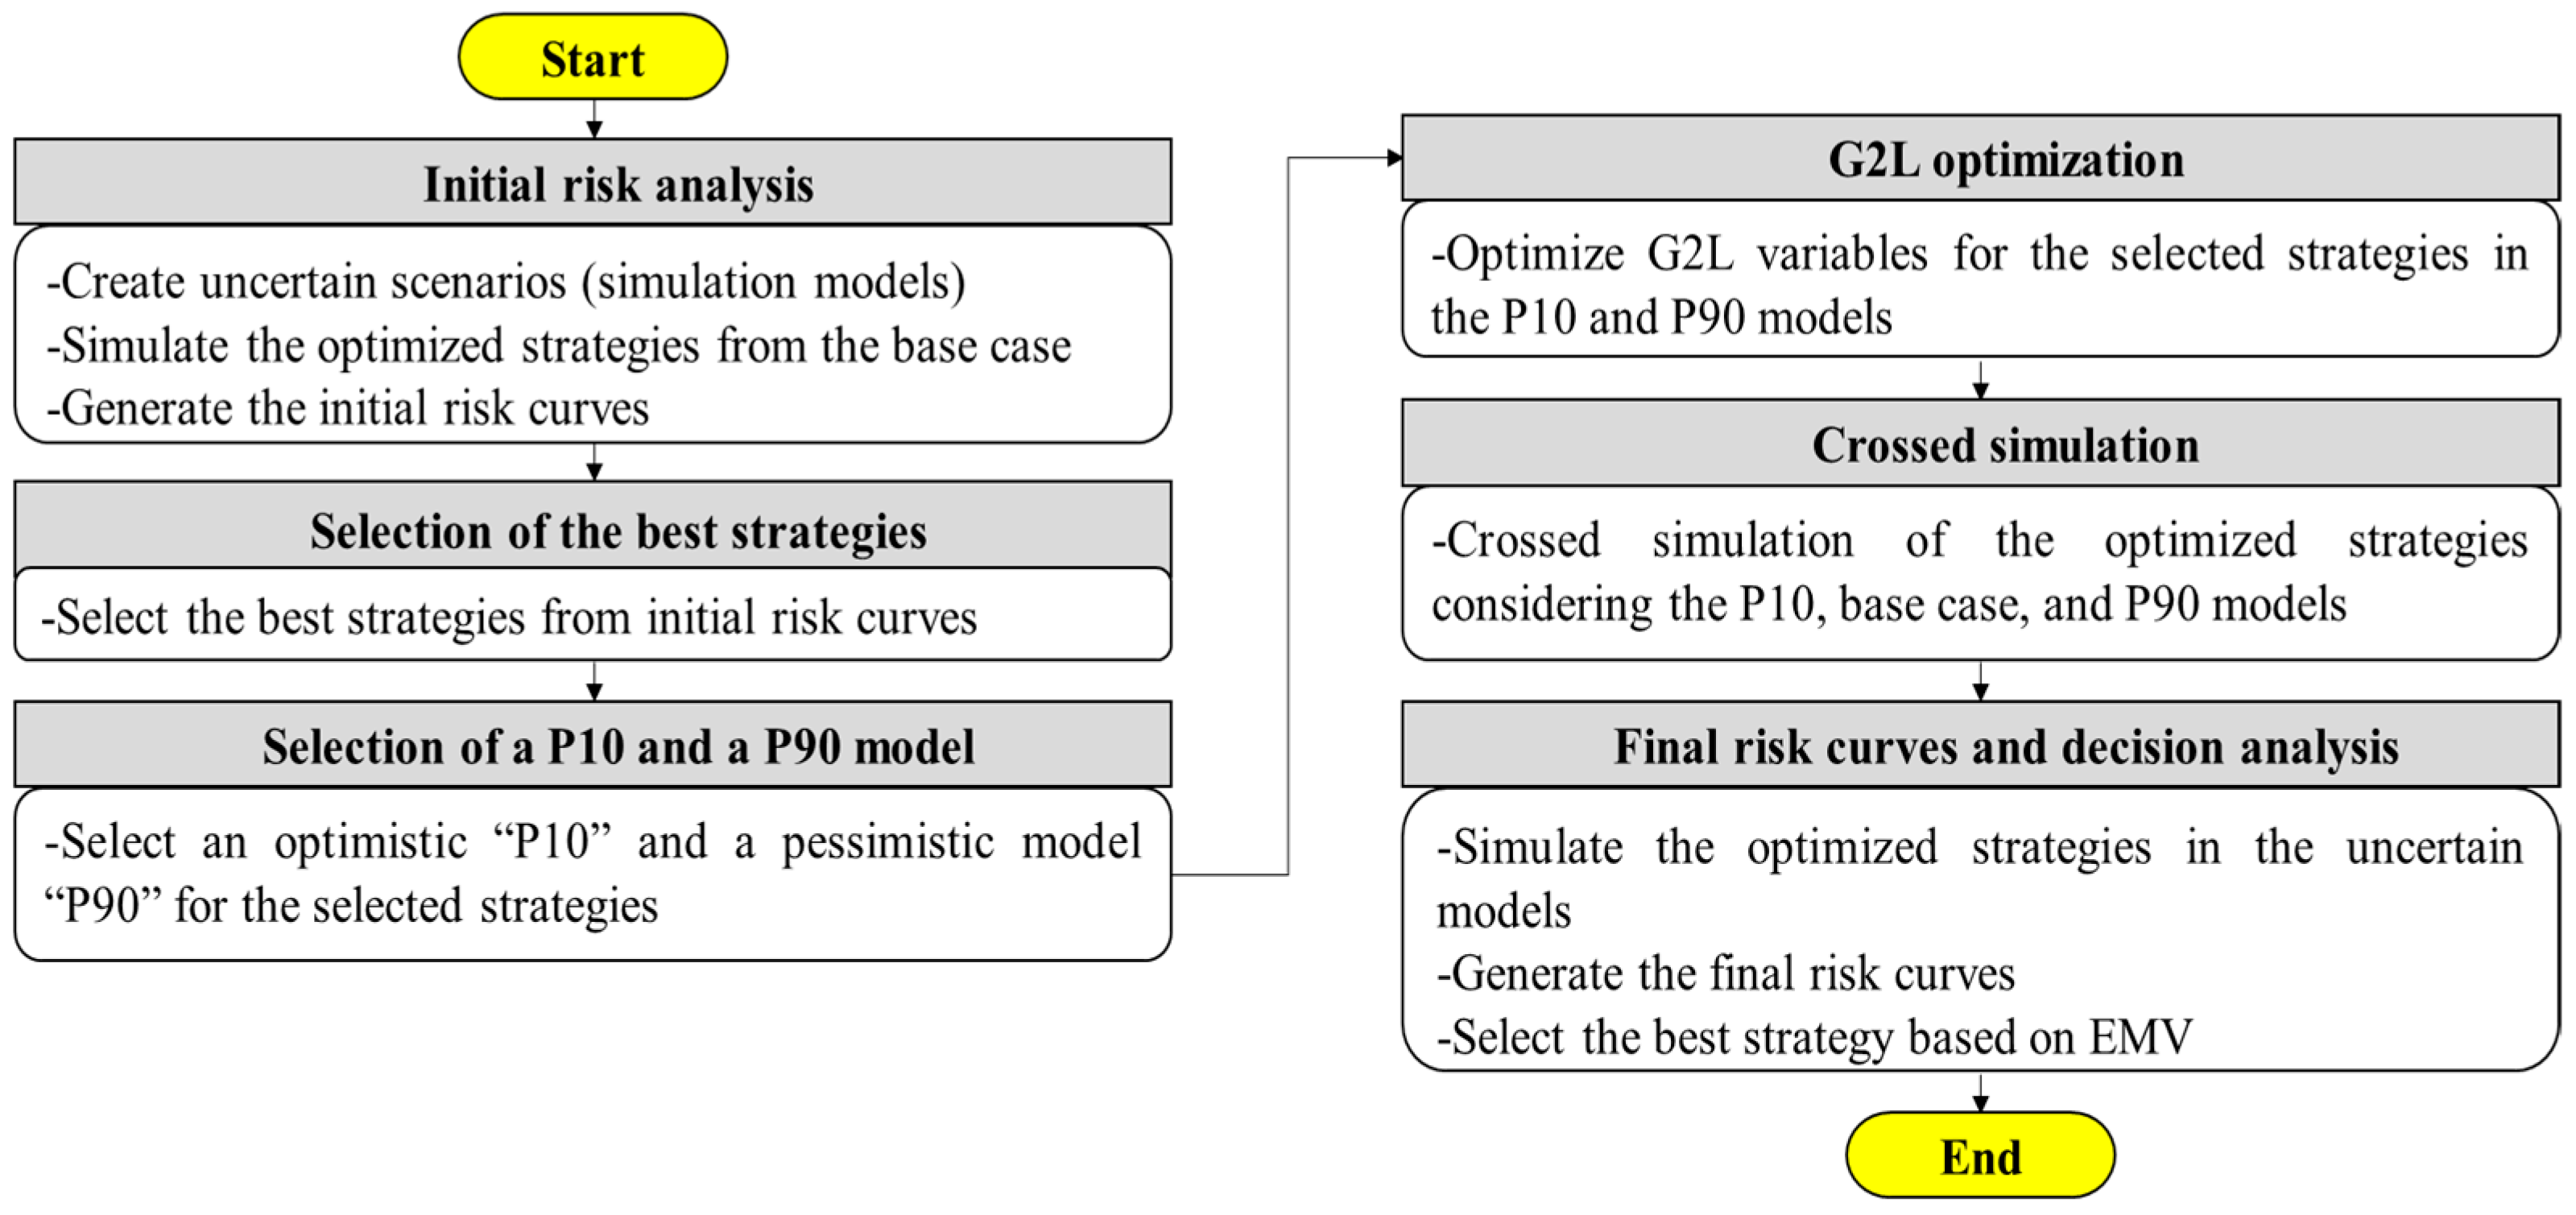
The base of this work started at step 6 [56] where the production strategies were nominally optimized for the base case only. Details of the nominal optimization for the base case can be consulted in previous works [50,51,52]. This research completes the decision analysis by studying the uncertainties, covering the application from step 7 onwards, but we did not strictly apply each step from [56]. As this is the first analysis of the case study, some simplifications were applied to the steps to assess whether our approach can accomplish our hypothesis or whether more representative models with robust optimization are needed. Figure 1 illustrates the workflow of the methodology used in this research.
Figure 1.
Workflow of the decision analysis under uncertainty.
2.1. Initial Risk Analysis
We applied the Discrete Latin Hypercube with Geostatistics (DLHG) sampling method to generate 100 scenarios (models) combining the geological, operational, and economic uncertainties through probability distributions [57]. More details of the uncertain attributes used to generate the models are shown in the application section of this work. The nominal optimized strategies for the base case (WF, WF + ICV, PF, and PF + ICV) were evaluated in the initial risk analysis. EMV values, risk curves of NPV, oil production (Np), ORF, water production (Wp), and water injection (Wi) were generated by simulating each strategy on the 100 uncertain models.
2.2. Selection of the Best Strategies
Two strategies were selected from the initial risk analysis. The selection was based on the EMV values and their behavior under the uncertain models in terms of NPV and field indicators, exposing the field risks, potential gains, and operationality.
2.3. Selection of a P10 and a P90 Models
One optimistic model (closest to P10) and another pessimistic one (near P90) were selected from the NPV risk curve for the selected strategies in the previous stage [11,58]. We selected these extreme models to evaluate possible notable differences in the behavior of the selected strategies in the uncertain analysis, using as a reference their uncertain assessment when the strategies were optimized from the base case. The selection of these models is a simplification since this research is one of the pioneering studies done in this particular case study. However, potential biases may affect the results if these extreme models do not capture the full uncertainty spectrum. Thus, we also evaluated the need for more representative models or robust optimization if the results of the decision analysis are inconsistent, or the possibility of evaluating different results.
2.4. G2L Optimization
We only optimized the G2L variables because the G1, which results from the nominal optimization, were quite similar among the strategies, particularly in the type and number of wells, well-opening schedule, and small changes in the well position [51]. The G2L optimization has the NPV as an OF and hierarchically follows the optimization of variables, which include the following: well flow rates, well water cut limit value, polymer concentration, water and polymer slug number and sizes, ICV controls, and apportionment method. The variables are optimized via assisted processes applied either manually or automatically using our standard algorithm (which is analogous to the idea of EDA—Estimation of Distribution Algorithm). Sensitivity analysis, knowledge of reservoir-production engineering, and simulation analysis are used in the manual procedure. The Iterative Discrete Latin Hypercube (IDLHC) [60] algorithm was selected for the automatic application running guided processes of about 100 simulations (sample size: 10, cut-off (%): 80, number of iterations: 10, and termination criterion: number of iterations). G2L optimization took around 800 to 1000 simulation runs, spending 130 to 180 h, respectively. More details about the optimization process are described in previous works [50,51,52].
2.5. Crossed Simulation
We performed crossed simulations of the selected strategies that were optimized from the P10, base, and P90 models. The process involves simulating each strategy in the models in which they were not optimized, thus obtaining quantitative results of NPV values. In this way, we evaluate if the optimization process achieved an acceptable result for the strategy in the model that was optimized by comparing its NPV value with its crossed-simulations.
2.6. Final Risk Curves and Decision Analysis
The optimized strategies from the P10 and P90 models were simulated on the 100 uncertain models. EMV values and risk curves with NPV and field indicators are shown together for the selected strategies optimized from the P10, base, and P90 models. Finally, we evaluated the response of the optimized strategies in the uncertain models and selected the best strategy based on the EMV.
2.7. Application
2.7.1. Description and Conditions of the Case
The case study of this research is named EPIC001. The base case was built from real data to represent part of a sandstone heavy-oil reservoir with 13° API of an offshore Brazilian field. Before obtaining the research results for this study, we validated our study case. In the validation, we performed a reservoir simulation analysis in which we approved the physical and computational time-consuming responses of the model for our research purposes. Thus, it is not computationally very time-consuming for optimization studies, and, yet, it showed good behavior to represent a real heavy-oil reservoir. As this is a new case without real history production data, the response model can be improved (in the future) for real production processes by updating new data and incorporating the uncertainty. Water phase has high salinity (100,000 ppm) and presents 0.43 cP of viscosity, and 1067.9 kg/m3 of density. More general information about the base case is listed in Table 1.
Table 1.
Main parameters of the base case (data from [50]).
2.7.2. Simulation Model of the Base Case
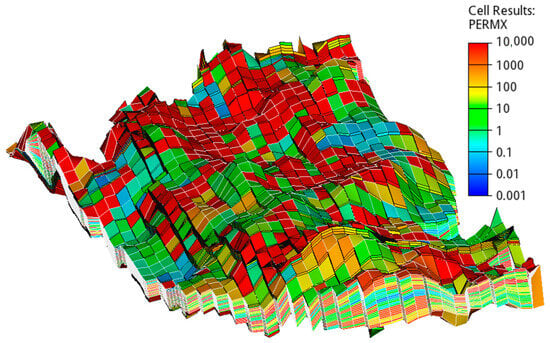
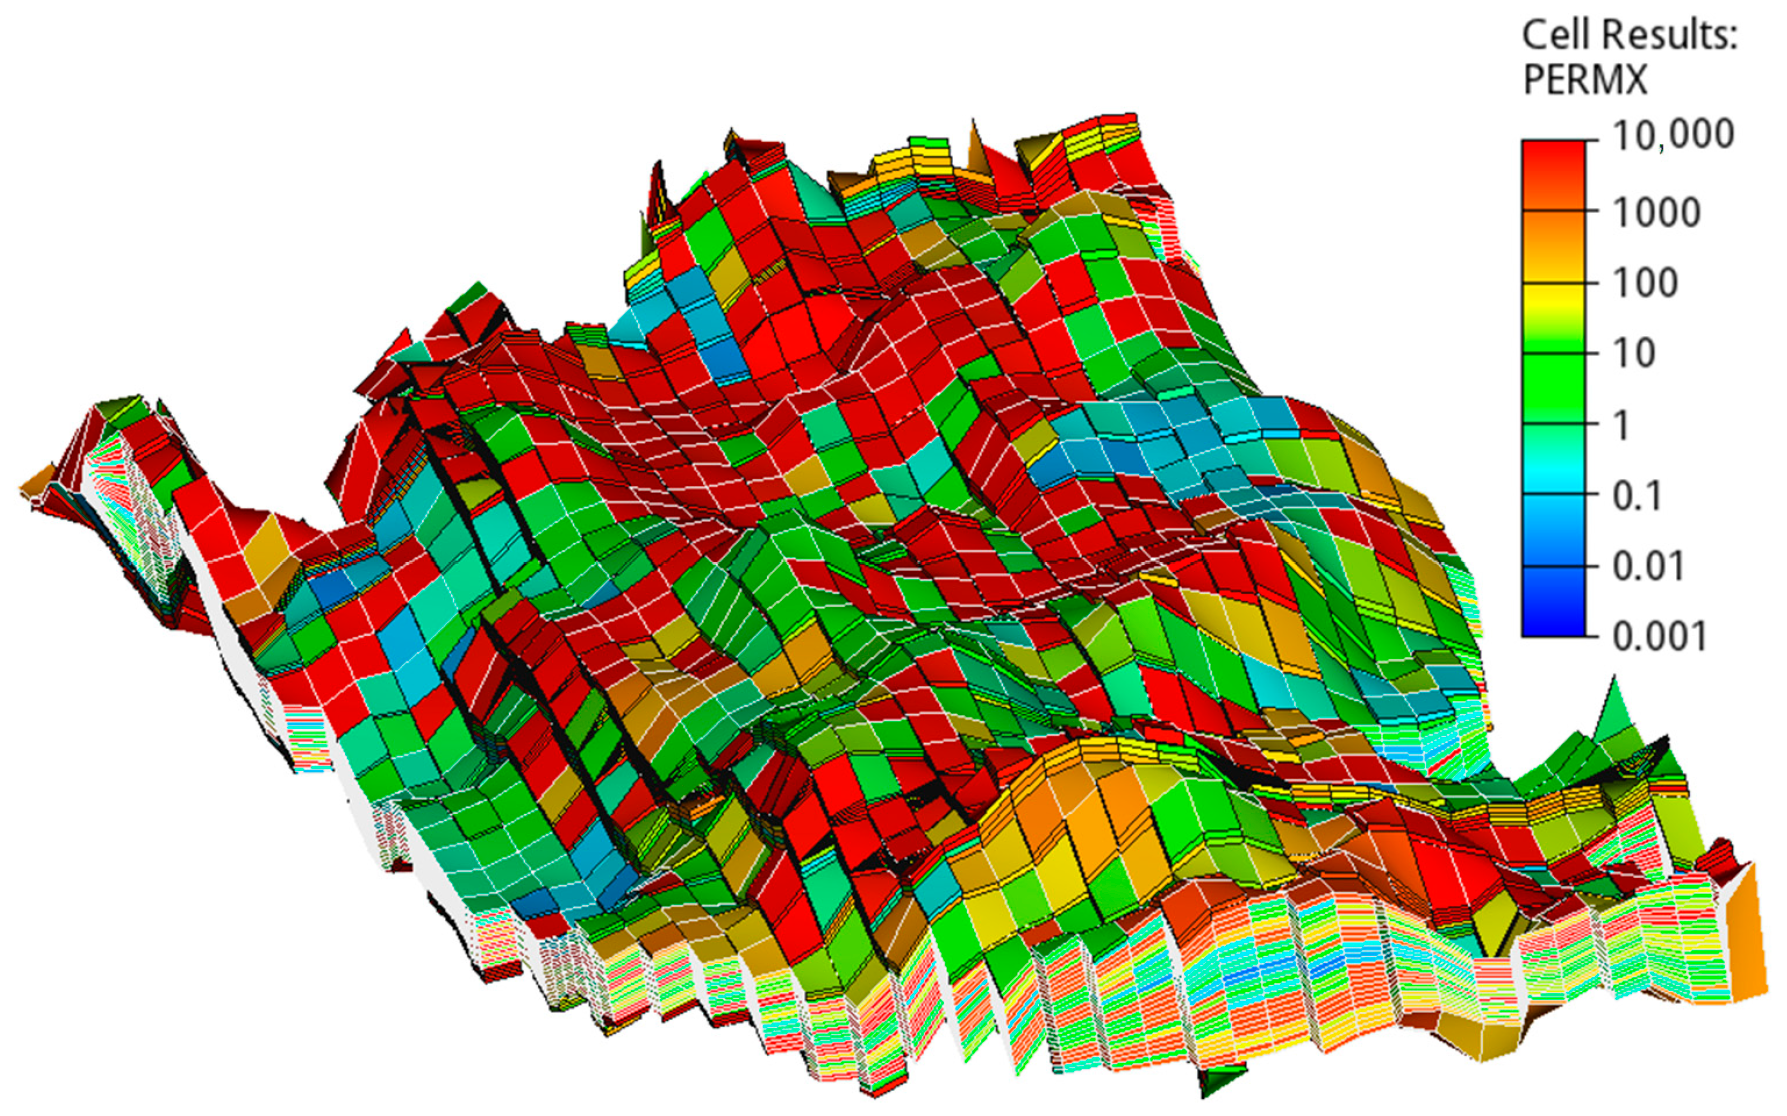
The grid type of the model is the corner point, composed of 30 × 53 × 59 cells with 30,694 active blocks of 100 × 100 m length and varied thickness (avg 1.94 m). The reservoir has three facies (types of rock) distributed along the model. Moreover, there is no presence of aquifer or fractures. Due to the facies distribution, the model is highly heterogeneous with rock “packages” of high permeability (over 1000 mD) and porosity, and with others that have very low permeability and porosity, as illustrated in Figure 2.
Figure 2.
Permeability X (mD); 3-D view for the base case.
2.7.3. Medium Scenario (Most-likely) for Polymer Flooding Strategies
A medium scenario was created to make the study more alike the strategies with polymer injection [52]. Viscosity and adsorption functions, permeability reduction, IPV, and correction in well injectivity were added to capture the effects and phenomena for the modeling of polymers in the black-oil simulator (E100). The synthetic polymer used in this study is of the HPAM type with 18 MDa molecular weight and a hydrolysis degree of about 30%. We show the input parameters of the medium scenario for the polymer modeling in the Table 2. We decided not to include the shear rate effects since it increased the simulation time by about 30 times longer without significantly impacting the results, making optimization procedures impractical. The salinity phenomenon was not studied as the ionic composition of production and formation water was unknown; however, polymer injection cost was slightly augmented to compensate for minor salinity effects in case of high polymer concentration requirements. Similarly, temperature effects were disregarded as larger temperature gradients between injectors and producers were not expected, and reservoir temperature (82 °C) is lower than the synthetic polymer tolerance of around 90 °C.
Table 2.
Input parameters of the medium scenario to model the polymers in the E100 simulator.
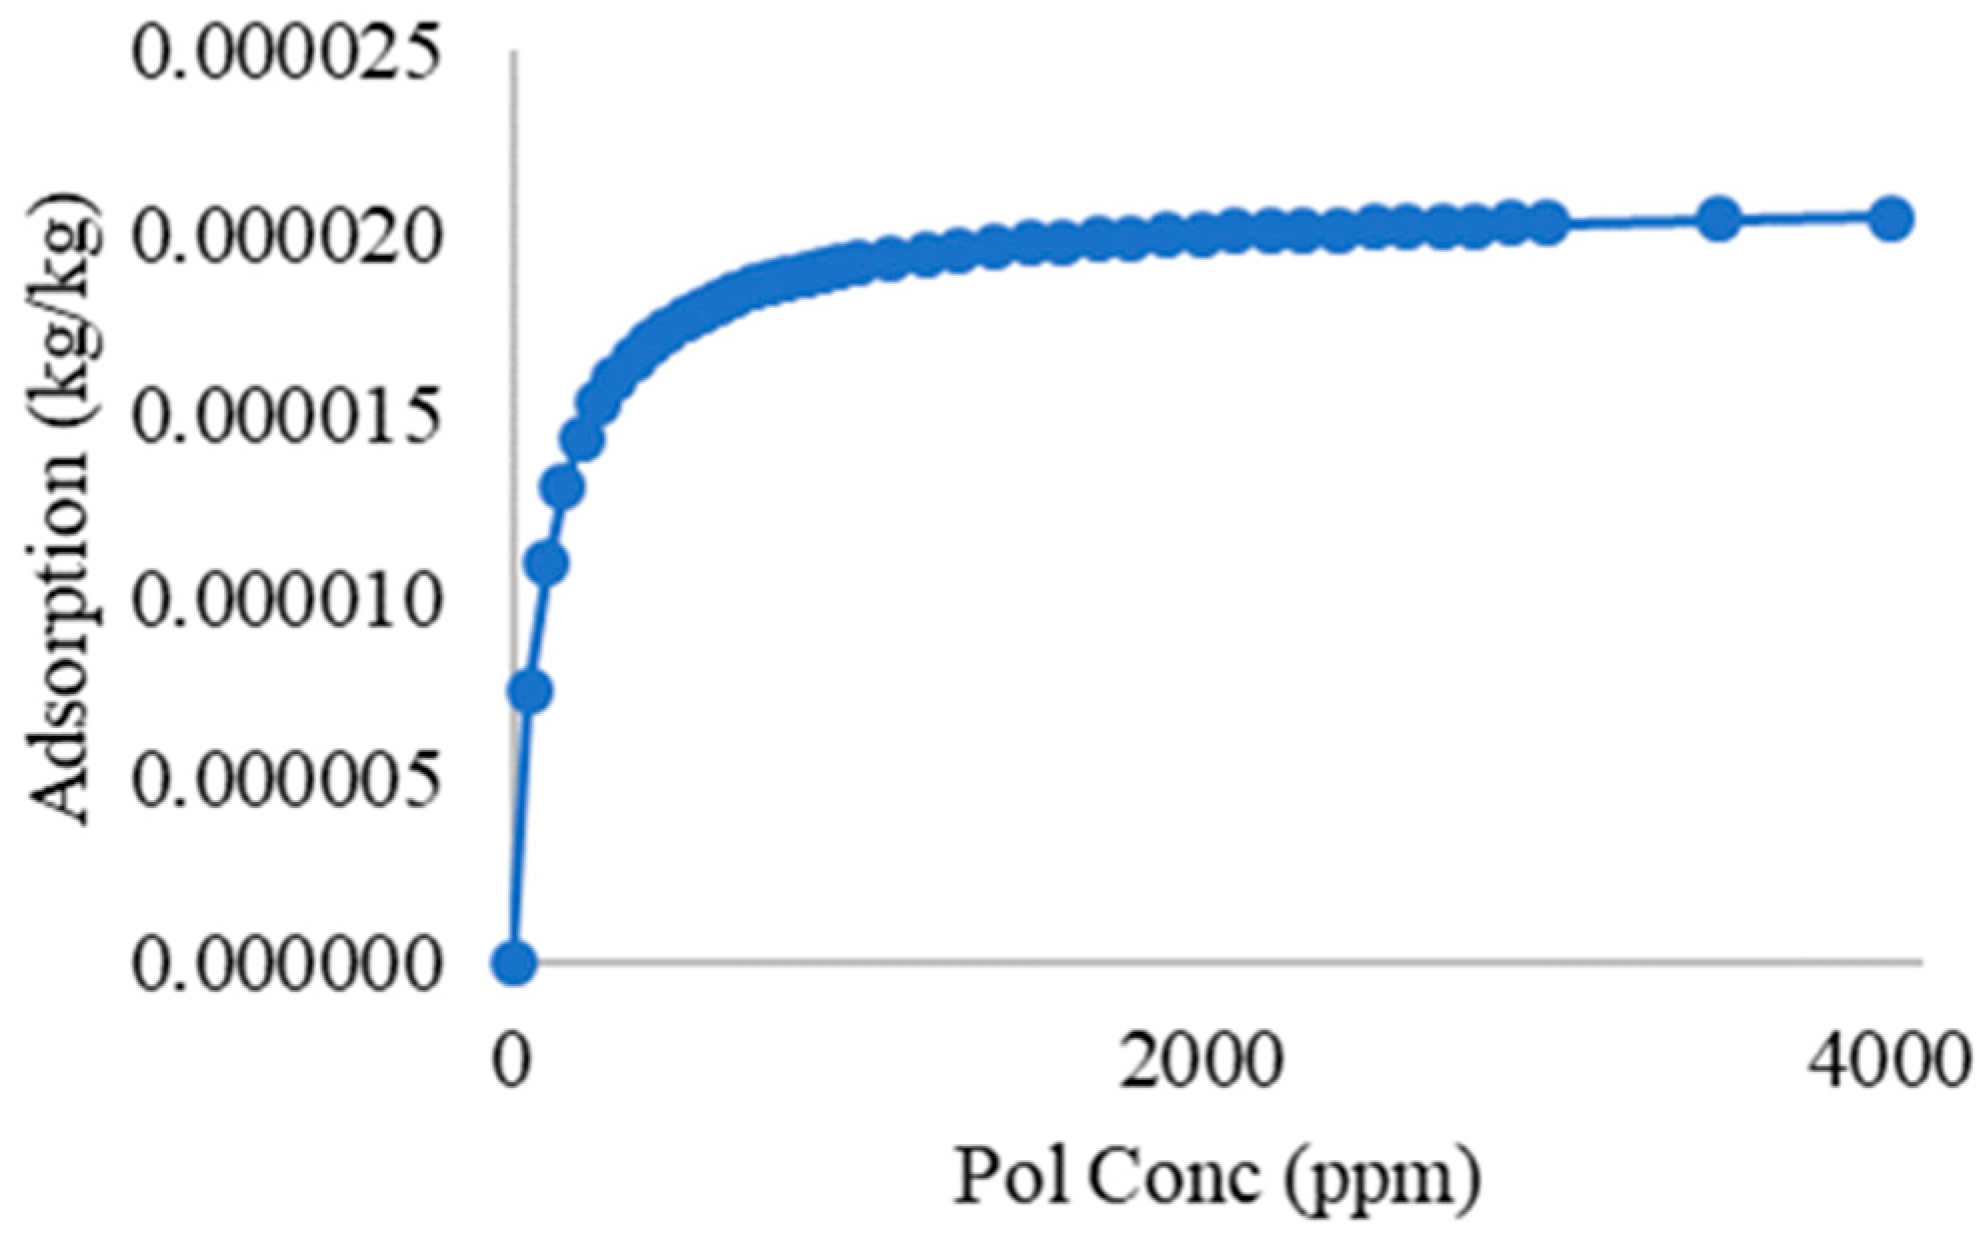
It is known that polymer adsorption functions reach a plateau value (maximum polymer adsorption value) regardless of polymer concentration increases [63]. At this point, all available adsorption sites on the surface are occupied without receiving any additional polymer molecules; therefore, no significant effect on the amount of polymer adsorbed is observed (polymer adsorption is measured in kg polymer per kg rock).
Figure 3.
Adsorption vs. concentration for the applied polymer (data from [52]).
2.7.4. Well and Platform Operational Conditions
Table 3, Table 4 and Table 5 provide data about the well and platform conditions, including their operational efficiency.
Table 3.
Well operational conditions (data from [50]).
Table 4.
Well data (data from [50]).
Table 5.
Maximum dimensions allowed for each platform applied as group operational conditions (data from [50]).
2.7.5. Economic Scenario (Most-likely)
We use Equations (1) and (2) to calculate the net present value (NPV) and the net cash flow (NCF), respectively:
where:
NCFj: net cash flow at period j;
Nt: total number of time periods;
i: discount rate;
tj: time period j (average time of the period) related to the date of analysis.
The NCF for each period is calculated considering the Brazilian R&T fiscal regime:
where:
R: gross revenues from oil and gas sales;
Roy: total amount paid in royalties (charged over gross revenue);
ST: total amount paid in Social Taxes (special taxes on gross revenues);
OC: operational production costs (associated with the oil and water/polymer production and water/polymer injection);
T: corporate tax rate;
Inv: investments in equipment and facilities (platform, production and injection wells, network systems, pipelines, etc.);
AC: abandonment cost.
The Expected Monetary Value (EMV) is computed by applying Equation (3), defined as the NPV sum of each uncertain model multiplied by its respective probability of occurrence:
The platform investments are calculated using Equation (4). Some parameters were incorporated in this equation, modifying the first version from [64,65]:
where:
Invplat: investment on platform (106 USD);
CPl: liquid processing capacity (103 m3/d);
CPo: oil processing capacity (103 m3/d);
CPw: water processing capacity (103 m3/d);
Ciw: water injection capacity (103 m3/d);
Cnw: number of wells capacity.
Term 417 in Equation (4) represents fixed costs.
The fiscal assumptions and economic scenario to compute the NPV are listed in Table 6 and Table 7. The costs related to the polymers include the logistics and investments required in the platform.
Table 6.
Fiscal assumptions (data from [50]).
Table 7.
Economic scenario (most-likely) (data from [51]).
2.7.6. Dates and Important Events
Table 8 and Table 9 describe the main dates and events of this study. These correspond to the life cycle period with a duration of 22 years until the end of the concession contract by 2042. The strategy selection of this decision analysis considers this information to calculate Equations (1)–(3).
Table 8.
Timeline events—field production (data from [50]).
Table 9.
Timeline events—cash flow (data from [50]).
2.8. Selected Uncertainties
The optimized strategies’ performance must be evaluated using the probabilistic approach in uncertain models. These equiprobable scenarios or models were created by the combination of uncertain reservoir, operational, and economic attributes. In the next sections, we describe these attributes in tables and show their levels, values, and probability of occurrence.
2.8.1. Reservoir Uncertainties
We selected some static and dynamic properties and polymer parameters as reservoir uncertainties. Regarding the static properties, 100 equiprobable geostatistical realizations (images) were generated by conducting uncertain modeling through geostatistical software Petrel (version 2023.2.0). We used the base case to generate the images based on the distributions of facies, porosity, and permeability. The dynamic uncertainties were the relative permeability, capillary pressure, oil viscosity and PVT, and rock compressibility. In the case of polymer parameters, we evaluated the viscosity, adsorption, IPV, RRF, and polymer injectivity correction by adjusting the well skin factor, since the simulator may present some injectivity issues under polymer injection [62]. Table 10 and Table 11 include data about the reservoir attributes that are considered uncertain.
Table 10.
Uncertainty levels and probabilities of static and dynamic properties of the reservoir.
Table 11.
Uncertainty levels and probabilities of polymer parameters in the reservoir.
2.8.2. Operational Uncertainties
Uncertainties for operational attributes were also considered, as shown in Table 12 and Table 13. The system availability (SA) considers the operational efficiency of platform, groups, and wells. Uncertainties related to well productivity and injectivity use the well index multiplier to represent variations in the well proximity caused by formation damage, and chemical dissolution, among others.
Table 12.
Uncertainty levels and probabilities for operational attributes.
Table 13.
Uncertainty levels and probabilities for well productivity and injectivity attributes.
2.8.3. Economic Uncertainties
We also defined an optimistic and a pessimistic economic scenario with regard to the most-likely economic scenario from Section 2.7.5 of this work. The terms optimistic and pessimistic refer to the price of oil, since the investments and operational costs generally increase under optimistic oil prices; on the other hand, they decrease under pessimistic prices. The values and probability of occurrence for the economic scenarios are presented in Table 14.
Table 14.
Pessimistic, most-likely, and optimistic economic scenarios for the uncertain analysis.
2.8.4. Software Used
The simulation runs were done in ECLIPSE (E100) (version 2021.2) [68] through one processor in serial simulations. We used the ResInsight (version 2021.06.0) [69] for the visualization of the simulation outputs. The uncertain geostatistical modeling of the reservoir was conducted in Petrel (version 2023.2.0) [70]. The MERO software (version 2022.10.1) [71] from our UNISIM group (Simulation and Reservoir Group Management) was coupled with E100 to integrate the workflow of the evaluation process, executing both pre-simulation and pos-processing.
3. Results and Discussion
First, we show the main result of the nominal optimization for all the optimized strategies from the base case (step 6 from [56] because it is the basis of this risk analysis [51]). Through figures, tables, and analysis along each stage of the decision analysis workflow under uncertainties, we present the results to assess our methodology and support the implementation of the best strategy for the case study.
3.1. Summary of the Nominal Optimization for the Base Case
Previous nominal optimization found that the PF + ICV strategy was the best for the base case. It obtained a 50%, 26%, and 4% higher NPV than WF, WF + ICV, and PF, respectively. PF + ICV also produced more oil with a lower production and injection of water among the optimized strategies (see Table 15). However, the differences in the field indicators between PF + ICV and PF were small for NPV and oil production, rendering the ICV controls for the water management responsible for the low gain in the OF. However, the ICVs were more efficient under waterflooding strategies because a more considerable difference in the field indicators was observed for WF + ICV against WF. Table 15 presents the water management costs with polymers included for PF and PF + ICV. Supporting previous results, the PF + ICV strategy had the lowest costs due to the combined operation of polymers with ICV for more efficient water management. In general, conventional completion strategies, such as WF and PF, had higher costs than the ICV strategies WF + ICV and PF + ICV, respectively. Similarly, the efficiency of the ICVs is underscored in waterflooding strategies since the difference in costs between WF and WF + ICV is greater than in PF and PF + ICV.
Table 15.
Field indicators of the optimized strategies from the base case.
3.2. Initial Risk Analysis
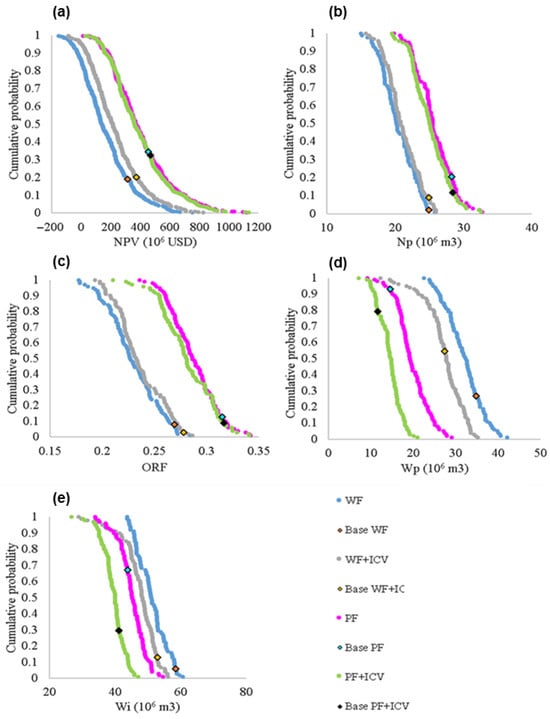
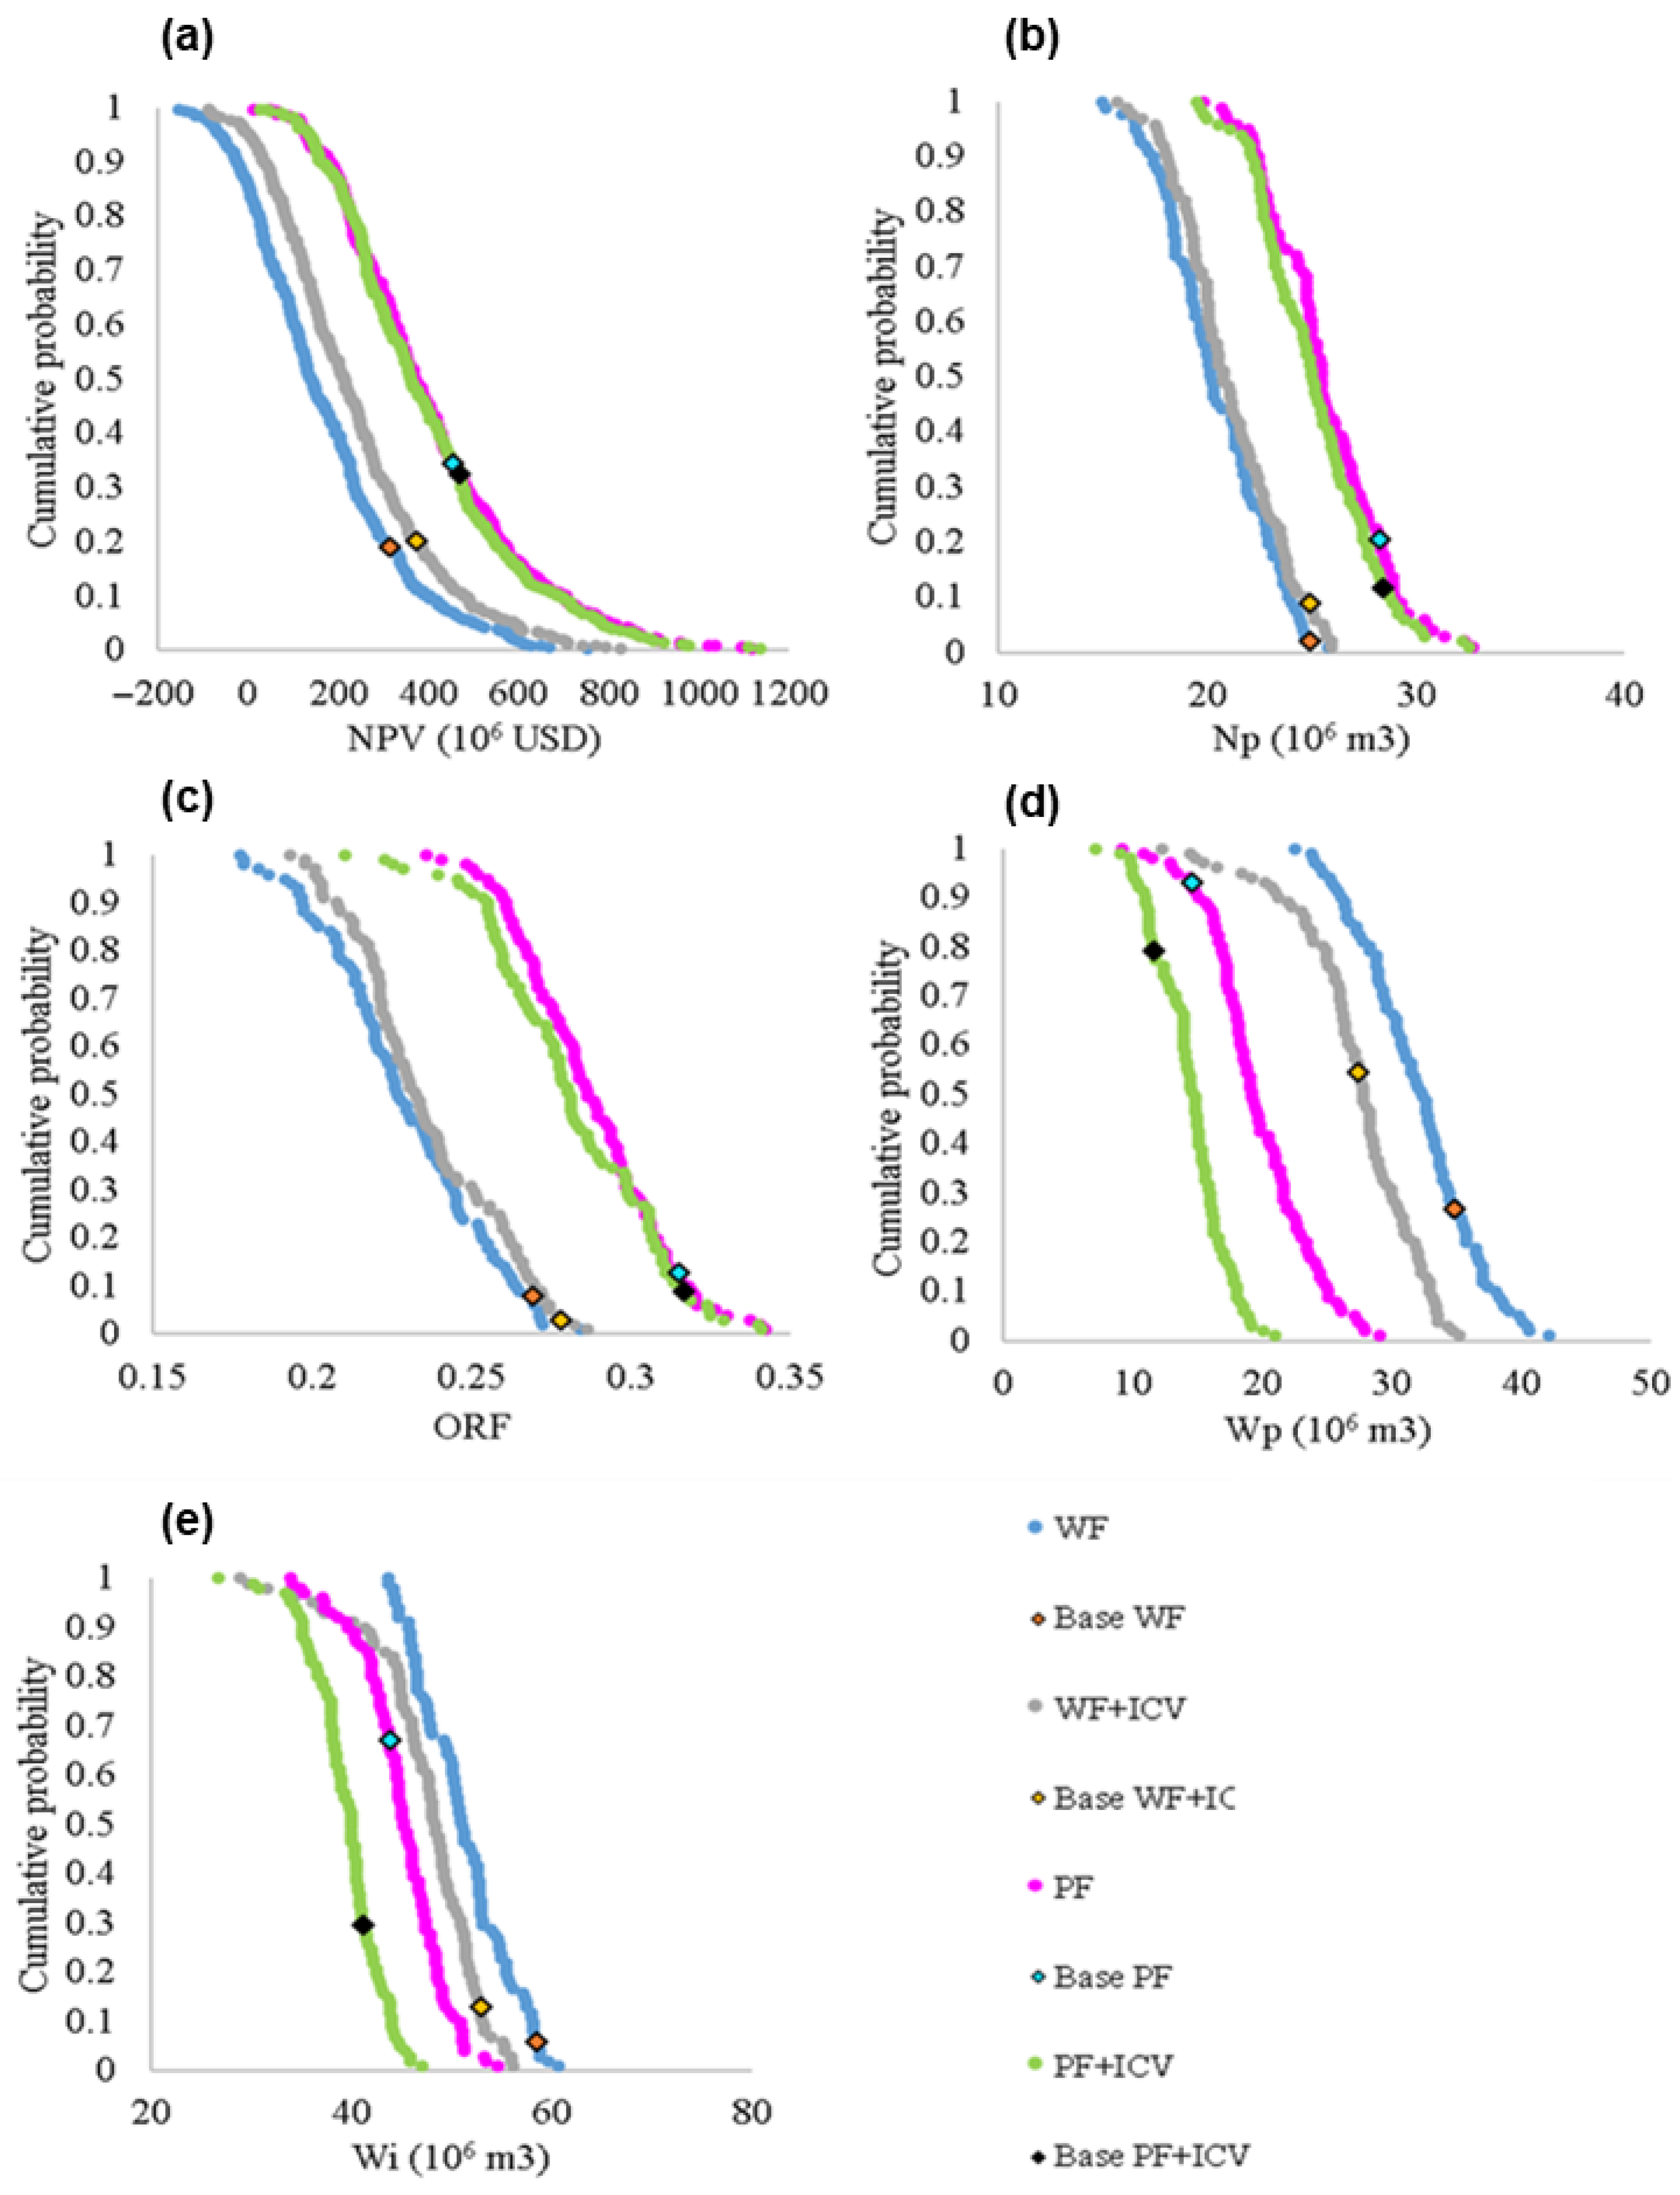
Once the uncertainties were combined, the optimized strategies from the base case were simulated in the 100 uncertain equiprobable models, generating the initial risk curves presented in Figure 4. From the NPV risk curves, the polymer strategies had a small difference in NPV, but they obtained potentially higher economic returns while the waterflooding strategies showed lower gains with the risk of providing negative returns. The field indicators showed that the polymer strategies produce more oil with better water management. In the case of the strategies with ICVs, they were more efficient in producing and injecting less water when injecting either water or polymers. However, the strategies under waterflooding presented a higher difference in NPV values than the polymers, which proves that ICVs are more useful for waterflooding.
Figure 4.
Initial risk evaluation of the optimized strategies from the base case in the uncertain models: (a) net present value (NPV), (b) Np (oil production), (c) ORF (oil recovery factor), (d) Wp (production of water, and (e) Wi (injection of water). WF strategy in blue, WF + ICV strategy in gray, PF strategy in pink, and PF + ICV in green. Orange rhombus: values of WF in the base case; yellow rhombus: values of WF + ICV in the base case; light blue rhombus: values of PF in the base case, and black rhombus: values of PF + ICV in the base case.
These initial results under uncertainties confirm the findings from the nominal optimization since the polymer strategies were better than the waterflooding ones. Nevertheless, the difference in the NPV values between PF and PF + ICV was small, so more studies are needed to select the best strategy.
3.3. Selection of the Best Strategies
The EMV values for the optimized strategies from the base case are shown in Table 16. Contrary to the finding of nominal optimization for the base case, PF + ICV was not the best strategy; instead, PF was initially the best strategy under uncertainties since it obtained the highest EMV value. However, its difference with the PF + ICV strategy was again marginal in terms of EMV, making the intelligent completion advantageous due to the better water management when considering an energy efficiency point of view.
Table 16.
EMV values for the optimized strategies from the base case.
The superior EMV values for PF and PF + ICV also demonstrated that it is better for the case to inject polymers over simply waterflooding. Additionally, the ICV’s efficiency proves that it is advantageous for waterflooding because of the higher EMV difference between WF and WF + ICV.
Based on the small difference in EMV values, the oil production and water management, and the exposed potential gains, risks, and operability, we selected the PF and PF + ICV strategies as the best strategies for further studies in this decision analysis.
3.4. Selection of a P10 and a P90 Model
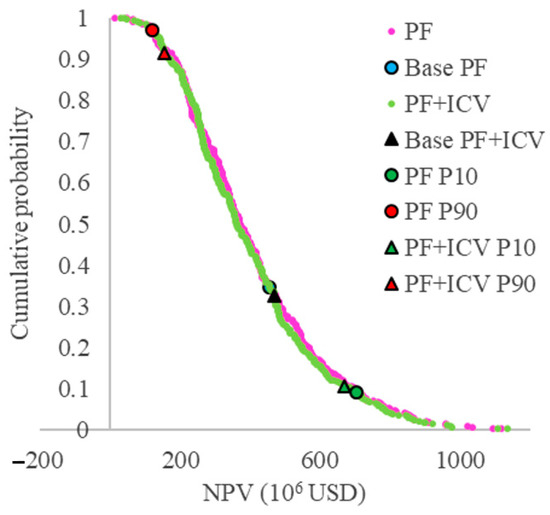
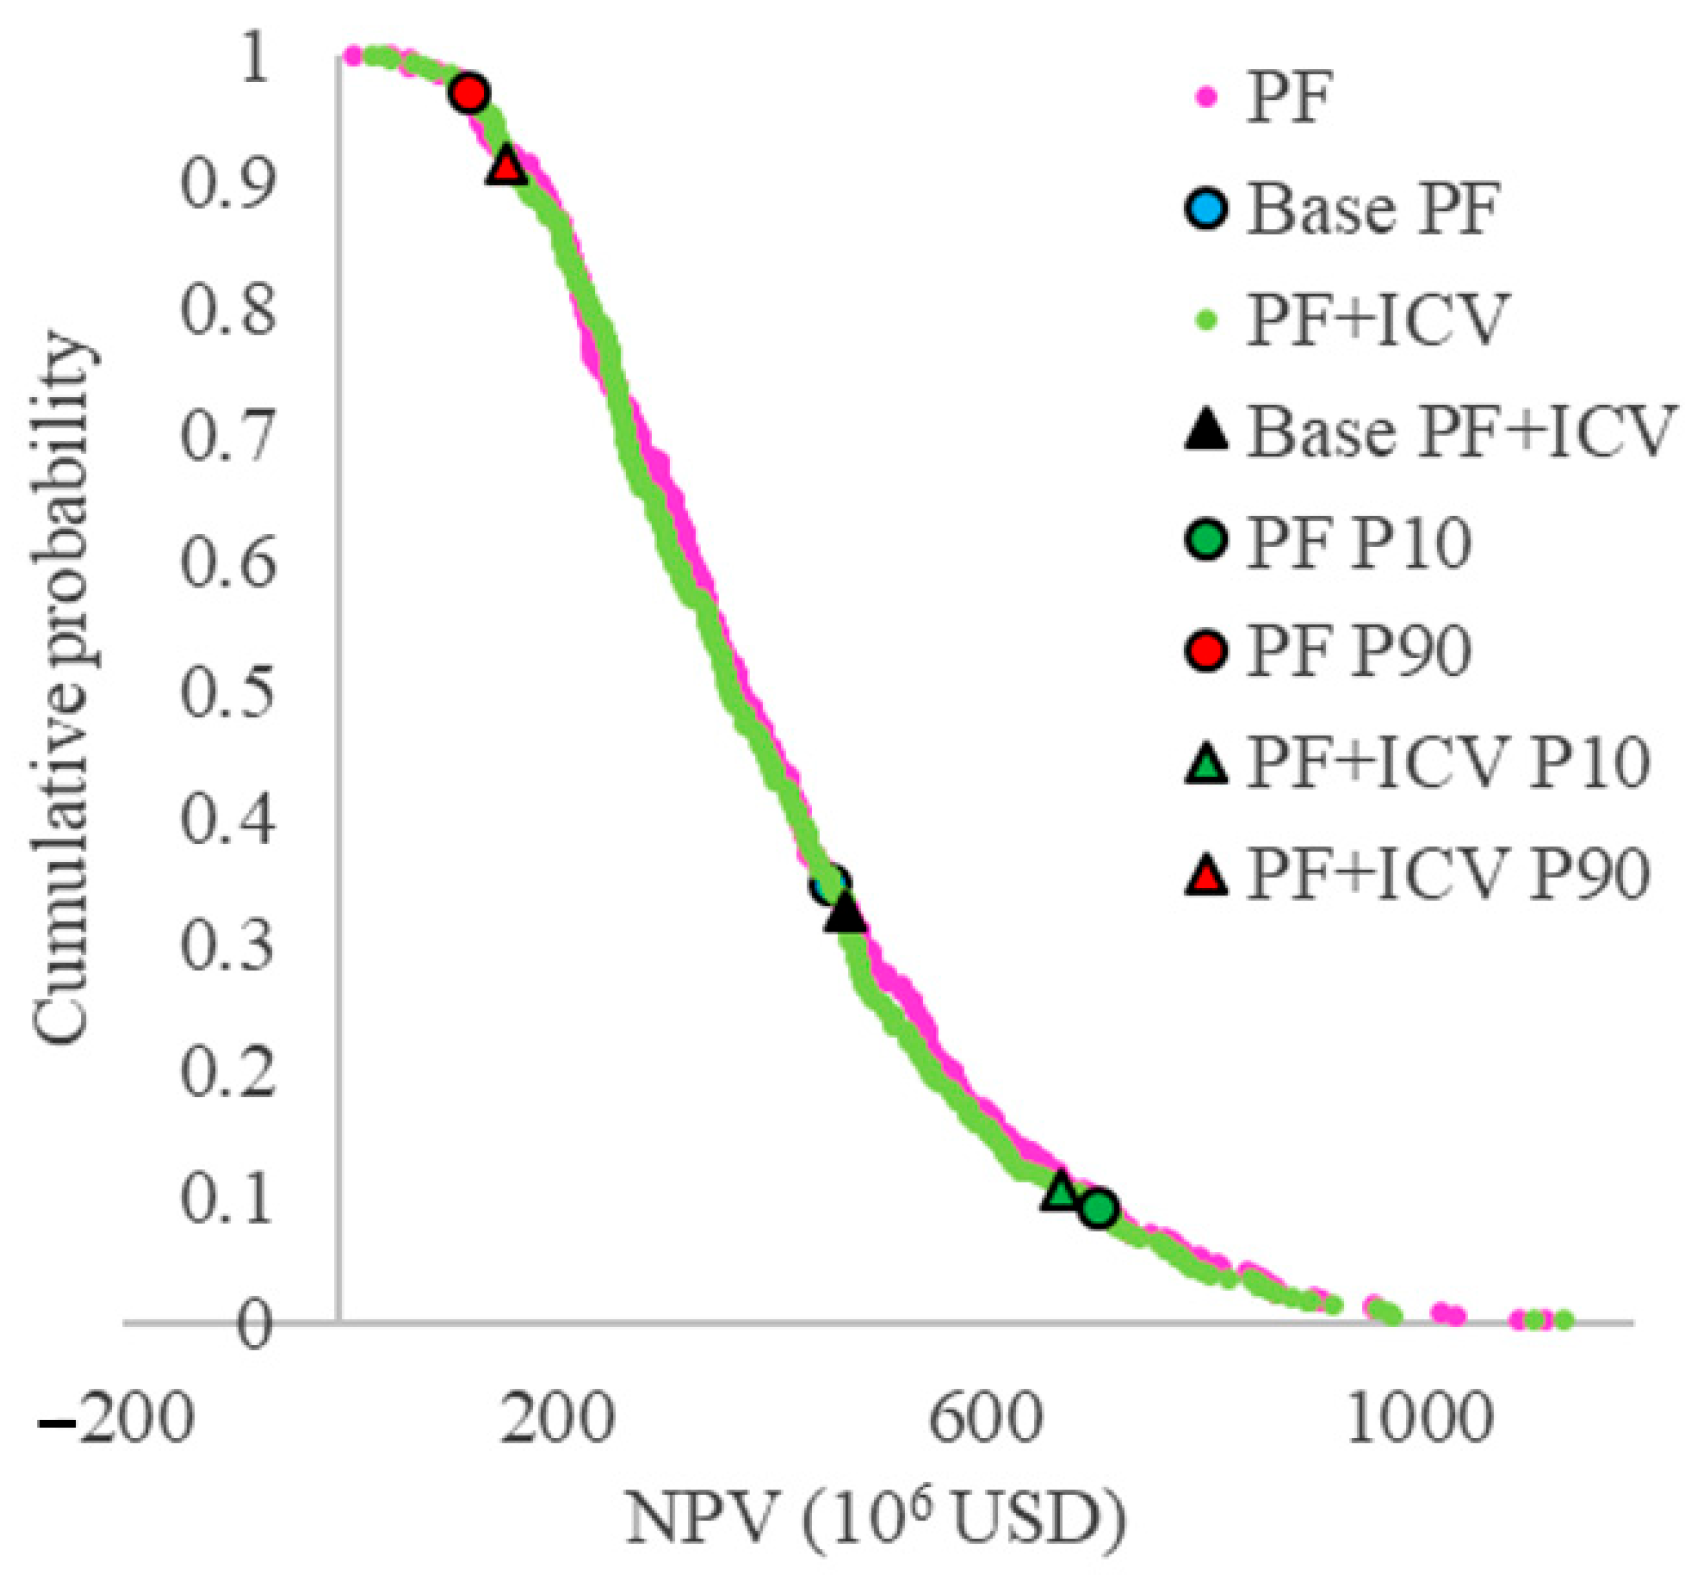
Figure 5 shows the selected P10 (optimistic) and P90 (pessimistic) models from the NPV risk curves for the selected strategies.
Figure 5.
Selected P10 and P90 models for the selected strategies. NPV values of the PF strategy in pink, and PF + ICV in light green. The light blue circle represents the NVP value of PF in the base case, and the black triangle for PF + ICV. Dark green circle NVP value of PF in P10, and dark green triangle for PF + ICV. Red circle NVP value of PF in P90, and red triangle for PF + ICV.
3.5. G2L Optimization
Table 17 includes the optimization results of the G2L variables for the selected strategies in the P10 and P90 models, and their values obtained in the base case as a reference. The following findings about the optimized variables were achieved among the optimized strategies:
Table 17.
Optimized G2L variables for PF and PF + ICV in the P10 and P90 models, and base case as reference.
- More well flow rate controls were necessary for the producers in the PF + ICV strategies, and most of the production wells in the PF strategies operated at maximum capacity. Regarding the injection wells, they operated at maximum capacity in the three models for the PF strategies, thus confirming that it is better to inject as much as possible.
- It was not necessary to shut in wells due to the high water cut in the P10 (optimistic) model for the selected strategies. Thus, the production wells under polymer injection must operate during the entire life cycle in the optimistic case.
- The same behavior in the polymer concentration, number, and duration of the polymer slug size was found for the selected strategies in the three models. Only two slugs were needed, starting the injection with polymers, and then one slug of water. PF + ICV strategies inject the polymer at higher concentrations for shorter periods, while PF strategies inject at lower concentrations for a longer time.
- The ICVs were efficient in water management, especially for the base case and pessimistic case (P90), since the ICV controls (based on the water cut) were activated at greater values due to a faster and larger water production through the wells. As the optimistic case did not present severe problems with water production, the ICV controls were activated mainly to manage the reservoir pressure using lower water cut values.
- Regarding the apportionment method, the well potential (WP) method was selected for the strategies in the P10 and P90 models, which differs from the best method of the base case. The well guide rate control operated better in the base case because the operational efficiency of the platform and wells was considered to be 100%. Accordingly, the WP method operates better under a lower operational efficiency of either the platform or wells.
Table 18 lists the field indicators of the selected strategies optimized in the base case, before and after the optimization process of the G2L variables for the P10 and P90 models. Overall, the PF + ICV strategies had better performance after conducting the optimization. However, it is necessary to evaluate their response in all the uncertain models because the differences with PF strategies were still small for these specific models (base case, P10, and P90). Before optimization, the PF + ICV strategy presented better field indicators in the P90; in the same way, the PF strategy was better in the P10. Considering the increase in the NPV after the G2L optimization, they had an opposite result: the PF + ICV had a higher increase (14.3%) than PF (4.4%) in the P10. In the P90, PF was better obtaining a 5.9% NPV increase compared to 3.8% from PF + ICV. As a result, once optimized, the PF strategies could respond better to the uncertain models when optimized from a pessimistic case; on the other hand, the PF + ICV may present good results when optimized from an optimistic case. According to water management costs, strategies that combine polymers with IVCs showed consistently lower costs than those that inject polymers alone. This result was especially evident in the most optimistic scenario, P10, which showed the greatest difference.
Table 18.
G2L optimization results for PF and PF + ICV in P10, P90, and base case as reference.
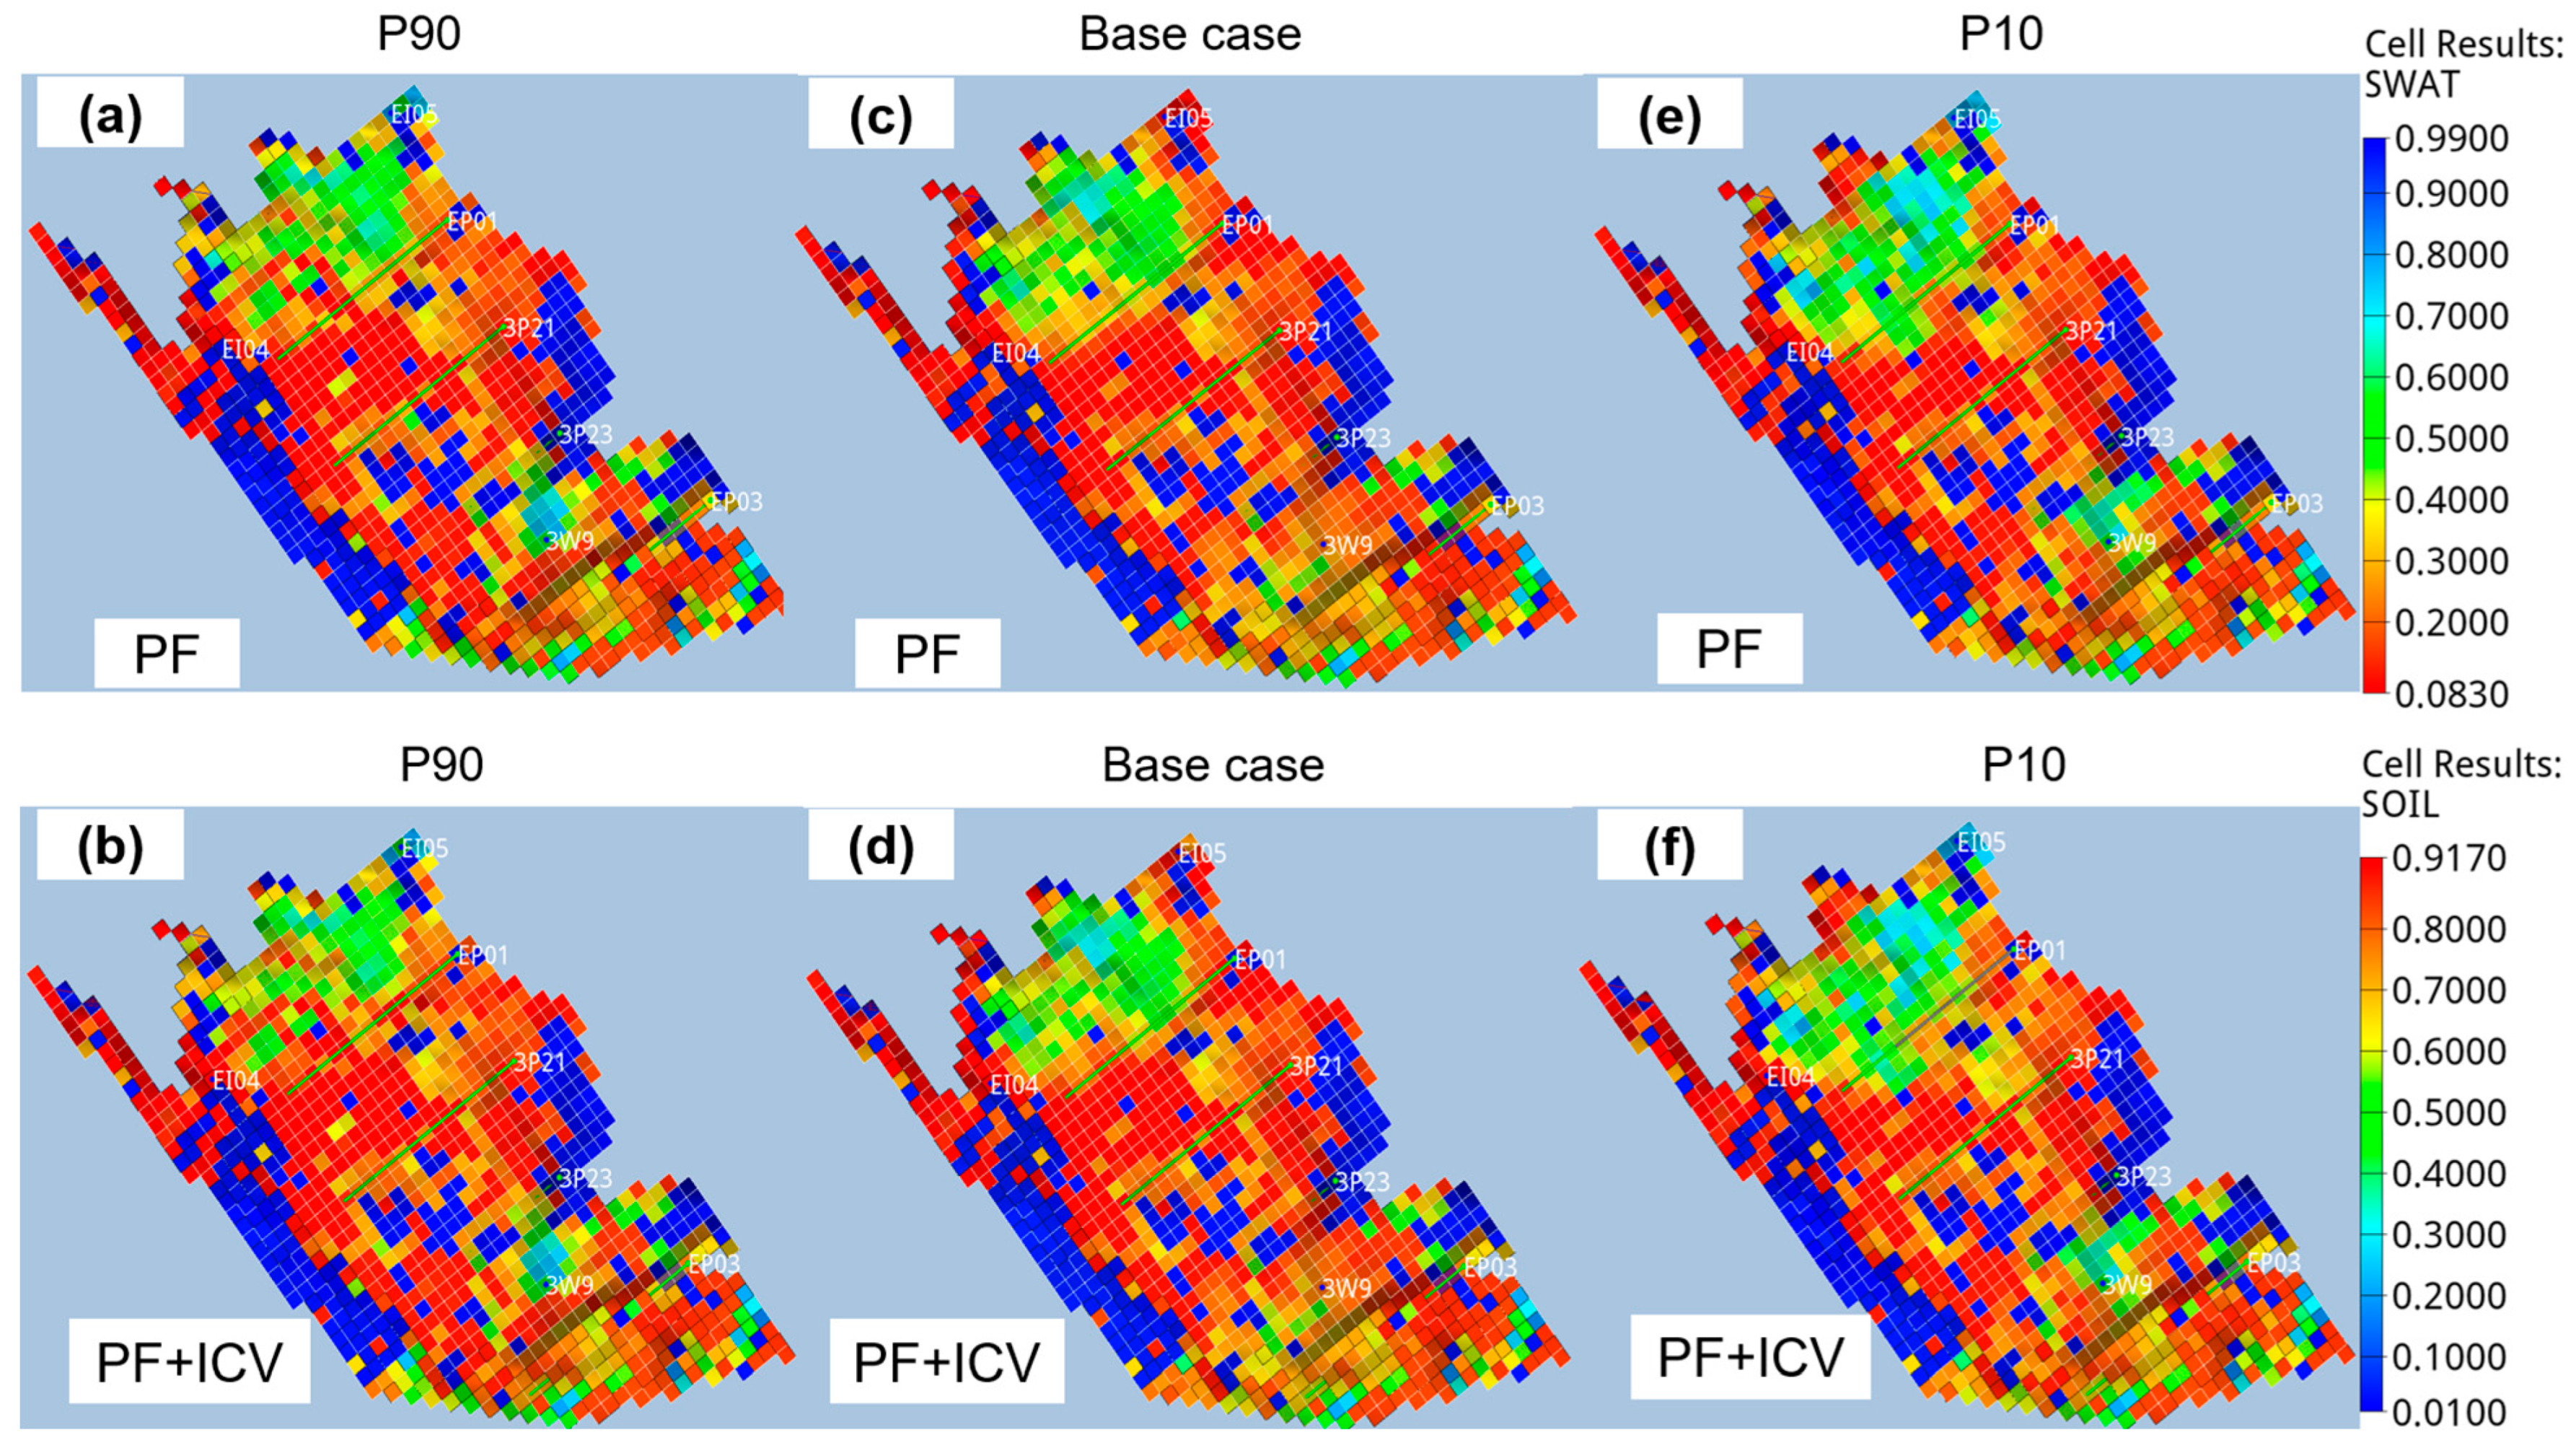
To better visualize the performance of the PF and PF + ICV strategies in the P90, base, and P10 scenarios with optimized G2L, Figure 6 displays fluid (water and oil) saturation maps. As the scenarios progress from pessimistic to base to optimistic, the sweep efficiency increases; however, the strategies with intelligent completion exhibit a more controlled sweep and, therefore, greater oil drainage.
Figure 6.
Fluid saturation maps (SWAT: water saturation, and SOIL: oil saturation), on layer 20 on 1st Jan 2030, of the G2L optimized strategies PF and PF + ICV in the P90, base, and P10 cases: (a) PF in P90, (b) PF + ICV in P90, (c) PF in base case, (d) PF + ICV in base case, (e) PF in P90, and (f) PF + ICV in P90.
3.6. Crossed Simulation
We ran a crossed simulation considering the optimized strategies and the models used for their optimization procedures, following the nomenclature:
- PF opt: PF strategy optimized from P10;
- PF + ICV opt: PF + ICV strategy optimized from P10;
- PF bc: PF strategy optimized from the base case;
- PF + ICV bc: PF + ICV strategy optimized from the base case;
- PF pes: PF strategy optimized from P90;
- PF + ICV pes: PF + ICV strategy optimized from P90.
To indicate if the optimization process had acceptable results for the strategies in the applied models, we expect that the optimized strategies present the highest NPV values in the models in which they were optimized. As shown by Table 19, the NPV values of the crossed simulation found the expected results for the strategies above (see the NPV values in bold).
Table 19.
Crossed simulation of the optimized strategies in the P10, base case, and P90 models.
3.7. Final Risk Curves and Decision Analysis
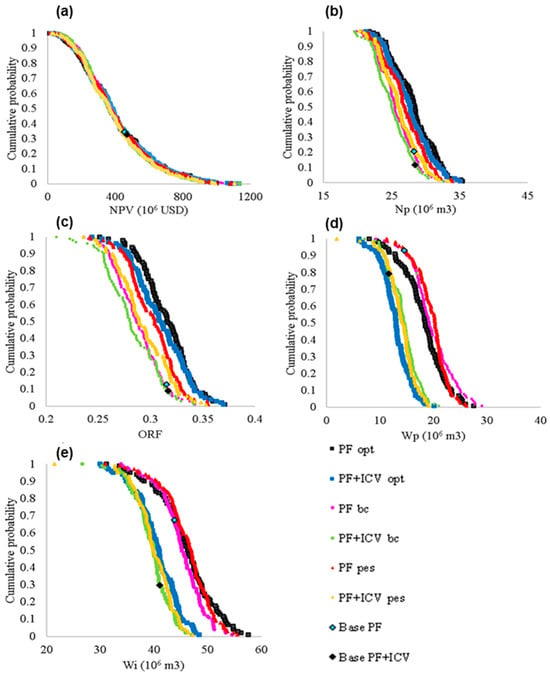
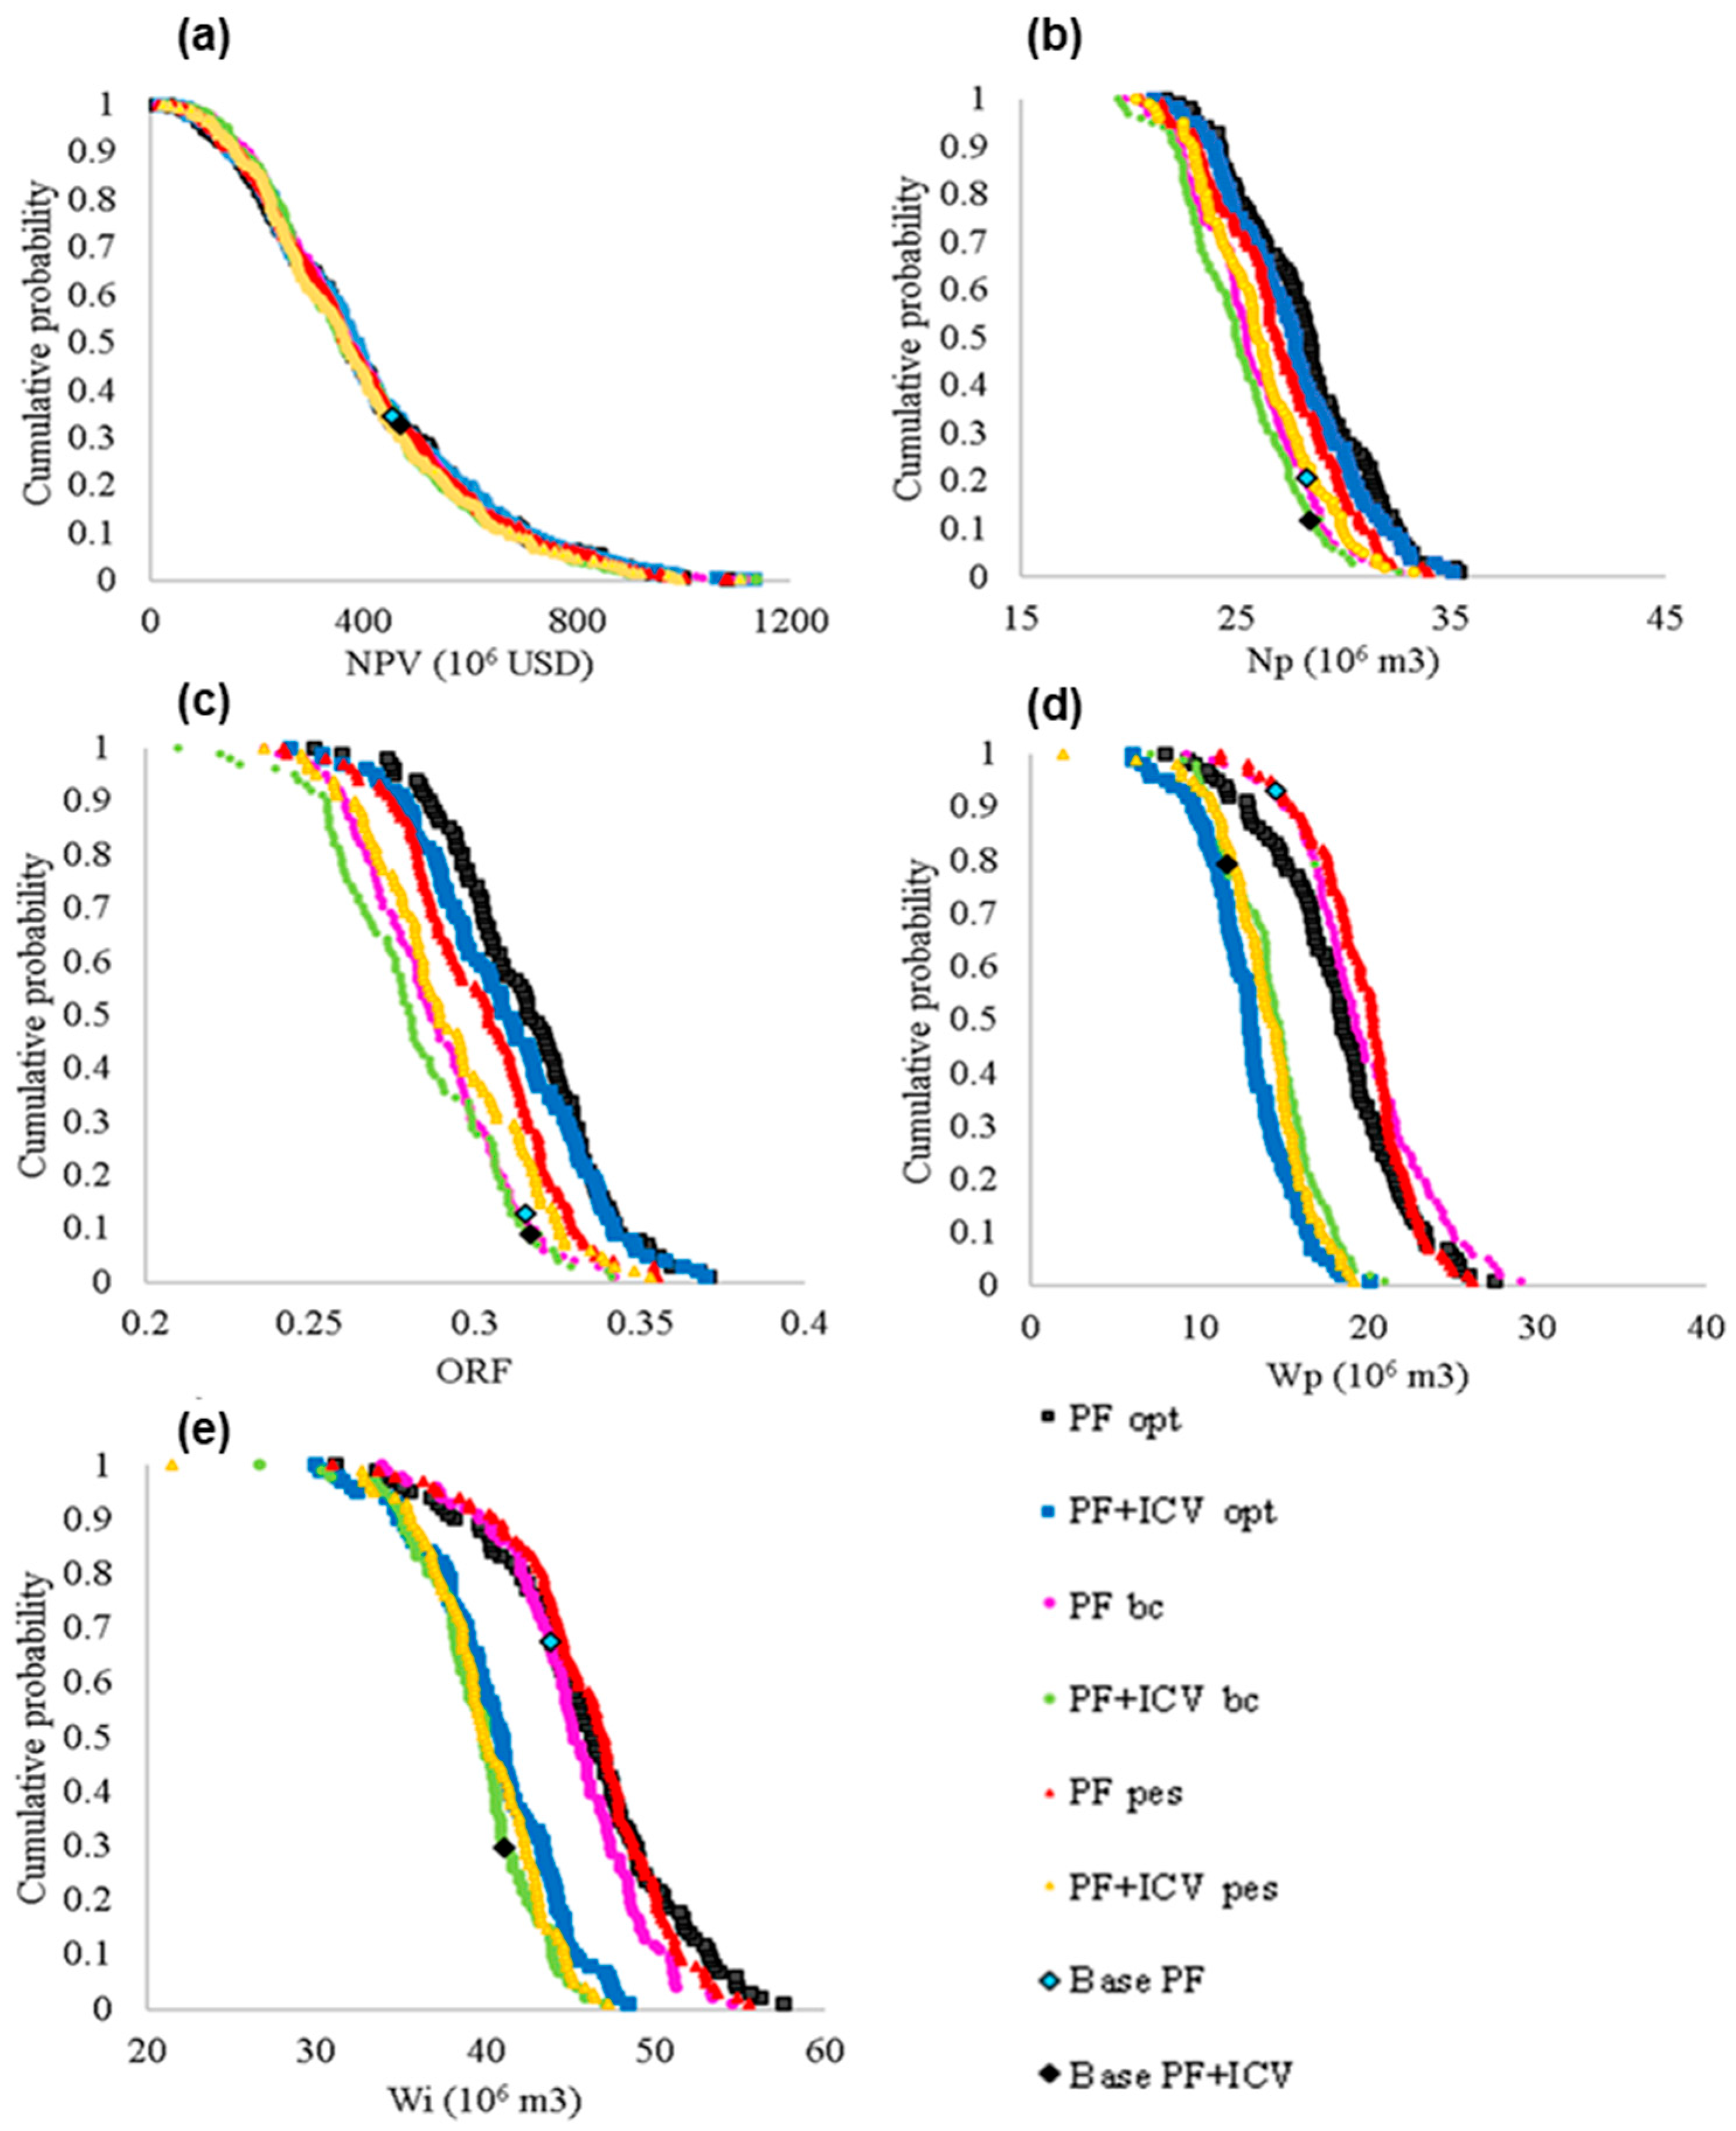
The final risk curves of the NPV and field indicators for the optimized strategies from P10, base case, and P90 are illustrated in Figure 7. The optimized strategies provided similar results to the initial risk analysis, indicating that it is not necessary to select more representative models for the production strategy optimization in the decision analysis, as recommended in the original methodology proposed by [56]. The PF and PF + ICV again presented smaller differences in the NPV risk curves; however, some differences in the oil production and water management can be observed from the risk curves of the field indicators. Like previous studies [47,48,49], the PF strategies produced more oil while the PF + ICV strategies produced and injected less water, making the ICV completion attractive for the water management (lower operation and water management costs).
Figure 7.
Final risk curves of the optimized strategies from the P10, base case, and P90 in the uncertain models: (a) net present value (NPV), (b) Np (oil production), (c) ORF (oil recovery factor), (d) Wp (production of water), and (e) Wi (injection of water). PF opt in black squares, PF + ICV in blue squares, PF bc in pink squares, PF + ICV bc in green squares, PF pes in red squares, and PF + ICV pes in yellow squares. Light blue rhombus: values of PF in the base case, and black rhombus: values of PF + ICV in the base case.
However, based on our proposed methodology, the best strategy is selected based on the EMV. Table 20 lists the EMV values of the optimized strategies from the optimistic case P10 (suffix opt), base case (suffix bc), and pessimistic case P90 (suffix pes). Like previous studies from the G2L optimization for the P10 and P90 of the selected strategies, the PF + ICV is potentially better when improved for the optimistic case, but PF provided higher economic returns when optimized for the pessimistic case. Consequently, we finally selected the PF strategy as the best for the case since it presented the highest EMV values when optimized from the base case and pessimistic case, overcoming the polymer strategies with the use of intelligent wells. However, the decision to use intelligent completion can be made according to the objectives of each decision-maker since PF EMV values also showed a marginal difference with the ICV strategies, which were more flexible for water management even though they produced slightly less oil.
Table 20.
EMV values for the optimized strategies from the P10, base case, and P90.
4. Conclusions
We presented a methodology to complement the decision analysis for the selection of production strategies under uncertainty for the development and management of a sandstone heavy-oil reservoir using model-based reservoir simulation, and combining waterflooding, polymers, and intelligent wells, considering a probabilistic approach and uncertain scenarios. The main idea was to present an efficient and practical procedure that could be applied to similar cases.
For this particular case (EPIC001), based on the EMV, we found it more viable to implement the PF strategy, reaching our main decision by evaluating the polymers and the use of intelligent wells among all the studied strategies.
ICVs are more recommended when comparing waterflooding strategies since significant differences in EMV and NPV values were observed between WF + ICV and WF. Instead, small differences in these indicators were present for PF against PF + ICV.
The PF + ICV strategy showed better results than PF in the management of water, and NPV values after optimization processes (specific models). Thus, the decision to use the ICVs depends on a project target (principal OF, secondary OFs, additional investments, ORF, water management, ICVs, and polymer failures).
Author Contributions
Conceptualization, D.S. and V.B.; methodology, A.P., V.B., A.S. (Antonio Santos) and D.S.; software, A.S. (Antonio Santos); validation, A.P., D.S., A.S. (Arne Skauge) and T.S.; formal analysis, A.P.; investigation, A.P.; resources, D.S. and V.B.; data curation, A.P., A.S. (Arne Skauge) and T.S.; writing—original draft preparation, A.P.; writing—review and editing, A.P., V.B., A.S. (Antonio Santos), D.S., A.S. (Arne Skauge) and T.S.; visualization, A.P., V.B., A.S. (Antonio Santos), D.S., A.S. (Arne Skauge) and T.S.; supervision, D.S. and A.S. (Arne Skauge); project administration, D.S. and V.B.; funding acquisition, D.S. and V.B. All authors have read and agreed to the published version of the manuscript.
Funding
This research was funded by The São Paulo Research Foundation—FAPESP grant number 2020/13994-8.
Data Availability Statement
The original contributions presented in this study are included in the article. Further inquiries can be directed to the corresponding author.
Acknowledgments
This work was conducted with the support of the project registered under ANP number 24174-5 as “EPIC (Energy Production Innovation Center)—Research Line 1 (RL1)—Reservoir Management” (Universidade Estadual de Campinas (UNICAMP)/Equinor Brazil/FAPESP/ANP), hosted by UNICAMP and funded by Equinor Brazil and FAPESP (grants number 2017/15736-3 and 2020/13994-8), under the ANP R&D levy as “Compromisso de Investimentos com Pesquisa e Desenvolvimento”. The authors also thank Energi, UNISIM, School of Mechanical Engineering, Centro de Estudos de Energia e Petróleo (CEPETRO), University of Bergen, and Energy Research Norway for supporting this work, as well as SLB for the software licenses.
Conflicts of Interest
The authors declare the following financial interests/personal relationships which may be considered as potential competing interests: Andres Fernando Peralta Sanchez reports financial support was provided by the State of Sao Paulo Research Foundation. If there are other authors, they declare that they have no known competing financial interests or personal relationships that could have appeared to influence the work reported in this paper.
Abbreviations
The following abbreviations are used in this manuscript:
| AP | apportionment method for producers/G2L variable |
| BHP | well bottom hole pressure |
| CGinej | cost associated with gas injection in period ‘i’ |
| CGj | cost associated with produced gas in period ‘i’ |
| Cinjej | cost associated with water injection in period ‘i’ |
| COj | cost associated with produced oil in period ‘i’ |
| CPL | liquid processing capacity in the platform/G1 variable |
| CPO | oil processing capacity in the platform/G1 variable |
| CPW | water processing capacity in the platform/G1 variable |
| CPWi | water injection capacity in the platform/G1 variable |
| CWj | cost associated with produced water in period ‘i’ |
| DLHG | discrete Latin Hypercube with geostatistics |
| E100 | ECLIPSE 100 simulator |
| EMV | Expected Monetary Value |
| EOR | enhanced oil recovery |
| G1 | project variables |
| G2L | operational variables |
| i | discount rate |
| ICV | inflow control valve |
| ICV controls | control of ICVs for production and injection Wells |
| ICV_Wc_lim | ICV water cut limit/G2L variable |
| ICV_Wi_Δ | relative difference of cumulative injected water between the ICV zones/G2L variable |
| ICVs | inflow control valves |
| IDLHC | Iterative Discrete Latin Hypercube |
| Invwell | investment in the well |
| IR | well injection flow rate/G2L variable |
| IW | intelligent well |
| IWs | intelligent wells |
| j | index that varies from 0 to ‘n’ |
| Lp | cumulative liquid production |
| NCF | net cash flow |
| Np | cumulative oil production |
| NPV | net present value |
| OF | objective function |
| ORF | oil recovery factor |
| PF | polymer flooding strategy using conventional wells (without ICVs) |
| PF + ICV | polymer flooding strategy with ICVs |
| PR | well production flow rate/G2L variable |
| RE | reservoir engineering |
| RGj | revenue from sales of gas in period ‘i’ |
| Roj | revenue from sales of oil in period ‘i’ |
| rw | well radius |
| t | time period |
| W_grc_o | well guide rate control for oil phase—apportionment method/G2L variables |
| W_grc_w | well guide rate control for water phase—apportionment method/G2L variables |
| W_Wc_lim | well water cut limit/G2L variable |
| WF | strategy under waterflooding only (without ICV) |
| WF + ICV | waterflooding strategy with ICVs |
| Wi | cumulative water injection |
| Winj | cumulative water injected |
| WL | well location/G1 variable |
| WP | well’s potential—apportionment method/G2L variable |
| Wp | cumulative water production |
| WT | type of wells/G1 variable |
References
- Carosio, M.; Nava, F.; Michelez, J.; Montanaro, A. An Innovative Approach for Portfolio Analysis and Investment Decisions in the Oil and Gas Industry. In Proceedings of the Offshore Mediterranean Conference and Exhibition, Ravenna, Italy, 27–29 March 2019. [Google Scholar]
- Obidike, P.; Nwosi-Anele, A. Techniques for Investment Decision Making for Oil and Gas Assets. In Proceedings of the Society of Petroleum Engineers—SPE Nigeria Annual International Conference and Exhibition, NAIC, Lagos, Nigeria, 31 July–2 August 2023. [Google Scholar]
- Abdulfatah, H.K.; Stanley, O.I.; Nzerem, P.; Jakada, K. Defining the Optimal Development Strategy to Maximize Recovery and Production Rate from an Integrated Offshore Water-Flood Project. In Proceedings of the SPE Nigeria Annual International Conference and Exhibition, Lagos, Nigeria, 5–7 August 2019. [Google Scholar]
- Li, M.; Wang, Q.; Yao, C.; Chen, F.; Wang, Q.; Zhang, J. Optimization of Development Strategies and Injection-Production Parameters in a Fractured-Vuggy Carbonate Reservoir by Considering the Effect of Karst Patterns: Taking C Oilfield in the Tarim Basin as an Example. Energies 2025, 18, 319. [Google Scholar] [CrossRef] [Scilit]
- Schiozer, D.J.; Botechia, V.E.; Pires, L.C.O. Model-Based Petroleum Field Management in Three Stages: Life-Cycle, Short-Term, and Real-Time. In Proceedings of the Offshore Technology Conference Asia, OTCA, Kuala Lumpur, Malaysia, 27 February–1 March 2024. [Google Scholar]
- Toktas, O.L.; Nguyen, Q.M.; Onur, M.; Alpak, F.O. Nonlinearly Constrained Life-Cycle Production Optimization Under Geological Uncertainty: A Realistic Application. In Proceedings of the SPE Annual Technical Conference and Exhibition, New Orleans, LA, USA, 30 September–2 October 2024; pp. 7023–7036. [Google Scholar]
- Perrone, A.; Della Rossa, E. Optimizing Reservoir Life-Cycle Production Under Uncertainty: A Robust Ensemble-Based Methodology. In Proceedings of the SPE Reservoir Characterisation and Simulation Conference and Exhibition, Abu Dhabi, United Arab Emirates, 14–16 September 2015. [Google Scholar]
- Mahjour, S.K.; Badhan, J.H.; Faroughi, S.A. Uncertainty Quantification in CO2 Trapping Mechanisms: A Case Study of PUNQ-S3 Reservoir Model Using Representative Geological Realizations and Unsupervised Machine Learning. Energies 2024, 17, 1180. [Google Scholar] [CrossRef] [Scilit]
- Mirzaei-Paiaman, A.; Santos, S.M.G.; Schiozer, D.J. Optimization of design variables and control rules in field development under uncertainty: A case of intelligent wells and CO2 water alternating gas injection. Geoenergy Sci. Eng. 2023, 227, 211854. [Google Scholar] [CrossRef] [Scilit]
- Qiu, R.; Li, Z.; Zhang, Q.; Yao, X.; Xie, S.; Liao, Q.; Wang, B. A Realistic and Integrated Model for Evaluating Offshore Oil Development. J. Mar. Sci. Eng. 2022, 10, 1155. [Google Scholar] [CrossRef] [Scilit]
- Browning, J.; Gorell, S.; Andrews, J. Efficient Optimization and Uncertainty Analysis of Field Development Strategies by Incorporating Economic Decisions in Reservoir Simulation Models. In Proceedings of the SPE Asia Pacific Oil & Gas Conference and Exhibition, Virtual, 17–19 November 2020. [Google Scholar] [CrossRef] [Scilit]
- Meira, L.A.A.; Coelho, G.P.; da Silva, C.G.; Abreu, J.L.A.; Santos, A.A.S.; Schiozer, D.J. Improving representativeness in a scenario reduction process to aid decision making in petroleum fields. J. Pet. Sci. Eng. 2020, 184, 106398. [Google Scholar] [CrossRef] [Scilit]
- Li, M. Risk Prediction of Gas Hydrate Formation in the Wellbore and Subsea Gathering System of Deep-Water Turbidite Reservoirs: Case Analysis from the South. Reserv. Sci. 2025, 1, 52–72. [Google Scholar] [CrossRef] [Scilit]
- Cao, L.; Lv, M. Effects of Crosslinking Agents and Reservoir Conditions on the Propagation of Fractures in Coal Reservoirs During Hydraulic Fracturing. Reserv. Sci. 2025, 1, 36–51. [Google Scholar] [CrossRef] [Scilit]
- Delamaide, E.; Bazin, B.; Rousseau, D.; Degre, G. Chemical EOR for Heavy Oil: The Canadian Experience. In Proceedings of the SPE EOR Conference at Oil and Gas West Asia, Muscat, Oman, 26–28 March 2014. [Google Scholar]
- Guo, K.; Li, H.; Yu, Z. In-situ heavy and extra-heavy oil recovery: A review. Fuel 2016, 185, 886–902. [Google Scholar] [CrossRef] [Scilit]
- De Bento, H.; Moreno, R.B. Evaluation of Heavy Oil Recovery Factor by Water Flooding and Polymer Flooding at Different Temperatures. In Proceedings of the SPE Latin America and Caribbean Heavy and Extra Heavy Oil Conference, Lima, Peru, 19–20 October 2016. [Google Scholar]
- Liu, J.; Liu, S.; Gao, P.; Zhang, Q.; Liu, Y.; Chen, X.; Zhong, L.; Lin, Y. Efficient development strategies for heavy oil reservoirs with a focus on rational utilization of water resources. Sep. Purif. Technol. 2025, 362, 131943. [Google Scholar] [CrossRef] [Scilit]
- Reichenbach-Klinke, R.; Zimmermann, T.; Stavland, A.; Strand, D. Temperature-Switchable Polymers for Improved Oil Recovery. In Proceedings of the SPE Norway One Day Seminar, Bergen, Norway, 18 April 2018. [Google Scholar] [CrossRef] [Scilit]
- Zhao, Y.; Yin, S.; Seright, R.S. Enhancing Heavy-Oil-Recovery Efficiency by Combining Low-Salinity-Water and Polymer Flooding. SPE J. 2020, 26, 1535–1551. [Google Scholar] [CrossRef] [Scilit]
- Zhang, W.; Liu, Y.; Zou, J.; Wang, Q.; Wang, Z.; Zhao, Y.; Sun, X. Comprehensive Experimental Study of Steam Flooding for Offshore Heavy Oil Recovery After Water Flooding. Energies 2025, 18, 3140. [Google Scholar] [CrossRef] [Scilit]
- Needham, R.B.; Doe, P.H. Polymer Flooding Review. J. Pet. Technol. 1987, 39, 1503–1507. [Google Scholar] [CrossRef] [Scilit]
- David, E.; McDougall, S.R.; Mackay, E.J.; Ogbeiwi, P. Polymer Flooding Dynamics in Enhanced Oil Recovery: A Pore-Scale Study of the Influence of Shear-Thinning Rheology on Flow Dynamics and Recovery Efficiency. J. Appl. Polym. Sci. 2025, 142, e57189. [Google Scholar] [CrossRef] [Scilit]
- Delamaide, E. Polymer flooding of heavy oil—From screening to full-field extension. In Proceedings of the Society of Petroleum Engineers—SPE Heavy and Extra Heavy Oil Conference, Latin America, Medellín, Colombia, 24–26 September 2014; LAHO; pp. 707–736. [Google Scholar]
- Beteta, A.; Sorbie, K.S.; Johnson, G. Immiscible viscous fingering at the field scale: Numerical simulation of the captain polymer flood. SPE J. 2023, 28, 3165–3179. [Google Scholar] [CrossRef] [Scilit]
- Beteta, A.; Sorbie, K.S.; McIver, K.; Johnson, G.; Gasimov, R.; Van Zeil, W. The role of immiscible fingering on the mechanism of secondary and tertiary polymer flooding of viscous oil. Transp. Porous Media 2022, 143, 343–372. [Google Scholar] [CrossRef] [Scilit]
- Beteta, A.; Sorbie, K.; Skauge, A.; Skauge, T. Viscous crossflow as the mechanism for polymer enhanced oil recovery in viscous oils: Evidence of crossflow between bypassed oil and viscous fingers. Geoenergy Sci. Eng. 2025, 253, 213968. [Google Scholar] [CrossRef] [Scilit]
- Glandt, C.A. Reservoir management employing smart wells: A review. SPE Drill. Complet. 2005, 20, 281–288. [Google Scholar] [CrossRef] [Scilit]
- Ranjith, R.; Suhag, A.; Balaji, K.; Putra, D.; Dhannoon, D.; Saracoglu, O.; Hendroyono, A.; Temizel, C.; Aminzadeh, F. Production optimization through utilization of smart wells in intelligent fields. In Proceedings of the SPE Western Regional Meeting Proceedings, Bakersfield, CA, USA, 23–27 April 2017; pp. 1284–1312. [Google Scholar]
- Javid, K.; Mustafa, H.; Chitre, S.; Anurag, A.K.; Sayed, M.; Kuliyev, M.; Mishra, A.; Al Hosany, K.; Saeed, Y. Comprehensive ICD/ICV completion design workflow practiced in green oilfield offshore, Abu Dhabi. In Proceedings of the SPE/IADC Middle East Drilling Technology Conference and Exhibition, Abu Dhabi, United Arab Emirates, 12–15 November 2018. [Google Scholar]
- Ma, H.; Yu, C.; Dong, L.; Fu, Y.; Shuai, C.; Sun, H.; Zhu, X. Review of intelligent well technology. Petroleum 2020, 6, 226–233. [Google Scholar] [CrossRef] [Scilit]
- Rilian, N.A.; Hafez, M.; Sukmatiawan, A.; Ageng, C.; Sakti, P.; Firmananda, G. Maximize Oil Recovery of Horizontal Well by Flow Control Device Application at Complex Reservoir in Brownfield Offshore North West Java. In Proceedings of the ADIPEC 2025, Abu Dhabi, United Arab Emirates, 3–6 November 2025; SPE-229933-MS. pp. 1–24. [Google Scholar]
- Botechia, V.E.; Correia, M.G.; Schiozer, D.J. A Model-based Production Strategy Selection Considering Polymer Flooding in Heavy Oil Field Development. In Proceedings of the SPE Trinidad and Tobago Section Energy Resources Conference, Port of Spain, Trinidad and Tobago, 13–15 June 2016. [Google Scholar]
- Udosen, D.J.; Etim, J.O. Optimizing Polymer Flooding Techniques Using Eclipse Simulation Software in a Model Reservoir. In Proceedings of the SPE Nigeria Annual International Conference and Exhibition, Lagos, Nigeria, 4–6 August 2025; pp. 1–10. [Google Scholar]
- Barreto, C.E.A.G.; Botechia, V.E.; Schiozer, D.J. Evaluation of different types of operation for inflow-control-valves based on production and reservoir data. In Proceedings of the SPE Latin American and Caribbean Petroleum Engineering Conference Proceedings, Buenos Aires, Argentina, 21–23 May 2014; Volume 2, pp. 1447–1464. [Google Scholar]
- Martinez, J.K.; Konopczynski, M.R. Integrated Reservoir Management in an Intelligent Well Environment. In Proceedings of the SPE Asia Pacific Oil and Gas Conference and Exhibition, Melbourne, Australia, 8–10 October 2002; p. SPE-77853. [Google Scholar]
- Abreu, A.C.A.; Booth, R.; Bertolini, A.; Prange, M.; Bailey, W.J.; Teixeira, G.; Emerick, A.; Pacheco, M.A. Proactive and reactive strategies for optimal operational design: An application in smart wells. In Proceedings of the OTC Brasil 2015: The Atlantic: From East to West—An Ocean of Innovation, Rio de Janeiro, Brazil, 27–29 October 2015; pp. 1351–1363. [Google Scholar]
- Ilamah, O.; Waterhouse, R. Field-scale production optimization with intelligent wells. In Proceedings of the Society of Petroleum Engineers—SPE Europec featured at 80th EAGE Conference and Exhibition, Copenhagen, Denmark, 11–14 June 2018; pp. 11–14. [Google Scholar]
- Botechia, V.E.; Araújo de Lemos, R.; von Hohendorff Filho, J.C.; Schiozer, D.J. Well and ICV management in a carbonate reservoir with high gas content. J. Pet. Sci. Eng. 2021, 200, 108345. [Google Scholar] [CrossRef] [Scilit]
- Farahi, M.M.; Ahmadi, M.; Dabir, B. Model-based multi-objective particle swarm production optimization for efficient injection/production planning to improve reservoir recovery. Can. J. Chem. Eng. 2022, 100, 503–520. [Google Scholar] [CrossRef] [Scilit]
- Kherroubi, D.; Douik, H.M.; Albarracin, R.; Yuliyanto, T.; Omar, A.A. A Smart, Adaptive Workflow for Lower Completion Optimisation Integrating Proxy Reservoir Models and Lower Completion Challenges with Traditional Design philosophy. In Proceedings of the ADIPEC 2025, Abu Dhabi, United Arab Emirates, 3–6 November 2025; pp. 1–14. [Google Scholar]
- Sheng, J.J. Modern Chemical Enhanced Oil Recovery Theory and Practice; Gulf Professional Publishing: Burlington, MA, USA, 2010. [Google Scholar]
- Lamas, L.F. Influence of Polymer Properties on Selection of Production Strategy For Heavy Oil Fields. Ph.D. Thesis, Universidade Estadual de Campinas, Campinas, Brazil, 2017. [Google Scholar] [CrossRef] [Scilit]
- Lamas, L.F.; Botechia, V.E.; Correia, M.G.; Schiozer, D.J.; Delshad, M. Influence of polymer properties on selection of production strategy for a heavy oil field. J. Pet. Sci. Eng. 2018, 163, 110–118. [Google Scholar] [CrossRef] [Scilit]
- Khlaifat, A.L.; Fakher, S.; Harrison, G.H. Evaluating Factors Impacting Polymer Flooding in Hydrocarbon Reservoirs: Laboratory and Field-Scale Applications. Polymers 2024, 16, 75. [Google Scholar] [CrossRef] [Scilit]
- Zhou, W.; Li, X.; Mouhouadi, R.D.; Xin, C.; Pang, E.; Zhang, J. Novel insights on polymer properties: Their effects on polymer flooding performance in thin heavy oil reservoirs. Pet. Sci. Technol. 2025, 44, 855–878. [Google Scholar] [CrossRef] [Scilit]
- Botechia, V.E.; Correia, M.G.; Schiozer, D.J. Journal of Petroleum Science and Engineering A model-based decision analysis comparing water and polymer flooding in the development of a heavy oil field. J. Pet. Sci. Eng. 2017, 157, 917–929. [Google Scholar] [CrossRef] [Scilit]
- Al Harrasi, A.; Maskari, M.; Urdaneta, G.; Al-Jumah, A.; Badi, S.; Busaidi, I.; Harthy, K.; Abazeed, O.; Moradi, M. Autonomous Outflow Control Technology AOCD in New Water/Polymer Injectors in Heavy Oil Fields from South Sultanate of Oman. In Proceedings of the Abu Dhabi International Petroleum Exhibition & Conference, Abu Dhabi, United Arab Emirates, 15–18 November 2021; pp. 1–10. [Google Scholar]
- Uyoyoh, O.E.; Ojukwu, I.N.; Taiwo, O.A.; Olafuyi, O.O. Application of Smart Well Technology in Polymer Flooding for Heavy Oil Recovery. In Proceedings of the Society of Petroleum Engineers—SPE Nigeria Annual International Conference and Exhibition, NAIC, Lagos, Nigeria, 5–7 August 2024; pp. 1–10. [Google Scholar]
- Peralta, A.F.; Botechia, V.E.; Santos, A.A.; Schiozer, D.J. Geoenergy Science and Engineering. Model-based production strategy optimization for a heavy oil reservoir considering waterflooding and intelligent wells. Geoenergy Sci. Eng. 2024, 246, 213457. [Google Scholar] [CrossRef] [Scilit]
- Peralta, A.F.; Botechia, V.E.; Santos, A.A.S.; Schiozer, D.J.; Skauge, A.; Skauge, T. Model-based production strategy optimization of polymer flooding with intelligent wells for an offshore heavy oil reservoir comparing with waterflooding, waterflooding with ICVs, and polymer flooding. J. Pet. Explor. Prod. Technol. 2026. under reviewing. [Google Scholar]
- Peralta, A.; Botechia, V.; Santos, A.A.; Schiozer, D.; Skauge, A.; Skauge, T. Model-based production strategy optimization for an offshore heavy oil reservoir considering polymer flooding and intelligent wells. Braz. J. Pet. Gas. 2025, 19, 4. [Google Scholar] [CrossRef] [Scilit]
- Ghosh, B.; King, P. Optimisation of Smart Well Completion Design in the Presence of Uncertainty. In Proceedings of the SPE Reservoir Characterization and Simulation Conference and Exhibition, Abu Dhabi, United Arab Emirates, 16–18 September 2013. [Google Scholar]
- González, D.; Stanko, M.; Hoffmann, A. Decision support method for early-phase design of offshore hydrocarbon fields using model-based optimization. J. Pet. Explor. Prod. Technol. 2020, 10, 1473–1495. [Google Scholar] [CrossRef] [Scilit]
- Sori, A.; Sharifi, M.; Jabari, N. Robust multi-objective optimization for water flooding under geological uncertainty. Discov. Geosci. 2025, 3, 26. [Google Scholar] [CrossRef] [Scilit]
- Schiozer, D.J.; Alberto, A.; Souza, D.; Margarida, S.; Santos, D.G. Model-based decision analysis applied to petroleum field development and management. Oil Gas Sci. Technol. Rev. L IFP 2019, 74, 46. [Google Scholar] [CrossRef] [Scilit]
- Schiozer, D.J.; Avansi, G.D.; de Souza dos Santos, A.A. Risk quantification combining geostatistical realizations and discretized Latin Hypercube. J. Braz. Soc. Mech. Sci. Eng. 2017, 39, 575–587. [Google Scholar] [CrossRef] [Scilit]
- Steagall, D.E.; Schiozer, D.J. Uncertainty Analysis in Reservoir Production Forecasts During Appraisal and Pilot Production Phases. In Proceedings of the SPE Reservoir Simulation Symposium, Houston, TX, USA, 11–14 February 2001. [Google Scholar]
- Teresa, A.; Gaspar, F.S.; Barreto, C.E.A.G.; Schiozer, D.J. Journal of Petroleum Science and Engineering Assisted process for design optimization of oil exploitation strategy. J. Pet. Sci. Eng. 2016, 146, 473–488. [Google Scholar] [CrossRef] [Scilit]
- von Hohendorff Filho, J.C.; Maschio, C.; Schiozer, D.J. Production strategy optimization based on iterative discrete Latin hypercube. J. Braz. Soc. Mech. Sci. Eng. 2016, 38, 2473–2480. [Google Scholar] [CrossRef] [Scilit]
- Ferreira, V.H.S.; Moreno, R.B.Z.L. Impact of flow rate variation in dynamic properties of a terpolymer in sandstone. J. Pet. Sci. Eng. 2017, 157, 737–746. [Google Scholar] [CrossRef] [Scilit]
- Leon, J.M.; Masalmeh, S.K.; Xu, S.; AlSumaiti, A.M.; BinAmro, A.A.; Baslaib, M.A. Analysis of the World’s First Polymer Injectivity Test in a Carbonate Reservoir Under Extreme Harsh Conditions in ADNOC’s Reservoirs. In Proceedings of the Society of Petroleum Engineers—Abu Dhabi International Petroleum Exhibition and Conference, ADIP, Abu Dhabi, United Arab Emirates, 15–18 November 2021. [Google Scholar]
- Sorbie, K.S. Polymer-Improved Oil Recovery; Springer Netherlands Imprint: Dordrecht, The Netherlands, 1991; ISBN 978-94-010-5354-9. [Google Scholar]
- Santos, A.; Gaspar, A.T.; Von Hohendorff Filho, J.; Correia, M.; Santos, S.; Schiozer, D.J. Case Study for Field Development and Management-Selection of Production Strategy Based on UNISIM-II-D; UNISIM: Campinas, Brazil, 2018; Available online: https://www.unisim.cepetro.unicamp.br/benchmarks/files/UNISIM-II-D.pdf (accessed on 9 February 2026).
- Hayashi, S.H.D. Valor da Flexibilização e Informação em Desenvolvimento de Campo por Módulos. In Value of Flexibility and Information in Field Development by Modular Implantation; State University of Campinas: Campinas, Brazil, 2006. [Google Scholar]
- Seright, R.S.; Seheult, M.; Talashek, T. Injectivity characteristics of EOR polymers. SPE Reserv. Eval. Eng. 2009, 12, 783–792. [Google Scholar] [CrossRef] [Scilit]
- Alzaabi, M.A.; Leon, J.M.; Skauge, A.; Masalmeh, S. Analysis and simulation of polymer injectivity test in a high temperature high salinity carbonate reservoir. Polymers 2021, 13, 1765. [Google Scholar] [CrossRef] [Scilit]
- Schlumberger. Ecl Eclipse Industry-Reference Reservoir Simulator. User’s Guide Version 2021.2. 2021. Available online: https://www.slb.com/products-and-services/delivering-digital-at-scale/software/eclipse-industry-reference-reservoir-simulator/eclipse (accessed on 9 February 2026).
- Equinor, A.S.A.; Ceetron Solution, A.S.; Ceetron, A.S. ResInsight. User’s Guide Version 2021.06.0. 2021. Available online: https://resinsight.org/ (accessed on 9 February 2026).
- SLB. Petrel Shared Earth-Critical Insight. User’s Guide Version 2023.2.0. 2023. Available online: https://www.slb.com/products-and-services/delivering-digital-at-scale/software/petrel-subsurface-software (accessed on 9 February 2026).
- UNISIM. MERO. User’s Guide Version 2022.10.1. 2022. Available online: https://www.unisim.cepetro.unicamp.br (accessed on 9 February 2026).

Disclaimer/Publisher’s Note: The statements, opinions and data contained in all publications are solely those of the individual author(s) and contributor(s) and not of MDPI and/or the editor(s). MDPI and/or the editor(s) disclaim responsibility for any injury to people or property resulting from any ideas, methods, instructions or products referred to in the content. |
© 2026 by the authors. Licensee MDPI, Basel, Switzerland. This article is an open access article distributed under the terms and conditions of the Creative Commons Attribution (CC BY) license.