


Abstract
Dual-fuel, diesel–LPG (LPG being Liquified Petroleum Gas, e.g., propane) compression-ignition engines reduce CO2 and particulate emissions compared to diesel-only operation but are prone to knock at high load due to charge homogeneity and increased ignition delay. AdBlue port injection (API) was evaluated as a combustion stabilisation strategy for a diesel–LPG engine and compared with water port injection (WPI). Experiments were performed on a 2.0 L diesel–LPG engine operated at 2000 RPM, BMEP ≈ 9 bar, λ ≈ 1.27 and LPG substitution of 72%. Knock intensity was quantified using knock-induced signal energy (KISE) derived from the oscillatory component of the in-cylinder pressure over a knock-sensitive crank angle window. Characterisation of combustion was done through HRR analyses, MFB analyses and FFT-based frequency characterisation. Baseline operation exhibited severe knock with a peak HRR ≈ 200 J/°CA and mean KISE of 307.2 bar2. WPI at a water mass ratio WMR of 130% reduced the peak HRR by 56% and mean KISE by 88%, but decreased the peak pressure, BMEP and BTE. API at an AdBlue mass ratio AMR of 130% reduced the peak HRR by 37% and KISE by 82.6% while maintaining BMEP and BTE within baseline variability. Both strategies attenuated the dominant ~19.8 kHz (1,2) mode. NOx emissions decreased with WPI but increased at a high AMR.
1. Introduction
Compression-ignition (CI) engines remain central to heavy-duty transportation and marine propulsion because of their high efficiency, robustness and the favourable energy density of diesel fuel. At the same time, increasingly stringent emissions regulations target reductions in NOx, particulate matter and CO2, challenging the continued reliance on conventional diesel combustion and motivating the adoption of cleaner and more flexible combustion strategies. Dual-fuel diesel–LPG and diesel–methane operation has emerged as one such strategy [1,2,3,4,5,6,7].
Diesel–methane is a widely used fuelling strategy in large-bore engines and heavy-duty marine engines due to methane’s favourable knock resistance. Propane, found commercially as LPG, is much easier to store for use in lighter-duty transportation vehicles. Dual fuelling replaces a substantial fraction of diesel with the gaseous fuel while retaining a diesel pilot for ignition; dual-fuel engines combine the high efficiency of CI operation with the cleaner combustion characteristics of either methane or propane. Compared to neat diesel, LPG substitution can reduce particulate formation due to the absence of heavy hydrocarbons and can offer a CO2 benefit on an energy-equivalent basis. The concept is particularly attractive where existing diesel platforms can be retrofitted for dual-fuel operation, enabling lower emissions with minimal changes to core hardware [2,4,6].
However, these benefits come at the cost of more complex combustion behaviour and a heightened propensity to engine knock. The homogeneous nature of the LPG–air mixture and the increased ignition delay associated with reduced pilot fuel quantities at high load promote a quasi-Otto combustion behaviour, resulting in very rapid heat release events once ignition occurs. A large fraction of the air–fuel mixture can burn over a short crank angle interval, producing steep pressure rise rates and intense pressure oscillations. Under high-load conditions, the homogeneity of the end gas and the relatively high compression ratios typical of CI engines further exacerbate knock tendencies, making sustained operation at high substitution ratios challenging without additional knock mitigation strategies [1,2,8,9,10].
Engine knock in both spark-ignition and compression-ignition engines has long been recognised as a limiting factor for high-efficiency operation [9,11]. In CI engines, knock may arise from the very rapid burning of premixed air–fuel pockets formed during a long ignition delay [12,13]. Dual-fuel engines introduce additional complexity due to the presence of a homogeneous gaseous charge and the interplay between pilot and main fuel stages. This has motivated extensive research into knock suppression strategies that do not compromise efficiency, including charge cooling, water injection and advanced control of injection timing and pilot fuel quantity. Water injection has a long history as a knock suppression technique, originally used in high-output aircraft engines and later investigated in spark-ignition and diesel engines [10,14,15,16,17,18].
More recently, water injection has been explored in dual-fuel engines, where its latent heat of vaporisation can substantially reduce end gas temperatures, attenuating knock while enabling higher loads and substitution ratios. In LPG–diesel dual-fuel engines, water injection has been shown to enable a high load operation with reduced knock intensity and acceptable performance penalties at water-to-fuel mass ratios in excess of 100% [18]. Beyond pure water, ammonia-based additives have been considered for their resistance to auto-ignition and their ability to absorb heat via endothermic decomposition. AdBlue®, a 32.5 wt.% aqueous urea solution, is widely used as a reductant in diesel SCR systems; however, as a means of knock suppression, it introduces both water and a nitrogen-containing fuel to the combustion process. Previous studies have shown that blending AdBlue or urea-based mixtures with diesel can alter in-cylinder pressure traces, heat release profiles and emissions, indicating that urea-derived species can influence combustion dynamics. Little published work has explored the use of AdBlue as a dedicated combustion stabiliser in dual-fuel CI operation, particularly in the context of knock suppression [16,19].
When injected into the intake port, AdBlue can provide charge cooling through evaporation of its water content while also acting as a source of chemically bound energy via urea decomposition and combustion. This dual function suggests that AdBlue port injection (API) may be capable of suppressing knock while sustaining, or even enhancing, engine performance compared to pure water injection. At the same time, the nitrogen content of urea introduces a potential penalty in terms of NOx formation, which must be assessed.
Despite the extensive literature on dual-fuel combustion, water injection and AdBlue in SCR systems, experimental work specifically evaluating AdBlue port injection as a knock suppression strategy in dual-fuel diesel–LPG engines remains limited. In particular, there is a lack of detailed in-cylinder pressure-based studies that quantify knock intensity using knock-induced signal energy (KISE), supported by spectral analysis and comparison with conventional water port injection under matched conditions. This study addresses this gap by experimentally investigating the effectiveness of water and AdBlue port injection in suppressing knock in a dual-fuel diesel–LPG CI engine. Knock behaviour is characterised using high-speed in-cylinder pressure measurements, HRR and MFB analysis, and KISE and FFT-based frequency analysis in conjunction with Draper’s mode identification. The study compares the impact of WPI and API on knock intensity, combustion phasing, BMEP, BTE, peak in-cylinder pressure and NOx emissions.
2. Necessity of Robust Knock Quantification
As dual-fuel knock involves both rapid heat release events and resonant pressure oscillations, its characterisation requires more than simple time-domain peak pressure metrics. Previous work on knock in SI and dual-fuel engines has highlighted the value of frequency-domain analysis, particularly FFT-based methods, to separate normal combustion ringing from true knock-induced resonances. In addition, the analysis of cavity modes in closed cylindrical chambers, as pioneered by Draper and further developed by Hickling and others, provides a theoretical basis for linking measured knock frequencies to specific acoustic modes within the combustion chamber geometry [9,20,21,22,23,24,25,26,27].
The present study adopts a combined approach, using:
- A knock-induced signal energy (KISE) metric derived from in-cylinder pressure and knock sensor signals over a knock-sensitive window (KSW), following the methodologies developed by Hudson, Naber and co-workers [20,21,22,23].
- Frequency-domain analysis of in-cylinder pressure and knock sensor signals via FFT with appropriate windowing, as outlined by Smith and Harris [28,29].
- Draper’s cavity-mode framework and tabulated Bessel function zeros for a right circular cylinder to compute theoretical resonance frequencies for various (m,n) modes [23,24,25,26,27,30].
These tools, combined with classical heat release and mass fraction burnt analysis derived from in-cylinder pressure, provide a robust framework for quantifying the impact of WPI and API on knock intensity and combustion stability [2,31,32,33,34,35].
3. Experimental Setup for Water/AdBlue Port Injection
3.1. Engine and Dual-Fuel Operation
The experiments were carried out on a laboratory engine test bed based on a 2.0 L common-rail diesel engine manufactured by Peugeot in Trémery, France (engine model: DW10). The engine is a four-cylinder, eight-valve unit with a total displacement of 1996 cm3, a bore of 85 mm, stroke of 88 mm, and a compression ratio of 18:1 as summarised in Table 1. This engine’s rating is of 250 Nm peak torque at 2000 rpm. For the purposes of this study, the original turbocharger was removed in previous work to facilitate engine testing. In place of the turbocharger, a roots-type supercharger driven by an external electric motor was installed and controlled via LabVIEW. This arrangement allowed the intake manifold pressure to be raised independently, improving volumetric efficiency and enabling precise control of the manifold absolute pressure (MAP) during testing [36,37].
Table 1.
Engine and experimental parameters.
The engine had been previously modified to operate in dual-fuel mode, utilising LPG as the primary energy source with a small pilot diesel injection to initiate combustion [38,39]. Under high-load dual-fuel operation, combustion is predominantly sustained by the gaseous fuel, while the diesel pilot does not exhibit conventional diffusion flame behaviour due to its relatively low energy share. In the knock suppression tests reported here, the engine was targeted to operate under the below experiment parameters, forming a preliminary test matrix prior to the inclusion of WMR and AMR quantities:
3.2. Water/AdBlue Port Injection System
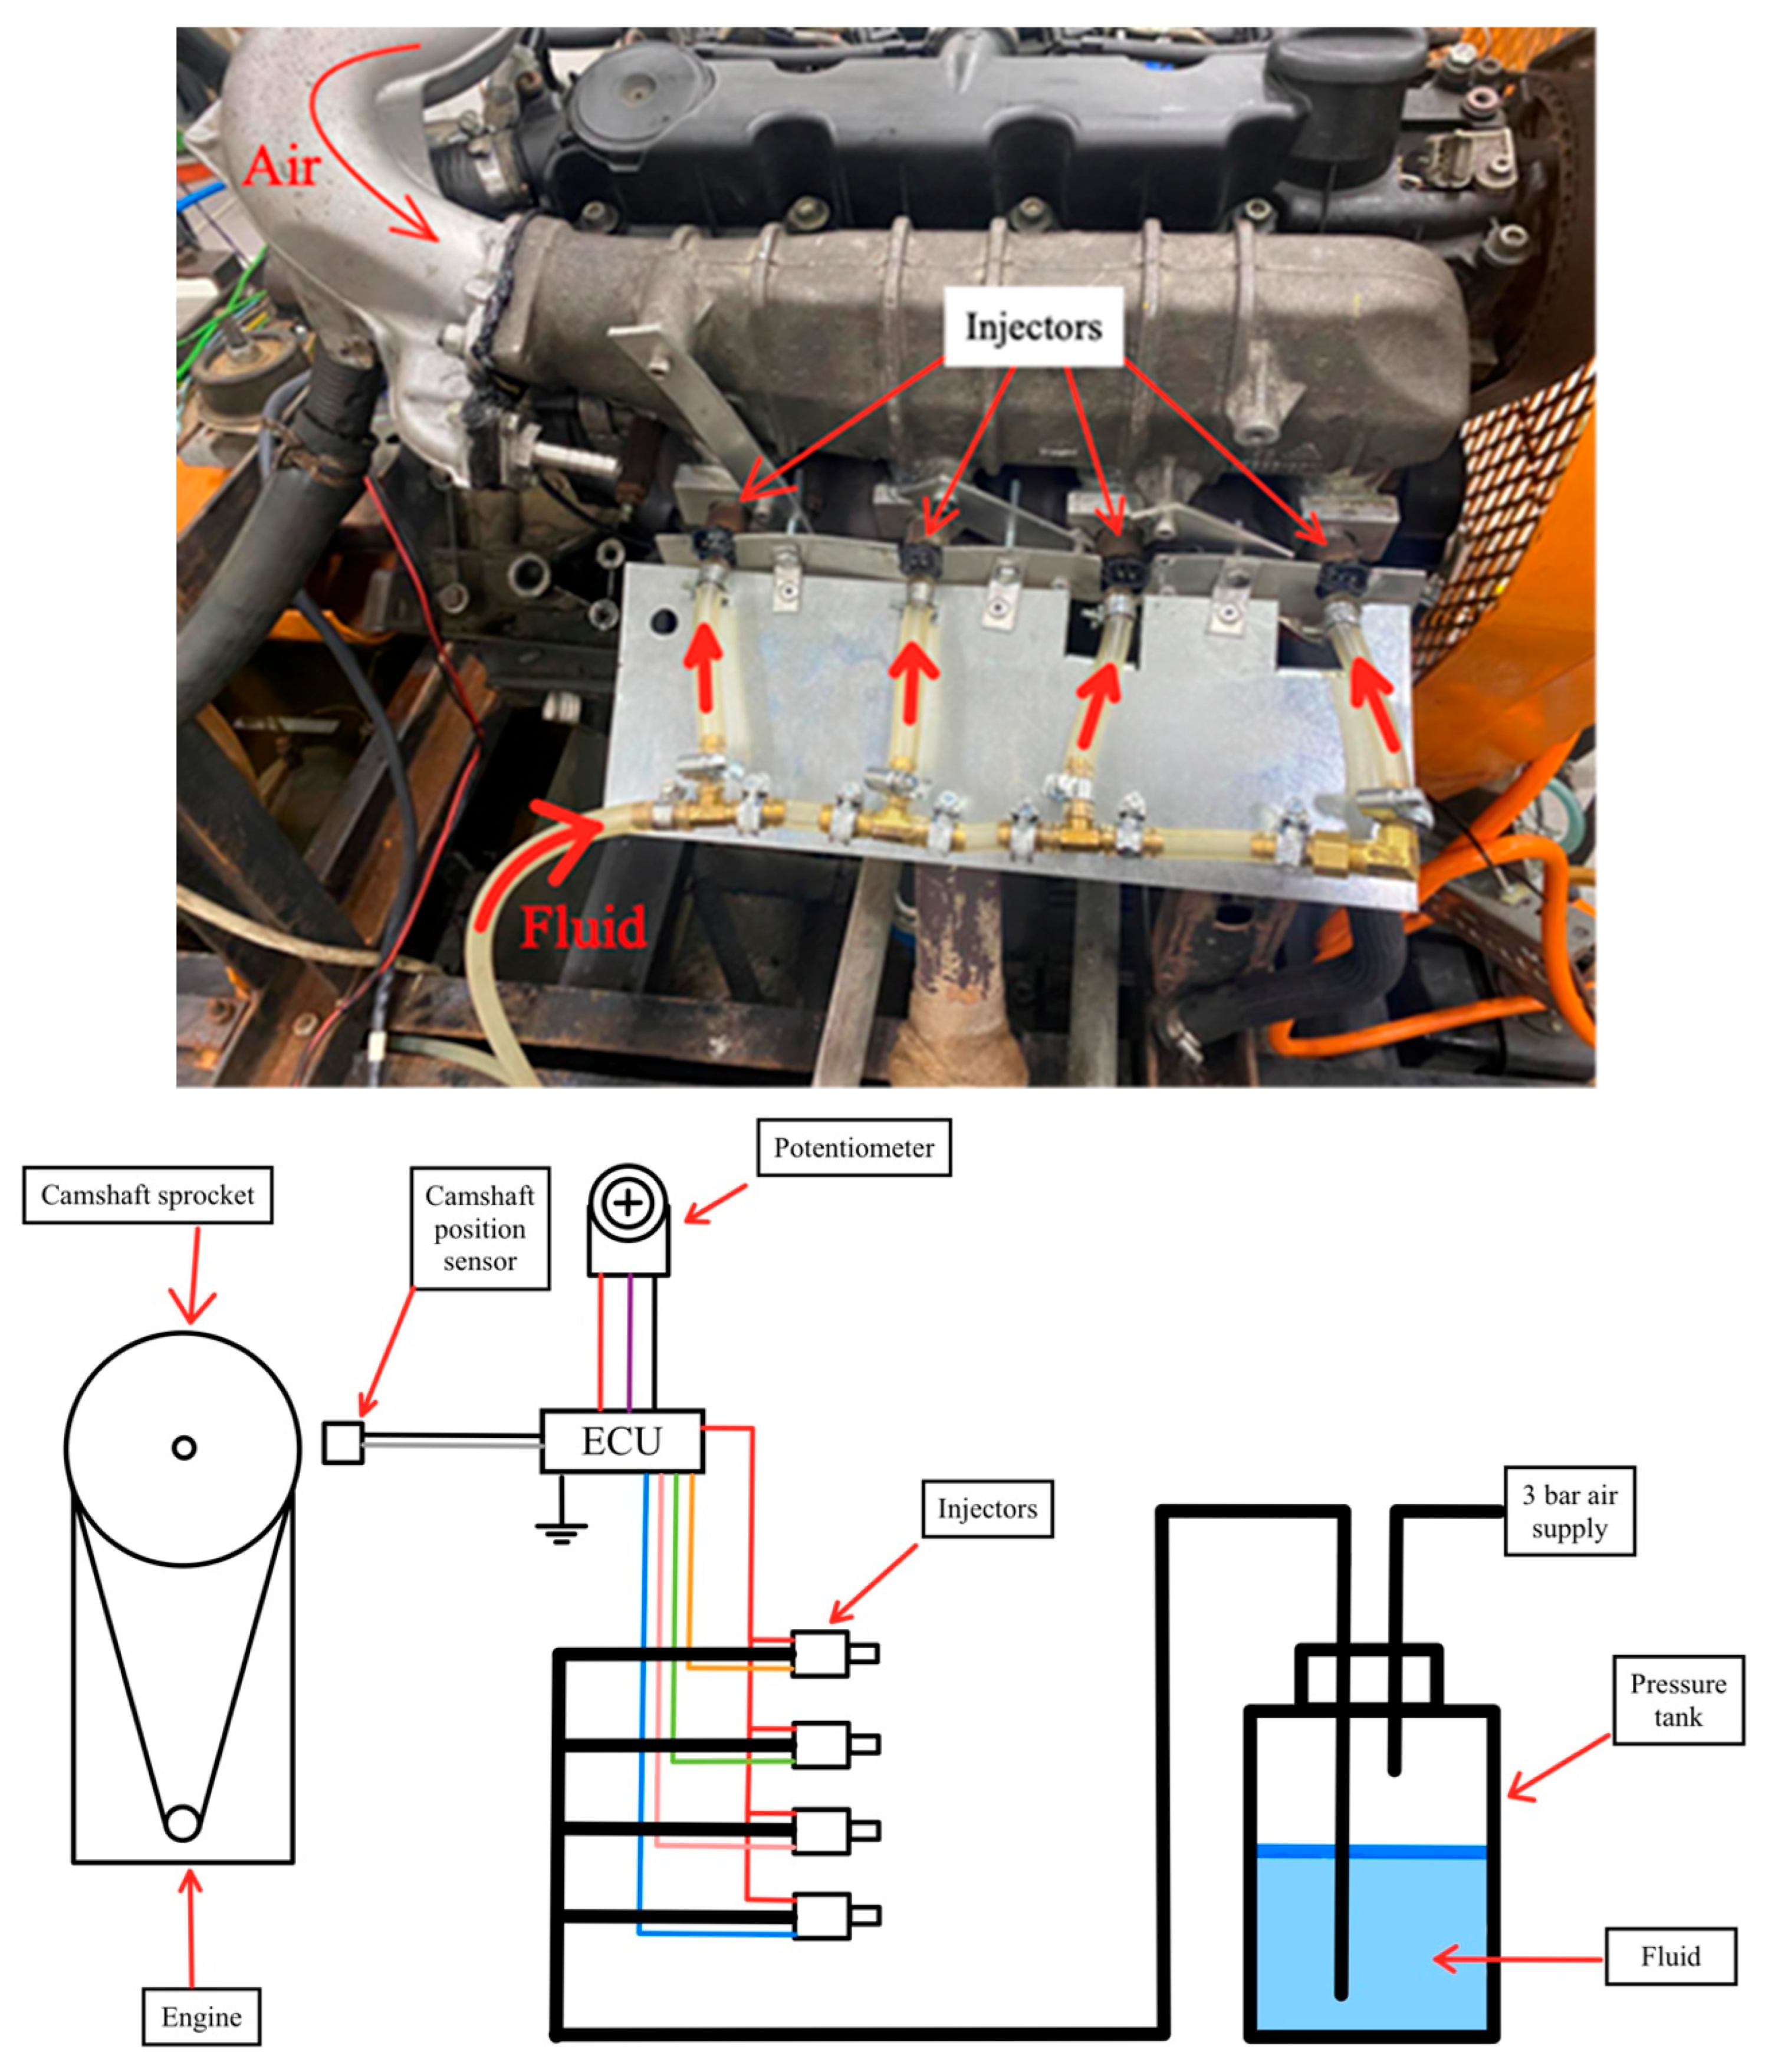
Knock suppression was investigated using a dedicated port injection system capable of delivering either water or AdBlue to all four cylinders, but never simultaneously. An initial configuration, utilising a single injector mounted at the inlet of the log-style intake manifold, was found to provide poor cylinder-to-cylinder distribution and inconsistent results. This concept was therefore replaced by a multi-point port injection arrangement to ensure uniform distribution and accurate control of injected fluid to each cylinder.
3.2.1. Injector Selection and Installation
The system employed gasoline port fuel injectors from a 2000 Honda Civic D14Z2 engine manufactured by Honda Motor Co., Ltd. in Suzuka, Japan, selected for their availability and compatibility with the required flow rates. A dedicated flow testing procedure was performed to quantify the mass of injected fluid per pulse similar to that explained in [40]. The resulting data showed that all four injectors delivered closely matched flow rates and exhibited a linear relationship between injected mass and pulse duration, enabling accurate dosing using a single calibration curve. In a separate test, it was confirmed that AdBlue and water exhibit identical flow characteristics through these injectors, allowing the same calibration to be used for both fluids.
The injectors were installed directly into the individual intake runners of the log-type manifold, at a position approximately 6 cm upstream of the cylinder head flange. The spray was oriented towards the intake valves to promote evaporation and mixing and to minimise liquid film formation on the runner walls.
3.2.2. Injection Control
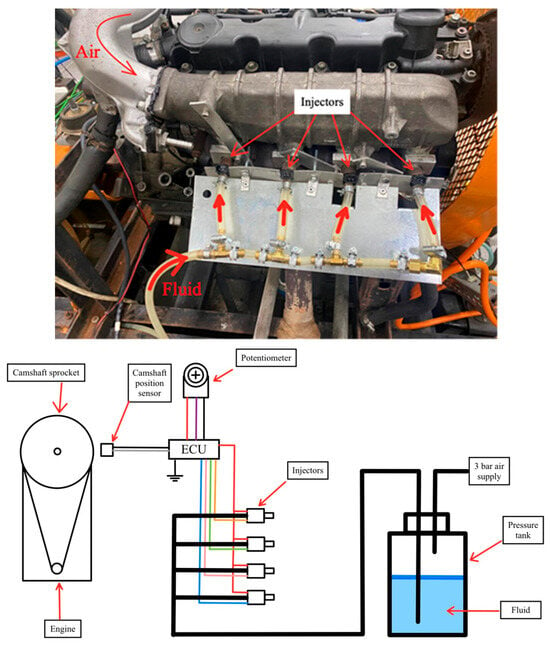
Injection timing and duration for water/AdBlue were controlled using a MoTeC M400 programmable ECU manufactured by MoTeC in Croydon South, Victoria, Australia. The ECU’s original throttle position-based fuel map was repurposed: the throttle position sensor (TPS) input was replaced by a manually controlled analogue voltage, allowing the operator to adjust the injection quantity in real time using a potentiometer; refer to Figure 1 Top. Because only one engine speed was used in these tests and the “fuel” in this map corresponded to water or AdBlue instead of gasoline, the duration-of-injection (DOI) values in the map were defined to vary linearly with the pseudo-TPS signal. This yielded a simple and direct relationship between the commanded input and the injected mass, aligning with the study’s focus on knock response as a function of the fluid mass ratio.
Figure 1.
Top: Final setup depicting the individual injectors positioned in the intake runners of the manifold accompanied by the aluminium heat shield protecting the tubing carrying the pressurised fluid from the hot exhaust manifold beneath it. Bottom: Schematic diagram of port injection setup. (Different coloured injector wiring indicates sequential and individual triggering of the injectors.)
3.3. Instrumentation and Data Acquisition
3.3.1. Knock Detection and In-Cylinder Pressure Measurement
The knock detection approach taken relied on two separate sensing methods capturing both structural vibrations along with direct in-cylinder pressure measurements. A piezoelectric in-cylinder pressure transducer of make and type AVL GH13G was installed in place of the glow plug on cylinder 3, providing high-resolution pressure traces over each engine cycle and capturing the high-frequency pressure oscillations associated with knock. The piezoelectric pressure transducer’s charge output signal was fed to a charge amplifier (AVL Flexifem Piezo Type 2P2G). In parallel, an accelerometer-based knock sensor was mounted on the engine block and connected to a MoTeC Standalone Knock Unit, which processed the block vibration signal to detect knocking combustion events.
Data acquisition was performed in a crank angle-resolved manner rather than time-based. A H25D-SS-3600-ABZC-28V/OC-S rotary shaft encoder (manufactured by BEI) provided phase-synchronised reference pulses to the data acquisition system. Signals were sampled at 0.1° crank angle intervals, enabling detailed reconstruction of the pressure trace and knock intensity throughout the combustion event. A National Instruments (NI) USB-6363 module was used to record the in-cylinder pressure signal, the knock sensor voltage waveform and the one pulse per revolution “z” index outputted by the BEI rotary shaft encoder. The 0.1 degree interval fast data were acquired using a National Instruments LabVIEW software version 19.0f2 and saved using TDMS file format.
3.3.2. Low-Speed Analogue and Temperature Measurements
The test bed incorporated multiple National Instruments modules for comprehensive measurement of the engine operating conditions. Low-speed analogue voltage signals from various engine sensors (e.g., manifold pressure, airflow, and other standard ECU-level parameters) were acquired via an NI SCC-68 connector block, while temperature measurements were made using thermocouples connected to an NI SCXI-1000 chassis equipped with an SCXI-1125 differential voltage input module feeding data towards an NI-PCI-6229 Data Acquisition Card. This configuration allowed accurate conditioning and logging of thermocouple readings alongside other analogue channels.
Engine control and low-speed data logging were handled by a separate PC operating a LabVIEW-based virtual instrument (VI). This VI controlled key engine functions such as the diesel torque request, engine load and speed, and LPG injection through a combination of NI multifunction I/O hardware (including an NI-PCI-6229 card, SCC-68, and SCXI-1000 chassis). Serial communication with the engine ECU provided access to the mass air flow (MAF), diesel duration of injection, and diesel rail pressure, which were used to derive the fuel flow rates and to monitor the consistency of the operating point during the WPI and API tests.
To maintain sufficient bandwidth and minimise latency, high-speed knock and pressure data were recorded on a dedicated second PC via the NI USB-6363 module, while the first PC ran the LabVIEW control VI and handled low-speed logging. This two-PC architecture ensured that real-time engine control and high-frequency combustion measurements could be carried out simultaneously without compromising data quality. The slow speed data were acquired by using a bespoke LabVIEW control and DAQ VI and data saved in Comma Separated Values format.
4. Knock Quantification and Combustion Analysis
Accurate characterisation of combustion and knock was essential to assess the influence of AdBlue port injection on dual-fuel diesel–LPG operation. In this work, knock was quantified using both frequency-domain and time-domain pressure-based metrics, while global combustion behaviour was evaluated via heat release analysis, mass fraction burnt and cycle-to-cycle variability indices. The methodology follows the approaches of Naber et al. [20], Hudson et al. [21], Kirsten et al. [23] and others, adapted to the specific dual-fuel test engine under test. The analysis described here was all done using LabVIEW software by National Instruments through a virtual instrument (VI) written by the authors that implemented the equations mentioned in the following subsections.
Knock manifests as high-frequency pressure oscillations superimposed on the bulk combustion pressure trace, typically in the 6–20 kHz range [20]. To isolate these oscillations, the in-cylinder pressure was first low-pass-filtered below the Nyquist frequency to avoid aliasing, and then band-pass-filtered (post-processing) over the knock-relevant frequency band [21,28,29]. A crank angle-based knock-sensitive window (KSW) of 40 °CA was adopted, starting at the start of combustion (SOC) identified by the first positive heat release rate (HRR), following Kirsten et al. [23]. This window duration allows the entire knock event to be captured while maintaining a reasonable FFT resolution and minimal spectral leakage.
For each cycle, the filtered pressure signal within the KSW was transformed into the frequency domain using Fast Fourier Transform (FFT). The knock signal energy, Espec, in the frequency domain was then evaluated as the sum of the squared spectral amplitudes over the knock band [21]:
where is the FFT amplitude of the pressure signal at frequency bin , is the frequency resolution and the summation spans the indices corresponding to the chosen knock band. This summation was computed as the integral of the FFT plot over the knock band frequency. This provides a measure of the average knock energy per cycle for a given time window inside the combustion event.
4.1. Knock-Induced Signal Energy (KISE)
In this work, the knock-induced signal energy (KISE) is used as the principal knock index [23]. KISE is defined as the signal energy of the oscillatory component of the in-cylinder pressure trace associated with knock and is evaluated as per Equation (2):
The raw (low-pass-filtered) in-cylinder pressure signal is first filtered to remove very low- and very high-frequency components, isolating the band where knock-induced oscillations are expected. The resulting band-pass-filtered signal in the crank angle domain is denoted by . KISE is then obtained by integrating the squared signal over a crank angle interval defined by the phase angles and , which delimit the portions of the combustion event associated with the pilot diesel and the gaseous mixture combustion phases, respectively, as determined from the heat release rate (HRR) trace.
The limits and are selected using the calculated HRR profiles obtained from the in-cylinder pressure measurements for each test, such that the integration window spans the crank angle region in which knock-related oscillations may occur.
In this research, the diesel-induced signal energy (DISE) and the signal energy factor (SEF) were also taken into consideration following Kirsten et al. [23] as a means to distinguish diesel ringing from gaseous charge knock. DISE measures the knock intensity during the diesel premixed combustion phase of the process, which would be attributed to normal diesel ringing. SEF is a measure of the knock intensity resulting from the combustion of the main charge relative to the pressure oscillation intensity resulting from diesel ringing combustion.
where denotes the start of combustion and denotes the end of combustion. However, for the present analysis of WPI and API, SEF was not used as the primary knock index. If WPI or API successfully reduces knock throughout the combustion process, both KISE and DISE diminish simultaneously, causing SEF to remain effectively unchanged and thus failing to reflect the actual reduction in knock intensity.
For this reason, KISE alone was adopted as the measured parameter characterising the effectiveness of WPI and API. In particular, for the WPI tests, was set to zero and spans the full knock-sensitive window (KSW), so that KISE integrates the oscillatory pressure energy over the entire crank angle range in which knock can reasonably occur. This choice ensured that any global reduction in knock-related pressure oscillations due to WPI/API was directly reflected in the KISE values, providing a robust and physically meaningful knock index for comparison between different injection strategies.
4.2. Resonant Mode Identification: Draper’s Equations
To interpret the dominant frequencies present in the knock spectra, the combustion chamber was considered as a right circular cylinder with rigid, closed ends. Knock-induced pressure oscillations inside this cavity correspond to acoustic resonance modes governed by the wave equation shown in Equation (5) [23,24,25,26].
where is the acoustic pressure fluctuation and is the speed of sound in the in-cylinder gas. The speed of sound in the gas can be found using the following equation:
where is the ratio of specific heats, is the equilibrium pressure, and is the density of the charge at any given crank angle during the combustion stroke. The equilibrium pressure will be taken to be the pressure of the charge without knock, that is, the low-pass-filtered pressure signal below 3 kHz, to only capture the pressure due to combustion and not due to knock. The charge density was not measured directly; instead, it was deduced from the measured mass air flow (MAF), engine speed and the instantaneous cylinder volume . The mass of air trapped in one cylinder per cycle, , is derived from the total MAF, the engine speed (RPM) and the number of cylinders N, taking into account the four-stroke cycle.
As combustion proceeds and the piston moves away from TDC, both and vary with the crank angle, and consequently so does the local speed of sound. For the chosen 40 °CA KSW, the resonant frequencies therefore lie within a finite band rather than being single discrete frequencies. By application of the boundary conditions present within a right circular cylinder, Draper states that the frequency for any given vibration mode can be found as per Equation (8).
where is the frequency in Hertz, is the speed of sound, is a value determined from the root of the Bessel function and cylinder radius, is the number for the longitudinal pressure nodes and is the height of the combustion chamber. This equation assumes that the entire mixture is of equal pressure and temperature and thus the speed of sound is uniform throughout the volume. The axial modes of oscillation are rarely excited in internal combustion engines and thus can be taken to be zero [27]. This leads to the following equation:
where is the root of the Bessel function [30] determined from the wave number, m and n are the numbers for the circumferential and radial pressure nodes respectively and is the radius of the bore. This leads to the Equation (9):
Which is the equation described by Eng [27] in their research with General Motors for finding the resonant frequency of transverse pressure waves depending on the pressure nodes for an engine. The solutions to the derivative of the Bessel function resulting in the wave number are shown in Table 2 [30]. The dominant spectral peaks in the measured knock spectra were compared to these theoretical frequencies using the appropriate values from tabulated Bessel function roots. Agreement between theoretical and experimental frequencies allowed the principal acoustic modes excited during knock to be identified.
Table 2.
Wave numbers corresponding to each circumferential and radial pressure node.
5. Results and Discussion
5.1. Baseline Knock Characterisation Under Dual-Fuel Operation
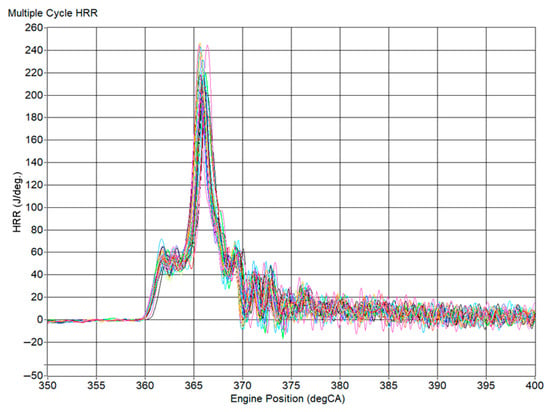
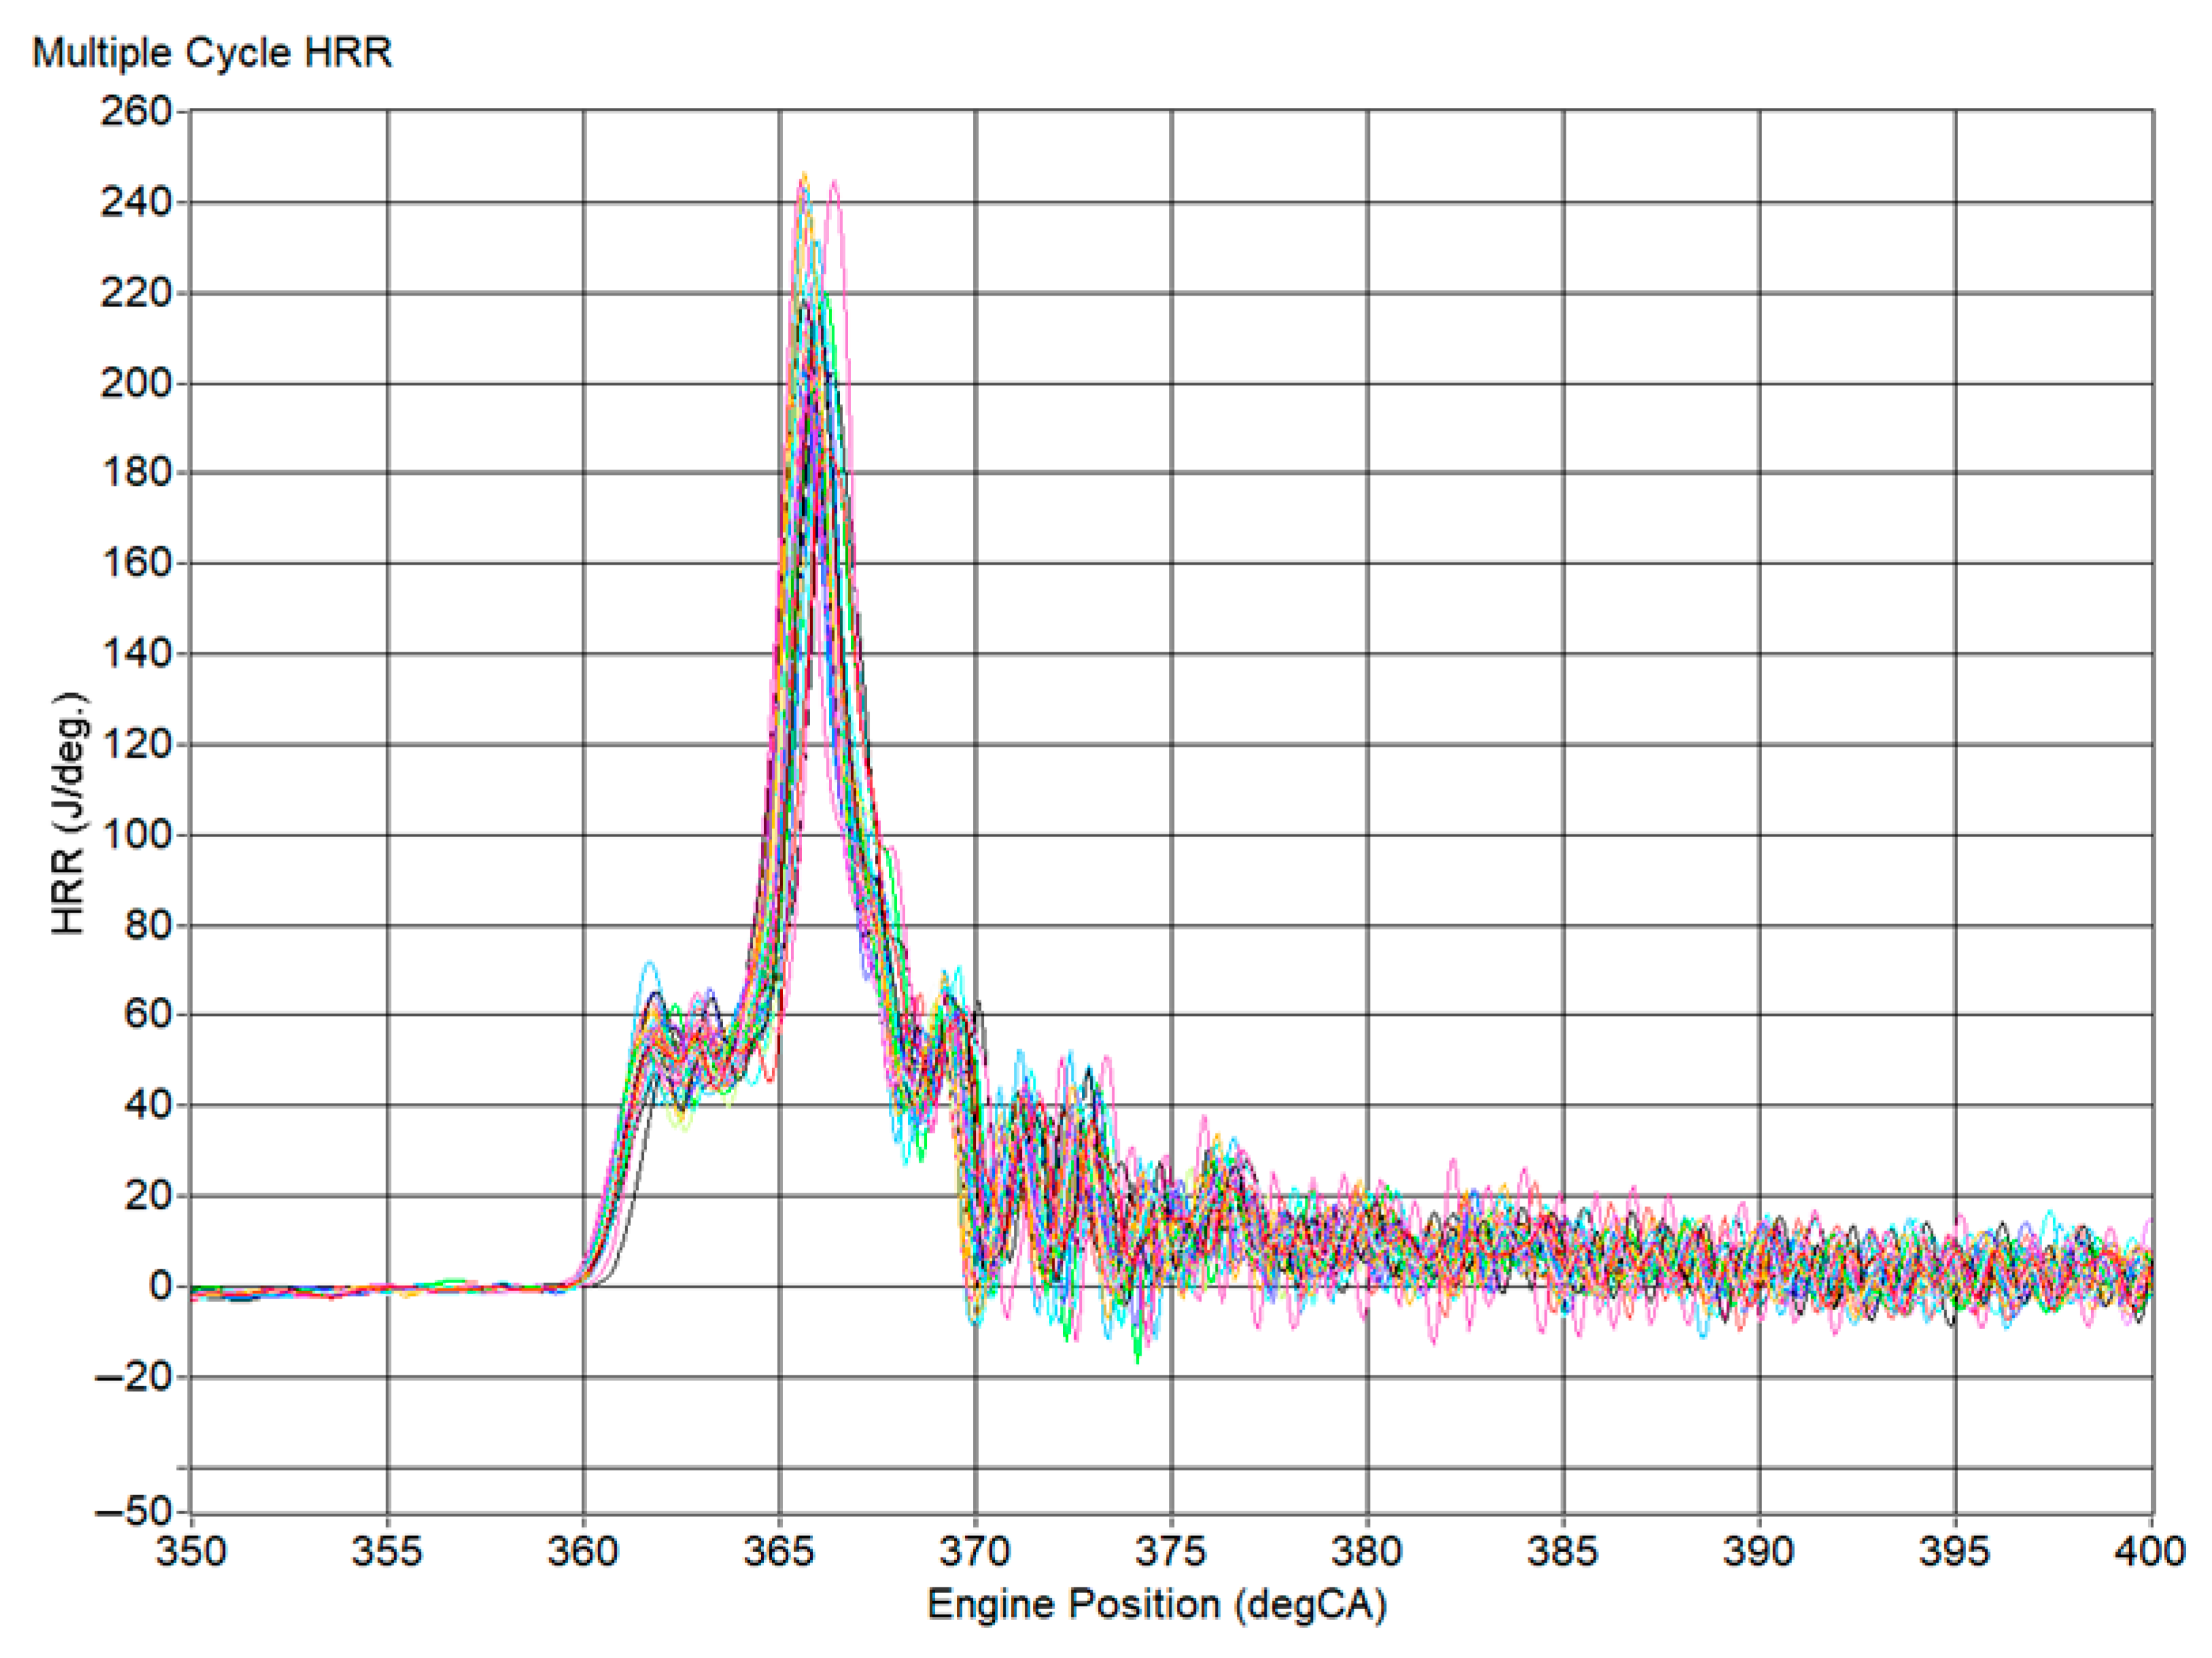
In order to assess the knock suppression potential of water port injection (WPI) and AdBlue port injection (API), the knock behaviour of the dual-fuel diesel–LPG engine was first characterised under severe knocking conditions at high load. Refer to Table 3 for the experiment parameters as measured during testing. Figure 2 shows the heat release rate (HRR) versus the crank angle for 43 consecutive knocking cycles recorded prior to any port injection (hereafter “Test 1”). More than 40 consecutive cycles were acquired to enable statistically meaningful cycle averaging under steady-state conditions, in line with the recommendations of Chun, Heywood and Lancaster for combustion analysis using in-cylinder pressure data [32,33]. The HRR was computed from low-pass-filtered in-cylinder pressure traces in order to remove high-frequency pressure oscillations associated with knock; if these oscillations were left in the signal, the derived HRR would be dominated by numerical noise rather than by the underlying combustion process.
Table 3.
Test matrix depicting loading condition for testing of both WPI and API, all at 2000 rpm.
Figure 2.
Heat release rate of 43 continuous knocking combustion cycles at 154 kPa MAP, 70% substitution ratio and BMEP of 8.6 bar.
The operating point during Test 1 corresponded to a BMEP of 8.7 bar at 2000 rpm, a MAP of 154 kPa, a diesel–LPG substitution ratio of 71% and an overall excess air ratio λ = 1.27. Under these conditions, the diesel pilot combustion takes place approximately between 360 °CA (TDC) and 364 °CA, while the bulk of the premixed LPG–air charge is consumed rapidly between about 364 °CA and 380 °CA. The high degree of premixing, combined with the high compression ratio of the base diesel engine, leads to a large fraction of the premixed charge burning very quickly, which is conducive to high pressure rise rates and strong knock.
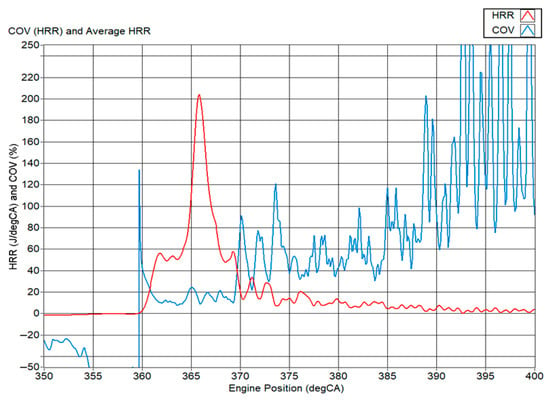
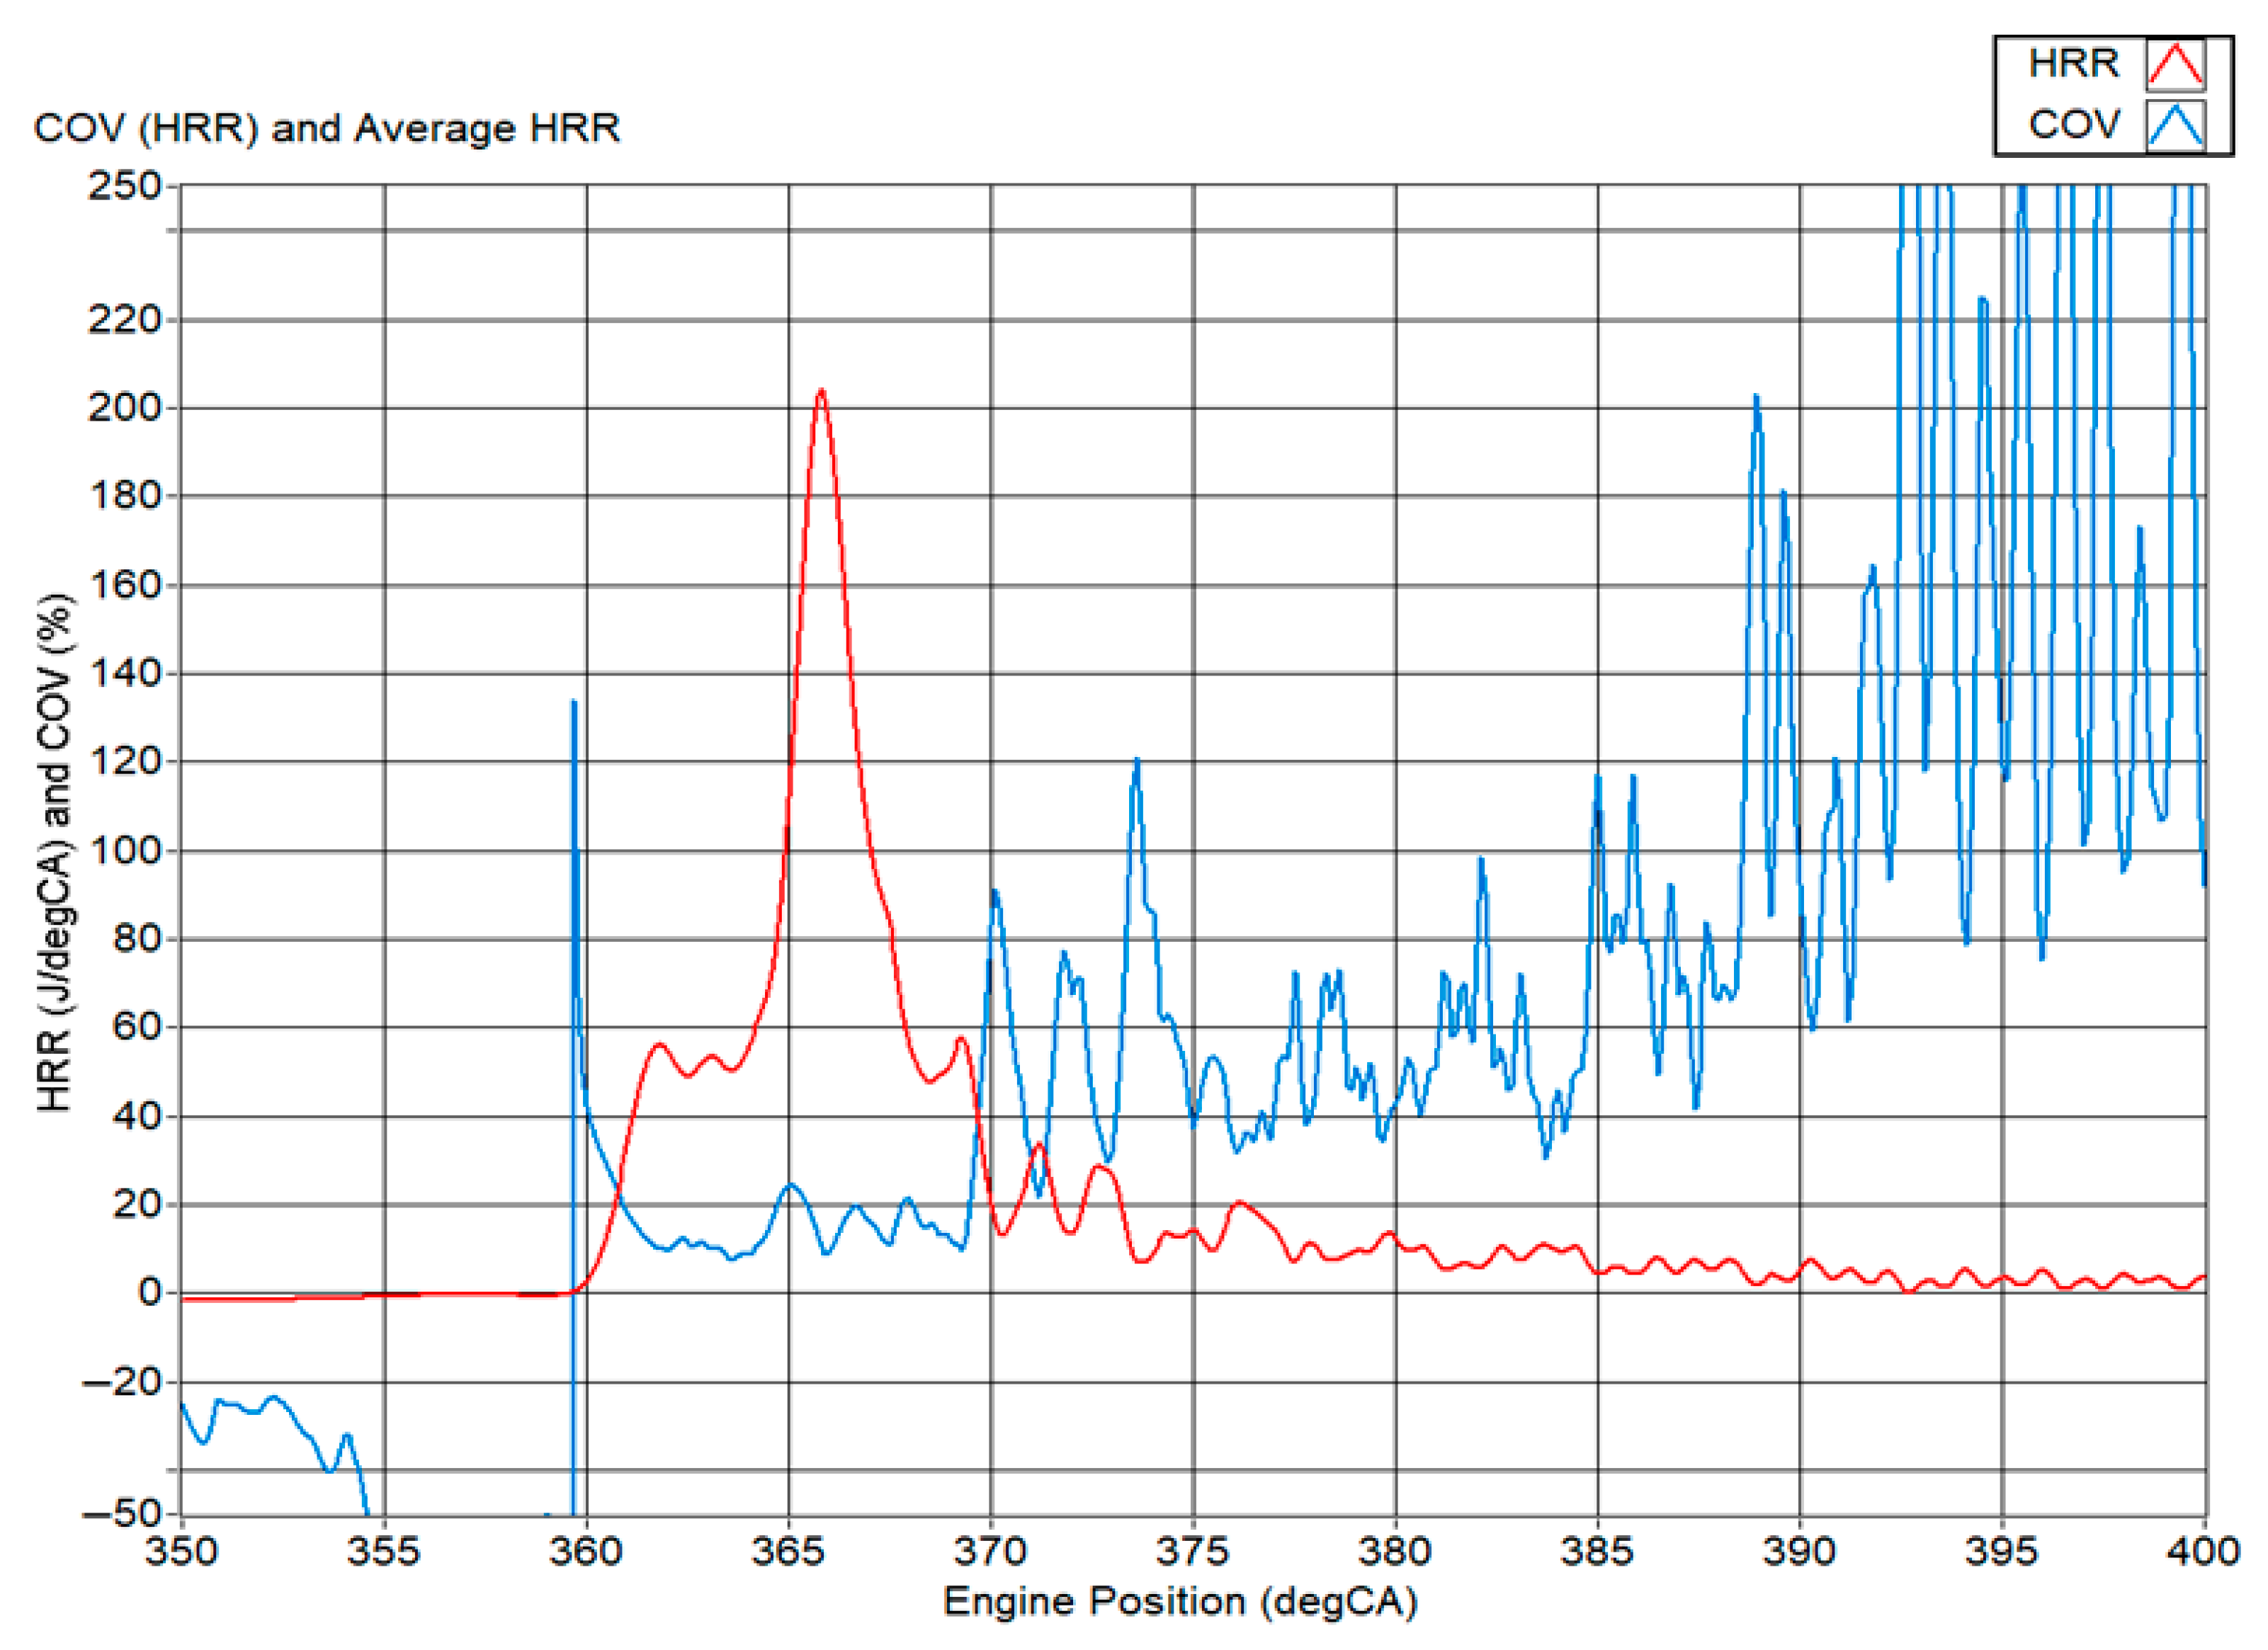
Figure 3 presents the ensemble-averaged HRR and the coefficient of variation based on the HRR () for the 43 cycles of Test 1. The peak HRR reaches approximately 202 J/°CA at 366 °CA. The vertical asymptote in at 359.5 °CA arises from the COV definition, which divides the standard deviation by the mean HRR; at the zero-crossing of the mean HRR, the denominator approaches zero, producing an artificial spike. The crank angle interval of greatest interest lies between roughly 359.5 °CA and 370 °CA, where most of the heat release occurs. In this window, the mean is 13.9 ± 4.3%, indicating that there is high repeatability in the knocking combustion cycles during this given test. Thus, although engine knock is known to be a highly sporadic event, the influencing factor promoting engine knock, which is HRR, can be said to be relatively consistent through the cycles.
Figure 3.
Average heat release rate (HRR) and coefficient of variation (COV) based on the HRR for all 43 knocking combustion cycles plotted against engine position.
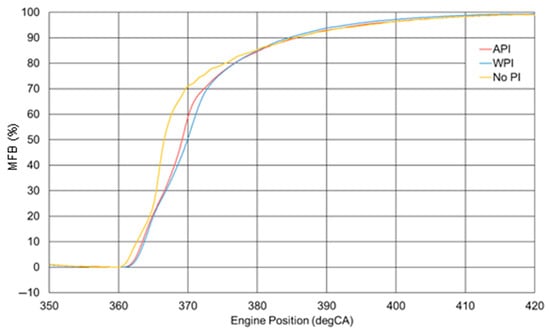
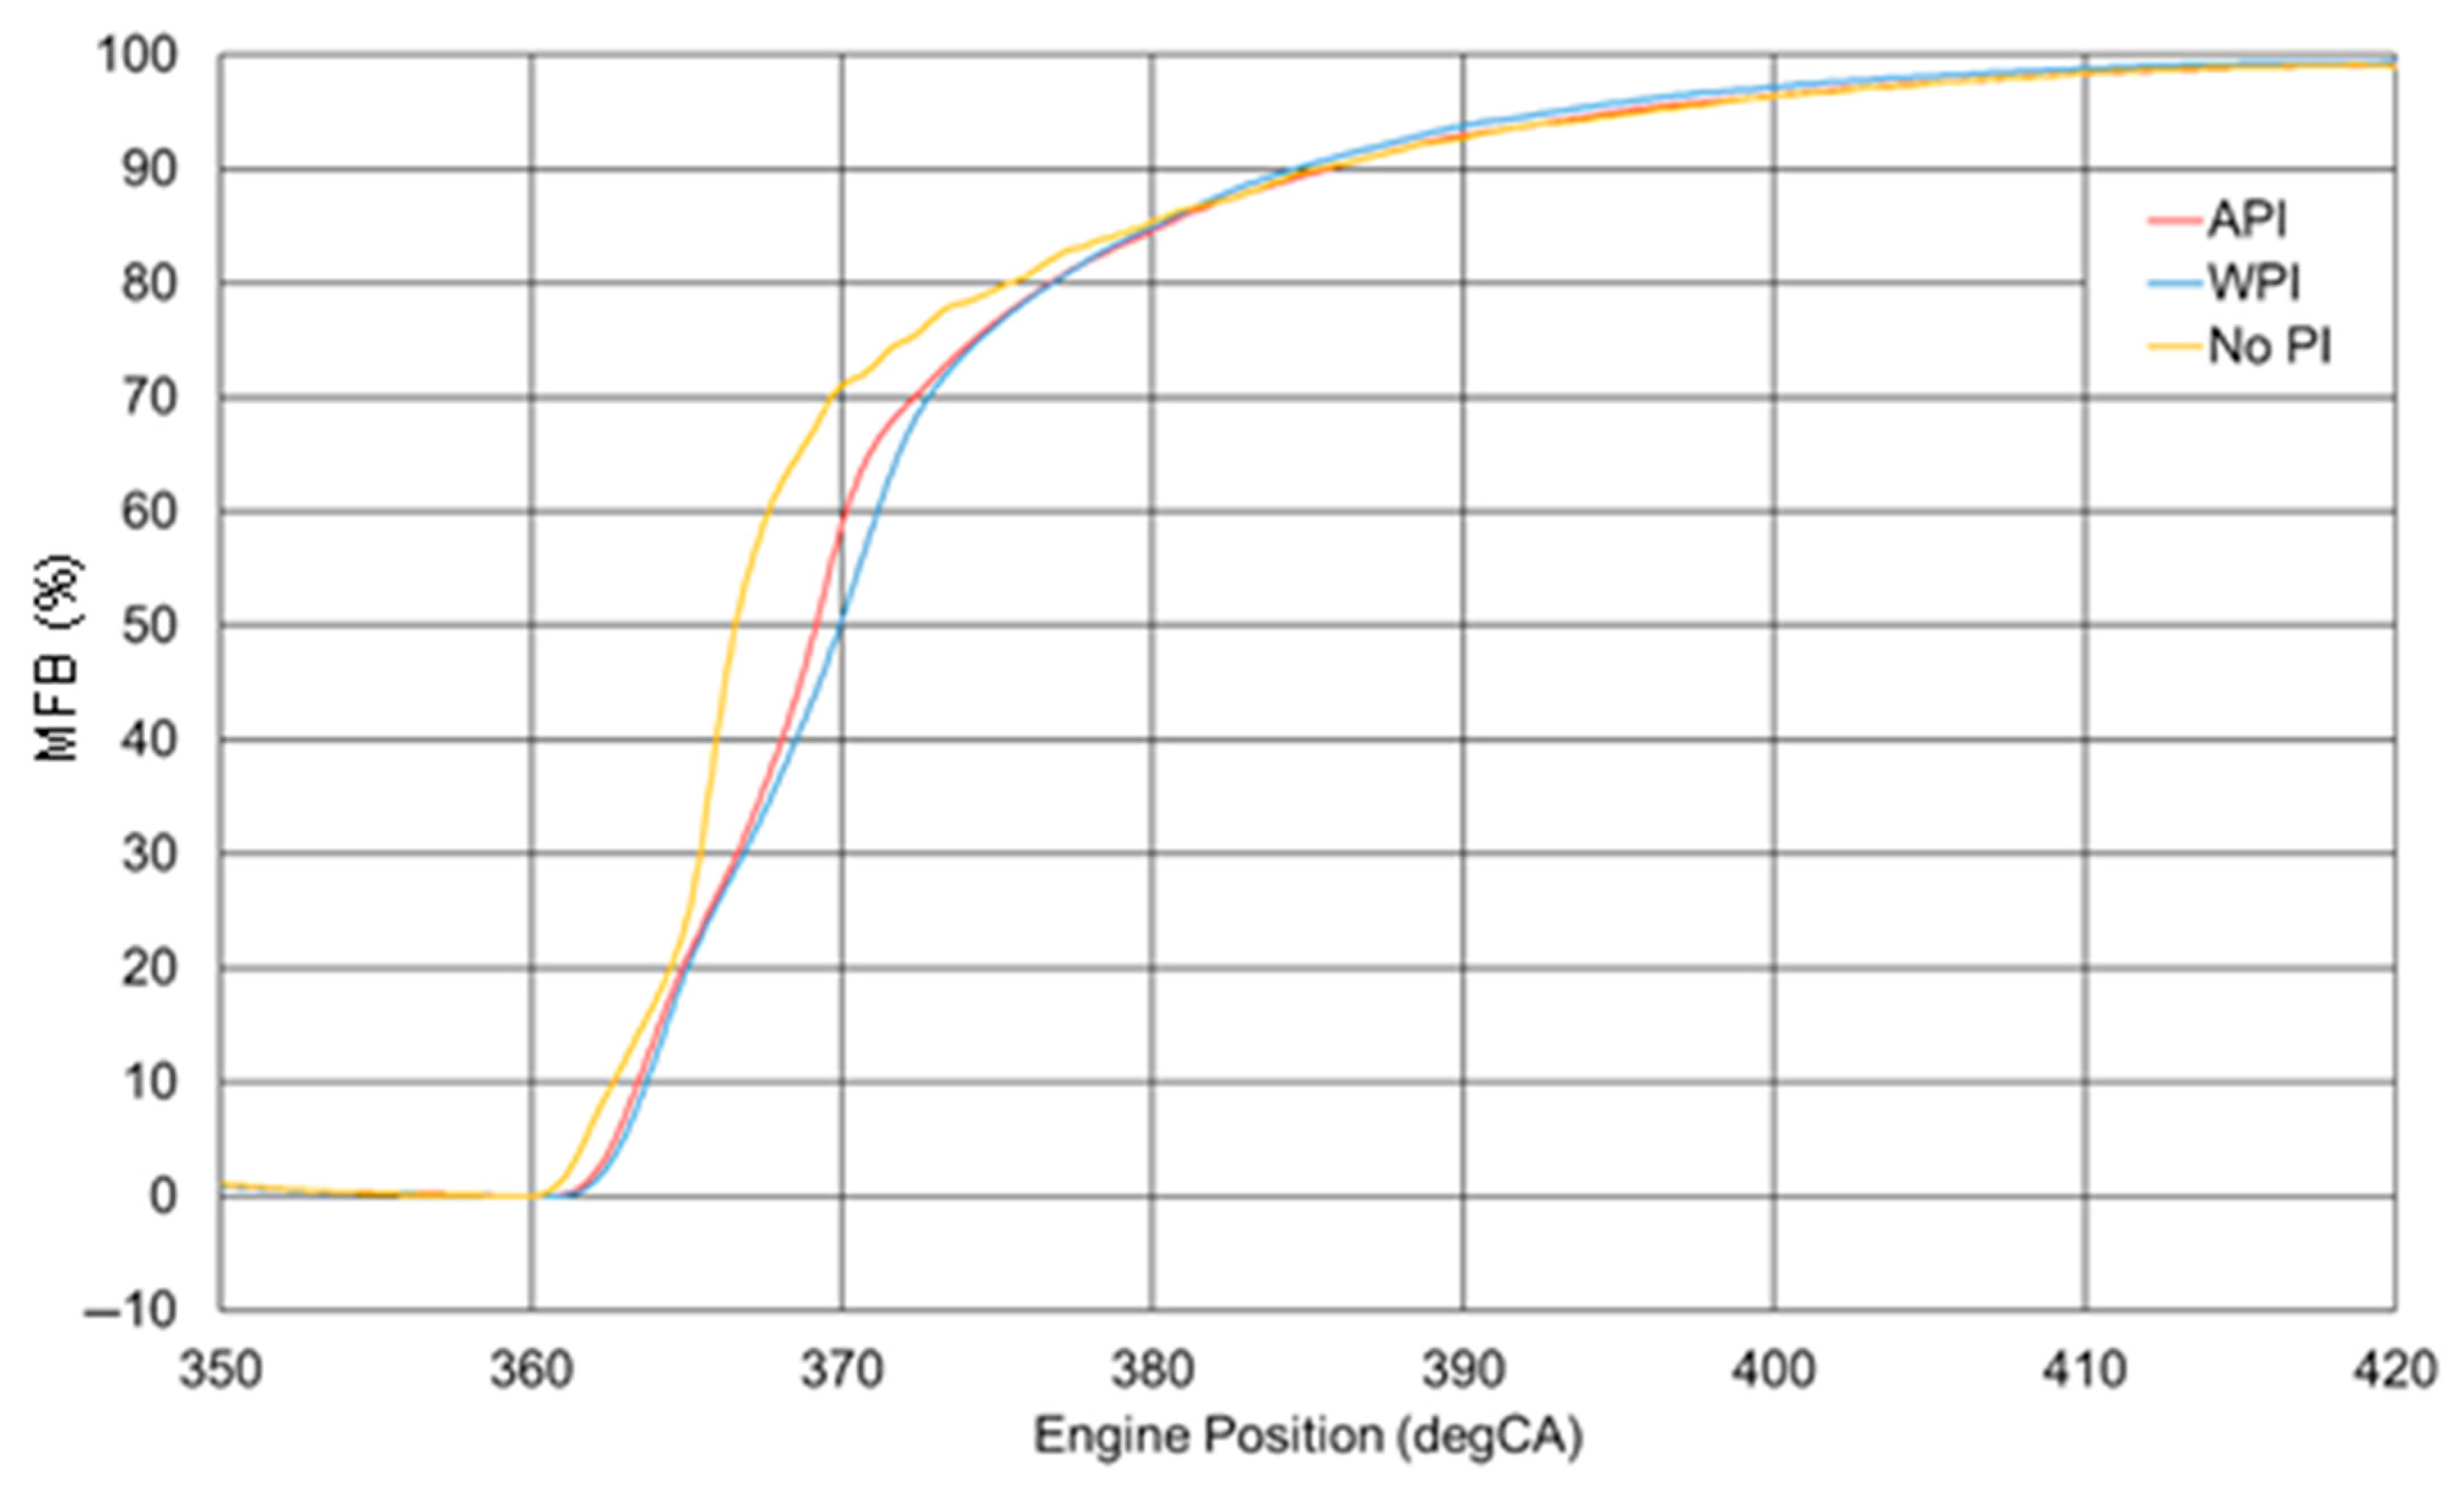
The corresponding ensemble-averaged mass fraction burned (MFB) trace computed using the Rassweiler and Withrow method for Test 1 is shown in the yellow curve in Figure 4, labelled as no port injection (No PI). The MFB evolution confirms that the first 80% of fuel is consumed much more rapidly than the last 20%. Using the conventional 10–90% MFB definition (BDUR10–90), the combustion duration appears relatively long due to the slow burn rate of the final 10% of charge. However, when the duration from CA0 to CA70 (start of combustion to 70% MFB) is considered, the fast burn character of the knocking cycles becomes clearer, CA0–CA70 is only 9.3 °CA. This short rapid burn interval, concentrated near TDC, is consistent with high pressure rise rates and strong knock tendency. With the zero-crossing point of the HRR located at 359.5 °CA, taken to indicate the start of combustion, the ignition delay of the pilot diesel injection was 5.5 °CA. This ignition delay, coupled with the high injection pressure allowed for the entirety of the required pilot diesel injection to enter the cylinder prior to combustion, this meant sufficient time was given for the diesel to disperse thoroughly with the LPG–air mixture, causing multiple ignition centres. This enhanced the rate of heat release substantially, such that the engine knock was aggravated.
Figure 4.
Ensemble-averaged mass fraction burnt (MFBs) of without port injection (PI), with WPI at 130% WMR, and with API at 130% AMR.
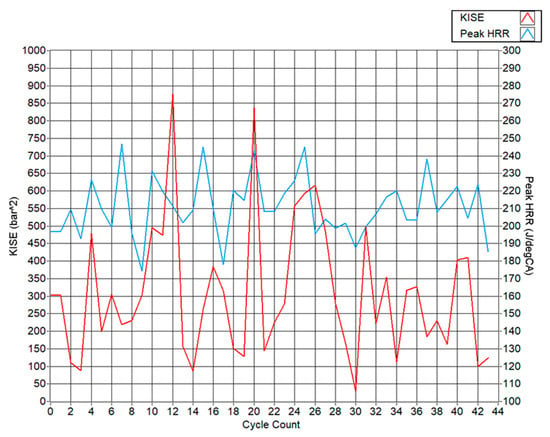
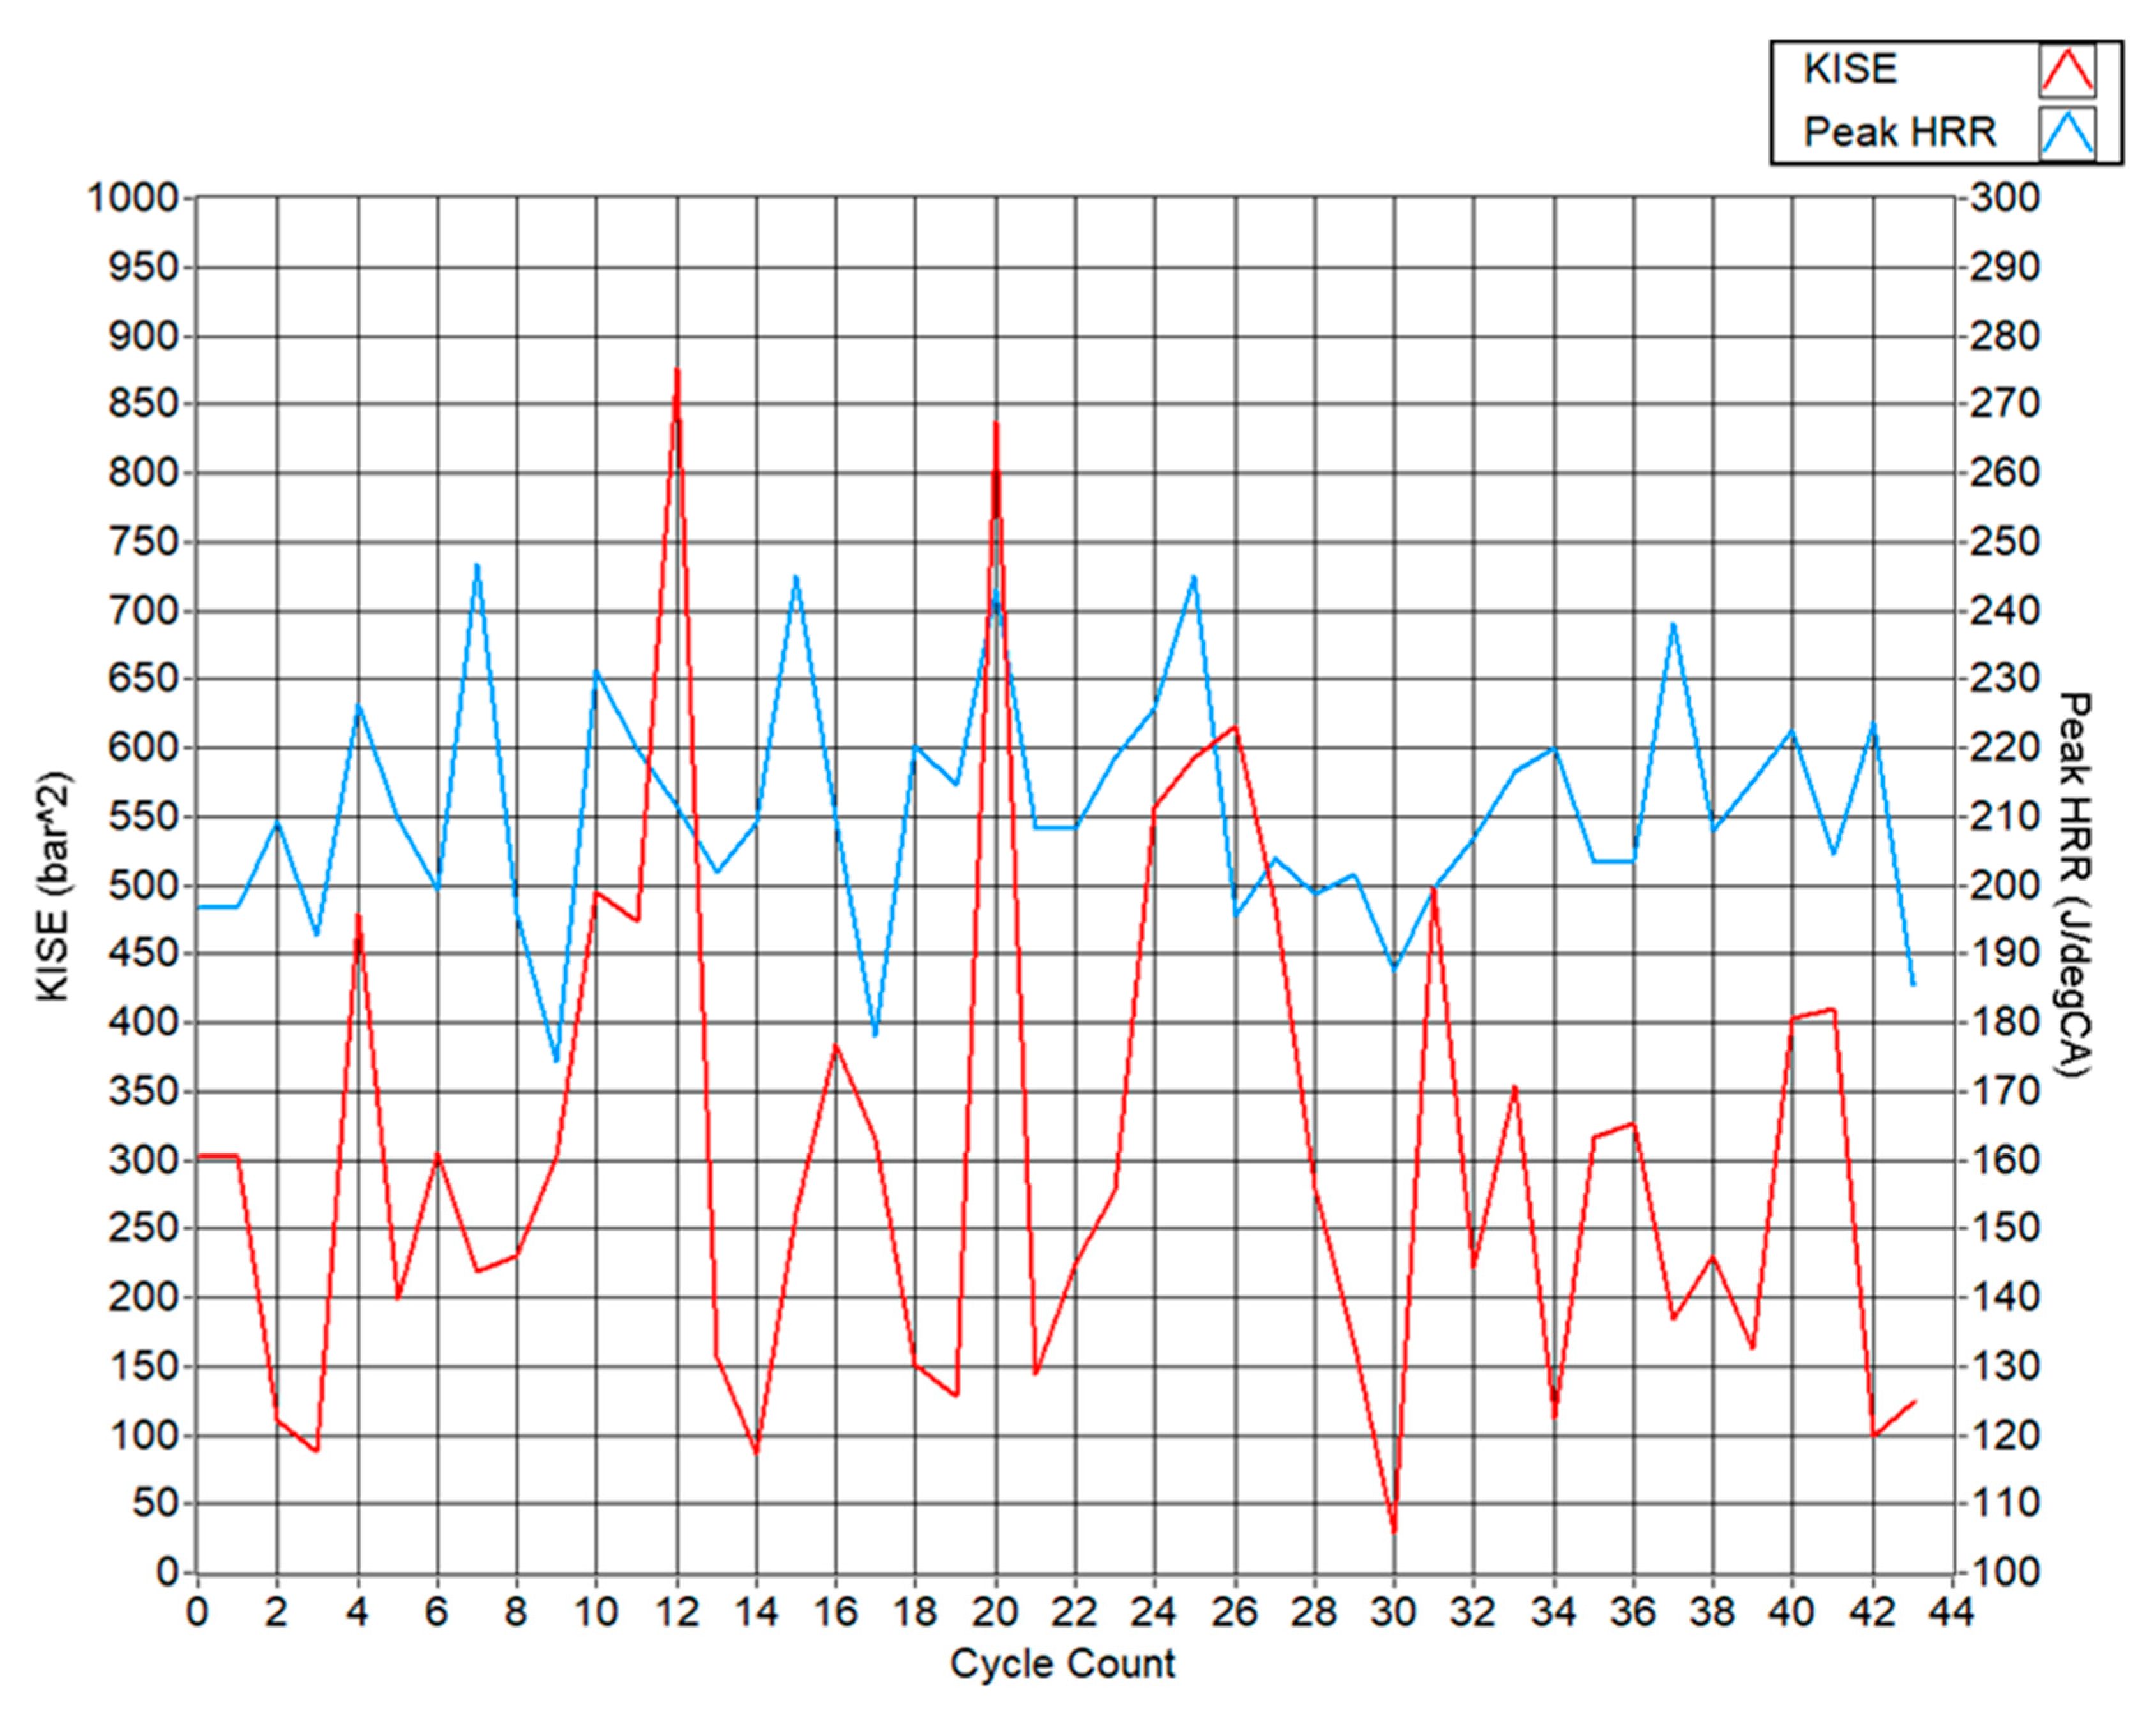
Figure 5 depicts the calculated KISE quantifying knocking combustion attributed to the initial 43 cycles. What can be noted is the sporadic nature of knocking combustion, wherein the KISE varies significantly from cycle-to-cycle. KISE is a measure of knock severity and thus the higher the value, the harsher the pressure oscillation for that given combustion cycle. What can also be noted is that severe knocking does not occur in a recognisable pattern; however, it takes place haphazardly. The most severe knocking cycle, cycle 12, with a KISE of 875 bar2, was both preceded and followed by lower KISE combustion cycles.
Figure 5.
KISE and peak heat release rate for each of the 43 ‘Test 1’ knocking combustion cycles.
Figure 5 also depicts the cycle-by-cycle peak heat release rates alongside the KISEs obtained, indicating the knock intensity. It had been discussed from the literature that high heat release rates, signifying rapid combustion events, lead to auto-ignition of the end gas. This results in the pressure oscillations initiating at the same instant that the peak HRR is reached during the cycle. As such, it would seem logical that the knock intensity would be related to the heat release rate, as the more rapid the combustion event, the greater the knock intensity; however, it is not necessarily the case. Referring to Figure 5, the greatest peak HRRs do not coincide with the greatest KISEs measured throughout the 43 ‘Test 1’ knocking combustion cycles. Cycle 7, with the highest peak HRR of all the 43 cycles of 245 J/°CA, resulted in a relatively low KISE of 218.5 bar2, whilst cycle 9, with the lowest peak HRR of 175 J/°CA, resulted in a higher KISE of 303 bar2. The cycle with the greatest knocking intensity, cycle 12, characterised with a KISE of 875, had a peak HRR of 210 J/°CA, which is only slightly greater than the mean peak HRR of 204.5 J/°CA and significantly lower than the peak HRR of cycle 7.
This further highlights the sporadic nature of engine knock as high HRRs do not always correspond to high knock intensities. This may be explained by the greater dependency of engine knock on the pressure oscillations caused by auto-ignition of the end gas rather than combustion velocity. Cycles with high peak HRRs may still undergo a more controlled combustion process with minimal end gas auto-ignition compared to cycles with lower peak HRRs. Cycles with moderate peak HRR but high knock intensity suggest multiple auto-ignition sites contributing to severe knocking rather than just a rapid energy release. The cycle-to-cycle variability, albeit showing a low mean COVHRR of 13.9%, still resulted in inherently random knock events. This could be due to various factors such as the local equivalence ratio of the charge, which impacts the flame propagation velocity and auto-ignition probability. Residual gases present in the charge, being gases not fully exhausted from the previous combustion cycle, may also alter the temperature distribution of the gaseous mixture within the combustion chamber, leading to regions with an increased likelihood of causing auto-ignition, which may vary cycle-by-cycle depending on where the residual gases manifest.
Combustion cycles with high intensity knock events result in increased heat transfer to the cylinder walls and is true for pressure oscillations with amplitudes greater than 2 bar. This is due to the increased turbulence within the charge resulting from auto-ignition, influencing the coefficient of heat transfer resulting from the increase in the Reynolds number [34]. As such, it is possible that cycles following cycles with severe knock intensities have less residual heat accumulation as a result of cooler residual gases, resulting in dampened knock intensities. This can be noted in Figure 5 as various high KISE cycles are both preceded and followed by lower KISE cycles. Cycles 24–26 behave differently in that a high knock intensity is maintained throughout the cycles, albeit these are then followed by the lowest KISE cycle, cycle 30, measuring only 28.5 bar2 of signal energy.
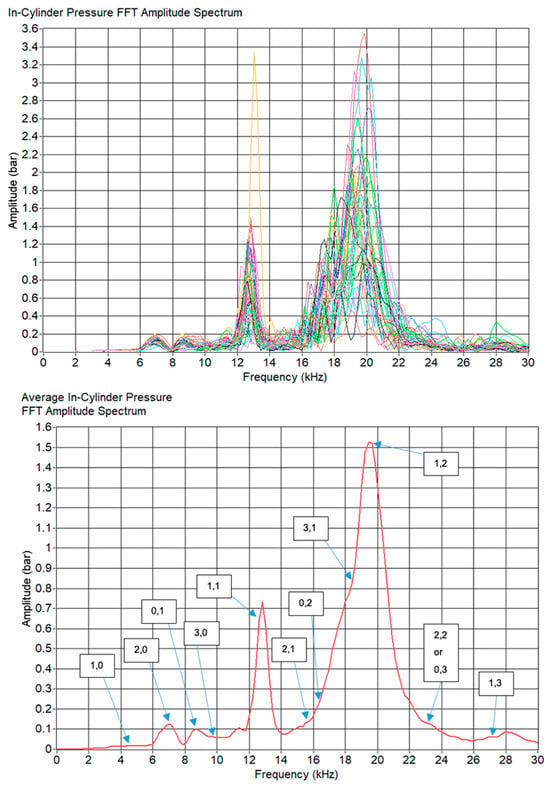
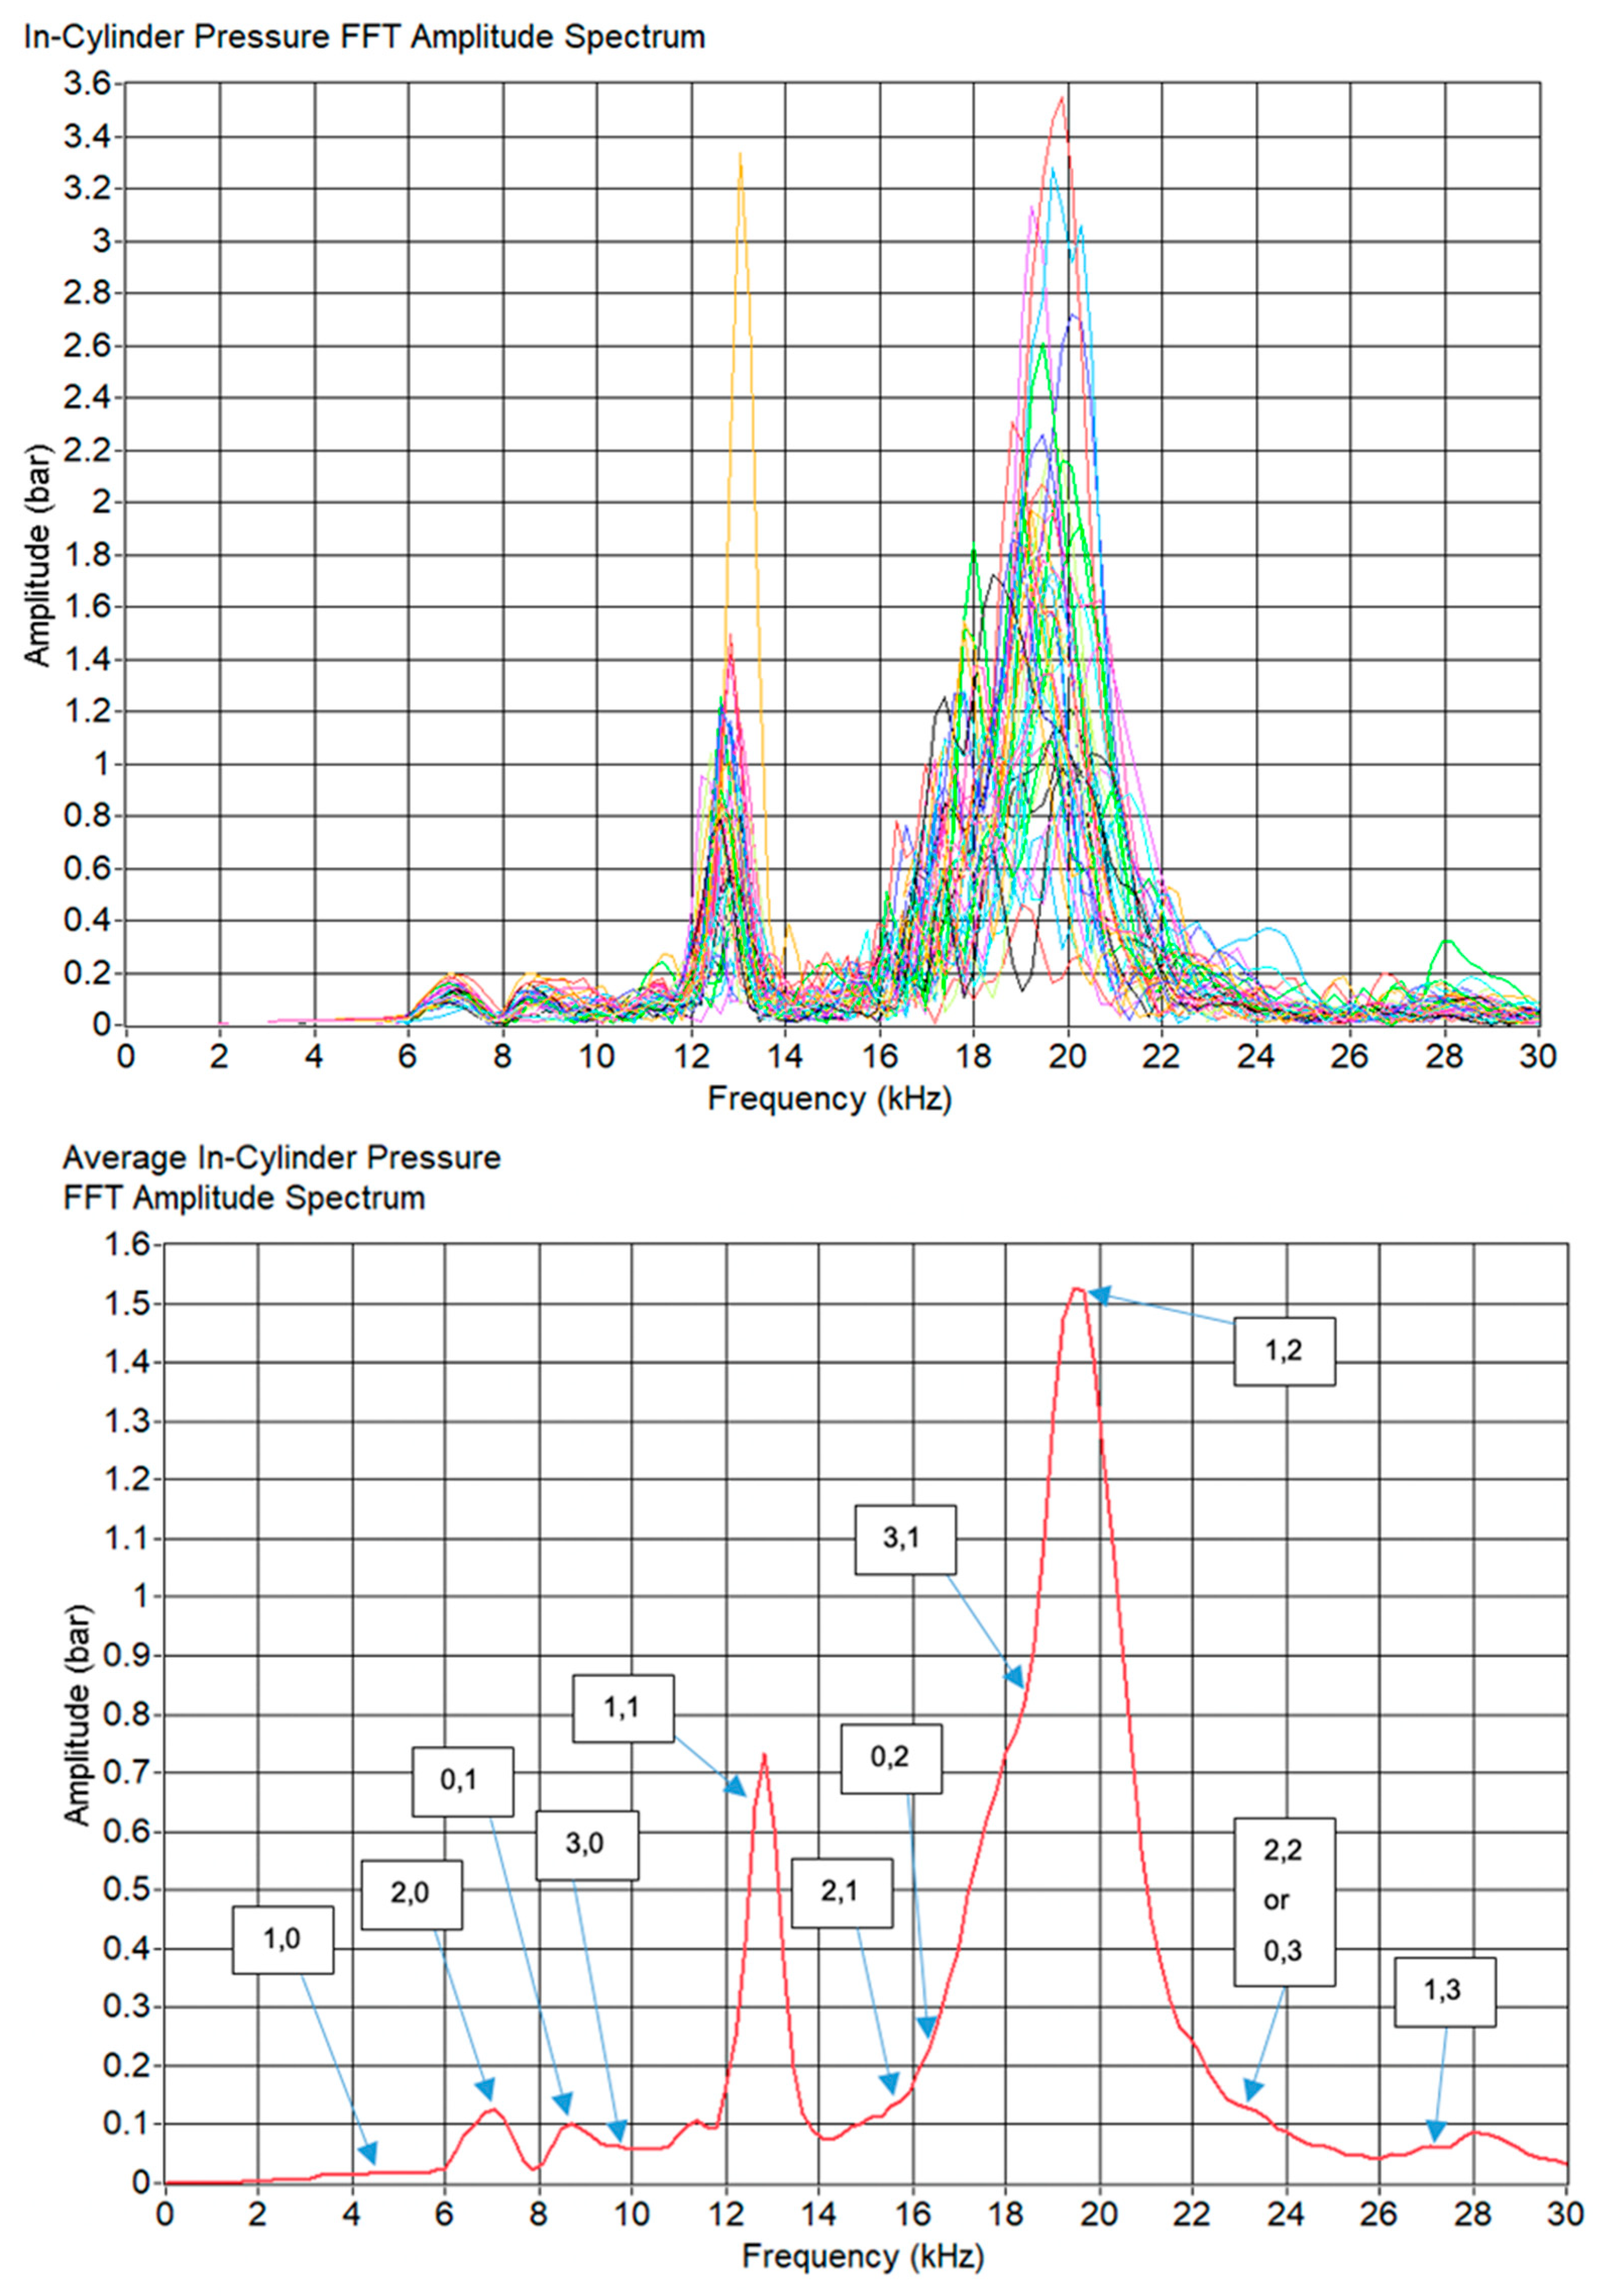
The top of Figure 6 shows the amplitude spectra of the 43 knocking combustion cycles of ‘Test 1,’ while the bottom of Figure 6 depicts the mean FFT amplitude spectrum for these 43 cycles.
Figure 6.
Top: FFT amplitude spectra of the in-cylinder pressure measurements of the 43 knocking combustion cycles of ‘Test 1’. Bottom: Ensemble-averaged in-cylinder pressure FFT amplitude spectrum of the 43 knocking combustion cycles of ‘Test 1’.
Using Draper’s equation, and the engine conditions measured during the test, the theoretical knock frequencies expected can be identified and compared to those recorded. If appreciable agreement exists between the experimental and theoretical frequencies, the frequency modes of the dominant experimental frequencies can be identified. Draper’s equation, Equation (8), and more importantly Equation (9), utilise the pressure and density of the in-cylinder gaseous mixture in order to deduce the speed of sound.
The only means of calculating the density of the gaseous charge, as previously explained, is by dividing the mass of the charge, measured from the MAF sensor, by the in-cylinder volume calculated using the crank slider equation. As both the in-cylinder volume and pressure are functions of the crank angle position, the charge density is also a function of the crank angle position and varies as engine knock develops through the cycle. As such, a specific crank angle position must be selected in order to compute the theoretical frequency modes. Since pressure oscillations within the cylinder and hence engine knock can only develop after combustion occurs, the crank angle position is selected depending on the first detectable rise in the heat release rate, for the sake of accuracy and repeatability. Thus, for this case, 359.5 °CA was selected for this computation as it is the zero-crossing point of the ensemble-averaged HRR for the 43 knocking combustion cycles.
Table 4 lists the resulting frequencies of each frequency mode as calculated using Equation (9). These frequency modes are also depicted in Figure 6 Bottom, with each arrow indicating the amplitude of each frequency mode. The most prominent peaks observed in the average FFT spectrum align closely with the theoretical frequencies predicted using Draper’s equation. This strong agreement suggests that the assumptions made in calculating the theoretical knock frequencies are valid and accurately represent the in-cylinder conditions. Consequently, the identified peaks in the FFT spectrum can be attributed to specific frequency modes, enhancing the understanding of the knock events and providing a clearer characterisation of its behaviour.
Table 4.
Theoretical calculated for each frequency mode.
The most distinct frequency modes are the second-order circumferential mode ‘(2,0)’, the first-order radial mode ‘(0,1)’, the first-order combination of circumferential and radial modes ‘(1,1)’ and a more complex mode involving both mode types ‘(1,2)’. The formation of distinct peaks in the ensemble-averaged FFT spectrum of 43 cycles indicates that the behaviour of engine knock is quite repeatable over the same conditions; thus, albeit engine knock is proven to be highly sporadic in knock intensity, the resulting frequencies can be predictable with appreciable accuracies. The most dominant frequency modes are the (1,1) and (1,2) showing an average amplitude of 0.7 bar and 1.5 bar respectively, indicating that these modes contribute the greatest energy towards engine knock.
5.2. Water Port Injection
WPI was evaluated at water mass ratios (WMRs) of 130%, defined as the ratio of water mass flow to the combined diesel and LPG mass flow. The highest WMR was selected with reference to the work of Ortega et al., who demonstrated safe operation up to a WMR ≈ 132% in a similar dual-fuel configuration [18]. During testing, the engine speed, load and mixture conditions were held constant by first stabilising operation under knocking conditions and then enabling WPI while keeping all other parameters fixed.
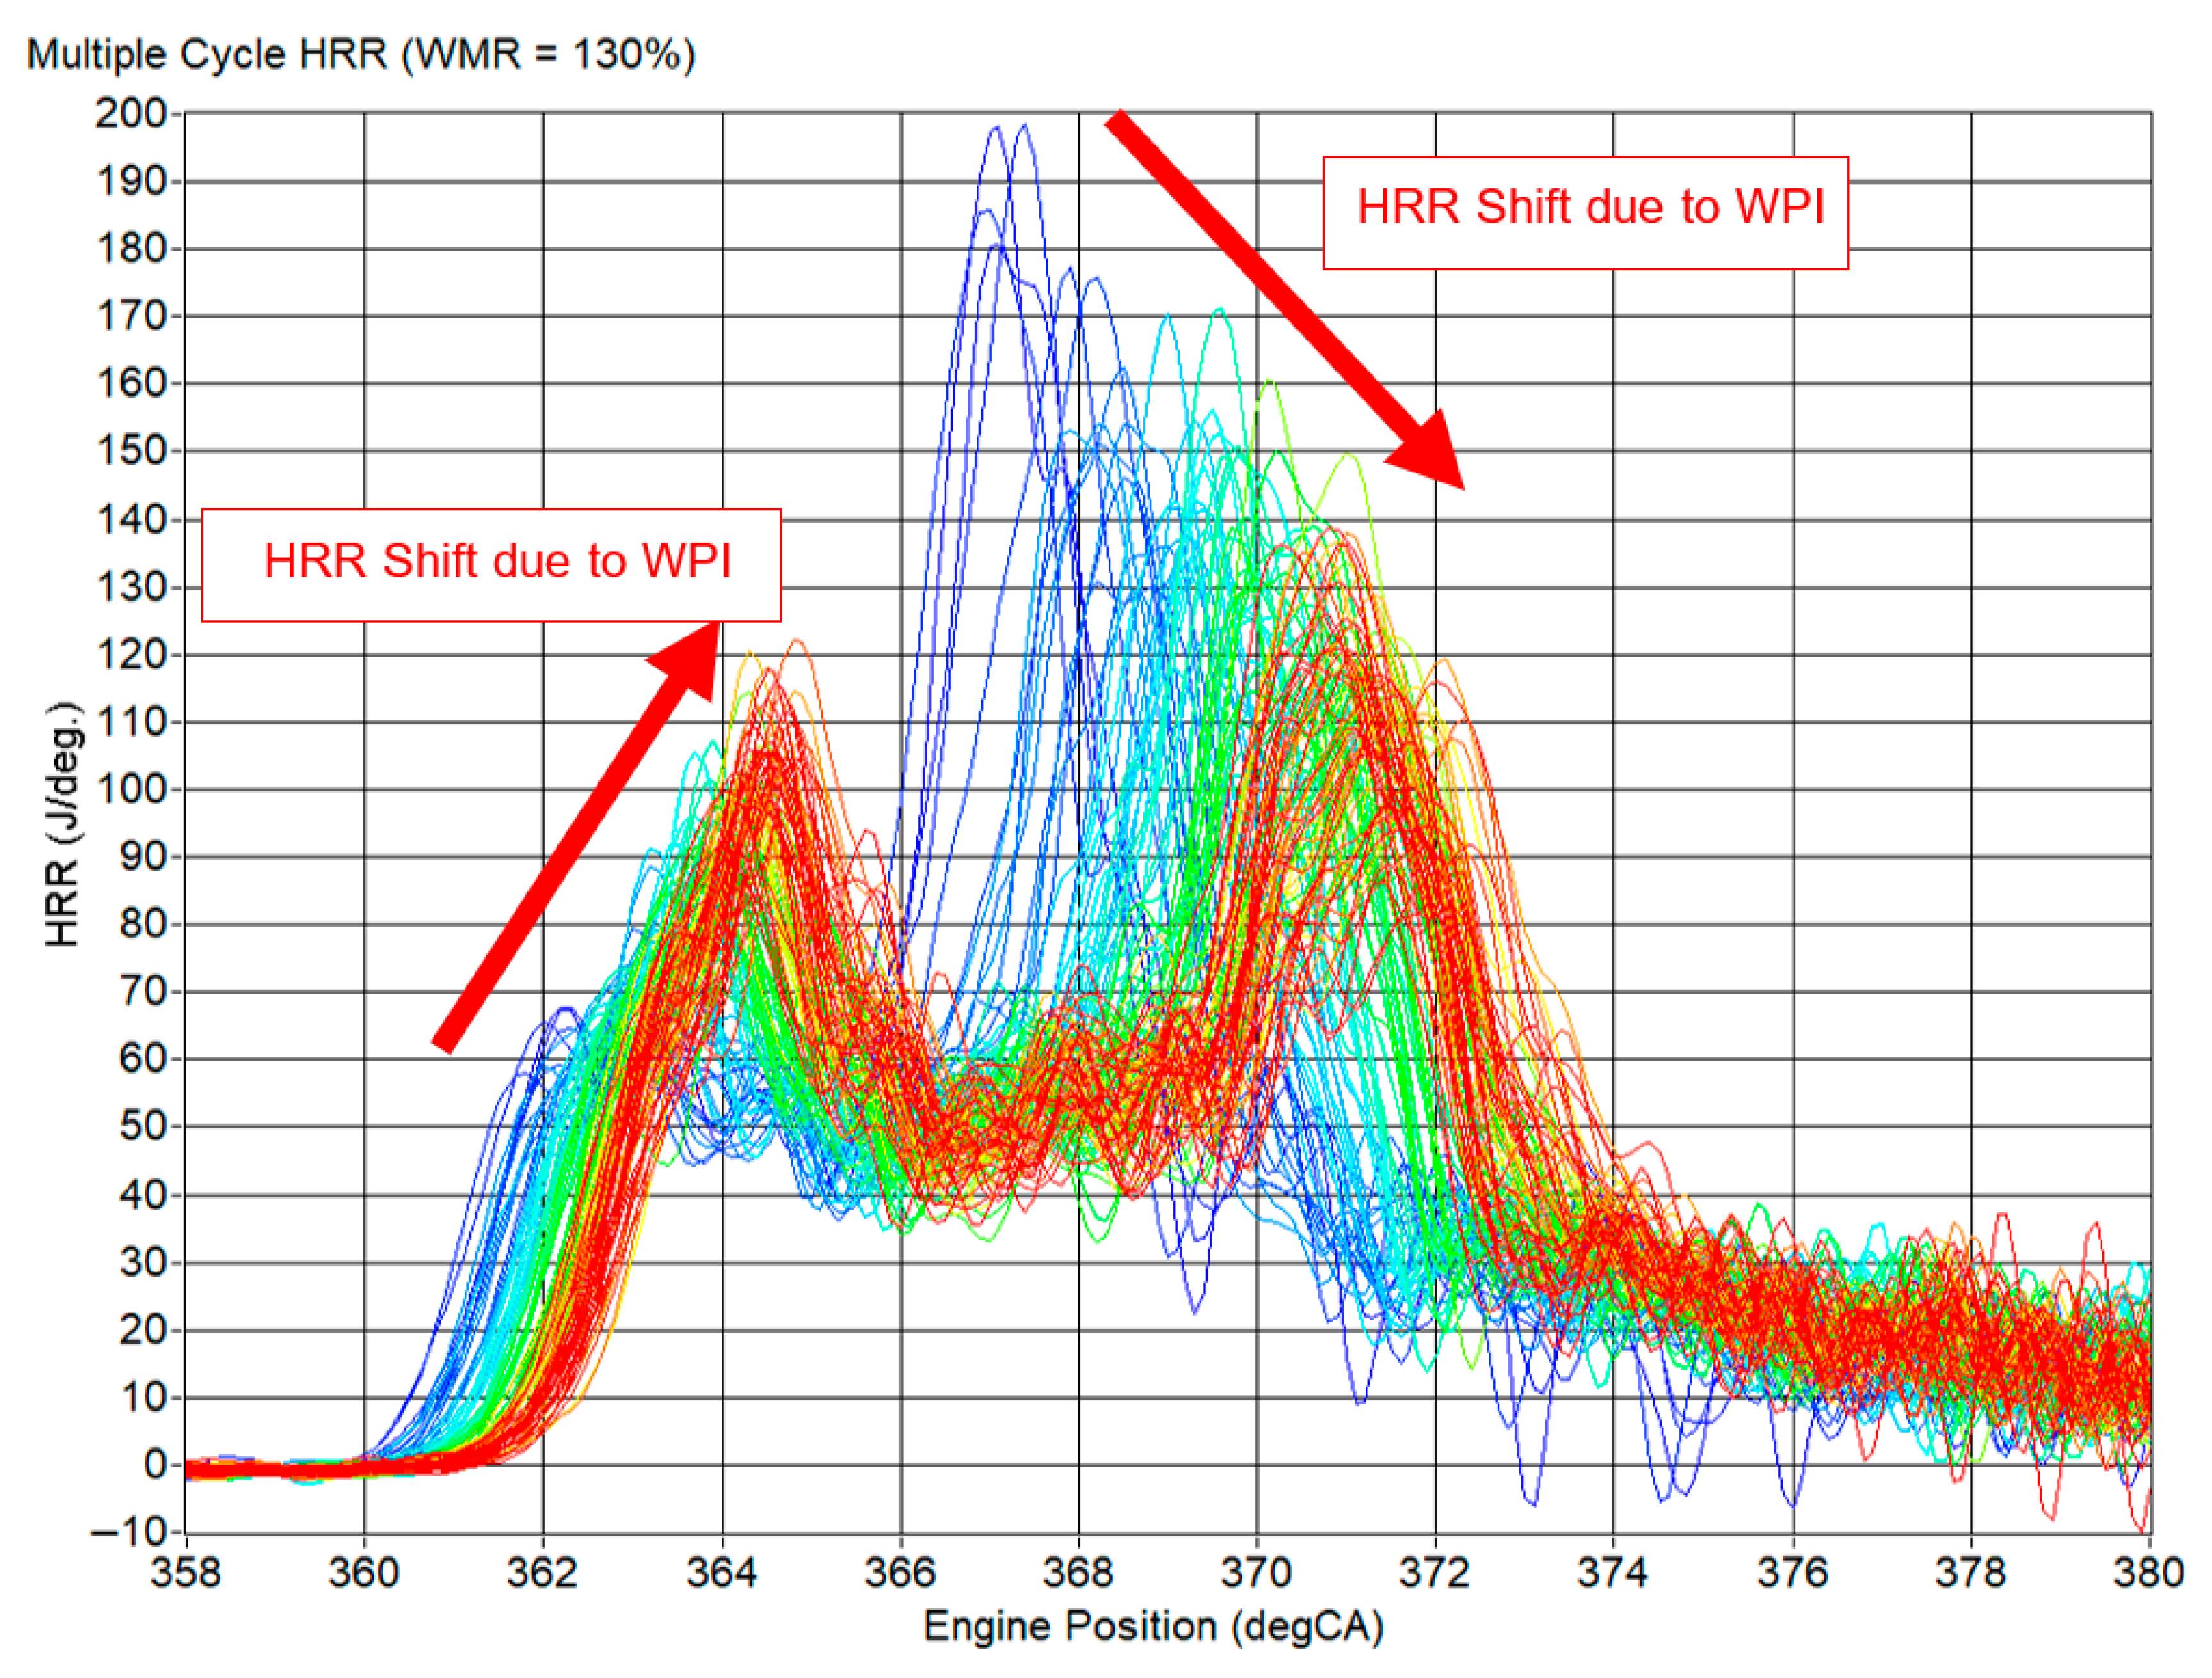
As shown in Figure 7, immediately after the onset of injection, the earliest cycles remain similar to the baseline knocking combustion, with a small initial HRR shoulder followed by a large secondary peak. As the cycles progress under WPI, the start of combustion (SOC) is gradually retarded from 359.5 °CA to 361 °CA, and the initial HRR peak between 360 °CA and 366 °CA increases from about 67 J/°CA to 120 J/°CA, while the secondary peak decreases from roughly 198 J/°CA to 90 J/°CA. This redistribution of heat release indicates that a larger fraction of the premixed charge is burned earlier in the cycle, and that the subsequent part of combustion proceeds in a slower, more controlled manner.
Figure 7.
Multiple HRRs of 130 combustion cycles with WPI initiated at a WMR of 130% throughout. (Colours range from blue to red, with blue indicating the earlier cycles and red indicating the final cycles under WPI.)
The shift in the mean peak HRR over the 130 WPI cycles in Test 3 (130% WMR) confirms this trend. The initial shoulder increases from ~60 J/°CA in the knocking reference to about 84 J/°CA, while the secondary peak is reduced from ~210 J/°CA to 92 J/°CA, corresponding to a 56% reduction in the mean peak HRR at 130% WMR. The COVHRR increases from about 13% in the 43 baseline knocking cycles to 29.9 ± 9.7% during WPI as the reduced and less repeatable secondary peak contributes a larger relative variation.
Despite the strong attenuation of the peak HRR, the MFB analysis shows that the overall burn duration up to 90% mass fraction burned (BDUR0–90) is only weakly affected. The mean burn duration for Test 3 is 23 °CA, just 1 °CA longer than the 22 °CA observed under the knocking operation. This apparent similarity hides a meaningful redistribution of the burn. When the interval from the SOC (CA0) to CA70 is considered, the knocking reference burns 70% of the fuel within 9.3 °CA, whereas WPI extends this interval to 11.4 °CA, a 22.6% increase. A comparison of the MFB with no port injection, water port injection and AdBlue port injection can be seen in Figure 4.
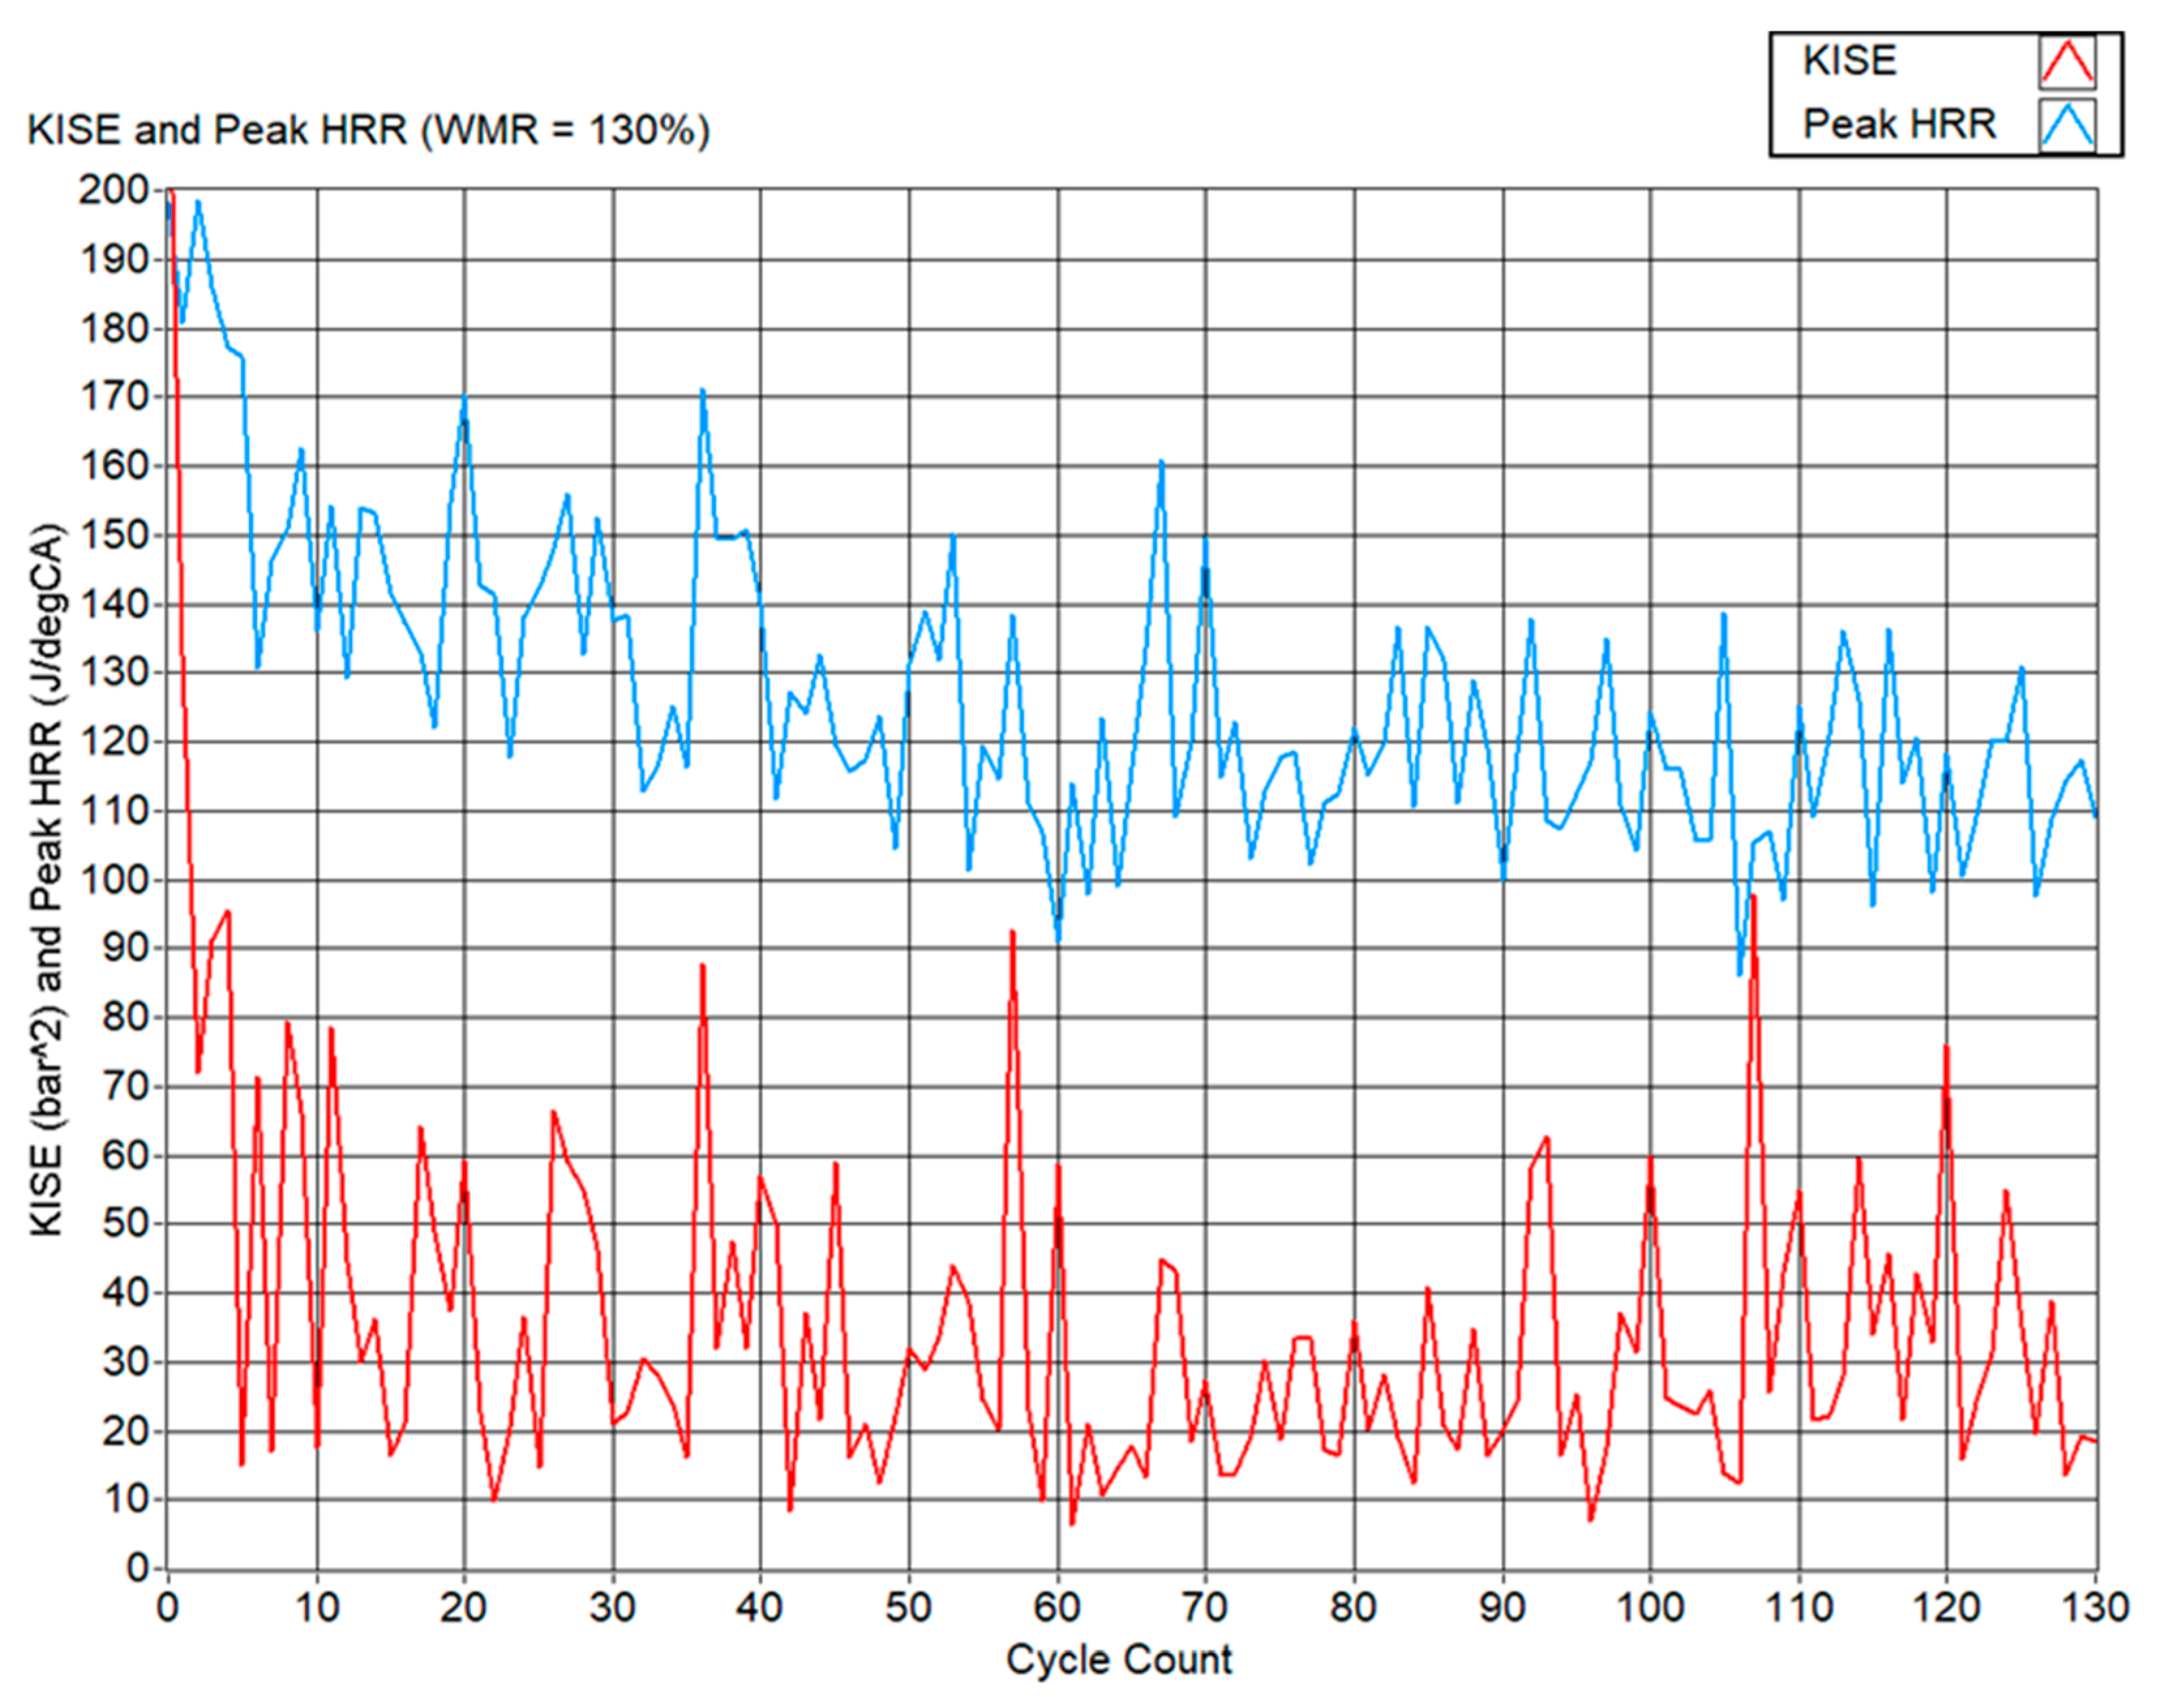
The knock-induced signal energy responds strongly to WPI, as shown in Figure 8. Across the 130 cycles of Test 3 (130% WMR), the mean KISE drops from 307.2 bar2 in the baseline to 36.1 bar2, meaning an 88% reduction. Simultaneously, the peak HRR across individual cycles decreases into the range 90–140 J/°CA, compared with 180–250 J/°CA under the severe knock baseline test. These trends confirm that WPI is highly effective in suppressing knock intensity, confirming its capability as a knock-suppressant fluid.
Figure 8.
KISE and peak HRR plotted for all of the 130 WPI combustion cycles of ‘Test 3’.
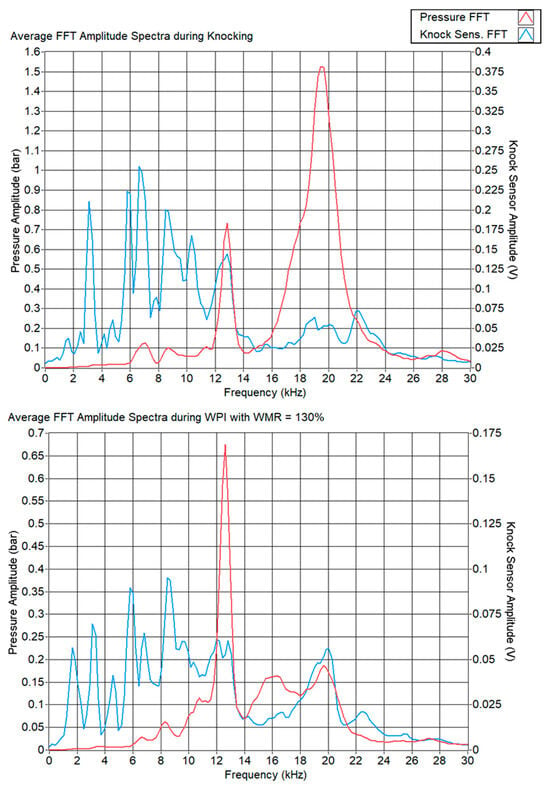
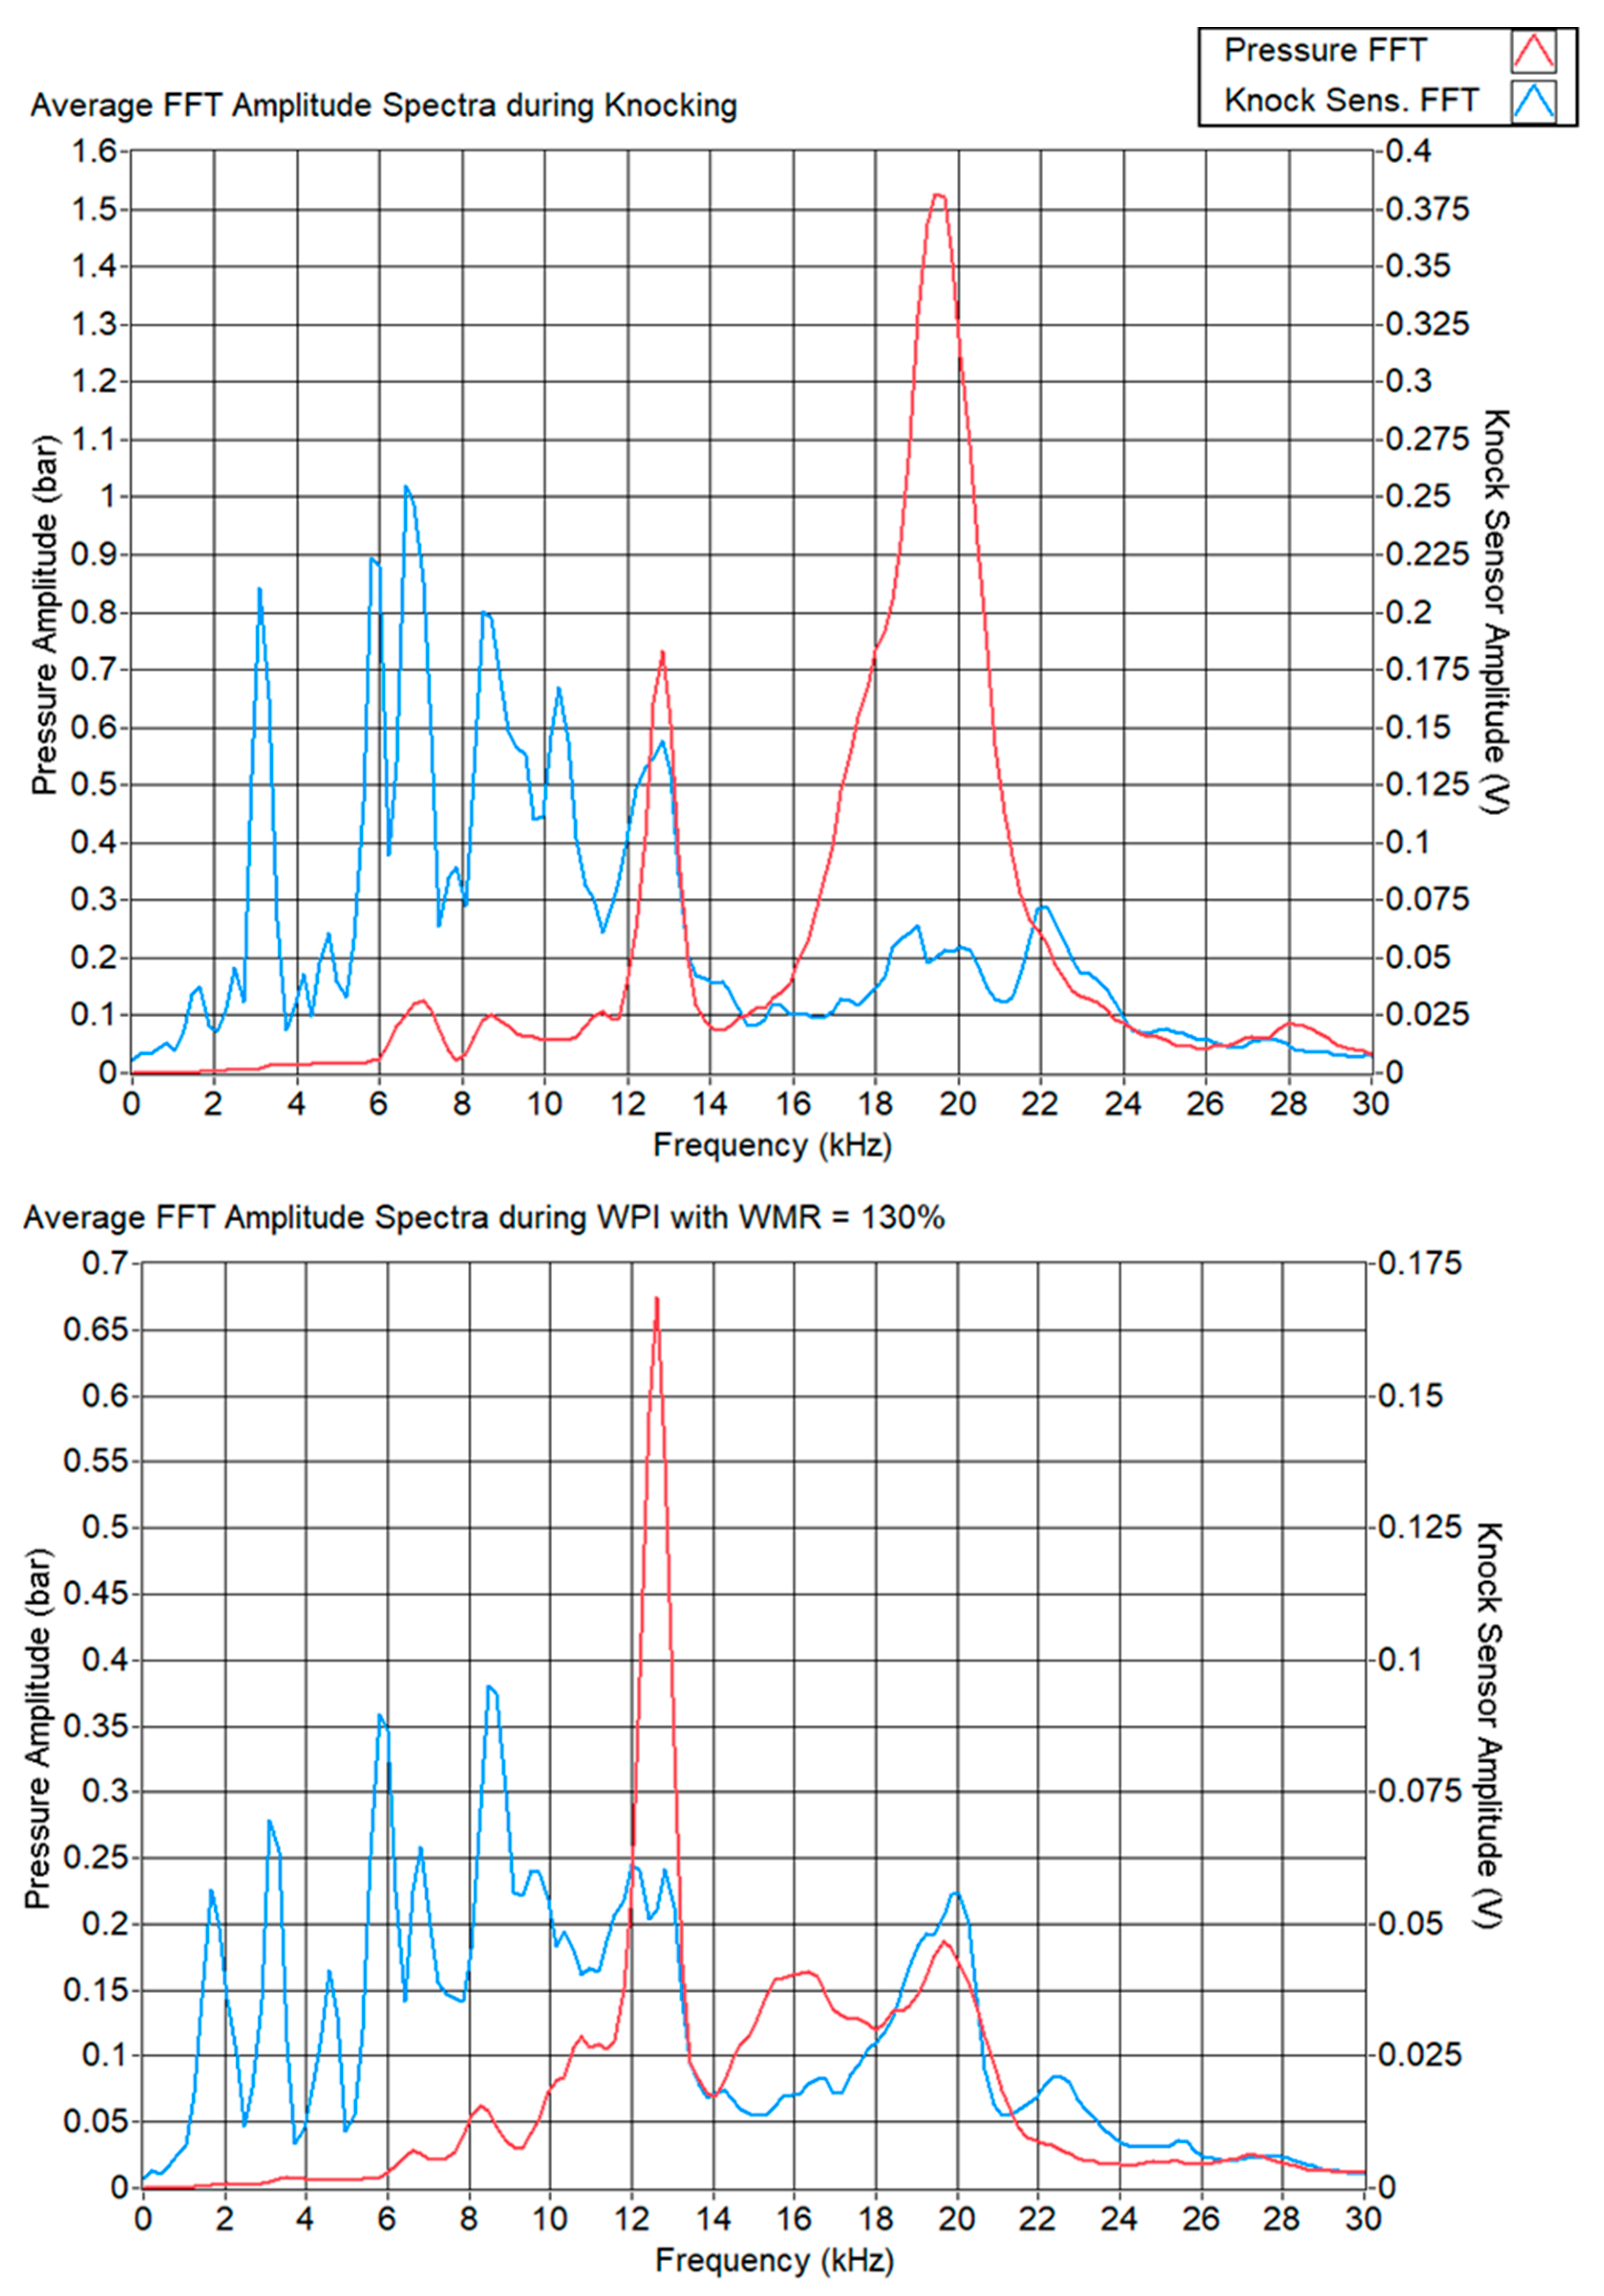
Frequency-domain analysis of the in-cylinder pressure signal further clarifies the mechanism of knock mitigation. Under baseline knocking conditions, the FFT spectrum exhibits dominant resonant modes at approximately 7.1 kHz (2,0), 8.8 kHz (0,1), 12.4 kHz (1,1) and 19.8 kHz (1,2). The (1,2) mode at 19.8 kHz has the highest amplitude, around 1.5 bar, and is strongly attenuated by WPI to about 0.175 bar, as shown in Figure 9. In contrast, the (1,1) mode retains an amplitude near 0.7 bar with and without WPI, and is therefore interpreted as a structural resonance of the engine block rather than a temperature-sensitive combustion mode [13].
Figure 9.
Top: FFT spectra of both the in-cylinder pressure signal and knock sensor signal for both knocking combustion cycles, bottom: WPI combustion cycles.
5.3. AdBlue Port Injection
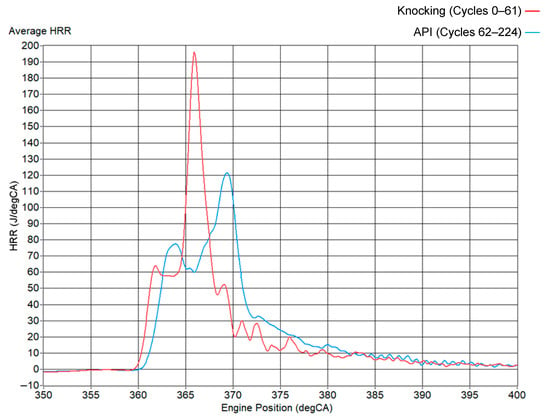
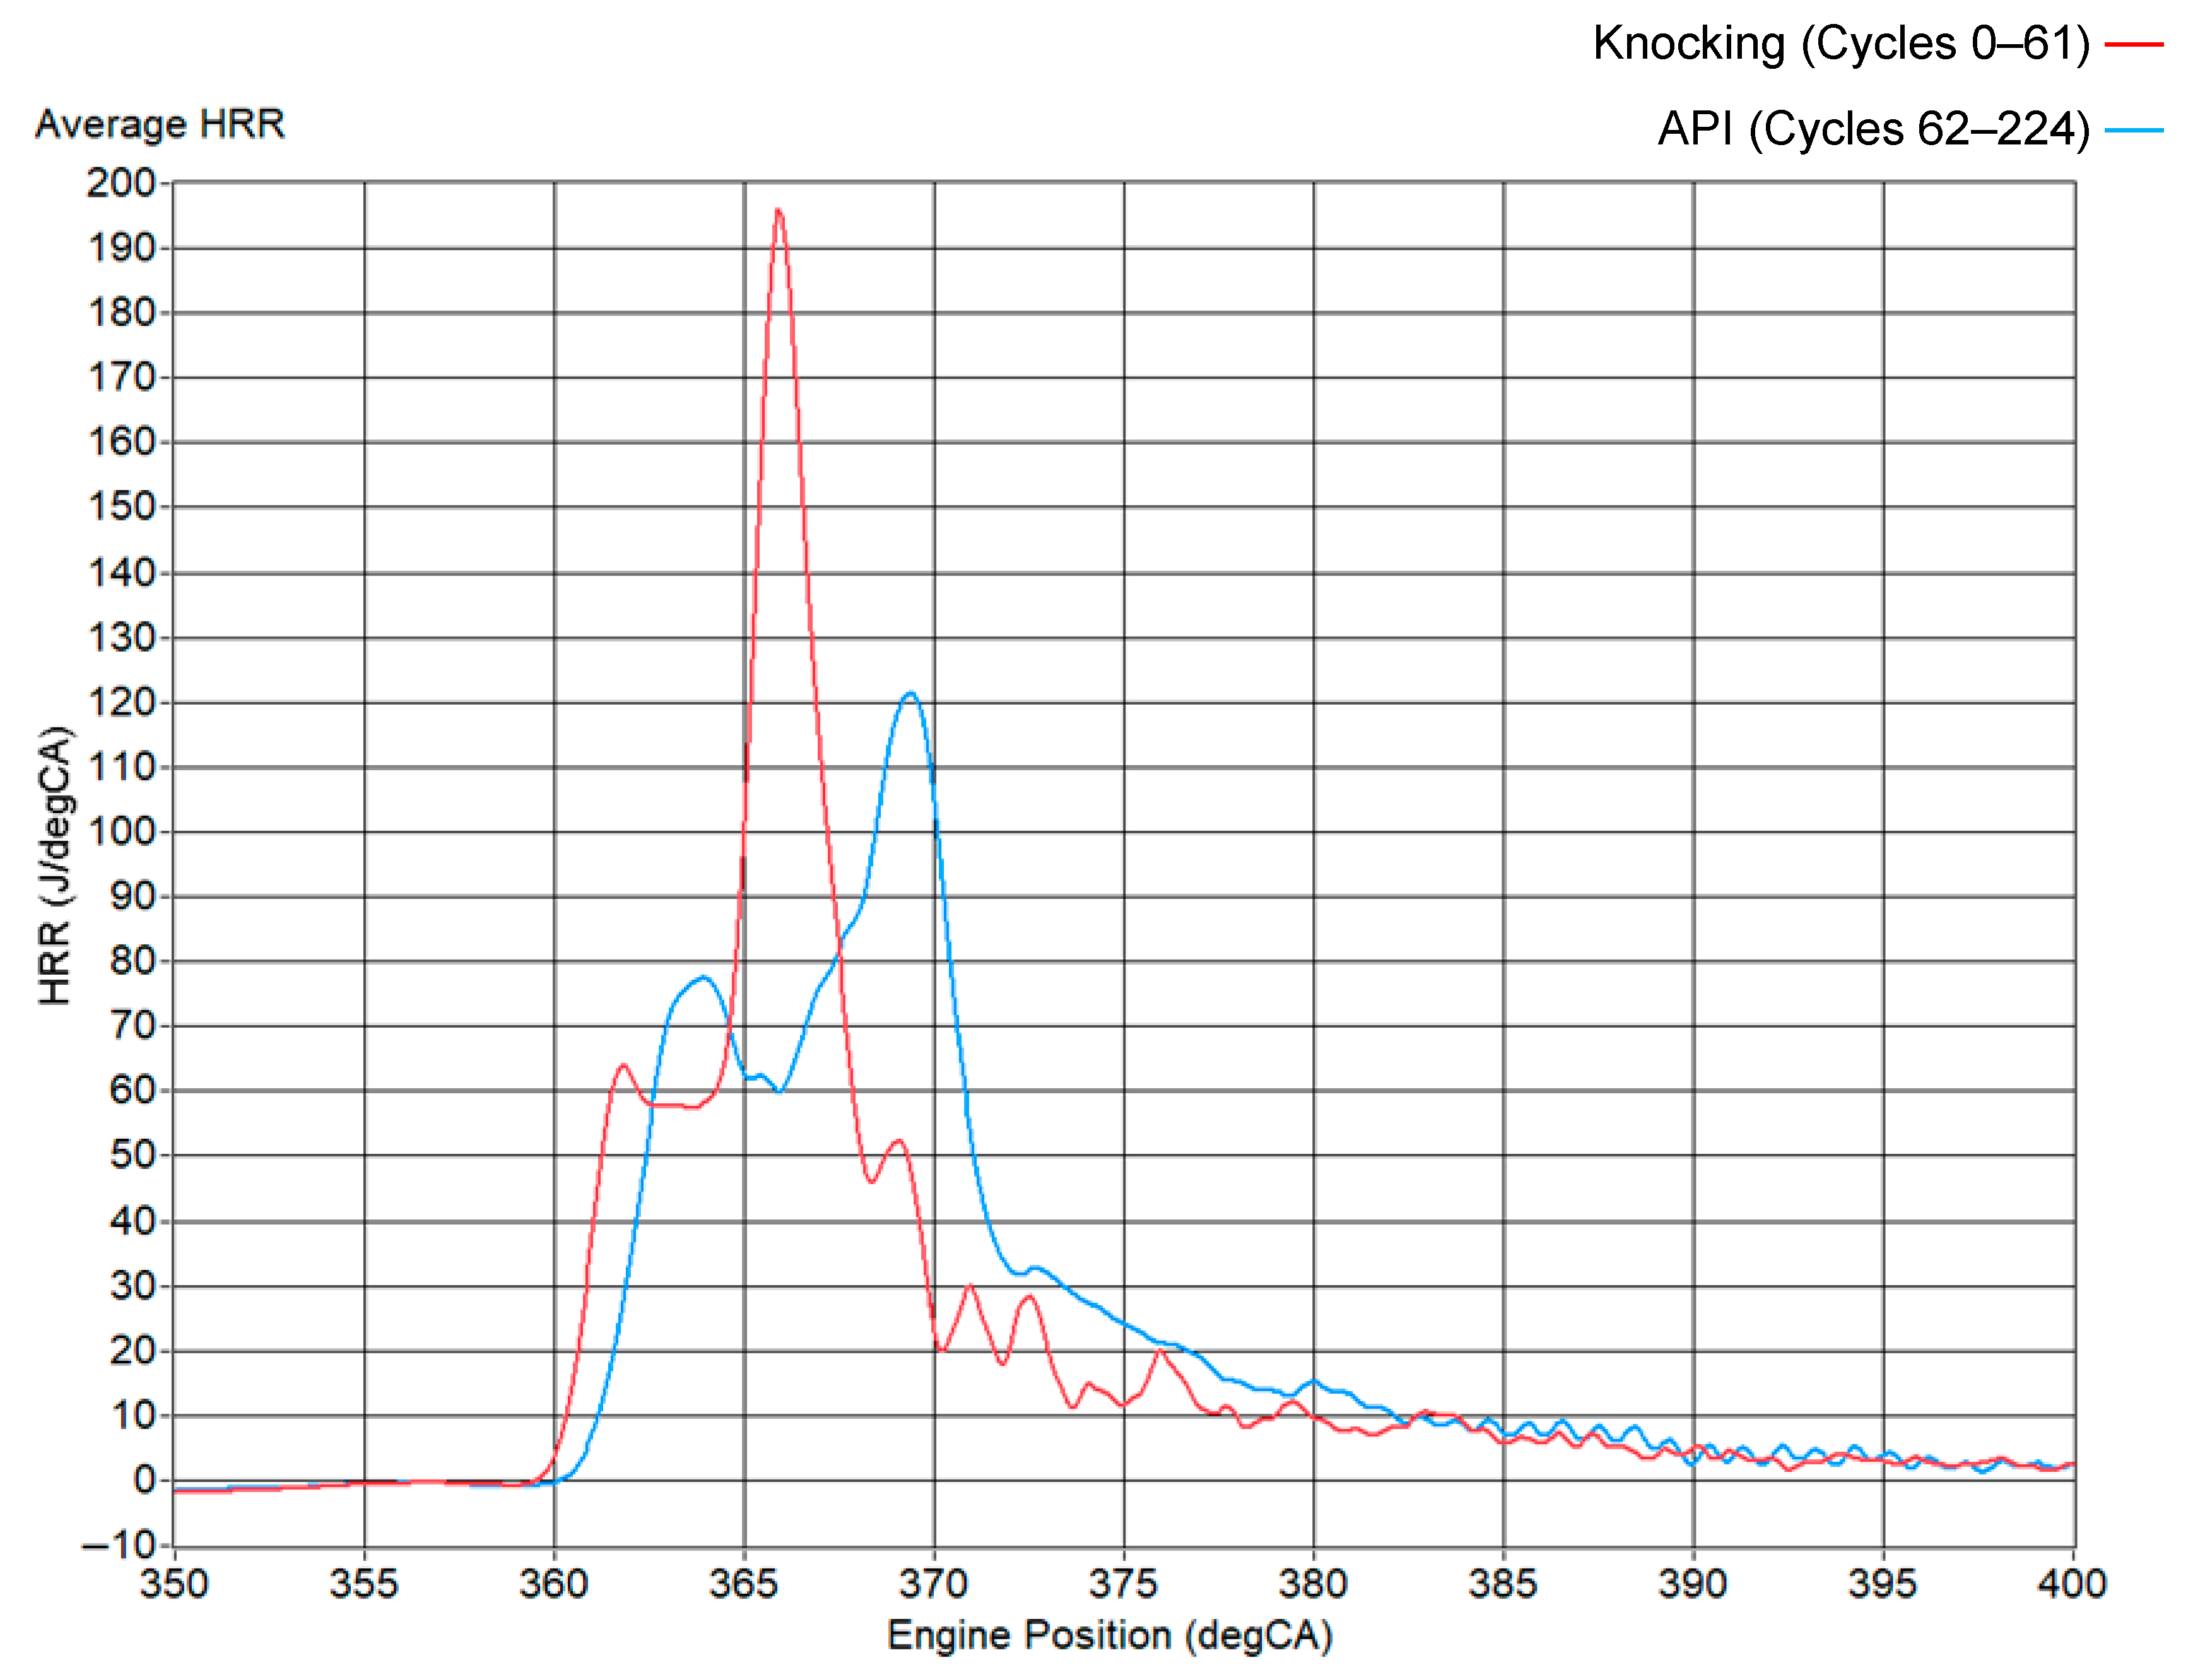
AdBlue port injection (API) was investigated at AdBlue mass ratios (AMRs) of 43%, 81% and 130% relative to the total fuel mass. For concision, Test 6 at 130% AMR is highlighted here, since Tests 4 and 5 exhibited similar but less pronounced trends. With reference to Figure 10, the ensemble-averaged HRR over the 61 knocking cycles preceding API and the subsequent 162 API cycles shows that API retards the SOC by about 0.86 °CA and reduces the peak HRR from ~195 J/°CA to ~122 J/°CA. This corresponds to a 37% reduction in the peak HRR, significantly smaller than the 56% reduction achieved by WPI, indicating that API mitigates knock while retaining a more intense combustion event.
Figure 10.
Ensemble-averaged HRR plots for the 162 AdBlue port injection cycles of ‘Test 6’ and the 61 cycles prior, undergoing knocking combustion.
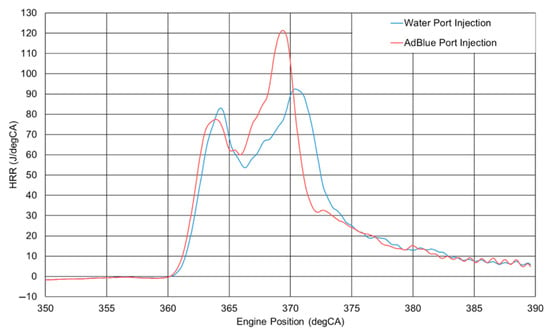
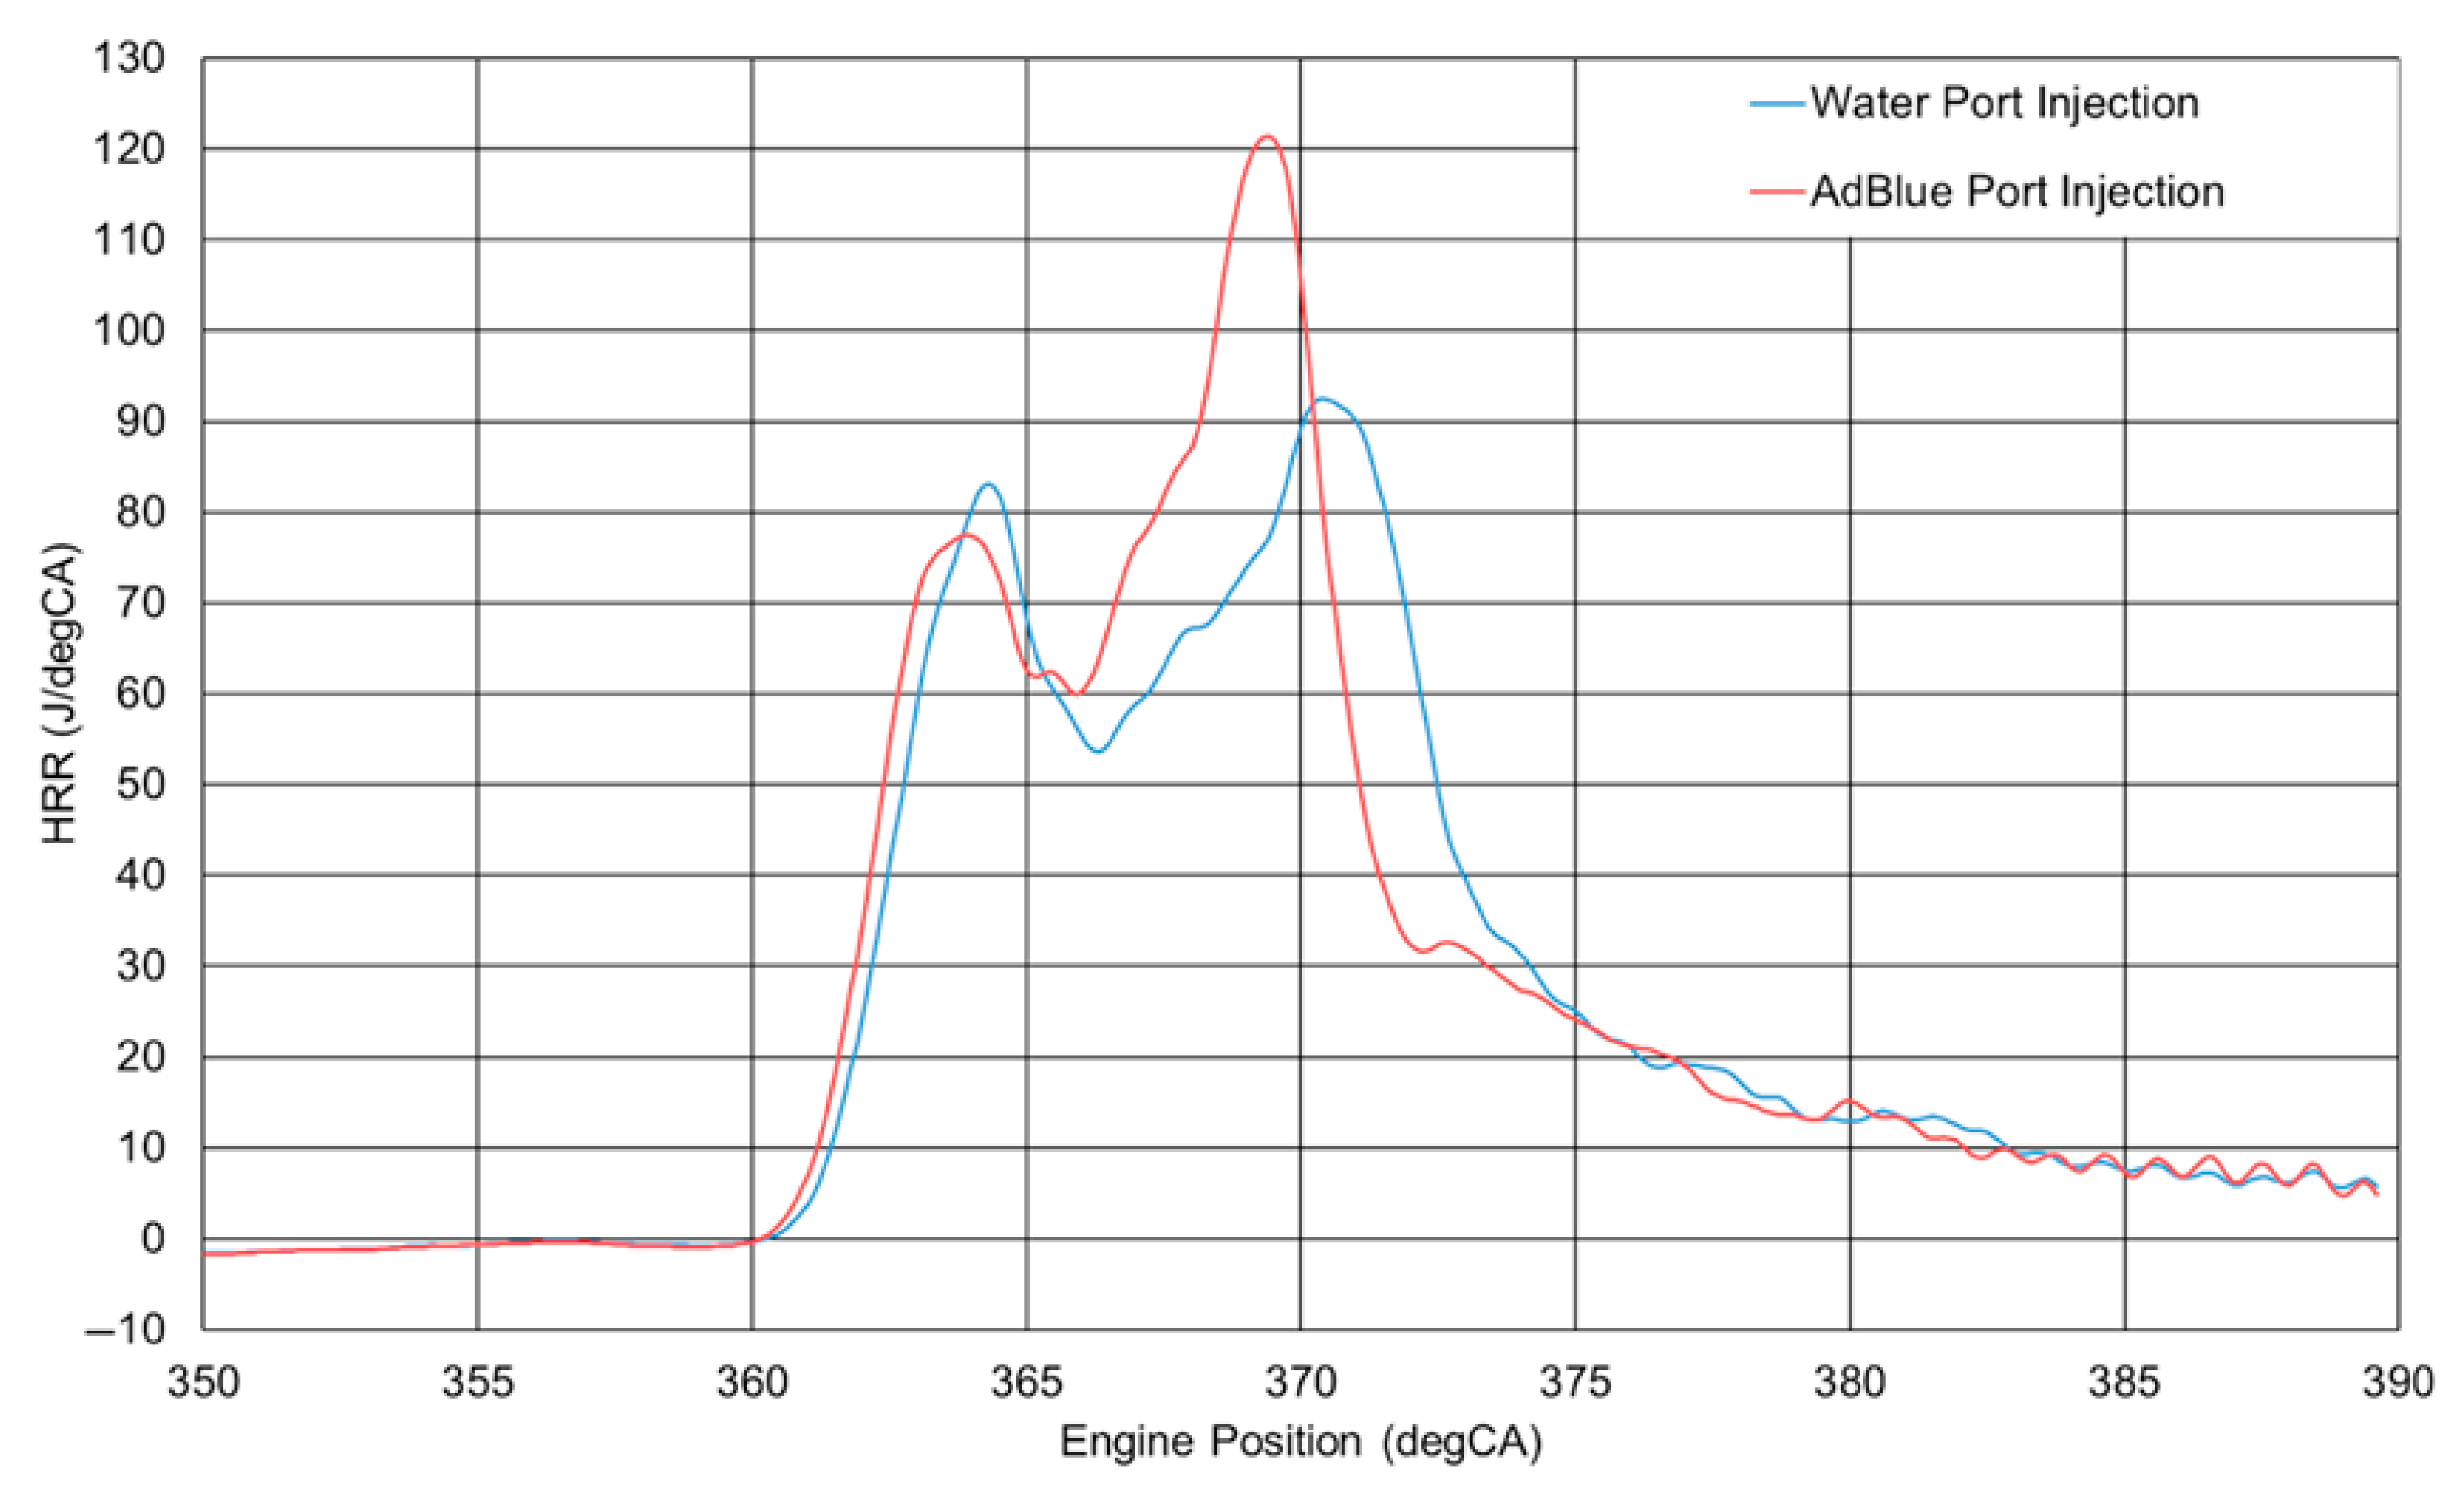
Direct comparison of the ensemble-averaged HRR traces for WPI and API at a 130% mass ratio, as can be seen in Figure 11, reveals important differences. Both strategies produce a characteristic dual-peak structure, but WPI yields a later SOC and a higher first peak, whereas API ignites earlier with a slightly smaller first peak and a more pronounced second peak. The smaller retardation of the SOC with API suggests that the diesel pilot has less time to premix before ignition, leading to fewer ignition kernels and somewhat less premixed charge consumed during the initial phase. The higher second peak with API is attributed to the combustion of urea contained in AdBlue, which provides additional chemical energy later in the cycle.
Figure 11.
HRR against engine position comparing impact of WPI and API at 130% mass ratios.
The contribution of urea to the overall heat release was quantified by taking the difference between the mean CHR of the API combustion cycles to the WPI combustion cycles. The energy released as heat due to the combustion of urea would be found. This is shown in the following:
This analysis yields an average additional 33 J of released heat per cycle attributed to urea. For both Tests 3 and 6, the mean duration of injection (DOI) into the intake port was 8.31 ms, which, through the previously calibrated injector mass–DOI correlation, corresponds to 22.94 mg of total knock-suppressant fluid per cycle. For AdBlue, this implies 7.46 mg of urea (32.5 wt.% in water), with a chemical energy content of approximately 79 J per cycle. The ratio of released heat (33 J) to chemical energy (79 J—QLHV) gives an effective combustion efficiency of about 41% for urea under these dual-fuel conditions. By comparison, lean spark-ignition combustion typically achieves 95–98% combustion efficiency [31], suggesting that a large fraction of the injected urea either does not fully decompose and burn or is exhausted as unreacted intermediates. Nevertheless, the partial utilisation of urea still contributes non-negligible additional heat release and helps sustain HRR in API operation.
The MFB analysis for API closely mirrors that of WPI, as shown in Figure 4. The mean burn duration BDUR0–90 is again 23 °CA at 130% AMR, identical to the WPI case and only slightly longer than the knocking baseline. Considering the CA0–CA70 interval, API burns 70% of the charge within 11.2 °CA, marginally shorter than the 11.4 °CA observed with WPI (≈1.8% decrease). This small difference is consistent with the slightly higher late-cycle HRR due to urea combustion and suggests that API mildly accelerates the main part of the burn while still avoiding violent knock.
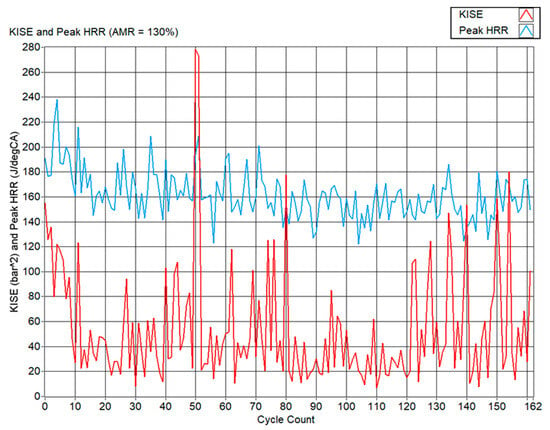
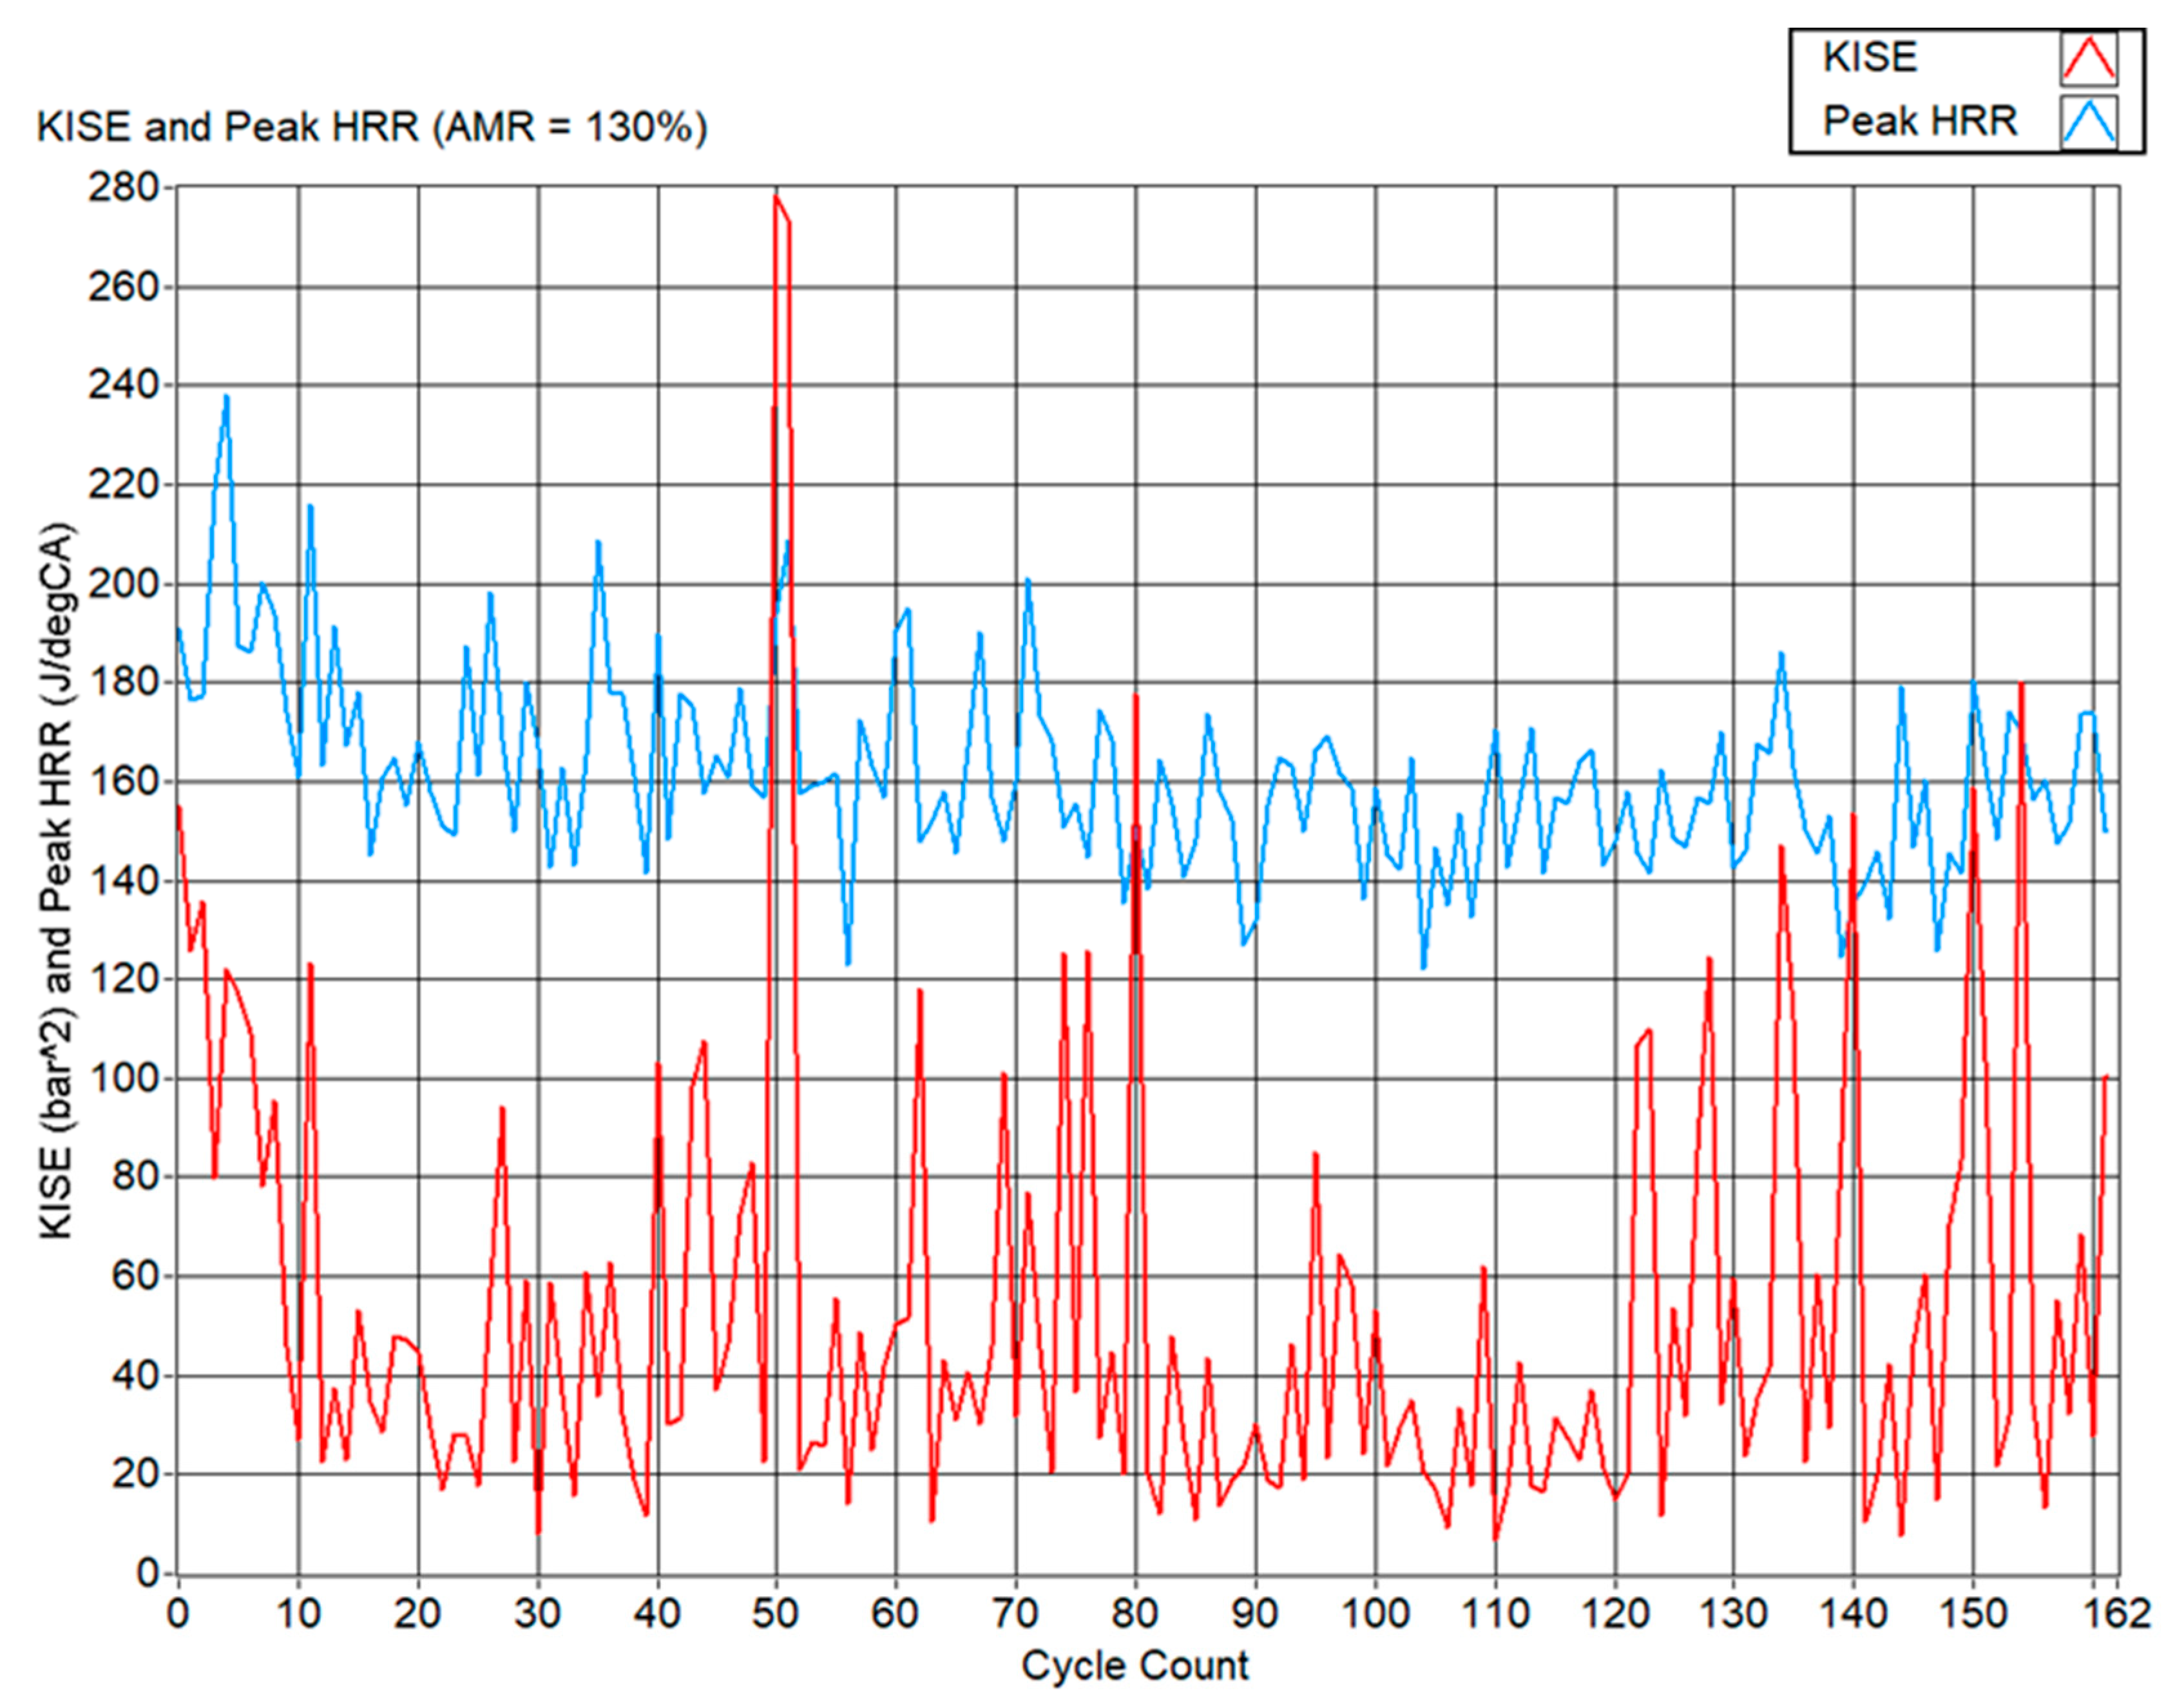
Figure 12 shows the cycle-resolved peak HRR and KISE for API (Test 6), which show a progressive reduction in knock intensity as the cycles evolve under injection, analogous to the hysteresis behaviour seen with WPI. After sufficient cycles, the peak HRR values settle in the 120–200 J/°CA range, with a mean of 161.3 ± 19.2 J/°CA, compared with 210.7 ± 16.9 J/°CA in the severe knocking reference and 126.1 ± 20.2 J/°CA for WPI. The mean KISE under API is 53.3 bar2, representing an 82.6% reduction from the baseline and only slightly higher than the 88% reduction achieved with WPI. Thus, API delivers nearly the same knock suppression as WPI while retaining significantly higher peak HRRs.
Figure 12.
KISE and peak HRRs for the 162 API combustion cycles.
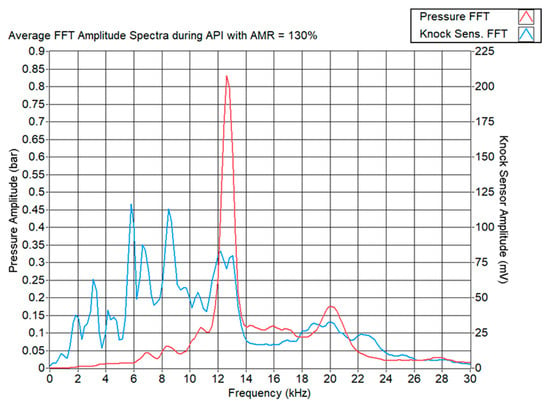
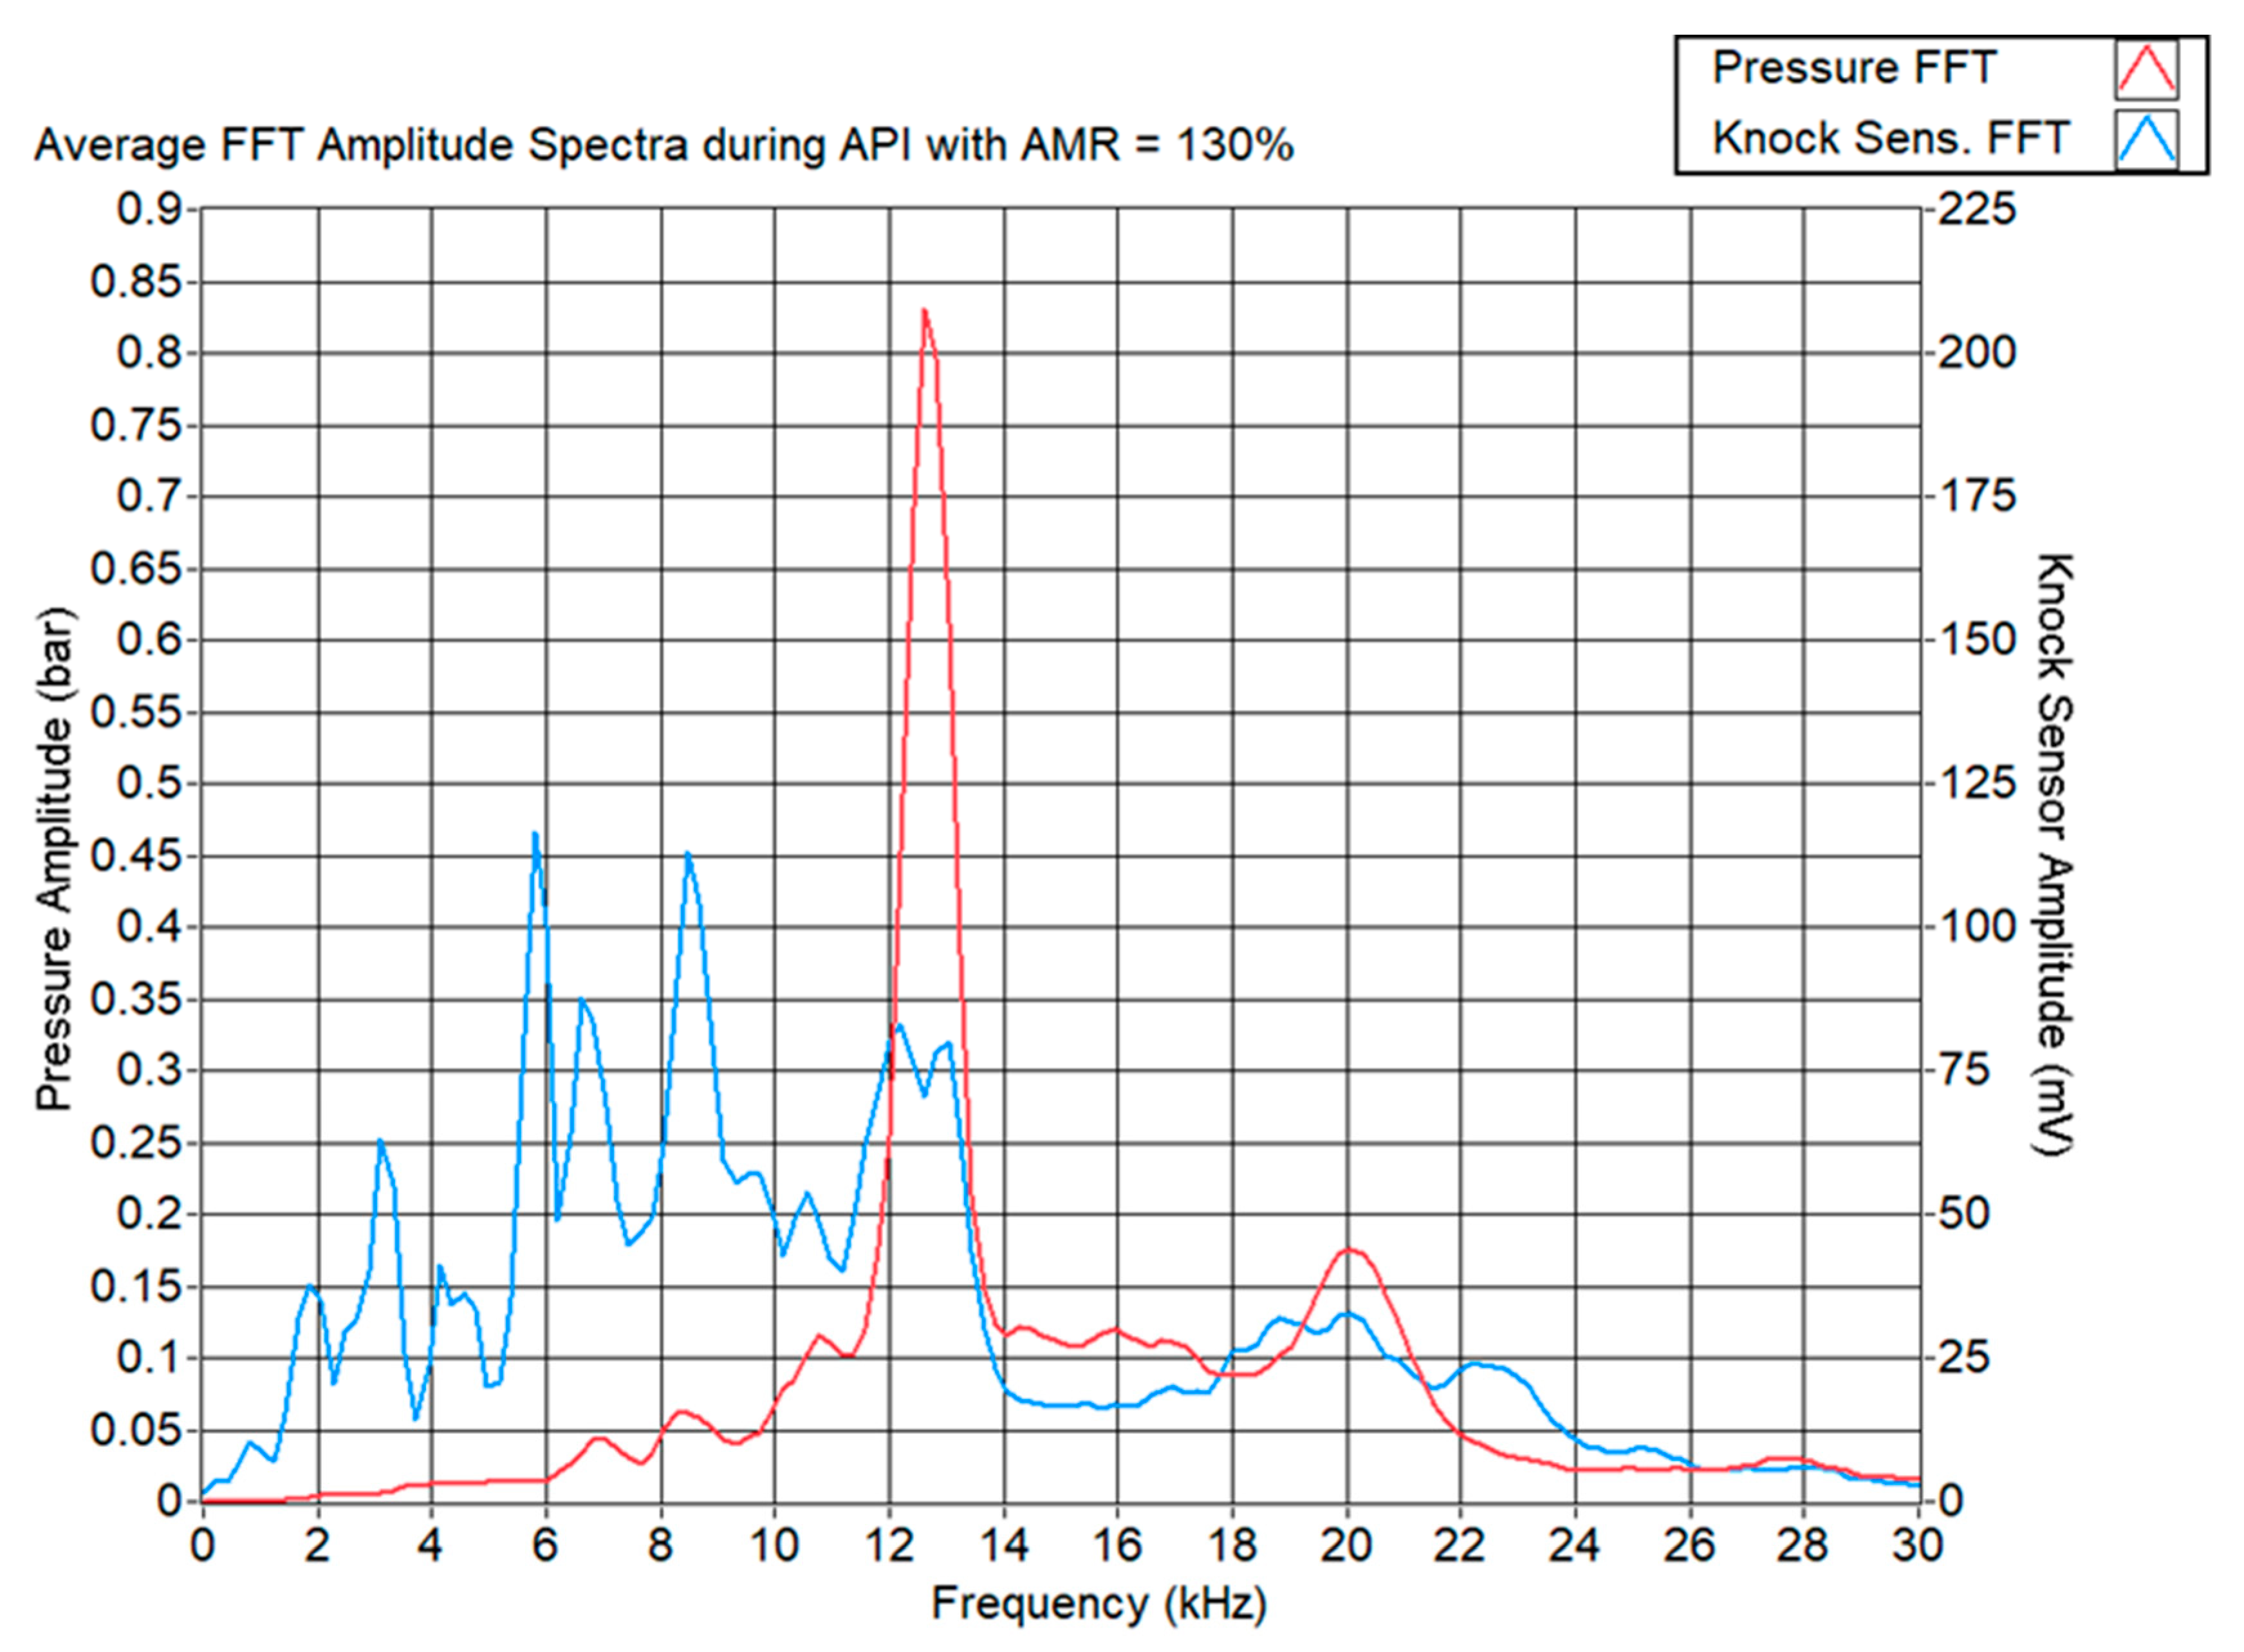
The FFT spectra for API at 130% AMR exhibit similar structural features to those under WPI with reference to Figure 13. The (1,2) mode around 19.7–19.8 kHz remains strongly damped with an amplitude of approximately 0.18 bar, confirming its association with combustion-induced knock and its sensitivity to both WPI and API. By contrast, the (1,1) mode at 12.4 kHz shows a higher average amplitude during API (0.83 bar) compared with WPI (0.67 bar), consistent with the higher peak HRR and somewhat rougher combustion under API. The persistence of this mode in both the pressure and knock sensor spectra, despite strong knock mitigation, reinforces its interpretation as predominantly driven by structural resonance, with its amplitude modulated by the overall combustion severity [13].
Figure 13.
FFT spectra of both the in-cylinder pressure signal and knock sensor signal for API combustion cycles.
5.4. Impact of WPI and API on BTE, BMEP and In-Cylinder Pressure
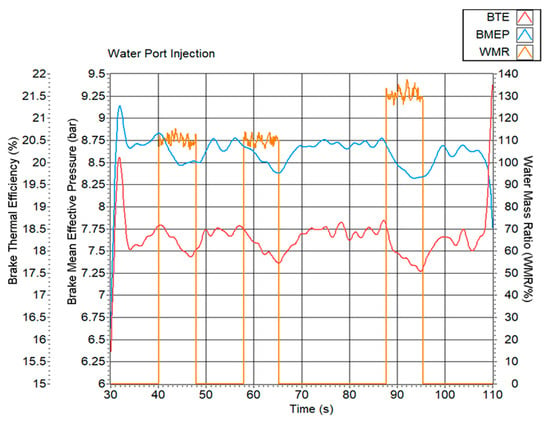
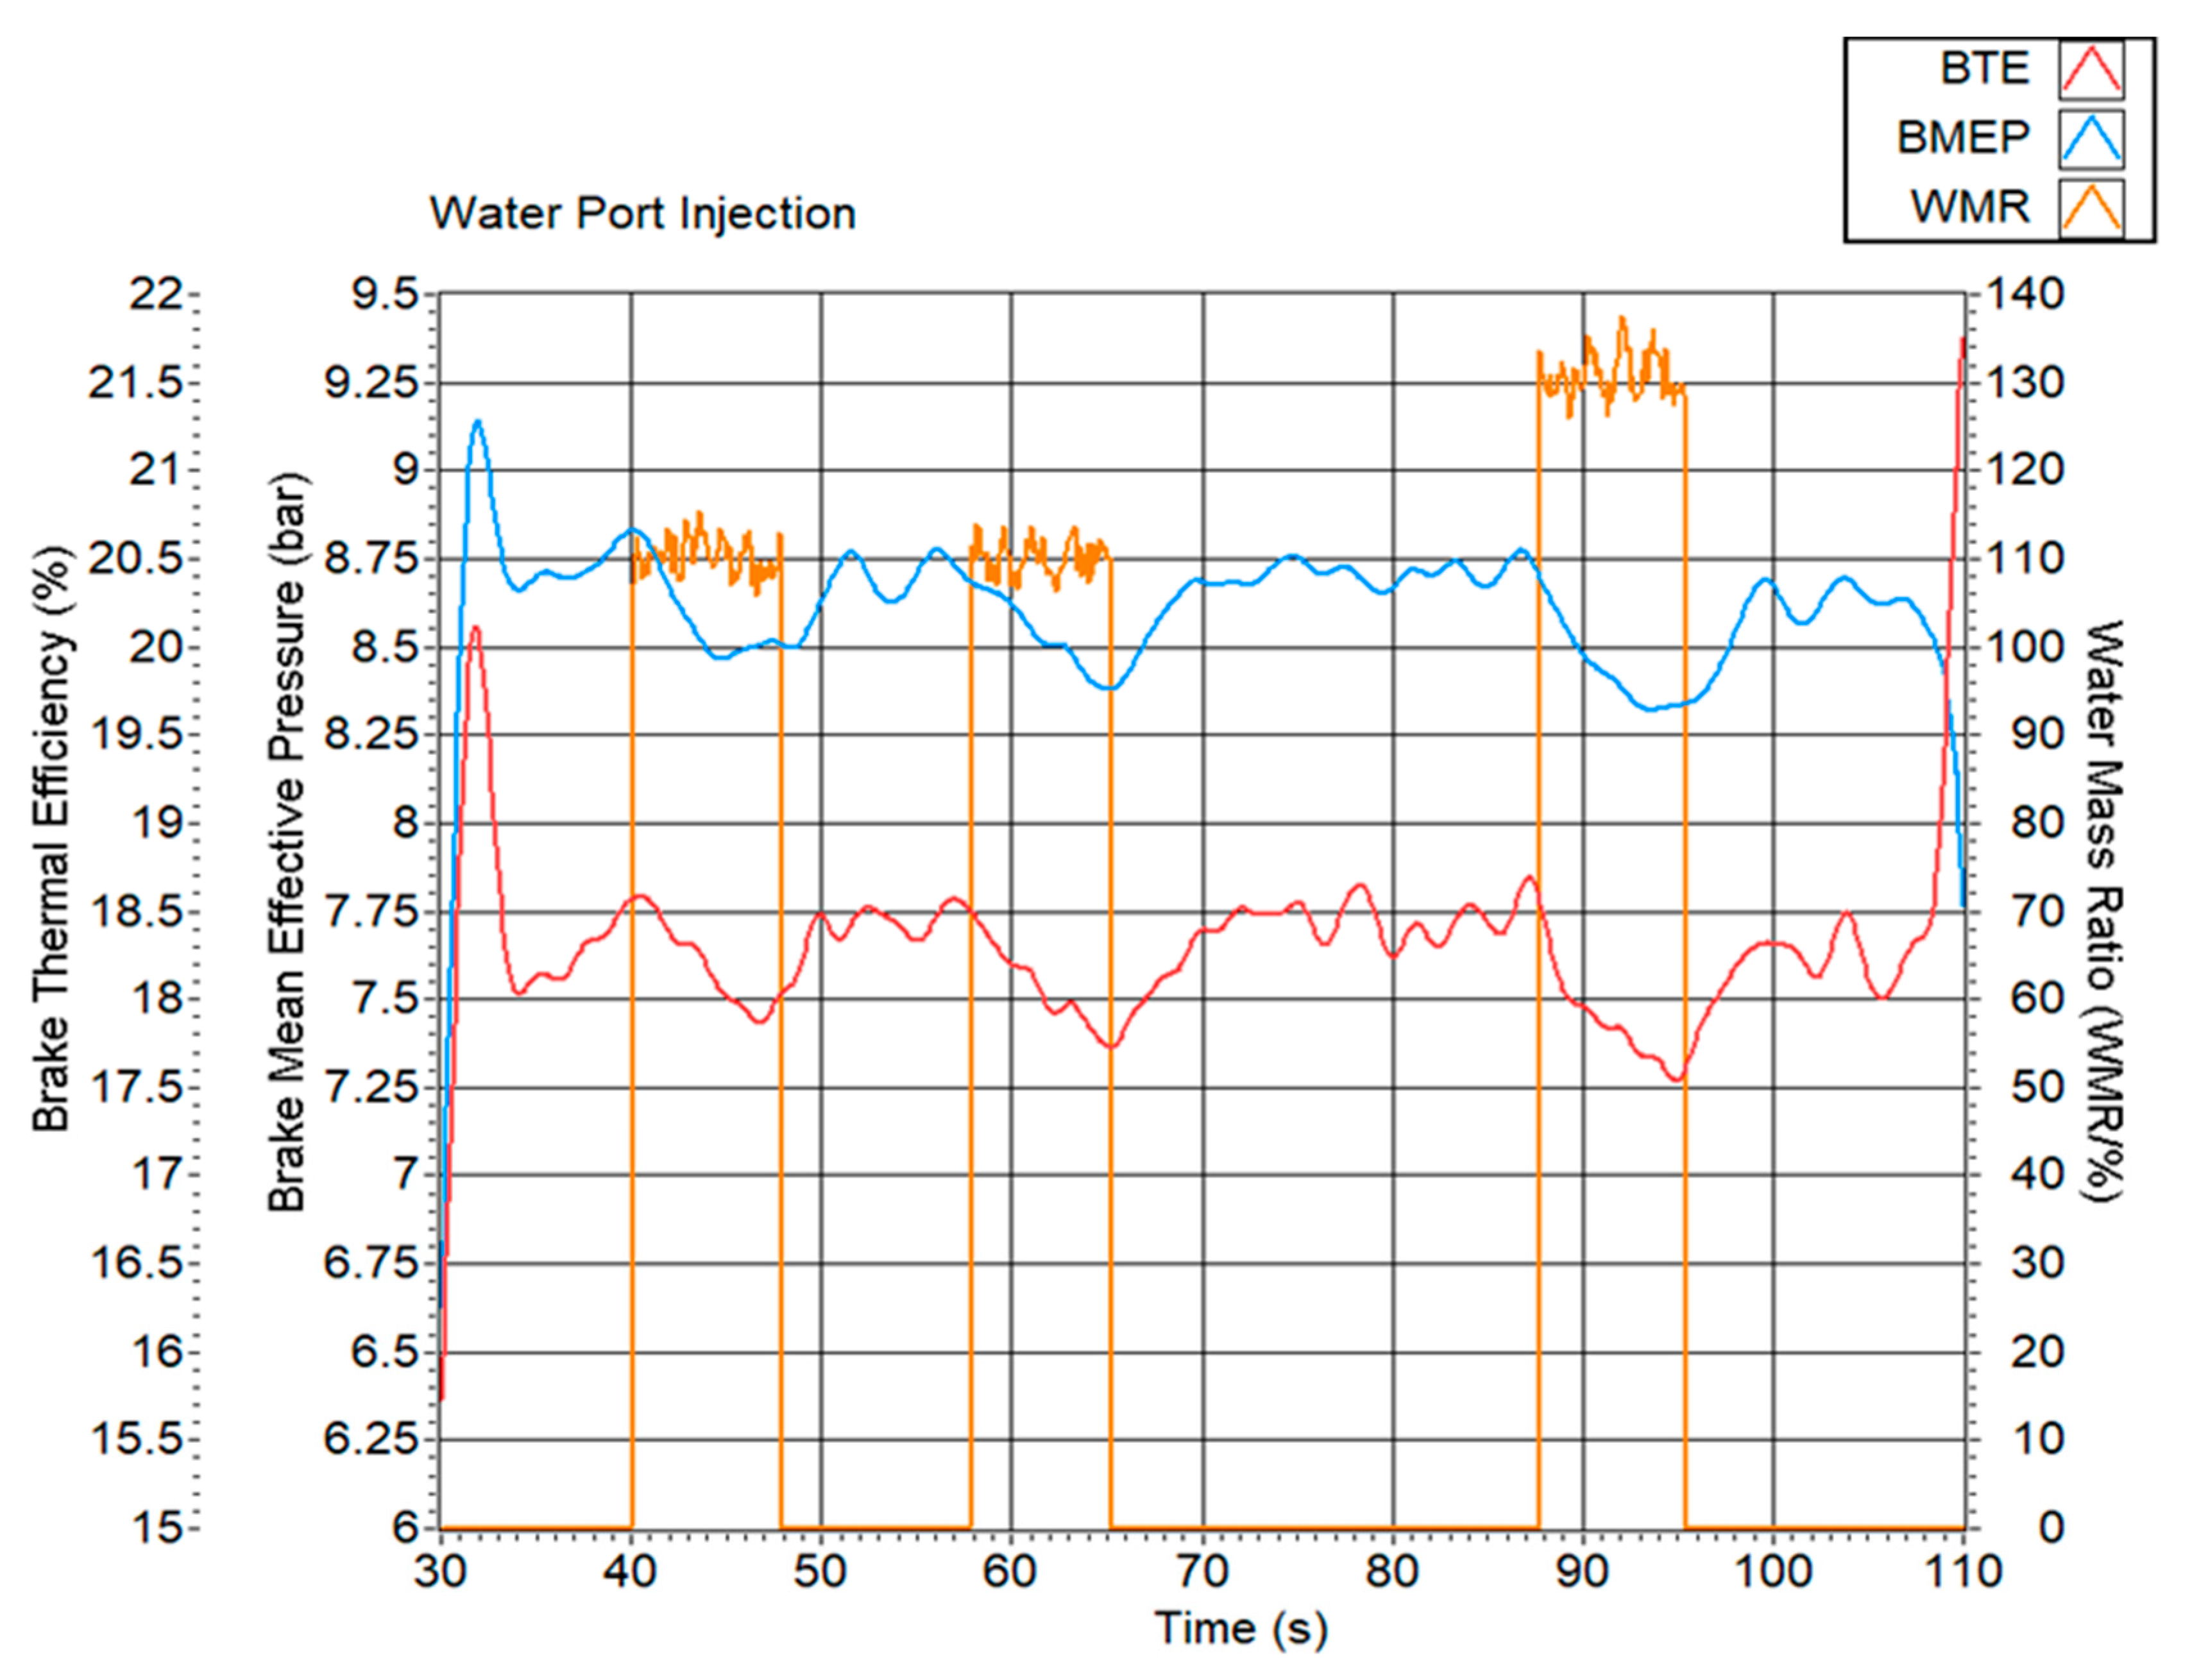
Slow-speed acquisition data were used to evaluate the effect of WPI and API on global engine performance. For WPI (Tests 2 and 3), both the BTE and BMEP decrease monotonically with the increasing WMR, as shown in Figure 14. At 130% WMR, the BTE drops from 18.5% to 17.5% and the BMEP from 8.8 bar to 8.3 bar, corresponding to reductions of 5.4% and 5.7%, respectively. The decrease in performance is consistent with the lower peak HRR and slower early burn.
Figure 14.
BTE, BMEP and WMR plotted against time for the duration of WPI testing.
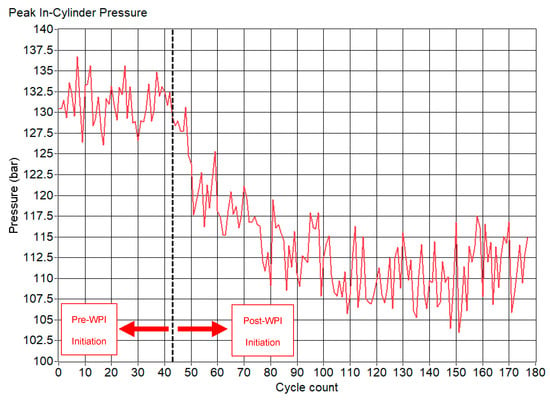
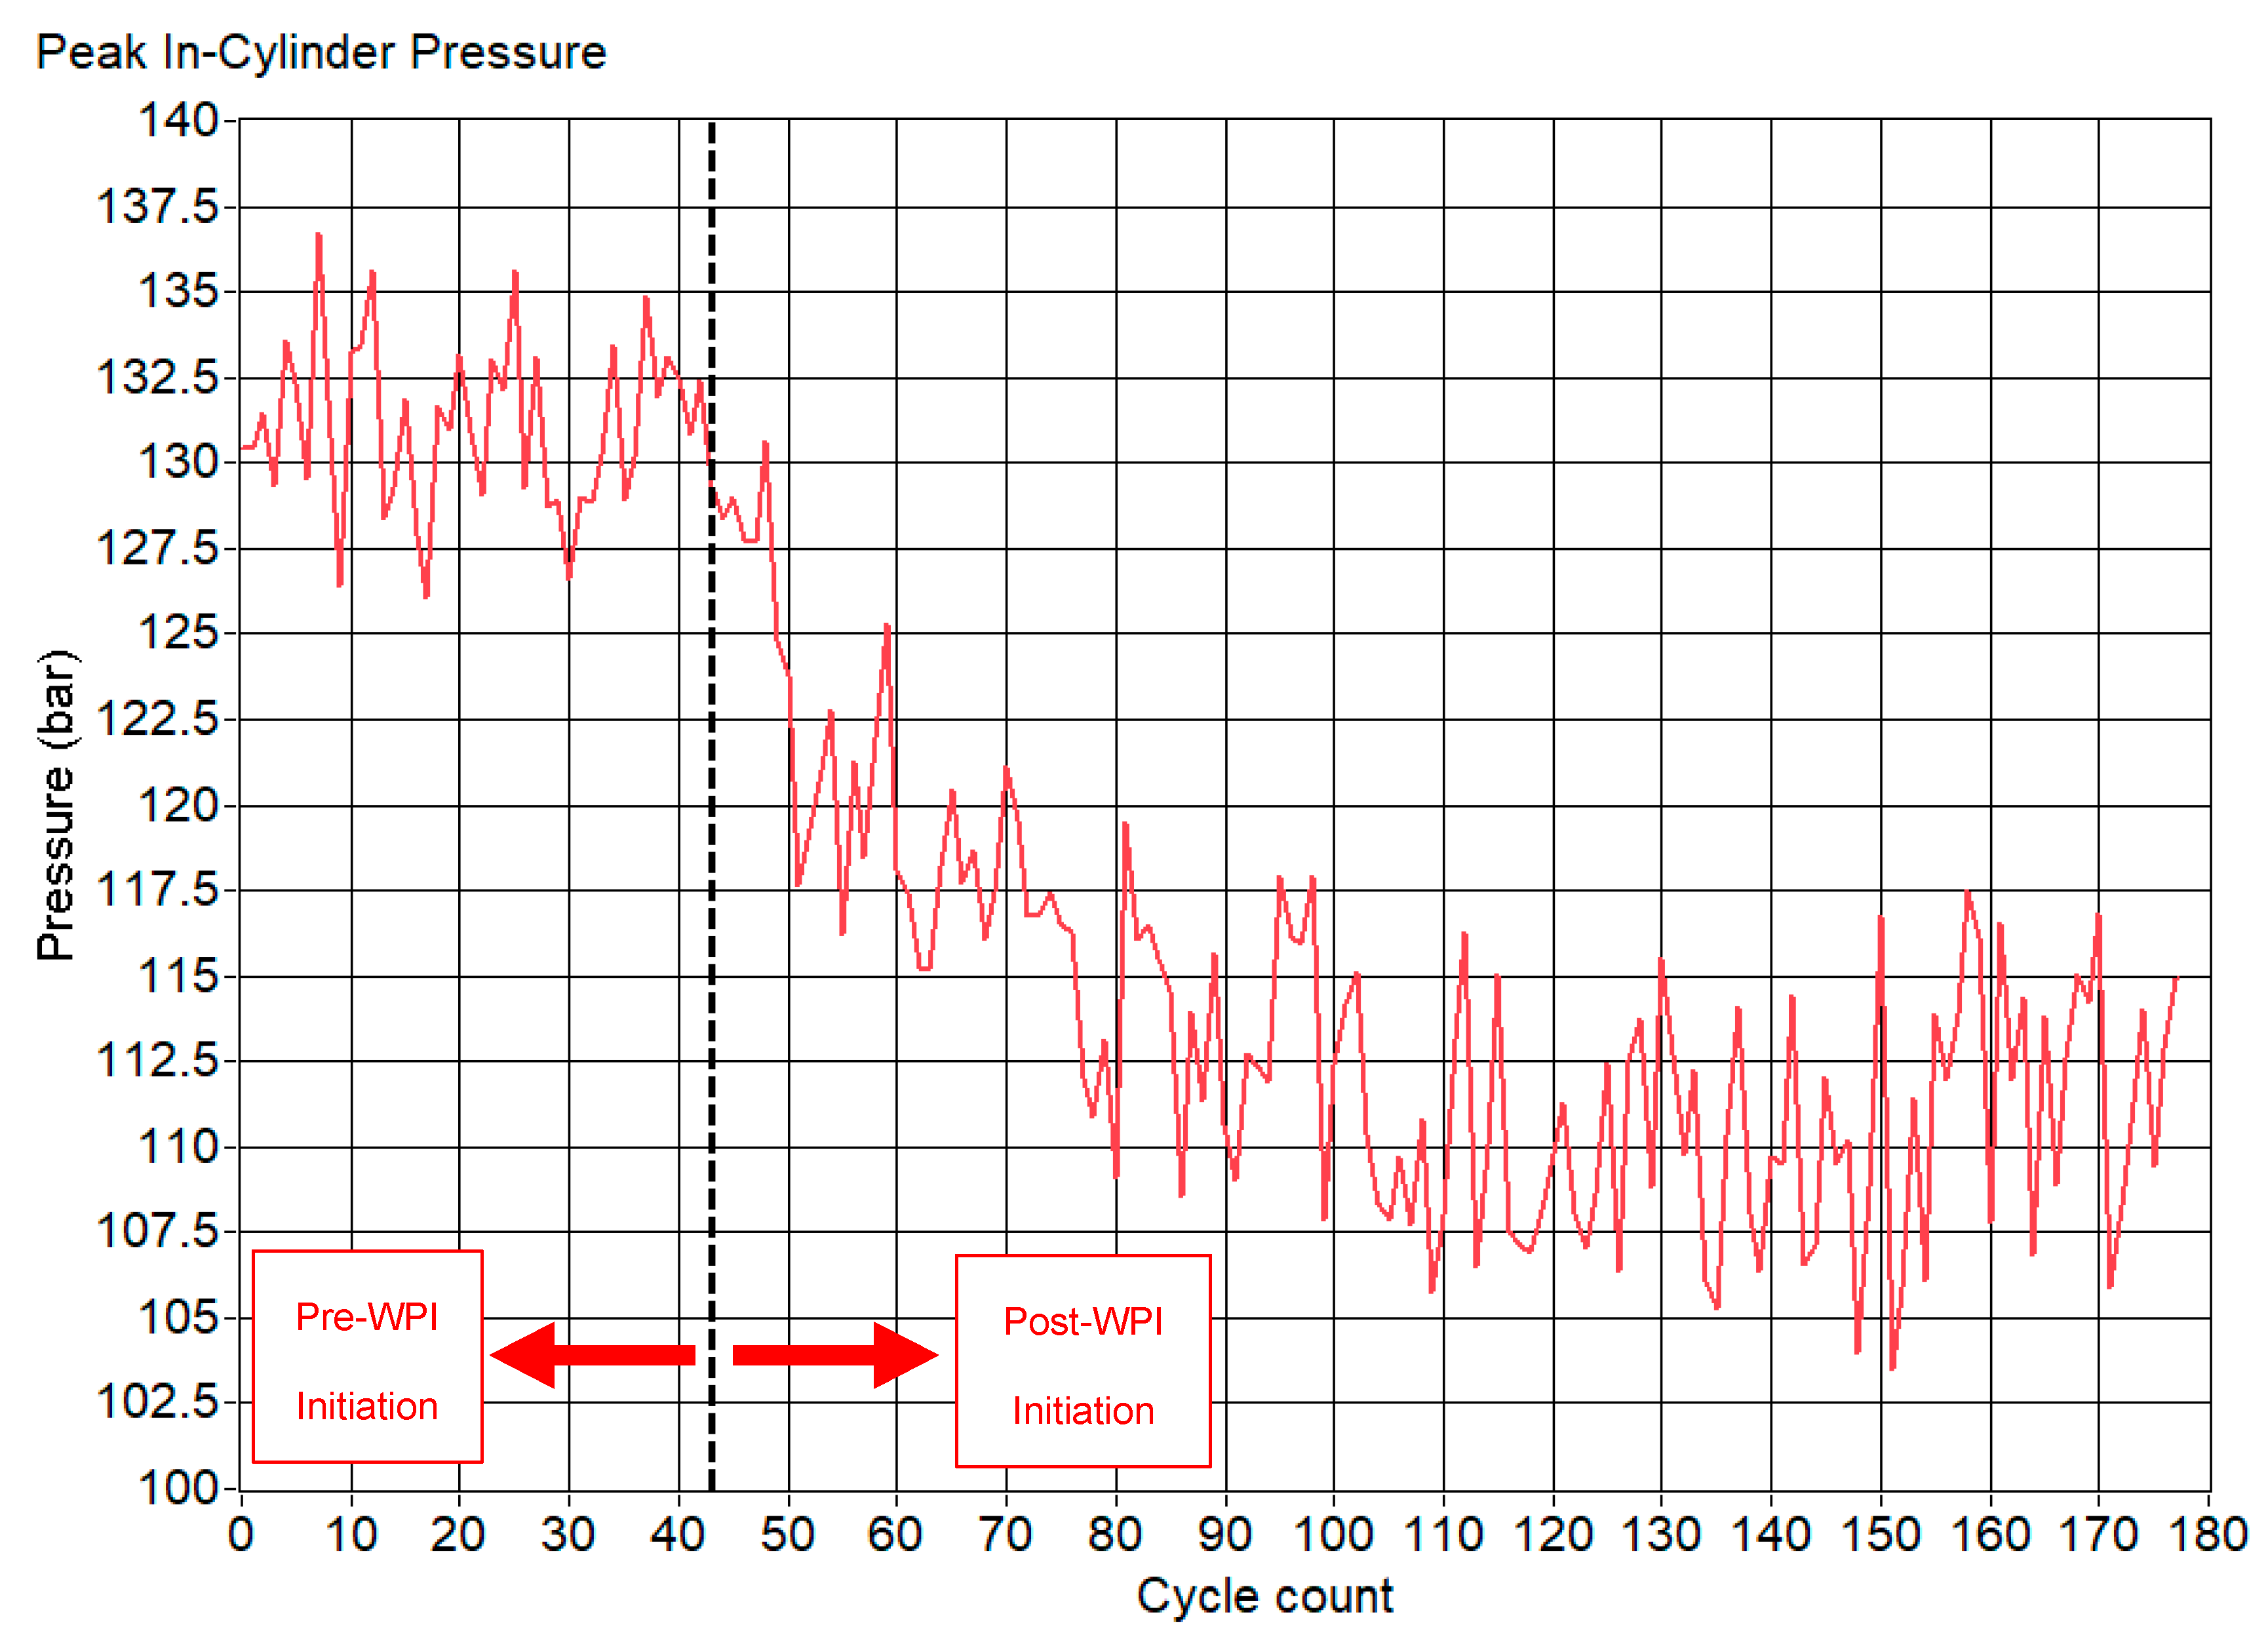
The reduced and delayed in-cylinder pressure near the top dead centre leads to lower indicated and brake work, despite unchanged air mass flow, as confirmed by the constant MAF of ≈65 g s−1 throughout the tests. The principal mechanism is therefore thermal quenching of the flame rather than oxygen displacement by the evaporating water [35,41,42]. The evolution of peak in-cylinder pressure during WPI supports this interpretation. After WPI activation at cycle 43, as shown in Figure 15, the mean peak pressure falls from approximately 131 bar to 110 bar (≈16% reduction) and remains at this lower level as the hysteresis behaviour in the HRR and KISE develops.
Figure 15.
Peak in-cylinder pressure for the duration of WPI testing showing the cycles prior to and during WPI.
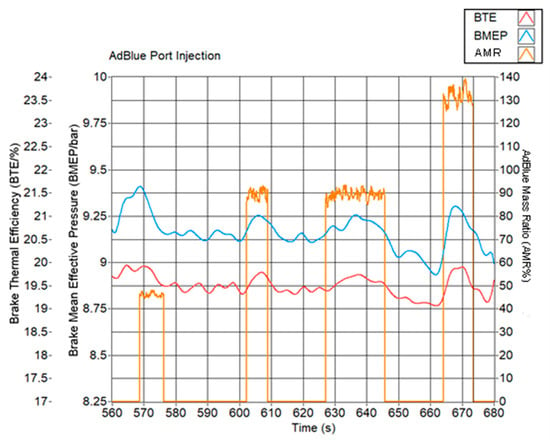
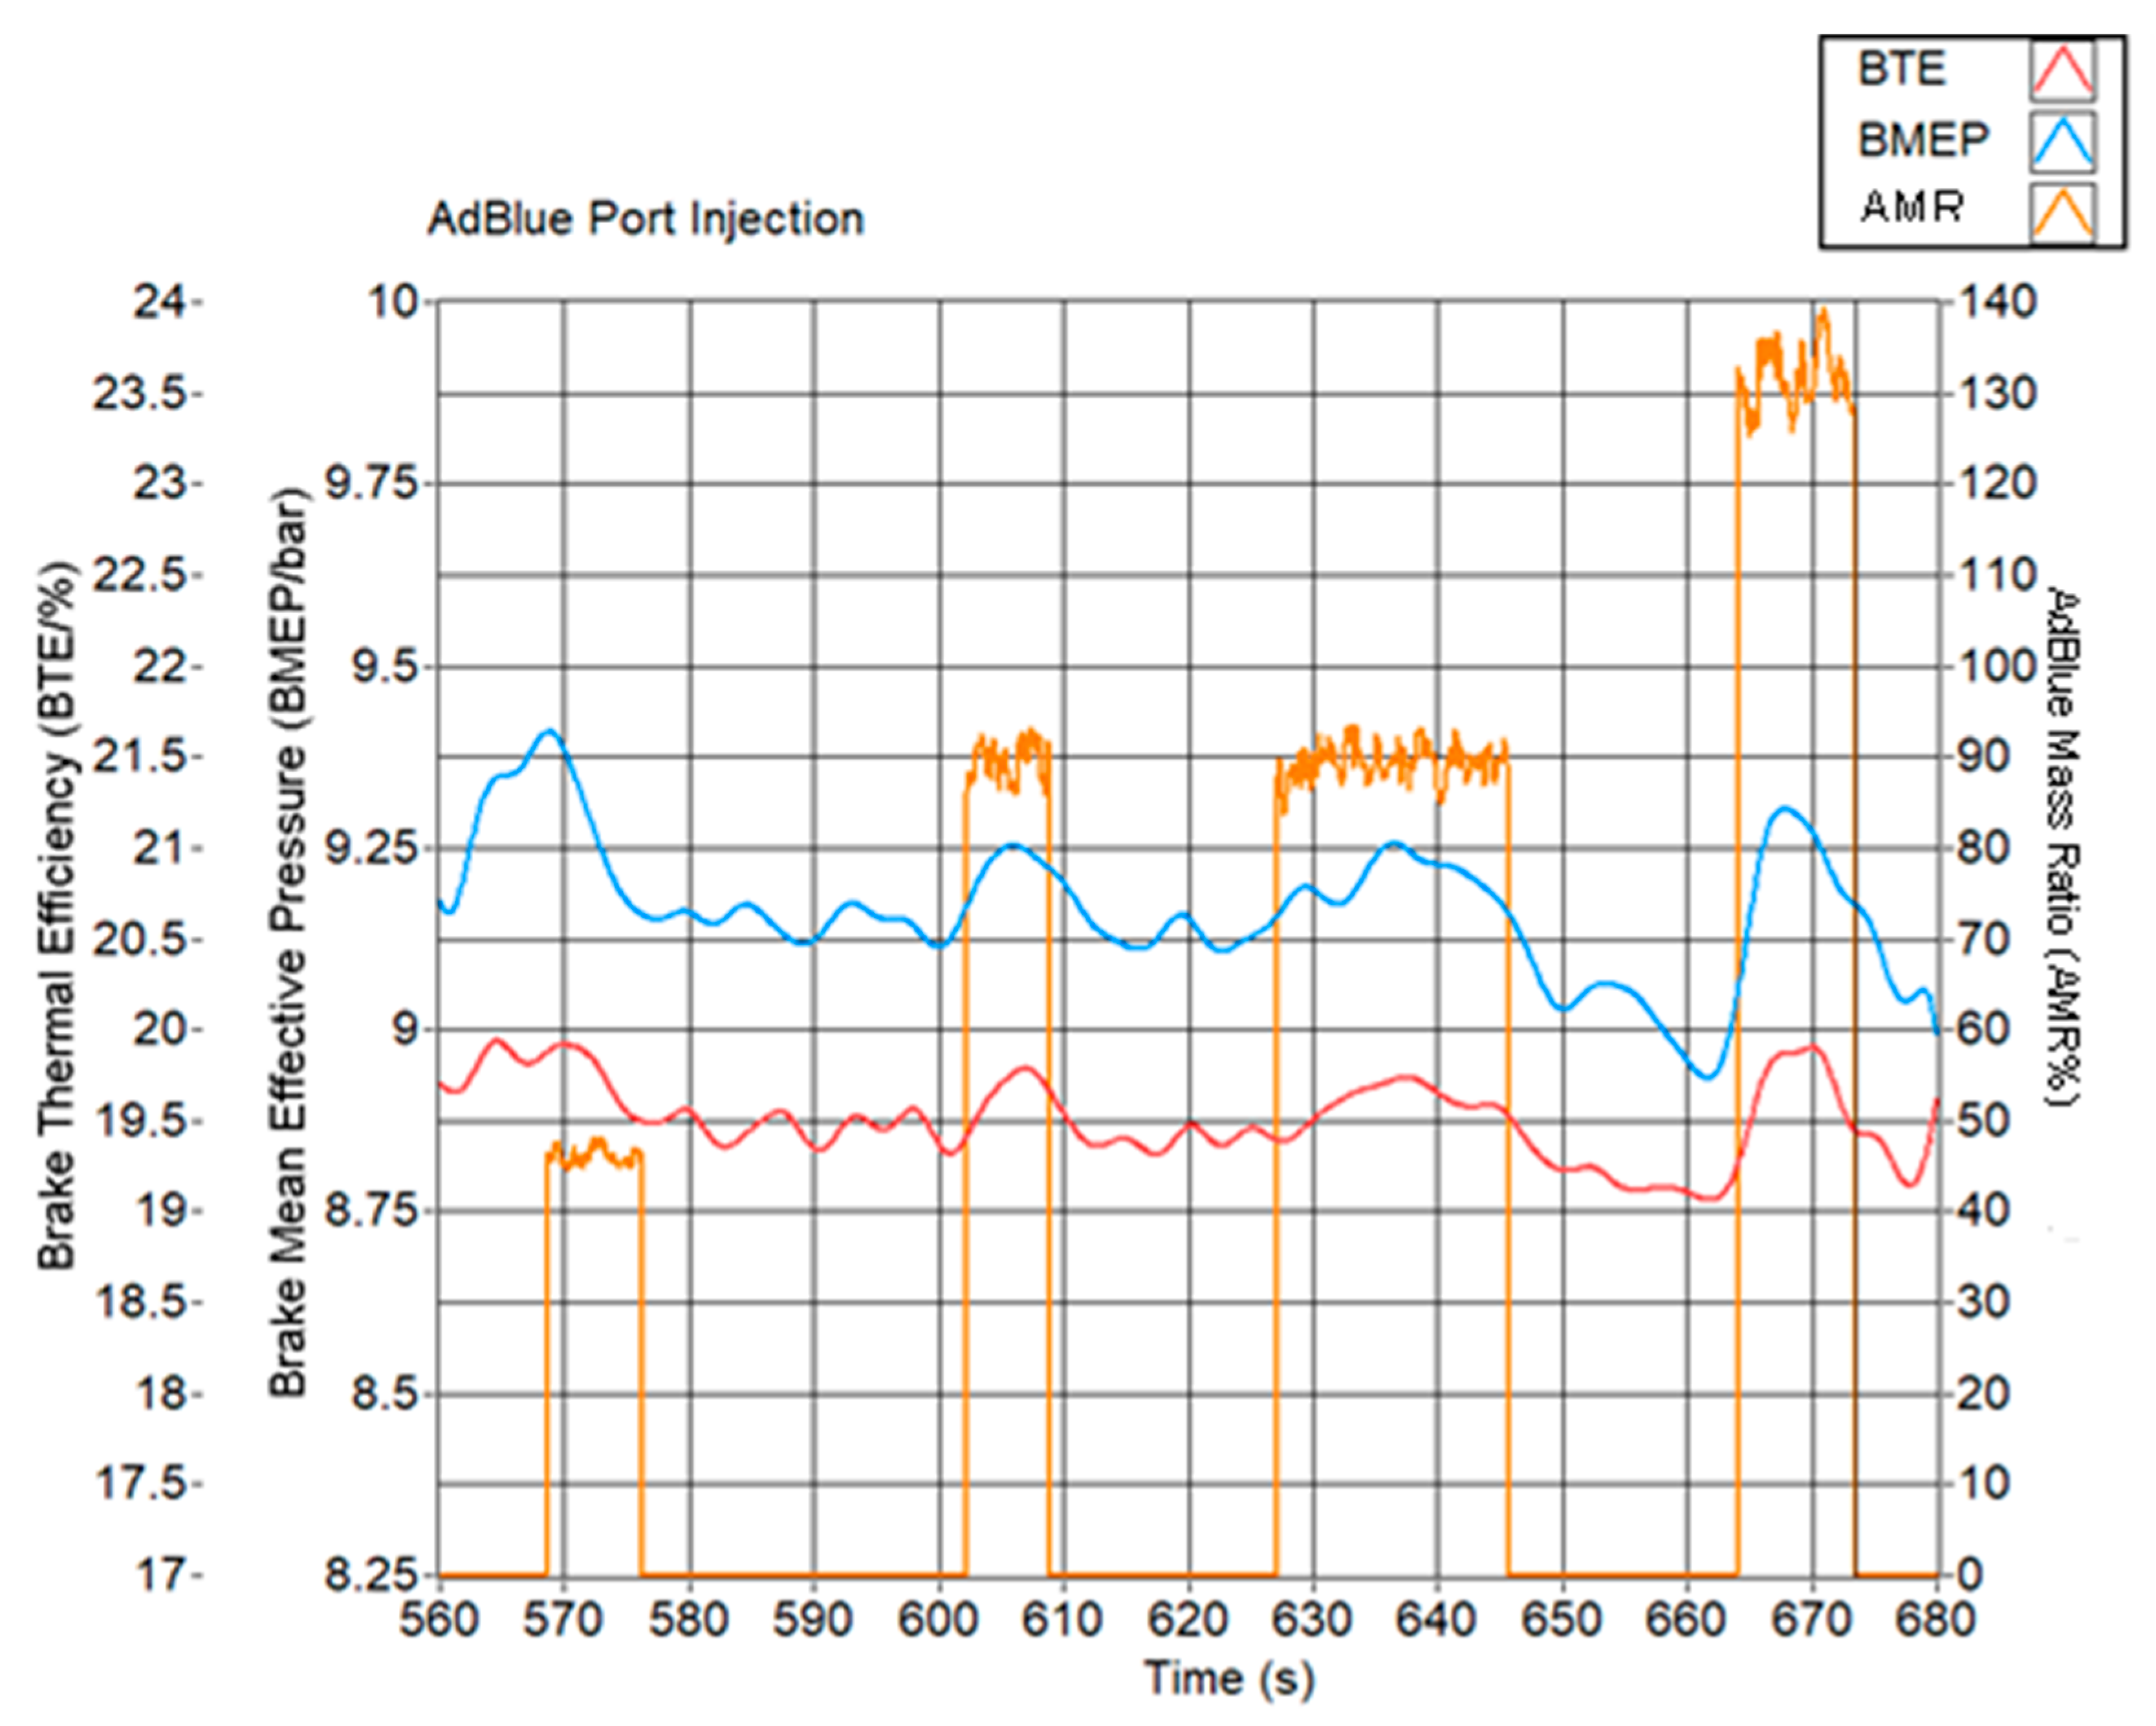
In contrast, API does not penalise the BTE or BMEP. Over Tests 4–6, both parameters remain broadly constant or exhibit a slight increase with AMR. At 130% AMR, the BMEP increases from 8.9 bar to about 9.2 bar, as shown in Figure 16; however, this change is comparable to the standard deviation of the measurements (9.16 ± 0.27 bar) and is therefore not considered statistically significant. The ability of API to suppress knock while maintaining engine performance is attributed to urea combustion, which helps to sustain the HRR and peak in-cylinder pressure for potentially increased effective work output.
Figure 16.
BTE and BMEP plotted against AMR for the duration of API testing.
5.5. Exhaust Gas Temperature and NOx Emissions
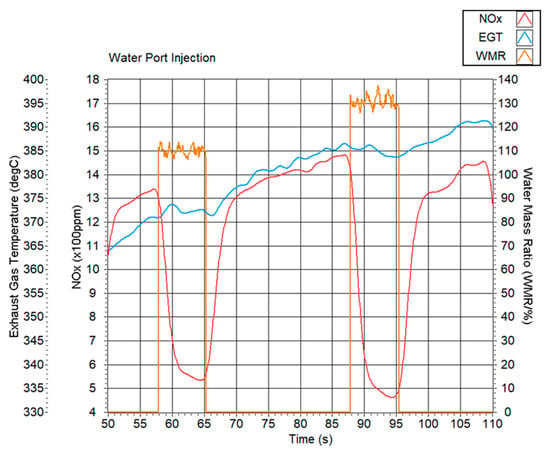
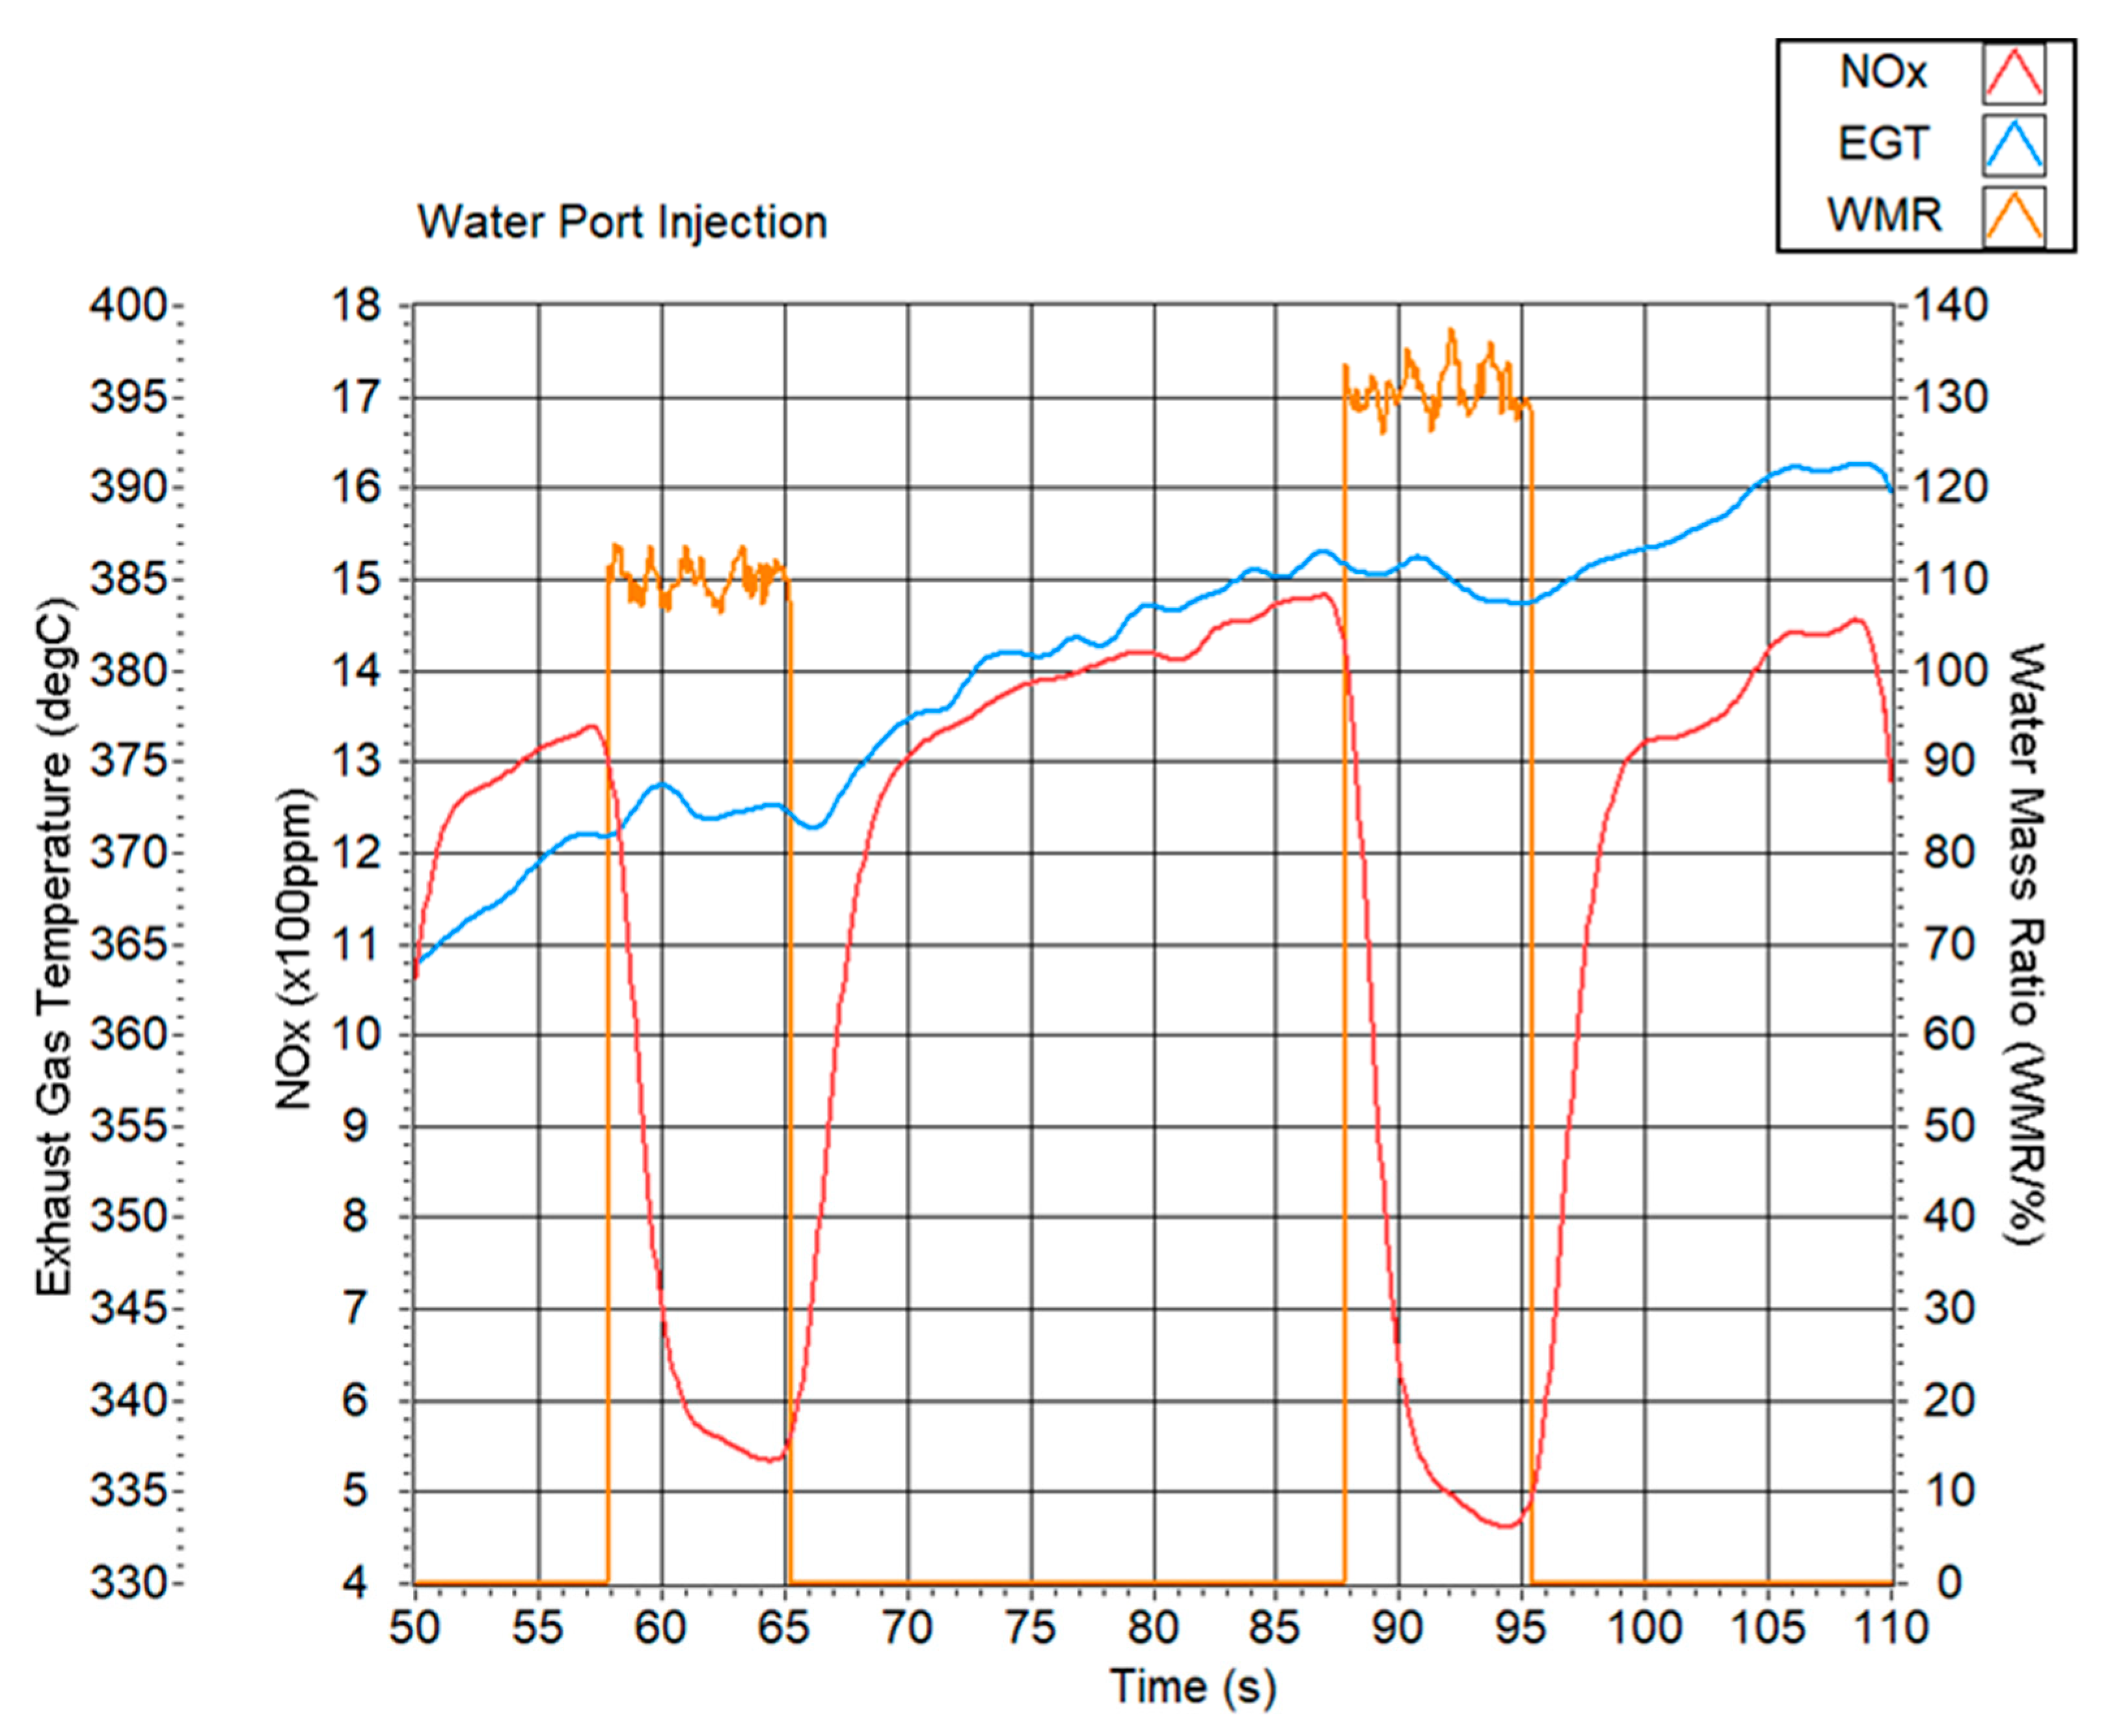
WPI and API also exert distinct influences on NOx formation and Exhaust Gas Temperatures (EGTs). Under WPI (Tests 2 and 3), NOx emissions decreased markedly as the WMR increased, falling from approximately 1500 ppm under baseline conditions to around 500 ppm at a 130% WMR, as shown in Figure 17. This reduction is consistent with the substantial lowering of peak combustion temperatures induced by water evaporation and slower heat release, which suppress the thermal NO mechanism. EGTs did not show a simple absolute decrease because of the ongoing heat soak of the initially cold exhaust system; instead, they rose gradually with time during early operation and then plateaued when WPI was active at higher WMRs, indicating that the cooler exhaust gas streams were sufficient to halt a further temperature rise in the exhaust hardware.
Figure 17.
NOx emissions and EGTs plotted alongside WMR for the duration of WPI testing.
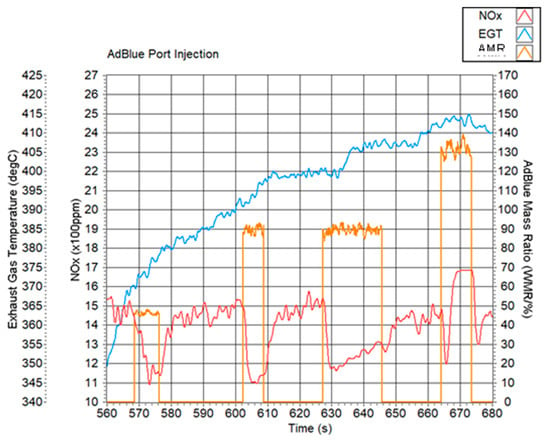
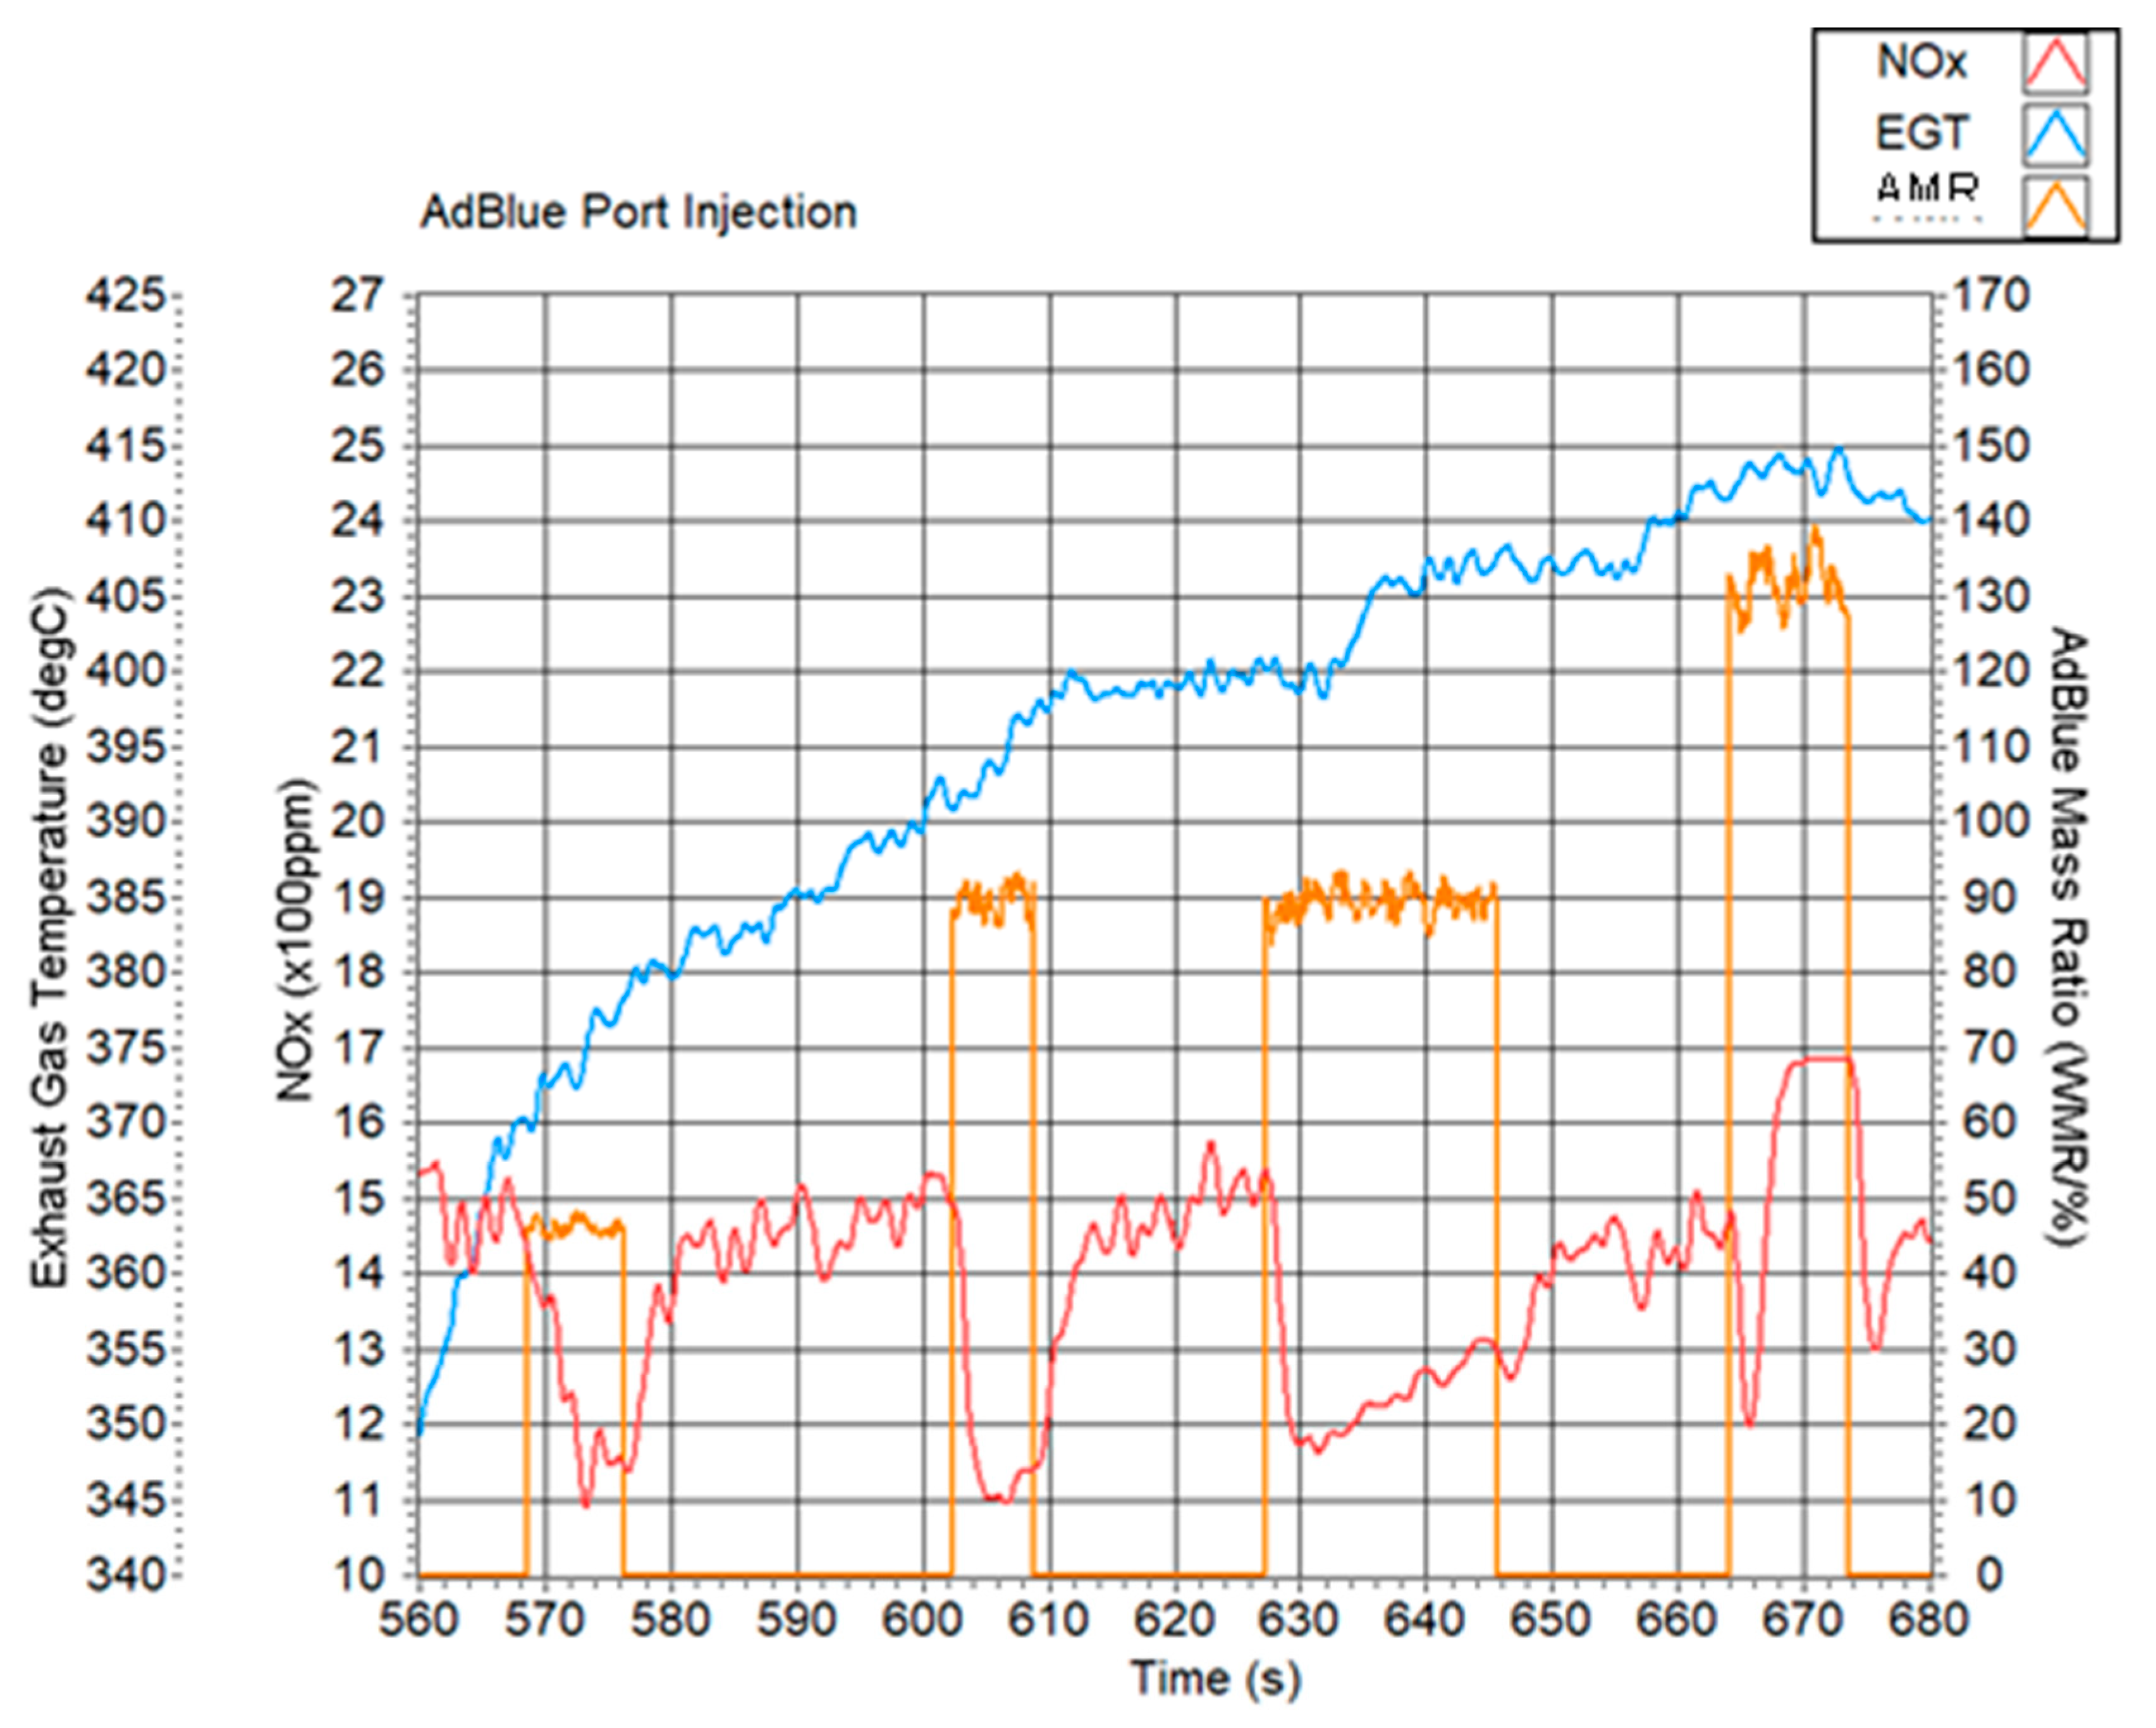
For API (Tests 4–6), Figure 18, the NOx trends were more complex. At moderate injection levels (e.g., 90% AMR), NOx decreased only slightly, from ~1500 ppm to ~1200 ppm, reflecting modest in-cylinder cooling. However, at 130% AMR, NOx initially fell but then rose sharply, reaching the upper limit of the sensor range (1680 ppm). This reversal results from the dual role of AdBlue: the water content promotes charge cooling, while the urea component both releases additional heat during decomposition/oxidation and introduces extra fuel-bound nitrogen. At a high AMR, the latter effects dominate, elevating the in-cylinder temperatures relative to WPI and providing additional nitrogen for NOx formation, so that the total NOx emission can exceed the baseline value despite strong knock suppression. The EGTs again show a trend of initial increase followed by stabilisation, but without the clear cooling signature seen under WPI, in line with the higher HRR and sustained in-cylinder temperatures during API.
Figure 18.
NOx emissions and EGTs plotted alongside AMR for the duration of API testing.
At AMR = 130%, the NOx signal reached the sensor upper limit (1680 ppm), indicating NOx ≥ 1680 ppm under these conditions. Because the true engine-out NOx level beyond this threshold could not be quantified, the present work does not establish whether a downstream SCR system would achieve the required conversion under such conditions. Consequently, API should be implemented with a targeted dosing strategy and must be accompanied by a dedicated aftertreatment evaluation (SCR performance testing or validated catalyst modelling) before practical deployment.
6. Conclusions
Overall, WPI and API both proved highly effective in reducing knock in the dual-fuel diesel–LPG engine, with reductions in the mean KISE of 88% and 82.6%, respectively, at their highest investigated mass ratios. WPI achieves this primarily through strong charge cooling and slowing of the early premixed burn, which significantly lowers the peak HRR, peak in-cylinder pressure and NOx emissions but also incurs a measurable penalty in the BTE and BMEP due to thermal quenching. API, by contrast, leverages the dual nature of AdBlue: water provides some cooling, while urea combustion supplies additional heat and sustains higher HRR and pressure levels. As a result, API can deliver comparable knock suppression to WPI with much smaller reductions in the peak HRR and no statistically significant degradation in global performance metrics. The trade-off is a more complex NOx behaviour, which transitions from a slight reduction at a modest AMR to increased emissions at a high AMR due to fuel-bound nitrogen and elevated combustion temperatures.
These results indicate that API at a high AMR can increase NOx significantly and therefore requires a dedicated aftertreatment assessment (either experimentally with an SCR system or via catalyst modelling/characterisation) before practical deployment. At a lower AMR, AdBlue port injection is a promising strategy for enabling high-load dual-fuel diesel–LPG operation: it mitigates knock, preserves brake efficiency and power density, and re-uses the same reductant already required for exhaust aftertreatment. However, the optimisation of the injection timing, rate and AMR will be necessary to balance knock suppression against NOx formation and to fully exploit the potential of this dual-use AdBlue concept in heavy-duty applications.
The presented experiments were short-duration proof-of-concept tests focused on combustion and knock response; therefore, they do not quantify long-term effects on engine reliability. Future work should discuss credible risks associated with intake-side AdBlue exposure, including deposit formation (e.g., crystallisation/solid residues), corrosion compatibility, potential interactions with intake valves and surfaces, and the need for long-duration endurance testing and post-test inspection to establish durability.
Other future research work can be the following:
Combining API with an optimised SCR injection strategy to simultaneously suppress knock and minimise NOx emissions.
Investigating alternative possible knock-suppressant injection strategies, such as methanol, to evaluate their effects on combustion efficiency and emissions.
Author Contributions
Conceptualization, T.S.; methodology, T.S. and M.F.; software, T.S.; validation, T.S.; formal analysis, T.S.; investigation, T.S.; resources, M.F.; data curation, T.S.; writing—original draft preparation, T.S.; writing—review and editing, M.F.; visualization, T.S.; supervision, M.F.; project administration, M.F.; funding acquisition, M.F. All authors have read and agreed to the published version of the manuscript.
Funding
The research work disclosed in this publication is partially funded by the “Dual Fuel Engine technology and dynamic Behaviour Improvement for Marine Application—BIMA” SINO-MALTA Fund 2021-16 Project part–financed by the MCST, now Xjenza Malta. Also funded by the project ‘AdBlue Port Injection for Engine Knock Suppression—APEKS’ financed by Xjenza Malta through the Research Networking Scheme (RNS) RNS-2024-041.
Data Availability Statement
The original contributions presented in this study are included in the article. Further inquiries can be directed to the corresponding author(s).
Conflicts of Interest
The authors declare no conflicts of interest.
Abbreviations
| θ | angle |
| stating crank angle | |
| interval of crank angle | |
| density of the charge at any given crank angle | |
| equilibrium pressure | |
| ratio of specific heats | |
| df | frequency resolution |
| knock signal energy | |
| mass of air trapped in one cylinder per cycle | |
| mass air flowrate | |
| N | number of cylinders |
| P | absolute pressure |
| FFT amplitude of pressure signal | |
| band-pass-filtered signal in the crank angle domain | |
| AMI | AdBlue mass ratio |
| API | AdBlue port injection |
| BDUR | burn duration |
| BMEP | Brake Mean Effective Pressure |
| BTE | Brake Thermal Efficiency |
| CA | crank angle |
| CHR | Chemical Heat Release |
| COV | coefficient of variation |
| DISE | diesel-induced signal energy |
| ECU | Engine Control Unit |
| EOC | end of combustion |
| FFT | Fast Fourier Transform |
| HRR | heat release rate |
| IMEP | Indicated Mean Effective Pressure |
| KISE | knock intensity signal energy |
| KSW | knock-sensitive window |
| LPG | Liquified Petroleum Gas |
| MAF | mass air flow |
| MAP | manifold absolute pressure |
| MFB | mass fraction burned |
| SEF | signal energy factor |
| SOC | start of combustion |
| TPS | throttle position sensor |
| VI | virtual instrument |
| WMR | water mass ratio |
| WPI | water port injection |
References
- Karim, G.A.; Klat, S.R.; Moore, N.P.W. Knock in dual-fuel engines. Proc. Inst. Mech. Eng. 1966, 181, 453–466. [Google Scholar] [CrossRef] [Scilit]
- Karim, G.A. Dual-Fuel Diesel Engines; CRC Press: London, UK, 2015. [Google Scholar]
- Wei, L.; Geng, P. A review on natural gas/diesel dual fuel combustion, emissions and performance. Fuel Process. Technol. 2016, 142, 264–278. [Google Scholar] [CrossRef] [Scilit]
- Lounici, M.S.; Loubar, K.; Tarabet, L.; Balistrou, M.; Niculescu, D.-C.; Tazerout, M. Towards improvement of natural gas-diesel dual fuel mode: An experimental investigation on performance and exhaust emissions. Energy 2014, 64, 200–211. [Google Scholar] [CrossRef] [Scilit]
- Cheenkachorn, K.; Poompipatpong, C.; Ho, C.G. Performance and emissions of a heavy-duty diesel engine fuelled with diesel and LNG (Liquid Natural Gas). Energy 2013, 53, 52–57. [Google Scholar] [CrossRef] [Scilit]
- Mustafi, N.N.; Raine, R.R.; Verhelst, S. Combustion and emissions characteristics of a dual fuel engine operated on alternative gaseous fuels. Fuel 2013, 109, 669–678. [Google Scholar] [CrossRef] [Scilit]
- Papagiannakis, R.; Hountalas, D. Combustion and exhaust emission characteristics of a dual fuel compression ignition engine operated with pilot diesel fuel and natural gas. Energy Convers. Manag. 2004, 45, 2971–2987. [Google Scholar] [CrossRef] [Scilit]
- Lata, D.; Misra, A. Analysis of ignition delay period of a dual fuel diesel engine with hydrogen and LPG as secondary fuels. Int. J. Hydrogen Energy 2011, 36, 3746–3756. [Google Scholar] [CrossRef] [Scilit]
- Zhen, X.; Wang, Y.; Xu, S.; Zhu, Y.; Tao, C.; Xu, T.; Song, M. The Engine Knock Analysis—An Overview. Appl. Energy 2012, 92, 628–636. [Google Scholar] [CrossRef] [Scilit]
- Kubesh, J.; Brehob, D.D. Analysis of Knock in a Dual-Fuel Engine; SAE Technical Paper 922367; SAE International: Warrendale, PA, USA, 1992; pp. 1–7. [Google Scholar] [CrossRef] [Scilit]
- Warnatz, J.; Maas, U.; Dibble, R.W. Combustion: Physical and Chemical Fundamentals, Modeling and Simulation, Experiments, Pollutant Formation; Springer: Berlin, Germany, 2006. [Google Scholar]
- Rajput, R.K. Internal Combustion Engines: (Including Air Compressors and Gas Turbines and Jet Propulsion); Laxmi Publications: Bangalore, India, 2007. [Google Scholar]
- Gupta, H.N. Fundamentals of Internal Combustion Engines; PHI Learning: New Delhi, India, 2011. [Google Scholar]
- Bridgman, L. Jane’s Fighting Aircraft of World War II; Crescent Books: New York, NY, USA, 1994. [Google Scholar]
- Rowe, M.R.; Ladd, G.T. Water Injection for Aircraft Engines; SAE Technical Paper Series; SAE International: Warrendale, PA, USA, 1946. [Google Scholar] [CrossRef] [Scilit]
- Yu, H.; Su, Y.; Shen, B.; Zhang, Y.; Wang, B.; Xie, F. Experimental study on knock suppression by direct water injection and direct ammonia-water injection based on low-flow injector under High Load. Appl. Therm. Eng. 2024, 255, 124055. [Google Scholar] [CrossRef] [Scilit]
- Lanzafame, R. Water Injection Effects in a Single-Cylinder CFR Engine; SAE Technical Paper 1999-01-0568; SAE International: Warrendale, PA, USA, 1999. [Google Scholar] [CrossRef] [Scilit]
- Ortega, N.; Fontalvo, V.M.; Guerrero, F.; Toledo, M.; Amador, G. Dynamic response of the performance and emissions of an LPG diesel dual-fuel engine with water injection. Appl. Therm. Eng. 2023, 228, 120543. [Google Scholar] [CrossRef] [Scilit]
- Demir, U.; Kozan, A.; Özer, S. Experimental investigation of the effect of urea addition to fuel on engine performance and emissions in Diesel Engines. Fuel 2022, 311, 122578. [Google Scholar] [CrossRef] [Scilit]
- Naber, J.; Blough, J.R.; Frankowski, D.; Goble, M.; Szpytman, J.E. Analysis of Combustion Knock Metrics in Spark-Ignition Engines; SAE Technical Paper 2006-01-0400; SAE International: Warrendale, PA, USA, 2006. [Google Scholar] [CrossRef] [Scilit]
- Hudson, C.; Gao, X.; Stone, R. Knock measurement for fuel evaluation in Spark Ignition Engines. Fuel 2001, 80, 395–407. [Google Scholar] [CrossRef] [Scilit]
- Ismail, M.M.; Fawzi, M.; Taweekun, J.; Leevijit, T. Engine knock detection for a multifuel engine using engine block vibration with statistical approach. MethodsX 2021, 8, 101583. [Google Scholar] [CrossRef] [Scilit] [PubMed]
- Kirsten, M.; Pirker, G.; Redtenbacher, C.; Wimmer, A.; Chmela, F. Advanced knock detection for diesel/natural gas engine operation. SAE Int. J. Engines 2016, 9, 1571–1583. [Google Scholar] [CrossRef] [Scilit]
- Hickling, R.; Feldmaier, D.A.; Sung, S.H. Knock-induced cavity resonances in open chamber diesel engines. J. Acoust. Soc. Am. 1979, 65, 1474–1479. [Google Scholar] [CrossRef] [Scilit]
- Draper, C.S. The Physical Effects of Detonation in a Closed Cylinder Chamber. 1934. Available online: https://ntrs.nasa.gov/citations/19930091567 (accessed on 3 December 2024).
- Hickling, R.; Feldmaier, D.A.; Chen, F.H.K.; Morel, J.S. Cavity resonances in engine combustion chambers and some applications. J. Acoust. Soc. Am. 1983, 73, 1170–1178. [Google Scholar] [CrossRef] [Scilit]
- Eng, J.A. Characterization of Pressure Waves in HCCI Combustion; SAE Technical Paper 2002-01-2859; SAE International: Warrendale, PA, USA, 2002. [Google Scholar] [CrossRef] [Scilit]
- Smith, S.W. The Scientist and Engineer’s Guide to Digital Signal Processing; California Technical Pub: San Diego, CA, USA, 1999. [Google Scholar]
- Harris, F.J. On the use of windows for harmonic analysis with the discrete Fourier transform. Proc. IEEE 1978, 66, 51–83. [Google Scholar] [CrossRef] [Scilit]
- Weisstein, E.W. “Bessel Function Zeros,” MathWorld—A Wolfram Web Resource. Available online: https://mathworld.wolfram.com/BesselFunctionZeros.html (accessed on 17 December 2024).
- Heywood, J.B. Internal Combustion Engine Fundamentals; McGraw-Hill Education: New York, NY, USA, 2019. [Google Scholar]
- Chun, K.M.; Heywood, J.B. Estimating heat-release and mass-of-mixture burned from spark-ignition engine pressure data. Combust. Sci. Technol. 1987, 54, 133–143. [Google Scholar] [CrossRef] [Scilit]
- Lancaster, D.R.; Krieger, R.B.; Lienesch, J.H. Measurement and Analysis of Engine Pressure Data; SAE Technical Paper 750026; SAE International: Warrendale, PA, USA, 1975. [Google Scholar] [CrossRef] [Scilit]
- Grandin, B.; Denbratt, I. The Effect of Knock on Heat Transfer in SI Engines; SAE Technical Paper 2002-01-0238 Series; SAE International: Warrendale, PA, USA, 2002. [Google Scholar] [CrossRef] [Scilit]
- Shehata, M. Cylinder pressure, performance parameters, heat release, specific heats ratio and duration of combustion for spark ignition engine. Energy 2010, 35, 4710–4725. [Google Scholar] [CrossRef] [Scilit]
- Farrugia, M.; Seychell, C.; Camilleri, S.; Farrugia, G.; Farrugia, M. Development of a Programmable Engine Control Unit to Multi-Fuel Capabilities, Progression to Diesel. In Proceedings of the 16th International Conference on Sciences and Techniques of Automatic Control and Computer Engineering (STA), Monastir, Tunisia, 21–23 December 2015; IEEE Conference Publications: New York, NY, USA, 2015; pp. 174–180. [Google Scholar] [CrossRef] [Scilit]
- Caruana, C.; Azzopardi, J.P.; Farrugia, M.; Farrugia, M. Common Rail Diesel Engine, Fuel Pressure Control Scheme and Use of Speed-Density Control. In Proceedings of the 25th Mediterranean Conference on Control and Automation (MED), Valletta, Malta, 3–6 July 2017; IEEE Conference Publications: New York, NY, USA, 2017; pp. 210–216. [Google Scholar] [CrossRef] [Scilit]
- Mifsud, S.; Azzopardi, J.P.; Farrugia, M. Liquefied Petroleum Gas (LPG) and Diesel, Dual Fuel Implementation on a Common Rail Diesel Engine. In Proceedings of the 2020 19th International Conference on Mechatronics-Mechatronika (ME), Prague, Czech Republic, 2–4 December 2020; IEEE: New York, NY, USA, 2020; pp. 192–199. [Google Scholar] [CrossRef] [Scilit]
- Saliba, A.T.; Schembri, M.; Scerri, K.; Farrugia, M. Implementation of Electronic Throttle for Control of a Dual Fuel Diesel Engine. In Proceedings of the 7th International Conference on Control, Automation and Diagnosis ICCAD2023, Rome, Italy, 10–12 May 2023. [Google Scholar] [CrossRef] [Scilit]
- Farrugia, M.; Rossey, M.; Sangeorzan, B.P. On the Use of a Honda 600cc 4-Cylinder Engine for Formula SAE Competition; SAE Paper 2005-01-0025, SAE World Congress 11–14 April 2005; SAE International: Warrendale, PA, USA, 2005. [Google Scholar] [CrossRef] [Scilit]
- Scicluna, T.; Farrugia, M. Experimental investigation of an AdBlue injection system and implementation on a dual-fuel (Diesel/LPG) engine. In Proceedings of the 2024 21st International Conference on Mechatronics-Mechatronika (ME), Brno, Czech Republic, 4–6 December 2024. [Google Scholar] [CrossRef] [Scilit]
- Scicluna, T. Investigating AdBlue as both an Emissions Reductant and Combustion Stabiliser in Dual-Fuel C.I. Engine. Master’s Thesis, Mechanical Engineering, University of Malta, Msida, Malta, 2025. [Google Scholar]

Disclaimer/Publisher’s Note: The statements, opinions and data contained in all publications are solely those of the individual author(s) and contributor(s) and not of MDPI and/or the editor(s). MDPI and/or the editor(s) disclaim responsibility for any injury to people or property resulting from any ideas, methods, instructions or products referred to in the content. |
© 2026 by the authors. Licensee MDPI, Basel, Switzerland. This article is an open access article distributed under the terms and conditions of the Creative Commons Attribution (CC BY) license.