


Abstract
Hybrid renewable energy systems (HRESs) are increasingly used because they integrate diverse energy resources whose availability can complement one another over the day–night cycle. However, the high cost of system components, particularly batteries, and the dependence of energy generation on weather conditions can undermine their economic viability. Researchers, therefore, seek to optimize HRES configurations to achieve a balance between reliability and lifecycle cost by performing techno-economic studies using different techniques. One of the industries that started relying more on renewable energy is the mobile telecommunication industry, especially in the remote stations where the expansion of the grid is expensive and the renewable resources are abundant. This study introduces the scope of hybrid renewable energy system optimization and applies a study case to a remote telecommunication station where the existing energy system was installed without prior techno-economic assessment. Using mathematical models, single and multi-objective (lexicographic) optimizations are conducted using the particle swarm optimization algorithm and a deterministic exhaustive search numerical algorithm, to minimize the lifecycle cost of the system, maintain reliability for a full continuity of service, and reduce the dependency to the diesel generator to contribute to the decarbonization objective of the world. The computational results show a significant reduction in the cost of the system from USD 525,512.83 for the existing system to approximately USD 197,879.03 (reduction of 62.3% of the actual cost), and the operating hours of the diesel generator from 1401 h/year to 770 h/year. More details are presented in the Discussion section.
1. Introduction
Mobile telecommunication sites or base transceiver stations (BTSs) [1] are fundamental components of mobile telecommunication networks and serve as the main interfaces between users and the network. These stations contain equipment that enables users to access the network through different generations of mobile technology (2G, 3G, 4G, and 5G).
As mobile technology advances, subscriber demand increases. Consequently, maintaining continuous service at telecommunication sites has become a critical requirement. To ensure a reliable power supply, telecommunication equipment typically operates on a 48 V DC system, which allows batteries to store energy and supply the equipment during energy shortages. However, grid instability and prolonged power outages at some sites can limit the effectiveness of batteries as a standalone backup solution, and diesel generators (DGs) incur fuel and maintenance costs. For this, HRESs are employed to ensure the reliability of the energy system, extend battery service life by reducing charging and discharging cycles, reduce the DG operation and maintenance costs, and mitigate greenhouse gas emissions.
In the literature on HRESs [2], researchers aim to ensure reliable power supply while minimizing cost.
Hamza Siyoucef et al. [3] investigated the reduction in energy costs and improvement in energy-system performance at three grid-connected mobile telecommunication sites in remote areas of Algeria and Morocco. The techno-economic optimization is performed using HOMER software [4], while energy production is simulated using MATLAB/Simulink. Based on the TNPC, LCOE, and the DG emissions, HOMER obtained the PV-wind turbine system as the optimal solution.
In [5], the authors designed a PV, wind turbine (WT), battery microgrid to power the remote telecommunication towers instead of the existing DGs. Multi-objective function incorporating the loss of power supply probability (LPSP), excess of energy (EE), and the COE is optimized based on a non-dominated sorting genetic algorithm II (NSGA II) [6,7,8]. Three scenarios of LPSP were analyzed, and the results are presented in Table 1.
Table 1.
HRES design solution based on LPSP criteria.
To supply a city in DJelfa, Algeria, the team of Zakaria Belboul [9] used a multi-objective salp swarm algorithm (MOSSA) [10] to determine the PV rated power, number of wind turbines, and battery autonomy with the objective of minimizing the COE and LPSP. This algorithm is coupled with an energy management system (EMS) to control the flow of the energy between the system components; then, it is compared with the multi-objective dragonfly algorithm (MODA) [11], multi-objective ant lion optimizer (MOALO) [12], and multi-objective grasshopper optimization algorithm (MOGOA) [13]. The authors reported that MOSSA is the most effective algorithm with a COE of 0.255 USD/kWh and an LPSP of 27.079%.
Electric trains are an efficient solution to reduce the greenhouse gas emissions in the transportation field. However, these trains receive energy from fossil fuel-based power plants. So, electric trains contribute indirectly in polluting the environment. Farshid Foroutan et al. [14] investigated the deployment of HRESs in a traction power supply substation to substitute fossil fuel with a green hybrid traction power supply substation (GHTPS). Their objective is to find the best size of the system with the minimum NPC. The system consists of PV modules (210 W), wind turbines (1.65 MW) and the grid as a backup source, which saves 40–50% of the LCC compared to batteries [15]. To achieve this objective, optimizations are held using HOMER software and the following population-based algorithms: atom search optimization [16], bird swarm algorithm [17], Coyote Optimization Algorithm [18], Grey Wolf Optimizer [19], Harris Hawks Optimization [20], Artificial bee colony [21], Multi-population Ensemble Differential Evolution [22], genetic algorithm, particle swarm optimization [23], and ant lion optimizer. The optimization is run using the data of 8760 h with a time step of 1h and a population size of 250 for all algorithms for a fair comparison between them. The results are shown in Table 2
Table 2.
NPC of the optimal solutions.
BSA, COA, MPEDE, PSO, and ALO obtained the same minimum cost function (USD 82,863,135.5319), but BSA had the smallest standard deviation (1.40 × 10⁻⁸), which makes it the most robust method. The obtained size of BSA consists of 0 PV array and 40 wind turbines.
For further results, BSA is compared with HOMER simulation, which obtained zero PV array and two wind turbines as the best size with an NPC of USD 133,710,880. The authors attributed the difference to the optimization formulations, explaining that their BSA approach included a net-power constraint based on the difference between load demand and renewable generation, whereas HOMER did not account for this constraint in the same way. They also reported that the site’s relatively weak solar resource favored wind generation in the BSA solution.
1.1. Related Work
This research paper investigates the standalone HRES of the 4G remote mobile telecommunication station in Bougaroun, Skikda, Algeria, which consists of 33 PV modules (250 W) [24], 96 lead-acid batteries (2 V, 650 Ah) [25], and a 17.5 kVA DG [26]. The objectives of this study are as follows:
- -
- Conduct a techno-economic study using real BTS energy consumption including wind turbines in a telecommunication power system in Algeria to increase the contribution of renewable energy penetration.
- -
- Resize the actual configuration of the system using an exhaustive search numerical algorithm to find the best size.
- -
- Apply an energy management system (EMS) [27] to control the operation of the system components.
- -
- Apply the charge limit of the battery in the EMS to approach real-world battery operation and increase the results’ precision. This constraint was not considered in the studies reviewed.
- -
- Reduce DG operating hours and fuel consumption, with the potential to reduce CO2 emissions.
Single and multi-objective optimizations are carried out, and the results are compared to each other and to the existing system to determine the best configuration related to the best cost function.
In the single-objective optimization, the exhaustive search numerical algorithm aims to minimize the LCC of the PV–battery–WT–DG system subject to zero (0) LPSP.
In the multi-objective optimization, a lexicographic approach [28] is used to optimize the LPSP first and then the LCC of the PV–battery–WT–DG system.
1.2. Description of the System
The site of Bougaroun is a terminal 4G mobile station (owned by Algérie Telecom Mobilis company [29]), located in the remote cap of Bougaroun. The loads of the station and their ratings are as follows:
- -
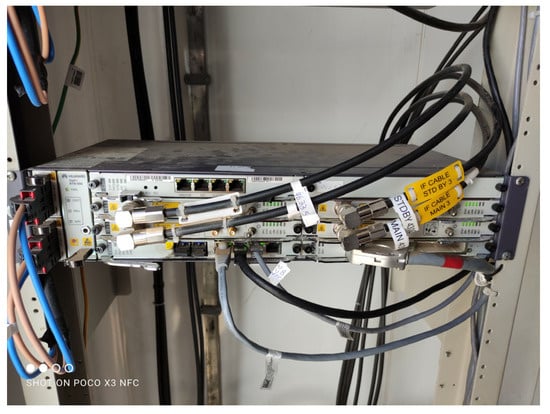
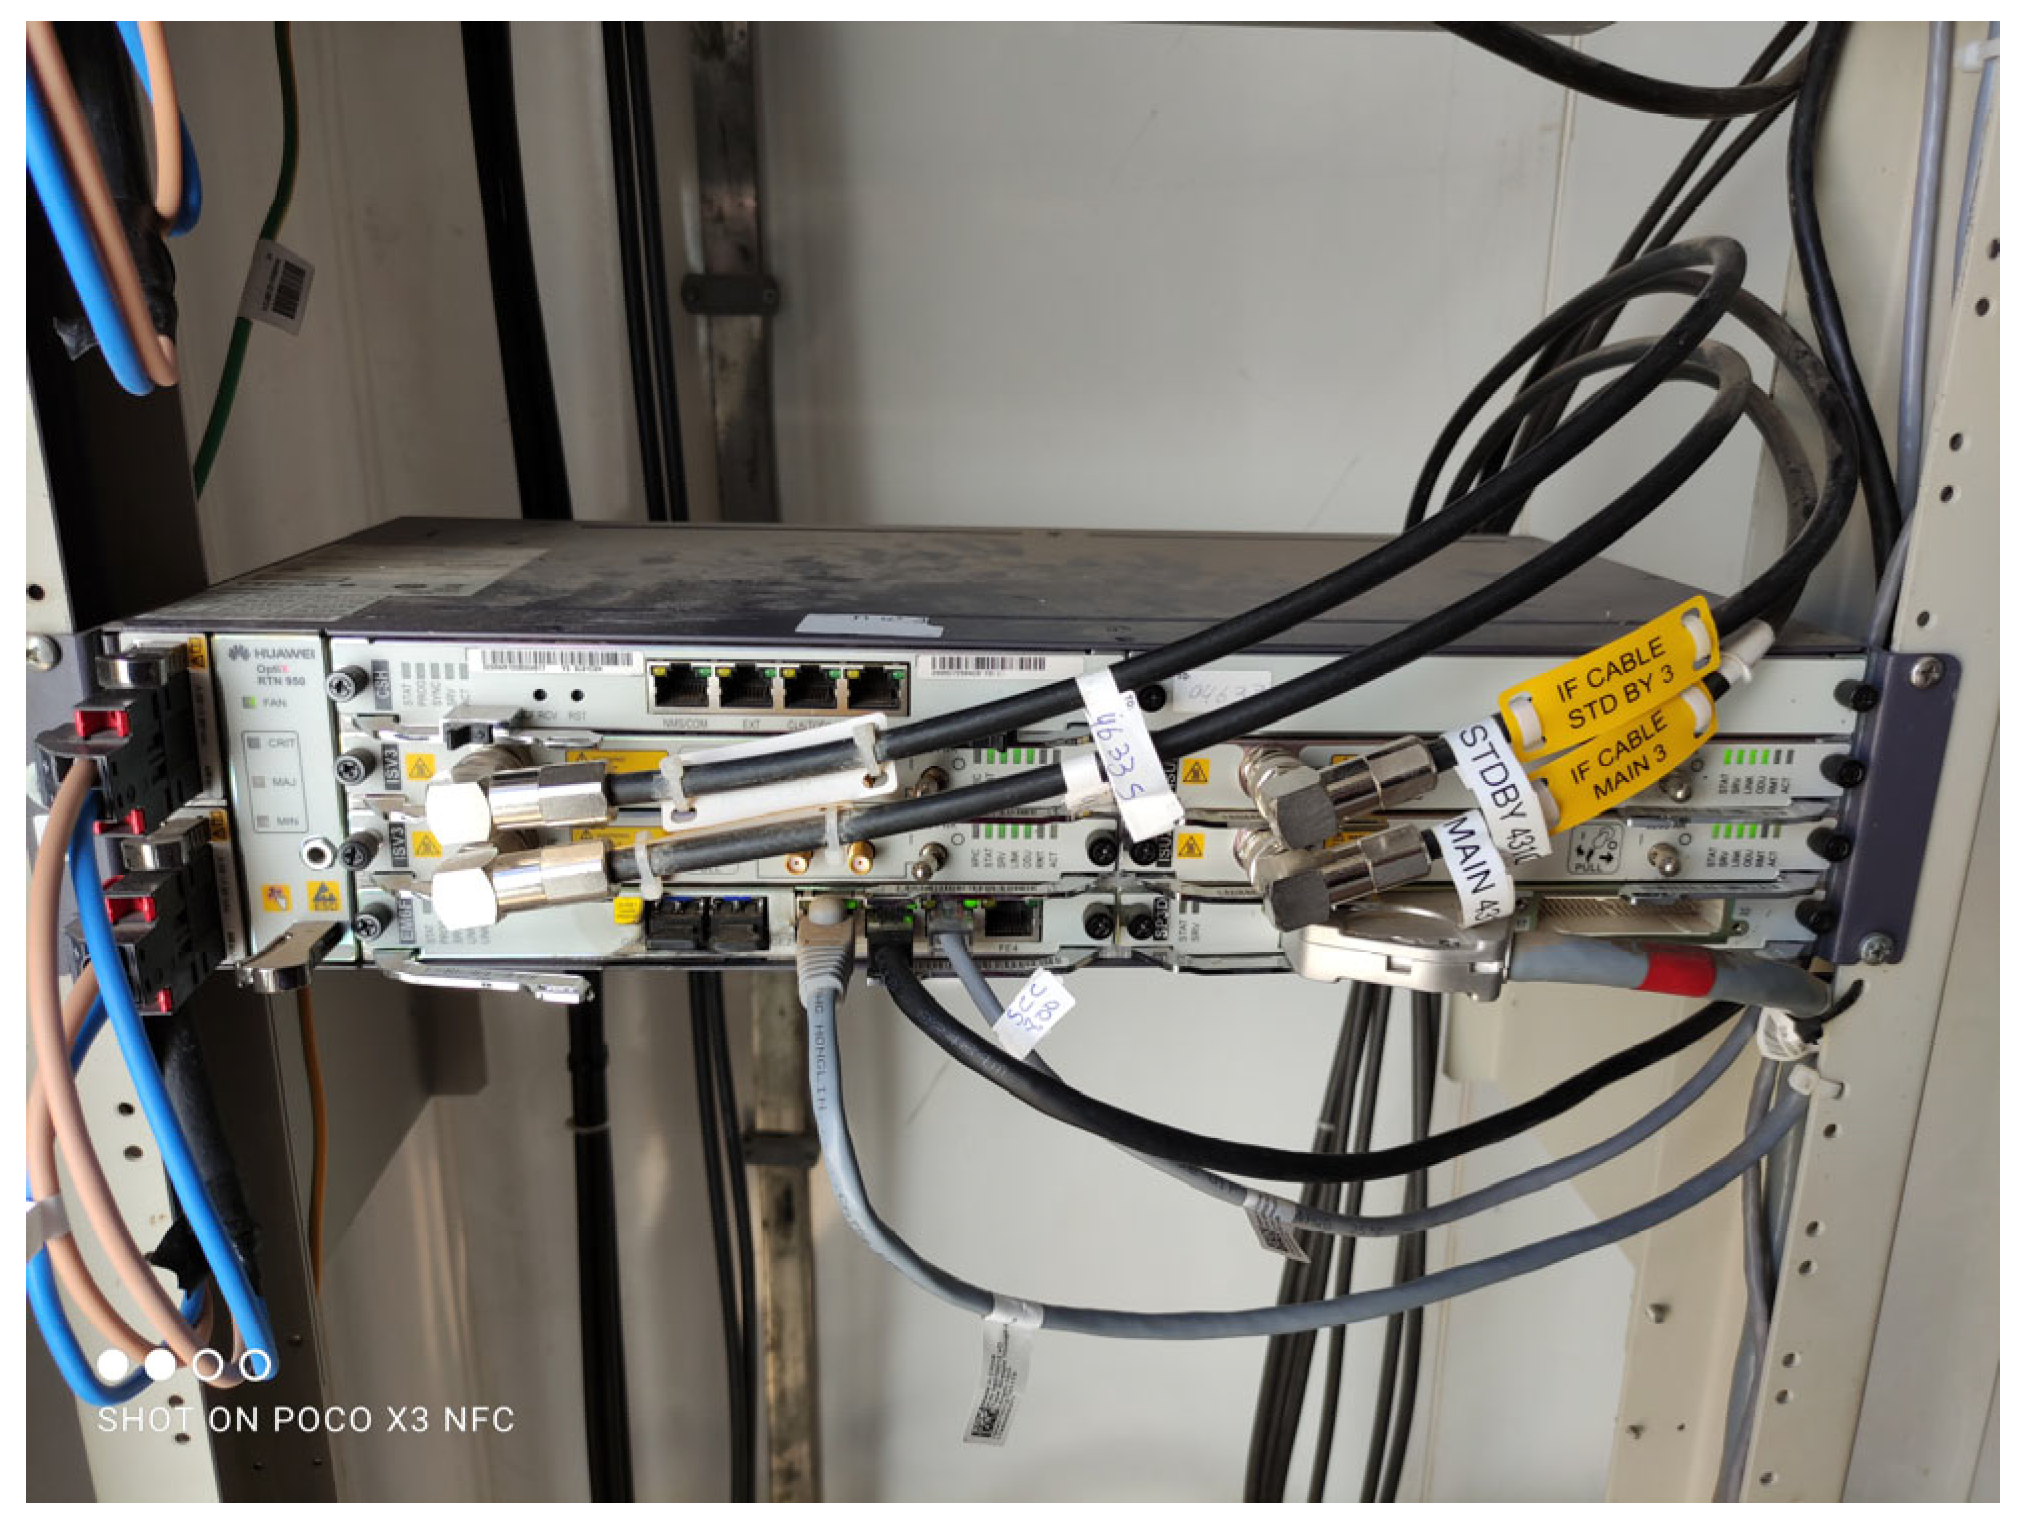
- Radio transmission network (Figure 1): 48V/14.3A.Figure 1. RTN 950.
- -
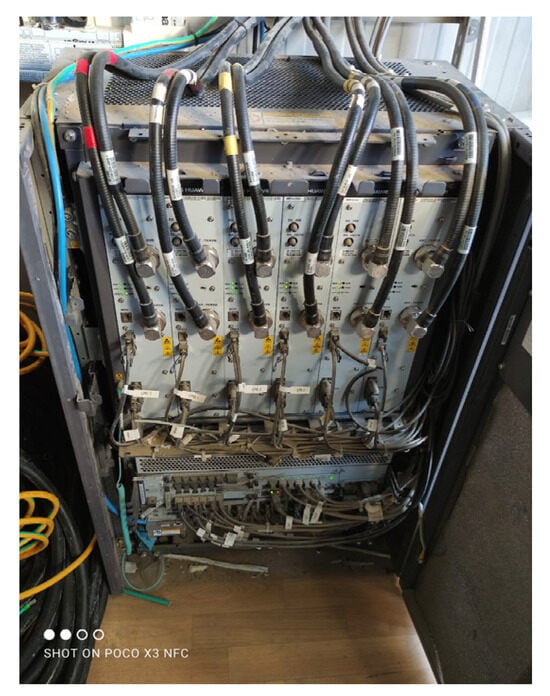
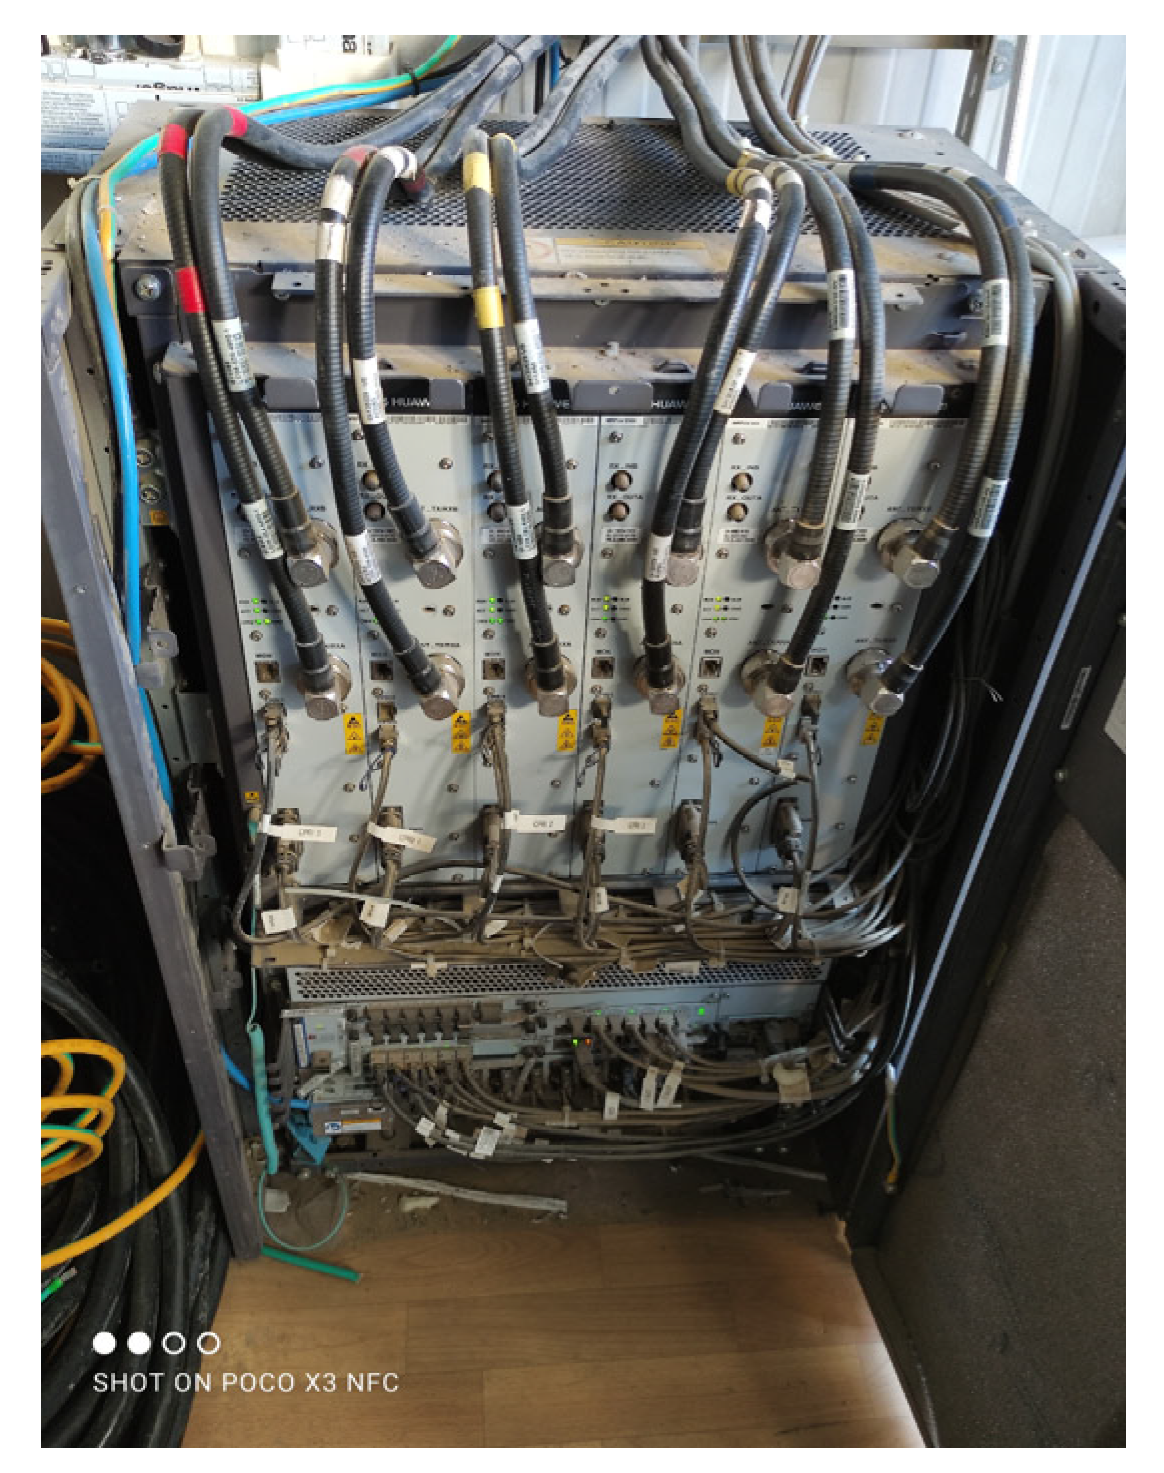
- Base transceiver station (BTS3900): 48V/78A (Figure 2).Figure 2. BTS 3900.
- -
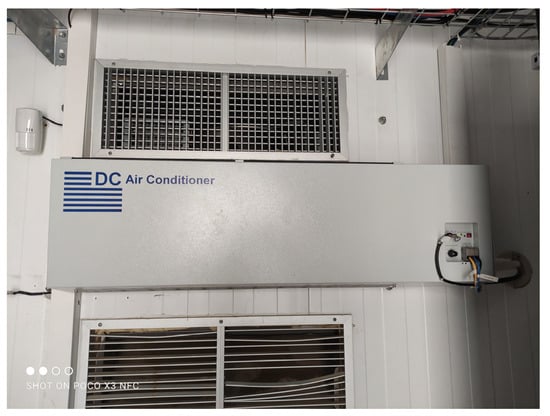
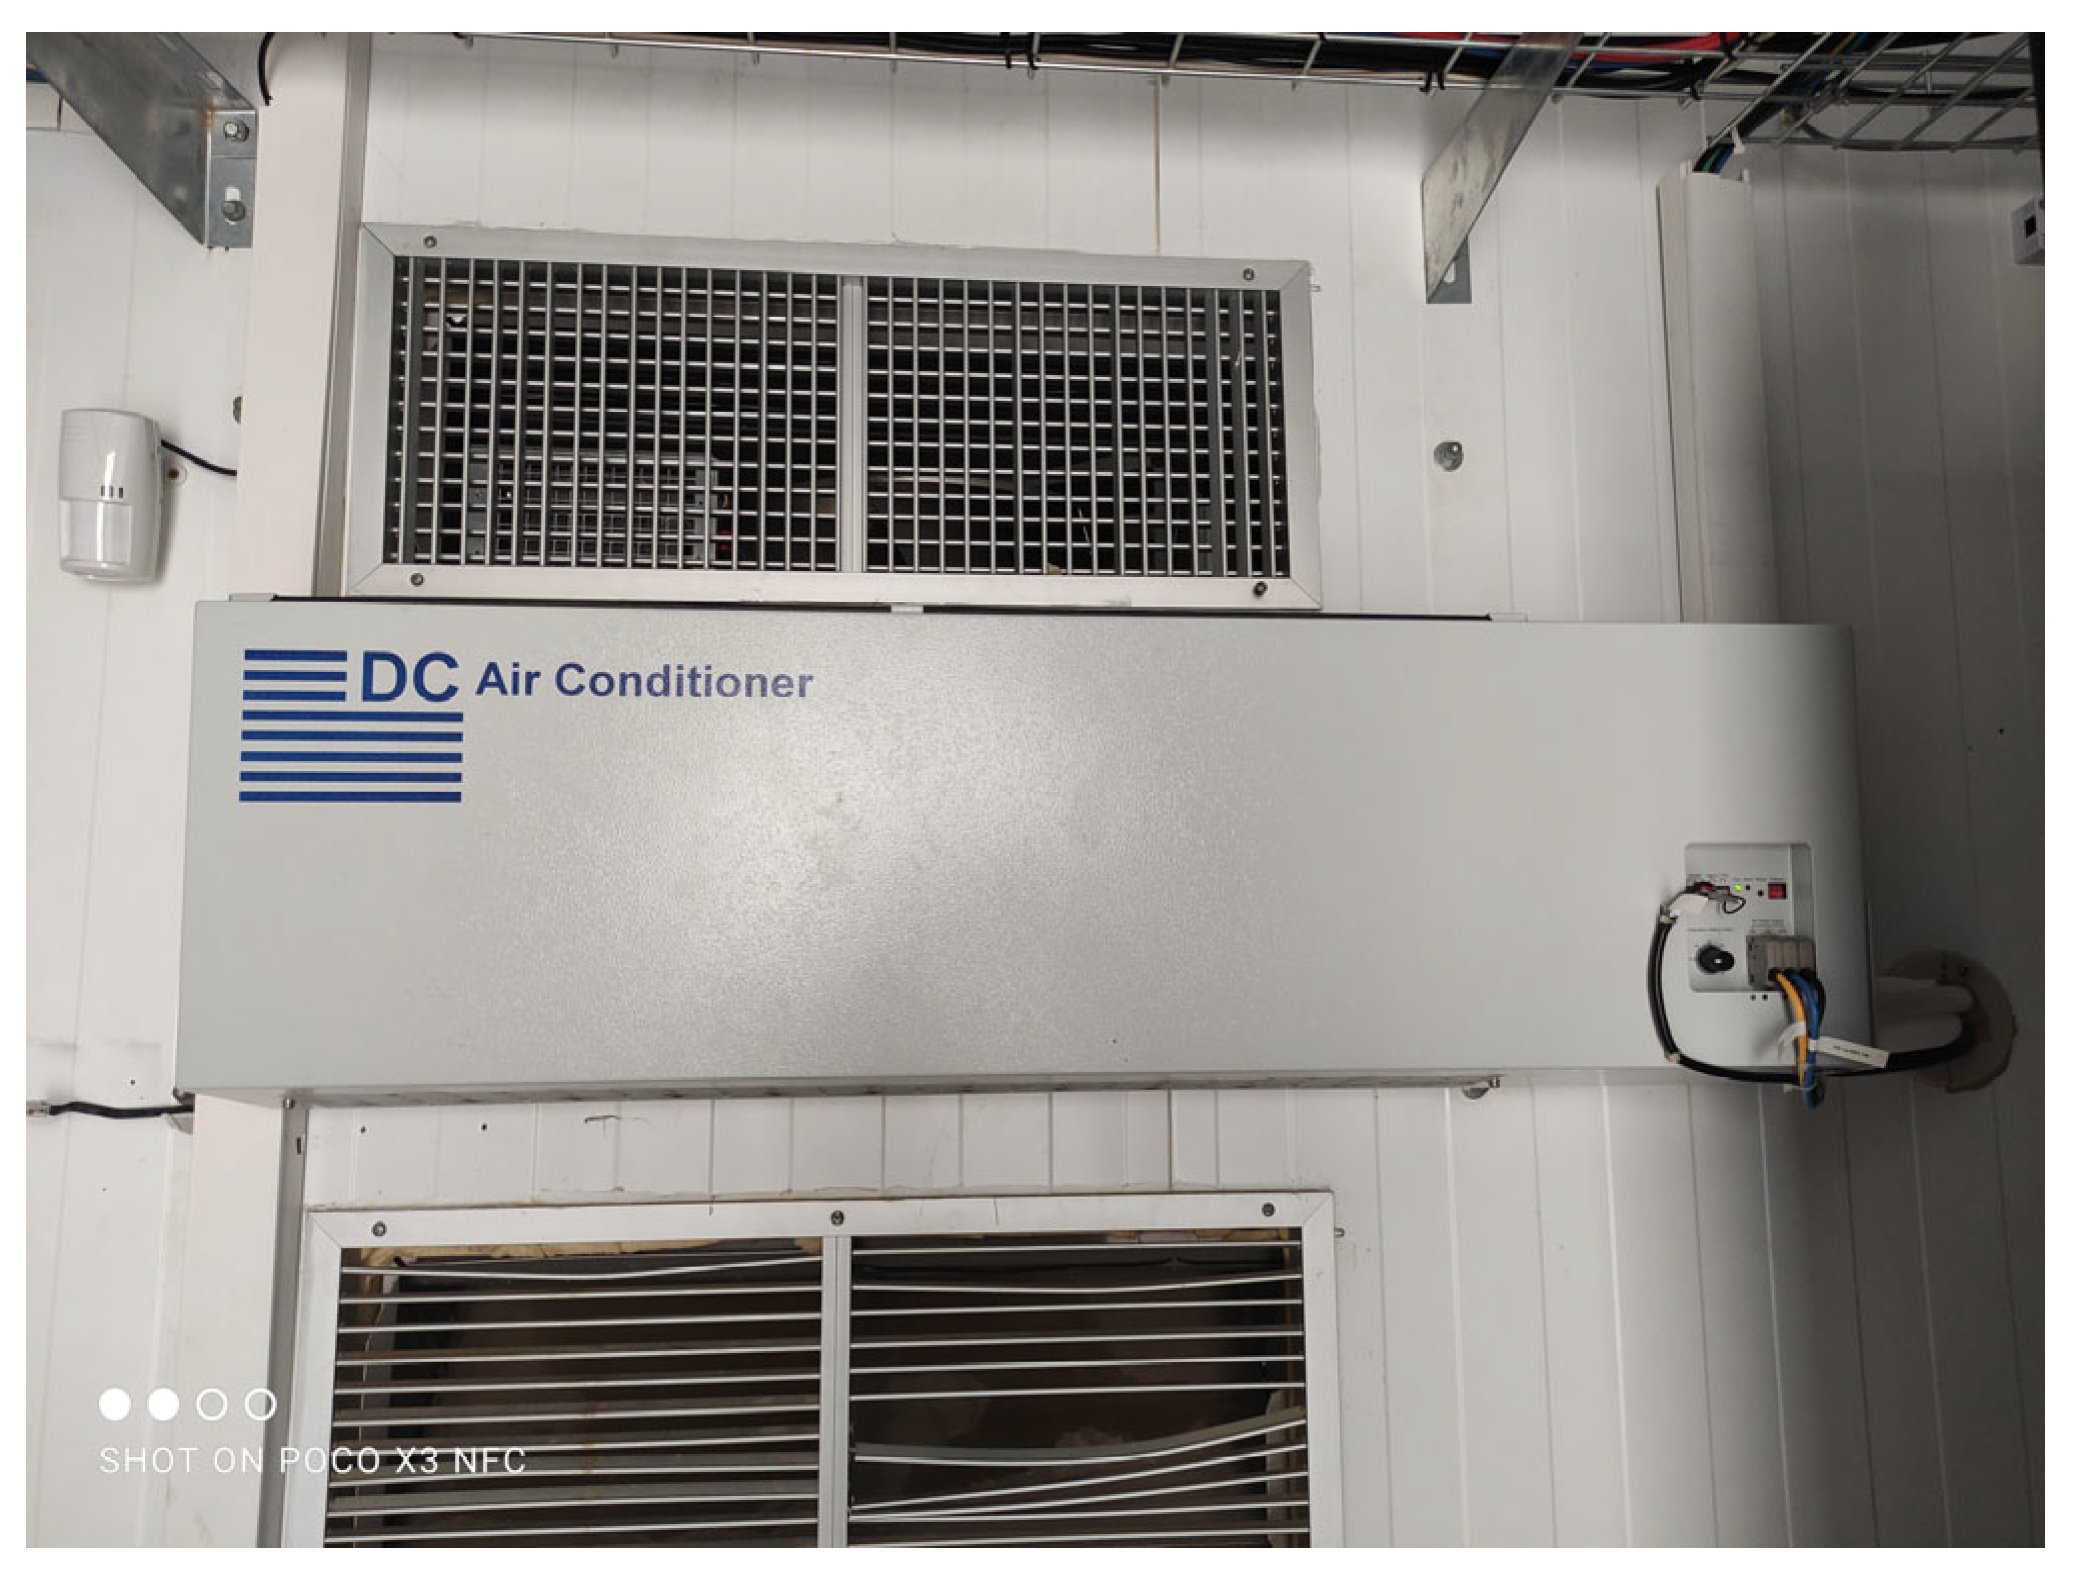
- DC air conditioner: −48V/20A (Figure 3).Figure 3. DC air conditioner.
The components of the HRES are as follows:
- -
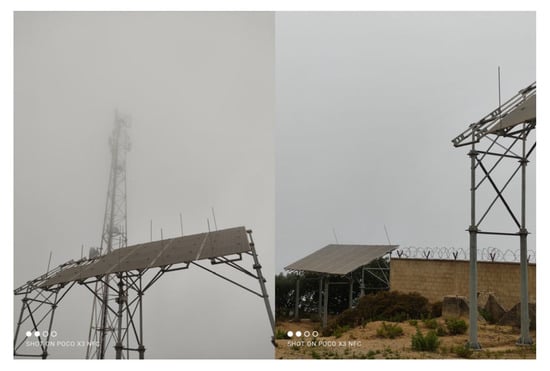
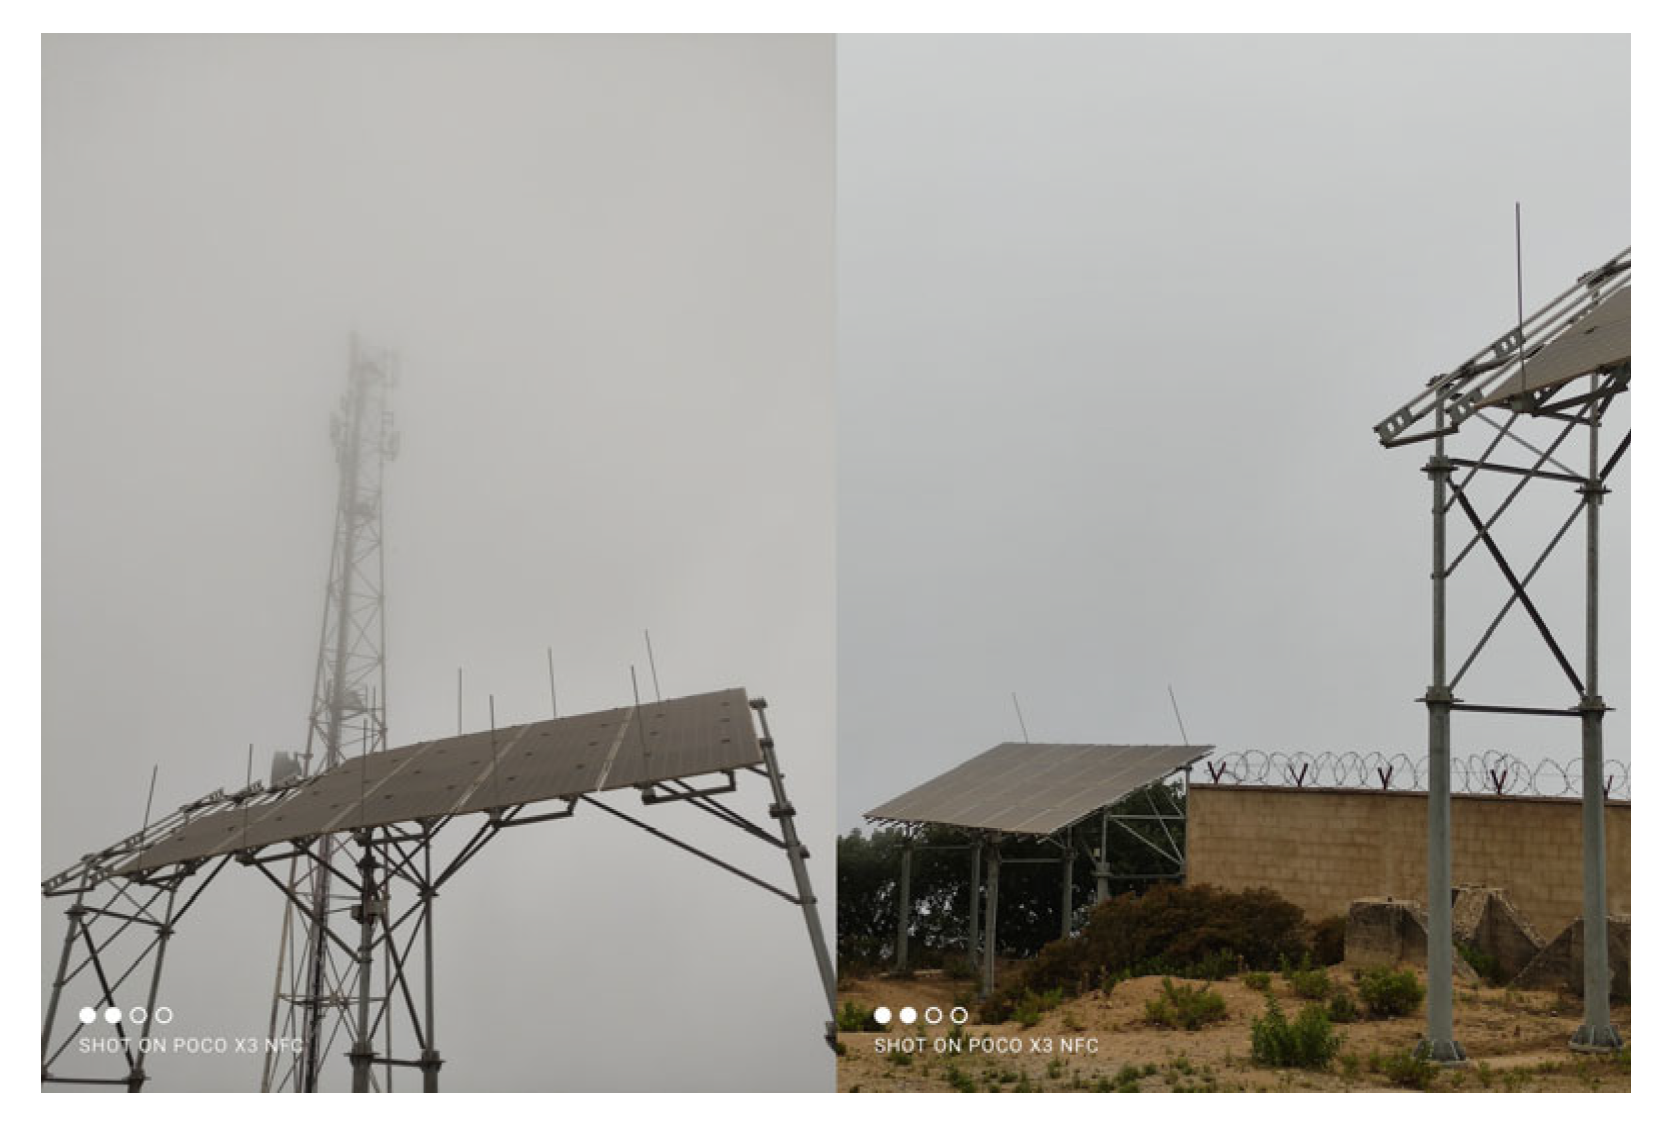
- PV array: The system comprises 33 PV modules (Figure 4), which serve as the primary source of electrical energy. The modules are connected in parallel, and DC–DC converters are used to boost their output voltage to the required system voltage.Figure 4. PV array of the site.
- -
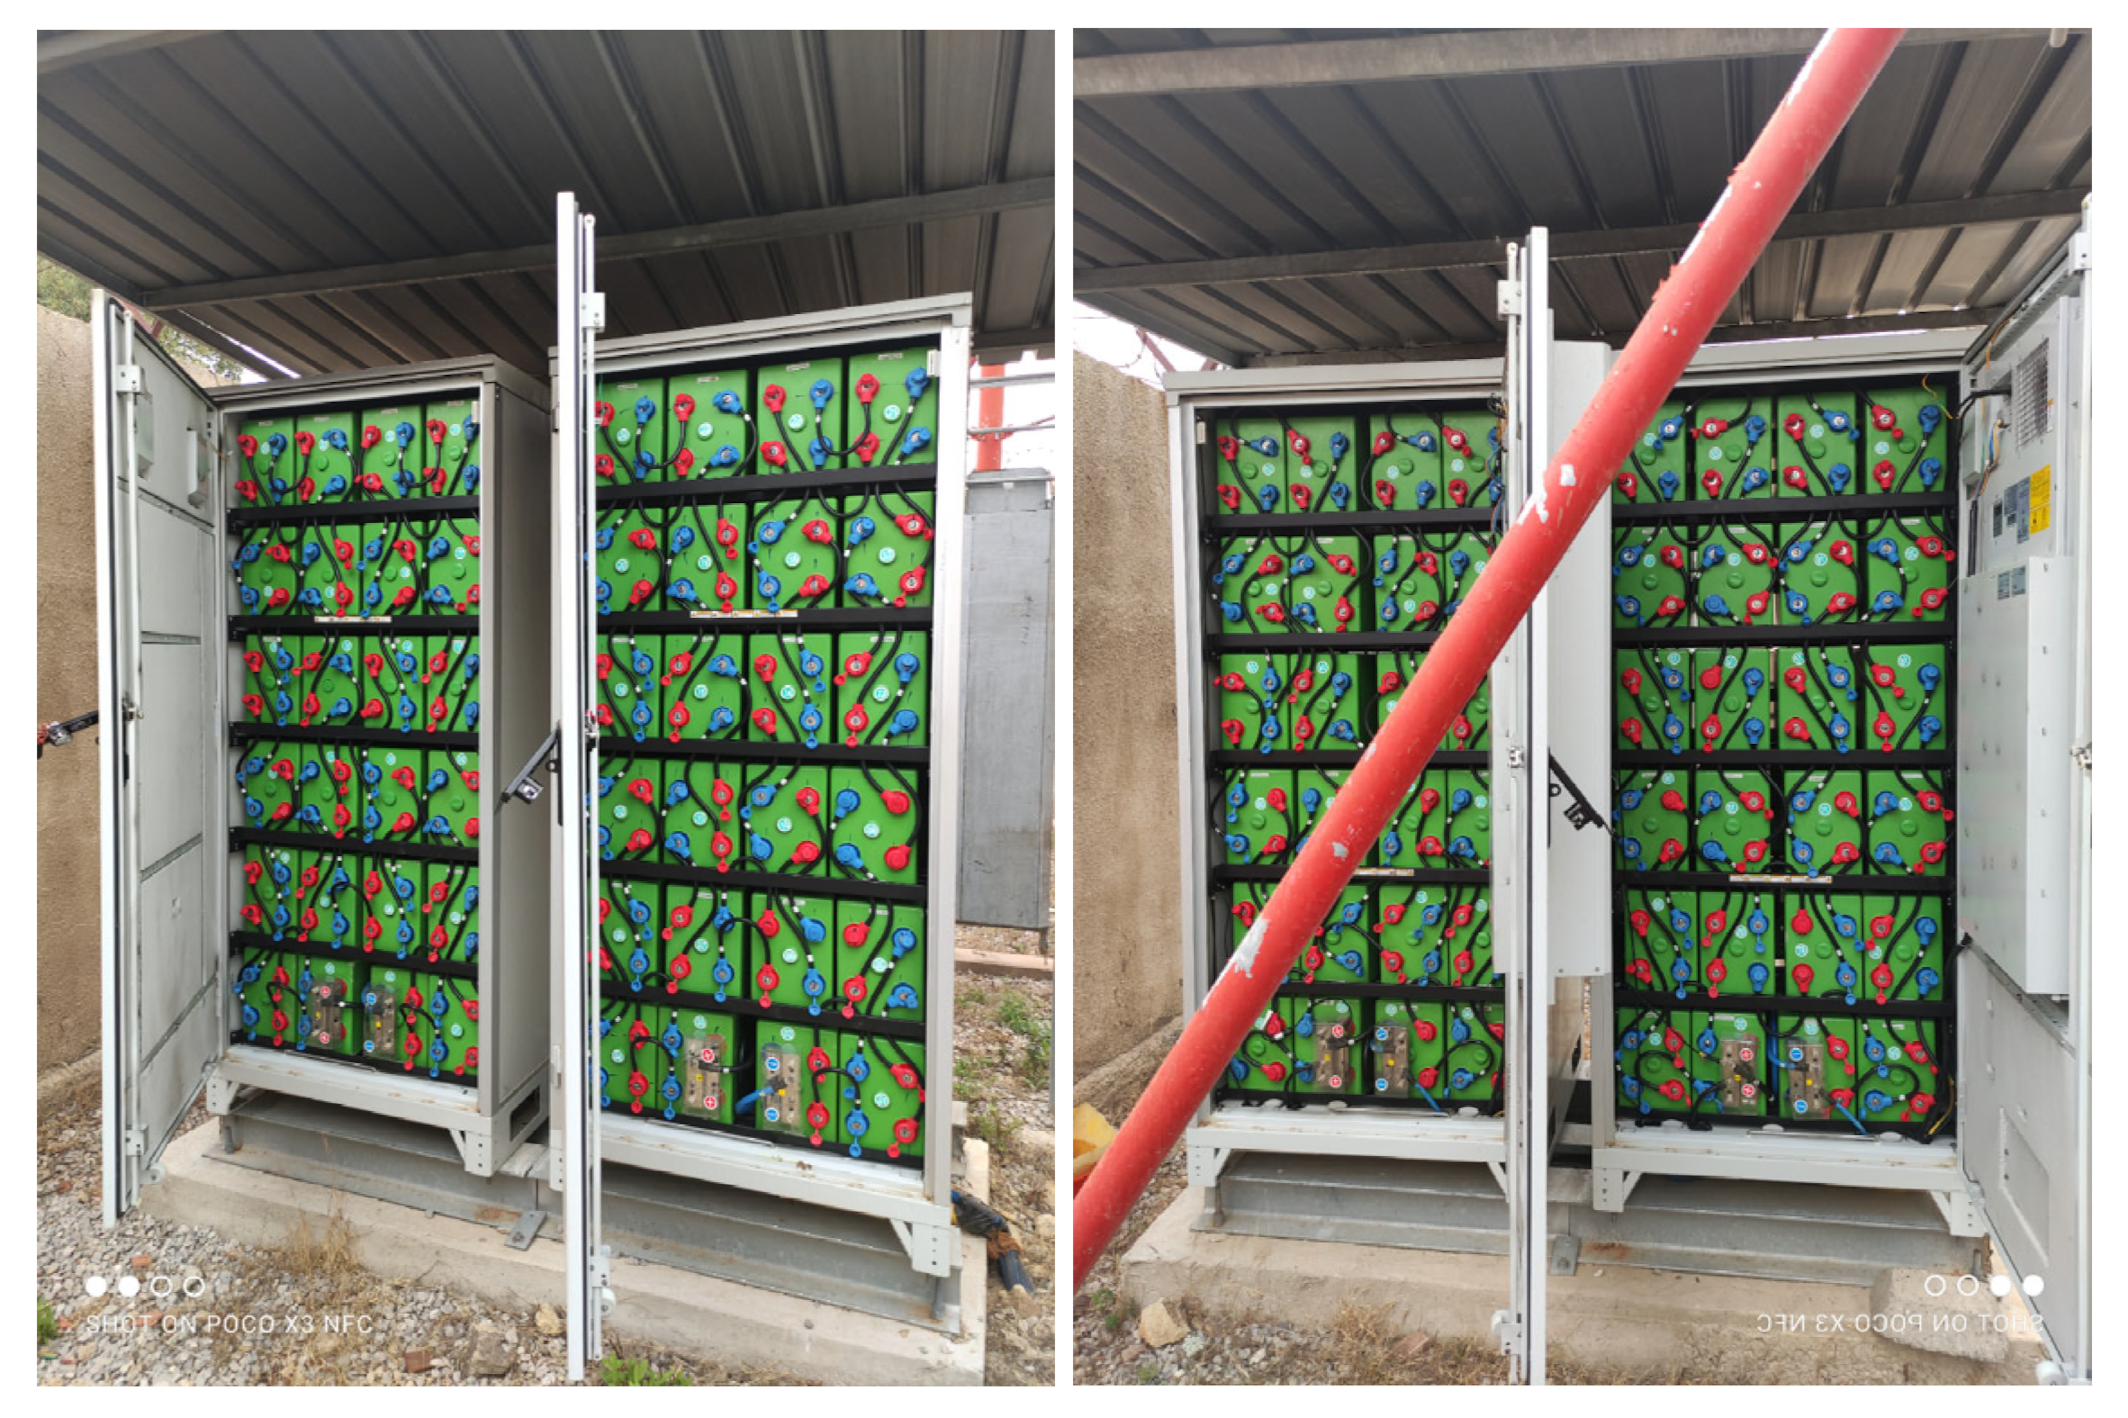
- Battery bank: The energy storage system consists of 96 AGISSON TCB-650A batteries, each rated at 2 V and 650 Ah (Figure 5). The batteries are arranged in four parallel strings, each containing 24 batteries connected in series. Each string, therefore, has a nominal voltage of 48 V and a capacity of 650 Ah, resulting in a total nominal battery-bank rating of 48 V and 2600 Ah.Figure 5. Lead-acid batteries.
- -
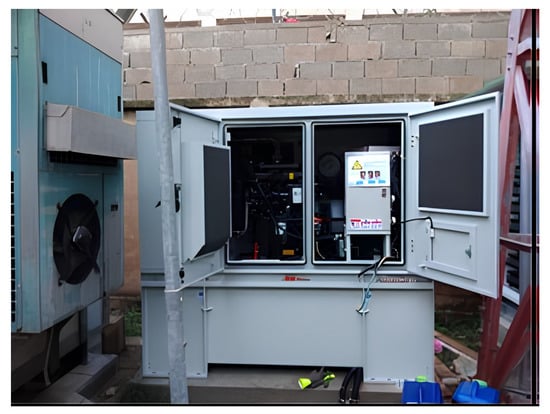
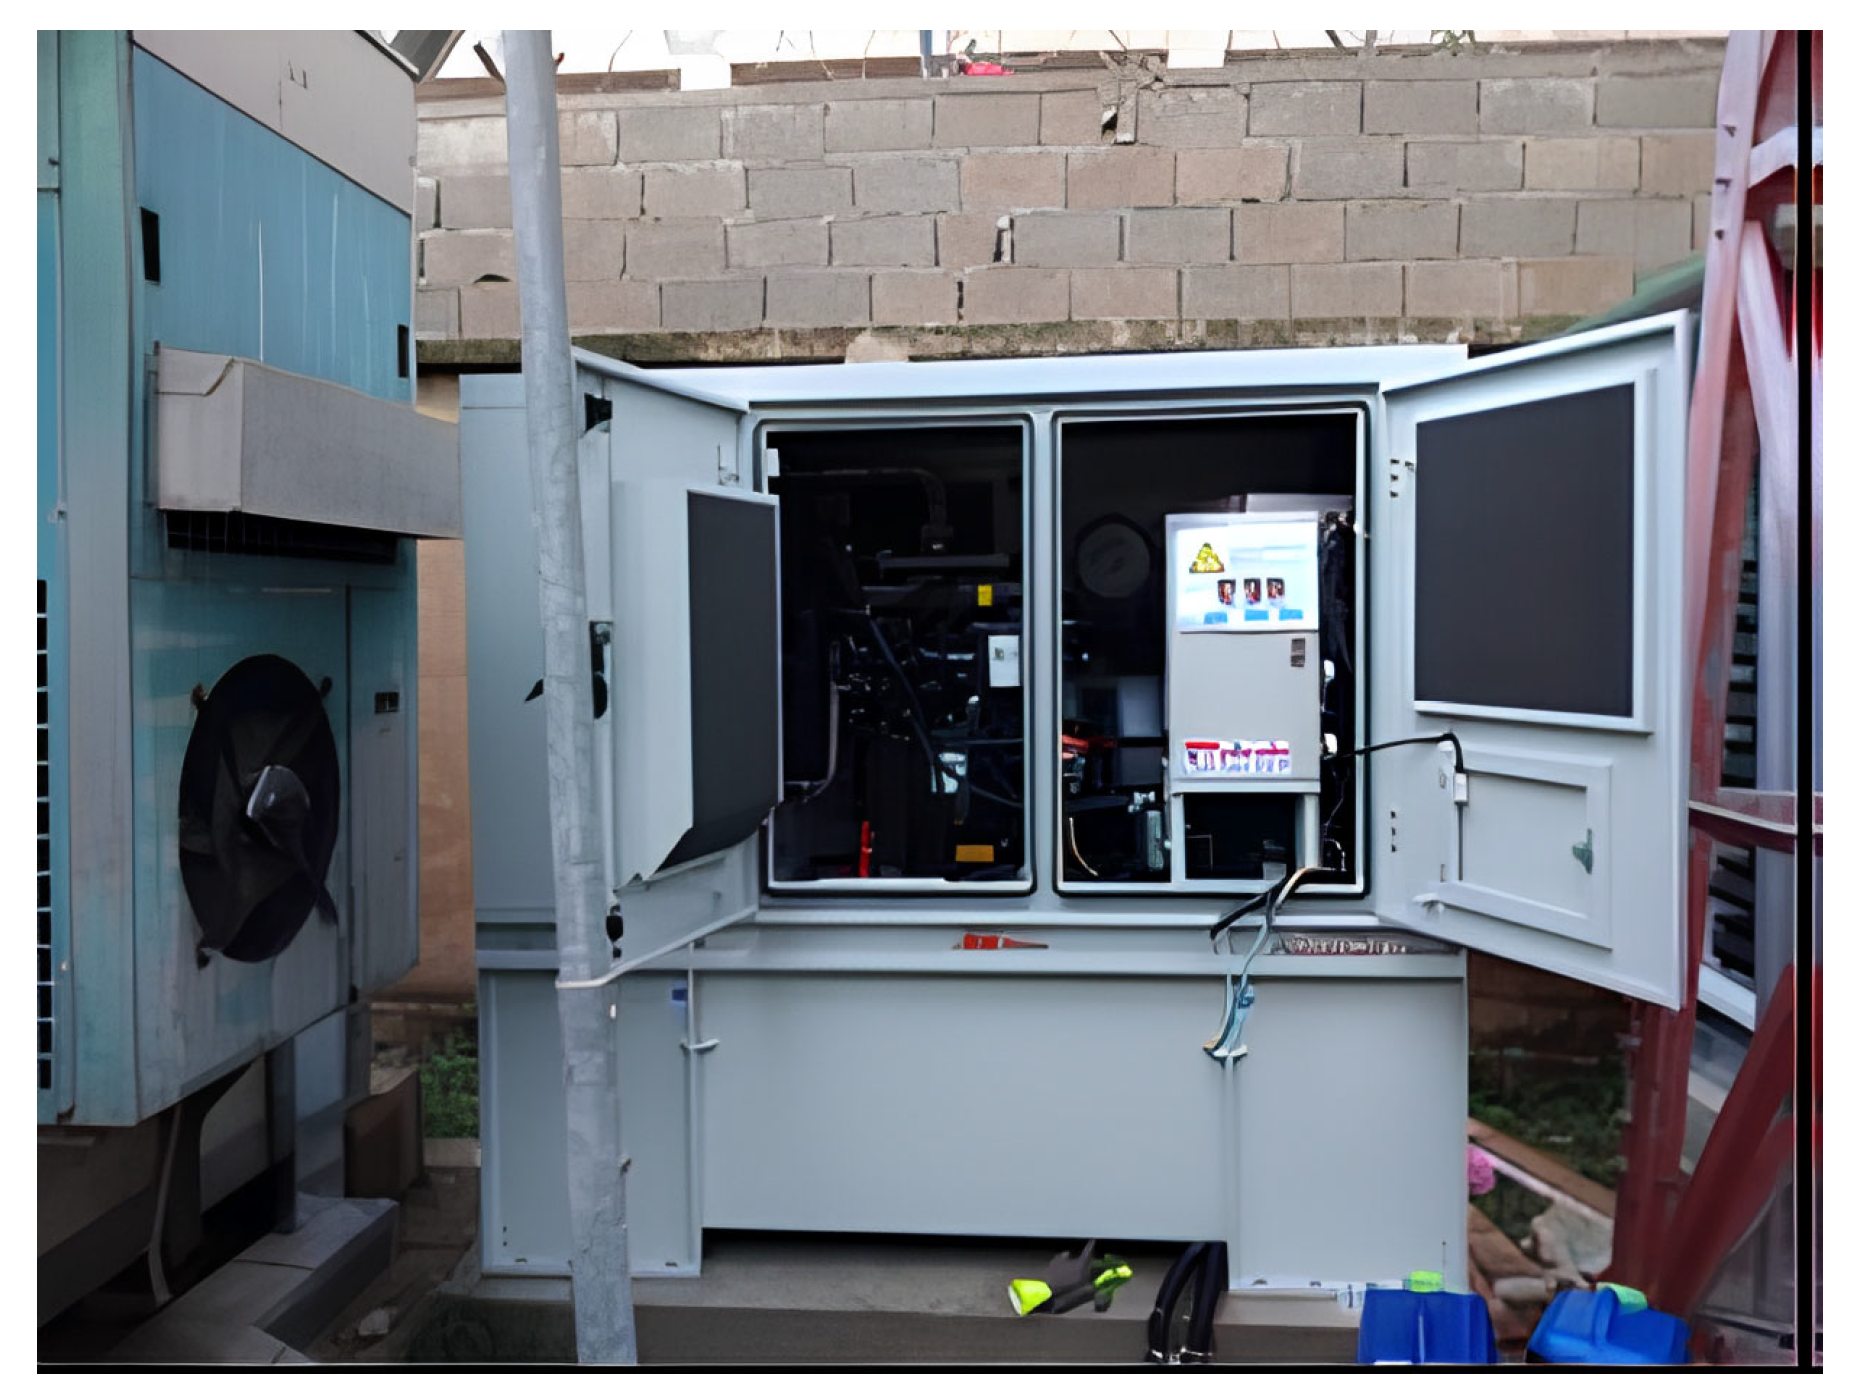
- DG: 17.5 KVA/14 kW (Figure 6).Figure 6. 17.5 kVA DG.
2. HRES Optimization Methods
Optimization techniques are used to identify the best solution to a given problem by minimizing or maximizing an objective function subject to specified constraints.
In HRES design, these techniques are applied to determine the optimal sizes of the system components, including the number of PV modules, battery-bank capacity, number of wind turbines (WTs), and diesel generator (DG) rated power. The optimal configuration depends on the selected objective function and the associated constraints, which may include minimizing the lifecycle cost (LCC) while satisfying a specified reliability requirement [30].
2.1. Graphical Construction
It solves the problems of two design variables, which change with respect to one another. All the constraints are plotted in the same graph, and the optimal solution is obtained from the feasible region in the graph.
2.2. Probabilistic Approach
In this technique, the presence of randomness depends on the collected data, and the variable states are described using a statistical tool.
2.3. Deterministic Approach
Unlike the probabilistic approach, the deterministic approach has a unique solution where the set of variable states is only identified by parameters in the model and sets of previous states of these variables.
2.4. Iterative Approach
It is a mathematical method, performed by a computer, which generates a sequence of improved approximative solutions and stops when it reaches the termination criteria. The disadvantage of this method is that the computation time is directly proportional (exponentially) to the number of optimization variables.
2.5. Artificial Intelligence
Artificial intelligence (AI) develops intelligent agents who perform actions that increase the chance of success [31]. Many AI algorithms are nature inspired, like PSO, GA, ACO, and artificial neural networks (ANNs) [32,33], in addition to many other developed algorithms, like fuzzy logic (FL) [34], exhaustive search technique (ES), Pareto optimization (PO) [35] and hybrid systems, which combine two or more algorithms.
2.6. Software-Based Approach
HOMER, RETScreen [36], PVsyst [37], and iHOGA (hybrid optimization by genetic algorithms) [38], etc., are used.
3. Modeling of HRES
To perform the optimization, the parameters of the system components, like the output power of PV panels and WT, state of charge of the batteries, and the fuel consumption of the DG, must first be calculated using mathematical equations. The calculated values are then used to evaluate candidate system configurations during the optimization process. Since different mathematical models can be used to represent the same component, the models adopted in this study are described in the following subsections. Previous studies have also presented various models for HRES components and optimization [5,39,40,41].
3.1. PV Model
PV modules are characterized by the short-circuit current, open-circuit voltage and the temperature of the cells [42,43,44].
where:
: open-circuit voltage (V).
: short-circuit current (A).
: fill factor.
where:
G: global solar irradiance (W/m2).
T: PV module temperature (C°).
GSTC: solar irradiance at standard test conditions (STCs).
TSTC: PV module temperature at STCs (C°).
: thermal coefficient of the short-circuit current (A/C°).
where:
Voc: open-circuit voltage at STCs (V).
NS: number of the series-connected cells in a PV module.
K: Boltzmann constant (1.381 × 10⁻²³ J/K).
n: diode ideality factor.
q: electronic charge (−1.602 × 10⁻¹⁹ C).
: thermal coefficient of the open-circuit voltage (V/C°).
The temperature of the PV module is calculated as follows:
where:
Tc: cell temperature (C°).
Ta: ambient temperature (C°).
NOCT: nominal operating cell temperature (C°).
800: solar radiation (W/m2).
Φ: solar irradiance (W/m2).
3.2. Wind Turbine Model
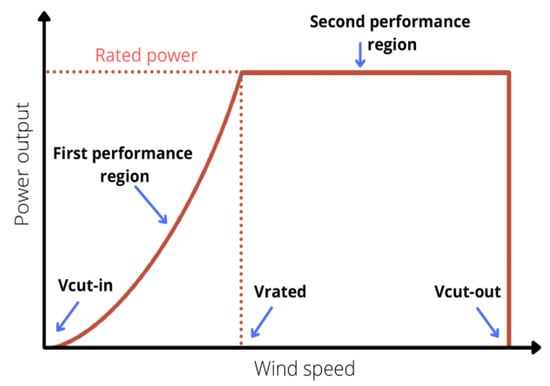
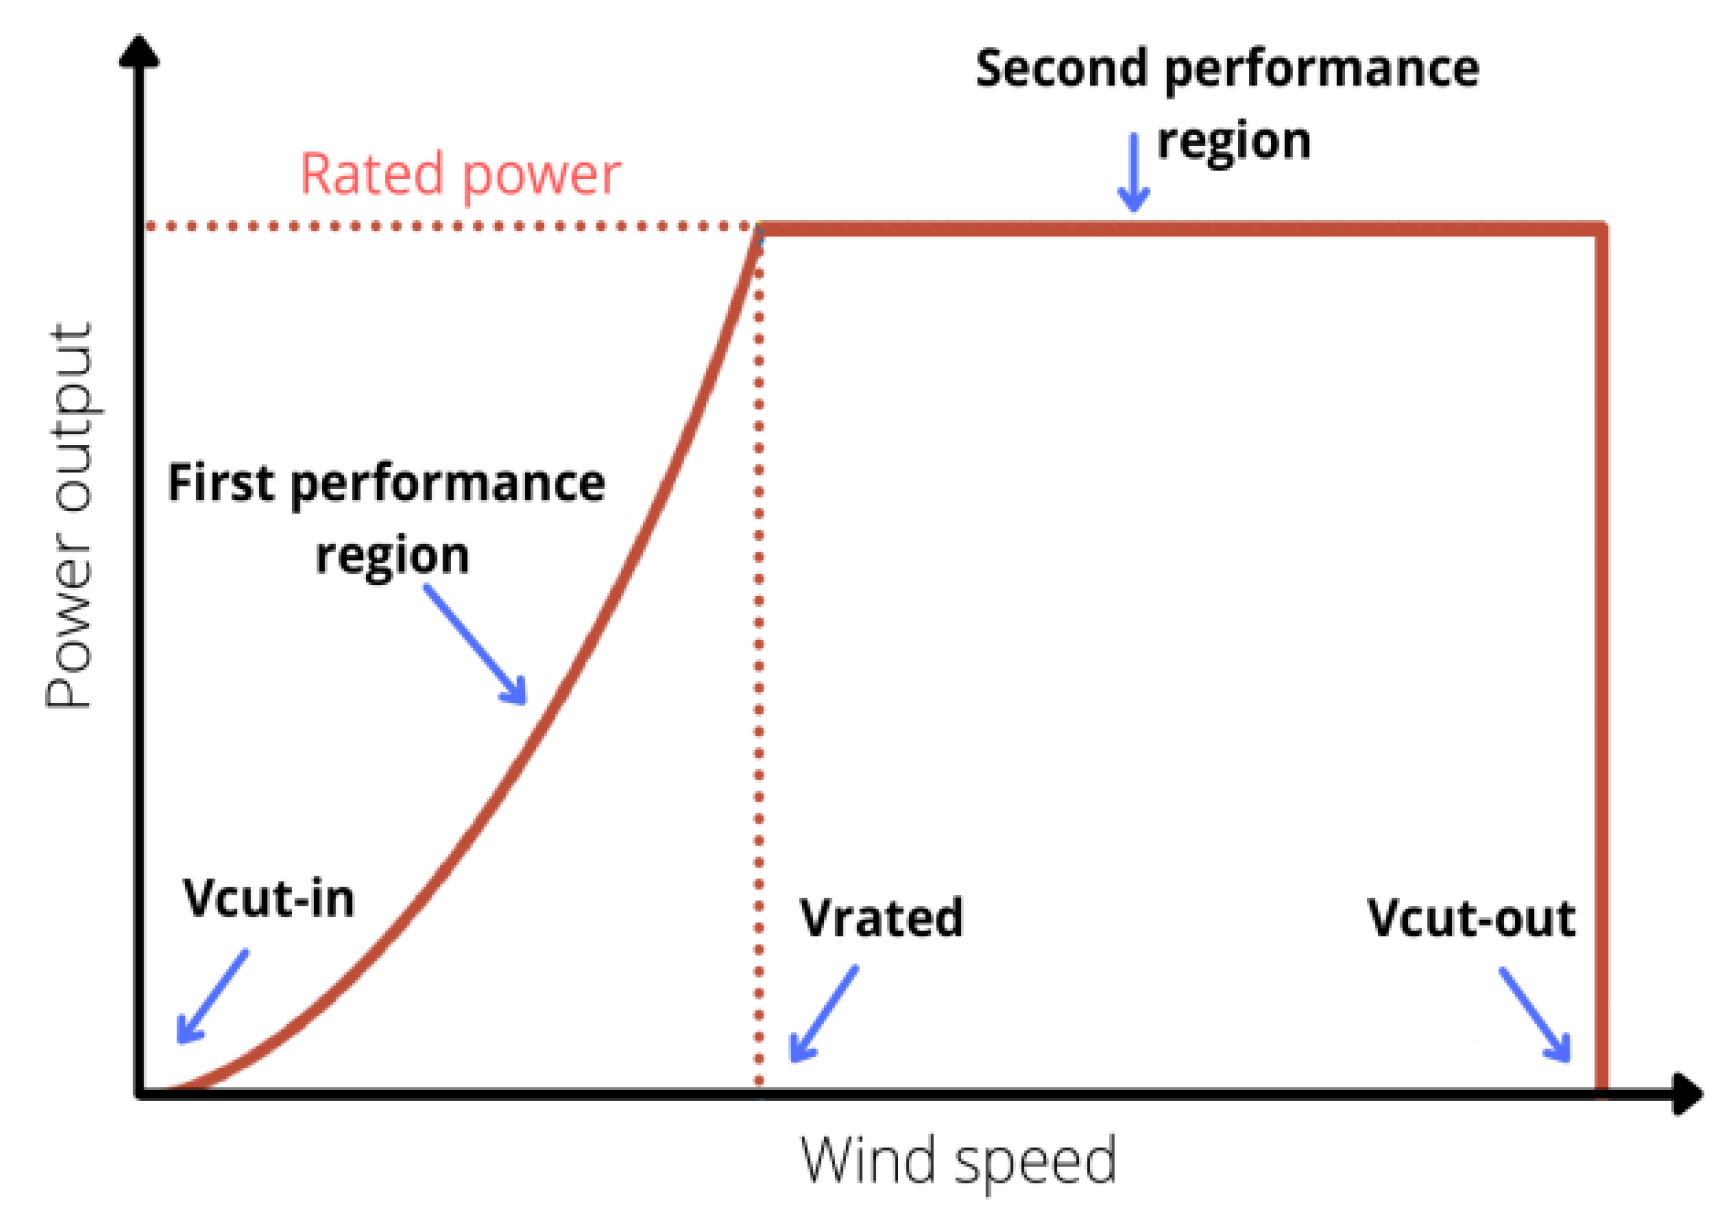
The output power of a wind turbine depends on the wind speed at hub height and the turbine’s power characteristics. Figure 7 illustrates the output power of a WT as a function of the wind speed. The power curve can be divided into three operating regions:
Figure 7.
Wind turbine power variation with wind speed.
[0–Vcut-in]: The turbine does not produce any power.
[Vcut-in to Vrated]: Vcut-in is the threshold speed at which the turbine starts generating the minimum power. In this interval, the power keeps increasing linearly as the speed increases, until it reaches the rated speed Vrated.
[Vrated–Vcut-out]: The turbine operates at its rated power. When the wind speed reaches the cut-out speed, the turbine shuts down to protect its mechanical components from potentially damaging high winds.
Different techniques of modeling WT output power have been used in the literature [5,41,45,46,47,48,49]:
where:
PR: rated power of the wind turbine.
u: wind speed.
ur: rated wind speed.
uc: cut-in wind speed.
uF: cut-off wind speed.
P(u) varies linearly in the interval [uc − ur] [30].
3.3. Battery Modeling
A battery is an electrochemical device, storing electrical energy during charging and releasing energy during discharging. Its state of charge (SOC) represents the remaining charge relative to its rated capacity, usually expressed as a percentage. The SOC can be modeled during the charging and discharging phases [30,50,51,52].
Charging phase:
Discharging phase:
where:
Pload: the power consumed by the load at time t.
Δt: simulation time step.
ŋdcdc: efficiency of the DC/DC converter.
ŋacdc: efficiency of the AC/DC converter.
ŋinv: efficiency of the inverter.
ŋwr: wire losses.
ŋcha: charging efficiency.
ŋdis: discharging efficiency.
Ubus: nominal bus voltage (v).
3.4. Diesel Generator Model
In an HRES, the diesel generator (DG) serves as a backup power source when renewable generation and the energy available from the battery bank are insufficient to meet the load demand. Depending on the energy management system, the DG may supply the load alone or supply the load while simultaneously charging the batteries.
The DGs use conventional fuel (diesel) as a source of energy to generate electrical power. However, the combustion of this fuel emits greenhouse gases, which are environmentally unfriendly. For this, reducing DG operation can help lower fuel consumption and associated emissions. To estimate the quantity of fuel consumption, the following model is used:
where:
Df(t): hourly fuel consumption (L/h).
PDG: average DG power per hour (kW).
PDGr: rated DG power (kW).
αD, βD: coefficients of the fuel consumption curve (L/kWh).
The values of α and β are 0.246 and 0.08145, respectively [9,53,54,55,56,57].
4. HRES Optimization Objectives and Criteria
HRES optimization aims to identify the system configuration that optimizes one or more objective functions subject to specified constraints (criteria). These objectives and criteria can be classified into three categories: economical [58,59,60,61,62], technical [7,9,43,50,52,60,61,63,64], and environmental [65,66,67].
4.1. Economical
Lifecycle Cost (LCC)
It is the total recurring and non-recuring costs during the life of the system. Different equations have been used in the literature to calculate its value
where:
Ci: the initial cost.
CO&M: operation and maintenance cost.
Crep: the replacement cost [58].
To calculate CO&M and cost of replacement, the present worth of operating cost (PWO&M) and replacement cost (PWr) should be calculated as follows [49,58]:
where Cim is the initial cost of maintenance and Pa is the present worth factor of the recurring expense
where:
i: the inflation rate.
d: the discount rate.
n: the duration of the project in years.
If the recurring purchase begins at the end of the first year and if the last purchase does not begin until the end of the system life, the present worth factor becomes
The present worth factor of an element that will be replaced n years later is given as
Then, the equation of the total present worth of replacement is driven as follows:
4.2. Technical (Reliability)
Loss of Power Supply Probability
It is defined as the amount of the load demand that the system is unable to satisfy, divided by the total load demand during the period of study. The limit of this value is determined by the user of the load, depending on the needs [7,9,43,50,52,61,63].
where:
DE(t): deficit of energy (kWh) at time t.
Pload: the required load (kW) at time t.
Psupply: the supplied power to the load (kW).
4.3. Environmental
The conventional power plants emit greenhouse gases like carbon dioxide, carbon monoxide, sulfur dioxide, and nitrogen monoxide, which contribute significantly to polluting the environment and changing the climate.
To solve this problem, the designers of HRESs set environmental objectives, like embodied energy, carbon emissions, and carbon footprint of energy, to minimize the impact of greenhouse gases (global warming).
5. Study Case (Remote Mobile Telecommunication Station)
This section applies the selected component models, optimization methods, objective functions, and constraints to the remote mobile telecommunication station introduced in Section 1.2
Single-objective and multi-objective (lexicographic) optimizations are performed using an exhaustive search numerical algorithm and particle swarm optimization (PSO).
For the single-objective optimization, the objective is to minimize the lifecycle cost (LCC) using Equations (10)–(16), subject to a loss of power supply probability (LPSP) of zero (Equation (17)). The optimization problem is formulated as follows:
X is the vector of design variables comprising the number of PV modules, the number of WTs, the number of parallel battery strings, and the rated power of the DG.
The upper bounds of the PV array, WT, and battery bank are intended to be determined from the load consumption and the assumed operating conditions. This study estimates the PV and WT bounds using the maximum load energy consumption (kWh) and the minimum nonzero energy output of an individual component over the simulation period. The battery-bank bound is based on the assumption that the storage system should provide one day of load autonomy.
For the PV system:
where ELmax denotes the maximum energy consumption of the load over the specified time interval, and EPVmin denotes the minimum nonzero energy generated by one PV module over the simulation period.
For the wind turbine:
EWTmin denotes the minimum nonzero energy generated by one WT over the simulation period.
For battery bank, the maximum number of parallel battery strings is estimated using
where Cr is the rated capacity of one battery string in kWh and ELmax_day is the maximum daily consumption of the load (assuming that the storage system should provide one day of autonomy).
The maximum DG rated power is intended to account for the requirement to supply the peak load consumption and charge the minimum battery bank simultaneously (limit the DG operation), subject to the maximum permitted charging power.
The maximum SOCmax is set to 1, while the minimum SOCmin is calculated from the permitted depth of discharge (DOD):
The recommended value of DOD is provided by the manufacturer.
The lower bounds for the numbers of PV modules, wind turbines (WTs), and battery strings were set to 1 to ensure that all three component types were included in the investigated HRES configurations. The lower bound for the DG rated power was set to 8 kW to limit the computational search space.
For the multi-objective optimization (lexicographic method, which is defined as a multi-objective optimization approach that minimizes objective functions in a prioritized order, ensuring that each function meets its specified constraints [28]), the objective is to minimize LPSP followed by LCC.
5.1. Energy Management System
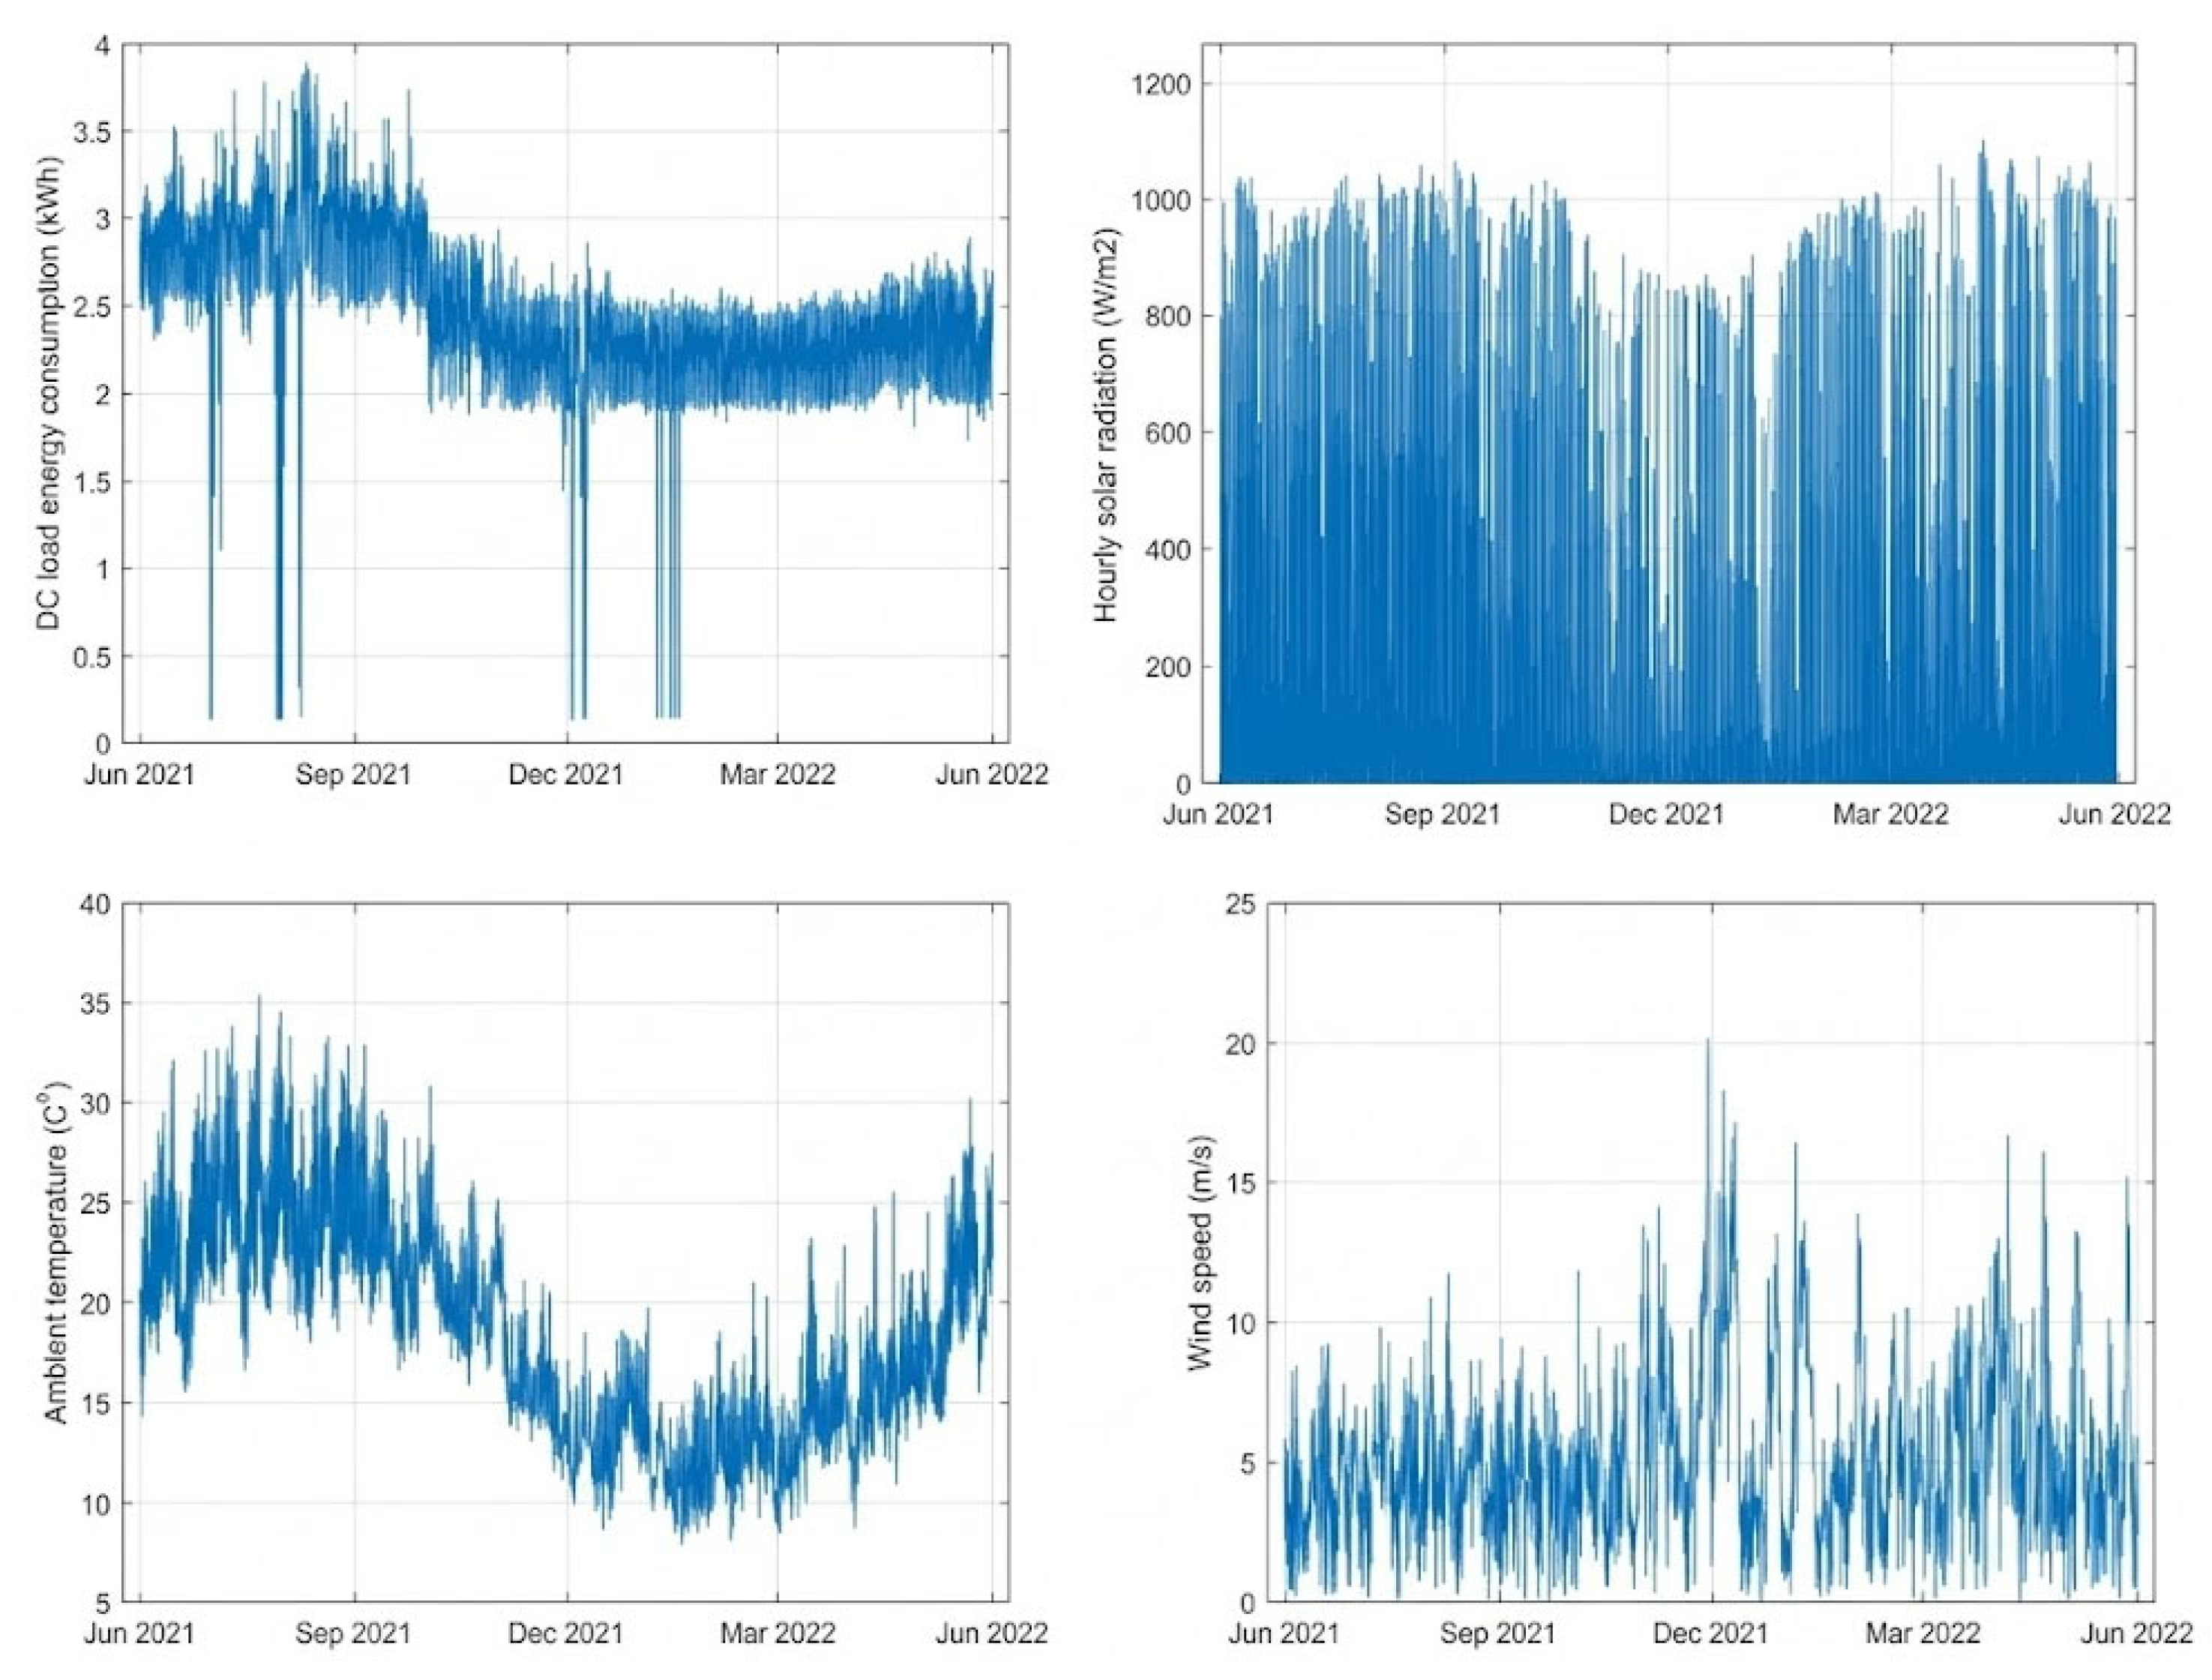
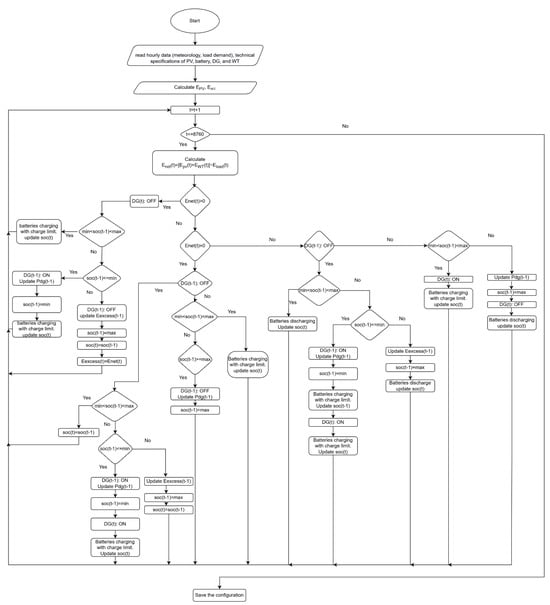
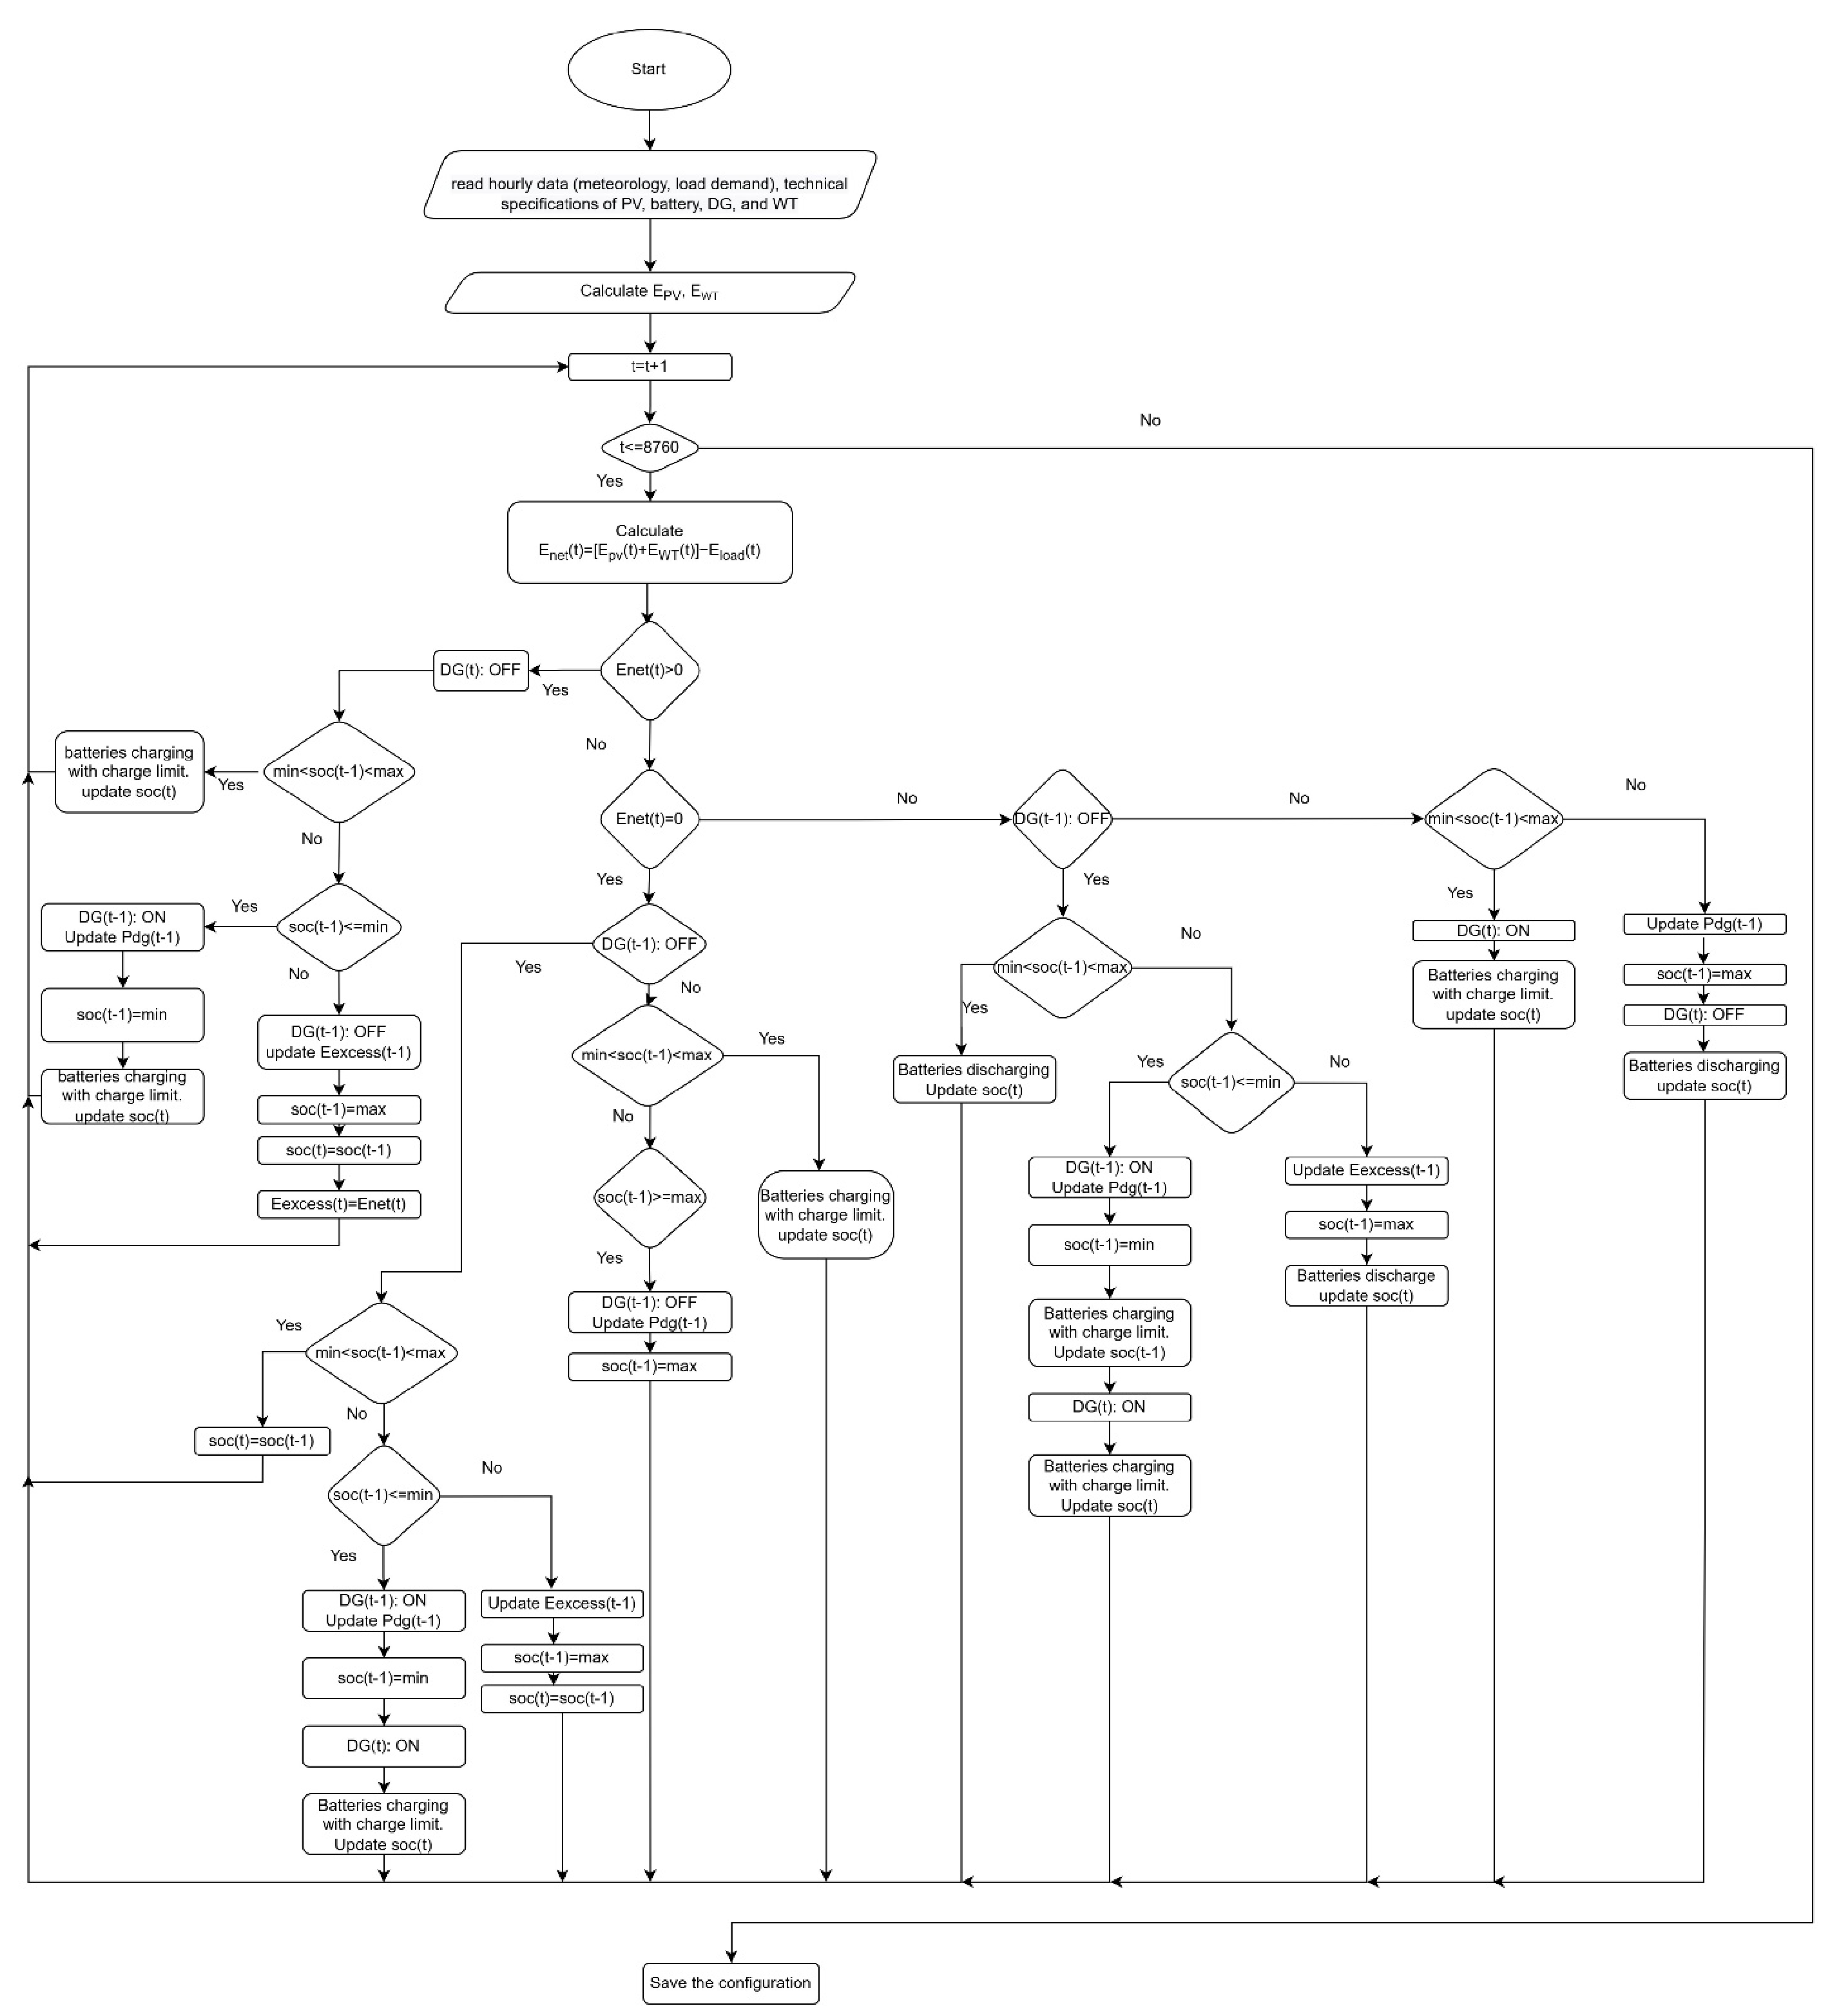
Figure 8 presents a flowchart of the energy management strategy. The algorithm starts by reading the hourly meteorological data of the site, the load demand (Figure 9), and the technical specifications of the PV modules, battery bank, DG, and wind turbine (Table 3, Table 4, Table 5, and Table 6 respectively).
Figure 8.
Energy management strategy.
The PV and WT output powers are calculated using Equations (1)–(4) and (5) and (6), respectively.
The battery system is assumed to be fully charged at t = 0 to represent a scenario in which the batteries are charged and tested during system commissioning before handover to the customer. The battery SOC is calculated using Equations (7) and (8).
When the battery SOC reaches the selected DOD (60%), the DG starts to supply the load and charge the batteries simultaneously. The DG is switched off when the batteries become fully charged or when renewable generation exceeds the load demand. The fuel consumption of the DG is calculated using Equation (9).
To make this algorithm more efficient than the other scientific works and close to the real operating system, a charge limit of 0.14C is applied during the boost charging and 0.08C during the float charging; i.e., the maximum charging current is equal to 0.14-times the total capacity of the battery system during the boost charging phase (SOCmin SOC(t) < 80%) and 0.08-times the total capacity during the float charging phase (80% SOC(t) < 100%). These values of charge limits are implemented in the existing system.
At each hourly time step, the net energy Enet is calculated as the difference between the energy generated by the PV and WT systems and the load consumption. The EMS then determines the system operating state according to the following three cases.
- Enet(t) > 0:
In this case, the DG is off.
If the SOC of the batteries is between the min and max, Enet(t) is used to charge the batteries and the SOC is updated. Excess energy is obtained if Enet(t) is greater than the required energy to charge the batteries to 100% or if it exceeds the charging limit.
If the SOC is equal to 1, excess energy is equal to Enet(t).
- 2.
- Enet(t) = 0:
If the DG was running at time (t − 1) and SOC(t − 1) is less than SOCmax, the batteries continue charging at time (t) and SOC(t) is updated.
If the DG was off at time (t − 1) and SOCmin < SOC(t − 1) SOCmax, the battery SOC(t) remains unchanged.
- 3.
- Enet(t) < 0:
If the DG was switched off and SOCmin < SOC(t − 1) SOCmax, the batteries discharge and SOC(t) is updated. Once the SOC reaches the minimum value, the DG starts.
If the DG was operating during the previous time step and SOCmin < SOC(t − 1) < SOCmax, the DG supplies the load and charges the batteries simultaneously, subject to the charging constraints. The DG is switched off when the SOC reaches SOCmax or when Enet(t) becomes positive.
At each time step, the algorithm calculates and records the SOC, excess energy, energy deficit, DG fuel consumption, DG output energy, and PV and WT energy production. The time index is then incremented by one hour, and the procedure is repeated until the end of the 8760 h simulation period.
For a consistent comparison between the existing and optimized HRES configurations, the same types of PV modules, batteries, and DG are used, with their respective technical characteristics and purchase prices kept consistent. The same battery charging limits are also applied to both configurations.
Table 3.
PV panel specifications [68,69].
Theoretically, the maximum number of PV panels is 3890. However, because of the site area constraints, the number is limited to 100 PV panels. The modules are connected in parallel, and the system voltage is assumed to be provided by an ideal DC–DC converter (losses are neglected). The converter was not modeled in terms of power and cost, because the objective of this study is to optimize the size of the main energy components (PV, batt, WT, DG).
The PV module lifetime is assumed to be approximately 20 years.
Table 4.
Solar battery specification [68].
The lifetime of the lead-acid batteries is assumed to be approximately 4 years [68], regardless of the degradation factors and temperature effect. Accordingly, four battery replacements are considered over the 20-year project lifetime.
In this system, the battery-bank configuration consists of 24 batteries connected in series to provide a nominal system voltage of 48 V.
Table 5.
DG specifications [68,70].
The DG AC output voltage is converted to DC assuming the use of a rectifier (losses are neglected). The rectifier was not modeled in terms of power and cost, because the objective of this study is to optimize the size of the main energy components (PV, batt, WT, DG).
Table 6.
Wind turbine specifications [71,72].
Because of the site area limitations, the maximum number of wind turbines was limited to five units.
The manufacturer’s power curve for the commercial wind turbine was available as an image rather than as a numerical data table. Therefore, piecewise linear interpolation was used to estimate the turbine’s output power.
The site’s DC load-demand data were obtained locally from the controller and remotely from Huawei’s NetEco monitoring system.
The currency of the tables above is in USD. The inflation and discount rates are mentioned in Table 7.
Table 7.
Economical parameters.
Figure 9.
Site data [73].
5.2. Numerical Algorithm
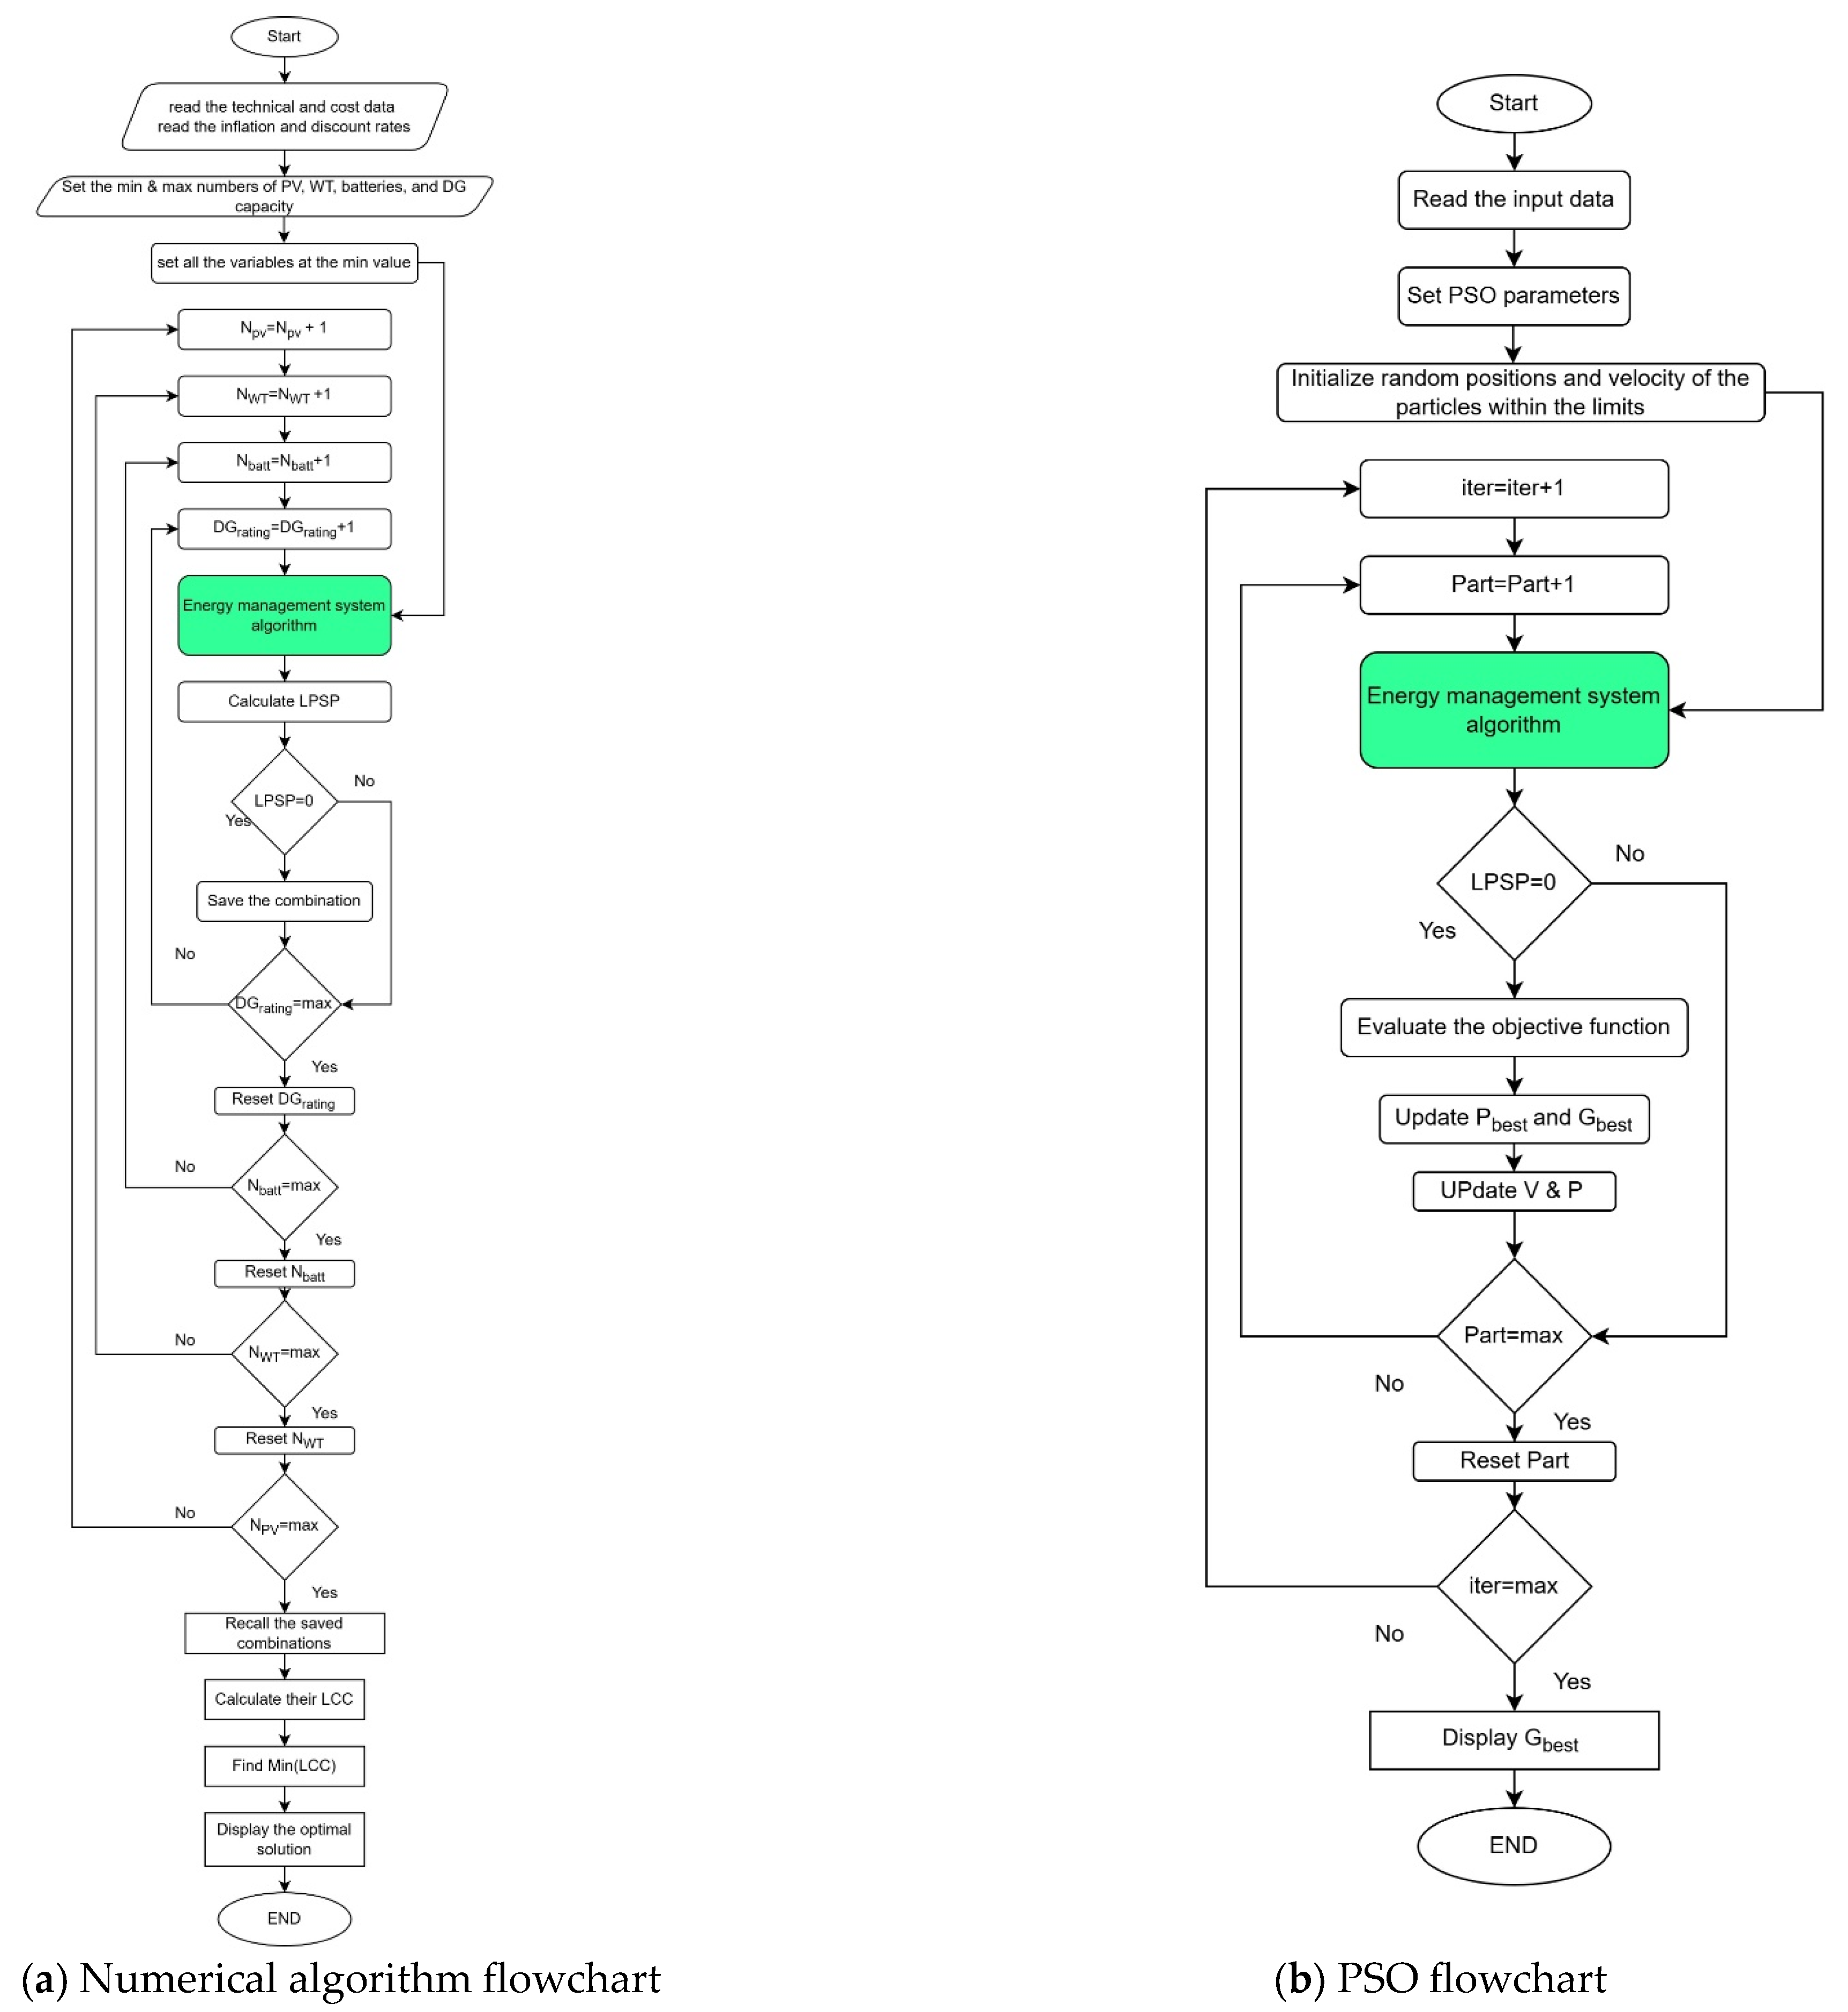
The numerical algorithm is based on an exhaustive enumeration approach. It initiates the optimization by reading the cost data and defining the maximum values of the design variables. Starting from the min values of these variables (1 PV, 1 battery string, 1 WT, and 8 kW DG), the algorithm simulates the hourly operation of each candidate configuration using the EMS described above and calculates its LPSP. The EMS simulation is performed over 8760 h for each candidate configuration (time step of 1 h). The algorithm systematically evaluates all combinations within the predefined search bounds for a total of (100\times3\times5\times2 = 3000) candidate configurations.
For the single-objective optimization, the LCC is calculated only for configurations satisfying the constraint (LPSP = 0). The configuration with the lowest LCC among these feasible candidates is selected as the optimal solution within the specified search space.
For lexicographic optimization, the algorithm first identifies the minimum achievable LPSP and then minimizes the LCC among the configurations attaining that minimum LPSP.
The wind speed was measured at a height of 50 m, which was assumed to correspond to the wind turbine (WT) hub height. The geographical coordinates of the study site are 37.088° N latitude and 6.467° E longitude.
The site’s load-demand data were retrieved from the local controller and the Huawei NetEco remote monitoring system. Access to data was granted following authorization from Algérie Télécom Mobilis. This access was facilitated as one of this study’s contributors was employed by Huawei.
5.3. PSO Algorithm
The particle swarm optimization (PSO) algorithm was implemented using a swarm of 50 particles and a maximum of 50 iterations. The PSO parameters were set to a fixed inertia weight (w = 1.5), a cognitive coefficient (C1 = 1), and a social coefficient (C2 = 0.75). The upper bounds of the design variables were set to 100 PV modules, 03 battery strings, 05 wind turbines (WTs), and a DG rated at 9 kW. The algorithm was applied to the single-objective optimization problem according to the procedure illustrated in Figure 10.
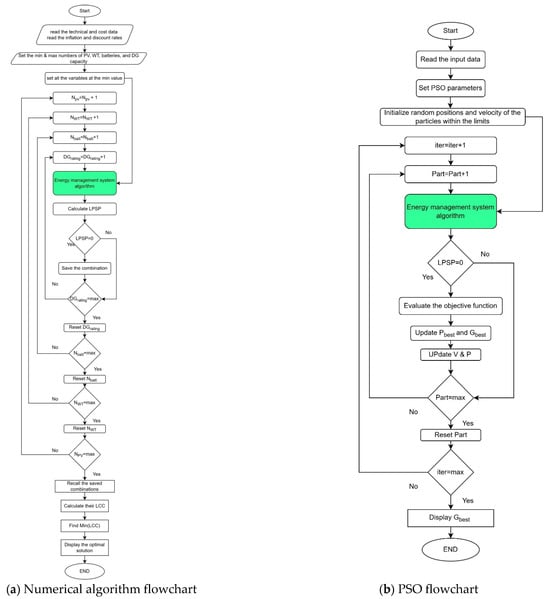
Figure 10.
Flowcharts of the numerical algorithm and PSO algorithm.
The main steps of the PSO algorithm are as follows:
Read the input data of the system.
Initialize the PSO parameters (W, max iteration, population size, C1, and C2).
Randomly initialize the particle positions within the prescribed bounds, with each particle representing a candidate HRES configuration.
Set the initial particle velocities to zero.
Evaluate each initial particle by simulating the energy management strategy (EMS) and calculating the loss of power supply probability (LPSP).
Evaluate the objective function for feasible particles and update the personal-best positions (Pbest) and the global-best position (Gbest) according to the optimization criterion.
Update the velocity and positions of the particle using Equations (22) and (23), respectively.
where:
Vik: the velocity of the particle “i” at iteration “k”.
W: the inertia weight.
C1, C2: acceleration coefficients.
rand: uniformly distributed random number between 0 and 1.
Pbesti: Pbest of particle “i”.
Gbest: global best of the group.
Xik: current position of particle “i” at iteration “k”.
After updating the velocity, the position is updated using Equation (27). However, since the position is an integer value while velocity is a continuous one, the position is discretized using round() function.
If a position falls below its lower bound or above its upper bound, it is set to the corresponding bound limit.
Repeat the particle evaluation and update steps until the maximum number of iterations is reached.
Finally, return the global-best position as the best solution identified by the PSO algorithm.
6. Results and Discussion
The proposed algorithms were implemented in MATLAB R2016a on a laptop equipped with an Intel® Core™ i7-1065G7 processor (1.30 GHz base frequency, 1.50 GHz reported frequency) and 16 GB of RAM, running a 64-bit operating system on an x64-based processor. The results are presented in the following tables:
Table 8 represents the optimal solution found by the exhaustive search algorithm for the single-objective optimization.
Table 8.
The optimal solution of the single-objective exhaustive search algorithm optimization.
During the one-year simulation period, the DG operated for 770 h. Assuming that this annual operating pattern remains representative throughout the 20-year project lifetime, the cumulative operating time would be approximately 15,400 h. According to the adopted replacement assumptions, one DG replacement is considered over the project lifetime.
Compared with the existing system in Table 9, the optimized configuration reduced the total LCC by USD 327,633.79, corresponding to a reduction of approximately 62.34%. The existing system’s LCC is approximately 2.6-times that of the optimized system. This cost reduction is primarily associated with the smaller battery bank and the lower number of DG replacements, together with the overall changes in component sizing and operation resulting from the optimization.
Table 9.
Size and cost of the existing HRES.
The number of PV modules also decreased from 33 to 10, while two wind turbines are incorporated into the optimized configuration to exploit the site’s wind resource.
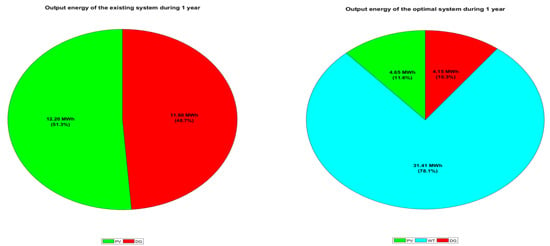
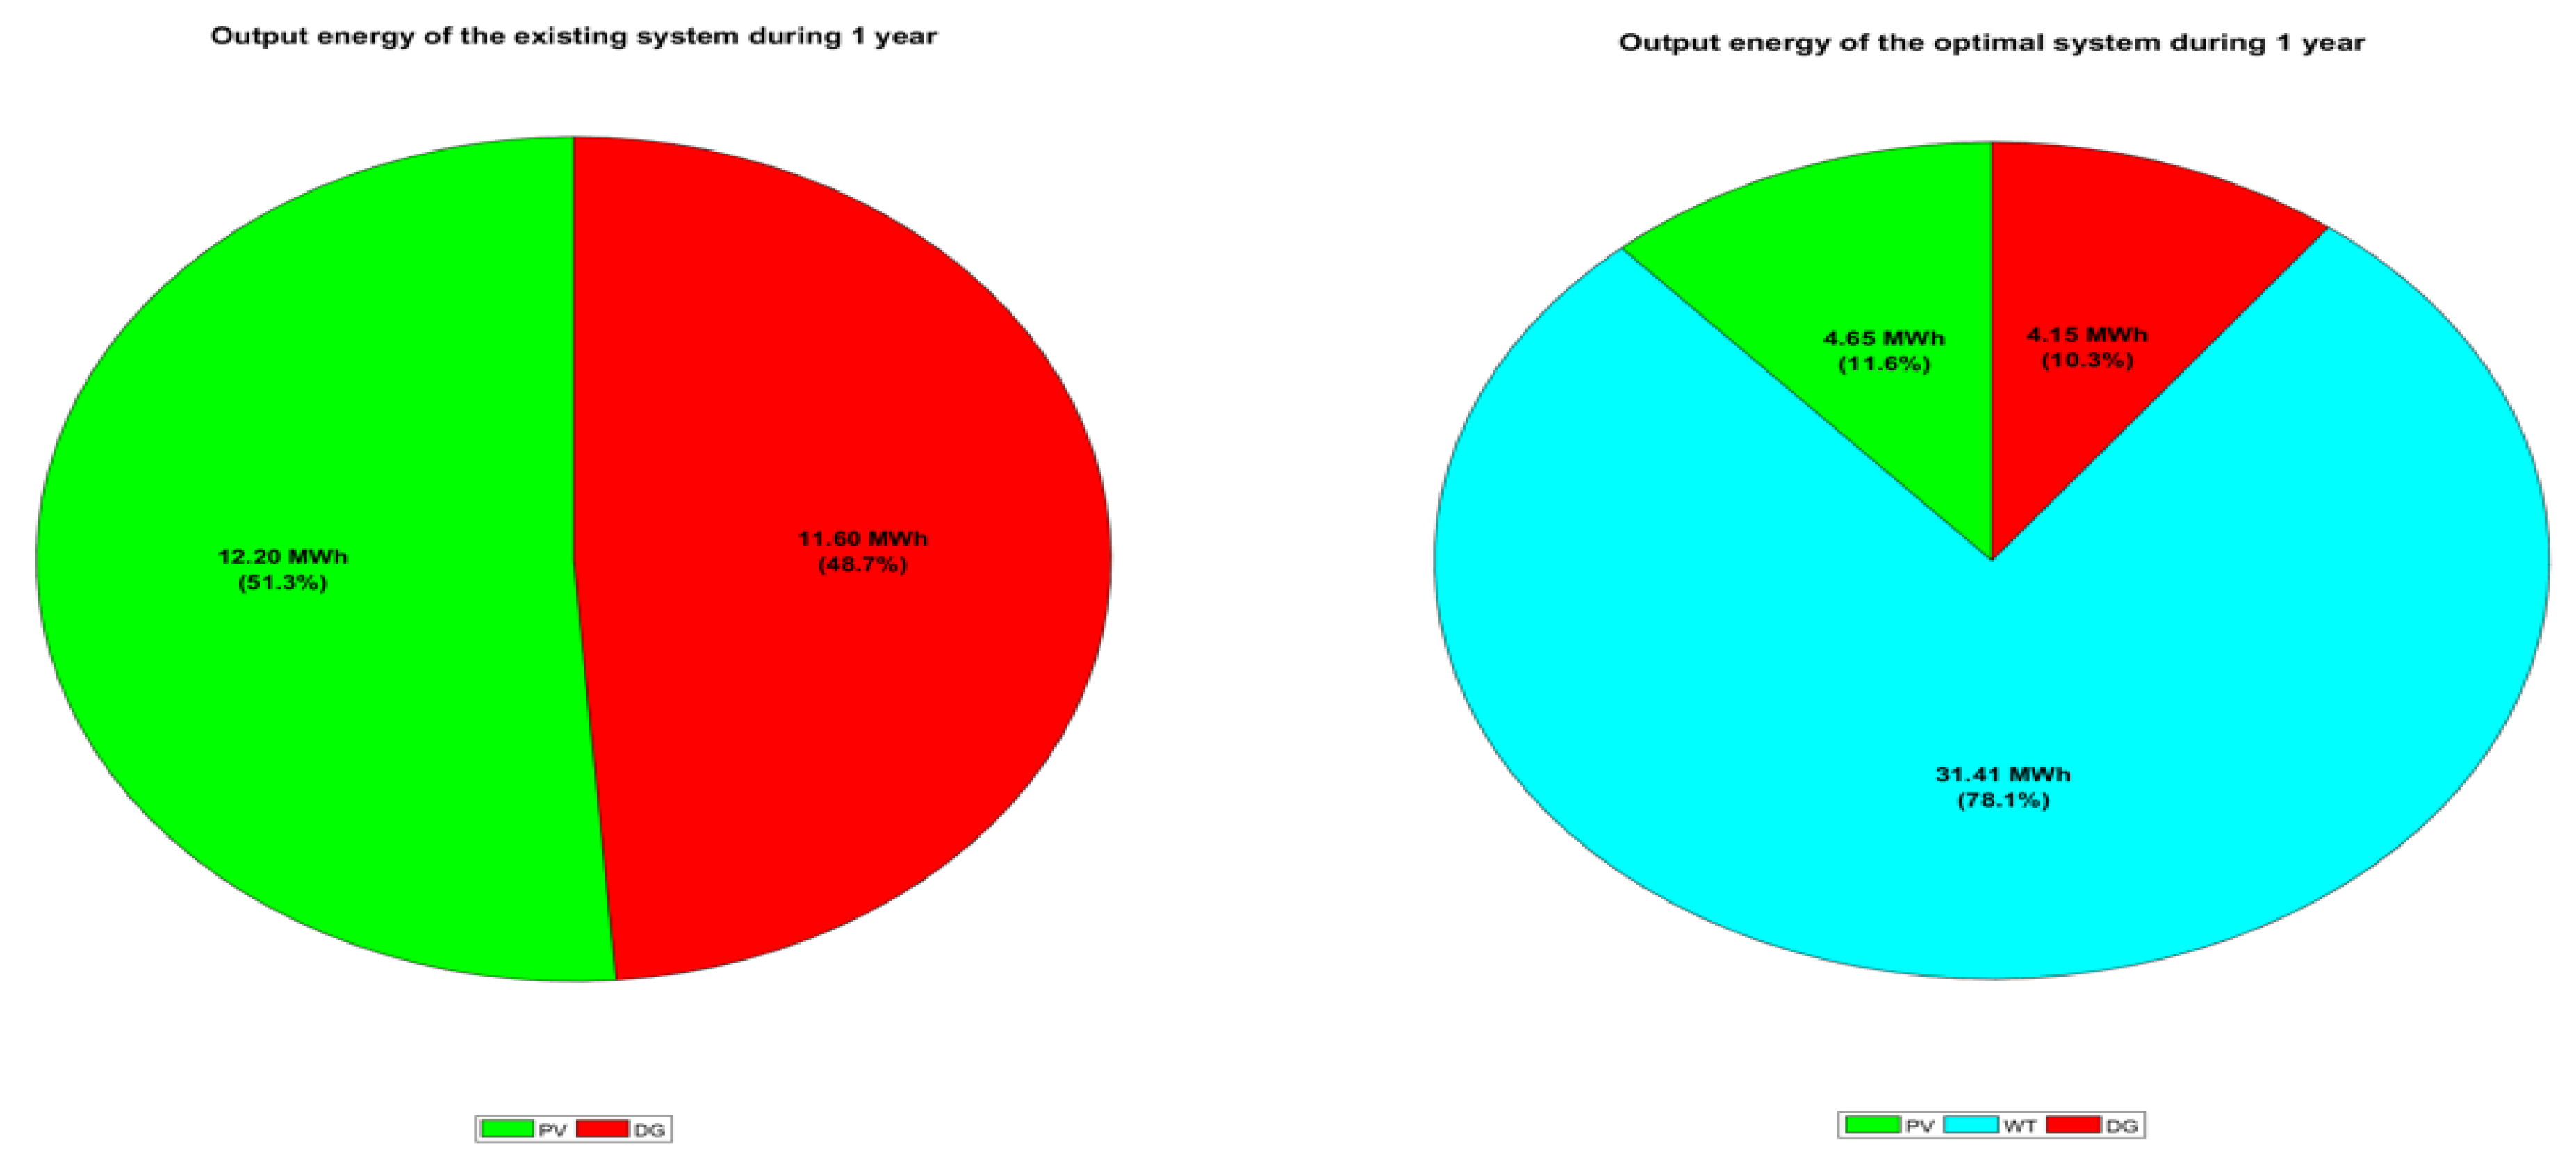
Figure 11 compares the gross annual energy production of the existing system and the optimized one. The optimized PV array produces approximately 4.65 MWh/year, compared with 12.2 MWh/year for the existing array. When normalized by installed PV capacity, these values correspond to specific yields of approximately 1.86 MWh/kW/year for the optimized array and 1.48 MWh/kW/year for the existing array, respectively, although both systems use PV modules with the same technical specifications.
Figure 11.
Power contribution of the energy system components.
Two factors may contribute to this difference. First, there may be an input data error, where the energy estimates are based on different data sources: NASA POWER meteorological data were used for the optimization, whereas the existing system’s PV energy was obtained from the site’s energy-monitoring equipment, which measures the real output power of the PV array. Differences between the meteorological inputs and the conditions represented by the measured data may, therefore, affect the comparability of the results. Second, during the site visit, dust accumulation was observed on the existing PV modules, and a regular maintenance program was reportedly absent. Such soiling can reduce PV output and may partly explain the difference between measured and simulated performance. However, its contribution was not quantified in this study. Consequently, the measured and simulated energy values should not be expected to coincide exactly, particularly because they are based on different data sources and operating conditions.
Regarding the backup source, the optimization identifies an 8 kW DG as sufficient to satisfy the modeled operating and reliability constraints. The optimized DG produces approximately 4.15 MWh/year, compared with approximately 11.6 MWh/year for the existing 14 kW DG, which operates for approximately 1401 h/year. The optimized configuration, therefore, requires 01 DG replacement over the project lifetime, compared with 03 replacements for the existing DG, according to the replacement assumptions used in the LCC calculation. This reduction in the output energy and size of the optimized system is a result of the integration of two 5 kW wind turbines, which generate 31.41 MWh (78.1% of the gross total output energy of the system), due to the significant wind potential at the site location. This wind potential contributed to the reduction in PV system size and BESS capacity.
Therefore, these reductions in the number of PV panels from 33 to 10 and the battery strings from 3 to 1, in addition to the integration of 02 wind turbines, confirm that the existing system was installed without a prior techno-economic assessment.
For PSO, to assess its stochastic variability, 10 independent runs were performed manually in MATLAB using the same algorithmic parameters. The results are summarized in Table 10.
Table 10.
Statistics of the 10 independent PSO runs.
The LCC values obtained across the ten runs ranged from USD 197,879.036 to USD 201,000.475, with a mean of USD 199,037.489 and a sample standard deviation of USD 1096.766. The optimal configuration identified by the exhaustive search algorithm—comprising 10 PV modules, 01 battery string, 02 WTs, and an 8 kW DG—was recovered in 04 of the 10 PSO runs, corresponding to a success rate of 40%. Although the LCC values exhibited relatively low dispersion, PSO did not consistently recover the exhaustive search optimum across the ten runs.
To compare the computational performance of the two algorithms, the mean execution time of the exhaustive search numerical algorithm was calculated from ten independent runs. Its mean computational time was 11.858 s, compared with 8.390 s for PSO, giving a difference of approximately 3.47 s. Thus, PSO was approximately 29.3% faster on average under the tested computational conditions. This difference is consistent with the algorithms’ search strategies: exhaustive search evaluates all 3000 configurations within the prescribed search space, whereas PSO explores the search space using a population of candidate solutions and may not identify the exhaustive search optimum in every run.
The multi-objective lexicographic optimization is performed by the exhaustive search algorithm, as explained above. The resulting optimal configuration comprised 10 PV modules, 02 wind turbines, 01 battery string, and an 8 kW DG. The minimum LPSP equals zero with a corresponding minimum LCC of USD 197,879.036 (Table 11). This configuration is similar to the one obtained through the single-objective optimization. This indicates that this configuration is non-dominated over the search space.
Table 11.
Multi-objective numerical algorithm optimal solution.
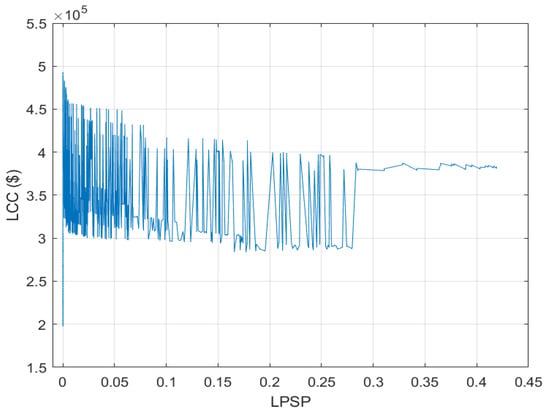
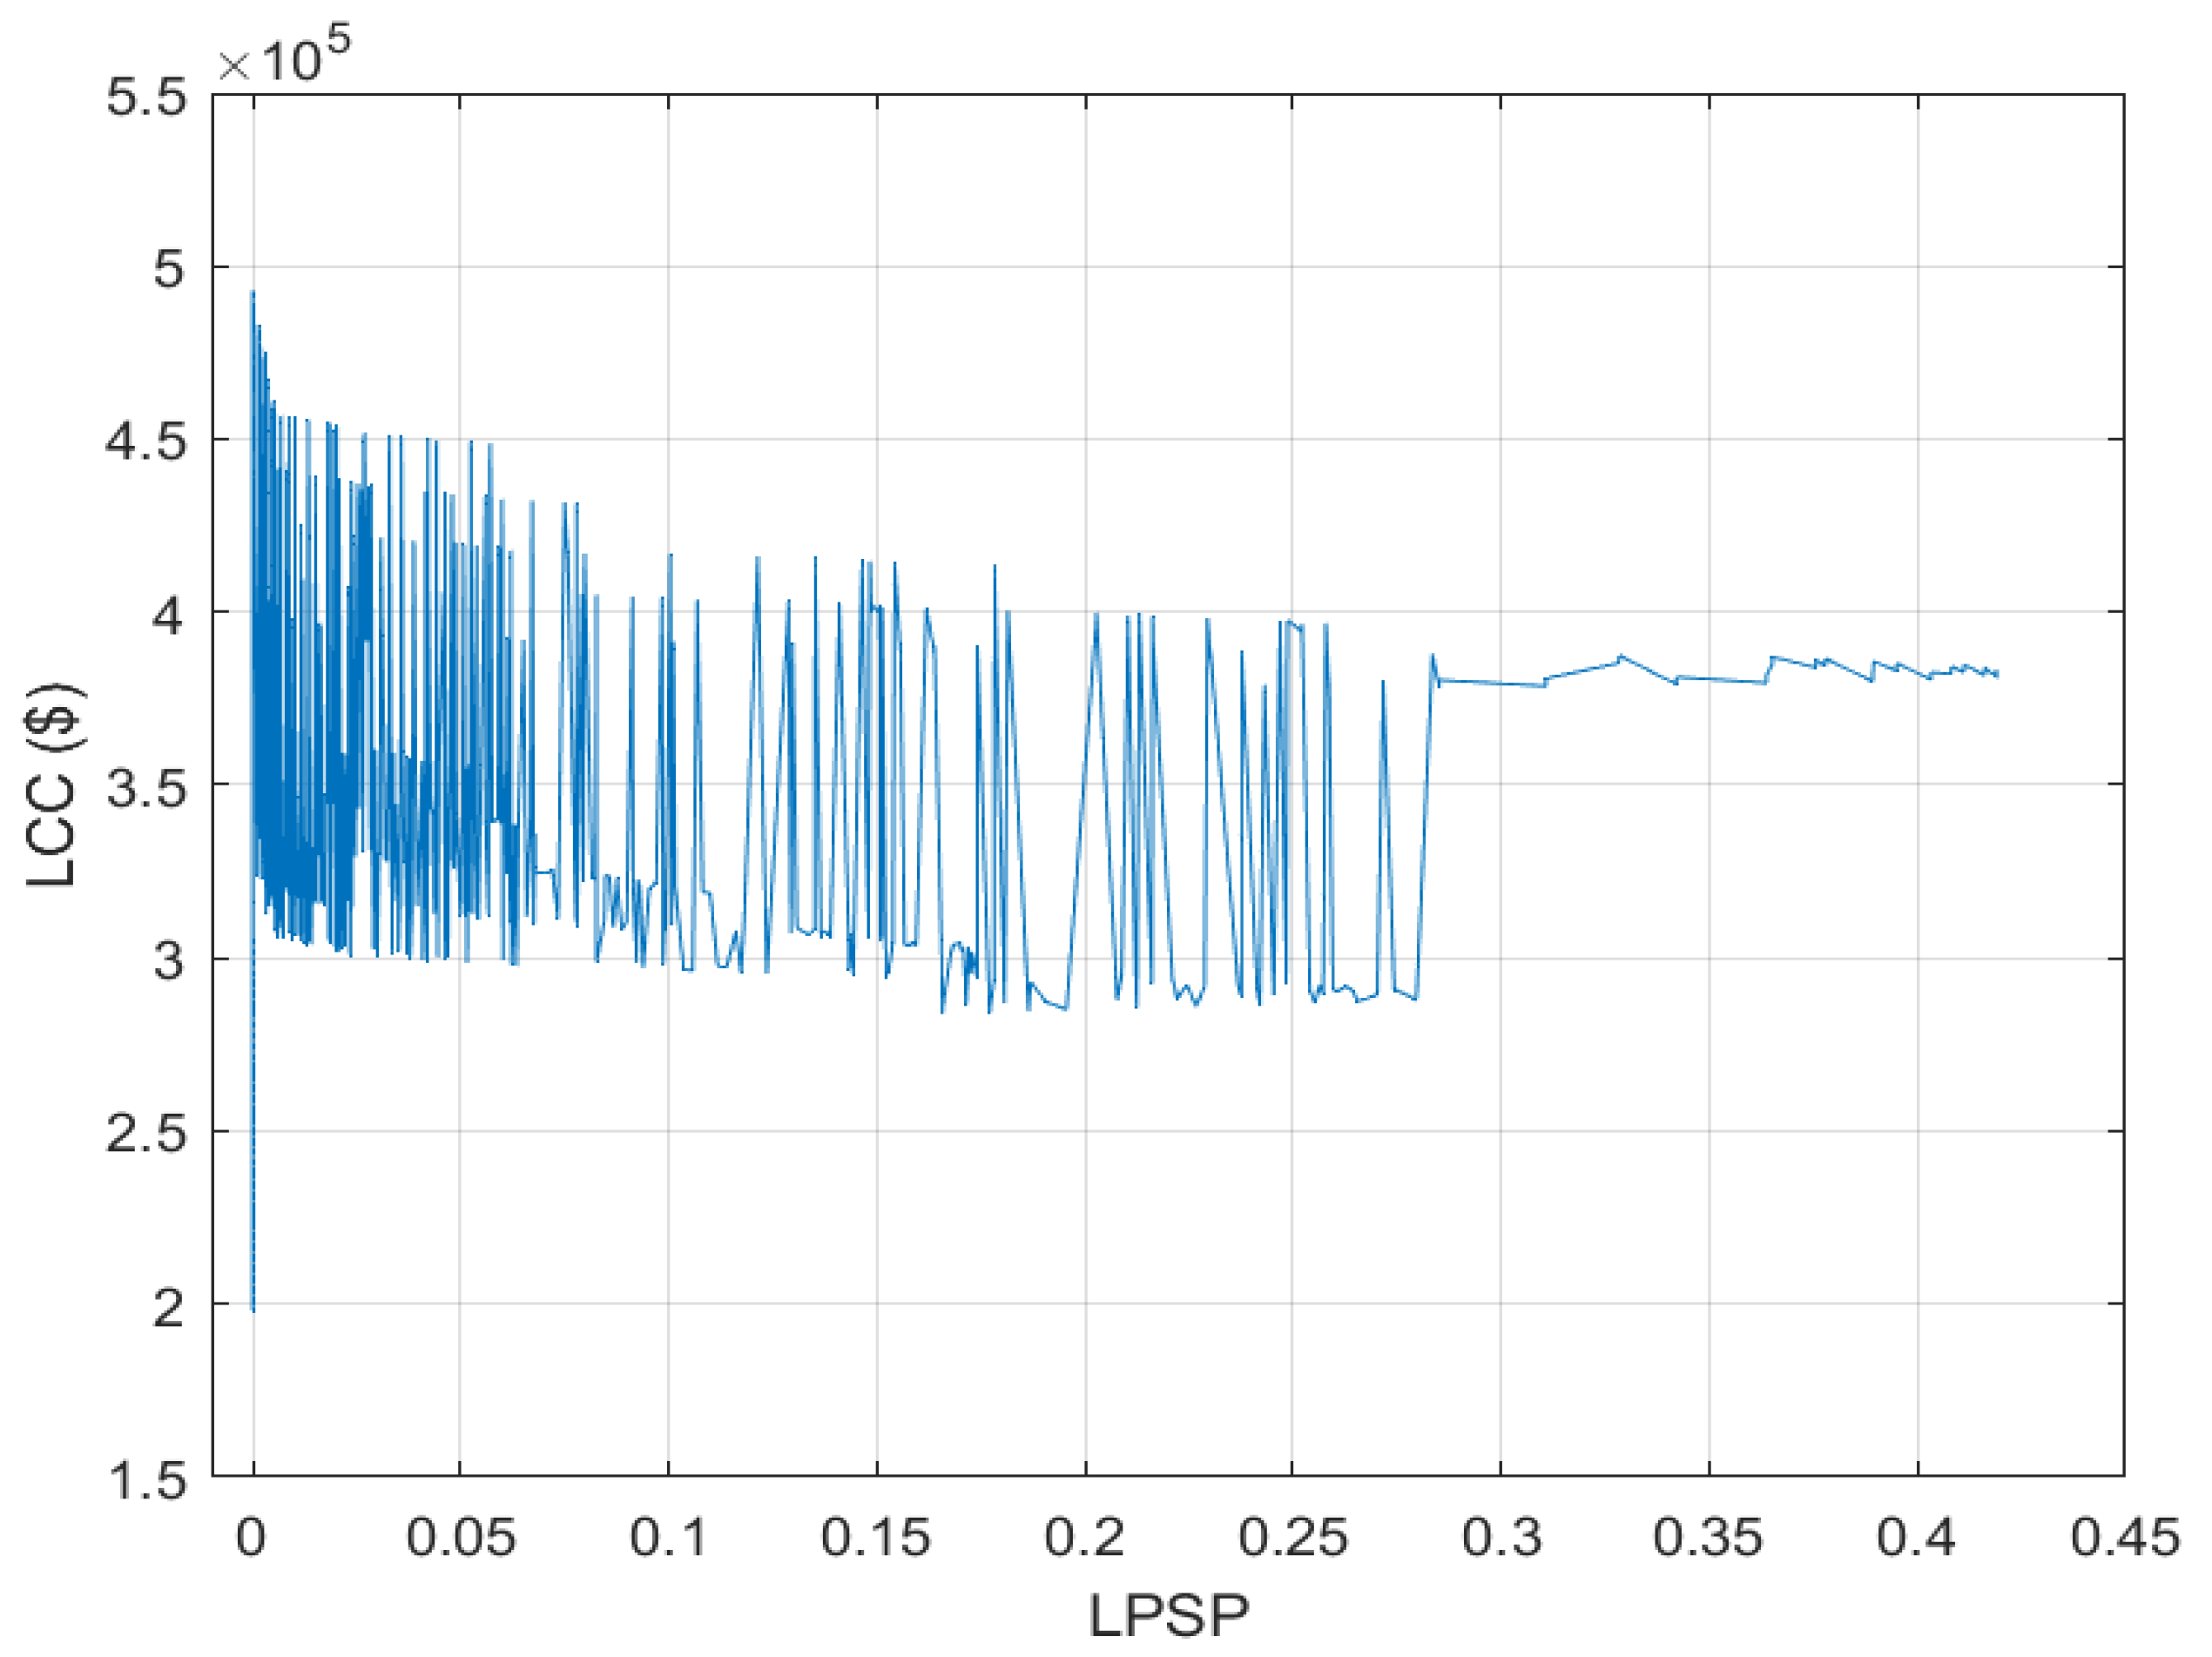
Figure 12 presents a cost–reliability trade-off obtained from the lexicographic optimization. This trend can be divided based on LPSP to three regions:
Figure 12.
Multi-objective LPSP-LCC trade-off.
- LPSP = 0
Many configurations achieved zero LPSP, with substantial variation in the cost as a result of the variation in combination sizing. This value is achieved by the optimal solution corresponding to the lowest cost and by the worst-case configuration, which consists of the maximum number of all elements (100 PV, 5 WT, 3 BESS, 9 kW DG) corresponding to the highest cost of USD 492,952.24. As the number of each variable is reduced from the upper bound, the LCC is reduced. These results demonstrate that multiple configurations can achieve zero LPSP at substantially different lifecycle costs.
- 2.
- 0 < LPSP ≤ 0.28:
In this region, the LCC values exhibit substantial fluctuations. One factor that causes this behavior is the role of the battery string and the DG; i.e., the BESS serves as a power supplier during the discharge phase and as a load from the DG role during the charging phase. So, in certain configurations, the DG output is insufficient to meet the combined demand of the load and the expensive battery strings, leading to higher energy deficit and higher cost. For example, at LPSP of 0.001, LCC equals USD 323,982.03 corresponding to 86 PV, 01 WT, 02 BESS, and a 9kW DG configuration. For an LPSP of 0.0025, LCC is equal to USD 408,494.04 corresponding to 67 PV, 01 WT, 03 BESS, and a 9kW DG. So, although LPSP increased, LCC did not decrease as expected, because the deficit of energy is caused by the increase in the storage capacity, such that the 9 kW DG is unable to charge this BESS and supply the load simultaneously (overload protection). Therefore, the increased size of battery strings in this configuration led to an increase in the cost without improving reliability.
Another example of consecutive LPSP is shown in Table 12:
Table 12.
System configurations and LCCs of two consecutive values of LPSP.
- 3.
- 0.28 < LPSP ≤ 0.419:
This region corresponds to the highest LPSP values observed in the evaluated configurations, reaching a maximum of 0.419. The reported LCC trend in this region is relatively stable, with only minor fluctuations resulting from the stability of the size of the BESS and the wind turbines. All configurations in this region comprise 03 battery strings and 01 WT, while the numbers of PV modules and the DG rated power vary. Therefore, the cost is dominated by the subsystem’s BESS and wind turbine, while the reliability is dominated by the PV and DG subsystems.
However, despite the fluctuations observed in the individual points, the overall curve tends to decrease gradually in cost as LPSP increases. This can be observed when looking separately at the top and bottom envelopes of the curve across the x-axis. This global behavior aligns a bit with the expected economic–reliability trade-off.
To examine the sensitivity of the optimization results to the initial state of charge (SOC) of the storage system, additional simulations were performed using initial SOC values of 100%, 80%, 70%, 60%, and 40%. The results show that the initial SOC did not change the optimal configuration across the tested values. Accordingly, the LCC and LPSP remained unchanged in these simulations. However, the initial SOC slightly affected the amount of excess energy, particularly at the beginning of the simulation period. Since excess energy is neither an objective function nor an optimization constraint in the present study, this variation did not affect the selection of the optimal system based on LCC and LPSP.
7. Conclusions
This study investigated the techno-economic optimization of a standalone hybrid renewable energy system (HRES) supplying the 4G mobile telecommunication station in Bougaroun, Skikda, Algeria. An energy management system (EMS) incorporating battery charging constraints was implemented to simulate the hourly operation of candidate configurations over an 8760 h period. The system was optimized using an exhaustive search numerical algorithm and particle swarm optimization (PSO) for the single-objective problem, while a lexicographic approach was used for the multi-objective optimization to prioritize reliability over lifecycle cost (LCC).
The exhaustive search algorithm identified an optimal configuration comprising 10 PV modules, 2 × 5 kW WTs, 01 battery string, and an 8 kW DG. This configuration achieved an LPSP of zero and an LCC of USD 197,879.04, compared with USD 525,512.83 for the existing system. The resulting cost reduction was approximately 62.34%. The optimized configuration also incorporated wind generation, through 02 WTs, producing approximately 31.41 MWh annually. These results demonstrate the economic potential of optimizing component sizing and integrating wind generation into the investigated telecommunication power system, subject to the adopted technical and economic assumptions.
The single-objective exhaustive search algorithm and the lexicographic optimization produced the same optimal configuration. This result confirms that, within the investigated search space, the minimum-cost configuration is non-dominated. The comparison between exhaustive search and PSO showed that PSO had a lower mean execution time, at 8.390 s compared with 11.858 s for exhaustive search. However, PSO recovered the global optimum in only four of the ten independent runs. Therefore, although PSO reduced the average computational time under the tested conditions, exhaustive search provided a systematic evaluation of all 3000 candidate configurations and established the optimum within the specified bounds.
Several limitations should be considered when interpreting these results. The optimal configuration is conditional on the prescribed design-variable bounds, the input data for the simulated year, the component models, available prices, and the adopted economic assumptions. Also, converter and rectifier losses and costs were neglected.
Author Contributions
All authors contributed to this work, where they agreed on the subject and roadmap of the paper. I.L.M. collected the data and chose the method of optimization. A.M. and S.B. worked on the management strategy and results analysis. R.A., A.A., H.H.H., B.A., N.T. and M.K. contributed to validation, writing-review and editing, supervision, visualization, software, funding acquisition, and project administration. All authors have read and agreed to the published version of the manuscript.
Funding
This research work was funded by Umm Al-Qura University, Saudi Arabia under grant number: 26UQU4470020GSSR04.
Data Availability Statement
The data used are presented in Figure 9, and links to download them are referred in the text.
Acknowledgments
The authors extend their appreciation to Umm Al-Qura University, Saudi Arabia for funding this research work through grant number: 26UQU4470020GSSR04.
Conflicts of Interest
The authors declare no conflict of interest.
Abbreviations
The following abbreviations are used in this manuscript:
| HRES | Hybrid renewable energy system |
| Batt | Battery |
| LCC | Lifecycle cost |
| LOLP | Loss of load probability |
| BTS | Base transceiver station |
| 2G | 2nd generation |
| 3G | 3rd generation |
| 4G | 4th generation |
| 5G | 5th generation |
| DC | Direct current |
| DG | Diesel generator |
| HOMER | Hybrid optimization model for multiple energy resources |
| TNPC | Total net present cost |
| LCOE | Levelized cost of energy |
| P V | Photovoltaic |
| WT | Wind turbine |
| NSGA | Non-dominant sorting genetic algorithm |
| MOSSA | Multi-objective salp swarm algorithm |
| MODA | Multi-objective dragonfly algorithm |
| MOALO | Multi-objective ant lion optimizer |
| MOGOA | Multi-objective grasshopper optimization algorithm |
| COA | Coyote Optimization Algorithm |
| GWO | Grey Wolf Optimizer |
| HHO | Harris Hawks Optimization |
| ACO | Ant colony optimization |
| ES | Exhaustive search technique |
| O&M | Operation and maintenance |
| SD | Standard deviation |
| ALO | Ant lion optimization |
| ASO | Atom search optimization |
| SOC | State of charge |
| ABC | Artificial bee colony |
| PO | Pareto optimization |
| STC | Standard test condition |
| ANN | Artificial neuron network |
| FL | Fuzzy logic |
| AI | Artificial intelligence |
| PSO | Particle swarm optimization |
| GA | Genetic algorithm |
| MPEDE | Multi-population Ensemble Differential Evolution |
| DOD | Depth of discharge |
| BSA | Bird swarm algorithm |
| EMS | Energy management system |
| LPSP | Loss of power supply probability |
References
- Widjonarko, A.C.; Budi, U.S.; Setiawan, A.; Rudiyanto, B. A control strategy for hybrid energy source in backbone base transceiver station using artificial neural network: A case study of Penajam, Indonesia. Int. J. Energy Environ. Eng. 2020, 11, 405–416. [Google Scholar] [CrossRef] [Scilit]
- Gabour, A.; Metatla, A.; Kelaiaia, R.; Bourennani, F.; Kerboua, A. Recent Bibliography on the Optimization of Multi-source Energy Systems. Arch. Comput. Methods Eng. 2019, 26, 809–830. [Google Scholar] [CrossRef] [Scilit]
- Siyoucef, H.; Benameur, A.; Djilani, K.Y.I.; Ghouali, S.; Merabet, B.; Motahhir, S. Performance Analysis and Techno-Economic Optimization of Green Energy Systems for Remote Areas in the Maghreb. Technol. Econ. Smart Grids Sustain. Energy 2021, 6, 12. [Google Scholar] [CrossRef] [Scilit]
- HOMER software. Available online: https://www.homerenergy.com (accessed on 5 June 2025).
- Kaur, R.; Krishnasamy, V.; Kandasamy, N.K. Optimal sizing of wind–PV-based DC microgrid for telecom power supply in remote areas. IET Renew. Power Gener. 2018, 10, 859–866. [Google Scholar] [CrossRef] [Scilit]
- Adeyemo, A.A.; Amusan, O.T. Modelling and multi-objective optimization of hybrid energy storage solution for photovoltaic powered off-grid net zero energy building. J. Energy Storage 2022, 55, 105273. [Google Scholar] [CrossRef] [Scilit]
- Bouaouda, A.; Sayouti, Y. Hybrid Meta-Heuristic Algorithms for Optimal Sizing of Hybrid Renewable Energy System: A Review of the State-of-the-Art. Arch. Comput. Methods Eng. 2022, 29, 4049–4083. [Google Scholar] [CrossRef] [Scilit]
- Krishan, O.; Sathans, S. Techno-economic analysis of a hybrid renewable energy system for an energy poor rural community. J. Energy Storage 2019, 23, 305–319. [Google Scholar] [CrossRef] [Scilit]
- Belboul, Z.; Toual, B.; Kouzou, A.; Mokrani, L.; Bensalem, A.; Kennel, R.; Abdelrahem, M. Multi-objective Optimization of a Hybrid PV/Wind/Battery/Diesel Generator System Integrated in Microgrid: A Case Study in Djelfa, Algeria. Energies 2022, 15, 3579. [Google Scholar] [CrossRef] [Scilit]
- Mirjalili, S.; Gandomi, A.H.; Mirjalili, S.Z.; Saremi, S.; Fares, H.; Mirjalili, S.M. Salp Swarm Algorithm: A bio-inspired optimizer for engineering design problems. Adv. Eng. Softw. 2017, 114, 163–191. [Google Scholar] [CrossRef] [Scilit]
- Mirjalili, S. Dragonfly algorithm: A new meta-heuristic optimization technique for solving single-objective, discrete, and multi-objective problems. Neural Comput. Appl. 2016, 27, 1053–1073. [Google Scholar] [CrossRef] [Scilit]
- Mirjalili, S.; Jangir, P.; Saremi, S. Multi-objective ant lion optimizer: A multi-objective optimization algorithm for solving engineering problems. Appl. Intell. 2017, 46, 79–95. [Google Scholar] [CrossRef] [Scilit]
- Mirjalili, S.Z.; Mirjalili, S.; Saremi, S.; Faris, H.; Aljarah, I. Grasshopper optimization algorithm for multi-objective optimization problems. Appl. Intell. 2018, 48, 805–820. [Google Scholar] [CrossRef] [Scilit]
- Farshid, F.; Mousavi, G.S.M.; Shokri-Ghaleh, H. A Comparative Study of Recent Optimization Methods for Optimal Sizing of a Green Hybrid Traction Power Supply Substation. Arch. Comput. Methods Eng. 2020, 28, 2351–2370. [Google Scholar] [CrossRef] [Scilit]
- Ma, T.; Yang, H.; Lu, L.; Peng, J. An optimization sizing model for solar photovoltaic power generation system with pumped storage. Energy Procedia 2014, 61, 5–8. [Google Scholar] [CrossRef] [Scilit]
- Jie, B.; Yong, Z. An improved atom search optimization for optimization tasks. Multimed. Tools Appl. 2022, 82, 6375–6429. [Google Scholar] [CrossRef] [Scilit]
- Xiaoyan, M.; Yunfei, M.; Yu, Z.; Chenxi, Z.; Shurong, L.; Xinyang, J.; Meng, C. Multi-objective microgrid optimal dispatching based on improved bird swarm algorithm. Glob. Energy Interconnect. 2022, 5, 154–167. [Google Scholar] [CrossRef] [Scilit]
- Zhi, Y.; Weiqing, W.; Haiyun, W.; Yildizbasi, A. Developed Coyote Optimization Algorithm and its application to optimal parameters estimation of PEMFC model. Energy Rep. 2020, 6, 1106–1117. [Google Scholar] [CrossRef] [Scilit]
- Faris, H.; Aljarah, I.; Al-Betar, M.A.; Mirjalili, S. Grey wolf optimizer: A review of recent variants and applications. Neural Comput. Appl. 2017, 30, 413–435. [Google Scholar] [CrossRef] [Scilit]
- Shehab, M.; Mashal, M.; Momani, Z.; Shambour, M.K.Y.; AL-Badareen, A.; Al-Dabet, S.; Bataina, N.; Ratib Alsoud, A.; Abualigah, L. Harris Hawks Optimization Algorithm: Variants and Applications. Arch. Comput. Methods Eng. 2022, 29, 5579–5603. [Google Scholar] [CrossRef] [Scilit]
- Ahmed, E.Z.; Saeed, A.R.; Amitava, M.; Sheetal, N.G. Energy optimization in low-power wide area networks by using heuristic techniques. In LPWAN Technol. IoT M2M Appl., 1st ed.; Academic press (Elsevier): London, United Kingdom, 2020; pp. 199–223. [Google Scholar]
- Xiaoyu, L.; Lei, W.; Qiaoyong, J.; Ning, L. Differential evolution algorithm with multi-population cooperation and multi-strategy integration. Neurocomputing 2021, 421, 285–302. [Google Scholar] [CrossRef] [Scilit]
- Hazem Mohammed, O.; Amirat, Y.; Benbouzid, M. Particle Swarm Optimization of a Hybrid Wind/Tidal/PV/Battery Energy System. Application To a Remote Area In Bretagne, France. Energy Procedia 2019, 162, 87–96. [Google Scholar] [CrossRef] [Scilit]
- Solar Panel Directory. Available online: https://www.enfsolar.com/pv/panel-datasheet/crystalline/18381 (accessed on 21 October 2026).
- SCRIBD. Digital Documents and E-Books Platform. Available online: https://www.scribd.com/document/446365457/TCB-650A-Datasheet-01-20160606-pdf# (accessed on 26 July 2026).
- Louahem M’sabah, I.; Benzahioul, S.; Djeghader, R.; Metatla, A. Evaluation and development of a hybrid renewable energy system for the remote telecommunication station of Bougaroun, Collo, Algeria. Sci. Bull. Electr. Eng. Fac. 2022, 22, 1–8. [Google Scholar] [CrossRef] [Scilit]
- Velukutty, K.N.K.; Sundararajan, D.; Krishnappa, M.R.; Angappan, S.K.; Premalatha, M.; Sivaraju, S.S.; Usha, S. Enhancing energy management and power quality in grid-connected photovoltaic systems through ESS and STATCOM integration. Int. J. Adv. Manuf. Technol. 2025. [Google Scholar] [CrossRef] [Scilit]
- ScienceDirect. Lexicographic Method. A Survey of Multi-Objective Optimization Methods and Their Applications for Nuclear Scientists and Engineers. Available online: https://www.sciencedirect.com/topics/engineering/lexicographic-method (accessed on 21 October 2026).
- Mobilis. Algeria Mobile Telecommunication Company. Available online: https://www.mobilis.dz/ (accessed on 27 July 2023).
- Bhandari, B.; Tae, L.K.; Lee, G.Y.; Cho, Y.M.; Ahn, S.H. Optimization of Hybrid Renewable Energy Power Systems: A Review. Int. J. Precis. Eng. Manuf.-Green Technol. 2015, 2, 99–112. [Google Scholar] [CrossRef] [Scilit]
- Wicaksono, H.; Trat, M.; Bashyal, A.; Boroukhian, T.; Felder, M.; Ahrens, M.; Bender, J.; Grob, S.; Steiner, D.; July, C.; et al. Artificial-intelligence-enabled dynamic demand response system for maximizing the use of renewable electricity in production processes. Int. J. Adv. Manuf. Technol. 2025, 138, 247–271. [Google Scholar] [CrossRef] [Scilit]
- Karabacaka, K.; Cetin, N. Artificial neural networks for controlling wind–PV power systems: A review. Renew. Sustain. Energy Rev. 2014, 29, 804–827. [Google Scholar] [CrossRef] [Scilit]
- Xinghua, G.; Lei, Z.; Qun, G.; Babak, D.R. An optimal size selection of hybrid renewable energy system based on Fractional-Order Neural Network Algorithm: A case study. Energy Rep. 2021, 7, 7261–7272. [Google Scholar] [CrossRef] [Scilit]
- Feddaoui, O.; Toufouti, R.; Labed, J.; Meziane, S. Fuzzy logic control of hybrid systems including renewable energy in microgrids. Int. J. Electr. Comput. Eng. 2020, 10, 55–59. [Google Scholar] [CrossRef] [Scilit]
- Javad, K. Pareto-Based Optimization. In Advanced Decision Making for HVAC Engineers, 1st ed.; Springer: Cham, Switzerland, 2016; pp. 99–115. [Google Scholar]
- RETScreen. Natural Resources Canada. Available online: https://www.rncan.gc.ca/cartes-outils-et-publications/outils/outils-modelisation/retscreen/7466 (accessed on 29 July 2023).
- PVsyst. Photovoltaic Software. Available online: https://www.pvsyst.com/ (accessed on 21 October 2026).
- University of Zaragoza. iHOGA. Available online: https://ihoga.unizar.es/ (accessed on 21 October 2026).
- Arab, A.H.; Taghezouit, B.; Abdeladim, K.; Semaoui, S.; Razagui, A.; Gherbi, A.; Boulahchiche, S.; Hadj Mahammed, I. Maximum power output performance modeling of solar photovoltaic modules. Energy Rep. 2020, 6, 680–686. [Google Scholar] [CrossRef] [Scilit]
- Bakhtiari, H.; Naghizadeh, R.A. Multi-criteria optimal sizing of hybrid renewable energy systems including wind, photovoltaic, battery, and hydrogen storage with ɛ-constraint method. Inst. Eng. Technol. 2018, 12, 883–892. [Google Scholar] [CrossRef] [Scilit]
- Al-Ghussain, L.; Humayun, A.; Haneef, F. Optimization of hybrid PV-wind system: Case study Al-Tafilah cement factory, Jordan. Sustain. Energy Technol. Assess. 2018, 30, 24–36. [Google Scholar] [CrossRef] [Scilit]
- Bilal, B.O.; Sambou, V.; Ndiaye, B.A.; Kébé, C.M.F. Multi-objective Design of PV-Wind- Batteries Hybrid Systems by Minimizing the Annualized Cost System and the Loss of Power Supply Probability (LPSP). In Proceedings of the 2013 IEEE International Conference on Industrial Technology (ICIT), Cape Town, South Africa, 25–28 February 2013; pp. 861–868. [Google Scholar]
- Haider, I.; Nader, A. Variations of PV module parameters with irradiance and temperature. In Proceedings of the 9th International Conference on Sustainability in Energy and Buildings, Chania, Crete, Greece, 5–7 July 2017; pp. 276–285. [Google Scholar]
- Mattei, M.; Notton, C.C.; Muselli, M.; Poggi, P. Calculation of the polycrystalline PV module temperature using a simple method of energy balance. Renew. Energy 2006, 31, 553–567. [Google Scholar] [CrossRef] [Scilit]
- Lydia, M.; Suresh, K.S.; Immanuel, S.A.; Edwin, P.K.G. A comprehensive review on wind turbine power curve modeling techniques. Renew. Sustain. Energy Rev. 2013, 30, 452–460. [Google Scholar] [CrossRef] [Scilit]
- Madani, L.T.; Champenoisa, G.; Mostefaic, M. Economic and ecological optimization of multi-source systems under the variability in the cost of fuel. Energy Convers. Manag. 2018, 177, 161–175. [Google Scholar] [CrossRef] [Scilit]
- Sanchez, V.M.; Chavez-Ramirez, A.U.; Duron-Torres, S.M.; Hernandez, J.; Arriaga, L.G.; Ramirez, J.M. Techno-economical optimization based on swarm intelligence algorithm for a stand-alone wind-photovoltaic-hydrogen power system at south-east region of Mexico. Int. J. Hydrogen Energy 2014, 39, 16646–16655. [Google Scholar] [CrossRef] [Scilit]
- Fathy, A. A reliable methodology based on mine blast optimization algorithm for optimal sizing of hybrid PV-wind-FC system for remote area in Egypt. Renew. Energy 2016, 95, 367–380. [Google Scholar] [CrossRef] [Scilit]
- Kit, G.L.; Shek, J.K.H.; Mueller, M.A. Hybrid wind–photovoltaic–diesel–battery system sizing tool development using empirical approach, life-cycle cost and performance analysis: A case study in Scotland. Energy Convers. Manag. 2015, 106, 479–494. [Google Scholar] [CrossRef] [Scilit]
- Abbes, D.; Martinez, A.; Champenois, G. Eco-design optimisation of an autonomous hybrid wind–photovoltaic system with battery storage. IET Renew. Power Gener. 2012, 65, 358–371. [Google Scholar] [CrossRef] [Scilit]
- Emad, D.; El-Hameed, M.A.; Yousef, M.T.; El-Fergany, A.A. Computational Methods for Optimal Planning of Hybrid Renewable Microgrids: A Comprehensive Review and Challenges. Arch. Comput. Methods Eng. 2019, 27, 1297–1319. [Google Scholar] [CrossRef] [Scilit]
- Mahesh, A.; Sandhu, K.S. A genetic algorithm based improved optimal sizing strategy for solar-wind-battery hybrid system using energy filter algorithm. Front. Energy 2017, 14, 139–151. [Google Scholar] [CrossRef] [Scilit]
- Mohamed-Abdelaziz, M.; Eltamaly, A.M. Modeling of Hybrid Renewable Energy System. In Systems, Decision and Control; Kacprzyk, J., Ed.; Springer: Cham, Switzerland, 2017; Volume 121, pp. 11–21. [Google Scholar]
- Mahmoud, F.S.; Zaki Diab, A.A.; Ali, Z.M.; El-Sayed, A.M.; Alquthami, T.; Ahmed, M.; Ramadan, H.A. Optimal sizing of smart hybrid renewable energy system using different optimization algorithms. Energy Rep. 2022, 8, 4935–4956. [Google Scholar] [CrossRef] [Scilit]
- Sari, A.; Majdi, A.; Catalan, O.M.J.; Timoshin, A.; Ngoc, H.D.T.; Trung, N.D.; Alsaikhan, F.; Hammid, A.T.; Akhmedov, A. New optimized configuration for a hybrid PV/diesel/battery system based on coyote optimization algorithm: A case study for Hotan county. Energy Rep. 2022, 8, 15480–15492. [Google Scholar] [CrossRef] [Scilit]
- Adedoja, O.S.; Babatunde, D.E.; Babatunde, O.M. Hybrid Power System for a Fuel Station Considering Temperature Coefficient. Int. J. Energy Econ. Policy 2020, 10, 476–482. [Google Scholar] [CrossRef] [Scilit]
- Obaro, A.Z.; Munda, J.L.; Yusuff, A.A. Modelling and Energy Management of an Off-Grid Distributed Energy System: A Typical Community Scenario in South Africa. Energies 2023, 2, 693. [Google Scholar] [CrossRef] [Scilit]
- Kaabeche, A.; Diaf, S.; Ibtiouen, R. Firefly-inspired algorithm for optimal sizing of renewable hybrid system considering reliability criteria. Sol. Energy 2017, 155, 727–738. [Google Scholar] [CrossRef] [Scilit]
- Paragond, L.R.S.; Kurian, C.P.K.; Singh, B.K. Optimization and LifeCycle Cost Analysis of Renewable Energy Supply Options for Academic Buildings—A Case Study. Int. J. Energy Econ. Policy 2019, 9, 224–236. [Google Scholar] [CrossRef] [Scilit]
- Jijian, L.; Yusheng, Z.; Chao, M.; Yang, Y.; Evance, C. A review on recent sizing methodologies of hybrid renewable energy systems. Energy Convers. Manag. 2019, 199, 112027. [Google Scholar] [CrossRef] [Scilit]
- Ranjay, S.; Ramesh, C.B. Review of HRESs based on storage options, system architecture and optimisation criteria and methodologies. IET Renew. Power Gener. 2018, 12, 747–760. [Google Scholar] [CrossRef] [Scilit]
- Olatomiwa, L.; Mekhilef, S.; Huda, A.; Ohunakin, O.S. Economic evaluation of hybrid energy systems for rural electrification in six geo-political zones of Nigeria. Renew. Energy 2015, 83, 435–446. [Google Scholar] [CrossRef] [Scilit]
- Rehman, S.; Rahman, H.U.; Wang, S.; Büker, M.S.; Alhems, L.M.; AL-Garni, H.Z. Optimal Design and Model Predictive Control of Standalone HRES: A Real Case Study for Residential Demand Side Management. IEEE Access 2020, 8, 29767–29814. [Google Scholar] [CrossRef] [Scilit]
- Kavadias, K.A.; Triantafyllou, P. Hybrid Renewable Energy Systems’ Optimisation. A Review and Extended Comparison of the Most-Used Software Tools. Energies 2021, 14, 8268. [Google Scholar] [CrossRef] [Scilit]
- Stoppato, A. Lifecycle assessment of photovoltaic electricity generation. Energy 2008, 33, 224–232. [Google Scholar] [CrossRef] [Scilit]
- Lan, H.; Wen, S.; Hong, Y.Y.; Yu, D.C.; Zhang, L. Optimal sizing of hybrid PV/diesel/battery in ship power system. Appl. Energy 2015, 158, 26–34. [Google Scholar] [CrossRef] [Scilit]
- Bortolini, M.; Gamberi, M.; Graziani, A.; Pilati, F. Economic and environmental bi-objective design of an off-grid photovoltaic–battery–diesel generator hybrid energy system. Energy Convers. Manag. 2015, 106, 1024–1036. [Google Scholar] [CrossRef] [Scilit]
- Gabour, A.; Benzahioul, S.; Metatla, A.; Sebbagh, T. Optimization and control strategy of multi-source system using genetic algorithm. Carpathian J. Electr. Eng. 2019, 13, 45–60. [Google Scholar]
- Europe Solar Store. Available online: https://www.europe-solarstore.com/download/luxor/LX_ecoline_m48_240-260_datasheet.pdf (accessed on 29 September 2026).
- Homer Software. Available online: https://www.homerenergy.com/products/pro/docs/latest/generator_lifetime.html (accessed on 21 October 2026).
- Unplugged Power Systems. 5 kW Wind Turbine Datasheet. Available online: https://unpluggedpowersystems.ca/product/wind-related/wind-turbines/5-kw-wind-turbine-2/ (accessed on 21 October 2026).
- Belfkira, R.; Zhang, L.; Barakat, G. Optimal sizing study of hybrid wind/PV/diesel power generation unit. Sol. Energy 2011, 85, 100–110. [Google Scholar] [CrossRef] [Scilit]
- NASA POWER. Data Access Viewer. Available online: https://power.larc.nasa.gov/data-access-viewer/ (accessed on 10 October 2026).

Disclaimer/Publisher’s Note: The statements, opinions and data contained in all publications are solely those of the individual author(s) and contributor(s) and not of MDPI and/or the editor(s). MDPI and/or the editor(s) disclaim responsibility for any injury to people or property resulting from any ideas, methods, instructions or products referred to in the content. |
© 2026 by the authors. Licensee MDPI, Basel, Switzerland. This article is an open access article distributed under the terms and conditions of the Creative Commons Attribution (CC BY) license.