


Abstract
The integration of Internet of Things (IoT) devices in microgrids enhances efficiency and adaptability but also introduces significant cybersecurity risks. This paper presents a conceptual hybrid modeling framework for cybersecurity modeling in IoT-enabled microgrids by combining System Dynamics (SD), Agent-Based Modeling (ABM), and statecharts. SD captures energy flows and storage dynamics, ABM models decentralized interactions among microgrid components, and statecharts represent cyberattack states and defensive responses aligned with the Lockheed Martin Cyber Kill Chain and MITRE ATT&CK for Industrial Control Systems (ICS) frameworks. A four-agent architecture—Microgrid, Attacker, Defense System, and External System—structures the modeling of cyber-physical interactions. An illustrative example shows how this hybrid approach can represent attack scenarios, such as Address Resolution Protocol (ARP) spoofing and smart meter manipulation, and how falsified sensor measurements could affect controller decisions and, conditionally, physical energy dynamics. The approach is conceptually compared against SD-only, SD+ABM, and AI/ML-based approaches, highlighting its intended advantages in interpretability and causal traceability. The scenarios establish representational feasibility, and a preliminary quantitative illustration compares normal, attacked, and defended conditions using resilience indicators; empirical validation against recognized microgrid benchmarks and testbeds remains future work.
1. Introduction
A microgrid (MG) is an electrical system engineered to facilitate the integration of distributed energy resources (DERs) through the use of sophisticated control algorithms for optimal performance [1]. Microgrids (MGs) can function independently or in conjunction with the grid, thereby enhancing the flexibility and security of the electrical system [2]. The advancement of IoT technologies, including smart metering, decentralization, self-healing functionalities, and bidirectional communication, has been crucial for the implementation of real-time monitoring and control systems [3]. Cyber-physical ecosystems in which MGs function facilitate intelligent and efficient energy management via optimization in energy management systems (EMSs), encompassing resource allocation, energy generation, storage, and consumption. This optimization is facilitated by the interplay of physical and digital technologies that regulate both electrical flow and secure data transmission via wireless and power line communication channels [4]. Consensus algorithms facilitate the flow of information among distributed agents regarding supply-demand equilibrium and system performance across many components, while IoT technologies provide adaptive monitoring and cost-effective operation.
The growing dependence on IoT components, including inverters, battery management systems (BMS), and smart energy management devices, arises from IoT’s capacity to effectively gather and analyze extensive data throughout the MG architecture. Consequently, IoT has emerged as a pivotal facilitator in transforming conventional MG systems into intelligent MGs [5]. The use of IoT technology facilitates extensive monitoring and communication within the MG system via diverse sensor installations, as depicted in Figure 1. The advancements in smart grids, bolstered by models for optimizing EMSs, promote agent communication and improve decision-making capacities [6]. In practical applications like residential energy management systems (REMS), IoT devices are essential for enhancing system efficiency through data measurement, behavioral analysis and prediction, and energy consumption optimization [7], thus yielding beneficial effects on smart neighborhoods.
Figure 1.
Network of sensors and devices in an IoT-enabled MG. Field sensors monitor wind, vibration, temperature, irradiance, power quality, and battery state of charge, sending their data to an IoT gateway. The gateway aggregates this information to support monitoring and control across homes, buildings, and industrial loads.
Although IoT technologies have become increasingly pertinent in cyber-physical systems like MGs, this digital transition has concurrently presented considerable cybersecurity challenges [8]. A worldwide escalation in cyberattacks has heightened the possibility of power supply outages, resulting in possible economic and operational consequences for both residential and commercial environments [9] and, in the extreme, cascading societal impacts such as food-supply disruption [10]. According to [11], the smart power system constitutes an integrated cyber-physical system in which physical components, such as protective systems, are closely interconnected with digital technology, including sensors, communication networks, and control systems. The interconnected nature renders the grid both intelligent and susceptible. Cybersecurity deficiencies may significantly jeopardize MG operations due to the inherent vulnerabilities of DERs reliant on software-intensive information and communications technology (ICT) infrastructure [12]. Cyberattacks can be categorized into two primary types: deception attacks, which compromise the integrity of transmitted data packets, and denial-of-service (DoS) attacks, which seek to interrupt data transmission by blocking access to shared network channels [13]. Numerous mitigation strategies have been recorded, including network segmentation to isolate cyber components within power applications [9], real-time monitoring to assess the effects of attacks on MG frequency response metrics such as load loss, frequency nadir, and stabilization time [14], and stringent authentication to guarantee that only authorized devices engage in MG communication [15].
Notwithstanding progress in cybersecurity solutions for power systems, numerous modeling issues persist. Traditional cybersecurity methodologies, mostly conceived from the viewpoints of computer science and communication engineering, frequently neglect the dynamics of power systems and the interconnections between cyber and physical elements [11]. Secondly, although system dynamics (SD) methodologies proficiently encapsulate feedback mechanisms and temporal dynamics within energy systems, they fall short in representing spatial information or the heterogeneity of individual components; overcoming this limitation necessitates alternative modeling paradigms, such as Agent-based modeling (ABM) [16]. Third, while multi-paradigm approaches that combine SD, ABM, and discrete-event/continuous-time simulation have proven effective for microgrid design and resilience analysis [17], the integration of cybersecurity modeling within such frameworks remains largely unexplored. Aljarbouh et al. [17] themselves note that, given the heavy dependence of interconnected microgrids on communication networks and digital control systems, developing robust cybersecurity measures to protect microgrid infrastructure is a necessary direction for future work. Fourth, current AI-driven security assessment techniques, although computationally fast, frequently lack the causal interpretability essential for comprehending attack evolution and guiding defensive strategies [11].
These challenges indicate the potential benefit of investigating hybrid modeling methodologies that integrate various simulation paradigms to depict both continuous SD and discrete cybersecurity incidents. This integration might utilize SD’s capability to describe feedback loops and accumulation processes, agent-based modeling’s ability to represent varied component behaviors, and formal state-based representations to capture patterns of attack advancement.
We examine the integration of SD, ABM, and statecharts for modeling IoT-enabled MGs facing cybersecurity threats. The approach illustrates the viability of combining these paradigms to: (i) depict energy flows and feedback dynamics via SD constructs; (ii) simulate individual MG components and their interactions through ABM; and (iii) delineate discrete attack states with statecharts, in line with the established CIA (Confidentiality, Integrity, Availability) taxonomy [18].
This article builds on our preliminary conference paper [19], which first explored combining SD, ABM, and statecharts to represent cyber attackers in MGs. That study introduced statechart-driven agents to model ARP spoofing attacks within a technology-agnostic MG simulation, and presented a basic three-state cybersecurity statechart, a single attacker-agent statechart, and an initial SysML block diagram of the MG architecture.
Relative to [19], the main extensions are:
- Literature review: A systematic review of defensive strategies, statechart formalisms, and SD–ABM integration for energy systems, absent from [19].
- Architectural justification: The four-agent architecture (Microgrid, Attacker, Defense System, External System) is formally grounded in the Lockheed Martin Cyber Kill Chain and the MITRE ATT&CK for ICS framework; Ref. [19] introduced the agents without this justification.
- Software specification: A UML class hierarchy defining inheritance, inter-agent communication, and the sensorModifier injection interface.
- Security-annotated system model: The SysML block definition diagram is extended with overlays mapping vulnerability classes to MITRE ATT&CK tactics.
- Second attack scenario: Smart-meter consumption manipulation is added to the single ARP-spoofing scenario of [19].
- Comparative positioning: A structured comparison against SD-only, SD+ABM, and AI/ML-based approaches.
The contributions of this work are methodological. First, it formalizes the coordinated use of SD, ABM, and statecharts within a single modeling architecture that represents continuous energy dynamics, heterogeneous agent interactions, and discrete cyberattack progression in a common environment. Second, it specifies a state-dependent measurement manipulation mechanism (Equations (5) and (6)) linking attack progression to the information available to the MG controller. A dispatch rule (Equation (7)) closes the loop between compromised measurements and physical storage operation. Third, the work outlines the extensions and validation steps that would be required before the approach could support a cybersecurity digital twin by identifying measurable modeling extensions, validation strategies, and integration opportunities with data-driven approaches.
The remainder of the paper is organized as follows: Section 2 reviews cybersecurity in IoT-enabled energy systems and the relevant modeling and simulation paradigms. Section 3 describes the key components for cybersecurity modeling. Section 4 presents the proposed modeling approach. Section 5 develops two illustrative attack scenarios. Section 6 discusses the approach’s capabilities, limitations, and positioning relative to existing methods. Section 7 concludes and outlines directions for future validation.
2. Literature Review
2.1. Cybersecurity in Microgrids
Cybersecurity in MGs involves threats that can compromise communication, control, and physical operation. Existing classifications and countermeasures provide essential foundations for identifying vulnerabilities and designing protection strategies. However, their contribution to cyber-physical modeling depends on whether the progression of an attack can be linked to the operational response of individual MG components and to system-level energy dynamics [20,21,22].
The confidentiality, integrity, and availability (CIA) classification presented in [20] distinguishes unauthorized information access, malicious modification of measurements or commands, and disruption of communication or control services. These categories encompass mechanisms such as spoofing, false data injection, and DoS attacks, while advanced persistent threats may combine several mechanisms. Although the CIA triad identifies the security objective affected, it does not, by itself, describe the temporal sequence of an attack or how compromised information alters energy flows. This distinction is relevant for simulations intended to represent both cybersecurity events and their physical consequences [20,21].
The device-level and grid-level classification in [21] provides a complementary perspective. Device-level attacks target smart inverters, sensors, and communication links through mechanisms such as replay, man-in-the-middle (MitM), firmware, and control-related attacks. Grid-level attacks affect coordinated inverter operation and distributed control, potentially causing frequency deviations, voltage violations, or service disruption. This classification relates the attack surface to possible electrical effects; nevertheless, a classification alone does not specify the interactions and state transitions through which a local compromise develops into a system-wide response [21].
According to [22], MG countermeasures can be grouped into prevention, resilience, and identification-segregation strategies. Authentication, encryption, and access control reduce exposure; resilient control seeks to maintain operation under attack; and intrusion detection, isolation, and recovery limit adverse effects. These strategies address different stages of incident management, but evaluating their combined behavior requires a representation of when attacks occur, which components are affected, and how mitigation changes the MG’s physical dynamics [22].
Tan et al. [23] review cybersecure microgrid control, including detection and mitigation strategies. Their control-oriented synthesis reinforces the need to connect cyber events with physical operation. The present framework addresses that connection at an aggregated energy-balance level, rather than reproducing electrical control dynamics.
The following studies illustrate the strengths of existing cybersecurity approaches and the modeling dimensions that remain outside their primary scope.
2.1.1. Learning-Based and Adaptive Defense Strategies
In [24], attacker–defender interactions are formulated as a multi-stage Markov game with a deep reinforcement learning (DRL) defense strategy for unknown attack vectors. The approach addresses adaptive decision-making under adversarial conditions. Its learning-oriented formulation, however, serves a different purpose from explicitly tracing how successive attacker states modify energy-balance variables. This distinction is consistent with broader concerns about causal interpretability in AI-based security assessments [24,25].
Adversarial DRL is also applied in [26] to attacks that manipulate droop-control gains in inverter-based MGs. By formulating the interaction as a Markov decision process, the study investigates robust defense against a defined destabilization mechanism. This provides a focused control-oriented treatment, rather than a general representation of multiple attack stages and their interactions with heterogeneous MG components [26].
For heterogeneous battery energy storage systems (BESSs), Ref. [27] develops a multi-agent DRL method for decentralized resilient secondary control under DoS attacks. The approach captures distributed control decisions, but its emphasis is on storage-system resilience rather than an explicit, transferable representation of attacker progression. Taken together, these studies show the value of adaptive defenses while motivating complementary, interpretable models of cyber-physical causality [24,26,27].
2.1.2. Distributed and Collaborative Defense Mechanisms
The R-CoDEMS framework [28] addresses false data injection through reputation-based neighborhood monitoring, allowing distributed MG agents to identify and mitigate compromised information. Its principal contribution is collaborative defense within the EMS, rather than an explicit state-based model of attack initiation, escalation, and effects on energy stocks and flows [28].
An attack-resilient distributed secondary control strategy for islanded AC MGs is developed in [29]. By relying on local information and limited communication, the strategy restores frequency, voltage, and power sharing under false data injection attacks. Although it relates cybersecurity to electrical performance, the analysis is centered on control recovery for a specified threat rather than on reusable attacker and defender state-transition structures [29].
Similarly, the frequency-control and intrusion-detection framework in [30] combines local droop control with distributed updates to maintain regulation in isolated MGs. These studies establish effective relationships between detection, communication, and resilient control. However, their application-specific objectives leave room for a modeling architecture that can express different attack sequences and their consequences within common MG dynamics [28,29,30].
2.1.3. Network-Level and Infrastructure-Oriented Countermeasures
Network-level protection is addressed in [15] through decentralized energy management, software-defined networking, and blockchain-supported communication integrity. These mechanisms strengthen information exchange in networked MGs, but a secure communication architecture is not equivalent to a simulation model that traces attacker behavior and subsequent physical effects. The two perspectives are complementary [15].
The digital twin framework in [31] represents both cyber and physical layers to detect and mitigate DoS-related communication disruptions using residual analysis. It therefore advances cyber-physical monitoring beyond purely network-oriented solutions. Its emphasis remains on the detection and control of a particular attack class, whereas the present research problem requires an explicit relationship between discrete attack phases, heterogeneous component responses, and continuous energy-balance dynamics [31].
2.1.4. Risk Assessment and Secure Transaction Frameworks
A risk assessment method for photovoltaic (PV) and energy storage system (ESS) controls uses Markov-based transitions and Monte Carlo simulations to estimate monetary consequences of syntactic and semantic cyberattacks [32]. This approach incorporates state-dependent risk, but its primary output is a risk measure rather than an explicit account of how interactions among attackers, defenders, and MG components perturb energy flows over time [32].
For secure energy transactions, Ref. [33] proposes a blockchain framework based on a directed acyclic graph (DAG) to reduce fraud in decentralized power trading. Although relevant to MG cybersecurity, this transaction-oriented contribution addresses a different layer from operational attack propagation. Overall, the reviewed defenses and assessments provide specialized mechanisms for prevention, detection, control, and risk quantification; their objectives do not individually encompass a unified representation of attack states and continuous MG behavior [22,28,29,30,31,32,33].
2.2. Statecharts and Systems Modeling
Statecharts formalize the evolution of event-driven systems through states, transitions, and triggering conditions. Harel’s formulation [34] extends finite state machines with hierarchy and concurrency, enabling the representation of interacting processes. Hybrid-system theory further establishes the treatment of discrete operating modes alongside continuously evolving variables [35]. These foundations are relevant to MG cybersecurity because reconnaissance, compromise, manipulation, detection, and recovery occur as discrete events, whereas power generation, consumption, and storage evolve continuously. However, the capacity to express these two forms of behavior does not itself define the variables or interfaces by which cyber events influence the underlying physical system [34,35].
In a state-based model, directed transitions are activated by events and guard conditions that determine when an agent changes behavior. This structure makes attack pathways and defensive responses traceable and has been applied to security attack modeling [36]. Nevertheless, statecharts considered in isolation emphasize behavioral logic; they do not automatically represent energy conservation, feedback loops, or heterogeneous component interactions in an MG. A cyber-physical application therefore requires an explicit coupling between attack-state transitions and the equations governing physical operation. Without this coupling, a statechart can describe when malicious manipulation occurs but not how its magnitude affects energy balance over time [34,35,36].
2.3. Energy Systems Modeling Using Agents and System Dynamics
SD and ABM have both been applied to MGs, but their contributions address different levels of system behavior. Previous preliminary work explored their combination with attacker statecharts [19]. The remaining methodological issue is to specify how these paradigms exchange information when a discrete cyber event changes a continuously evolving MG variable [17,19].
SD represents feedback loops, accumulations, and time-dependent power flows. The Power Dynamics approach in [37] uses stocks and flows to describe DC distribution components and examines generation, storage, and load balancing in MG case studies. This formulation provides a transparent basis for energy-conservation analysis. However, SD representations at the aggregate or component-flow level do not, by themselves, specify the distinct decisions of autonomous attackers and defenders or the event sequence through which a measurement becomes compromised [16,37].
In [38], SD is combined with machine learning for month-ahead peak-demand forecasting and energy management. This demonstrates the usefulness of SD for decision support but does not address the progression of cyberattacks or their coupling to individual agent behaviors. Its modeling objective is therefore distinct from cyber-physical security scenario analysis [38].
Other SD applications examine decentralization and energy-transition dynamics [39] or technology-agnostic representations of MG power flows, storage, and demand-side management (DSM) [40]. Their principal strength is system-level analysis of interconnected energy variables. The corresponding limitation for the present research problem is that these physical and operational descriptions require additional constructs to represent heterogeneous cyber actors and discrete attack or response events [16,39,40].
ABM complements these representations by describing autonomous components and their interactions. The dual-layer MG approach in [41] combines logical agent communication with physical power-flow calculations, demonstrating the value of a decentralized representation. Likewise, the multi-paradigm MG study in [17] integrates modeling methods for power stability but identifies cybersecurity as a direction for further research. Thus, agent interactions and continuous MG dynamics have been jointly modeled, while their explicit coupling to state-based cyberattack progression remains less developed in these works [17,41].
In summary, the literature offers defense mechanisms that are specific to certain attacks or control architectures, SD and ABM models that omit cybersecurity, and a statechart formalism that has not been applied to attack–defense behavior in MGs. No approach identified here integrates SD, ABM, and statecharts in a technology-agnostic framework to analyze cyberattack dynamics and evaluate defense strategies, such as anomaly detection and mitigation policies, in IoT-enabled MGs. This work addresses that gap by combining the three methodologies, so that continuous dynamics, autonomous agent interactions, and discrete state transitions are represented within a single simulation environment.
3. Key Components for Cybersecurity Modeling
The architecture of MGs presents multiple potential entry points for cyber threats. Compromised IoT devices, such as inverters, BMS, and networked appliances, can serve as gateways for attackers. Common cyber threats targeting MGs include DoS attacks, which overwhelm systems to disrupt operations; data breaches, leading to unauthorized access and potential misuse of sensitive information; MitM attacks, where attackers intercept and possibly alter communications between devices; and malware infections, which can compromise system integrity and functionality [42].
Statecharts are particularly useful for modeling the progression of cyber threats through a system. In this approach, each state corresponds to a specific phase of a cyberattack, for example, reconnaissance, initial access, malicious action execution, persistence maintenance, or data extraction. Transitions between states capture both the attacker’s maneuvers and the system’s security conditions. A state could, for instance, represent an ongoing password-cracking attempt, while transitions depend on conditions such as password strength or the number of failed login attempts.
By combining continuous monitoring (e.g., differential equations that track system behavior) with discrete events (such as intrusion attempts), statecharts can represent how an attack evolves and support the design of effective countermeasures. When specific indicators surpass predefined thresholds—such as abnormal data throughput or abrupt changes in power consumption—the model can trigger transitions to heightened security states or initiate system lockdown procedures.
To support this hybrid behavior, each state may include mathematical expressions (differential or integral equations) governing gradual changes during that phase. The system evaluates these continuous dynamics when determining whether a transition should occur. Since continuous evolution and discrete updates are treated independently, the model alternates between advancing time and executing state transitions but never performs both simultaneously. A representative state machine for MG cybersecurity is presented in Figure 2.
Figure 2.
Five-state statechart for cyber defense. The system moves from Normal Monitoring to Threat Analysis, then to Active Containment. If the situation worsens, it escalates to Emergency Response, and once the threat is neutralized, it enters Remediation before returning to normal operation.
The five states in the illustrative defense statechart (Figure 2) are:
- Normal Monitoring: The Defense System observes network and measurement indicators during routine operation.
- Threat Analysis: An alert prompts further checks to distinguish suspected intrusion from benign deviations.
- Active Containment: A confirmed event activates proposed measures to restrict compromised communication or data use.
- Emergency Response: Persistent anomalies or unsuccessful containment prompt escalation to additional protective actions.
- Remediation: The system verifies communication and measurement integrity before normal monitoring resumes.
The statechart in Figure 2 uses the events threat_detected and confirmed_threat to represent detection and confirmation, respectively. An unconfirmed alert follows the false_positive transition back to Normal Monitoring. The events escalate and system_restored represent escalation and verified restoration. The transition criteria and their instantiation are specified with the attack scenarios.
4. Modeling Approach
4.1. Four-Agent Model for Cyberattack Modeling in Microgrids
A four-agent model (Microgrid, Attacker, Defense System, External System) is introduced for cyberattack modeling in MGs, grounded in the Cyber Kill Chain [43] and MITRE ATT&CK for ICS [44]. These structured cybersecurity frameworks provide a real-world basis for how cyberattacks unfold, reinforcing the necessity of modeling each agent separately.
4.1.1. Applying the Lockheed Martin Cyber Kill Chain
The Cyber Kill Chain defines seven sequential stages of an attack, from initial reconnaissance to final data exfiltration or system compromise. The relevance of each Cyber Kill Chain stage to Agent-Based Modeling is presented in Table 1.
Table 1.
Cyber Kill Chain Stages and Agent-Based Modeling Responsibilities in IoT-Enabled Microgrids.
The Cyber Kill Chain shows that attackers, defenders, and external entities continuously engage with the MG at every phase of an attack, underscoring the necessity of the four-agent model.
4.1.2. Applying the MITRE ATT&CK for ICS
The MITRE ATT&CK framework for ICS (Industrial Control Systems) further strengthens the justification by categorizing specific attack tactics and techniques against power grids and MGs. In Table 2, the mapping of agents to the MITRE ATT&CK for ICS Tactics and some relevant examples of Attack Scenarios are presented.
Table 2.
The MITRE ATT&CK for ICS and Agents in MGs’ Attack Scenarios.
The MITRE ATT&CK tactics confirm the need for distinct agent-based modeling of the attacker, MG, defense mechanisms, and external entities, as each tactic affects multiple components in different ways.
4.1.3. Final Justification for the Four-Agent Model
By combining the Cyber Kill Chain and MITRE ATT&CK for ICS, the following four agents are modeled separately:
- Microgrid (Target System). The physical and cyber infrastructure is under attack. Models how cyberattacks impact power generation, distribution, and control systems. Represents the effects of false data injection, DoS attacks, malware intrusions, and physical disruptions.
- Attacker (Threat Agent). Simulates real-world adversaries (e.g., nation-state actors, ransomware groups, insiders). Implements tactics from MITRE ATT&CK for ICS, including C2, privilege escalation, and impact techniques.
- Defense System (Cybersecurity Mechanisms). Models intrusion detection, AI-based monitoring, and automated response mechanisms. Evaluates countermeasures against MITRE ATT&CK techniques (e.g., detecting lateral movement, blocking exfiltration). Enhances MG resilience through threshold-based anomaly detection.
- External System (Grid/Market/Regulatory Agent). Represents the broader infrastructure and market influencing MG security. Captures how grid operators, market forces, regulatory policies, and emergency response teams react. Essential for modeling attack propagation, government intervention, and economic impact.
The Cyber Kill Chain and MITRE ATT&CK for ICS motivate separation of energy infrastructure, attacker behavior, defensive responses, and external influences. The four-agent architecture is a design choice for organizing these interactions; the taxonomies do not prove that it is the unique or best architecture.
4.2. Agent System Design Using a UML Diagram
Figure 3 shows the four-agent architecture as a UML class hierarchy.
Figure 3.
UML class hierarchy for the agent-based MG cybersecurity framework. At the top is the Agent superclass, from which four main agent types inherit: MicrogridSystem, AttackerAgent, DefenseSystem, and ExternalSystem.
At its core, the Main agent orchestrates four primary agents through compositional relationships, each designed to fulfill a distinct role in the cyber-physical simulation. The MG agent encapsulates the physical infrastructure by embedding multiple Generator, Storage, and Load sub-agents as internal populations, reflecting the distributed nature of DERs and enabling each component to maintain its own energy balance equations (as defined in Equations (1)–(4)).
The Attacker agent implements adversarial intelligence through methods such as arpSpoofing() and dataManipulation(), parameterized by user-defined variables including skew_reading_by_percent, which determines the magnitude of falsification applied to measurements received by the MG controller (Equation (5)), without directly changing physical power-flow equations. The Defense System agent is defined as an observer-and-response component that can monitor deviations in reported measurements and network indicators, initiate alert confirmation, and propose containment. The External_System agent captures broader ecosystem interactions, including grid operator dispatch signals, regulatory compliance constraints, and market price responses, that influence MG behavior during both normal and compromised operations. This four-agent decomposition ensures that each domain of the cyber-physical problem—energy infrastructure, adversarial behavior, defensive response, and external context—is modeled with dedicated logic while remaining coupled through well-defined interaction interfaces.
The inter-agent communication architecture is specified through agent messages; calibrated latency, packet loss, and protocol behavior would require explicit communication-model extensions. Each agent maintains an internal state machine, implemented as a statechart, that evolves in response to both endogenous system events (e.g., a battery reaching full charge) and exogenous interactions with other agents (e.g., receiving a manipulated sensor reading from a compromised channel). The Attacker agent’s statechart progresses through reconnaissance, ARP spoofing setup, interception, manipulation, and attack-success phases, as applied in Section 5.1. This design is adapted from the two frameworks of Section 4.1. The Defense System agent is represented through the states of Figure 2, with transitions specified in terms of configurable anomaly thresholds, alert confirmation, containment, and recovery conditions. The architecture therefore permits the communication infrastructure to be represented as an attack surface and provides a basis for examining the timing of attacker and defensive states, without implying that a defense policy has been empirically assessed.
4.3. Microgrid System Design Using a SysML Block Diagram
The SysML block diagram for MG design in Figure 4 formalizes the MG’s hierarchical architecture, with four primary subsystems in which the cyber and physical domains interweave at multiple abstraction levels. The Generation Sources subsystem contains PV System and Wind Turbine blocks that expose both power output ports and cyber interfaces, such as MPPT controllers and SCADA integration points—each representing a critical attack surface for false data injection.
Figure 4.
SysML block definition model of an MG system. The central MGSystem block aggregates four major subsystems: GenerationSources, EnergyStorage, ControlMonitoring, and Loads. Each subsystem is further refined into specialized blocks.
The Energy Storage subsystem centers on the Battery System block, which manages charge and discharge cycles governed by the efficiency-dependent differential equation defined in Equation (4) in Section Details of the Model. This block interfaces with the BMS, whose sensors report state-of-charge values to the MG Controller. From a cybersecurity perspective, the BMS interface represents a critical attack surface: if an adversary compromises these sensors—for example, through the ARP spoofing mechanism represented by the Attacker agent—falsified state-of-charge readings could alter a controller decision and, if acted upon, change battery dispatch. The physical energy balance in Equation (3) would then reflect the resulting change in actual power flows, not the falsified reading itself.
The Control and Monitoring subsystem coordinates measurements from distributed sensors through the IoT Gateway. Authenticated encryption and access control are design countermeasures, not assumptions that the illustrative ARP attack defeats. The manipulation scenarios assume a measurement path without end-to-end integrity protection, or a compromised endpoint with permission to alter the reported value. ARP spoofing alone can redirect traffic but cannot alter authenticated messages without detection. This distinction bounds the scenarios [21,42].
The diagram represents both power flows and information flow as distinct but interdependent pathways, reflecting the inseparability of the cyber and physical domains in IoT-enabled MGs. Power flows carry real-time constraints—such as maximum generation capacity and ramp rates—while information flows specify latency bounds and integrity requirements that, if violated, indicate potential cyber intrusion. Constraint blocks enforce physical laws (e.g., energy conservation expressed by Equation (2) in Section Details of the Model). Discrepancies between independently observed physical quantities and controller-received measurements may support anomaly detection; however, falsifying a reading does not itself violate physical energy conservation.
The Loads subsystem differentiates among critical, controllable, and non-critical loads through specialized blocks with distinct priority levels and demand response interfaces. This classification directly informs the parameterization of Load sub-agents in the ABM: critical loads (e.g., medical facilities) maintain fixed demand profiles, while controllable loads participate in the DSM procedures of the illustrative configuration.
From a security standpoint, the demand response interfaces that enable this flexibility simultaneously create attack surfaces for inappropriate demand-response decisions—an attacker who manipulates load priority signals or demand response commands could force inappropriate curtailment of critical loads or artificially inflate demand during peak periods. Security overlays on each block map these vulnerabilities to specific MITRE ATT&CK for ICS tactics: generation blocks are susceptible to set-point manipulation (Tactic 9: Impair Process Control), storage blocks to state estimation attacks via falsified BMS readings (Tactic 7: Collection), and load blocks to demand response signal spoofing (Tactic 9: Impair Process Control). These overlays link each block to the attack scenarios the Attacker agent can instantiate and the interfaces the Defense System monitors.
4.4. Example of the Agent-Based Simulation for IoT Components in Microgrids
This example examines a small community of six single-family homes with renewable energy systems (Figure 5). The homes are interconnected within an MG that incorporates solar panels, wind turbines, and energy storage systems, enabling self-sufficient, efficient energy management.
Figure 5.
MG in which six households and a wind turbine connect to a central Point of Common Coupling (PCC). Each house includes local generation and storage, exchanging power with the PCC through bidirectional flows. The attacker agent indicates that the model includes an agent(s) to initiate cyber threats to the MG.
PV and wind output are derived from hourly resource data with GRETA [45], scaled to the microgrid; specific hardware is not modeled. Energy storage plays a critical role in ensuring system reliability. Battery systems are incorporated into each home and modeled using SD to simulate charge and discharge cycles based on load requirements (Figure 6). A pumped water storage system connected to the wind turbine also provides surplus energy storage using gravitational potential energy. In the executed configuration, household and pumped storage are aggregated into a single storage element.
Figure 6.
Internal energy-flow model of a household within the MG. It shows how power is generated (e.g., rooftop PV), consumed by household loads, and exchanged with the MG. Flows for input power, output power, storage, and residual power are illustrated, with variable c capturing the surplus power available for storage after household consumption is subtracted.
The MG infrastructure connects the six single-family homes, each equipped with PV systems, to a shared wind turbine and centralized energy storage systems. All components are integrated through a PCC to ensure a balanced energy flow throughout the community.
The modeling approach is entirely technology-agnostic, focusing on power flows rather than specific device details. Power systems are represented as graphs with nodes (e.g., homes and wind turbines) and edges representing power flows (Figure 7). SD governs power generation, consumption, and storage dynamics through differential equations.
Figure 7.
Energy flows of a wind generator within the MG. It depicts how generated power is routed through the central node and split among local loads, grid export, and storage.
Discrete events capture real-world discontinuities, such as appliance switching and storage activation. Agent-based modeling simulates interactions among homes, generators, and storage systems. The model is implemented in AnyLogic, which supports the three formalisms natively.
A DSM procedure is incorporated to illustrate operational flexibility. In this illustrative configuration, load curtailment reduces peak-hour consumption by 15%, and load time-shifting moves 18% of the load from peak hours (16:00–20:00) to off-peak hours (00:00–06:00). These values are illustrative and consistent with common DSM practice rather than calibrated to a specific deployment; their role here is to exercise the modeling constructs, not to report optimized outcomes.
Details of the Model
Power Dynamics is an analytical perspective used to examine how energy flows within MGs, encompassing its production, transfer, storage, and use. Within a technology-agnostic modeling framework, the focus shifts from device-level technical details to the system’s functional interactions. This is accomplished by depicting the MG as a network of power flows defined by variables such as efficiency (η) and power flow p(t), without tying the model to any specific technology.
This approach is grounded in SD, which represents energy stocks and flows throughout the MG (Figure 8). The system’s behavior is captured through differential equations that express how energy inputs and outputs evolve. For example, Equation (1) describes how the stored energy (e) changes as a function of time (t).
de/dt = −pi − po
Figure 8.
PCC, where the MG connects its households and generators to the central power-exchange node.
In this expression, pi denotes the incoming power, po the outgoing power, and e is the amount of stored energy. This relationship enforces energy conservation across the system and provides the foundation for examining power flows dynamically.
To make the electrical network easier to conceptualize, the system is represented through power graphs. In this abstraction, nodes correspond to elements such as generators, loads, or storage units, while edges depict the power transferred between them. The interactions among these nodes and edges follow energy-conservation principles. At each node, the energy balance can be written as
where e denotes the stored energy and p represents the power flow. In practical terms, this relationship can be expressed as
de/dt + ∇ ⋅ p = 0
de/dt = pg + pi − pl − ps
In this physical balance, pg denotes generated power, pi incoming power, pl consumed power, and ps power allocated to storage. These terms represent actual physical quantities, which are distinguished from sensor readings and the values received by the controller. This distinction is relevant to false-data injection scenarios [21,28].
Energy storage devices, such as batteries or pumped water systems, are modeled using similar equations, highlighting the versatility of the technology-agnostic approach. For a battery, the energy stored (e) changes based on input and output power flows, factoring in efficiency (η):
This equation ensures that losses due to inefficiencies are accounted for in the energy flow calculations.
Equations (1)–(4) operate at the system-dynamics level: energy stocks and power flows are governed by conservation and storage efficiency. Bus voltages, frequency, converter switching, inverter control, line impedances, thermal limits, reactive power, and primary or secondary control dynamics are not explicitly represented. The framework targets operational attack progression and energy-management decisions, potentially over minutes to hours; it is not a validated model of millisecond-to-second electrical transients. This abstraction supports reuse across microgrid technologies at the cost of electrical fidelity.
Consequently, model-level consequences are described as energy-balance deviations or operational imbalance. A falsified measurement first changes the controller’s apparent balance. Mis-scheduled generation, storage cycling, operating cost, or degraded load service are conditional consequences requiring controller and actuator responses, quantified only in the preliminary illustration under the stated abstraction. Frequency excursions and voltage violations are possible downstream effects documented in [21], not outputs of the present model. Quantitative stability claims would require reduced-order frequency dynamics and power-flow constraints, which the present model does not include.
ABM complements the SD approach by representing each component—households, generators, and storage units—as autonomous agents. These agents interact dynamically, responding to changes in energy demand, supply, and storage states. For example, a wind turbine agent adjusts its power output based on wind speed data, while household agents implement DSM strategies to optimize energy use.
5. Illustrative Scenarios
Edge devices in an IoT-enabled MG—microcontrollers and I/O gateways—expose physical, wireless, and network attack surfaces, from firmware and debug-interface tampering to credential misuse, DNS spoofing, and ARP spoofing. Device-level hardening measures (secure boot, flash encryption, TLS, interface lockdown) address these surfaces but lie outside the scope of the present model, which abstracts the network layer. Among the listed vectors, ARP spoofing is the one represented here, because it is the access mechanism through which measurement falsification reaches the controller.
ARP spoofing is represented through a statechart. Forged ARP replies associate a legitimate IP address with the attacker’s MAC address, potentially redirecting local traffic through the attacker. Measurement manipulation additionally requires an unprotected data path or a compromised endpoint; redirection alone does not defeat message integrity. Representing each agent with its own statechart captures the independent lifecycles of attacker, detection, and recovery processes.
5.1. Modeling Details of the Cyber Threat
To incorporate cybersecurity threats into the technology-agnostic MG framework, we employ a statechart-based model that captures the behavior of an attacker carrying out an Address Resolution Protocol (ARP) spoofing attack. Rather than modeling device-specific details, this approach emphasizes the logical progression of the adversarial activity, enabling a high-level representation of how the attack unfolds within the system.
The ARP scenario assumes attacker access to the same local broadcast domain as the target, through a compromised node, a rogue field-network connection, or insider access. ARP poisoning does not traverse routed segments. The targeted segment is assumed to lack effective dynamic ARP inspection or protected static bindings and to accept forged ARP replies. Maintaining a poisoned mapping can require periodic reinjection; setup and maintenance are conceptual behaviors, not packet-level simulations. Manipulation further requires absent end-to-end integrity protection, as may occur with legacy Modbus/TCP or DNP3 deployments without secure authentication, or a compromised endpoint. Local access and target discovery are proposed guards for Reconnaissance-to-Setup; successful poisoning of the relevant endpoint caches is a proposed guard for Set-up-to-Interception. These guards elaborate the Figure 9 template and have not been experimentally verified.
Figure 9.
Attacker’s statechart for an ARP spoofing cyberattack. It progresses through five stages—Reconnaissance, ARP Spoofing Setup, Interception, Manipulation, and Attack Successful—illustrating how the adversary moves from initial network scanning to ultimately compromising the system, with loops indicating possible repeated or adaptive attack behaviors.
The attacker’s behavior is modeled through a statechart comprising five primary states, each representing a distinct phase of the ARP spoofing attack and enabling synchronized interactions with the statecharts of other agents (e.g., detection, mitigation, and recovery processes).
Formally, the attacker’s behavior is specified as a statechart M = (S, s0, E, G, A, T) in the Harel sense, where S = {Reconnaissance, ARP Spoofing Setup, Interception, Manipulation, Attack Success} is the state set with initial state s0 = Reconnaissance, E is the set of triggering events, G the guard conditions, A the actions executed on transitions, and T ⊆ S × E × G × A × S the transition relation. Each transition fires only when its event occurs and its guard holds: Reconnaissance → Setup requires a resolved IP–MAC pairing for the target device (guard: target identified); Setup → Interception requires confirmed ARP cache poisoning of both endpoints, which in turn presupposes the local-network access conditions stated in Section 5.1 (guard: MitM established); Interception → Manipulation fires on the attacker’s engagement decision, and its action is the coupling point with the continuous dynamics—the assignment sensorModifier: = skew_reading_by_percent/100, which enters Equations (5) and (6); Manipulation → Attack Success requires the falsification to persist for the intended duration without interruption. Two guard-governed exits run against this forward chain: a failed poisoning attempt returns the statechart from Setup to Reconnaissance, and a mitigation event emitted by the Defense System statechart forces an exit from Manipulation with the resetting action sensorModifier = 0. The discrete logic and the continuous energy balance therefore interact exclusively through transition actions, which is what makes the coupling reproducible and auditable.
This formalization is what makes the defended and undefended conditions of the preliminary illustration comparable: they differ by exactly one element of the specification—whether the Defense System statechart is active and able to emit the mitigation event that forces the exit from Manipulation. In the undefended condition, that exit guard can never be satisfied, so the attacker traverses the full chain and sensorModifier remains active for the entire attack window; in the defended condition, the exit fires on detection and the resetting action returns sensorModifier to zero. Every other element—states, events, remaining guards, inputs, parameters—is held fixed, so the comparison isolates the causal contribution of the defense logic.
- Reconnaissance: In the initial state, the attacker conducts network scanning to discover potential targets such as smart meters, IoT gateways, or microcontrollers. During this phase, the attacker’s statechart outputs observations—such as IP–MAC pairings—to other agent statecharts, which may trigger early-warning transitions in defense or anomaly-detection agents.
- ARP Spoofing Setup: Upon identifying a viable target, the statechart transitions to a phase where the attacker crafts and injects forged ARP responses. These messages associate the attacker’s MAC address with the victim device’s IP address, enabling MitM attacks. This state may activate corresponding “Suspicious ARP Activity” states in the defense-system statechart if monitoring thresholds are exceeded.
- Interception: Once the spoofing is effective, the attacker’s statechart enters an interception state, where all communication between MG devices and control components is rerouted through the attacker. At this stage, data streams—such as generation values, control commands, and sensor outputs—may become observable if unencrypted within the attacker statechart and can serve as potential triggers for defense-system transitions (e.g., traffic-anomaly detection).
- Manipulation: In this state, the attacker modifies captured traffic to influence MG performance. The present mechanism scales sensor readings; forged commands and timing delays require additional interfaces and are future extensions. Modified measurements can influence the controller or defense-state transitions. Physical degradation is possible only if an ensuing control action changes actual generation, load, or storage operation.
- Attack Success: The final state represents the point at which the attacker accomplishes the intended impact, ranging from operational degradation to full MG disruption. From here, the attacker’s statechart may loop into continued exploitation, escalate into more sophisticated attacks, or—if the defense agent triggers a countermeasure—transition into states representing containment, isolation, or forced disconnection.
5.2. Integration with the Technology-Agnostic Model
The integrated statechart and ABM approach distinguishes the following attacker, controller, and physical processes:
- The attacker is an autonomous agent that progresses through attack states.
- Other agents (e.g., smart meters, controllers) respond dynamically to the attack.
- A falsified reading alters the controller’s estimate of net load; any physical effect follows from the dispatch rule of Equation (7).
- No specific technology is assumed, keeping the model focused on logical attack progression and its effects on MG operations.
The Attacker agent implements a user-defined parameter, skew_reading_by_percent, which specifies the percentage modification applied to a sensor reading during the Manipulation state. The actual load power, the reading generated by the sensor, and the value received by the controller are distinct quantities. An attacker who compromises a measurement channel can modify the transmitted reading without directly changing the power consumed by the load. The modification is represented by Equation (5); its range and activation logic are specified in the following subsection.
Modified Reading = Original Reading × (1 + sensorModifier)
The variable sensorModifier is governed by the Attacker statechart and is zero when the attack is inactive. In Equation (5), Original Reading denotes the sensor-reported value before falsification, whereas Modified Reading denotes the value delivered to the controller. To illustrate how such a reading may affect the controller’s representation of energy balance, the modified load measurement is substituted into the balance expression:
de/dt = pg + pi − pl × (1 + sensorModifier) − ps
In Equation (6), the factor (1 + sensorModifier) applies to the reported load value used in the calculation, not to the actual electrical demand. Equation (6) retains the energy-balance notation of Equation (3) as an illustrative calculation based on potentially compromised information; its resulting balance is apparent and should not be interpreted as a demonstrated change in the physical rate of stored energy. A physical effect would depend on the controller using that information to issue a command and on the corresponding action being implemented by MG equipment.
In the executed model, the controller closes this loop through a dispatch rule that schedules storage against the reported net load. Denoting the reported load by p̃l = pl·(1 + sensorModifier), the storage power command is
ps(t) = p̃l(t) − pg(t) − pi(t), bounded by the storage power rating and the state-of-charge limits.
Equation (7) is the only point at which falsified information enters the physical dynamics: the battery discharges to serve a demand that is partly fictitious, and the surplus p_l·sensorModifier is exported through the central node. The physical balance of Equation (3) is never altered by the attacker directly; it is altered by the controller acting on p̃l.
5.3. Attack Injection Mechanism
The coupling between discrete attack states and continuous energy dynamics is represented through an explicit information-to-control interface. The Attacker statechart changes the measurement received by the controller, rather than directly adding or subtracting energy in the physical MG model. Any subsequent physical effect arises through the dispatch rule of Equation (7).
The parameter sensorModifier ∈ [−1, ∞) is determined by the Attacker statechart. Equation (5) therefore represents a state-dependent modification of the measurement transmitted to the controller. This information-layer change is distinct from the physical power balance described by Equation (3).
For a nonnegative magnitude reading, sensorModifier ∈ [−1, ∞) keeps the modified value nonnegative: −1 produces a zero report, values in (−1, 0) under-report, zero leaves it unchanged, and positive values inflate it. This range is a scenario convention, not a universal constraint on signed bidirectional power. Plausibility limits should be imposed for each target. A zero report represents measurement suppression; it does not by itself model loss of communication or DoS. Proportional scaling retains the signal’s shape under a constant factor, but its detectability depends on the detector and independent references. No general superiority over additive bias is asserted.
For the persistent case, sensorModifier(t) is piecewise constant: it becomes skew_reading_by_percent/100 on entry into Manipulation and returns to zero on every exit, including detection or withdrawal. Activation requires completion of Reconnaissance, ARP Spoofing Setup, and Interception under the Section 5.1 access guards. Attack duration therefore depends on configured dwell times and exit events; it is not calibrated here. Ramp, pulse, or threshold-dependent profiles may be assigned while Manipulation is active, preserving the same measurement interface.
The mechanism represents scaling-type false-data injection on reported load, generation, import, or storage variables and demand-signal manipulation that may influence load control. Replay, delay, desynchronization, and additive bias are not equivalent to scaling the current reading: they require buffer/delay or additive operators. These are extensions, not current capabilities.
The load-side example in Equation (6) illustrates how a manipulated measurement enters a balance calculation. An analogous transformation could affect reported generation, incoming power, or storage information. The selected measurement identifies the target, skew_reading_by_percent determines the magnitude, and the Attacker statechart determines the timing. Equation (7) specifies this response for the load-side case.
Within a hierarchical agent platform, the Attacker agent obtains the visibility required to apply this transformation through a reference to the top-level model (denoted main_obj in the present specification), providing a simulation-level reference to the measurement interfaces; this does not imply unrestricted access in a real MG.
5.4. Defensive Strategies Within the Model
The Defense System agent is specified as an observer-and-response layer using the five states shown in Figure 2. The following criteria define the intended state transitions and possible actions; they are instantiated in the preliminary illustration, and calibration against operating data remains future work. The selected indicators and defensive responses are informed by the monitoring and resilience approaches described in [22,28,30,31].
During Normal Monitoring, candidate indicators include anomalous ARP traffic and discrepancies between controller-received readings and independently verified measurements or estimates. A transition to Threat Analysis is proposed when an indicator exceeds a configurable detection threshold for a specified persistence interval. Thresholds and observation intervals would need calibration against normal operating variability and measurement uncertainty. In the absence of an independent reference, a discrepancy-based indicator cannot establish that a reading has been falsified.
The gateway scenario emphasizes network evidence such as anomalous ARP mappings. The meter-population scenario additionally requires comparison of aggregated meter reports with an independent feeder-level reference, allowing for ordinary losses and measurement uncertainty. Both scenarios can benefit from both indicators; neither detection pathway is exclusive or evaluated here.
Threat Analysis would seek confirmation through repeated anomalies, an independent measurement check, or corroborating network evidence. When the condition is not confirmed, the false_positive transition in Figure 2 returns the agent to Normal Monitoring. Detection delay is defined as the time between the onset of a simulated attack and the first alert. A false alarm is an alert raised during attack-free operation; the false-alarm rate would be estimated from benign observation windows. Detection delay is reported in the preliminary illustration; false-alarm rate requires attack-free runs with measurement noise and is not reported.
Following confirmation, Active Containment may block suspicious communication, isolate an affected interface, or mark its measurements as untrusted. Any subsequent change in MG operation remains dependent on controller decisions and implemented actions. Persistent anomalies or unsuccessful containment would trigger Emergency Response. In Remediation, authenticated communication and trusted measurements would be restored and checked; the system_restored transition would require indicators to remain within specified recovery tolerances for a configurable observation interval [22,31,36].
The thresholds, delays, observation intervals, redundant information sources, and mitigation policies described above are proposed model parameters and decision rules. Defense-enabled simulations involving both attack-free and compromised operating conditions are required to assess detection delay, false alarms, mitigation effectiveness, and recovery behavior. The base-case threshold of 5% is a scenario input, not a calibrated value; its sensitivity is reported with the results.
5.5. Modeling Details of the Cyber Threat: Smart Meter Consumption Manipulation
The two scenarios share ARP spoofing as the access vector but differ in target and manipulation profile. The first uses persistent constant scaling on a selected gateway load-measurement channel. The second considers meter-level reports, optionally across a meter population, with time-selective or gradual manipulation. Corrupted aggregate demand may bias billing and, if used by DSM or dispatch, lead to inappropriate storage scheduling or renewable curtailment. Those economic and operational pathways are conditional hypotheses, not simulated results. A plausible instantaneous aggregate report can conceal discrepancies in individual readings; independent feeder-level checks are therefore relevant (Section 5.4).
5.6. Mechanism of the Attack: ARP Spoofing and Smart Meter Manipulation
The attack uses the same five-phase statechart template (Figure 9), instantiated conceptually with target-specific access guards and a time-dependent Manipulation profile:
- Reconnaissance. The attacker scans the MG network to identify the smart meter’s IP and MAC address. Using passive listening techniques, the adversary maps device communication patterns and identifies potential network vulnerabilities.
- ARP Spoofing Setup. The attacker injects falsified ARP packets, making the MG gateway believe that the attacker’s MAC address corresponds to the smart meter’s IP address. This effectively positions the attacker as an intermediary between the smart meter and the central control system.
- Interception. Once ARP spoofing is successful, the attacker can intercept real-time data packets between the smart meter and the MG’s control unit. This exposes sensor-reported consumption data, which may differ from the underlying physical load and may be falsified before reaching the controller.
- Manipulation. Each mode defines sensorModifier(t) while the Manipulation state is active and resets it to zero on exit. Constant scaling uses sensorModifier(t) = a (e.g., a = 0.20 for an illustrative 20% increase). Time-based inflation uses a ramp a(t) bounded by target-specific plausibility limits; stealth is a hypothesis requiring detector evaluation. Threshold-based adjustment uses a(t) = a when the original reported demand exceeds a specified threshold, and zero otherwise; a time-window variant applies the same rule only during designated peak hours. Thresholds, ramp rates, and populations remain uncalibrated scenario inputs.
- Attack Success. In this illustrative scenario, the immediate result is a corrupted smart-meter report received by the controller or billing system. It may lead to incorrect charges or biased demand estimates. Changes in dispatch, storage operation, or load curtailment would occur only if a controller acted on the distorted measurement and its commands were implemented; the meter-level case is not executed; its physical consequences remain conditional.
5.7. Preliminary Quantitative Illustration
This section reports a preliminary use of the conceptual framework and its AnyLogic hybrid model. The load-falsification scenario is exercised under three conditions: normal operation (N), attacked without defense (A), and attacked with the defense agent active (D). This example illustrates the kind of measurable output the framework can produce. These preliminary results characterize the behavior of the modeled system only; they make no claim of empirical validation, which is outlined as future work.
5.7.1. Simulation Setup
The scenario represents a grid-connected microgrid serving six household agents over a 48-h horizon. The model was executed in AnyLogic with automatic numerical-method selection, in which the engine chooses between fixed-step Euler integration and fourth-order Runge–Kutta (RK4) according to the equations and their behavior, with a fixed reporting step of one minute. Renewable generation combines photovoltaic and wind production derived from hourly resource data for a site at 54.5° N, 2.7° W (2–5 July 2015): solar irradiance with temperature-dependent panel efficiency (12.2–13.1%) and wind at 100-m hub height (2.7–11.8 m/s), scaled to the microgrid’s size. Aggregate demand follows a double-peak daily profile between 5 and 15 kW. The household and pumped storage of Figure 5, Figure 6 and Figure 7 are aggregated into a single 60-kWh battery with a 10% state-of-charge floor and 60% initial charge; grid import serves as backup. Table 3 summarizes the configuration, which is exhaustive; the DSM procedures of Section 4.4 are not exercised in these runs.
Table 3.
Simulation setup and scenario parameters.
The Defense System agent compares the reported load p̃l with a reference p̂l. In this preliminary illustration p̂l is taken as the physical load pl, i.e., the detector is given an idealized oracle reference. This choice bounds the best-case detection delay and isolates the effect of the threshold and persistence settings; it does not represent an implementable detector. A forecast- or feeder-meter-based reference, with its own error, is the extension required before detection performance can be claimed.
5.7.2. Experimental Design
Six indicators, computed against the normal condition as reference, operationalize the resilience metrics: peak and integrated storage deviation (the maximum and time-integrated difference in stored energy relative to N), excess reported energy (cumulative falsified consumption forwarded to the controller), detection delay (time from attack onset to defense-agent detection), and recovery time (from mitigation until the trajectory rejoins the normal reference). A single-factor sensitivity study then varies, one at a time, around the base case: attack magnitude (5, 10, 20, 40%), attack duration (2, 6, 10 h), and detection threshold (5, 10, 25%). Because the model is deterministic for a given configuration, one run per configuration suffices, and no replication statistics are required. Stochastic measurement noise is not included in these runs. Table 4 summarizes the design.
Table 4.
Experimental design.
5.7.3. Results
Figure 10 presents the outcome of the three-condition comparison. Undefended, the +20% load falsification causes the controller, acting on the dispatch rule of Equation (7), to over-serve a demand that does not exist: the battery depletes faster than in normal operation, reaching its state-of-charge floor roughly three hours early, with a peak storage deviation of 11.8 kWh and 14.3 kWh of excess reported energy over the six-hour window (Table 5). With the defense agent active, the 5% deviation rule detects the attack within 2 min—a best-case figure given the oracle reference—and mitigation restores trusted readings within approximately 5 min of onset; the storage trajectory then remains indistinguishable from normal operation, and the attack’s only residue is 0.13 kWh of excess reported energy accumulated before mitigation. Because the battery is fully charged and not yet discharging when the attack begins at t = 16 h, mitigation at t ≈ 16:05 precedes any physical divergence between conditions; the defended case therefore shows that detection and mitigation prevent the physical consequence, but it does not exercise the Remediation transition of Section 5.4, and recovery time is reported as ≈0 for this reason. Unserved energy is zero in all three conditions because grid import, unconstrained in this configuration, covers the shortfall once storage reaches its floor; the attack’s physical cost therefore appears as accelerated storage depletion and 14.3 kWh of excess reported energy (Table 5), not as load loss.
Figure 10.
Stored energy under normal (N), attacked (A), and defended (D) conditions for the base-case load-falsification scenario (+20% reported-load inflation, t = 16–22 h). The attacked trajectory depletes faster during the attack window, reaching the storage floor roughly three hours early, with a peak deviation of 11.8 kWh; in the defended condition, detection occurs within 2 min of onset, mitigation restores trusted readings within ≈5 min, and the trajectory remains indistinguishable from normal operation.
Table 5.
Resilience indicators for the three conditions (base case: +20% load inflation, 6-h duration, 5% detection threshold).
The sensitivity study shows that peak storage deviation grows nearly linearly with attack magnitude (3.3, 6.6, 11.8, and 19.5 kWh at 5, 10, 20, and 40% inflation, respectively) and saturates with duration beyond approximately 6 h, when the battery reaches its state-of-charge floor, and the deviation can grow no further. The detection-threshold sweep quantifies the trade-off anticipated in Section 5.4: thresholds of 5% and 10% both detect the +20% attack within 2 min, whereas a 25% threshold never fires—the defended system then behaves identically to the undefended one, illustrating that an attacker who keeps the falsification below the configured threshold remains invisible to deviation-based detection.
6. Discussion
6.1. Positioning Relative to Existing Approaches
The cybersecurity challenges identified by [9] for distributed power systems, including vulnerability to coordinated attacks and the need for defense-in-depth strategies, provide context for the multi-layered modeling approach demonstrated in this work. Table 6 provides a comparative analysis of the proposed approach against existing methodologies documented in the literature.
Table 6.
Comparative Analysis of Modeling Approaches for Microgrid Cybersecurity.
Table 6 uses seven criteria: continuous energy dynamics means explicit stocks, flows, and feedback; heterogeneous behavior means distinct component agents; discrete attack states means named attack phases and transition logic; causal traceability means an explicit measurement-to-decision-to-action pathway; detection accuracy means a numerical detection metric; historical-data dependence means needing representative attack data for training; empirical validation means testing against measured data or a physical testbed. The cited works motivate these criteria [17,21,38,39,40,41,47,48]. Cells describe the particular formulations reviewed, not intrinsic limitations of every model in a paradigm. This is a qualitative scope comparison, not a common-benchmark performance test.
The demonstrated contribution is the explicit specification of the three-formalism architecture, attack-state progression, and a state-dependent measurement interface. The scenarios trace the causal pathway from falsified measurement to storage operation within the model; they do not validate it against a physical system. Analyst usefulness, reduced need for historical attack training data, and robustness to adversarial manipulation remain hypotheses. Explicit causal models can still be wrong or miscalibrated. The proposed framework complements data-driven detection through offline scenario exploration and causal analysis; it has not established superior detection or resilience performance.
The proposed approach addresses a gap explicitly identified by [17], who noted that “future studies would include the development of robust cybersecurity measures to protect MG infrastructure against potential cyber threats.” While their SD+ABM framework achieved frequency stability within ±0.1 Hz and stable voltage profiles, cybersecurity considerations were absent. The incorporation of statecharts in the present work provides a formal mechanism for representing discrete attack states that complements the continuous dynamics captured by SD and the heterogeneous behaviors modeled through ABM.
Data-driven approaches provide numerical detection and localization results for their evaluated datasets, whereas this work reports a preliminary model-based illustration. Explicit attack states offer a traceable representation, but usefulness for root-cause analysis or defense design requires evaluation with analysts and validated scenarios.
The hybrid IDS concept discussed by [21] provides theoretical grounding for the proposed approach. They note that hybrid IDS, combining cyber- and physical-space data, extends detection beyond either domain alone but remains underexplored for smart inverters. The SD+ABM+Statecharts integration conceptually aligns with this hybrid paradigm, combining physical-layer dynamics (SD and ABM) with cyber-layer state representations (statecharts).
6.2. Theoretical Implications
This paper contributes to the theoretical understanding of multi-paradigm modeling for cyber-physical systems in several ways.
First, the integration is designed to be complementary: SD represents energy stocks and feedback, ABM component heterogeneity, and statecharts explicit event-driven phases. The theoretical foundations for combining continuous and discrete dynamics within unified models were established in early work on hybrid systems [35], which the proposed SD+ABM+Statecharts integration operationalizes for cyber-physical MG analysis. SD provides the macro-level perspective on system-wide energy dynamics through stocks, flows, and feedback loops. ABM captures micro-level heterogeneity and emergent behaviors arising from agent interactions. The statechart formalism, originally developed by Harel [34] for specifying complex reactive systems, provides a structured approach for representing the discrete, event-driven nature of cyberattacks within continuous cyber-physical system models. The combination enables representation of phenomena that no single paradigm could adequately capture alone, specifically, the interplay between continuous physical processes and discrete cyber events.
Second, Rouhani and Su [11] note that cybersecurity has been addressed mainly from computer and communication engineering, overlooking power-system dynamics and the interdependencies between cyber and physical components. By embedding statecharts within an SD+ABM framework, the proposed approach maintains awareness of power-system dynamics while formally representing cyber threat progression.
Third, the explicit representation of attack progression from reconnaissance through exploitation to impact phases aligns with established cyber threat modeling frameworks, including the Cyber Kill Chain [43] and MITRE ATT&CK for ICS [44]. This alignment facilitates integration with existing threat intelligence workflows and provides a structured ontology for attack modeling. The taxonomic alignment with CIA categories [18] further supports communication between cybersecurity specialists and power systems engineers, potentially addressing the interdisciplinary fragmentation noted in recent reviews [11].
6.3. Practical Implications
From a practitioner perspective, the proposed approach offers several potential benefits.
For MG operators, the hybrid model provides a platform for scenario analysis and contingency planning. Unlike purely statistical approaches that require historical attack data for training, the model-based approach enables exploration of hypothetical attack scenarios, including novel or zero-day threats. This aligns with the proactive detection strategy advocated by [49], which emphasizes “ early detection of [coordinated cyber-attacks] by establishing correlations among distinct attack events.”
The modeling structure is compatible in principle with digital-twin architectures for MG cybersecurity [31,50] and with multi-domain co-simulation interfaces such as HELICS [51]; such use would require calibration against measured data and validation on a physical or hardware-in-the-loop testbed, neither of which is addressed here.
For cybersecurity analysts, the explicit statechart representation supports threat intelligence activities. The formal specification of attack states and transitions can inform the development of detection rules and response protocols. This interpretability advantage is particularly relevant given concerns about the opacity of machine learning-based intrusion detection systems [21,25].
For system designers, the modular architecture supports iterative development. The framework’s architecture is compatible with hybrid co-simulation testbeds documented in the recent literature [52,53], which combine cyber and physical domain simulators. Coupling with such testbeds is a prerequisite for validating the approach against realistic attack scenarios and remains future work while maintaining the safety of offline analysis. Components can be refined independently, for example, updating the statechart library to incorporate newly identified attack vectors, without requiring complete model reconstruction.
6.4. Comparison with Data-Driven Approaches
The 2DR-CNN method of [47] achieves approximately 95% localization accuracy for dynamic load-altering attacks on the IEEE 57-bus system, outperforming traditional machine learning benchmarks including SVM, DNN, and 1D-CNN. Similarly, Ref. [48] demonstrate that graph neural networks (GGNN) can achieve perfect detection scores (F1 = 1.00, AUC = 1.00) for false data injection attacks across multiple IEEE bus system scales.
Shees et al. [54] investigate supervised learning for false-data-injection detection in smart grids, reporting 98% detection accuracy with an Extra Tree classifier on their evaluated dataset. This result illustrates the distinction between dataset-based detector assessment and the conceptual attack-scenario specification proposed here, for which no comparable detection score is reported.
However, these data-driven approaches face limitations that the proposed model-based approach may address. First, regarding data dependency: as Ref. [48] notes, “existing datasets used to evaluate these methods have several limitations, including restricted availability, limited attack scenarios, and a lack of fidelity assessment.” Model-based approaches can generate synthetic scenarios for testing without requiring historical attack data, addressing the challenge that “cyberattacks are rare, diverse, and often undisclosed due to security concerns” [11].
Second, regarding adversarial vulnerability: the same authors demonstrate that “deep neural models remain vulnerable to adversarial threats,” with PGD-based attacks significantly degrading detection performance. Model-based approaches grounded in physical principles may exhibit greater robustness to such manipulations, as the underlying causal structure is explicitly defined rather than learned from potentially compromised data. This is an untested hypothesis; explicit physics does not guarantee robustness to incorrect measurements, parameter errors, or misspecified control logic. Third, regarding interpretability: the black-box nature of deep learning models complicates root cause analysis and regulatory compliance [11]; the explicit state-transition representation in statecharts addresses this limitation.
Fast cyber-induced cascading dynamics discussed in [55] further motivate coupling to physically detailed simulators. The present aggregated energy-balance formulation does not resolve such second-scale cascades and cannot reproduce their timing.
Rather than positioning model-based and data-driven approaches as mutually exclusive, future research may benefit from hybrid architectures that leverage the strengths of both paradigms, using model-based frameworks for scenario generation and interpretability while incorporating machine learning for pattern recognition and real-time detection.
6.5. Future Directions for Quantitative Stability and Resilience Analysis
Section 5.7 operationalizes an initial set of resilience indicators; future work extends them with false-alarm rate under measurement noise and storage cycling under repeated attacks. These metrics will enable systematic comparison between normal operation, attack scenarios, and defense-enabled responses, supporting empirical validation of resilience strategies. Attention will be given to developing stability-oriented analyses that remain consistent with the technology-agnostic philosophy of the model, as a possible longer-term step toward a quantitative digital twin, contingent on empirical validation in IoT-enabled MGs.
Quantitative stability analysis first requires an explicit controller-to-actuator coupling, followed by a reduced-order frequency representation (such as a swing or droop relation driven by net power imbalance) and power-flow constraints. The measurement-injection construct should also be extended with delay/buffer and additive operators for replay, delay, and bias injection. These are proposed extensions, not existing validated capabilities.
The preliminary sensitivity study of Section 5.7.3 varied magnitude, duration, and threshold; communication delay requires a transport element not present in the current construct and remains future work. A factorial design with attack-free, attacked, and defense-enabled cases would assess the indicators of Section 5.7.2, extended with false-alarm rate and storage cycling. Parameter ranges, replication, and uncertainty treatment must be fixed before experiments.
A validation plan has two complementary paths: parameterization against a recognized CIGRE medium-voltage benchmark or an IEEE 13- or 34-bus feeder, with operating mode and DER/storage configuration explicitly defined; and coupling to co-simulation or hardware-in-the-loop testbeds [52,53], potentially using HELICS [51]. Feeder topology alone does not validate electrical dynamics or a microgrid controller. Comparisons must align controller behavior, attack timing, measurements, and metrics. These studies remain future work, and no benchmark agreement is claimed.
6.6. Limitations
Several limitations bound the scope of this work. Coupling continuous SD integration with a population of interacting agents and concurrent statecharts increases computational demand relative to single-paradigm models, and this demand grows with the number of agents and the integration resolution. The approach is therefore better suited to offline analysis and planning than to real-time operation, where data-driven detection methods remain more appropriate.
The model’s fidelity is deliberately asymmetric across layers, and this trade-off merits explicit statement. The cyber layer is represented at the tactical level of abstraction: the attacker’s progression, its preconditions, and its interaction with detection logic are modeled explicitly through statecharts, but packet- and protocol-level mechanics—frame timing, ARP cache dynamics, retransmission, encryption handshakes—are compressed into guard conditions and state dwell times (Section 5.1). The physical layer is likewise represented at the energy-balance level rather than the electrical-transient level (Section Details of the Model). What the framework resolves at full fidelity is the coupling between the two: how a discrete cyber event becomes a continuous physical consequence, which is where the quantitative impacts of Section 5.7 are measured. This allocation of fidelity reflects the framework’s purpose, and its cost is that phenomena living inside the abstracted layers (protocol-specific evasion techniques, electrical transients) cannot be studied with it.
The scenarios are restricted to measurement falsification enabled by ARP spoofing. Other attack classes relevant to microgrids—including communication DoS, replay, firmware compromise, and coordinated multi-point attacks—are not represented. Although the injection mechanism is designed to be extensible, its applicability to these classes has not been demonstrated. The Defense System agent acts as an observer-and-response layer. The attacker does not adapt its strategy to the defender’s actions, and attacker–defender interaction is not formulated as a game; consequently, the model cannot represent strategic escalation, deception, or equilibrium behavior between the two parties. The model operates at the level of aggregated power balance and does not represent network-layer protocol behavior, voltage, frequency, or converter dynamics. In addition, the scenarios are illustrative and have not been validated against measured data or a physical testbed.
7. Conclusions
This paper presented a multi-paradigm modeling approach that integrates SD, Agent-Based Modeling, and statecharts to represent IoT-enabled MGs under cybersecurity threats. The central methodological element is a state-dependent modification of controller-received sensor data that is distinguished from the physical energy-balance equations. This representation makes the potential pathway from cyberattack to controller action and subsequent physical response explicit, without assuming that measurement tampering directly changes physical power. Through two worked scenarios—ARP spoofing and smart-meter consumption manipulation—the approach was shown to be feasible and to produce measurable resilience indicators and to offer interpretability and causal traceability that complement, rather than replace, data-driven detection methods.
The scope of this work is methodological and illustrative; it does not claim empirical validation; the quantitative illustration of Section 5.7 characterizes the modeled system only. The approach is deliberately attacker-centric. The Defense System is specified as an observer-and-response layer with proposed detection, confirmation, containment, and recovery criteria, but these criteria were exercised with uncalibrated base-case values; calibration remains future work.
The limitations of the approach are consolidated in Section 6.6. Future work follows the validation path of Section 6.5: calibration of the detector against operating data, extension of the indicator set with false-alarm rate under measurement noise, and parameterization against a recognized distribution benchmark prior to co-simulation or hardware-in-the-loop validation.
Author Contributions
Conceptualization, J.G.-d.-D. and L.R.; methodology, J.G.-d.-D., L.R. and C.R.-G.; software, J.G.-d.-D., M.P. and J.Z.-A.; Model Verification and Internal Review, M.E., F.A. and E.G.-F.; formal analysis, J.G.-d.-D., L.R. and F.A.; investigation, C.R.-G., J.Z.-A. and N.O.-M.; resources, L.R.; data curation, M.P. and N.O.-M.; writing—original draft preparation, J.G.-d.-D. and L.R.; writing—review and editing, C.R.-G., M.E., F.A. and E.G.-F.; visualization, M.P. and N.O.-M.; supervision, L.R. and E.G.-F.; project administration, L.R. All authors have read and agreed to the published version of the manuscript.
Funding
The authors would like to thank the Ongoing Research Funding Program (ORF-2026-1514), King Saud University, Riyadh, Saudi Arabia, for funding this work.
Data Availability Statement
The original contributions presented in this study are included in the article. Further inquiries can be directed to the corresponding author.
Conflicts of Interest
The authors declare no conflicts of interest.
References
- Ferraro, P.; Crisostomi, E.; Raugi, M.; Milano, F. On the impact of microgrid energy management systems on power system dynamics. In Proceedings of the IEEE Power & Energy Society General Meeting (PESGM), Chicago, IL, USA, 16–20 July 2017; pp. 1–5. [Google Scholar] [CrossRef] [Scilit]
- Meng, L.; Dragicevic, T.; Roldán-Pérez, J.; Vasquez, J.C.; Guerrero, J.M. Modeling and sensitivity study of consensus algorithm-based distributed hierarchical control for DC microgrids. IEEE Trans. Smart Grid 2016, 7, 1504–1515. [Google Scholar] [CrossRef] [Scilit]
- Sedhom, B.E.; El-Saadawi, M.M.; El Moursi, M.S.; Hassan, M.A.; Eladl, A.A. IoT-based optimal demand side management and control scheme for smart microgrid. Int. J. Electr. Power Energy Syst. 2021, 127, 106674. [Google Scholar] [CrossRef] [Scilit]
- Harmon, E.; Ozgur, U.; Cintuglu, M.H.; De Azevedo, R.; Akkaya, K.; Mohammed, O.A. The Internet of microgrids: A cloud-based framework for wide area networked microgrids. IEEE Trans. Ind. Inform. 2018, 14, 1262–1274. [Google Scholar] [CrossRef] [Scilit]
- Lei, L.; Tan, Y.; Dahlenburg, G.; Xiang, W.; Zheng, K. Dynamic energy dispatch based on deep reinforcement learning in IoT-driven smart isolated microgrids. IEEE Internet Things J. 2021, 8, 7938–7953. [Google Scholar] [CrossRef] [Scilit]
- Silva, J.A.A.; López, J.C.; Guzman, C.P.; Arias, N.B.; Rider, M.J.; da Silva, L.C.P. An IoT-based energy management system for AC microgrids with grid and security constraints. Appl. Energy 2023, 337, 120904. [Google Scholar] [CrossRef] [Scilit]
- Guan, Y.; Feng, W.; Wu, Y.; Vasquez, J.C.; Guerrero, J.M. An IoT platform-based multi-objective energy management system for residential microgrids. In Proceedings of the IEEE 9th International Power Electronics and Motion Control Conference (IPEMC-ECCE Asia), Nanjing, China, 29 November–2 December 2020; pp. 3107–3112. [Google Scholar] [CrossRef] [Scilit]
- Murugan, G.; Vijayarajan, S. IoT based secured data monitoring system for renewable energy fed micro grid system. Sustain. Energy Technol. Assess. 2023, 57, 103244. [Google Scholar] [CrossRef] [Scilit]
- Li, Z.; Shahidehpour, M.; Aminifar, F. Cybersecurity in distributed power systems. Proc. IEEE 2017, 105, 1367–1388. [Google Scholar] [CrossRef] [Scilit]
- Blouin, S.; Herwix, A.; Rivers, M.; Tieman, R.J.; Denkenberger, D.C. Assessing the impact of catastrophic electricity loss on the food supply chain. Int. J. Disaster Risk Sci. 2024, 15, 481–493. [Google Scholar] [CrossRef] [Scilit]
- Rouhani, S.H.; Su, C.-L. Future cyber-resilient renewable and sustainable smart grids: A critical review from power system researchers’ perspective on emerging threats and solutions. Renew. Sustain. Energy Rev. 2026, 226, 116299. [Google Scholar] [CrossRef] [Scilit]
- Ding, L.; Han, Q.-L.; Ning, B.; Yue, D. Distributed resilient finite-time secondary control for heterogeneous battery energy storage systems under denial-of-service attacks. IEEE Trans. Ind. Inform. 2020, 16, 4909–4919. [Google Scholar] [CrossRef] [Scilit]
- Chlela, M.; Joos, G.; Kassouf, M.; Brissette, Y. Real-time testing platform for microgrid controllers against false data injection cybersecurity attacks. In Proceedings of the IEEE Power & Energy Society General Meeting (PESGM), Boston, MA, USA, 17–21 July 2016; pp. 1–5. [Google Scholar] [CrossRef] [Scilit]
- Angjelichinoski, M.; Danzi, P.; Stefanovic, C.; Popovski, P. Secure and robust authentication for DC microgrids based on power talk communication. In Proceedings of the IEEE International Conference on Communications (ICC), Paris, France, 21–25 May 2017. [Google Scholar] [CrossRef] [Scilit]
- Li, Z.; Shahidehpour, M.; Liu, X. Cyber-secure decentralized energy management for IoT-enabled active distribution networks. J. Mod. Power Syst. Clean Energy 2018, 6, 900–917. [Google Scholar] [CrossRef] [Scilit]
- Akhatova, A.; Kranzl, L.; Schipfer, F.; Heendeniya, C.B. Agent-based modelling of urban district energy system decarbonisation—A systematic literature review. Energies 2022, 15, 554. [Google Scholar] [CrossRef] [Scilit]
- Aljarbouh, A.; Zubov, D.; Moghrabi, I.A.R. Multi-paradigm modelling and control of microgrid systems for better power stability in the Rockaways. Front. Energy Res. 2024, 12, 1404811. [Google Scholar] [CrossRef] [Scilit]
- Gunduz, M.Z.; Das, R. Cyber-security on smart grid: Threats and potential solutions. Comput. Netw. 2020, 169, 107094. [Google Scholar] [CrossRef] [Scilit]
- Gonzalez-de-Durana, J.; Rabelo, L.; Zamora-Aguas, J.; Rincon-Guio, C. Preliminary modeling of cyber attackers in microgrids: An agent-based and system dynamics approach enhanced with statecharts. In Industrial Engineering and Operations Management, IEOM-CS 2025; Florez, H., Rabelo, L., Diaz, C., Eds.; Communications in Computer and Information Science; Springer: Cham, Switzerland, 2026; Volume 2557, pp. 325–340. [Google Scholar] [CrossRef] [Scilit]
- Amanlou, S.; Hasan, M.K.; Asma’ Mokhtar, U.; Mahmood Malik, K.; Islam, S.; Khan, S.; Attique Khan, M.; Asghar Khan, M. Cybersecurity challenges in smart grid systems: Current and emerging attacks, opportunities, and recommendations. IEEE Open J. Commun. Soc. 2025, 6, 1965–1997. [Google Scholar] [CrossRef] [Scilit]
- Li, Y.; Yan, J. Cybersecurity of smart inverters in the smart grid: A survey. IEEE Trans. Power Electron. 2023, 38, 2364–2383. [Google Scholar] [CrossRef] [Scilit]
- Ahmed, I.; El-Rifaie, A.M.; Akhtar, F.; Ahmad, H.; Alaas, Z.; Ahmed, M.M.R. Cybersecurity in microgrids: A review on advanced techniques and practical implementation of resilient energy systems. Energy Strategy Rev. 2025, 58, 101654. [Google Scholar] [CrossRef] [Scilit]
- Tan, S.; Xie, P.; Vasquez, J.C.; Guerrero, J.M. Developments, challenges and future opportunities in cybersecure microgrid control. Nat. Rev. Electr. Eng. 2025, 2, 522–540. [Google Scholar] [CrossRef] [Scilit]
- Rath, S.; Das, T.; Sengupta, S. Improvise, adapt, overcome: Dynamic resiliency against unknown attack vectors in microgrid cybersecurity games. IEEE Trans. Smart Grid 2024, 15, 4245–4258. [Google Scholar] [CrossRef] [Scilit]
- Cuevas, M.; Álvarez-Malebrán, R.; Rahmann, C.; Ortiz, D.; Peña, J.; Rozas-Valderrama, R. Artificial intelligence techniques for dynamic security assessments—A survey. Artif. Intell. Rev. 2024, 57, 340. [Google Scholar] [CrossRef] [Scilit]
- Wang, Y.; Pal, B.C. Destabilizing attack and robust defense for inverter-based microgrids by adversarial deep reinforcement learning. IEEE Trans. Smart Grid 2023, 14, 4839–4850. [Google Scholar] [CrossRef] [Scilit]
- Chen, P.; Liu, S.; Chen, B.; Yu, L. Multi-agent reinforcement learning for decentralized resilient secondary control of energy storage systems against DoS attacks. IEEE Trans. Smart Grid 2022, 13, 1739–1750. [Google Scholar] [CrossRef] [Scilit]
- Cheng, Z.; Chow, M.Y. Resilient collaborative distributed energy management system framework for cyber-physical DC microgrids. IEEE Trans. Smart Grid 2020, 11, 4637–4649. [Google Scholar] [CrossRef] [Scilit]
- Chen, Y.; Qi, D.; Dong, H.; Li, C.; Li, Z.; Zhang, J. A FDI attack-resilient distributed secondary control strategy for islanded microgrids. IEEE Trans. Smart Grid 2021, 12, 1929–1938. [Google Scholar] [CrossRef] [Scilit]
- Lu, L.Y.; Liu, H.J.; Zhu, H.; Chu, C.C. Intrusion detection in distributed frequency control of isolated microgrids. IEEE Trans. Smart Grid 2019, 10, 6502–6515. [Google Scholar] [CrossRef] [Scilit]
- Abdelrahman, M.S.; Kharchouf, I.; Hussein, H.M.; Esoofally, M.; Mohammed, O.A. Enhancing cyber-physical resiliency of microgrid control under denial-of-service attack with digital twins. Energies 2024, 17, 3927. [Google Scholar] [CrossRef] [Scilit]
- Liu, X.; Shahidehpour, M.; Cao, Y.; Wu, L.; Wei, W.; Liu, X. Microgrid risk analysis considering the impact of cyber attacks on solar PV and ESS control systems. IEEE Trans. Smart Grid 2017, 8, 1330–1339. [Google Scholar] [CrossRef] [Scilit]
- Wang, B.; Dabbaghjamanesh, M.; Kavousi-Fard, A.; Mehraeen, S. Cybersecurity enhancement of power trading within the networked microgrids based on blockchain and directed acyclic graph approach. IEEE Trans. Ind. Appl. 2019, 55, 7300–7309. [Google Scholar] [CrossRef] [Scilit]
- Harel, D. Statecharts: A visual formalism for complex systems. Sci. Comput. Program. 1987, 8, 231–274. [Google Scholar] [CrossRef] [Scilit]
- Maler, O.; Manna, Z.; Pnueli, A. From timed to hybrid systems. In Lecture Notes in Computer Science; de Bakker, J.W., Huizing, C., de Roever, W.P., Rozenberg, G., Eds.; Springer: Berlin/Heidelberg, Germany, 1992; Volume 600, pp. 447–484. [Google Scholar] [CrossRef] [Scilit]
- El Ariss, O.; Xu, D. Modeling security attacks with statecharts. In Proceedings of the Joint ACM SIGSOFT Conference on Quality of Software Architectures (QoSA) and ACM SIGSOFT Symposium on Architecting Critical Systems (ISARCS), Boulder, CO, USA, 20–24 June 2011; pp. 123–132. [Google Scholar] [CrossRef] [Scilit]
- de Durana, J.G.; Rabelo, L.; Elkamel, M. A novel system dynamics approach to DC microgrid power flow analysis. In Proceedings of the Winter Simulation Conference (WSC), Seattle, WA, USA, 7–10 December 2025; pp. 2039–2050. [Google Scholar] [CrossRef] [Scilit]
- Ibrahim, B.; Rabelo, L.; Sarmiento, A.T.; Gutierrez-Franco, E. A holistic approach to power systems using innovative machine learning and system dynamics. Energies 2023, 16, 5225. [Google Scholar] [CrossRef] [Scilit]
- Kubli, M.; Ulli-Beer, S. Decentralisation dynamics in energy systems: A generic simulation of network effects. Energy Res. Soc. Sci. 2016, 13, 71–83. [Google Scholar] [CrossRef] [Scilit]
- Gonzalez de Durana, J.; Barambones, O. Technology-free microgrid modeling with application to demand side management. Appl. Energy 2018, 219, 165–178. [Google Scholar] [CrossRef] [Scilit]
- Kremers, E.; Viejo, P.; Barambones, O.; de Durana, J.G. A complex systems modelling approach for decentralised simulation of electrical microgrids. In Proceedings of the 15th IEEE International Conference on Engineering of Complex Computer Systems (ICECCS), Oxford, UK, 22–26 March 2010; pp. 302–311. [Google Scholar] [CrossRef] [Scilit]
- Koduru, S.S.; Machina, V.S.P.; Madichetty, S. Cyber attacks in cyber-physical microgrid systems: A comprehensive review. Energies 2023, 16, 4573. [Google Scholar] [CrossRef] [Scilit]
- Hutchins, E.M.; Cloppert, M.J.; Amin, R.M. Intelligence-driven computer network defense informed by analysis of adversary campaigns and intrusion kill chains. In Proceedings of the 6th International Conference on Information Warfare and Security (ICIW), Washington, DC, USA, 17–18 March 2011; pp. 113–125. Available online: https://www.lockheedmartin.com/content/dam/lockheed-martin/rms/documents/cyber/LM-White-Paper-Intel-Driven-Defense.pdf (accessed on 15 September 2026).
- Alexander, O.; Belisle, M.; Steele, J. MITRE ATT&CK for Industrial Control Systems: Design and Philosophy; The MITRE Corporation: Bedford, MA, USA, 2020. [Google Scholar]
- McPherson, M.; Sotiropoulos-Michalakakos, T.; Harvey, L.D.D.; Karney, B. An Open-Access Web-Based Tool to Access Global, Hourly Wind and Solar PV Generation Time-Series Derived from the MERRA Reanalysis Dataset. Energies 2017, 10, 1007. [Google Scholar] [CrossRef] [Scilit]
- Stackhouse, P.W. Atmospheric Science Data Center (ASDC) at NASA Langley Research Center. Available online: https://asdc.larc.nasa.gov/ (accessed on 13 October 2026).
- Jahangir, H.; Lakshminarayana, S.; Maple, C.; Epiphaniou, G. A deep-learning-based solution for securing the power grid against load altering threats by IoT-enabled devices. IEEE Internet Things J. 2023, 10, 10687–10697. [Google Scholar] [CrossRef] [Scilit]
- Kadri, B.; Sliman, L.; Alsaedi, A.; Abdella, J.; Farah, Z. Physics-aware hybrid estimator for dynamic power system dataset generation and cyber attack simulation. IEEE Access 2025, 13, 146830–146853. [Google Scholar] [CrossRef] [Scilit]
- Sahani, N.; Liu, C.-C. Model-based detection of coordinated attacks (DCA) in distribution systems. IEEE Open Access J. Power Energy 2024, 11, 559–570. [Google Scholar] [CrossRef] [Scilit]
- Saad, A.; Faddel, S.; Youssef, T.; Mohammed, O.A. On the implementation of IoT-based digital twin for networked microgrids resiliency against cyber attacks. IEEE Trans. Smart Grid 2020, 11, 5138–5150. [Google Scholar] [CrossRef] [Scilit]
- Hardy, T.D.; Palmintier, B.; Top, P.L.; Krishnamurthy, D.; Fuller, J.C. HELICS: A Co-Simulation Framework for Scalable Multi-Domain Modeling and Analysis. IEEE Access 2024, 12, 24325–24347. [Google Scholar] [CrossRef] [Scilit]
- Abdelrahman, M.S.; Kharchouf, I.; Nguyen, T.L.; Mohammed, O.A. A hybrid physical co-simulation smart grid testbed for testing and impact analysis of cyber-attacks on power systems: Framework and attack scenarios. Energies 2023, 16, 7771. [Google Scholar] [CrossRef] [Scilit]
- Cao, G.; Gu, W.; Gu, C.; Sheng, W.; Pan, J.; Li, R.; Sun, L. Real-time cyber–physical system co-simulation testbed for microgrids control. IET Cyber-Phys. Syst. Theory Appl. 2019, 4, 38–45. [Google Scholar] [CrossRef] [Scilit]
- Shees, A.; Tariq, M.; Sarwat, A.I. Cybersecurity in Smart Grids: Detecting False Data Injection Attacks Utilizing Supervised Machine Learning Techniques. Energies 2024, 17, 5870. [Google Scholar] [CrossRef] [Scilit]
- Rajkumar, V.S.; Ştefanov, A.; Rueda Torres, J.L.; Palensky, P. Dynamical analysis of power system cascading failures caused by cyber attacks. IEEE Trans. Ind. Inform. 2024, 20, 8807–8817. [Google Scholar] [CrossRef] [Scilit]
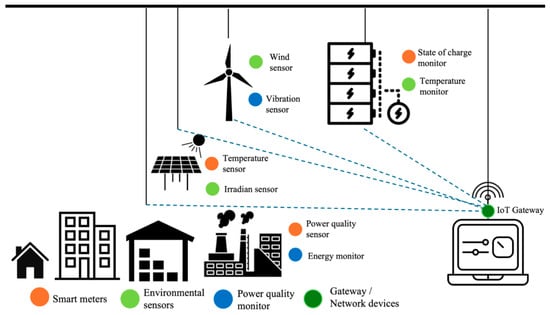
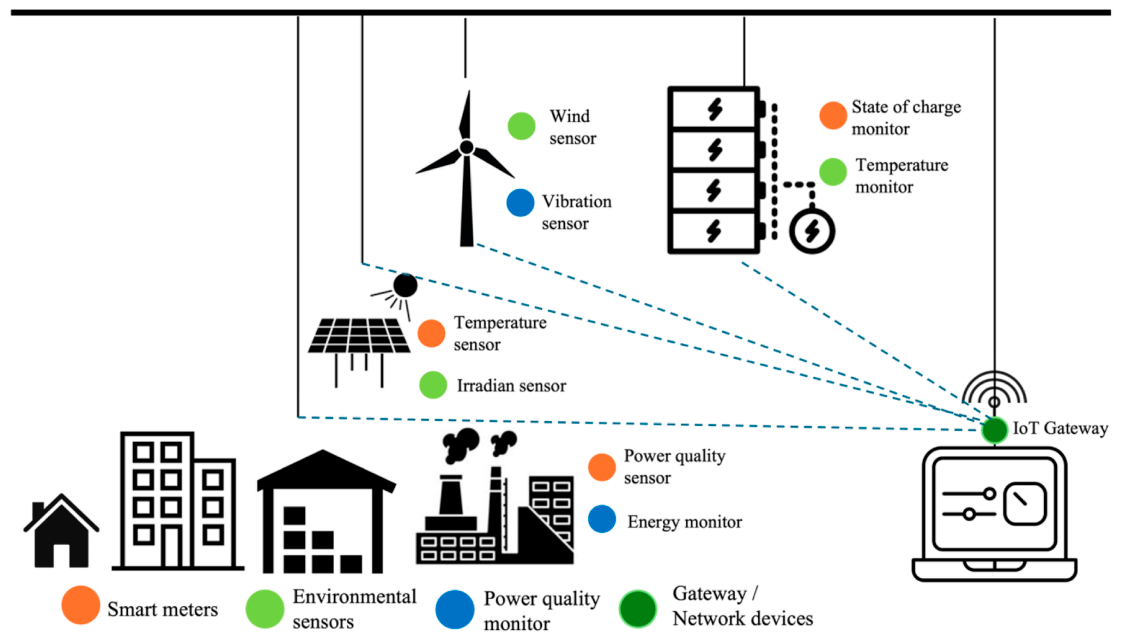
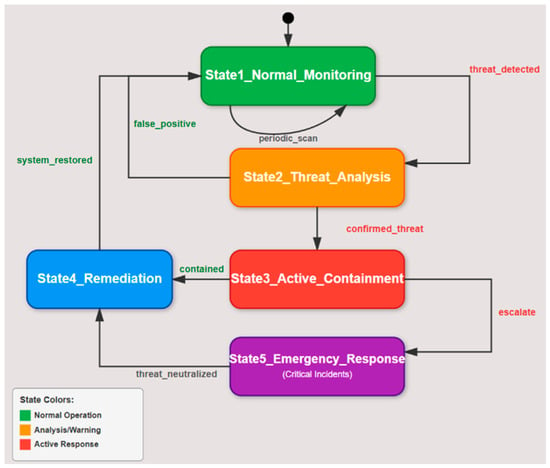
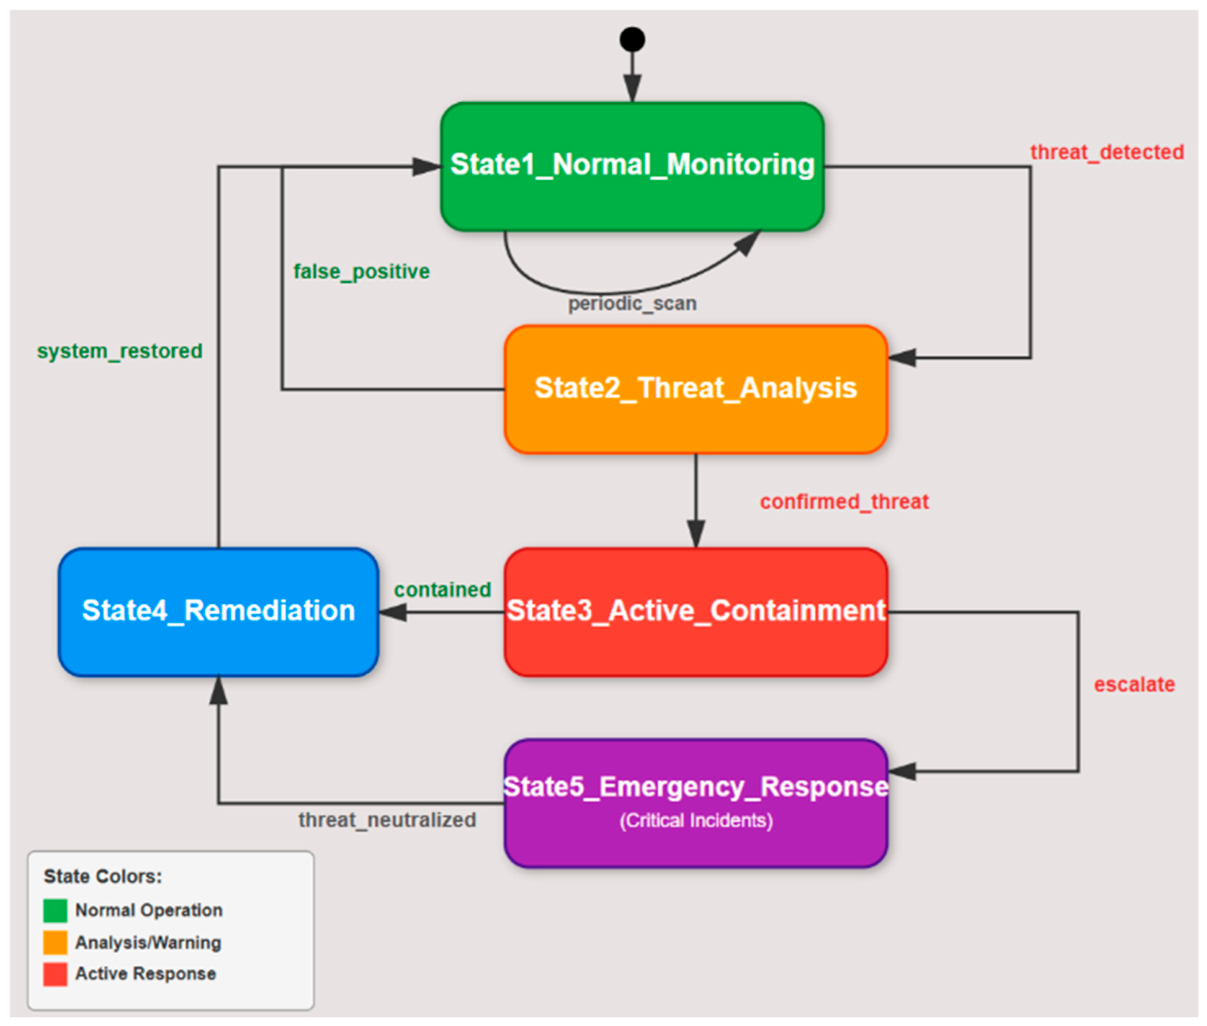
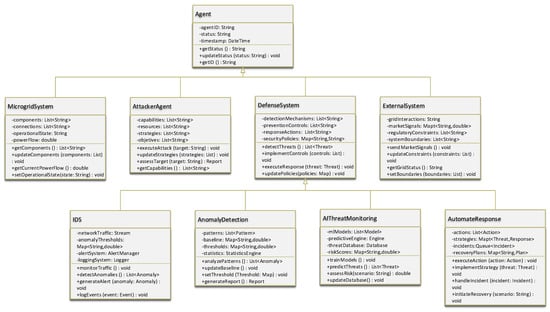
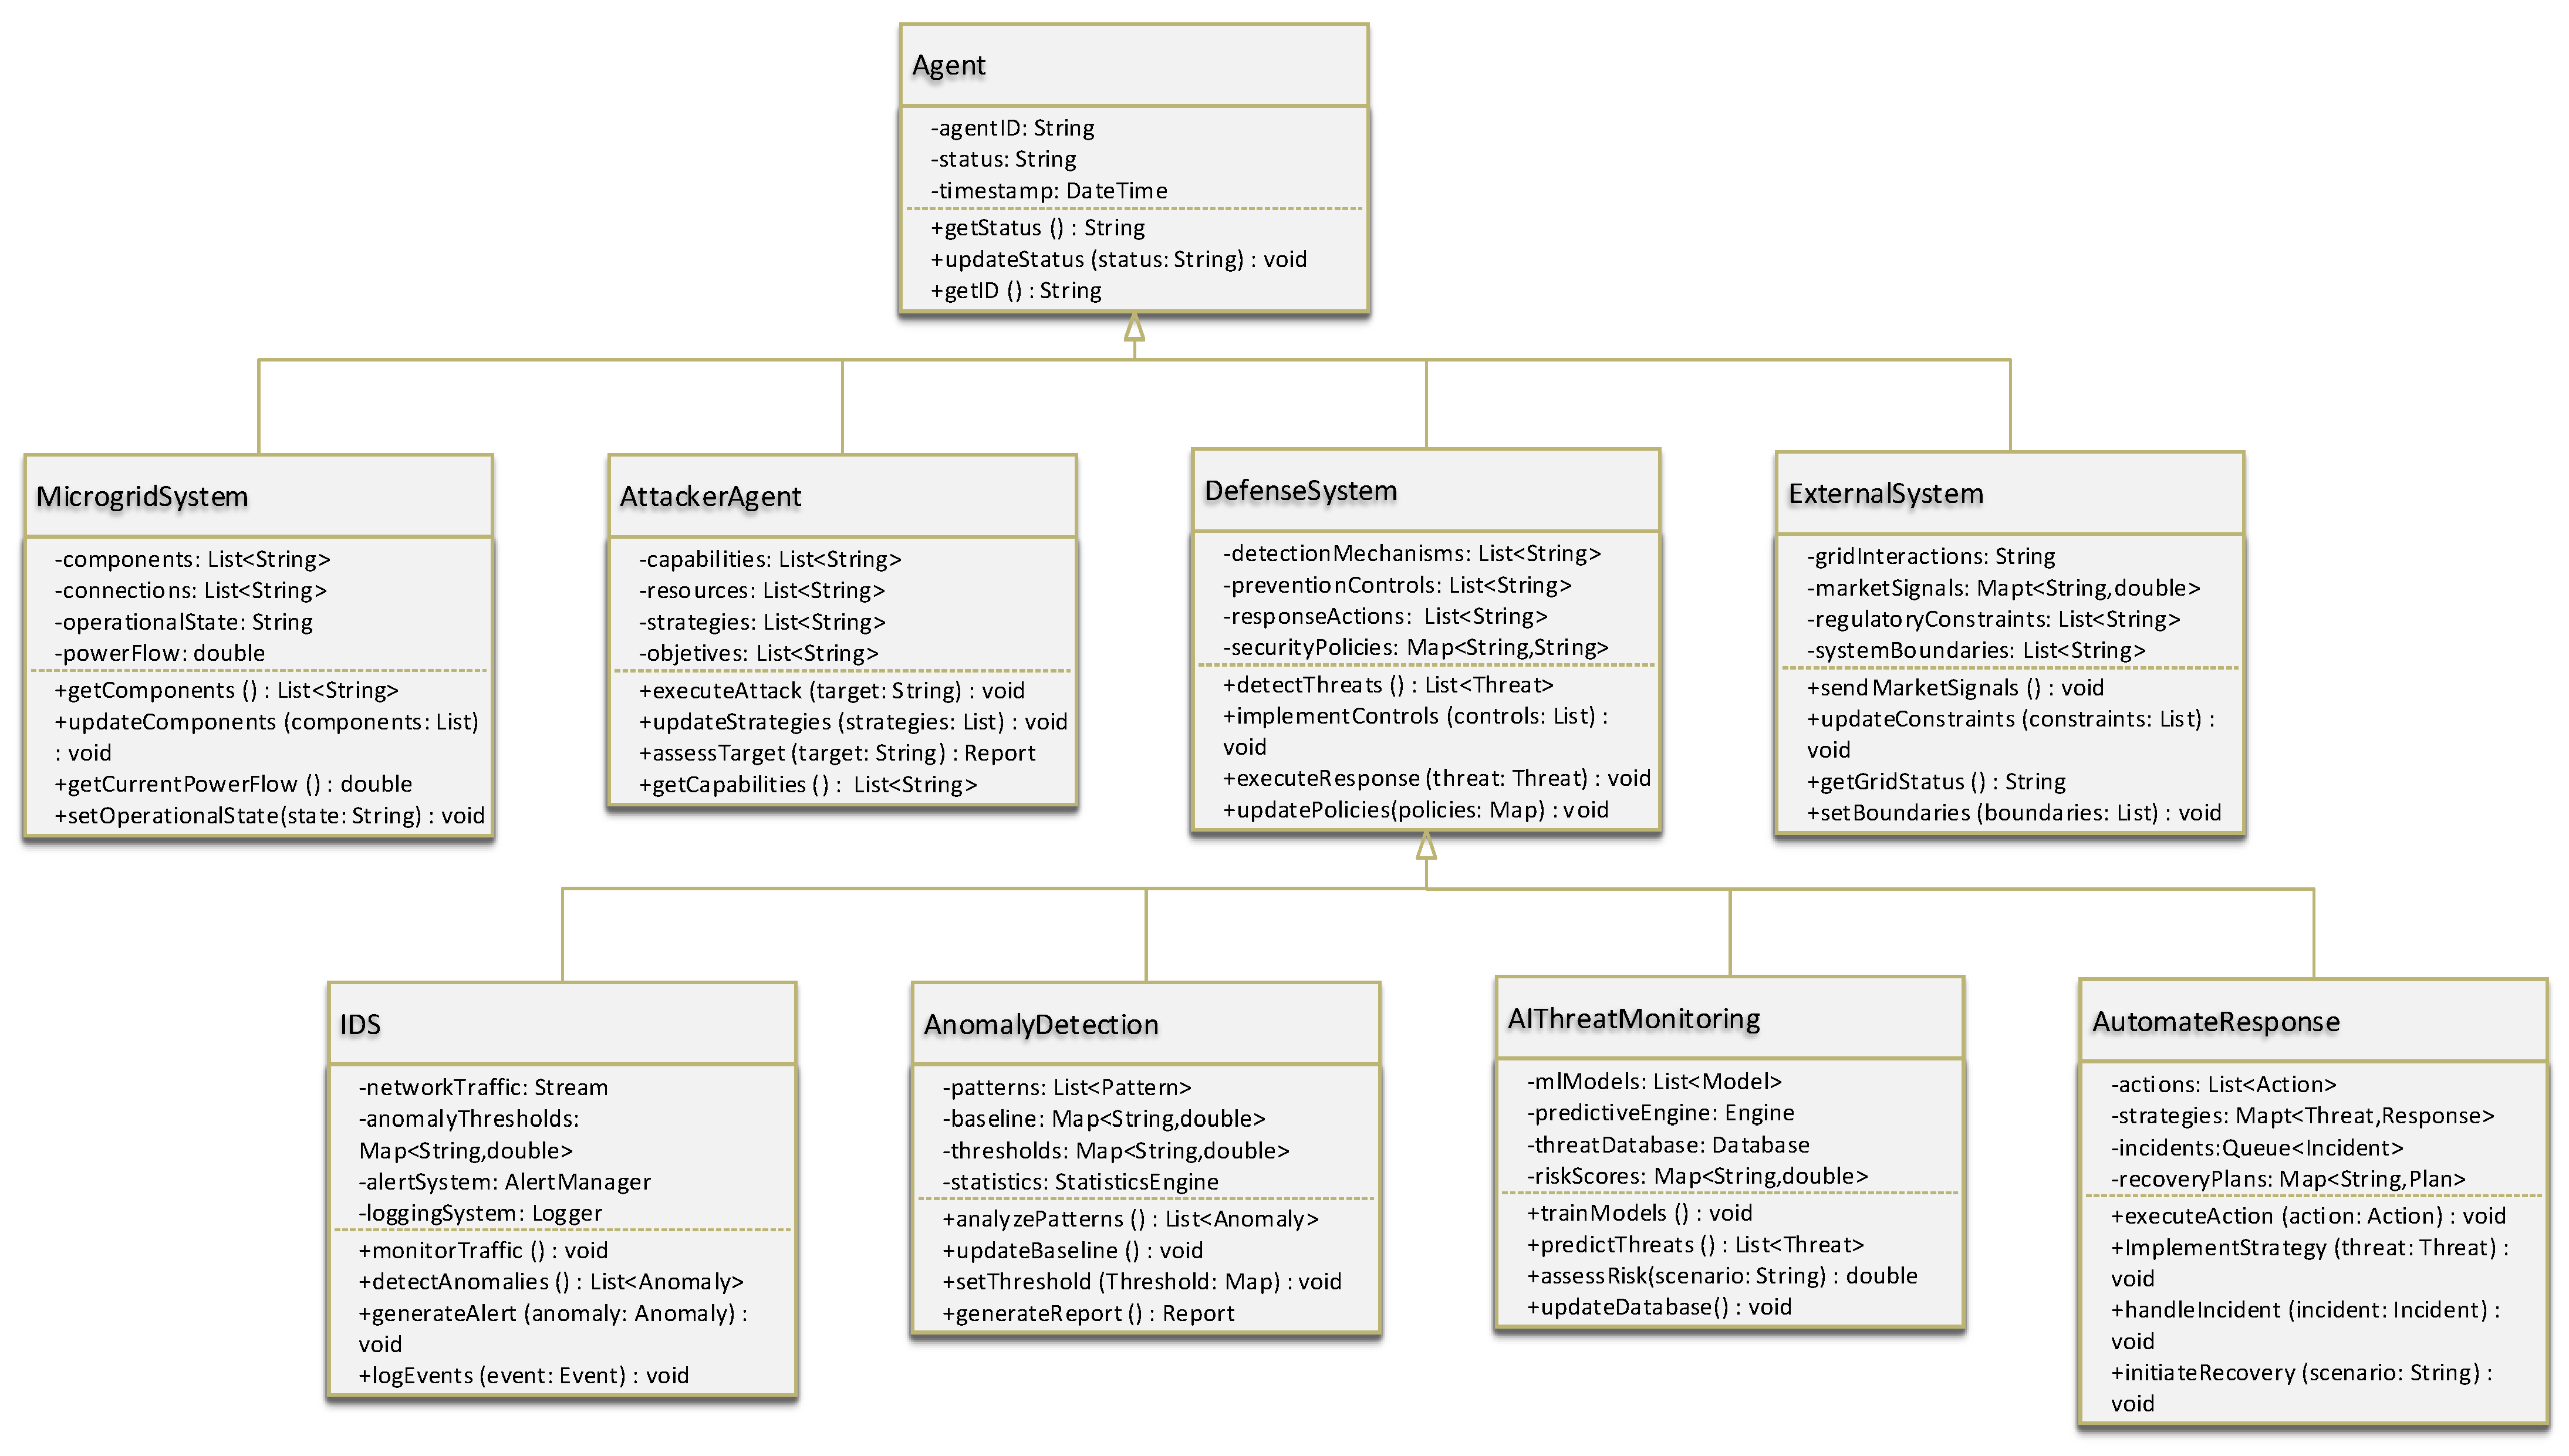
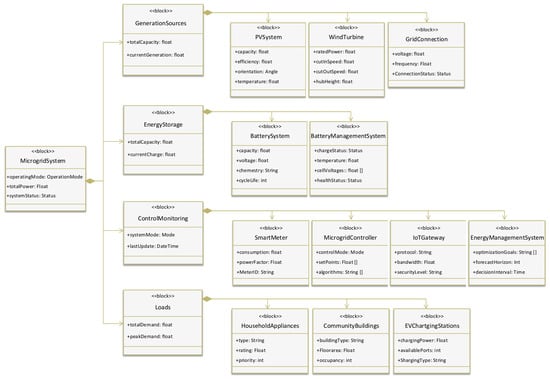
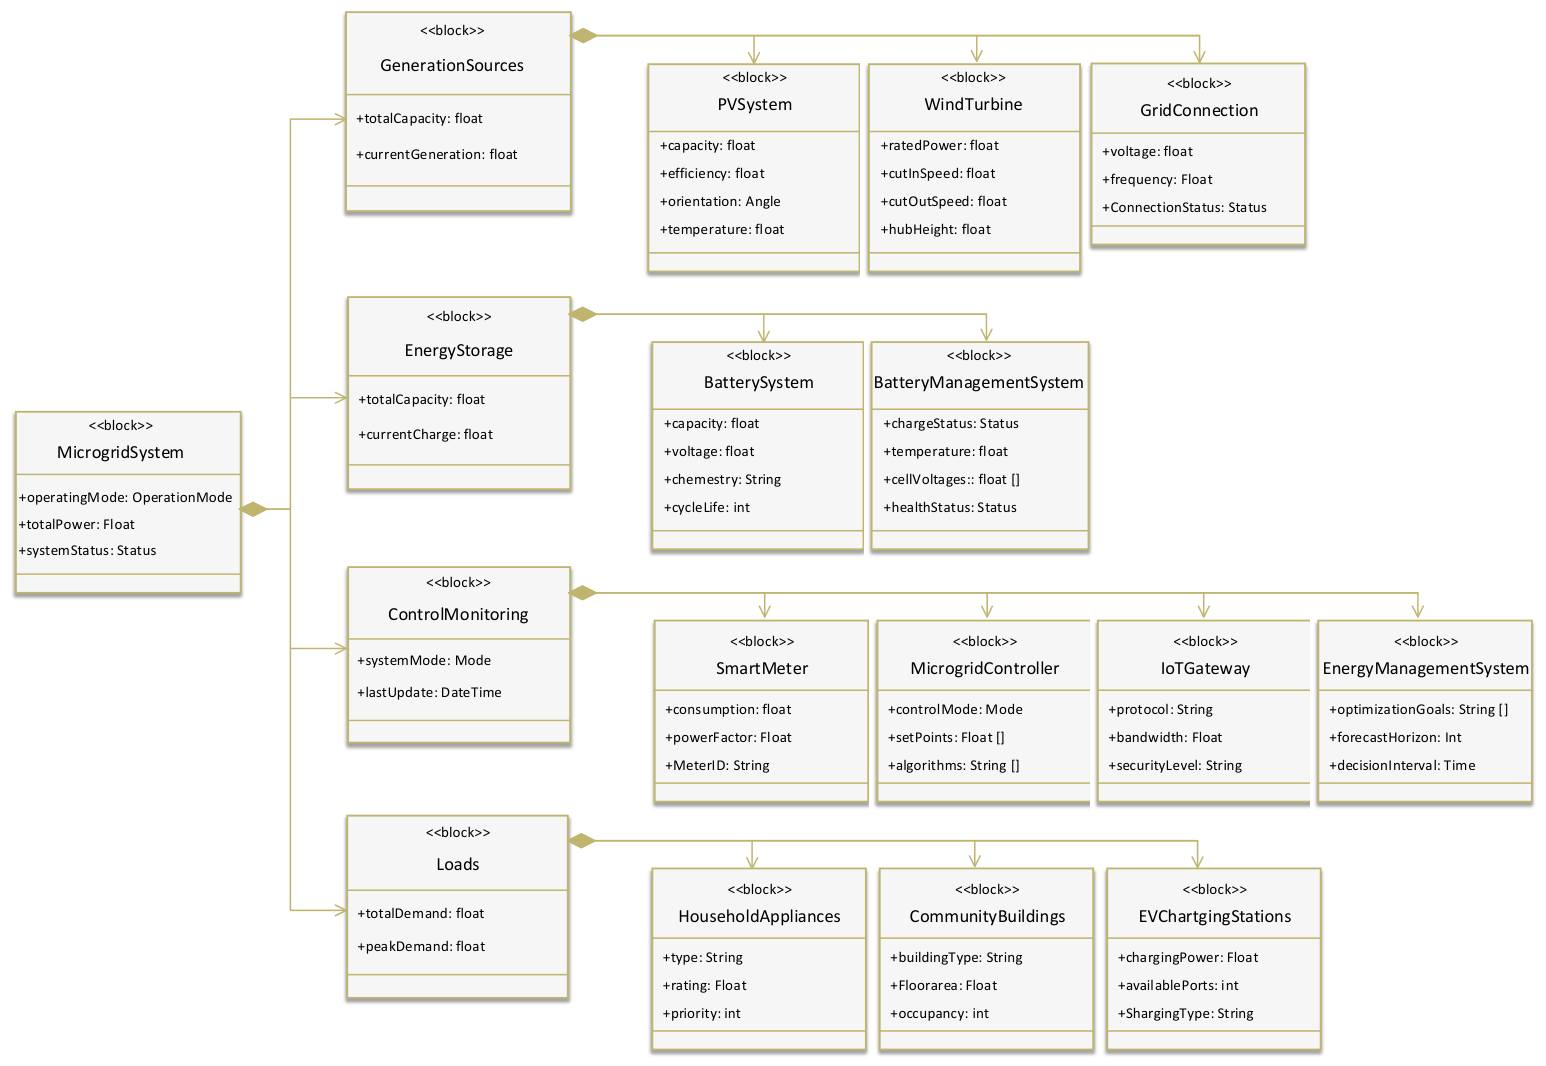
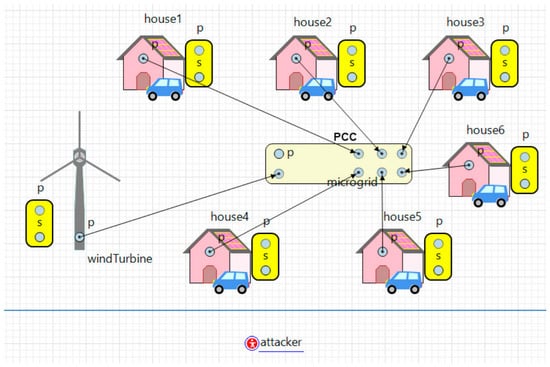
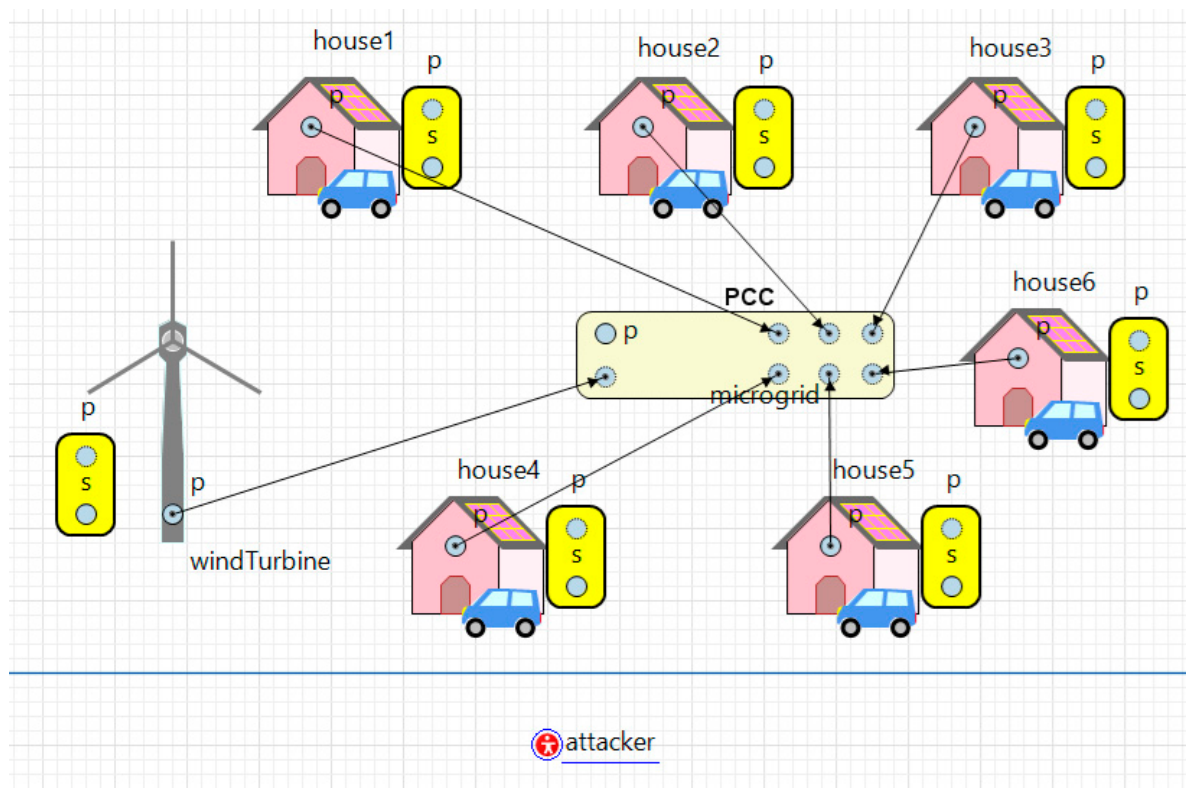
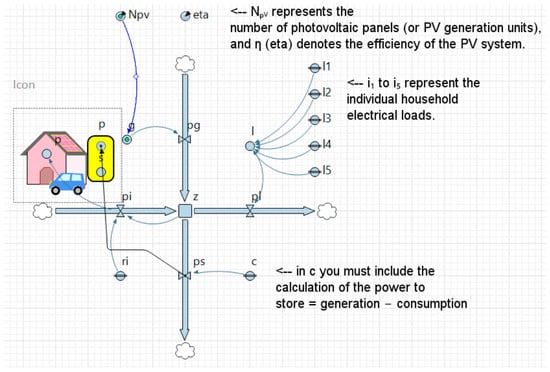
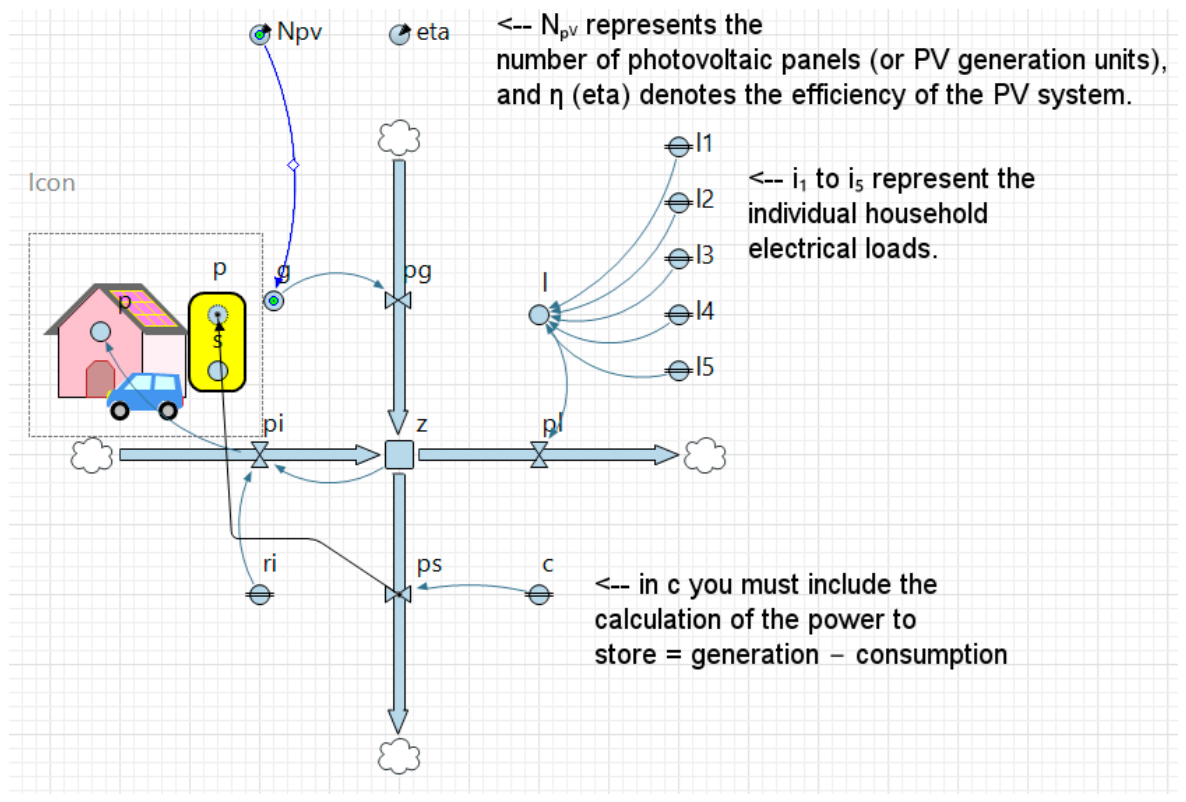
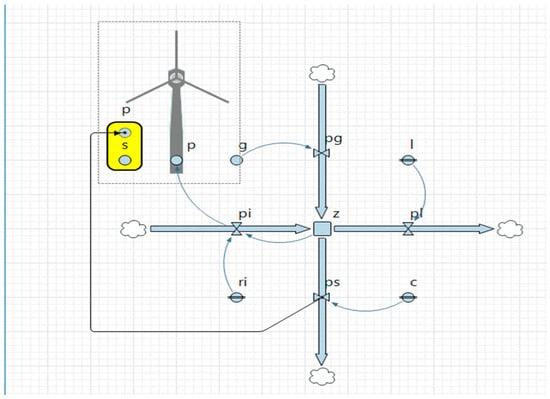
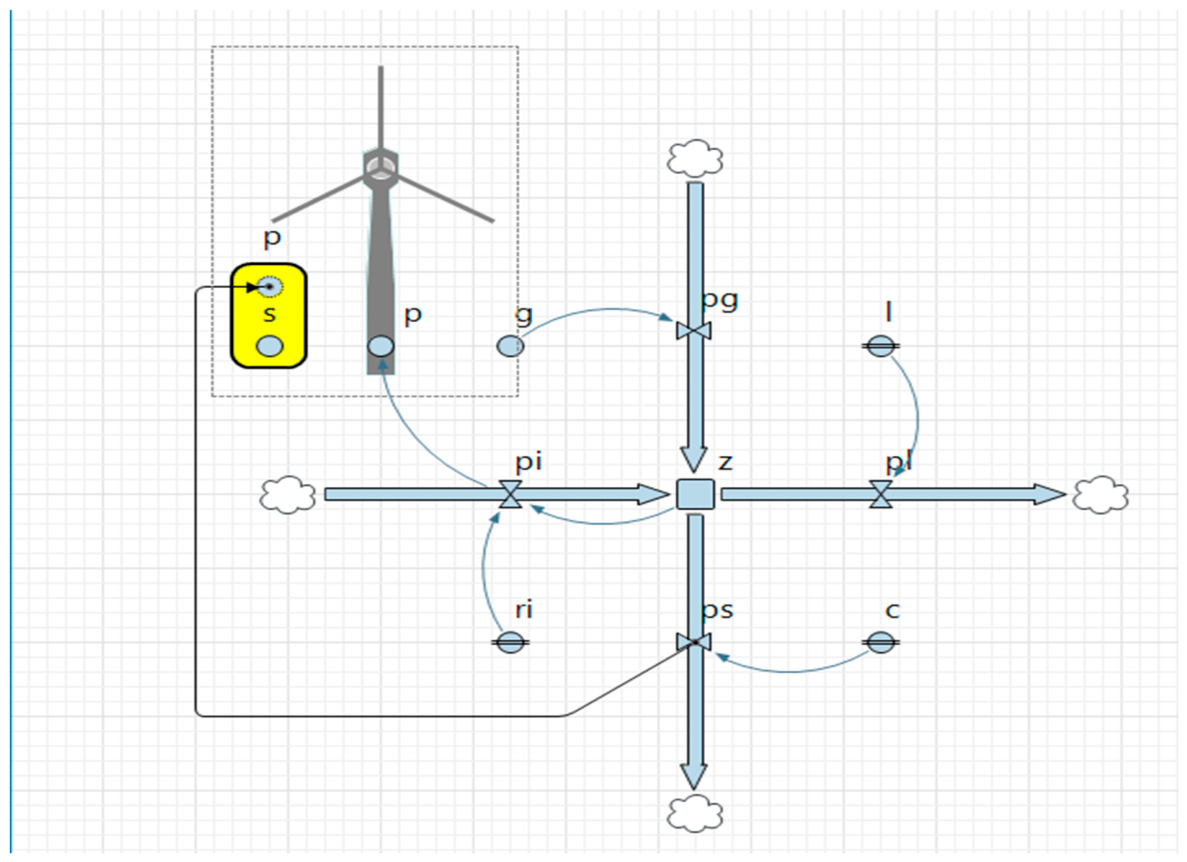
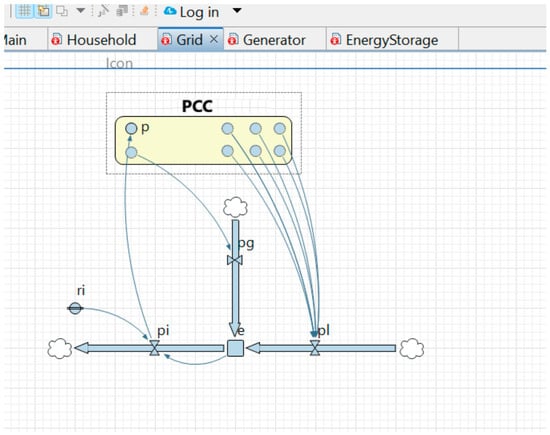
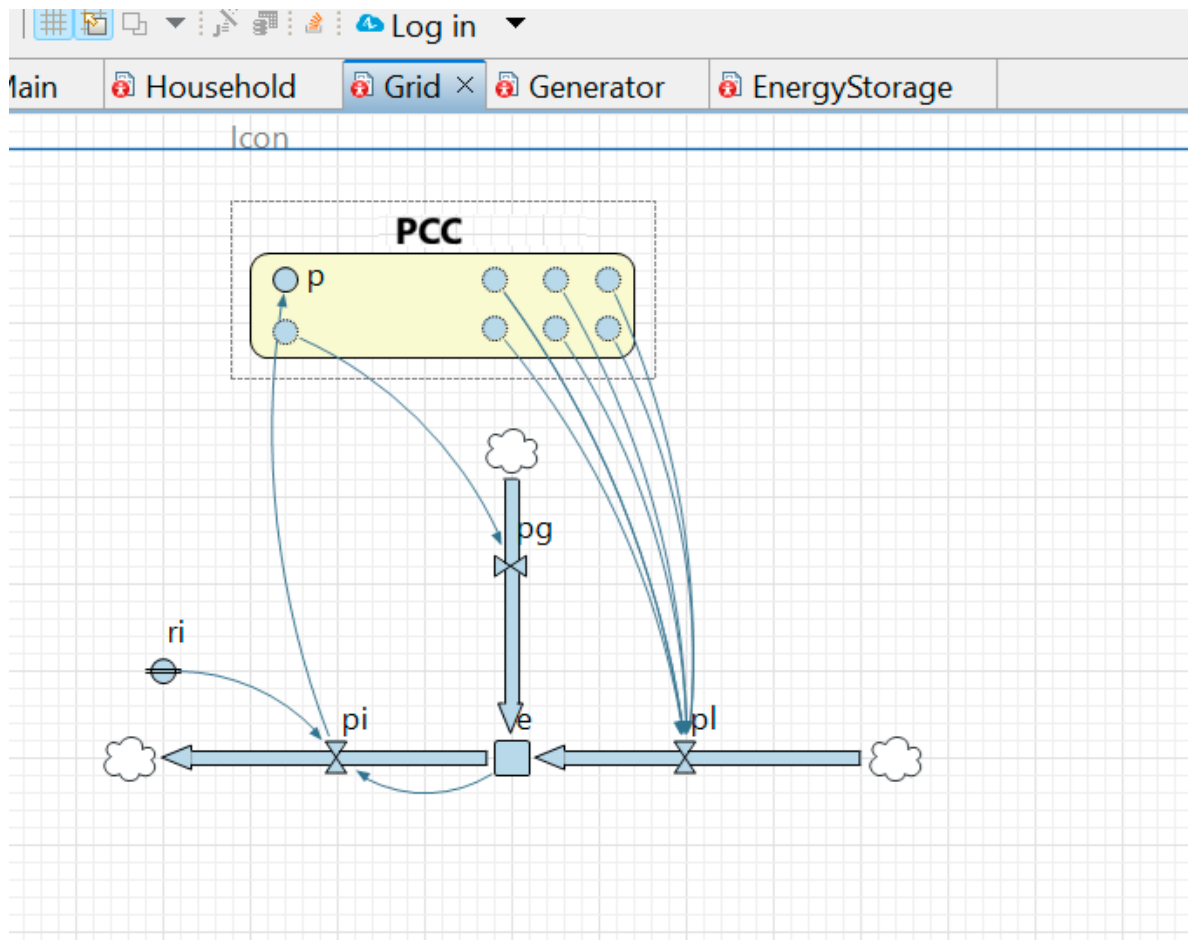
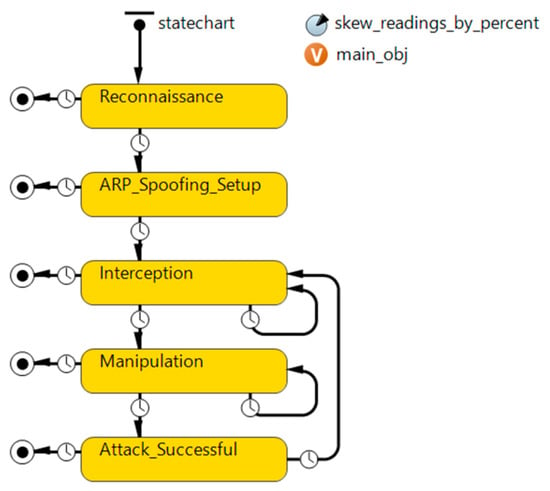
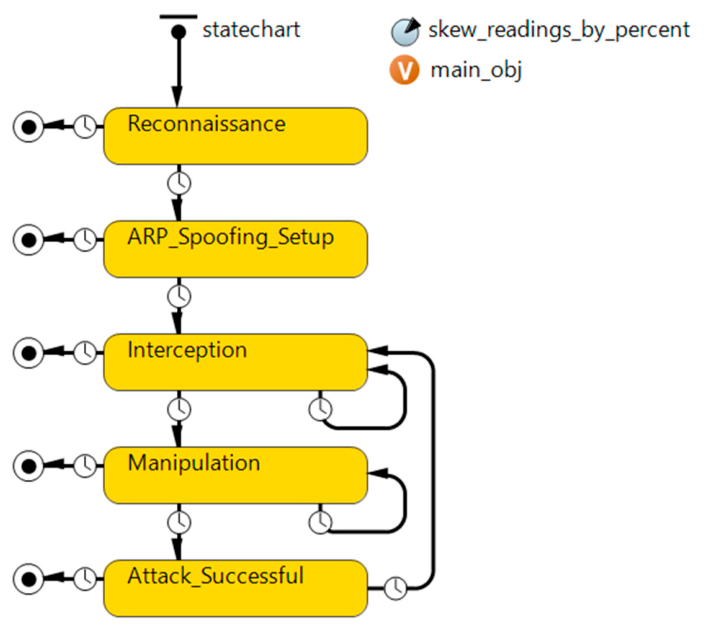
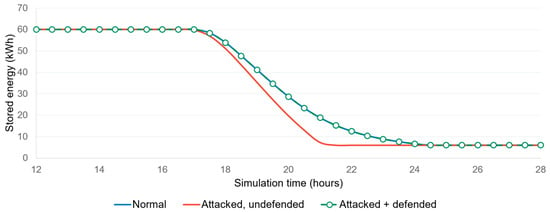
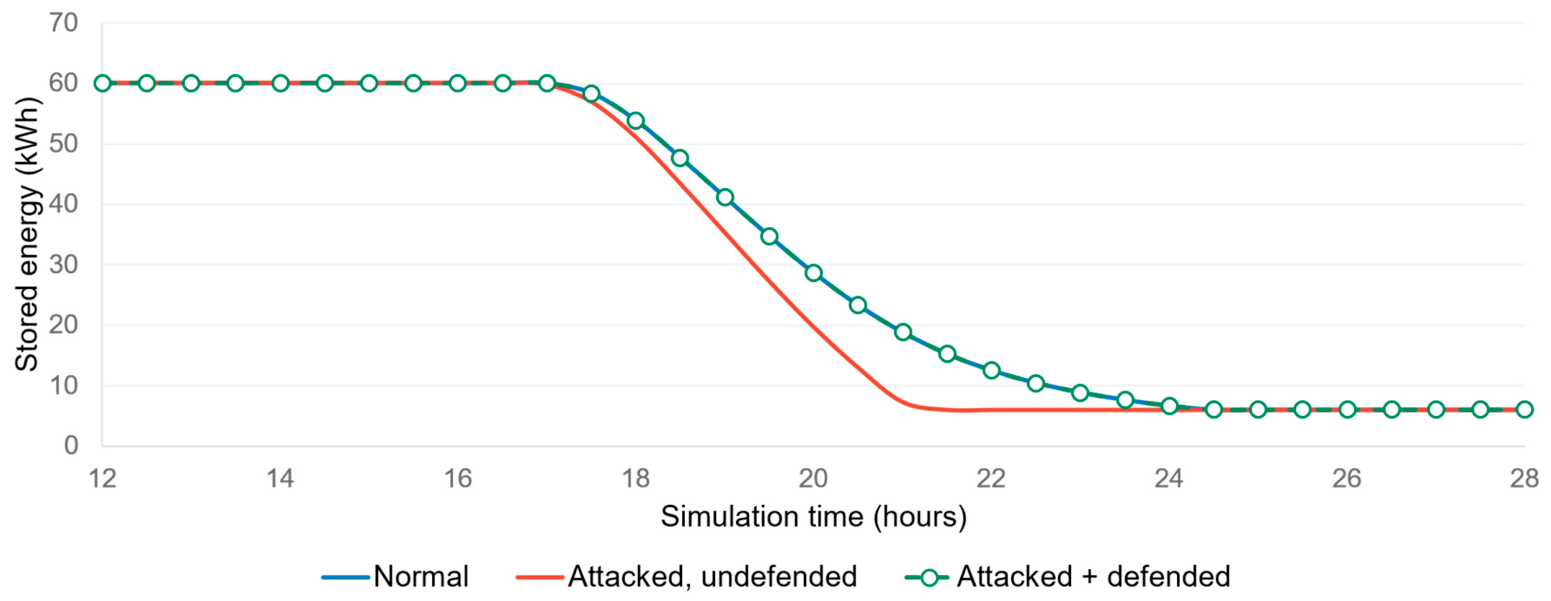

Disclaimer/Publisher’s Note: The statements, opinions and data contained in all publications are solely those of the individual author(s) and contributor(s) and not of MDPI and/or the editor(s). MDPI and/or the editor(s) disclaim responsibility for any injury to people or property resulting from any ideas, methods, instructions or products referred to in the content. |
© 2026 by the authors. Licensee MDPI, Basel, Switzerland. This article is an open access article distributed under the terms and conditions of the Creative Commons Attribution (CC BY) license.