


Abstract
The energy transition in Ibero-American countries demands significant diversification, yet the vast potential of offshore renewable energies (ORE) remains largely untapped. Slow adoption is often attributed to the hostile marine environment, high investment costs, and a lack of institutional, regulatory, and industrial readiness. A critical barrier for policymakers is the absence of methodologically robust tools to assess national preparedness. Existing indices typically rely on simplistic weighting schemes or are susceptible to known flaws, such as the rank reversal phenomenon, which undermines their credibility for strategic decision-making. This study addresses this gap by developing a multi-criteria decision-making (MCDM) framework based on a problem-specific synthesis of established optimization principles to construct a comprehensive Offshore Readiness Index (ORI) for 13 Ibero-American countries. The framework moves beyond traditional methods by employing an advanced weight-elicitation model rooted in the Robust Ordinal Regression (ROR) paradigm to analyze 42 sub-criteria across five domains: Regulation, Planning, Resource, Industry, and Grid. Its methodological core is a non-linear objective function that synergistically combines a Shannon entropy term to promote a maximally unbiased weight distribution and to prevent criterion exclusion, with an epistemic regularization penalty that anchors the solution to expert-derived priorities within each domain. The model is guided by high-level hierarchical constraints that reflect overarching policy assumptions, such as the primacy of Regulation and Planning, thereby ensuring strategic alignment. The resulting ORI ranks Spain first, followed by Mexico and Costa Rica. Spain’s leadership is underpinned by its exceptional performance in key domains, supported by specific enablers, such as a dedicated renewable energy roadmap. The optimized block weights validate the model’s structure, with Regulation (0.272) and Electric Grid (0.272) receiving the highest importance. In contrast, lower-ranked countries exhibit systemic deficiencies across multiple domains. This research offers a dual contribution: methodological innovation in readiness assessment and an actionable tool for policy instruments. The primary policy conclusion is clear: robust regulatory frameworks and strategic planning are the pivotal enabling conditions for ORE development, while industrial capacity and infrastructure are consequent steps that must follow, not precede, a solid policy foundation.
1. Introduction
The energy transition entails not only the shift from widespread reliance on fossil fuels to the use of renewable energy sources driven by development and technological innovation, but also demands a holistic approach [1]. This transition must account for the broader ecosystem, including the specific country’s economy, energy policies, and social aspects related to reducing energy consumption and, above all, to addressing inequalities in accessing the benefits derived from these energy resources. The International Renewable Energy Agency (IRENA) has outlined the 1.5 °C scenario, in which 91% of the global electricity supply would come from renewable energy sources by 2050. Achieving an even higher share of renewable sources is possible but challenging in the current technological and regulatory context [2,3].
In recent years, many countries have adopted diverse energy models to achieve more efficient and sustainable energy sources. For example, in Mexico, Costa Rica, Colombia, Chile, and Brazil, energy generation relies on a mix of fossil-fuel-based thermal energy and hydropower, using existing natural resources [4,5]. However, vulnerability to climate variability often leads to hydrological scarcity, restricting hydroelectric generation and preventing the desired manageability of this energy source. In this context, only a few Ibero-American countries (Spain, Portugal, Mexico, Costa Rica, Colombia, Chile, and Brazil) have turned their attention to the ocean as a potential source of alternative energy resources [6,7,8,9]. The deployment of offshore renewable energy technologies represents one of the most strategic challenges for the energy transition in Pan-American countries. This limited progress may be attributed to the insufficient technological maturity required to operate in a demanding marine environment, the comparatively higher cost associated with offshore projects, and the lack of institutional, regulatory, and industrial readiness necessary to sustain such development.
Nevertheless, although marine energy currently represents only a small fraction of national energy matrices, it could, in some contexts, become an essential pillar for providing flexibility to electrical systems. This is especially true in specific areas where the electrical grid is weak and highly dependent on fossil fuels (such as indigenous regions, isolated mountains, coastal zones, or islands), where electricity prices are high and even subsidized by the government, or where other resources are lacking (e.g., islands). Electrical systems increasingly demand more diversified energy resources, as evidenced in certain regions of Central and South America, where severe droughts have limited the use of river basins for hydropower on which many countries are heavily relying for electricity generation, resulting in significant power outages [10,11].
Finally, the technological development associated with marine ecosystems has generated added value that extends beyond the energy sector, benefiting aquaculture, communications, maritime transport, and resilience to climate effects in some areas [12]. In this framework, there is a compelling need to construct a synthetic readiness index that enables a comparative assessment of each country’s capacity and maturity to promote and implement offshore renewable energy technologies. Existing energy governance indices provide valuable but insufficient tools for this task. The World Bank’s Regulatory Indicators for Sustainable Energy (RISE) [13] offers a comprehensive assessment of general energy sector governance, but is not designed to capture offshore-specific readiness factors. RISE adopts equal weighting across all criteria, precluding the incorporation of strategic policy assumptions about the relative importance of different enablers. Furthermore, it does not assess dimensions critical to offshore deployment—such as marine spatial planning frameworks, grid codes for offshore integration, port infrastructure, or technology-specific test facilities. Critically, RISE treats “Unknown” responses as missing data to be excluded, whereas in the offshore context, the absence of documented policies often signals institutional opacity or underdevelopment—both relevant indicators of readiness rather than mere data gaps.
Standard Multi-Criteria Decision-Making (MCDM) approaches face practical constraints when applied to this problem. The Analytic Hierarchy Process (AHP) would require pairwise comparisons for 42 criteria, raising feasibility concerns and increasing the risk of judgmental inconsistency [14,15]. Data-driven methods such as CRITIC derive weights entirely from the decision matrix, precluding the incorporation of expert-derived strategic preferences (e.g., that regulatory frameworks should precede industrial development). Full Robust Ordinal Regression (ROR), while theoretically appealing for its ability to explore the entire feasible weight space, becomes computationally intractable for problems of this dimensionality [16]. These limitations motivate the development of a framework that combines the strengths of multiple approaches while remaining tractable and interpretable.
This paper analyzes data from selected Ibero-American countries using a novel application of multi-criteria optimization techniques to construct a comprehensive ORI that is not only robust but also interpretable at multiple scales. This is achieved by leveraging an enhanced optimization framework, guided by epistemic regularization and entropy maximization, which allows for a transparent assessment of country performance both at an aggregate level (macro-scale) and within specific functional domains (meso-scale). Furthermore, the proposed index is designed to be flexible and scalable, thus addressing the gap for the incorporation of future data expansions and comparative analyses across broader geographic or temporal scopes. This manuscript is organized as follows: Section 2 presents the analytical framework and describes the data used from selected countries, Section 3 details the methodology approach applied in the analysis, while Section 4 summarizes the main results, Section 5 validates these findings through a robustness test and Section 6 concludes with key insights derived from the results and provides policy recommendations for advancing offshore renewable energy development in the region.
2. Data of the Countries Under Analysis
Although marine energies currently do not represent a significant share of the energy mixes of Ibero-American countries, there are important opportunities that should be explored and exploited in this field. Notable considerations are:
- Countries such as Argentina, Brazil, Chile, Ecuador, Mexico, Colombia, Costa Rica, Peru, Spain, and Portugal incorporate marine energy sources into their energy policies, recognizing them as potential resources worthy of further analysis.
- The existence of specific Ibero-American regions offering significant potential for wave energy (Galápagos Islands, southern Brazil, Patagonia, and some areas of Colombia, southern Chile, central Peru, Baja California in Mexico), tidal currents (east coast of Brazil and the Strait of Magellan), and offshore wind (north coast of Brazil and the Pacific coast of Colombia).
- Many Ibero-American countries have strong naval traditions, which have allowed the development of a robust shipbuilding industry capable of supporting technological developments in the marine environment. For instance, Chile has estimated that between 60% and 80% of the value chain for a wave-energy project could be met using local capabilities.
- There are notable experimental infrastructures for marine energy, including the University of Costa Rica (Costa Rica); Hydraulic Institute of Cantabria (Spain); University of Campeche (Mexico); test tank at the Federal University of Rio de Janeiro (Brazil); Escuela Politécnica del Litoral (Ecuador); University of the Republic (Uruguay); Valdivia (Chile); and INA (Argentina). Additionally, marine test sites—such as Las Cruces (Chile), PLOCAN test site and BiMep (Spain), and Aguçadoura test site (Portugal)— are especially important to reach high Technology Readiness Levels (TRLs).
- Marine energies present significant opportunities for integration with green hydrogen production. As a versatile energy vector, hydrogen and its derivatives can be transported over long distances, thereby connecting regions with abundant marine resources to areas of high demand.
In this regard, the thematic network Opportunities for Integration of Marine Energies into Ibero-American Electric Grids, which comprises 13 Ibero-American countries (Argentina, Brazil, Chile, Colombia, Costa Rica, Cuba, Ecuador, Spain, Mexico, Panama, Peru, Portugal and Uruguay) and is promoted and funded by the Ibero-American Programme for Science and Technology for Development (CYTED), has prepared a study that compiles the situation of each country regarding marine energy sources and suggests possible actions [17]. The information consulted from the aforementioned reference considers:
- 1.
- Energy policies on marine energies. Roadmaps and defining policy documents on renewable energies, and specifically on marine renewable energies, when available.
- 2.
- Resource, industrial capacity, and experimental facilities related to marine energies. Studies and analyses of the country’s renewable resources, and, where available, of marine energies in particular; descriptions of industrial capabilities of sector companies and notable experimental facilities for marine energy testing.
- 3.
- The status of the electrical grid regarding the integration of new renewable energies. Documents about plans for modernization and expansion of transmission and distribution lines, and descriptions, where available, of problems arising from the integration of renewable energy that may affect system stability.
This paper analyses this information using a methodology that enables conclusions to be drawn from the data contained in the reviewed documentation. This methodology will be described in detail in the following section.
3. Methodology
3.1. Context and State of the Art
The use of synthetic indices to assess and rank country-level performance is a common practice in fields ranging from economic development to energy policy [18,19,20]. While the utility of such rankings is clear, a persistent debate in the literature concerns the methodological rigor of their construction. At the core of this debate is the pivotal challenge of eliciting criteria weights in a way that is both objective and strategically meaningful [19,21].
Furthermore, classical Multi-Criteria Decision-Making (MCDM) methods, such as the Analytic Hierarchy Process (AHP) or CRiteria Importance Through Intercriteria Correlation (CRITIC), present their own challenges. These approaches can be sensitive to inconsistent or incomplete expert judgments and, most notably, are often susceptible to the well-known rank reversal phenomenon, where the ranking of alternatives is illogically altered by the addition or removal of an option [14,15,22,23]. Within the specific domain of offshore energy, such MCDM techniques have been primarily applied to site-selection problems [24,25,26,27,28], not for a holistic, national-level readiness assessment. This reveals a critical gap in the literature: while advanced MCDM techniques are frequently applied to solve granular, technical problems in the offshore sector, such as site selection, their potential as a tool for holistic, national-level policy assessment remains untapped. The presented work addresses this gap by demonstrating the value of a stable weight-elicitation framework designed not for tactical optimization but for the strategic evaluation of national readiness in offshore energy policy.
3.2. Comparison with Classical MCDM Methods
To contextualize the proposed framework, we briefly compare it with established MCDM approaches commonly applied in energy policy assessment [29,30]. Table 1 summarizes the key trade-offs.
Table 1.
Comparison of weight elicitation methods for large-scale policy assessment.
The Analytic Hierarchy Process (AHP) enables structured expert input but requires pairwise comparisons—861 for our 42 criteria—and is susceptible to rank reversal when alternatives are added or removed [23]. CRITIC and similar entropy-based methods are computationally efficient and purely data-driven, but cannot incorporate strategic preferences such as “Regulation should dominate Industry.” TOPSIS provides a distance-based ranking but requires pre-specified weights, merely shifting the elicitation problem rather than solving it. Full Robust Ordinal Regression offers theoretical guarantees by exploring the entire feasible weight space, but becomes computationally intractable beyond approximately 15–20 criteria [16].
The proposed framework occupies a middle ground. It inherits the core ROR principle of translating ordinal preferences into linear inequality constraints, but selects a single optimal solution rather than exhaustively analyzing the feasible polytope. This pragmatic choice sacrifices the completeness guarantee of full ROR in exchange for computational tractability. The stability of the resulting solution is therefore not assumed but explicitly verified through the robustness analyses presented in Section 5.5. The framework is not positioned as universally superior to classical methods, but as appropriate for this specific problem structure: large criterion sets, hierarchical block organization, incomplete data, and the need to encode strategic policy assumptions.
3.3. Methodological Framework for Hierarchical Weight Elicitation Preferences
To address the shortcomings of traditional indexing methods, this study develops an advanced framework (Figure 1) for criteria weight elicitation. The ideal benchmark for this task would be a formal Robust Ordinal Regression (ROR) paradigm, which evaluates the entire feasible space of weight vectors consistent with a set of expert-derived preferences [31]. Such an approach offers unparalleled robustness, as its conclusions hold for any valid weight combination within that space. However, for a problem of our scale, with 42 sub-criteria, a full ROR analysis is computationally intractable due to the “curse of dimensionality”, as assessed by [16]. Therefore, instead of analyzing the entire feasible space, this study adopts a pragmatic yet powerful alternative: we select the single, optimal weight vector by solving a well-defined optimization problem. Our approach innovates by applying this logic at a higher level of abstraction. Rather than using preferences on alternatives (e.g., “Country A is preferred to Country B”), we use strategic preferences between entire blocks of criteria (e.g., “Plan > Industry”). The method translates these high-level expert judgments into linear inequality constraints that shape the feasible solution space. In doing so, while not being a formal, robust analysis, our framework inherits a core ROR technique and its key advantages, including strong resilience to incomplete data and the mitigation of pathological behaviors such as rank reversal. For this reason, the method is best described as an advanced weight elicitation framework rather than a formal robust analysis. The stability of the single solution it generates is therefore not assumed, but explicitly verified in the robustness tests presented in Section 5.5. The main contribution of the presented framework is rooted in the synergistic combination of three key components: first, a core optimization engine that infers weights from high-level hierarchical preferences to avoid arbitrary assignments; second, a unique dual-component objective function that blends a Shannon entropy term with an epistemic regularization penalty to balance impartiality with expert knowledge; and third, a strategic constraint structure that explicitly encodes high-level policy assumptions through hierarchical inter-block constraints. The sub-criterion weights are ultimately obtained by solving the nonlinear optimization problem under the enforcement of these hierarchical constraints. By combining entropy maximization with intra-block anchoring and inter-block inequality energies, the model avoids driving any criterion to zero without a clear justification, thus ensuring a coherent and non-degenerate weighting scheme.
Figure 1.
Methodological flowchart of the ORI framework. The optimization engine combines Shannon entropy (promoting weight diffusion) with epistemic regularization (anchoring to expert priors) under hierarchical constraints to derive optimal weights for ORI score computation.
Before presenting the formal optimization model, we provide an intuitive explanation of its three core components:
Shannon entropy term: This component promotes weight diffusion across criteria, preventing any single criterion from monopolizing importance without strong justification. Intuitively, it encodes a “principle of insufficient reason”—in the absence of compelling evidence to the contrary, importance should be distributed rather than concentrated.
Epistemic regularization penalty: While entropy promotes diffusion, the epistemic penalty anchors the solution to expert-derived priors within each functional block. This ensures that criteria deemed important by domain experts (e.g., the existence of a dedicated maritime spatial plan) receive appropriate weight even when the entropy term would favor uniformity. The balance between these two forces is controlled by the hyperparameters and .
Hierarchical inter-block constraints: These linear inequality constraints encode high-level policy assumptions that structure the feasible weight space. For instance, the constraint reflects the strategic assumption that regulatory frameworks are prerequisites for industrial development—not arbitrary preferences, but causal hypotheses about offshore energy readiness.
3.4. Database Construction and Filtering
The analysis is accomplished among 13 Ibero-American countries: Argentina, Brazil, Chile, Colombia, Costa Rica, Cuba, Ecuador, Spain, Mexico, Panama, Peru, Portugal, and Uruguay. Data from these different countries were gathered from publicly available national documents published until December 2024 [32]. This document was prepared by the Ibero-American Network for the Integration of Marine Energy into Electrical Grids (REMAR, for its acronym in Spanish).
Based on the information provided by each of the countries under study, a series of yes or no, NC–not known, questionnaires was designed covering various topics such as specific regulations on marine renewable energy, energy plans and targets, available renewable resources, value chain development, and the state of grid infrastructure. From this structured database, the index was built comprising 42 sub-criteria, grouped into five domains: Regulation, Planning, Resource, Industry, and Grid Infrastructure. A schematic representation of this categorization is presented in Figure 2.
Figure 2.
Hierarchical Structure of the ORI Framework. The index comprises five functional blocks (Regulation, Plan, Resource, Industry, Grid) disaggregated into 42 sub-criteria (detailed in Table A1). This two-level architecture enables both aggregate country rankings and block-specific diagnostic assessments, supporting targeted policy recommendations.
Each criterion was assessed using a ternary information scheme (YES, NO, NC–Unknown) and subsequently mapped into fuzzy values, as follows:
- YES = 1
- NO = 0
- NC = NaN
To ensure objectivity and cross-country comparability, our data collection framework is based on a ternary scoring system (YES/NO/Unknown), a methodological approach whose validity for large-scale policy analysis is a benchmark for leading global initiatives such as the World Bank’s Regulatory Indicators for Sustainable Energy (RISE) [13]. This approach minimizes subjective interpretation and provides a transparent, verifiable foundation for the subsequent analysis. However, the weighting process is where our methodology fundamentally diverges from and innovates upon such standard frameworks. While many indices, including RISE, adopt an equal-weighting scheme for simplicity [20,21], our framework is specifically designed to overcome this key limitation.
We developed a non-linear optimization model to create a stable and meaningful weight vector. This model is based on the expert consensus of the Ibero-American Electric Networks on Marine Energies Consortium (REMAR), and its methodology is detailed in the sections that follow. This allows the model to reflect the strategic and differential impact of each policy area on offshore renewable energy readiness. The database crucially retains a set of criteria for every country, even when information is incomplete. No criteria or countries were excluded based on missing values. This choice preserves the semantic consistency of the evaluation space across all alternatives, ensuring that the ORI model operates over a uniform criterion set, independent of local data availability. During score computation, each country’s weight vector is dynamically normalized over the subset of available (non-NaN) criteria. This treatment is deliberate: multiple imputation was avoided because “Unknown” responses carry semantic content—they signal either the absence of policy development or institutional opacity, both relevant to readiness assessment. This interpretation is empirically supported by the strong positive correlation between data availability (Clearance Index) and ORI performance (Section 5.3).
The presence of missing information is therefore handled in two complementary ways: computationally, it reduces the information richness of an evaluation without altering the uniform decision space; methodologically, it becomes a key input for further investigations into institutional transparency, as analyzed in Section 5.3. This enabled validation of the system’s logical consistency in handling extremes of informational availability. As mentioned above, the database comprises 42 criteria subdivided into five main domains: the offshore regulatory framework, the foreseen development plans, the analysis of the resource, the infrastructure level, and the electric grid status; each assesses the current status of offshore energy development in the considered countries. Although the regulatory framework, plans, infrastructure level, and electric grid status can be treated using a ternary information system (YES/NO/NC-UNKNOWN), the creation of the Resource information assessment must be discussed differently.
For this study, we have used the availability of offshore renewable energy resources as an indicator of government and scientific community interest in this technology. In this context, we have not focused on the magnitude of the resource, which is not a symptom of the readiness of the country, but only of the presence or absence of the studies. This assumption implicitly assumes that every country has all resource types available, but has decided to investigate only a subset of them. The latter information allows us to mix it with the concept of the technology maturity level—the Technology Readiness Level (TRL)—representing a scenario in which the policy maker is conscious of the power, possibilities, and market of each technology, and has decided to include in the national development plan one or more of the most or least promising technologies.
All the information about the Offshore Renewable Energy Resource has been mapped onto two levels:
- YES to 1
- NC-NaN
The Yes value has been weighted for a normalized TRL, reflecting the maturity level of each technology. According to [33], we have set the following TRLs:
- offshore wind: TRL 9,
- wave energy: TRL6-7,
- tidal: TLR 6-7,
- thermal gradient: TRL 4-5,
- salinity gradient: TRL 3-4, and
- solar floating: TLR 9.
All the processed sub-criteria are available in the Appendix A. This approach is consistent with the other criteria, obtaining a whole dataset bounded in [0, 1]. The prevalence of Unknown (NC) values in the collected data is not treated merely as a limitation but as a significant finding in its own right, reflecting the level of institutional transparency and data accessibility within each country. To quantify this dimension, we have introduced a Clearance Index (CI) as a secondary metric of our analysis. The CI for each country is calculated as the ratio of criteria with available information (either YES or NO) to the total number of criteria:
This index provides a direct measure of a country’s informational transparency/availability, a critical precondition for investment and robust policy assessment. The final performance score for each country is aggregated using a weighted arithmetic sum. It is important to distinguish this linear aggregation function, used for the final score computation, from the nonlinear optimization process used to infer the weights themselves. Although more complex, non-additive functions such as the Choquet or Sugeno integrals exist [34], a weighted sum was deliberately chosen for its high interpretability and widespread acceptance. For a policy-oriented index like the ORI, transparency in the final score aggregation is paramount, as this linear function provides the clearest possible link between a country’s performance on individual criteria and its final ranking.
From the authors’ perspective, the use of a weighted average, the weights of which are derived from the innovative optimization process, represents an optimal compromise among interpretability, effectiveness, and robustness. This design choice strategically focuses the model’s complexity on the non-linear weight-elicitation phase rather than on the final score-computation mechanism. A limitation of this study is its reliance on a single primary data source. Although compiled by an international consortium of 13 research institutions and validated through cross-referencing with official documents, the REMAR database was not subject to independent third-party verification. This constraint is common to most national-level policy assessments—including the World Bank’s RISE, which also relies substantially on government-reported data. The comparison with RISE presented in Section 5.4 provides partial external validation, demonstrating strong correlation with interpretable deviations. Future iterations of the ORI should incorporate additional data sources as they become available, including project-level deployment data from databases such as IRENA’s offshore renewable energy statistics.
4. Mathematical Basis and Optimization Model
The mathematical core of the presented methodology is a constrained optimization model. This approach is based on a well-established principle in multi-criteria decision analysis, in which expert-derived ordinal preferences are translated into a system of linear inequality constraints [30,35]. Our model adapts this logic to a higher level of abstraction. Instead of using preferences on alternatives, we define ordinal preference relations exclusively between entire blocks of criteria (e.g., ’Regulation > Industry’). This strategic choice allows the model to be structured by high-level policy assumptions, which are central to our approach. The relative importance of sub-criteria within each block is governed by a unique regularization profile, developed by experts, embedded in the main optimization objective.
To ensure that the model reflects nuanced, domain-specific priorities, we introduce an a priori epistemic profile () that represents the intrinsic importance assigned to each sub-criterion within its functional block. This profile was derived from the expert consensus of the REMAR consortium (see Appendix A), and its primary role is to serve as a regularization component in the optimization model. The use of this technique is methodologically crucial for two reasons: first, it anchors the solution to expert-derived priors, ensuring the final weights are not only mathematically optimal but also strategically meaningful; second, it achieves a delicate equilibrium between a maximally unbiased (entropic) weight distribution and the need to conform to expert-derived intra-block priorities. Consequently, this approach ensures that the resulting weight structure authentically mirrors the decision-maker’s nuanced assessments, as specified.
Let:
- , being the set of criteria,
- , being a partition of C into K disjoint blocks, with ,
- , the vector of weights to be optimized,
- be the cumulative weight of the block ,
- , is the epistemic a priori profile over subcriteria in block , satisfying that ,
- , the system of ordinal preference constraints,
- , a hyperparameter controlling the overall strength of the epistemic regularization penalty,
- , a hyperparameter controlling the strength of the entropy term,
- , a block-specific scaling factor that distributes the epistemic penalty’s strength across the blocks.
The block-specific scaling factors for [Regulation, Plan, Resource, Industry, Grid] were established through expert consensus within the REMAR consortium during the questionnaire design phase. These values modulate the strength of epistemic regularization within each block; they do not directly determine the final block importance, which emerges endogenously from inter-block constraints and entropy optimization. The assignment reflects relative confidence in the epistemic priors: Plan received the highest value (0.30) due to stronger expert agreement on the relative importance of its sub-criteria (e.g., that installed capacity targets are more critical than fiscal incentives), while Resource received the lowest (0.10) due to inherent uncertainty in comparing assessments across technologies at different maturity levels.
The intra-block weight distribution is further governed by the epistemic profile (Table A1), which encodes expert-derived priors on the relative importance of individual sub-criteria within their respective blocks. Sub-criteria with higher values receive proportionally higher weights in the final solution, modulated by the entropy term to prevent degeneracy. For instance, within the Regulation block, SubC-01 (Specific Regulations for RE) has , reflecting expert consensus that dedicated offshore legislation is a critical enabler, while SubC-03 (General Documentation) has , indicating secondary importance. These values were elicited through structured expert consultation within the REMAR consortium and represent domain knowledge that purely data-driven methods cannot capture.
The inferred weights are also subjected to:
The core of the methodology lies in solving the following optimization problem to find the optimal weight vector w:
This objective function comprises two main components:
- Shannon’s Negative Entropy, the term encourages a diffuse distribution of weights, preventing the model from assigning zero weight to criteria unless strongly supported by other constraints.
- Intra-Block Epistemic Regularization Penalty: This term aligns the weights within each functional block with the a priori epistemic profile , weighted by the global hyperparameter and the block-specific scaling factor . It is represented by the expression:
4.1. Block-Wise and Hierarchical Constraints
To encode high-level strategic assumptions, the model accurately reflects overarching policy priorities, and the subsequent sets of inter-block preferences are instituted as linear inequality constraints imposed upon the weight vector w: Firstly, strategic cascading constraints to reflect strategic policy assumptions; specifically, the combined importance of Regulation and Planning must exceed that of Industry, Grid Infrastructure, and Resource. This is grounded in the rationale that only the simultaneous presence of strategic vision and a solid regulatory framework can enable robust industrial deployment and subsequent infrastructural development, ensuring a fruitful exploitation of renewable resources. Formally,
Consequently, pairwise inter-block constraints express further ordinal relationships, such as:
Specifically, we implemented the following inter-block preferences:
- Regulation > Plan
- Regulation > Industry
- Regulation > Grid
- Regulation > Resource
These reflect the central role of regulatory visions and frameworks in driving offshore renewable energy development. These constraints collectively delineate the feasible polytope within which the optimization algorithm seeks the optimal weight vector.
4.2. Model Solution and Score Aggregation
The optimization task involves determining the weight vector w that minimizes the composite entropy and epistemic penalty function, as defined in Equation (3). This minimization is performed subject to the normalization, Equation (2), and the system of linear inequality constraints derived from the inter-block preferences.
The chosen optimization procedure is designed to balance two key principles. Through the minimization of negative Shannon’s entropy, the model fosters a distributed weight profile, avoiding the arbitrary exclusion of criteria. Simultaneously, the epistemic regularization component anchors the solution to expert-derived priors, ensuring that the resulting weights are strategically meaningful. This non-linear optimization task was solved numerically using MATLAB R2025b’s fmincon function with the Sequential Quadratic Programming (SQP) algorithm. To further ensure the robustness of the solution and mitigate the risk of convergence to a poor local optimum, a multi-start strategy was implemented: the optimization was initiated from 10 distinct, randomly generated starting points, and the solution yielding the best objective function value was selected.
The aggregated score for each country c is computed as:
where denotes the subset of available (non-NaN) criteria for the country c. , instead, represents the normalized a of the country c for the criterion i. The result of this aggregation for each country constitutes its final ORI. Countries in which information is missing across all sub-criteria are excluded from the analysis and are assigned no ORI value.
5. Results and Discussion
The current analysis establishes a link between the model’s internal solution with its practical outcomes, ranging from an examination of the inferred weight distribution to an interpretation of the final country readiness ranking. In such a solution, all results are contextualized by block-level performance and specific activated criteria, as presented in the following subsections.
5.1. Analysis of the Optimal Weight Distribution
The primary output of the optimization process is the vector of weights assigned to each of the 42 criteria. The aggregated weights for each functional block provide insight into the model’s solution structure, see Figure 3. The resulting weight distribution fully respects the hierarchical constraints imposed on the model. The regulation block emerged, in line with the constraints, with the highest aggregate weight, reflecting the strategic priority assigned to a robust legal and policy foundation.
Figure 3.
Optimized Functional Block Weights. Aggregate importance of the five ORI domains, obtained through entropy-regularized optimization with hierarchical constraints. Regulation and Grid share the highest weight (0.272), emphasizing the primacy of policy frameworks and infrastructure readiness. The distribution reflects the strategic assumption that regulatory maturity precedes industrial development.
This outcome confirms the model’s ability to adhere to high-level strategic assumptions. However, a key finding is that while the Regulation block is predominant, the solution is not degenerate. The synergistic effect of the Shannon entropy term in the objective function ensures a distributed allocation of importance across all other domains. The Plan, Regulation, Resource, Industry, and Grid blocks all received non-zero weights, confirming that the model successfully avoids the “winner-take-all” pitfall and acknowledges the contribution of every functional area to the overall readiness assessment. This distributed hierarchical weight structure defines the basis for the final country ranking.
5.2. Interpretation of the Readiness Ranking
The inferred weight distribution has a direct and clear impact on the final readiness ranking. The results are aligned with the initial hypothesis that a solid regulatory and planning framework is a key enabler of offshore renewable energy development. Spain, ranking first overall, exemplifies this principle. An analysis of its performance at the block level reveals a consistently strong profile: it ranks first in the Regulation and Grid blocks and third in the Plan block. A closer look at the activated criteria provides concrete evidence for this leadership. For instance, Spain is one of the few Ibero-American countries with a specific regulatory framework for renewable energy Regulation; particularly there are defined specific regulations (Specific Regulations RE equals to 1), a defined roadmap on Regulation (Regulation: Roadmap 2 equals to 1), and a fully developed grid that includes specific plans for future renewable integration (i.e., Grid: the plan includes MRE equal to 1); as shown in the codes in Table A1. This combination of strategic foresight and concrete implementation underpins its leading position. It is important to emphasize that the high aggregate weights for Regulation (0.272) and Grid (0.272) are not exogenous assumptions imposed by the analysts, but endogenous outcomes of the optimization under hierarchical constraints. The model derives these weights as the solution that best satisfies the constraint system while maximizing entropy and respecting epistemic priors. Grid’s prominence, despite not being explicitly prioritized in the constraints, emerges because it contains 14 sub-criteria (the largest block), and the entropy term distributes weight across all available criteria. This mechanistic transparency—where results can be traced to explicit assumptions—distinguishes the framework from black-box approaches and enables critical scrutiny of the underlying policy logic.
Figure 4 and Figure 5 present the way in which the countries under study can be classified into three tiers according to their ORI performance: top, medium, and low tiers. Spain, Mexico, Costa Rica, and Brazil exhibit the highest ORI values.
Figure 4.
Final Offshore Readiness Index (ORI). Aggregated readiness scores (0-1) for evaluated countries. Spain (0.91) leads, followed by Mexico (0.73), Costa Rica (0.70), and Brazil (0.60). The ranking reflects weighted performance across five domains: Regulation, Planning, Resource, Industry, and Grid, with Regulation receiving the highest importance in the optimization framework.
Figure 5.
Geographic Distribution of ORI Performance. Color-coded classification of countries by readiness score: High Tier (green, 0.56–0.91), Medium Tier (yellow, 0.45–0.55), and Low Tier (red, 0.16–0.44). Left: American continent; right: European Iberian countries with Atlantic territories. The map illustrates that offshore readiness transcends geographic location, reflecting primarily policy and institutional maturity.
Spain holds the top position in four of the five dimensions assessed: Grid, Industry, Regulation, and Resources. It also ranks within the top three for the Plan dimension. This strong performance is likely due to several key factors: dedicated regulation for offshore renewable energy production, specific targets for installed capacity of offshore wind [36] and other emerging marine technologies [37], and comprehensive Marine Spatial Planning regulations [38].
Additionally, Spanish grid infrastructure relies on planning [39], including the integration of marine renewable energies (MRE) into the national power grid, while at the same time having well-established industries in shipbuilding, logistics, and manufacturing of wind energy components, among others, with extensive experience in international projects, particularly in offshore wind energy. Regarding Mexico, it is well-positioned on all other dimensions, except the Regulation dimension. This is due to the lack of robust and specific regulation for MRE, despite having the Technological Roadmap for Ocean Energy [40] at an early stage, with no demonstrative or commercial-scale projects implemented to date. In terms of industry, the country benefits from a well-established industrial ecosystem linked to the oil and gas sector, maritime-port operations, shipbuilding, logistics, maritime infrastructure, and the manufacturing of wind energy components, particularly for onshore applications.
Costa Rica ranks third in terms of ORI among the studied countries. This can be explained by its second position in the Grid dimension and fourth position in the Regulation dimension, as these two dimensions carry the highest weight in the ORI. Regarding the integration of renewable energy, Costa Rica has the Electricity Generation Expansion Plan [41], which is used to plan the integration and expansion of electricity generation, and it responds to the requirements defined in the electricity demand projections and the foresight planning integration of the portfolio of non-conventional energy, such as the marine sources.
Brazil ranks first in the Plan and Industry dimensions, with clear targets for offshore wind [36]. Furthermore, Brazil’s extensive experience in deep and ultra-deep water oil and gas operations is expected to benefit the offshore renewable energy sector through technology transfer. A second group of countries with ORI ranging from 0.55 to 0.45 is identified, composed by Portugal, Chile, Uruguay, and Colombia. Portugal ranks in the upper half of the ORI, with clear and ambitious targets in terms of offshore renewable energy defined in the National Energy and Climate Plan 2030 [42], which materialized in its first auction for floating offshore wind capacity published in April 2025 [43]. Low score on the Grid dimension is due to the lack of or limited information available at the time of developing the report ‘Las energías del mar en los países de Iberoamérica: Políticas, capacidades, recurso e integración en sus redes’ [17].
Chile, Uruguay, and Colombia show similar ORI results, which adversely affect Colombia’s ranking due to weaknesses in the existing grid infrastructure, where coastal areas face limited connectivity to the national grid, environmental restrictions, and issues related to the quality of power supply. Countries with an ORI performance between 0.16 and 0.44 include Ecuador, Peru, Argentina, Panama, and Cuba. Ecuador and Peru show similar ORI, Peru being more negatively impacted due to the lack of information in the Plan dimension than Ecuador, with no results in the Industry dimension, consistent with the inferred weights (Plan > Industry). Despite having clear targets for the penetration of renewable energy in the national energy mix [44,45,46], Argentina not only lacks a strategic roadmap for MRE, but also a regulatory framework for offshore electricity generation and a sufficiently robust power infrastructure to ensure operational reliability in the integration of future renewable facilities.
Panama and Cuba exhibit an underperformance across nearly all domains. An examination of their block-level scores places them consistently in the bottom tier. For these nations, the data reveal a widespread absence of key enabling factors. Despite having a national energy plan [47] aimed at promoting competitiveness among various renewable technologies and establishing a unified regulatory framework to harmonize the integration of renewable sources into the power grid, Panama faces limitations that impede the incorporation of new renewable generation sources, as well as marked disparities in grid access between urban and rural areas. The electrical network faces challenges concerning supply reliability and power quality, with frequent outages and fluctuations that compromise service stability.
Following the top performers, countries such as Mexico and Brazil also demonstrate strong, albeit less uniform, profiles. Mexico, for example, achieves the second-highest score in the Plan block, indicating a solid foundation in strategic planning, while Brazil’s top rank in the Industry block highlights its significant industrial capacity. Conversely, countries at the lower end of the ranking, such as Cuba and Panama, exhibit an underperformance across nearly all domains. An examination of their block-level scores shows that they consistently fall in the bottom tier. For these countries, the data indicate a pervasive absence of key enabling factors. For example, in Figure 6, Peru scores zero in the Plan block, indicating a lack of strategic planning for offshore renewable energy, whereas Cuba’s scores are consistently low across all blocks, including zero for all criteria in the Grid block, signaling significant infrastructural gaps. This confirms that their final ranking is not attributable to a single weakness but rather to a systemic lack of readiness across the board.
Figure 6.
Disaggregated Performance by Functional Block. Country scores (0–1 scale) across the five ORI domains: Regulation, Plan, Resource, Industry, and Grid. The color gradient (green to red) represents performance levels. This block-level analysis reveals domain-specific strengths and weaknesses, showing that high ORI rankings result from balanced performance across multiple blocks rather than from excellence in a single domain.
5.3. Correlation Between ORI and CI
The relationship between the Offshore Readiness Index (ORI) and the Clearance Index (CI) provides a deeper diagnostic layer to the analysis, moving beyond a simple performance metric to explore the availability of institutional information on MRE. The scatter plot presented in Figure 7 reveals a clear positive correlation between the two indices: countries with higher levels of data transparency (a higher CI) tend to exhibit stronger readiness performance (a higher ORI). This overarching trend suggests that institutional maturity, reflected in the availability and accessibility of public data, is a key enabling condition that often accompanies robust policy and regulatory frameworks.
Figure 7.
Correlation between ORI and Clearance Index (CI). The CI measures data availability as the proportion of criteria for which information is known. Dashed lines indicate median values. The four quadrants reveal distinct strategic profiles: high readiness with transparency (top-right), readiness with limited data (top-left), transparency without readiness (bottom-right), and dual deficiency (bottom-left). The positive correlation indicates that institutional transparency is a key enabler of offshore readiness.
Based on Figure 7, a detailed analysis of the four quadrants is provided, highlighting distinct strategic profiles that emerge from the combined ORI and CI:
- Countries located in the top-right quadrant correspond to the highest-ranking performers (Spain, Mexico, Costa Rica, Brazil) and two mid-ranking countries (Chile and Colombia). This positioning reflects not only strong offshore readiness but also high levels of data transparency, supported by a robust and verifiable information base. This alignment reinforces the credibility of their leadership in the sector. Among them, Spain stands out as a benchmark, excelling in both dimensions.
- Portugal and Uruguay occupy the Top-Left Quadrant. Although these countries demonstrate promising results in terms of offshore readiness, characterized by above-median ORI scores, the limited public information may hinder or delay the large-scale deployment of ocean energy technologies and the associated investments.
- The Bottom-Right Quadrant is solely occupied by Panama. While it demonstrates high transparency, as reflected in its CI score, significant gaps in offshore readiness result in a low ORI score. For this archetype, the key challenge lies not in information availability for policymaking but in implementing decisive measures to address the identified weaknesses.
- Countries in the Bottom-Left Quadrant (Argentina, Peru, Ecuador, and Cuba) face the dual challenge of low offshore readiness and limited data transparency. This position is particularly critical, as insufficient information both reflects an emerging institutional framework and impedes a comprehensive assessment of the barriers to readiness.
In conclusion, this analysis demonstrates that the CI goes beyond a simple data quality metric; it serves as a powerful secondary indicator of institutional maturity. When combined with the ORI, it provides a multi-dimensional strategic framework, offering a more nuanced and actionable assessment of a country’s readiness than a single performance score.
5.4. Comparison Between ORI and RISE
To externally validate the ORI, its performance was benchmarked against the World Bank’s Regulatory Indicators for Sustainable Energy (RISE), a global standard for energy sector governance. To facilitate a direct comparison, the normalized scores of both indices were analyzed, as shown in Figure 8.
Figure 8.
Comparison of ORI versus RISE Scores. Normalized performance (0–1) for offshore-specific readiness (ORI, blue) and general energy framework (RISE, red) from the World Bank. Performance gaps reveal strategic positioning: positive gaps indicate targeted offshore policies, negative gaps show opportunities for sector-specific development.
The results show a strong positive correlation, with countries such as Spain (ORI: 0.91, RISE: 0.83) and Mexico (ORI: 0.73, RISE: 0.75) performing well on both scales, which confirms the overall consistency of the ORI’s assessment.
However, the most insightful comparisons arise from the performance gaps between two scores. For instance, Costa Rica exhibits an ORI of 0.70 alongside a RISE score of 0.52, while Peru shows an ORI of 0.44 with a RISE score of 0.26. These discrepancies, with positive gaps of +0.18 in both cases, suggest that targeted policies have cultivated specialized readiness not yet mirrored in the broader regulatory framework, indicating a need for comprehensive policy integration to support sustainable energy development.
A second category is exemplified by Portugal, which exhibits the largest negative performance gap of −0.24 (ORI: 0.55 vs. RISE: 0.79). These countries possess a strong and highly rated general energy framework that has not yet been fully translated into offshore readiness, highlighting a clear opportunity for targeted policy development. Countries such as Chile (−0.13) and Argentina (−0.10) also belong to this category.
The third group includes top and medium performers like Mexico (−0.02), Uruguay (−0.02), and Colombia (+0.01). These countries exhibit a high degree of alignment between the ORI and RISE scores, indicating a well-integrated energy strategy in which general governance and sector-specific policies are developing in tandem.
This comparative, score-based analysis provides a robust diagnostic framework. It validates the ORI against an established benchmark while quantifying the strategic profiles of individual countries, providing a comprehensive and actionable perspective on their offshore energy development strategies.
5.5. Robustness and Stability Analysis
A critical aspect of any multi-criteria decision-making model is the robustness of its results, considering the uncertainty of the input dataset. Given that our proposed methodology relies on a non-linear optimization problem, which converges to a local optimum, a formal guarantee of global optimality cannot be claimed. To mitigate this issue and ensure the stability and reliability of the derived rankings, we implemented a comprehensive suite of robustness tests designed to challenge the model from multiple perspectives. These analyses verify the solution’s stability against variations in its core parameters, perturbations in the dataset, and the structural influence of its functional domains.
5.5.1. Parameter Sensitivity Analysis
The model’s final output is governed by two key hyperparameters: the weight of the entropy term () and the weight of the epistemic penalty term (). To ensure that our final scoring is not an artifact of a specific parameter choice (the so-called “knife-edge” problem), we performed a rigorous sensitivity analysis. The goal was to investigate the stability regions determined by this pair of parameters, using a grid search methodology.
The analysis systematically explores the hyperparameter space. Specifically, we varied on a linear scale from 0 to 1 and on a logarithmic scale from to 1. This latter choice is methodologically crucial, as it provides greater resolution at very small values, where the impact of the entropy term transitions from negligible to significant.
For each of the 121 pairs of (, ) in the grid, the entire optimization process was re-executed. The conversion into a binary map was then performed by applying a strict identity criterion: the resulting country scoring was compared against our reference scoring, and the corresponding cell in the stability map was marked as true (Stable) if and only if the two rankings were identical in every position. Any deviation, no matter how small, such as a single country shifting by one position, resulted in the cell being marked as false (Unstable). This matrix of boolean values constitutes the binary stability map visualized in Figure 9, which clearly delineates the stability region.
Figure 9.
Hyperparameter Sensitivity Analysis. Stability map showing parameter combinations (, ) that yield identical rankings (yellow) versus perturbed rankings (blue). The red circle marks the chosen parameters. The large stable region confirms the robustness of the final ORI ranking.
The analysis confirms that our selected parameters lie comfortably within this large, stable area, providing strong evidence for the robustness and reliability of the final scoring.
5.5.2. Bootstrap Analysis on Alternatives
To evaluate the statistical significance of the countries’ scores and their stability with respect to the dataset’s composition, a nonparametric bootstrap procedure was performed. This test assesses how the score of each country is affected by sampling uncertainty (Figure 10). We generated 500 B bootstrap samples by resampling the countries with replacement from the original dataset. For each sample, the complete optimization was re-executed to compute the criteria weights and the corresponding country scores. The final output of this analysis is a distribution of scores for each country, from which we calculated the mean score and its standard deviation. The close alignment between the reference scoring and the mean bootstrap scores, coupled with low standard deviations, provides strong evidence for the statistical stability of our results.
Figure 10.
Bootstrap Stability Analysis. Mean ORI scores from 500 bootstrap resamples (blue) compared with reference scores (red). The close alignment demonstrates the statistical robustness of the country rankings.
5.5.3. Stress Test Against Rank Reversal
Finally, to confirm the model’s resilience to the well-known rank reversal phenomenon—which occurs when alternatives are added or removed from the analysis—a stress test was conducted by introducing two synthetic extreme alternatives into the dataset: (i) an alternative with a score of 1 on all criteria (theoretical upper bound), and (ii) an alternative with a score of 0 on all criteria (theoretical lower bound). These synthetic alternatives represent the most extreme performance profiles theoretically possible within the evaluation framework. As expected, they were correctly assigned to the top and bottom ranks, respectively.
Crucially, their introduction did not perturb the relative ordering of the evaluated countries, with only a marginal shift of a single position observed and no rank crossing between any pair of countries, as shown in Figure 11. This outcome demonstrates the model’s structural integrity and its resistance to the pathological rank reversal behaviors that can affect other MCDM methods, such as AHP. The stability of the internal ranking, even under the stress of extreme synthetic alternatives, provides strong evidence that the proposed weight-elicitation framework produces robust and reliable country assessments.
Figure 11.
Rank Reversal Stress Test. Comparison of country rankings before (Reference Ranking) and after introduction of synthetic extreme alternatives (all criteria = 1, and all criteria = 0). The absence of rank crossing among evaluated countries confirms the model’s structural stability.
5.5.4. Baseline Comparison with Equal Weights
A fundamental validation question is whether the proposed optimization framework contributes beyond a simple, assumption-free aggregation of the underlying data. To address this, we compared the ORI ranking against a baseline computed using uniform weights ( for all criteria), which represents the methodological choice adopted by several established indices, including RISE [13].
Table 2 presents the comparative results. The analysis reveals a Kendall’s of 0.846 and a Spearman’s of 0.951, indicating a strong yet imperfect correlation between the two approaches. Notably, 7 of 13 countries maintain identical rankings, with the top tier (Spain, Mexico, Costa Rica) and bottom tier (Argentina, Panama, Cuba) remaining completely stable. However, meaningful differences emerge in the middle tier (positions 4–10), where the maximum rank shift is two positions.
Table 2.
Comparison of ORI rankings under optimized and equal weights.
Critically, these differences are not random but interpretable in light of the hierarchical constraints. Countries with stronger regulatory frameworks but moderate resource endowments (Portugal, Colombia) gain positions under the optimized weights, while countries with relatively abundant resources but weaker regulatory maturity (Chile, Peru) are penalized. This pattern directly reflects the encoded policy assumption that Regulation > Resource, demonstrating that the framework successfully translates strategic priorities into measurable ranking adjustments.
Figure 12 visualizes this comparison. The left panel shows the score correlation between the two approaches, with color indicating whether a country’s rank improved (green), worsened (red), or remained unchanged (gray) under optimization. The right panel displays the rank stability across all alternatives.
Figure 12.
Baseline comparison between optimized and equal-weight ORI rankings. (a) Score correlation plot showing strong agreement () with interpretable deviations: green markers indicate countries gaining rank under optimization (stronger regulation), red markers indicate countries losing rank (weaker regulation relative to resources). (b) Dumbbell plot showing rank stability: the top and bottom tiers remain unchanged, whereas middle-tier positions shift by up to two positions, consistent with the encoded hierarchical constraints.
This pattern reflects the expected behavior of a well-calibrated strategic framework. Complete ranking stability would indicate that hierarchical constraints add no value; complete instability would signal methodological artifacts. The observed outcome—invariant extremes with mid-tier shifts—demonstrates that the optimization preserves data-driven consensus while introducing differentiation where it matters most. Critically, the direction of changes is consistent with encoded assumptions: countries with stronger regulatory frameworks (Portugal, Colombia) gain positions, while those with abundant resources but weaker regulation (Chile, Peru) are penalized—precisely the effect that the Regulation > Resource constraint is designed to produce.
6. Conclusions and Recommendations
This study has developed and validated a novel multi-criteria framework for assessing the offshore renewable energy readiness of Ibero-American countries, delivering a dual contribution: a methodological advancement in the field of MCDM and a practical, transparent, and adaptable tool for policy analysis.
The main methodological innovation of this paper is a technique that provides greater control over the problem of determining weights by integrating three key principles. First, the inclusion of a Shannon entropy term so that no single criterion monopolizes the decision on its importance. Second, a penalty for epistemic regularization that anchors the model to knowledge derived from experts, recognizing that criteria such as the existence of a maritime spatial plan have intrinsic value. Finally, the use of hierarchical constraints across the five thematic blocks ensures that high-level strategic priorities are respected by the model. The stability and reliability of this approach and the resulting model have been validated using a series of stability tests.
By providing a clear, multi-dimensional snapshot of a country’s strengths and weaknesses, the index serves as an actionable tool for policymakers. Furthermore, the model’s architecture enables them to navigate beyond aggregate rankings and perform a diagnostic analysis of a country’s specific strengths and weaknesses within each functional domain. The proposed model is also designed to be scalable, accommodating the expansion of the database with new criteria or countries, which ensures its long-term utility.
Ultimately, the results generated by the ORI are consistent with the foundational hypotheses of this study. The final country positioning in Offshore Readiness provides empirical support for the notion that robust regulatory frameworks and strategic, long-term planning are the pivotal enabling conditions for future development in the offshore renewable energy sector. This finding reinforces the strategic vision that industrial capacity and grid infrastructural development are consequent steps that follow, rather than precede, a solid and well-articulated policy foundation.
Furthermore, readiness regarding marine energy deployment placement is closely linked to shipping and experience with marine logistics, as in the cases of Spain, Portugal, and Chile, for instance. Brazil has been promoted to the high-tier ORI ranking thanks to its underlined advances in Industry. Other countries, such as Cuba, Panama, and Peru, have received lower scores, mainly due to their Grid and Plan blocks, which are still in developing pathways.
Additionally, the correlation between CI and ORI provides an overview of data availability and readiness for offshore energy exploitation; however, not all countries can openly share the data required for this study. Such correlations allowed us to conclude that countries such as Spain, Mexico, Costa Rica, Brazil, and Chile are positively evaluated for the consistency of CI and ORI, whereas Ecuador, Peru, and Argentina fall within the low-ranking region (CI-ORI). It was concluded that the CI-ORI trade-off demonstrates that the CI goes beyond a simple data quality metric; it serves as a powerful secondary indicator of institutional maturity.
Regarding the ORI and RISE classifications, the alignment and divergence between the two scores provide a quantitative basis for diagnosing a country’s strategic position in marine energy development. The strong correlation, as evidenced by high performers such as Spain (ORI: 0.91, RISE: 0.83) and Mexico (ORI: 0.73, RISE: 0.75), validates the ORI’s overall consistency. However, the critical insight lies in the performance gaps: positive discrepancies of +0.18 for both Costa Rica and Peru quantitatively demonstrate that targeted sectoral policies can yield significant offshore readiness (ORI) that outpaces the broader regulatory environment (RISE). Conversely, the substantial negative gap of −0.24 for Portugal, alongside those of Chile (−0.13) and Argentina (−0.10), provides clear numerical evidence that a robust general energy framework does not automatically translate into specialized marine readiness. In addition, the model’s robustness against rank reversal was validated through a stress test using extreme synthetic alternatives. The introduction of these “best-case” and “worst-case” options did not alter the original countries’ relative rankings, resulting only in a marginal, non-crossing positional shift. This demonstrates strong resistance to the pathological rank reversals common in methods such as AHP, thereby confirming the model’s structural integrity and reliability for applied MCDM. Based on the ORI results and block-level analysis, we provide differentiated policy recommendations organized by performance tier. Table 3 summarizes the priority actions for each group. The following subsections elaborate on these recommendations with additional context.
Table 3.
Priority policy actions by country tier.
Primary recommendations, mainly related to the five thematic blocks (Regulation, Planning, Resource, Industrialization, and Electrical Grid), were defined. For the group of countries with significant progress in the different areas identified in the study (Spain, Mexico, Costa Rica, Brazil, Portugal):
- Consolidate and maintain leadership in regulation and planning. Spain is a reference in regulation, but it should continue updating its frameworks to include new technologies.
- Strengthen the industrial component and marine infrastructure. Although Brazil shows industrial strength, Spain and other countries could improve their capacity for manufacturing and testing emerging technologies.
- Expand technological diversification. Some countries could broaden their studies towards less mature technologies (such as salinity gradients, thermal gradients, etc.).
- Update the electrical grid to ensure future integration. Even as leaders, these countries should continue reinforcing their grids to integrate offshore generation. A clear example of this need is the incident in Spain during the shutdown of 28 April 2025 [48].
For the group of countries with partial progress (Chile, Uruguay, Colombia, Ecuador), the recommendations are:
- Strengthen regulatory frameworks specific to offshore energies. These countries often lack clear and consistent regulations.
- Develop medium and long-term development plans. Strategic planning is still weak or fragmented.
- Promote resource studies in all their variants. There are gaps in the characterization of resources such as tides, thermal gradients, etc.
- Develop national industrial capacities. They need technological networks and infrastructures for testing and validation.
- Review the electrical grid with a focus on future integration. Improve technical codes and explicitly include marine energies.
For the group of countries whose development in the areas identified by the study is still lagging (Peru, Argentina, Panama, and Cuba), the recommendations are:
- Promote the development of a roadmap and basic regulation. Many of these countries lack even general regulations adapted to marine environments.
- Prioritize resource studies as a starting point to foster interest from governments and industry. This is essential for understanding which technologies are viable and for attracting investment.
- Start plans for adapted infrastructure (ports, grids, etc.).
- Promote industrial and technical training. These countries are far from having national capacities to manufacture or maintain offshore technologies.
- Update regulatory frameworks for the electrical system. Modernize technical standards to allow the inclusion of new energy sources.
Overall, it is emphasized that without specific regulation and strategic planning, the development of MRE is not feasible. Even countries with high potential for marine energy resources or existing infrastructure need to align their regulatory frameworks and energy plans in order to make progress in this field.
Author Contributions
C.M. has contributed to the software, validation, resources, and data curation. C.M. and M.L. have contributed to the Conceptualization and Methodology. C.M., E.G.-P., M.C.-G. and M.L. have contributed to the project administration. All authors have contributed to the investigation, formal analysis, writing the manuscript, supervision, and review and editing of the manuscript’s draft. All authors have read and agreed to the published version of the manuscript.
Funding
This research received no external funding.
Data Availability Statement
Data and self-produced tools generated in this study are available to the public upon reasonable request.
Acknowledgments
This work is partly facilitated by collaboration within the framework of the REMAR thematic network (Opportunities for Integration of Marine Energy into Ibero-American Electricity Grids), promoted by the Ibero-American Programme of Science and Technology for Development (CYTED).
Conflicts of Interest
Author Adriana García-Mendoza was employed by the Oceanic Platform of the Canary Islands (PLOCAN). Author Marcos Lafoz was employed by the Ciemat. The remaining authors declare that the research was conducted in the absence of any commercial or financial relationships that could be construed as a potential conflict of interest.
Abbreviations
The following abbreviations are used in this manuscript:
| AHP | Analytic Hierarchy Process |
| CI | Clearance Index |
| CYTED | Ibero-American Programme for Science and Technology for Development |
| IRENA | International Renewable Energy Agency |
| MCDM | Multi-Criteria Decision-Making |
| MRE | Marine renewable energies |
| NaN | Non assigned number |
| ORI | Offshore Readiness Index |
| RE | Renewable energies |
| REMAR | Redes eléctricas iberoamericanas de las energías del mar |
| RISE | Regulatory Indicators for Sustainable Energy |
| ROR | Robust Ordinal Regression |
| TOPSIS | Technique for Order Performance by Similarity to Ideal Solution |
| TRL | Technology Readiness Level |
Appendix A. Criteria and Sub-Criteria to Determine the ORI Index
Table A1 comprises values for prioritization in the optimization model shown in Section 4. Moreover, Table A2 presents the boolean values involved in the ORI estimation for the assessed countries.
Table A1.
Identifier codes and Epistemic profile () for the sub-criteria considered in the estimation of the ORI index. Identifiers are required for the understanding of Table A2.
Table A2.
Criteria assessment for ORI estimation.
References
- Soni, N.; Singh, P.K.; Mallick, S.; Pandey, Y.; Tiwari, S.; Mishra, A.; Tiwari, A. Advancing Sustainable Energy: Exploring New Frontiers and Opportunities in the Green Transition. Adv. Sustain. Syst. 2024, 8, 2400160. [Google Scholar] [CrossRef] [Scilit]
- International Renewable Energy Agency. Ocean Energy; International Renewable Energy Agency: Abu Dhabi, United Arab Emirates, 2024. [Google Scholar]
- Okash, M. The Renewables Dividend: Why Somalia Must Bet Big on Clean Power; World Economic Forum (WEF): Cologny, Switzerland, 2025; Available online: https://www.weforum.org/stories/2025/09/somalia-renewable-energy-dividend/ (accessed on 30 October 2025).
- Lokey, E. Renewable Energy Project Development Under the Clean Development Mechanism: A Guide for Latin America; Routledge: New York, NY, USA, 2012. [Google Scholar]
- Washburn, C.; Pablo-Romero, M. Measures to promote renewable energies for electricity generation in Latin American countries. Energy Policy 2019, 128, 212–222. [Google Scholar] [CrossRef] [Scilit]
- Arango-Aramburo, S.; Ríos-Ocampo, J.; Larsen, E. Examining the decreasing share of renewable energy amid growing thermal capacity: The case of South America. Renew. Sustain. Energy Rev. 2020, 119, 109648. [Google Scholar] [CrossRef] [Scilit]
- Taveira-Pinto, F.; Rosa-Santos, P.; Fazeres-Ferradosa, T. Marine renewable energy. Renew. Energy 2020, 150, 1160–1164. [Google Scholar] [CrossRef] [Scilit]
- Salvador, S.; Gimeno, L.; Sanz Larruga, F.J. The influence of maritime spatial planning on the development of marine renewable energies in Portugal and Spain: Legal challenges and opportunities. Energy Policy 2019, 128, 316–328. [Google Scholar] [CrossRef] [Scilit]
- Pereira, M.G.; Camacho, C.F.; Freitas, M.A.V.; Silva, N.F.d. The renewable energy market in Brazil: Current status and potential. Renew. Sustain. Energy Rev. 2012, 16, 3786–3802. [Google Scholar] [CrossRef] [Scilit]
- Steiger, N.J.; Smerdon, J.E.; Seager, R.; Williams, A.P.; Varuolo-Clarke, A.M. ENSO-driven coupled megadroughts in North and South America over the last millennium. Nat. Geosci. 2021, 14, 739–744. [Google Scholar] [CrossRef] [Scilit]
- Zhang, L.; Yu, X.; Zhou, T.; Zhang, W.; Hu, S.; Clark, R. Understanding and attribution of extreme heat and drought events in 2022: Current situation and future challenges. Adv. Atmos. Sci. 2023, 40, 1941–1951. [Google Scholar] [CrossRef] [Scilit]
- Cui, Y.; Zhao, H. Marine renewable energy project: The environmental implication and sustainable technology. Ocean Coast. Manag. 2023, 232, 106415. [Google Scholar] [CrossRef] [Scilit]
- ESMAP. Regulatory Indicators for Sustainable Energy (RISE); World Bank: Washington, DC, USA, 2025; Available online: http://hdl.handle.net/10986/43307 (accessed on 30 October 2025).
- Li, H.L.; Ma, L.C. Detecting and adjusting ordinal and cardinal inconsistencies through a graphical and optimal approach in AHP models. Comput. Oper. Res. 2007, 34, 780–798. [Google Scholar] [CrossRef] [Scilit]
- Aguarón, J.; Escobar, M.T.; Moreno-Jiménez, J.M. Reducing inconsistency measured by the geometric consistency index in the analytic hierarchy process. Eur. J. Oper. Res. 2021, 288, 576–583. [Google Scholar] [CrossRef] [Scilit]
- Beliakov, G.; Wu, J.Z. Learning fuzzy measures from data: Simplifications and optimisation strategies. Inf. Sci. 2019, 494, 100–113. [Google Scholar] [CrossRef] [Scilit]
- Pastor, M.; Cabrera, I.; Mendoza, A.; Haim, P.; Tula, R.; Lifschitz, A.; Cristofaro, N.; Shadman, M.; Estrabis, T.; Angulo, T.; et al. LAS ENERGÍAS DEL MAR EN LOS PAÍSES DE IBEROAMÉRICA: Políticas, Capacidades, Recurso e Integración en sus Redes. Report by Centro de Investigaciones Energéticas Medioambientales y Tecnológicas (CIEMAT). Report for Cyted es el Programa Iberoamericano de Ciencia y Tecnología (CYTED). 2024. Available online: https://ria.utn.edu.ar/bitstreams/38bd5b19-b6ab-4b14-a1e1-4264df011526/download (accessed on 30 October 2025).
- He, Y.; Jiao, Z.; Yang, J. Comprehensive evaluation of global clean energy development index based on the improved entropy method. Ecol. Indic. 2018, 88, 305–321. [Google Scholar] [CrossRef] [Scilit]
- Iddrisu, I.; Bhattacharyya, S.C. Sustainable Energy Development Index: A multi-dimensional indicator for measuring sustainable energy development. Renew. Sustain. Energy Rev. 2015, 50, 513–530. [Google Scholar] [CrossRef] [Scilit]
- Bandura, R. A Survey of Composite Indices Measuring Country Performance: 2008 Update a UNDP/ODS Working Paper; Technical Report; United Nations Development Programme: Rome, Italy, 2008. [Google Scholar]
- Mainali, B.; Silveira, S. Using a sustainability index to assess energy technologies for rural electrification. Renew. Sustain. Energy Rev. 2015, 41, 1351–1365. [Google Scholar] [CrossRef] [Scilit]
- Brunelli, M. A survey of inconsistency indices for pairwise comparisons. Int. J. Gen. Syst. 2018, 47, 751–771. [Google Scholar] [CrossRef] [Scilit]
- Tu, J.; Wu, Z. Analytic hierarchy process rank reversals: Causes and solutions. Ann. Oper. Res. 2025, 346, 1785–1809. [Google Scholar] [CrossRef] [Scilit]
- Solbrekke, I.M.; Sorteberg, A. Norwegian offshore wind power—Spatial planning using multi-criteria decision analysis. Wind Energy 2024, 27, 5–32. [Google Scholar] [CrossRef] [Scilit]
- Gkeka-Serpetsidaki, P.; Tsoutsos, T. A methodological framework for optimal siting of offshore wind farms: A case study on the island of Crete. Energy 2022, 239, 122296. [Google Scholar] [CrossRef] [Scilit]
- Spyridonidou, S.; Vagiona, D.G. Systematic Review of Site-Selection Processes in Onshore and Offshore Wind Energy Research. Energies 2020, 13, 5906. [Google Scholar] [CrossRef] [Scilit]
- Yousefi, H.; Moradi, S.; Zahedi, R.; Ranjbar, Z. Developed analytic hierarchy process and multi criteria decision support system for wind farm site selection using GIS: A regional-scale application with environmental responsibility. Energy Convers. Manag. X 2024, 22, 100594. [Google Scholar] [CrossRef] [Scilit]
- Abramic, A.; Garcia Mendoza, A.; Cordero-Penin, V.; Magalhães, M.; Fernández-Palacios, Y.; Andrade, C.; Calado, H.; Kaushik, S.; Carreira, G.; Nogueira, N.; et al. Site selection within the maritime spatial planning: Insights from use-cases on aquaculture, offshore wind energy and aggregates extraction. Ocean Coast. Manag. 2024, 251, 107051. [Google Scholar] [CrossRef] [Scilit]
- Cinelli, M.; Kadziński, M.; Gonzalez, M.; Słowiński, R. How to support the application of multiple criteria decision analysis? Let us start with a comprehensive taxonomy. Omega 2020, 96, 102261. [Google Scholar] [CrossRef] [Scilit]
- Greco, S.; Słowiński, R.; Wallenius, J. Fifty years of multiple criteria decision analysis: From classical methods to robust ordinal regression. Eur. J. Oper. Res. 2025, 323, 351–377. [Google Scholar] [CrossRef] [Scilit]
- Greco, S.; Słowiński, R.; Figueira, J.R.; Mousseau, V. Robust Ordinal Regression. In Trends in Multiple Criteria Decision Analysis; Springer: Boston, MA, USA, 2010; Volume 142, pp. 241–283. [Google Scholar] [CrossRef] [Scilit]
- Pastor, M.; Cabrera, I.; Mendoza, A.; Haim, P.; Tula, R.; Lifschitz, A.; Cristofaro, N.; Shadman, M.; Estrabis, T.; Angulo, T.A.; et al. Las Energías del Mar en los Países de Iberoamérica; Programa Iberoamericano de Ciencia y Tecnología para el Desarrollo (CYTED): Madrid, Spain, 2024. [Google Scholar]
- PRIMRE. Marine Energy Projects Database; United States Department of Energy: Washington, DC, USA, 2025; Available online: https://openei.org/wiki/PRIMRE/Databases/Projects_Database (accessed on 30 October 2025).
- Grabisch, M.; Marichal, J.L.; Mesiar, R.; Pap, E. Aggregation Functions; Cambridge University Press: Cambridge, UK, 2009; p. 480. [Google Scholar]
- Corrente, S.; Greco, S.; Slowinski, R. Robust Ordinal Regression in case of Imprecise Evaluations. arXiv 2012, arXiv:1206.6317. [Google Scholar] [CrossRef] [Scilit]
- EPE. Roadmap Eólica Offshore Brasil: Perspectivas e Caminhos para a Energia eóLica Marítima (Nota Técnica No. NT-EPE-PR-001/2020-R2); Empresa de Pesquisa Energética (EPE): Rio de Janeiro, Brazil, 2020. Available online: https://www.epe.gov.br/sites-pt/publicacoes-dados-abertos/publicacoes/PublicacoesArquivos/publicacao-456/Roadmap_Eolica_Offshore_EPE_versao_R2.pdf (accessed on 6 October 2025).
- Ministerio para la Transición Ecológica y el Reto Demográfico. Actualización del Plan Nacional Integrado de Energía y Clima 2021–2030; MITECO: Madrid, Spain, 2023; Available online: https://www.miteco.gob.es (accessed on 30 October 2025).
- Ministerio para la Transición Ecológica y el Reto Demográfico. Real Decreto 150/2023, de 28 de Febrero, por el que se Aprueban los Planes de Ordenación del Espacio Marítimo de las Cinco Demarcaciones Marinas Españolas; Boletín Oficial del Estado (BOE): Madrid, Spain, 2023; pp. 32350–32574. Available online: https://www.boe.es/buscar/act.php?id=BOE-A-2023-5704 (accessed on 30 October 2025).
- REE. Plan de Desarrollo de la Red de Transporte de Energía Eléctrica: Período 2021–2026; Red Eléctrica de España (REE), Ministerio para la Transición Ecológica y el Reto Demográfico: Alcobendas, Spain, 2022. [Google Scholar]
- SENER. Mapa de Ruta Tecnológica de Energía del Océano; Secretaría de Energía (SENER): Mexico City, Mexico, 2017. [Google Scholar]
- Instituto Costarricense de Electricidad. Electricity Generation Expansion Plan 2024–2040; Grupo ICE: San José, Costa Rica, 2025; Available online: www.gob.mx/cms/uploads/attachment/file/279711/NT_OCEANO_VERSION_251017__rev1.pdf (accessed on 7 October 2025).
- República Portuguesa. Plano Nacional Energia e Clima 2021–2030 (PNEC 2030); Ministério do Ambiente e da Ação Climática: Lisbon, Portugal, 2020; Available online: https://apambiente.pt/clima/pnec-2030 (accessed on 30 October 2025).
- Economia e Ambiente e Energia—Gabinete da Secretária de Estado do Mar e Gabinete do Secretário de Estado da Energia. Diário da República n.º 77/2025, Série II de 2025-04-21. 2025. Available online: https://diariodarepublica.pt/dr/detalhe/despacho/4752-2025-915282933 (accessed on 30 October 2025).
- Régimen de Fomento Nacional para el Uso de Fuentes Renovables de Energía Destinada a la Producción de Energía Eléctrica. Diario Oficial de la Nación. Ley n.º 27.191: Modifica la Ley N.º 26.190. 2015. Available online: https://servicios.infoleg.gob.ar/infolegInternet/anexos/250000-254999/253626/norma.htm (accessed on 30 October 2025).
- Régimen de Fomento Nacional para el Uso de Fuentes Renovables de Energía Destinada a la Producción de Energía Eléctrica. Diario Oficial de la Nación. Ley n.º 26.190. 2006. Available online: https://www.argentina.gob.ar/normativa/nacional/ley-26190-123565/texto (accessed on 30 October 2025).
- Régimen de Fomento Nacional para el Uso de Fuentes Renovables de Energía Destinada a la Producción de Energía Eléctrica. Diario Oficial de la Nación. Ley n.º 27.424. 2017. Available online: https://www.argentina.gob.ar/normativa/nacional/ley-27424-305179 (accessed on 30 October 2025).
- Secretaría Nacional de Energía de Panamá. Plan Energético Nacional 2015–2050: Panamá, el Futuro que Queremos; Secretaría Nacional de Energía de Panamá: Panama City, Panama, 2014; Available online: http://www.energia.gob.pa/wp-content/uploads/2020/08/Plan-Energetico-Nacional-2015-2050-1_compressed-1.pdf (accessed on 30 October 2025).
- Batlle, C.; Barruso, M.; Rodilla, P.; Canoyra, A. The (Hopefully) Enlightening Blackout in Spain: Questions and Lessons for the Future (Research Commentary RC-2025-03); MIT Center for Energy and Environmental Policy Research (CEEPR): Cambridge, MA, USA, 2025; Available online: https://ceepr.mit.edu/workingpaper/the-hopefully-enlightening-blackout-in-spain-questions-and-lessons-for-the-future/ (accessed on 30 October 2025).
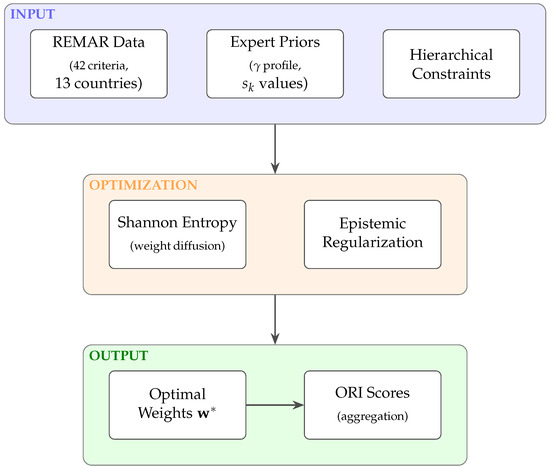
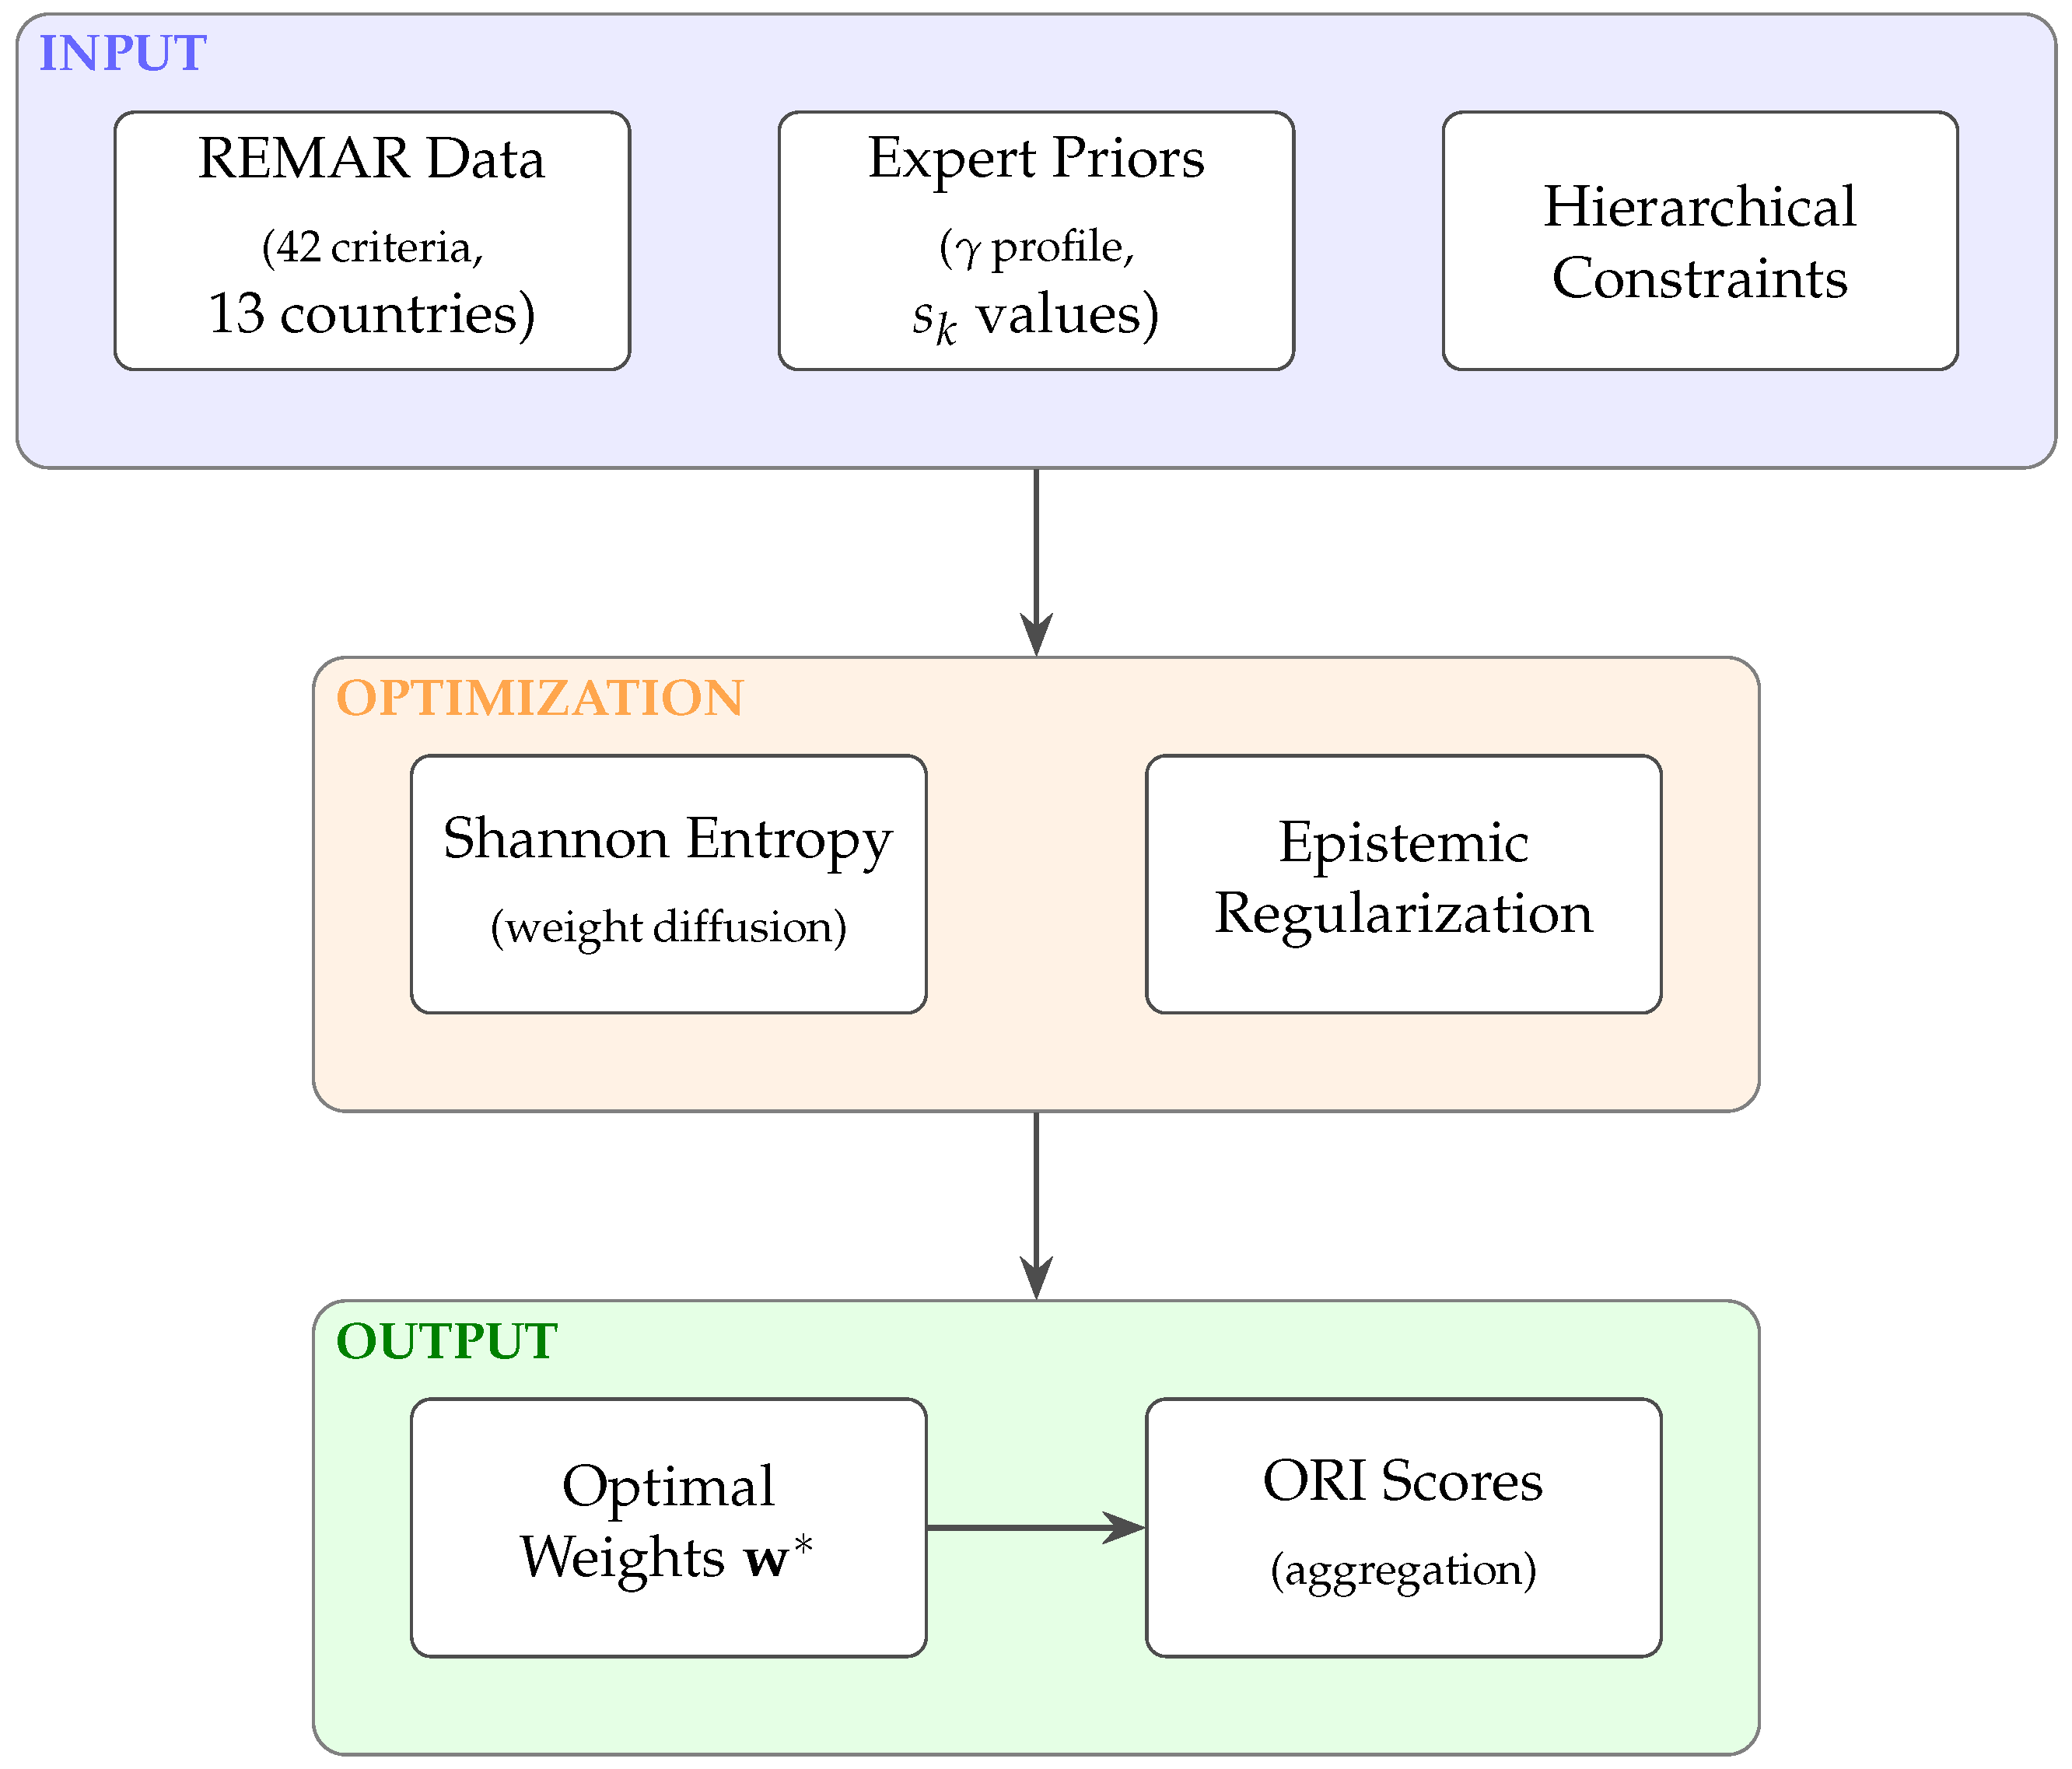
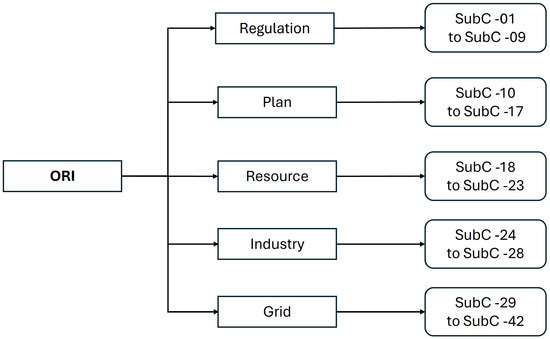
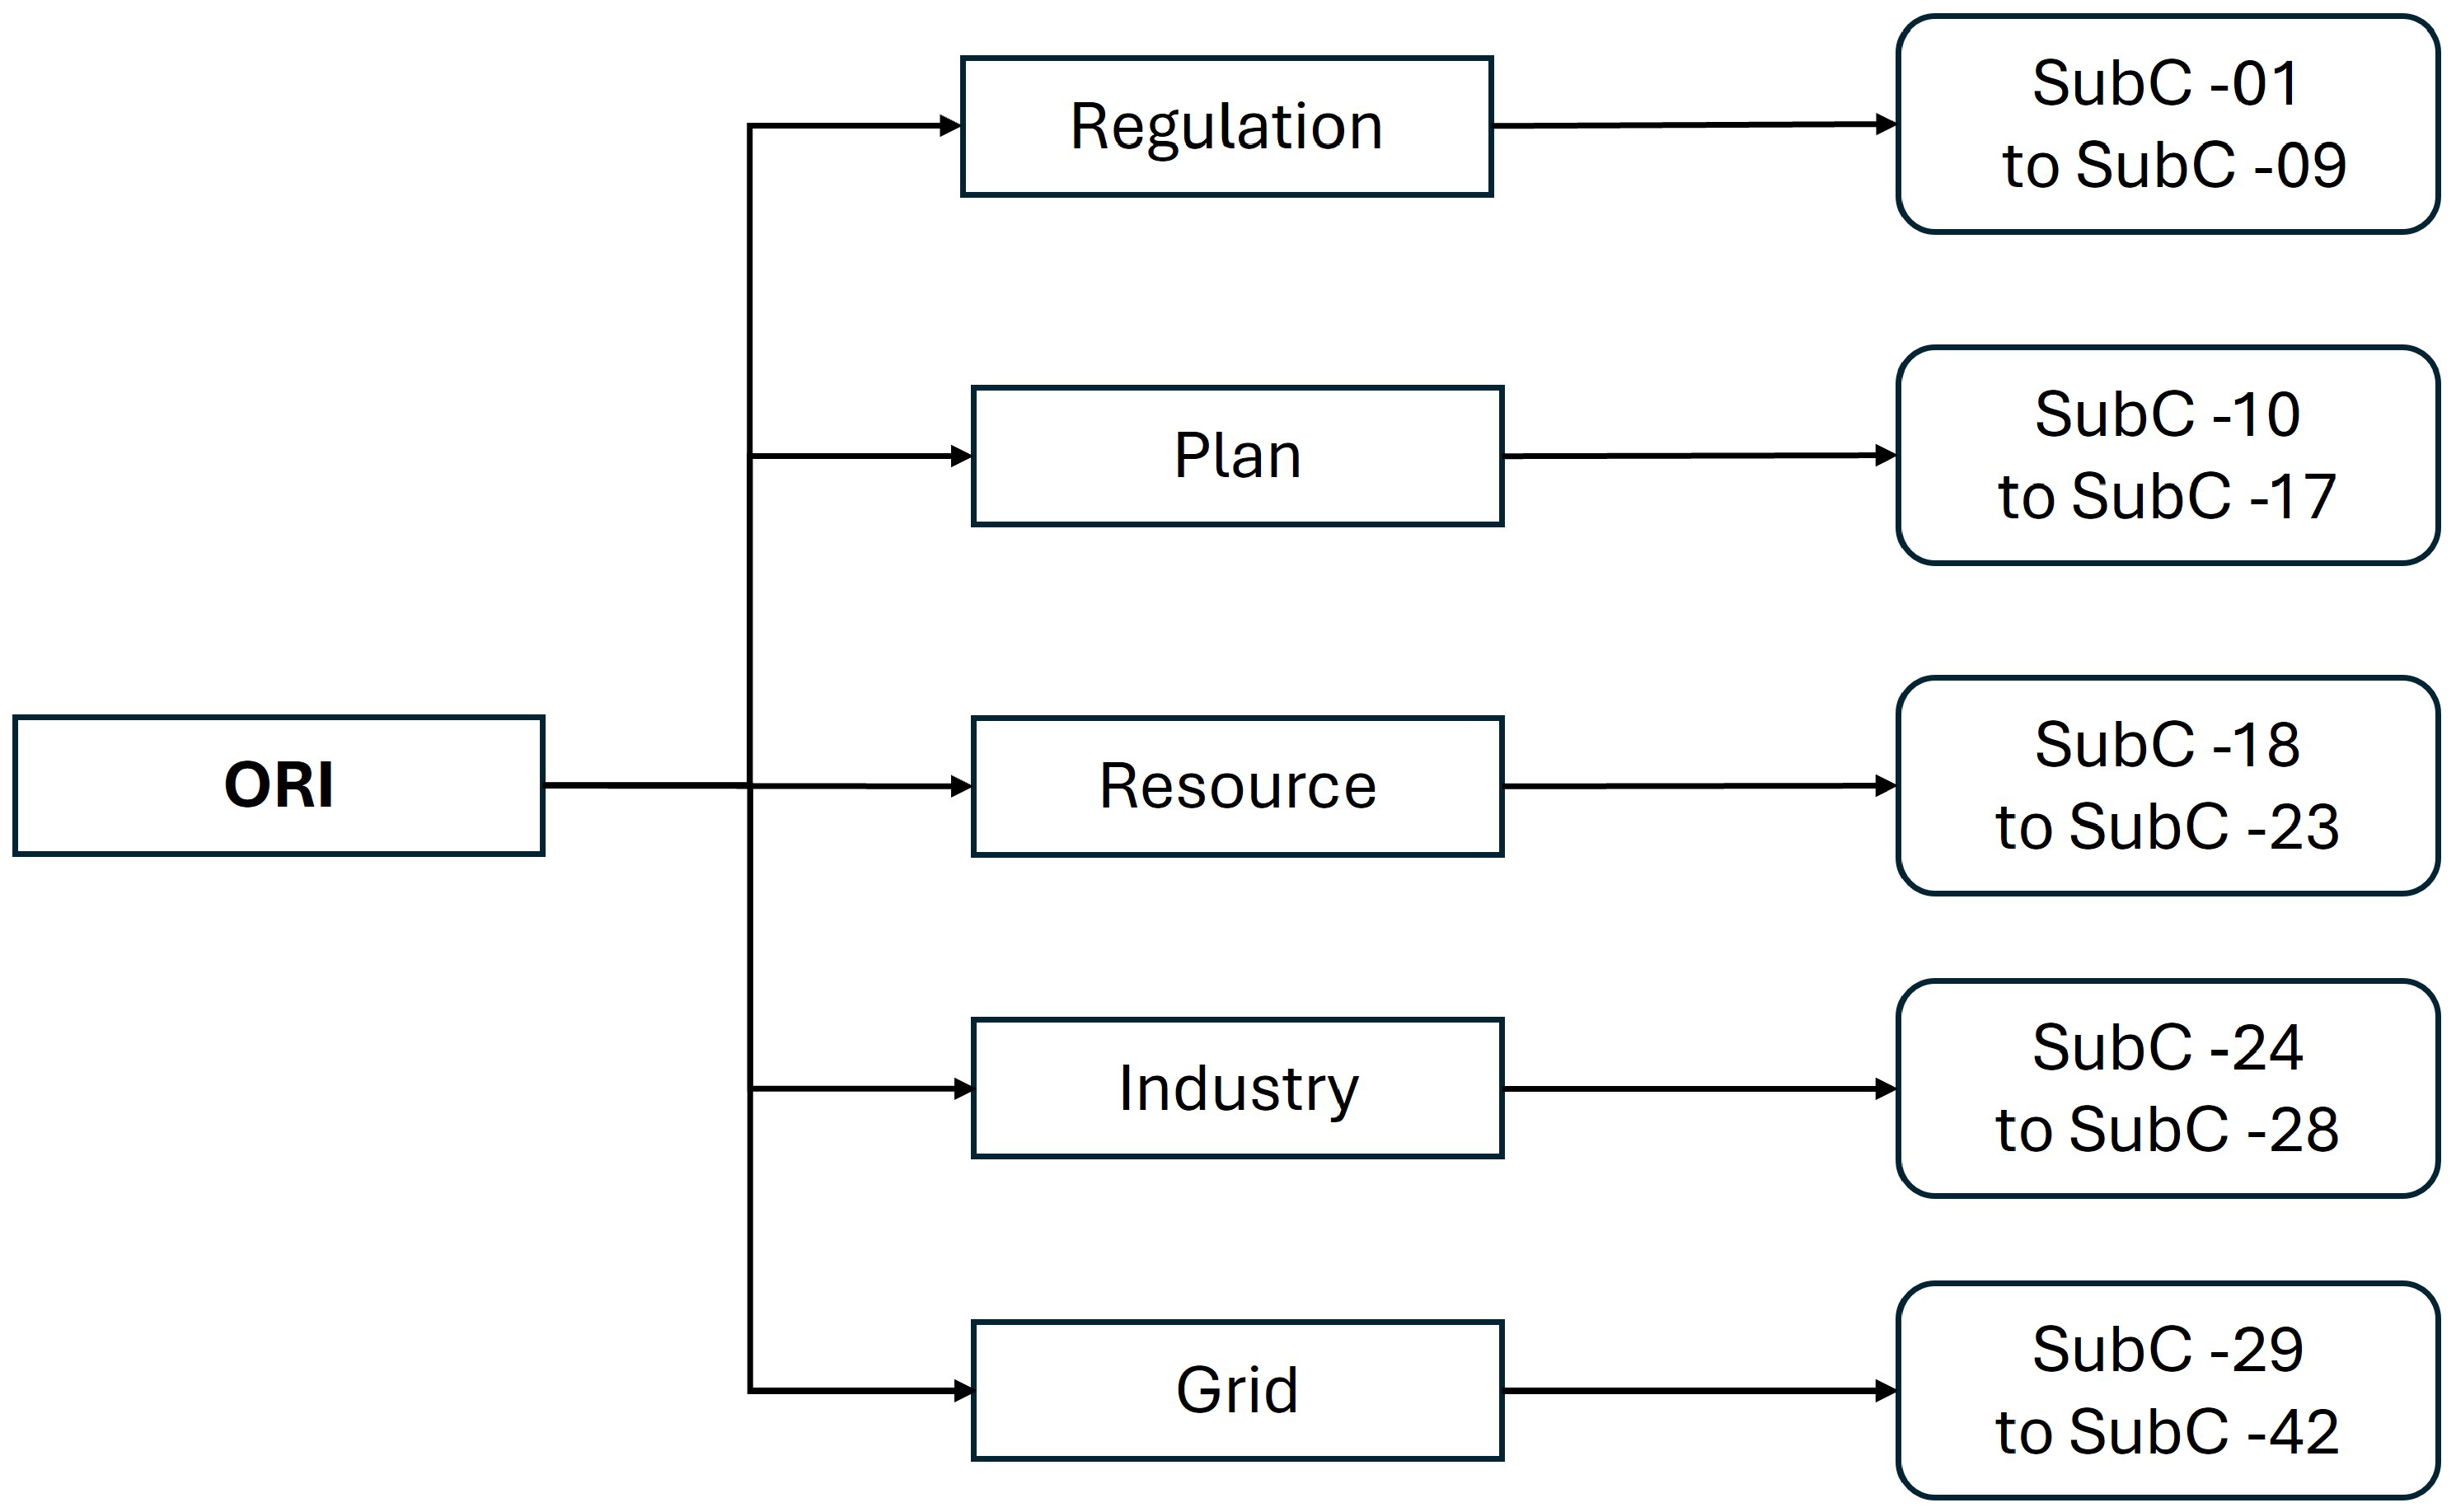
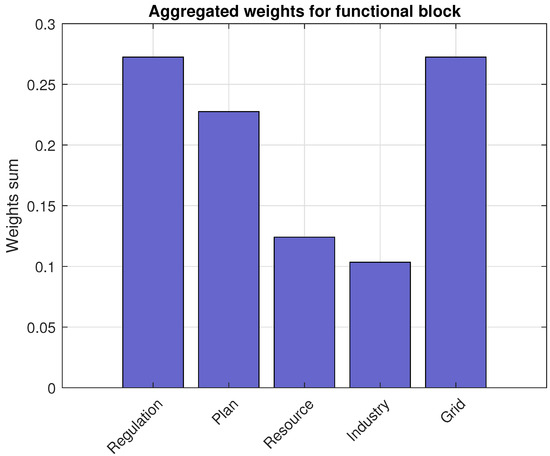
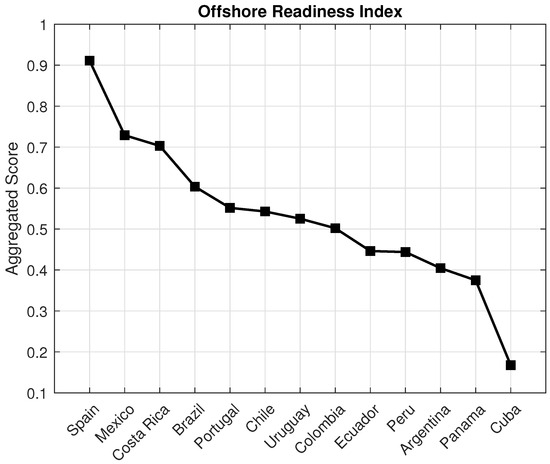
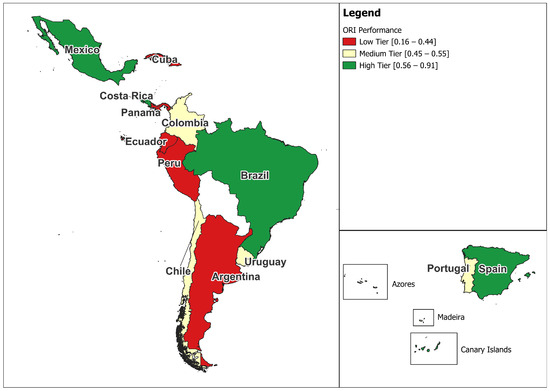
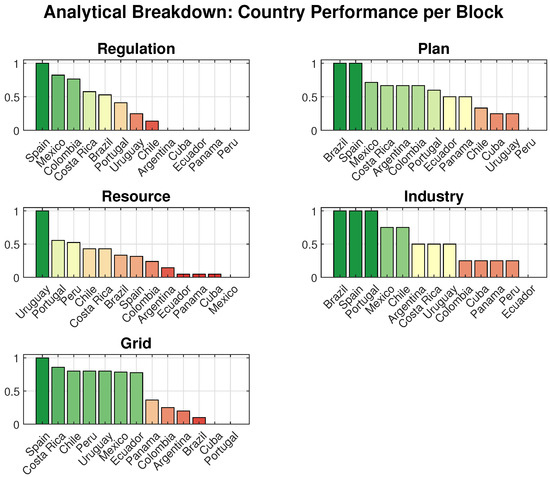
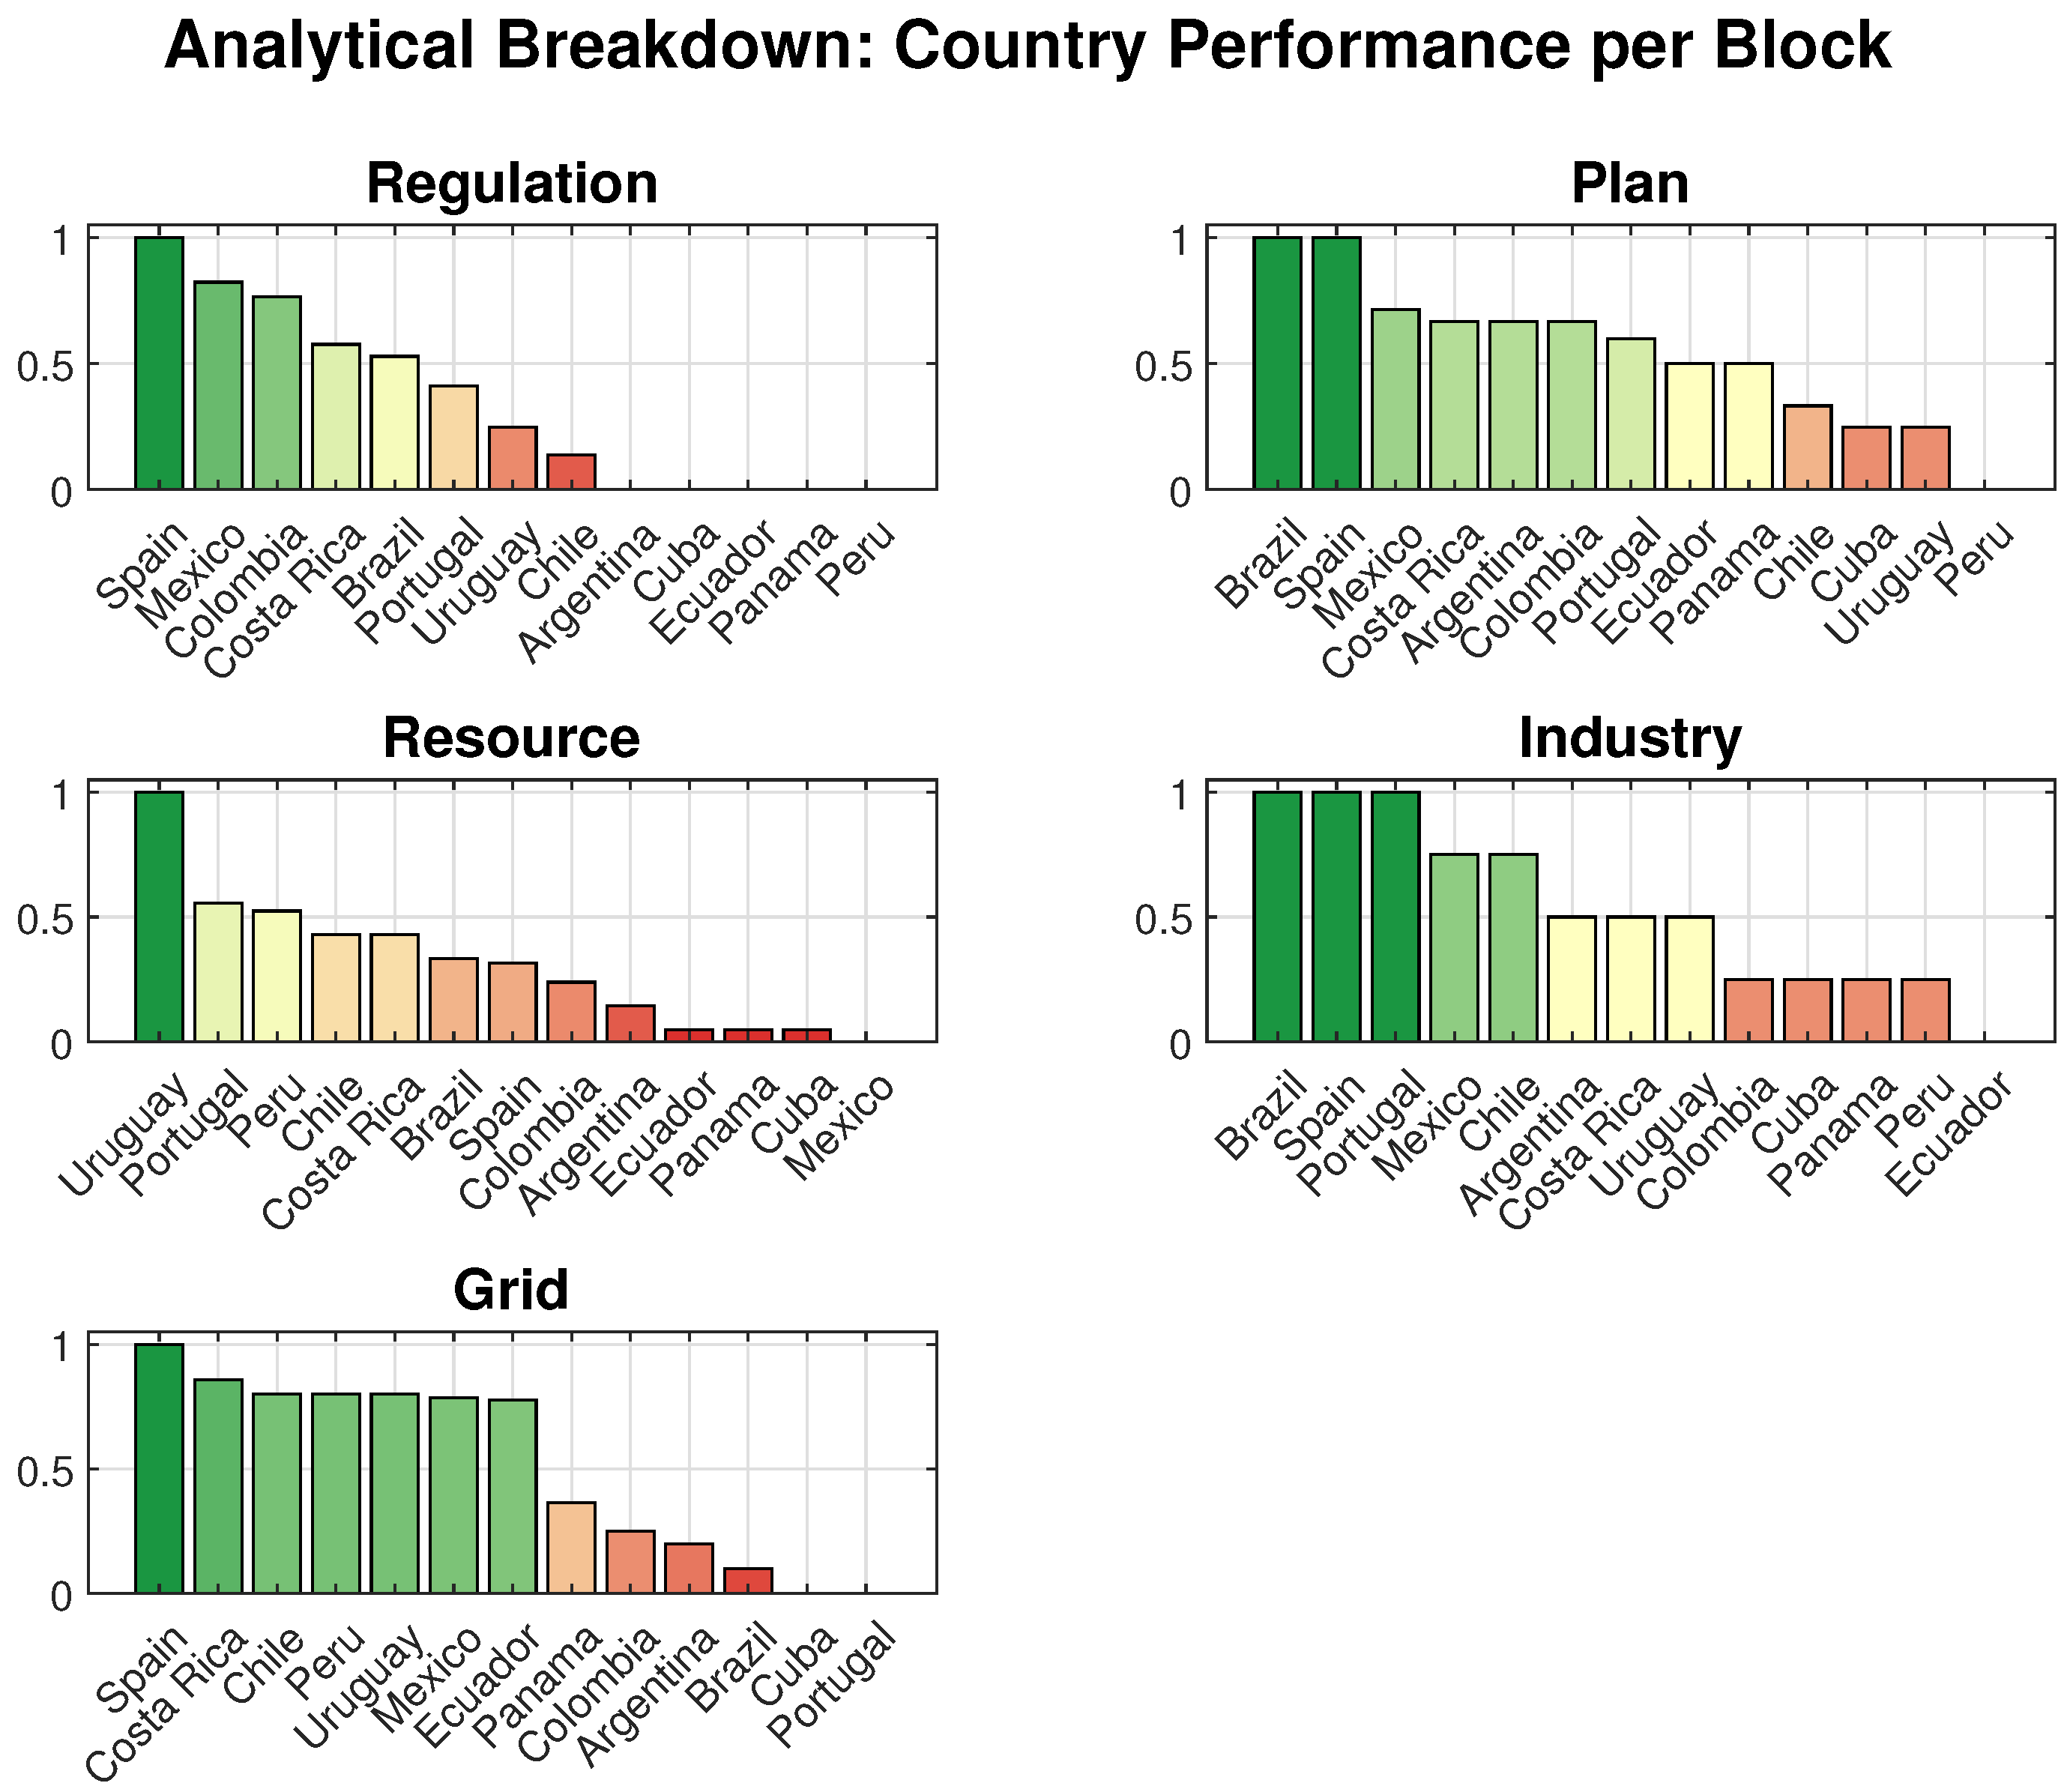
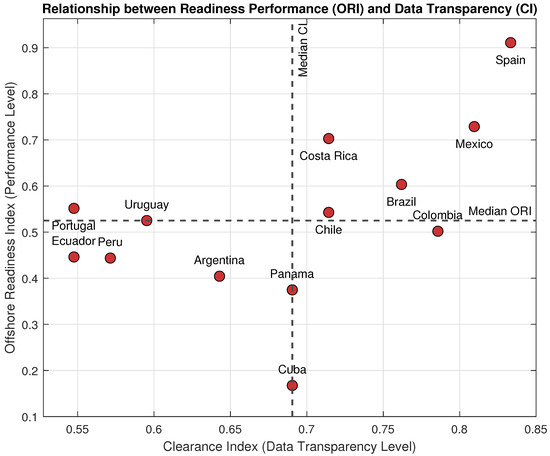
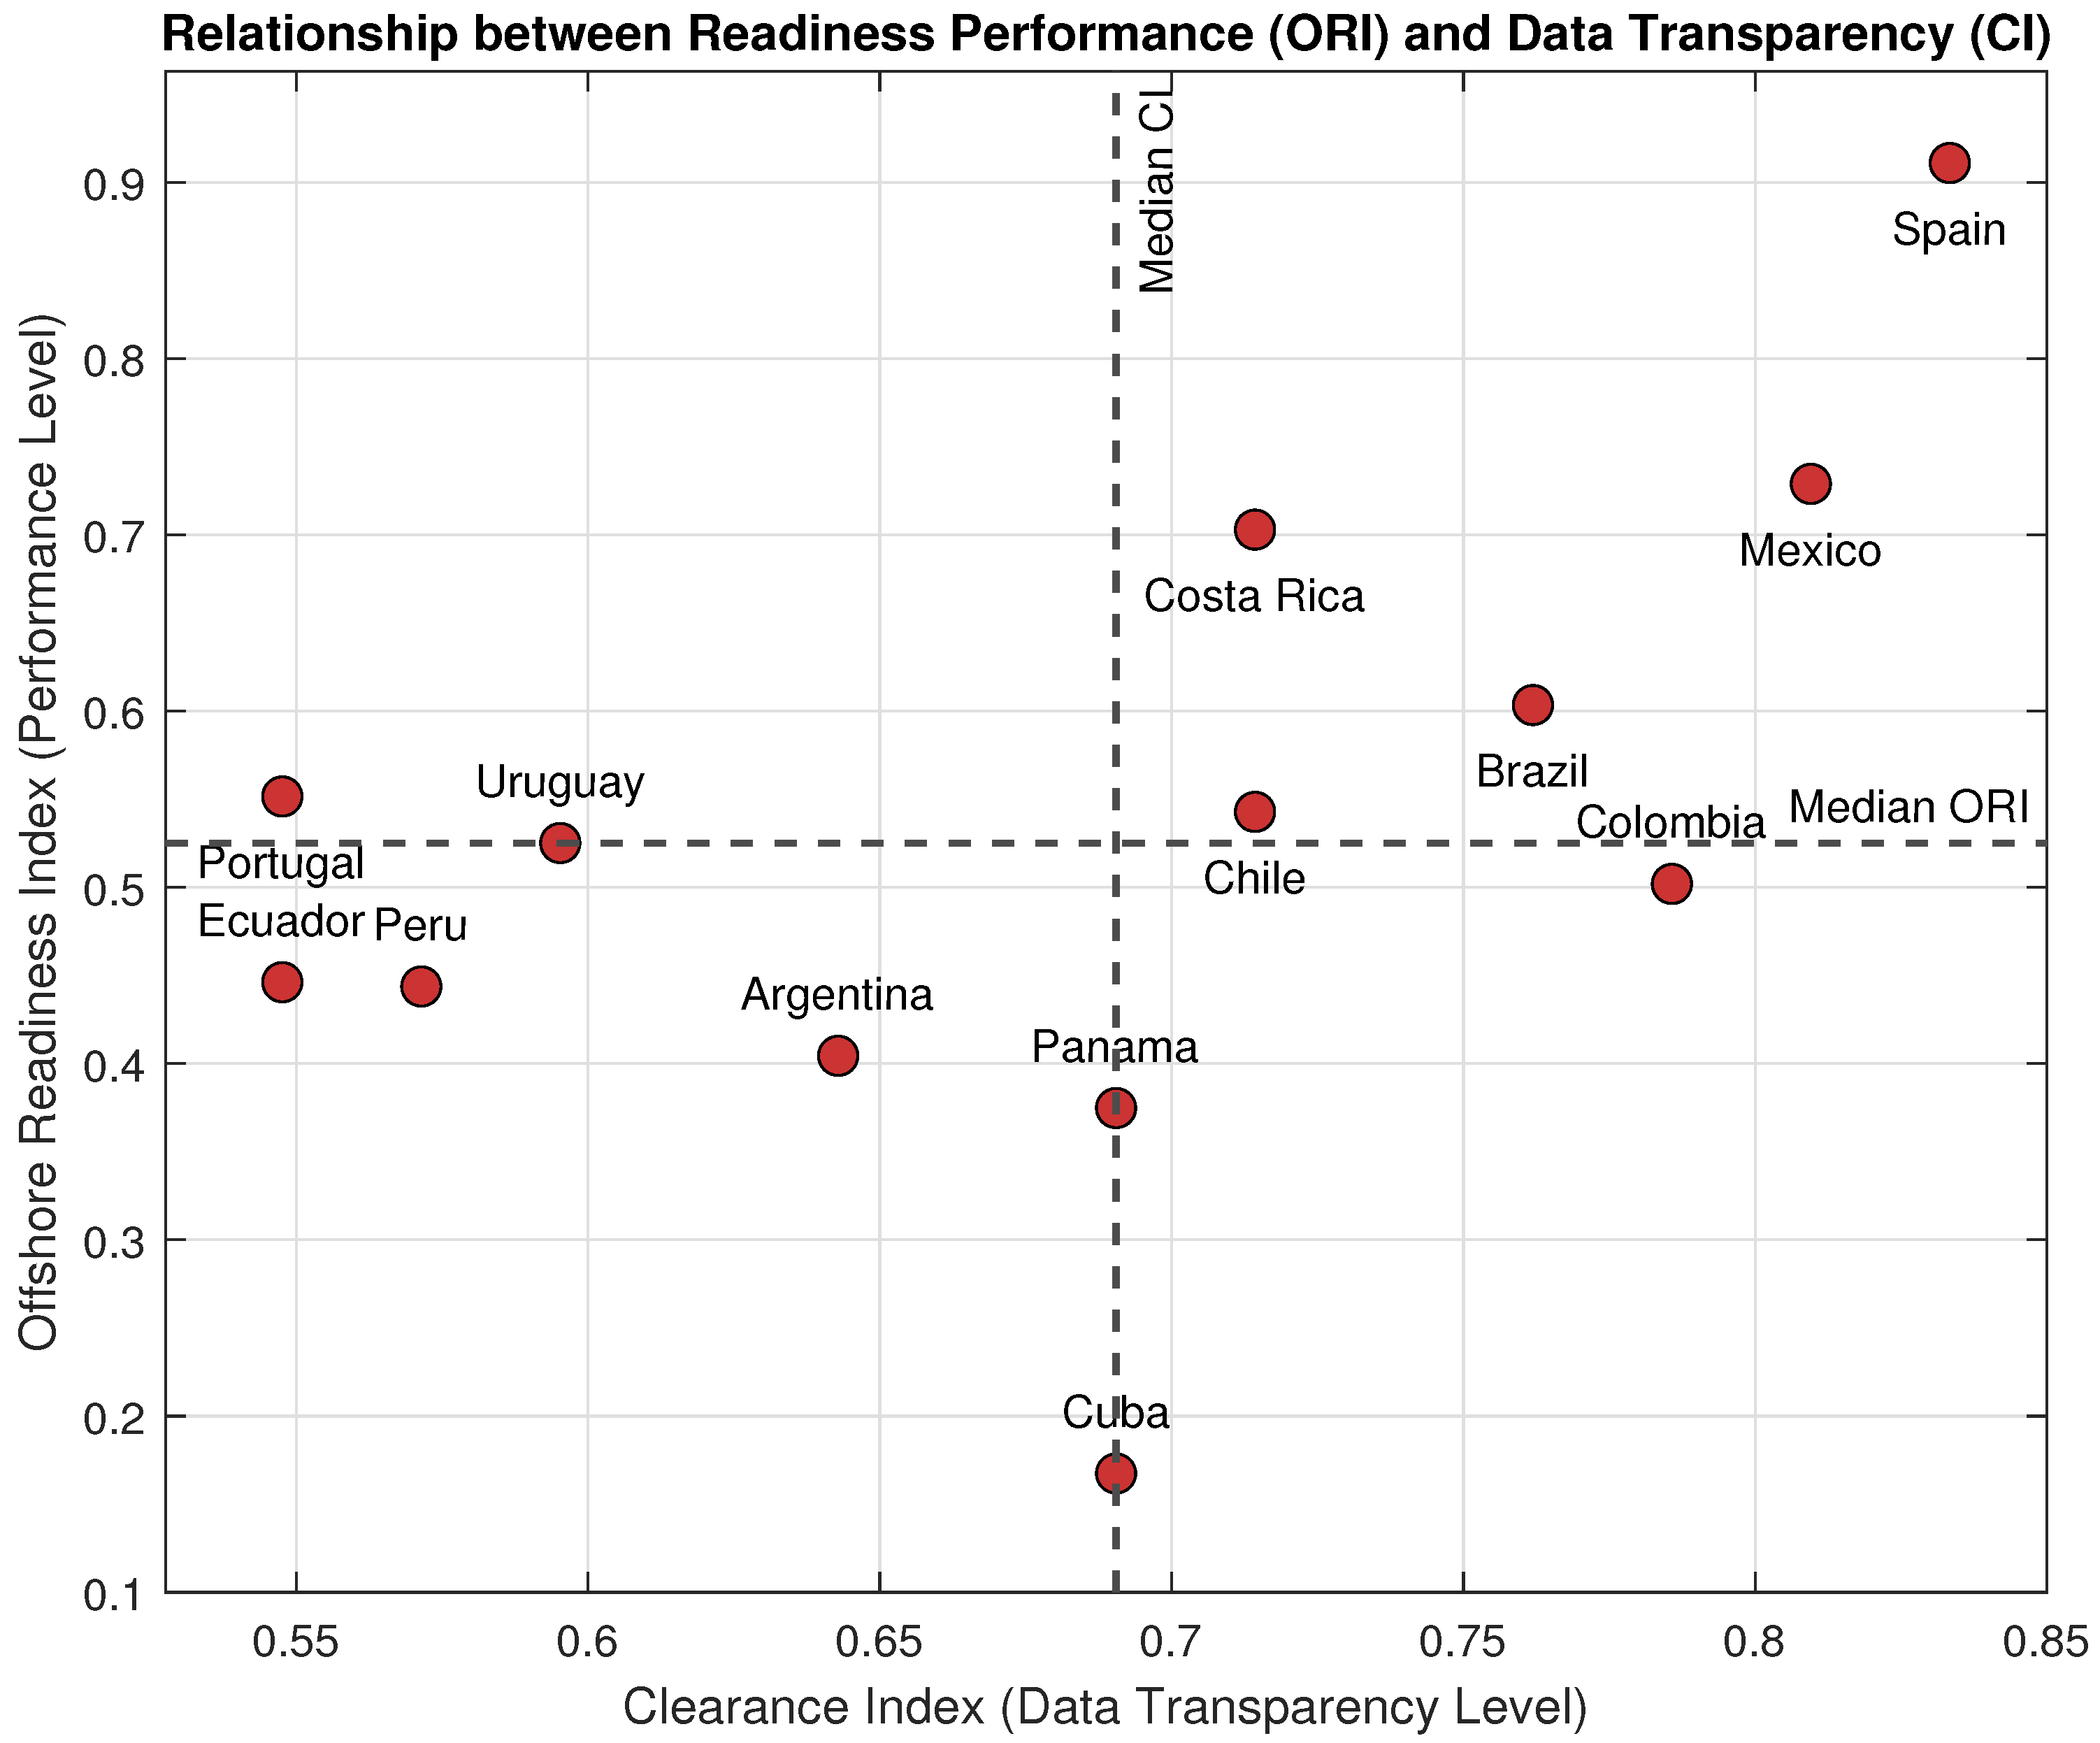
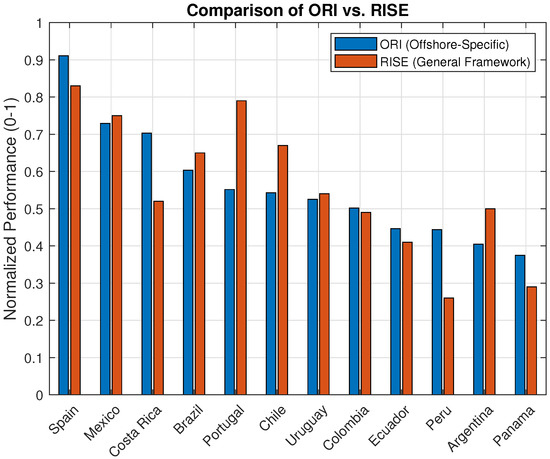
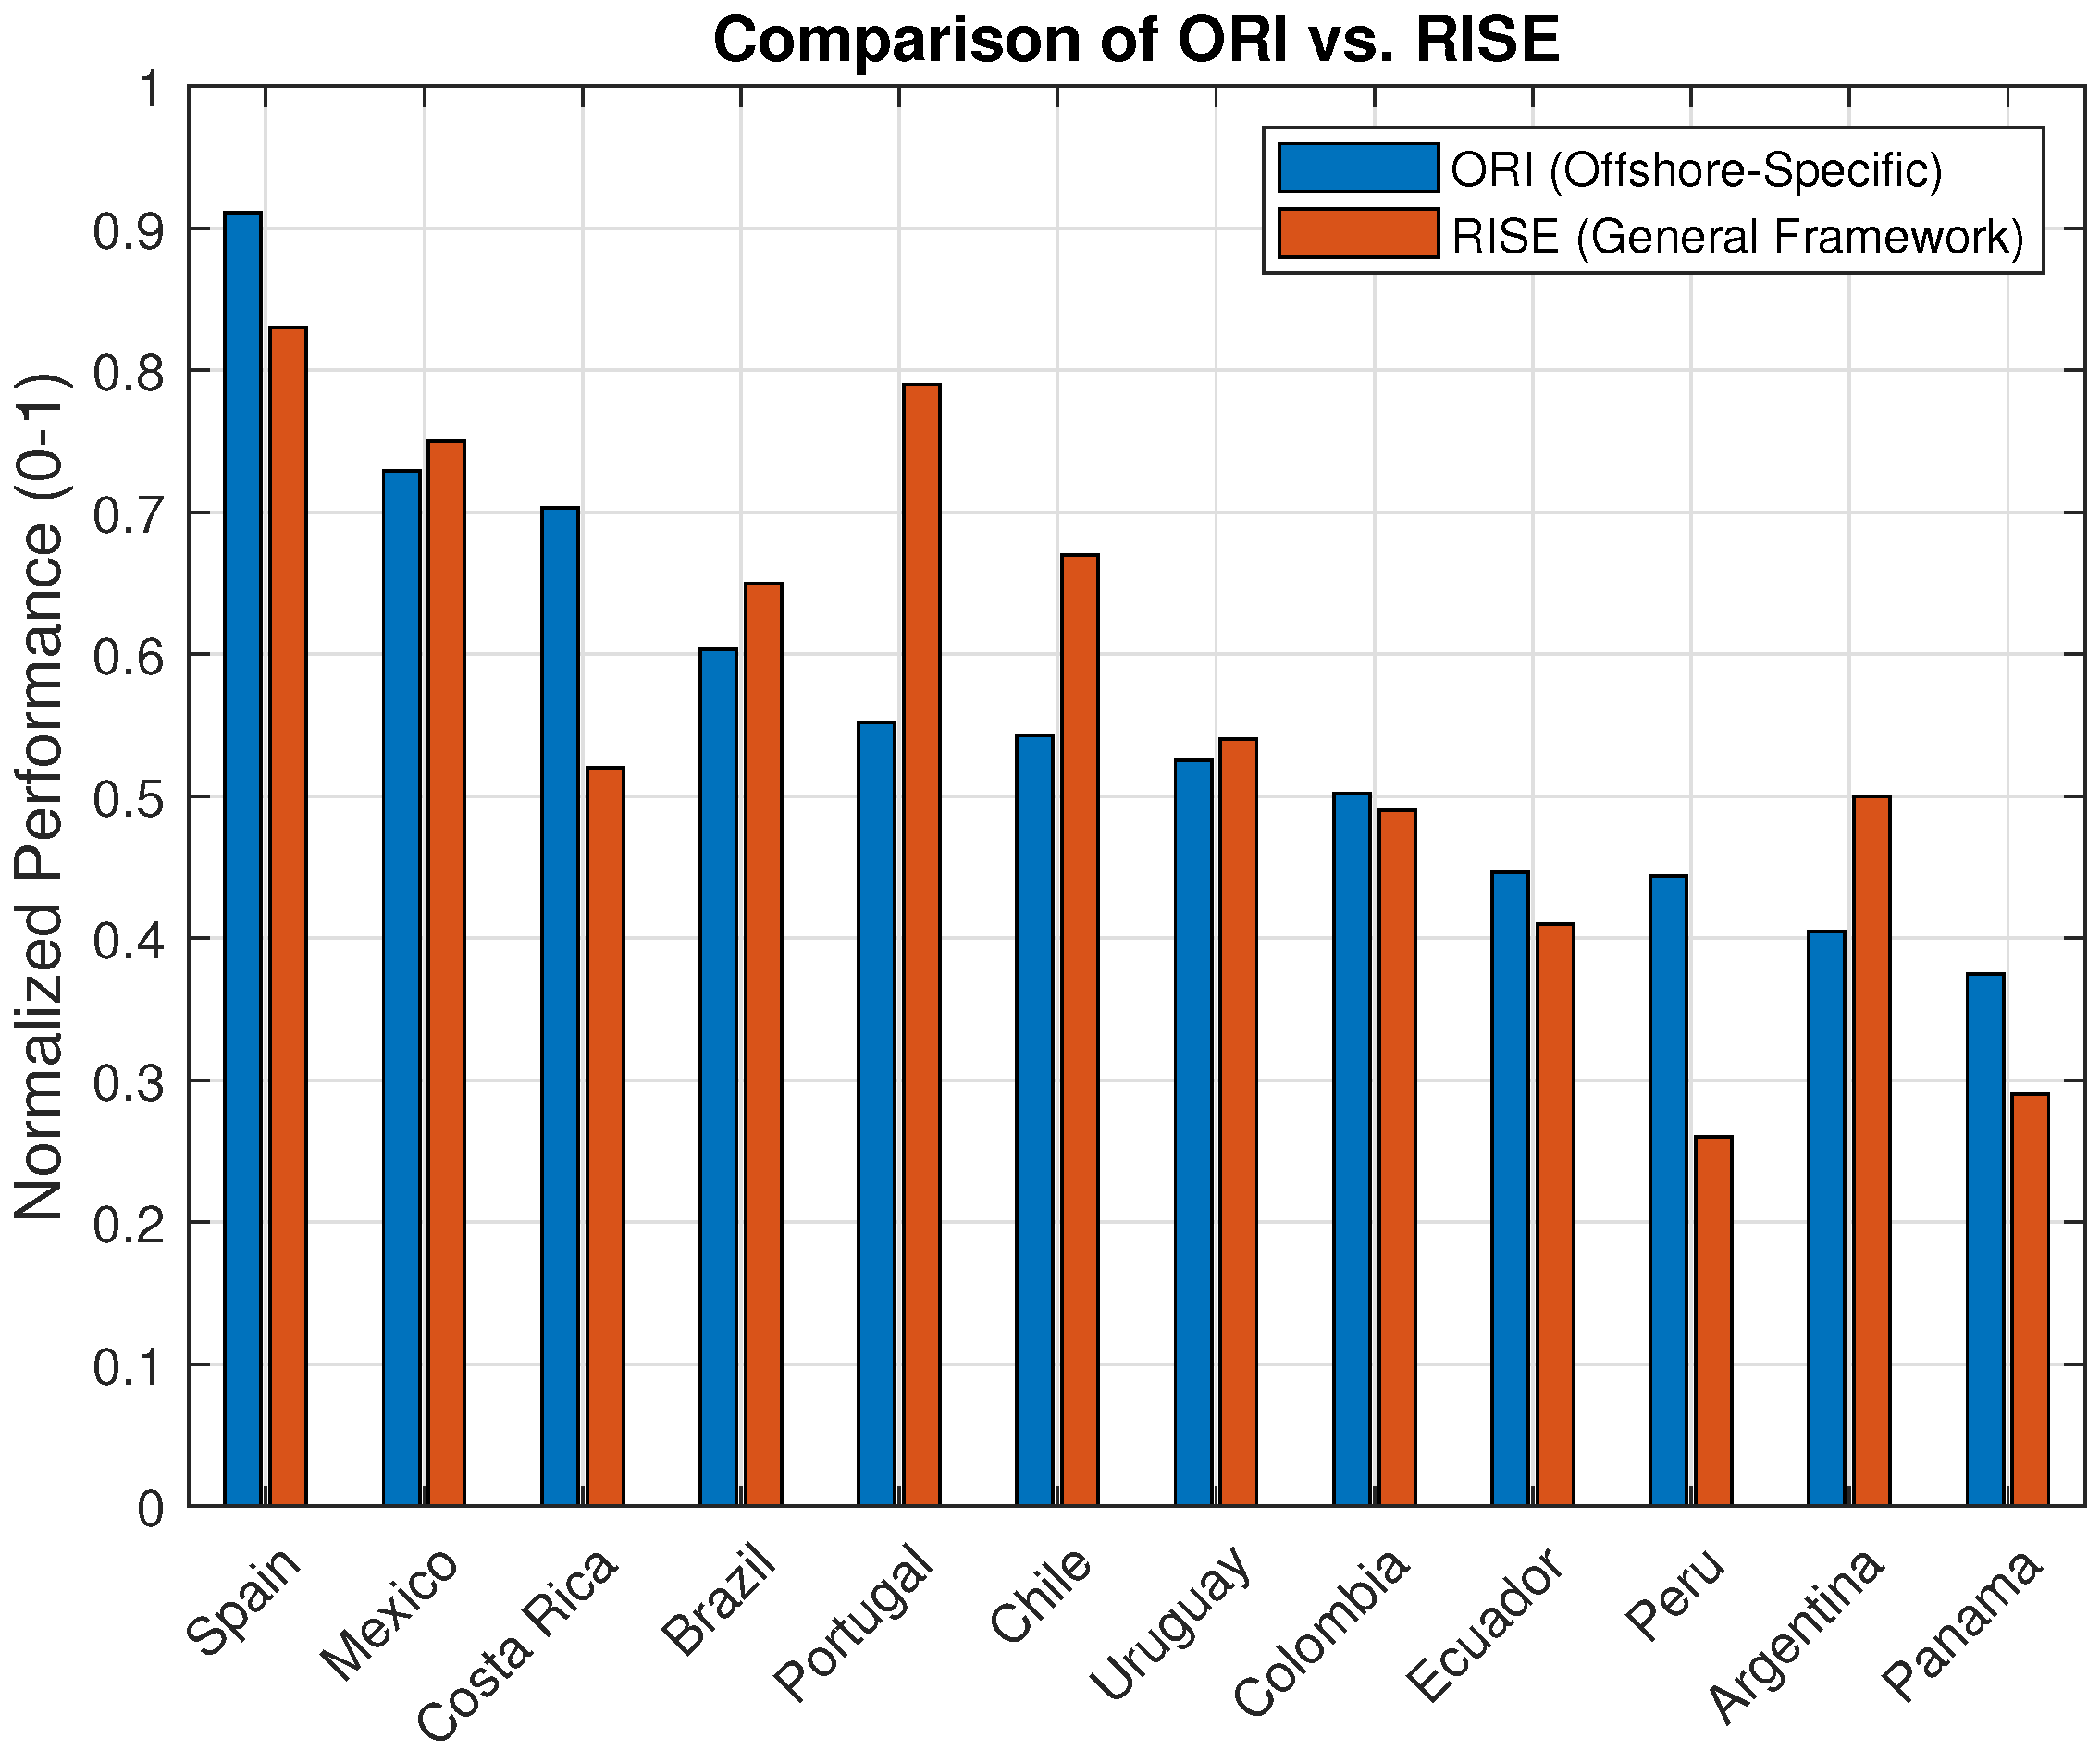
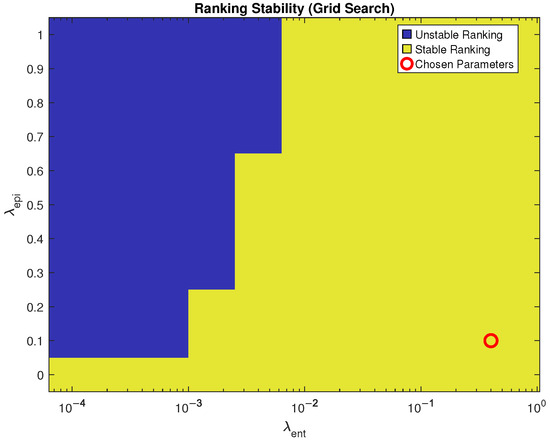
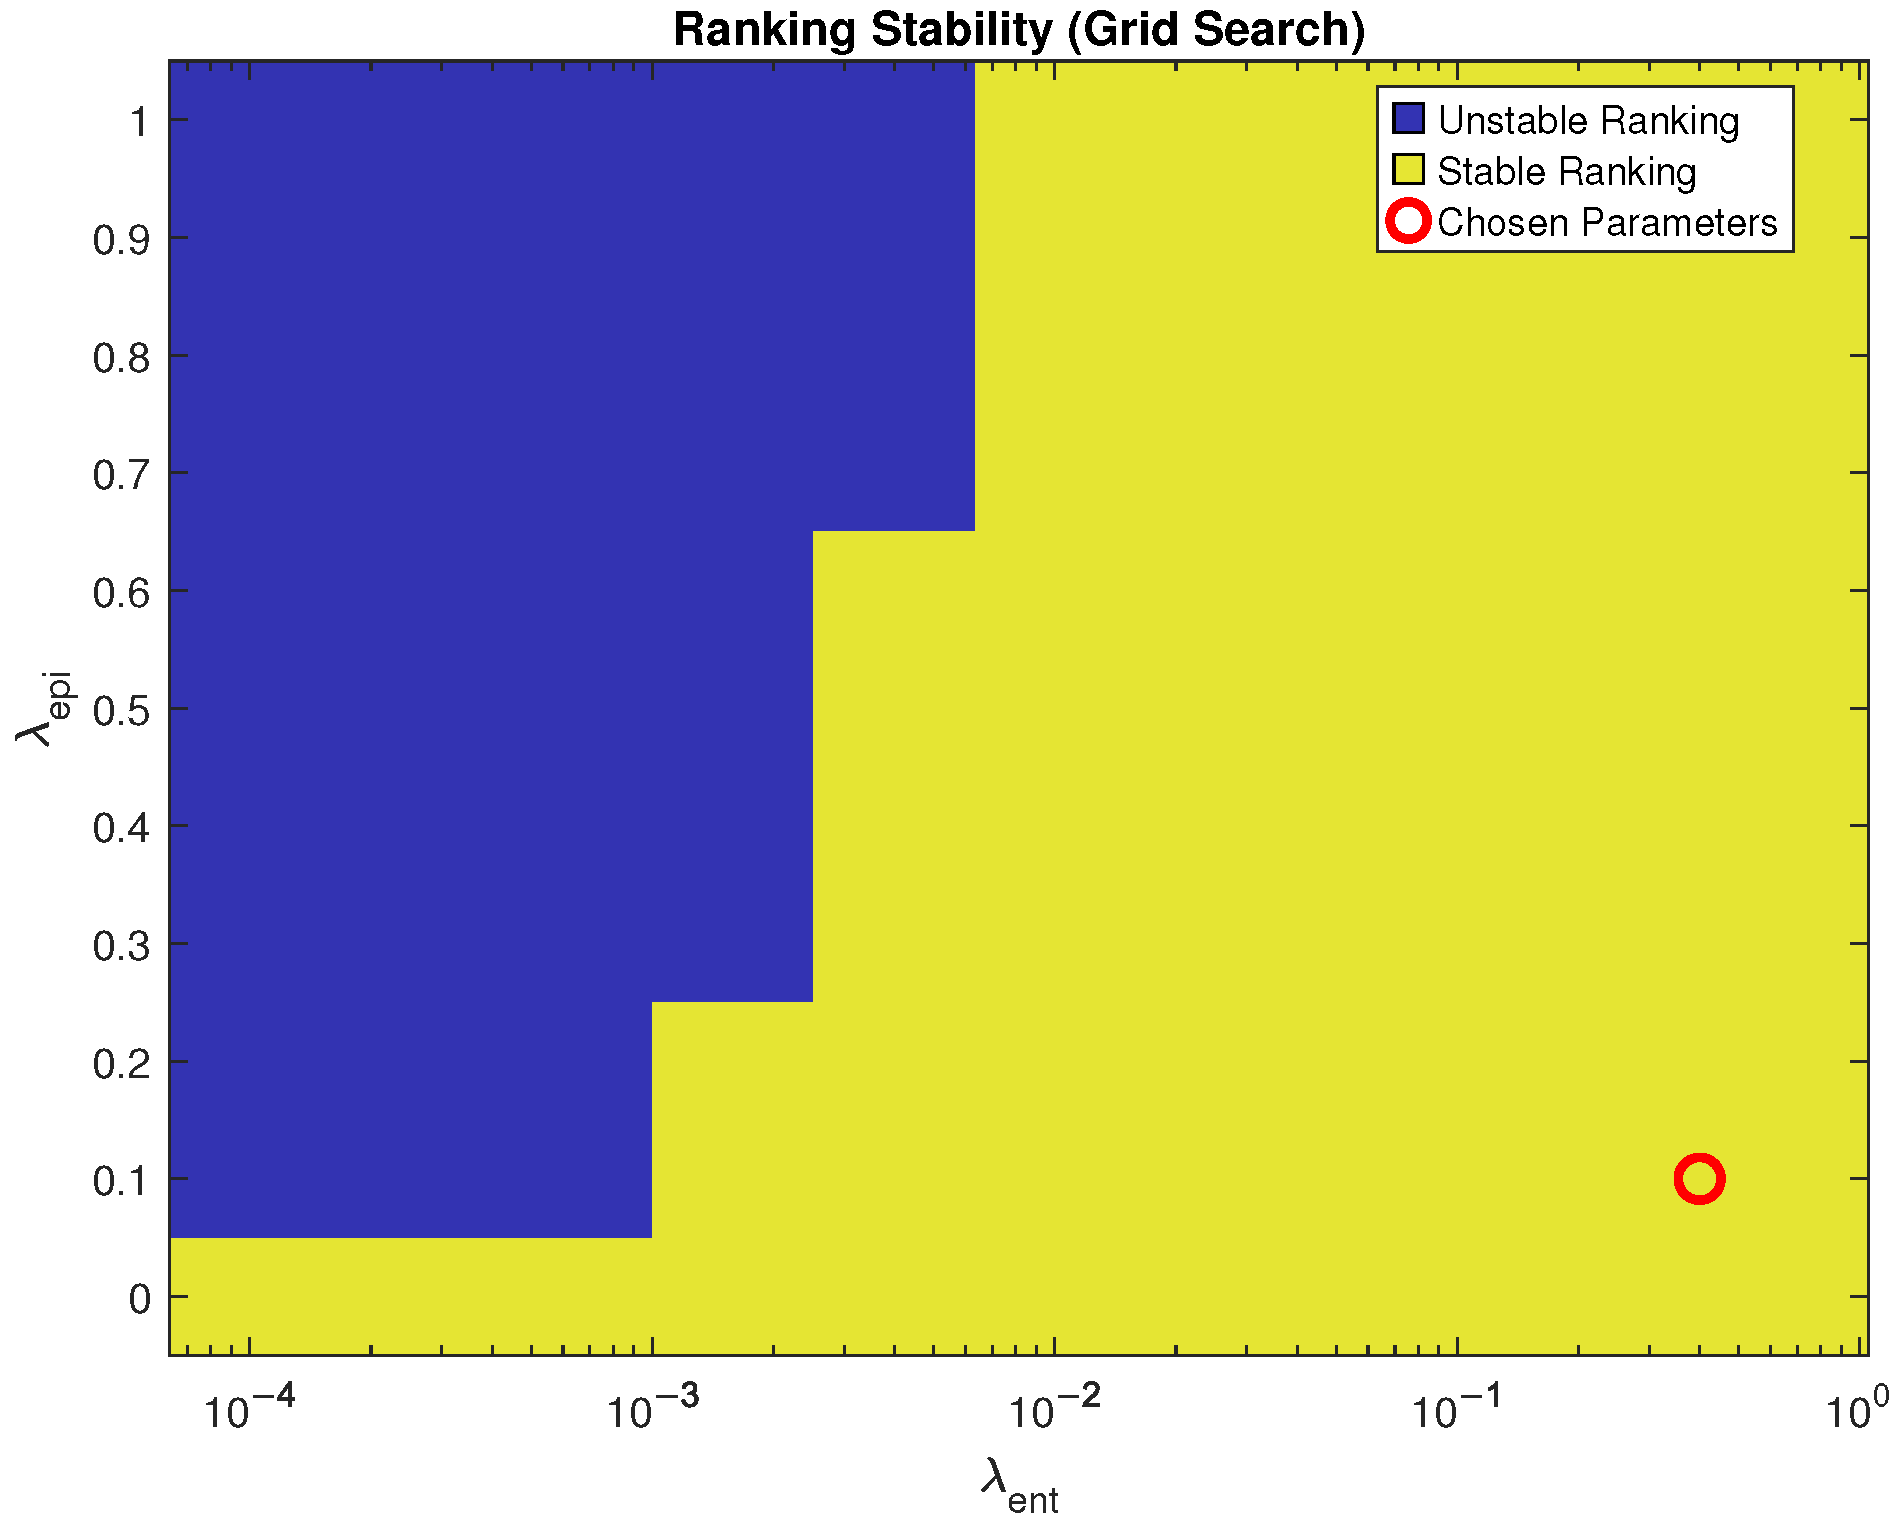
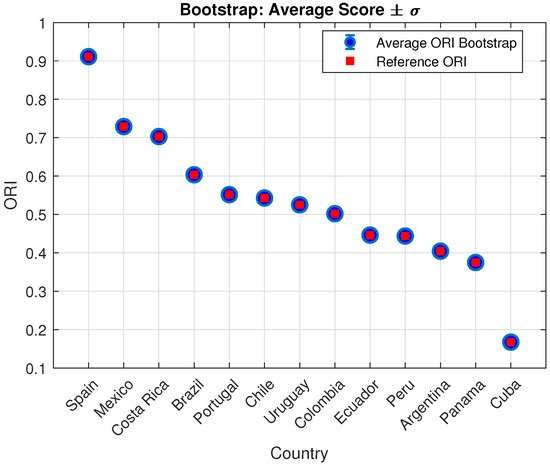
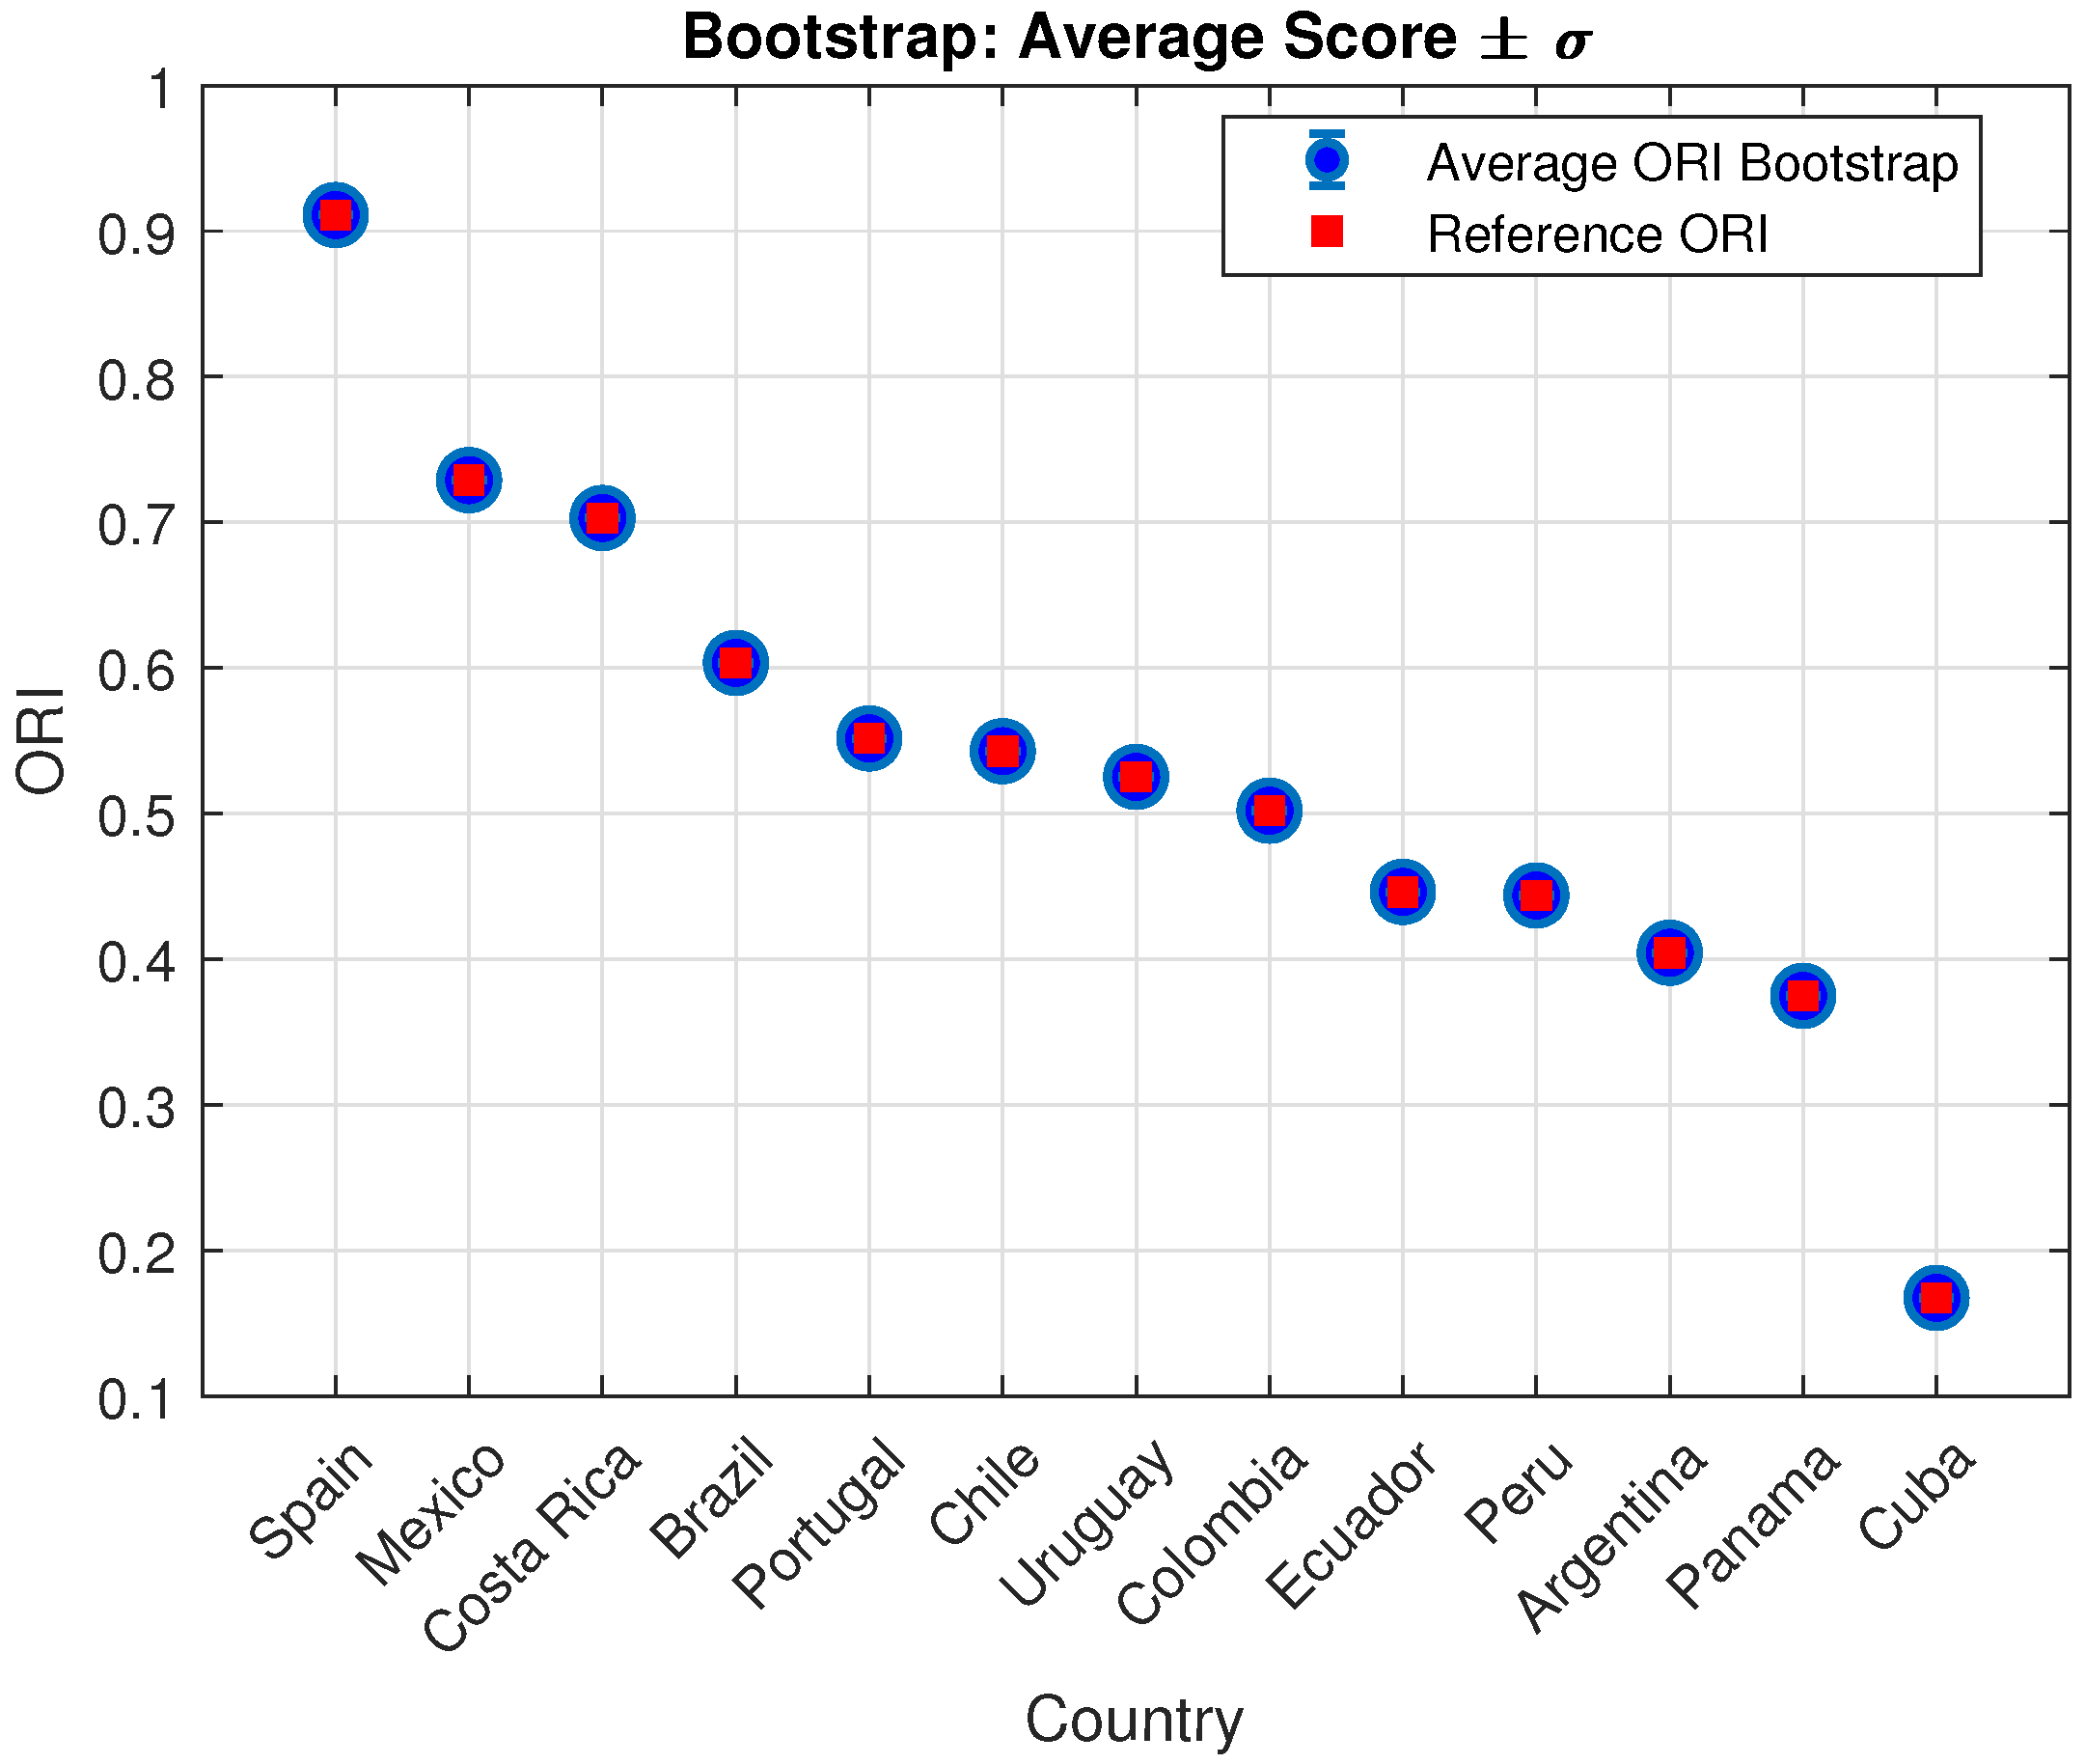
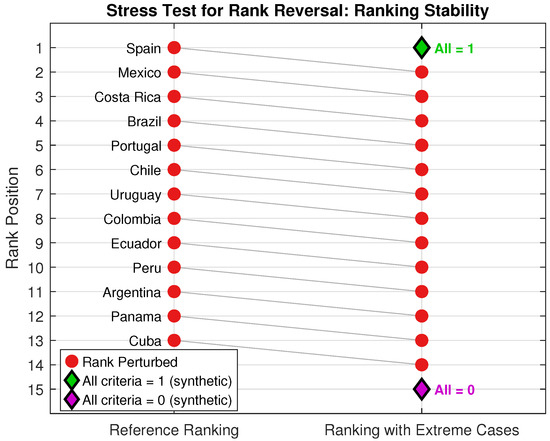
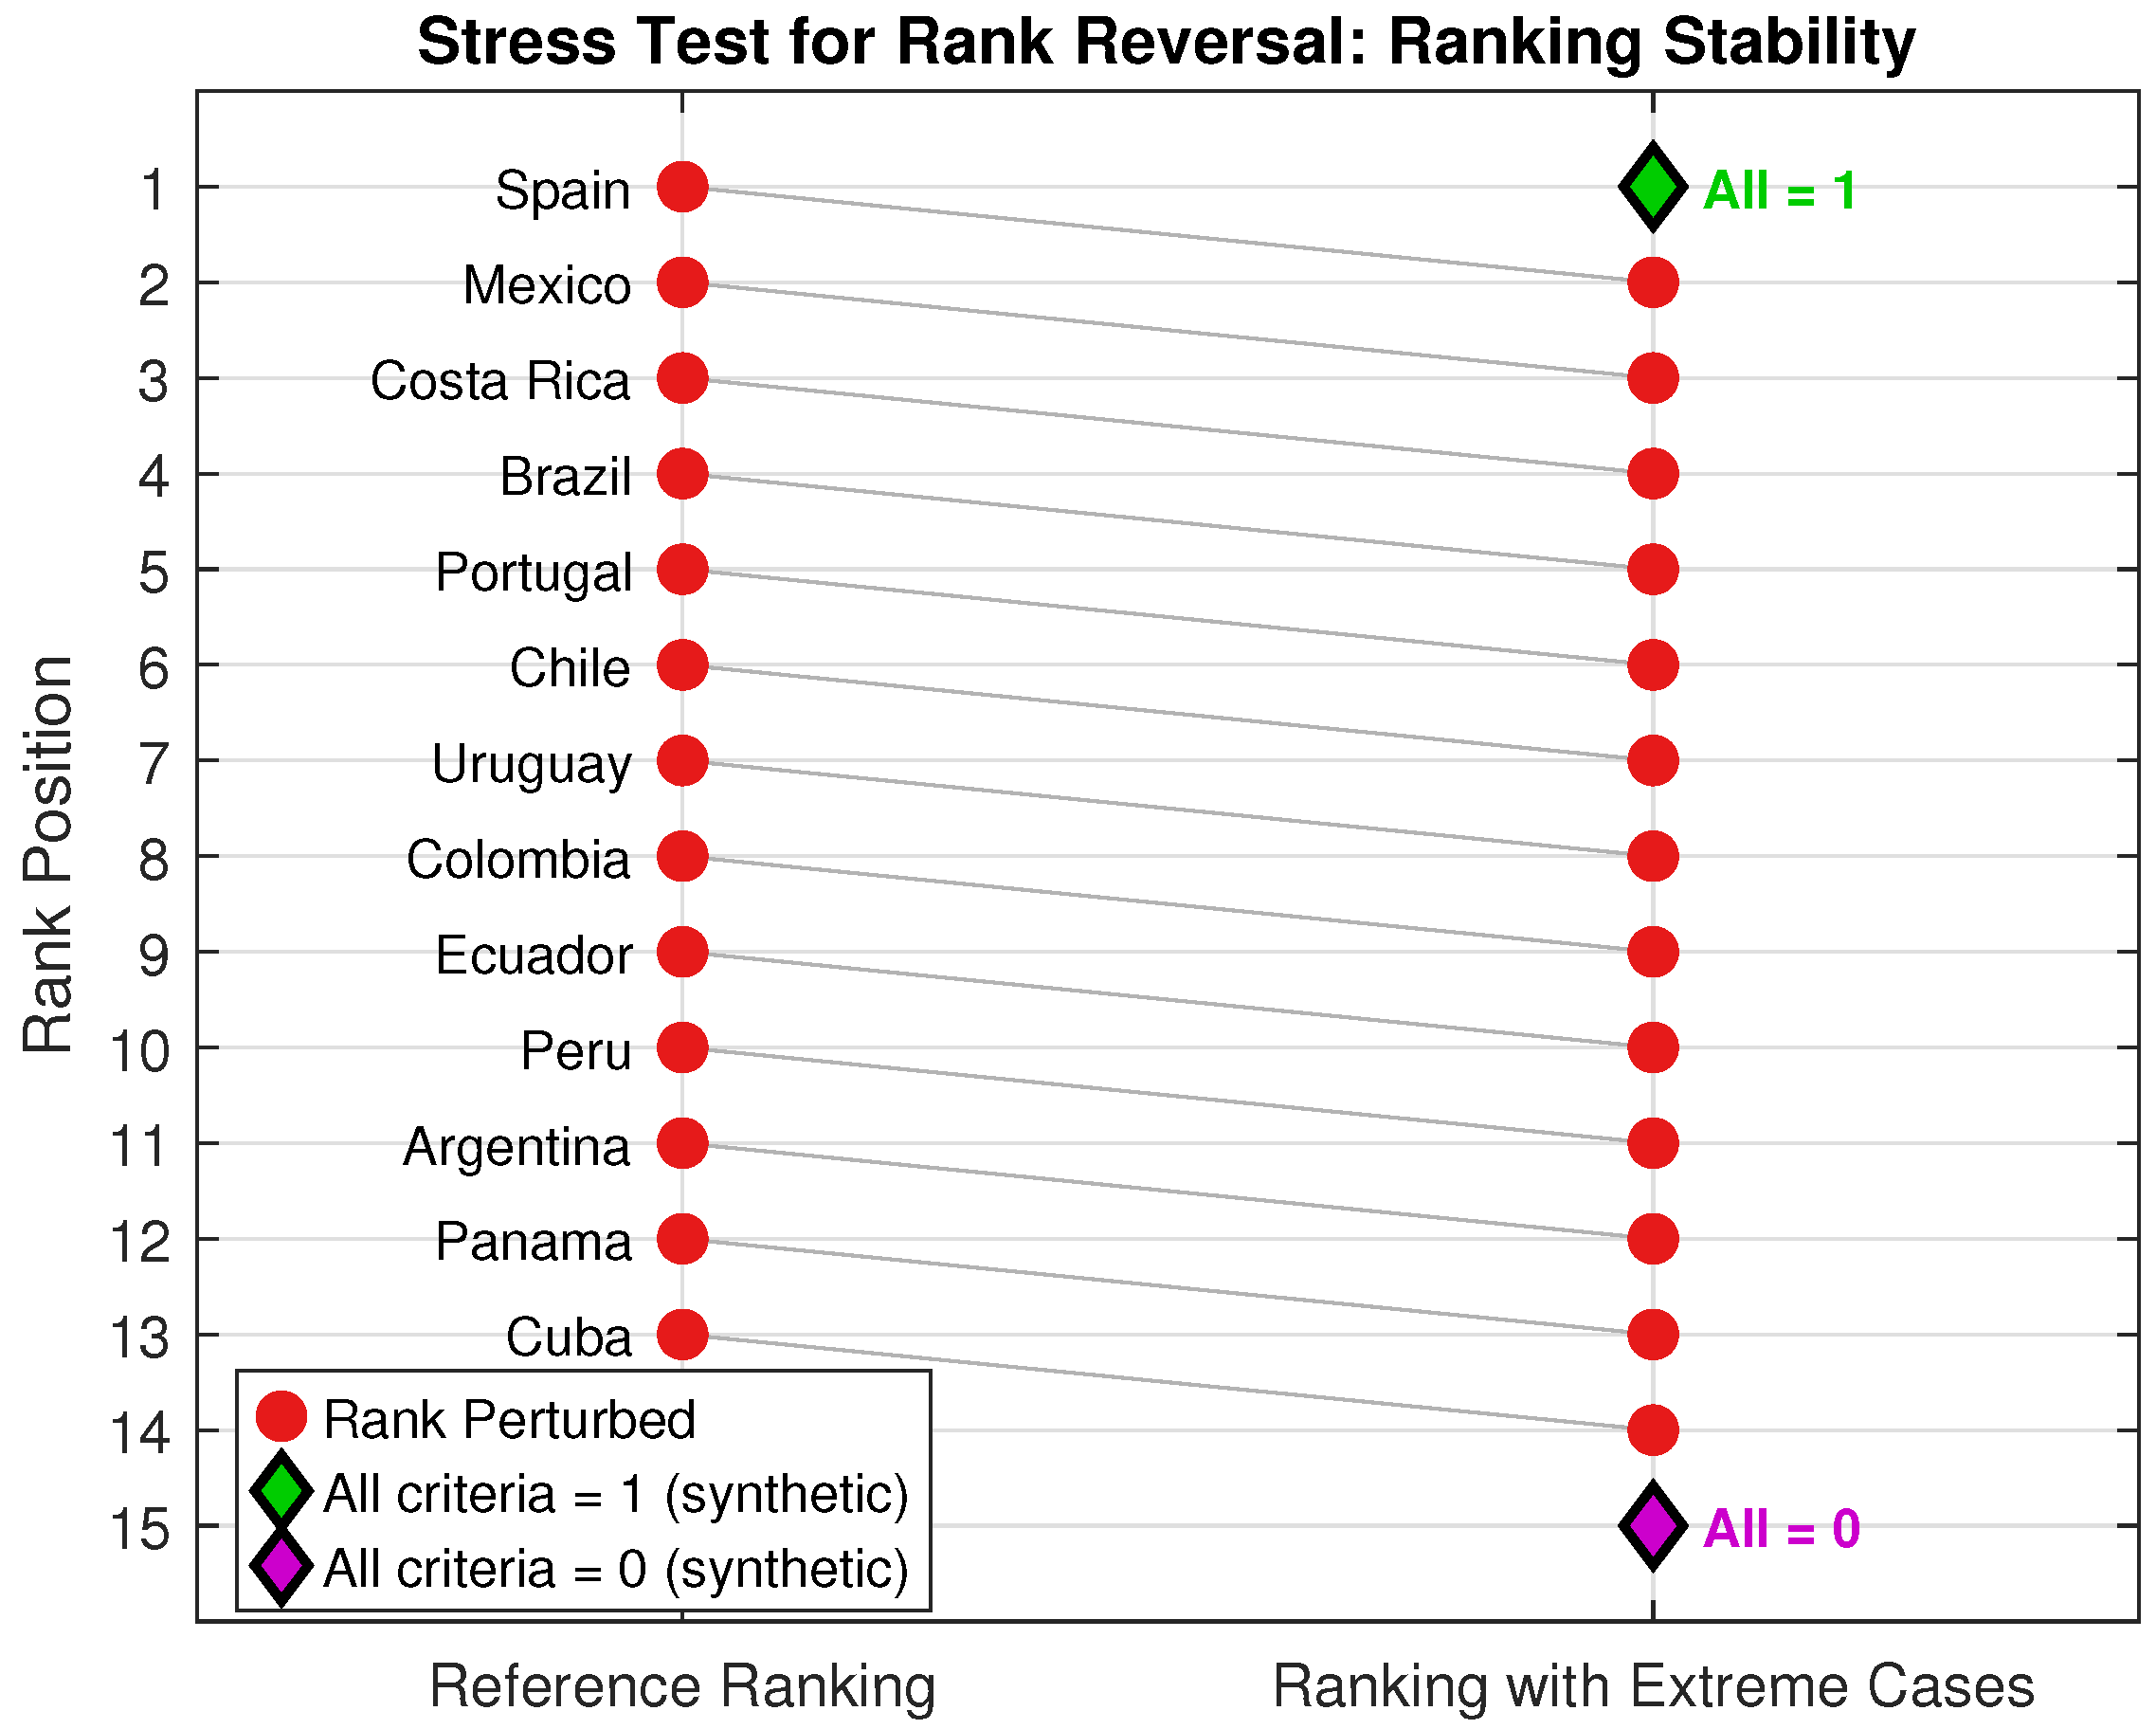
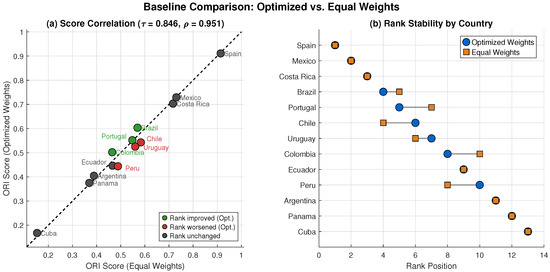
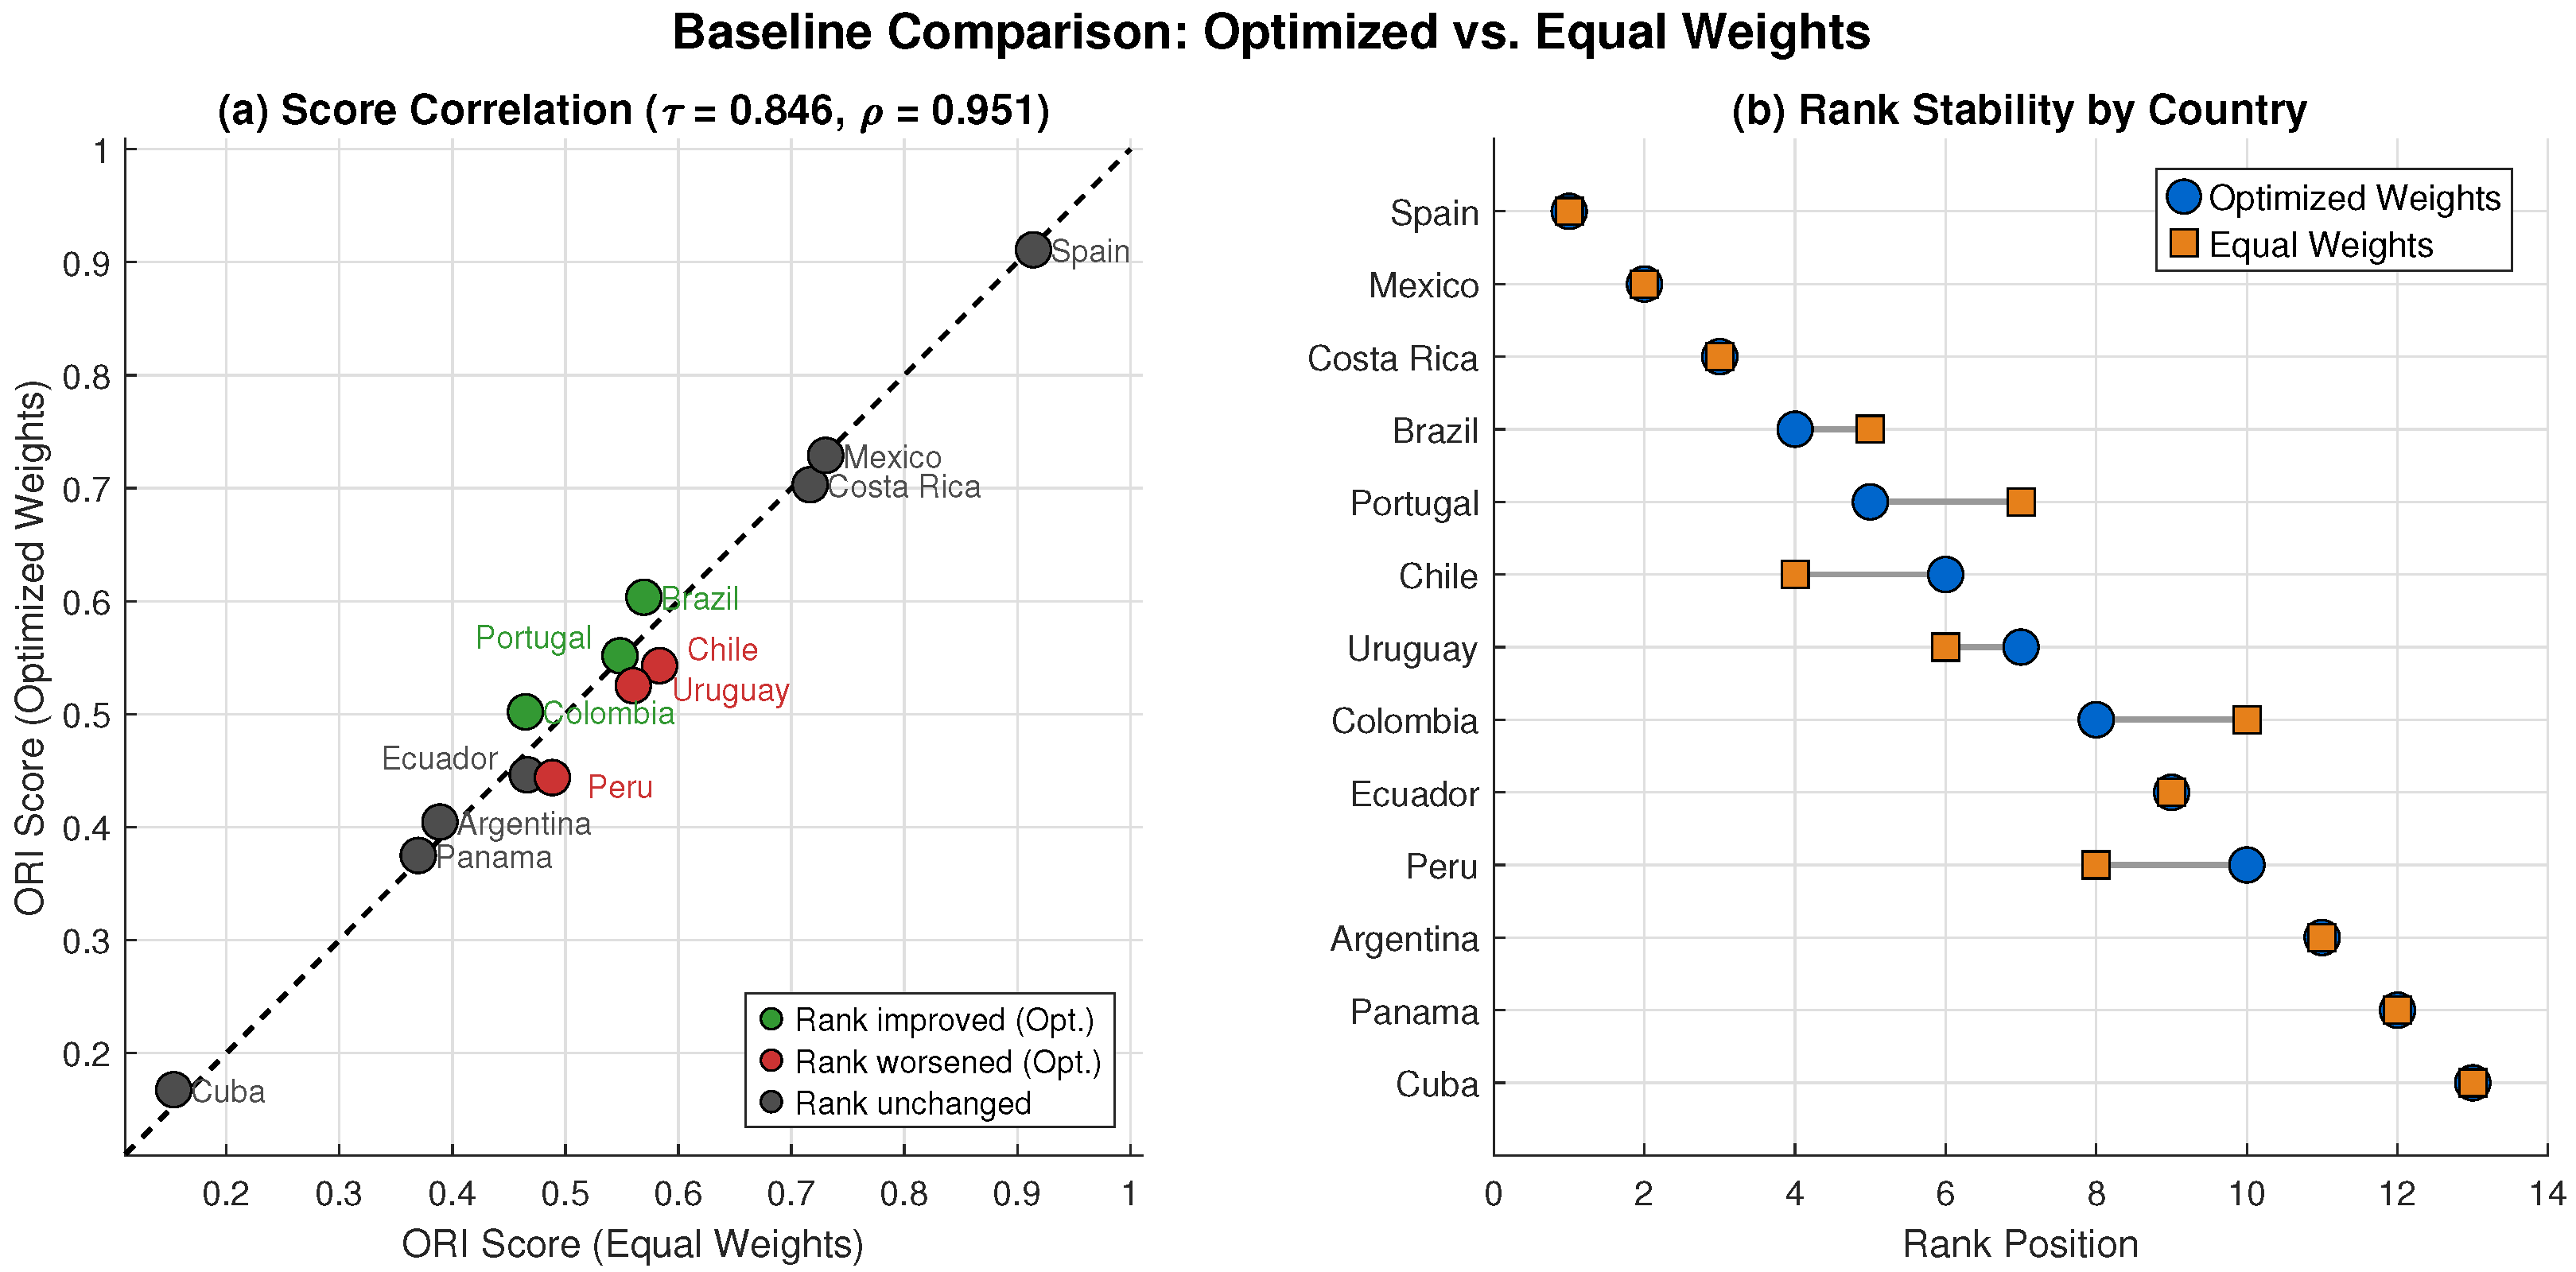

Disclaimer/Publisher’s Note: The statements, opinions and data contained in all publications are solely those of the individual author(s) and contributor(s) and not of MDPI and/or the editor(s). MDPI and/or the editor(s) disclaim responsibility for any injury to people or property resulting from any ideas, methods, instructions or products referred to in the content. |
© 2026 by the authors. Licensee MDPI, Basel, Switzerland. This article is an open access article distributed under the terms and conditions of the Creative Commons Attribution (CC BY) license.