


Abstract
Buildings account for nearly 30% of global energy-related carbon emissions. In rapidly developing economies, the operational phase of buildings represents a major and growing source of emissions. However, emission pathways in hot-summer-cold-winter (HSCW) regions remain understudied. This study analyzes carbon emission peaks and influencing factors in the operational phase of existing civilian buildings in Anhui Province. It integrates energy balance tables, the LEAP model, carbon emission factors, and the STIRPAT model. The energy balance table method disaggregates building energy consumption into urban, rural residential and public sectors. It adjusts for transportation energy by deducting specific proportions of gasoline and diesel from industrial, commercial, and residential sectors. Heating energy calculations are simplified because the region has a HSCW climate with limited centralized heating. The LEAP model projects emissions under four scenarios from 2020 to 2060. The STIRPAT model with ridge regression reveals that the permanent population and energy structure negatively influence residential emissions with elasticities of −2.646 and −1.465, respectively. This finding is consistent with the province’s energy transition, where coal use dropped from 28.48% in 2005 to 0.45% in 2020 and electricity use rose from 39.86% to 59.01%. In contrast, per capita GDP, building area, and energy intensity show positive effects. For public buildings, tertiary industry added value and energy structure are key determinants. Scenario analysis identifies the blueprint scenario as optimal, with residential emissions peaking at 34.29 million tons in 2025 and declining to 9.19 million tons by 2060 through measures such as 10% building retrofits by 2025, 75% energy-saving standards for new constructions, 50% retrofits by 2060, and renewable energy integration with building electrification, outperforming the baseline scenario that peaks in 2036 at 49.46 million tons and other intermediate scenarios. The study underscores that energy structure optimization significantly decouples energy consumption from emissions, offering actionable pathways for dual carbon goals through policy synergies in building efficiency, population management, and clean energy adoption to foster sustainable development and the construction industry’s low-carbon transition.
1. Introduction
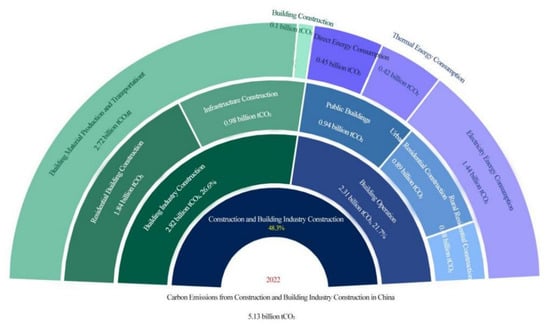
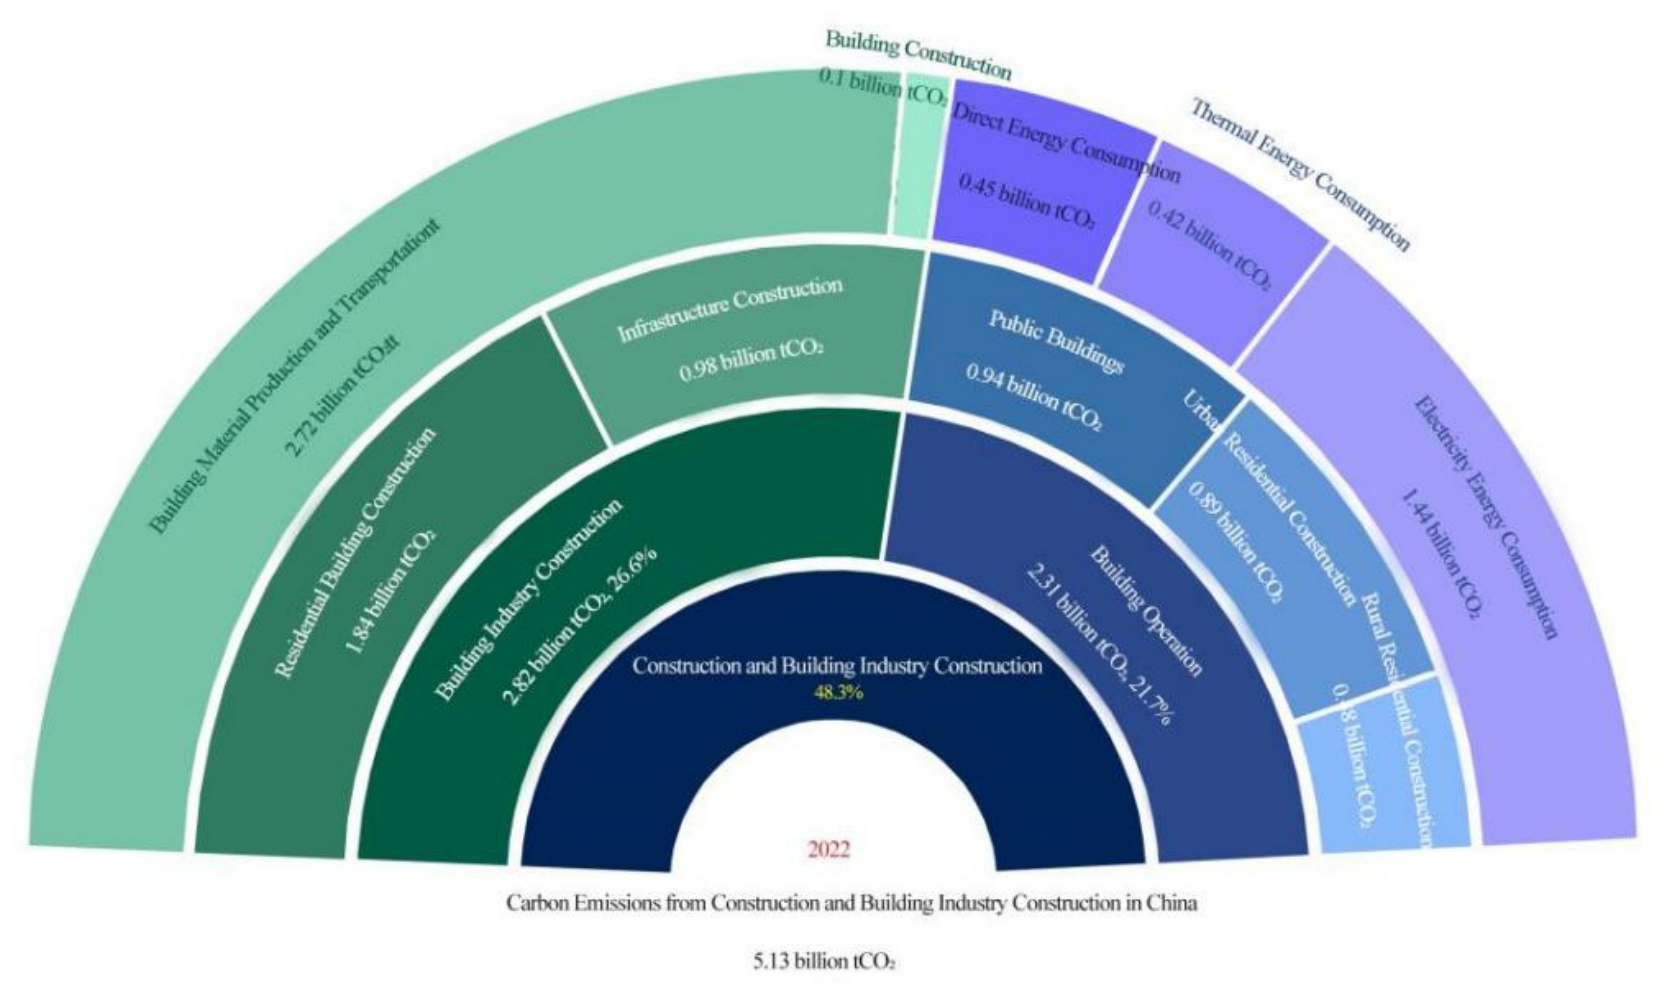
Climate change ranks among the most serious challenges confronting humankind. The growing concentration of greenhouse gases worldwide has caused climate warming. This in turn has produced frequent extreme weather events that seriously disrupt human activities and social development. China is the world’s largest energy consumer and CO2 emitter. It accounted for roughly 26.13% of global primary energy consumption. Industry, buildings, and transportation are the three major energy-consuming sectors. They are also the principal sources of greenhouse gas emissions. According to the Research Report on Carbon Emissions in the Field of Urban and Rural Development in China [1], total carbon emissions from the construction sector and building industry in China in 2022 reached 5.13 billion tons of CO2. This amount represented 48.3% of the nation’s total energy-related carbon emissions. Within this total, the operational phase of buildings (See Figure 1) contributed 2.31 billion tons of CO2, representing 21.7% of the total energy-related emissions.
Figure 1.
Total and proportion of carbon emissions from construction and construction industry in China in 2022.
Research on energy and carbon emissions covers various fields, including industry, power, transportation, and buildings, with diverse methodologies such as the STIRPAT model, LEAP model, decoupling model, and LMDI algorithm. Wu et al. [2] selected 18 developed countries and utilized the STIRPAT model to explore driving factors influencing the reduction in CO2 emissions. Zhang et al. [3] examined how various building energy efficiency standards contribute to China’s 2060 carbon neutrality target, using the LEAP model. Liu et al. [4] used a STIRPAT-SD model to analyze land-use carbon intensity variations and to simulate county-level emission scenarios. The LEAP (Long-Range Energy Alternative Planning) model has been extensively applied across various scales, including cities, regions, and countries [5,6,7]. Harries et al. [8] developed a LEAP model to analyze Chinese energy demand and supply strategy up to 2060. Hern’andez et al. [9] projected industrial emissions for a Latin American megacity by 2050. The LEAP model constructs a mathematical framework to simulate energy consumption patterns across various development scenarios. It incorporates energy demand, socio-economic trends, policies, and technologies. This allows the model to predict both energy use and environmental impacts for each sector. Most existing research concentrates on assessing individual technologies in isolation. However, such studies often overlook the broader context of socio-economic development and end-use energy technologies. They also fail to provide quantitative estimates of how different conservation and emission-reduction measures contribute.
Emodi et al. [10] utilized the LEAP model to examine Nigeria’s energy system, covering energy demand, supply, and related GHG emission. LEAP model has likewise been used to forecast the abatement of key atmospheric pollutants in Beijing, China [11]. Nieves et al. [12] adopted the LEAP model to evaluate energy demand and greenhouse gas emission in Colombia. Maduekwe et al. [13] employed LEAP model to project future energy demand and greenhouse gas emission for energy planning selection in Lagos; Yang et al. [14] built a LEAP model to assess the environmental and socio-economic impacts of renewable energy expansion in Zhangjiakou, China.
Hong et al. [15] applied LEAP to investigate the impact of Korea’s current low-carbon transportation policies implemented until 2020 on the country’s energy and environment. Zhao et al. [16] measured the level of low-carbon economic development through per capita GDP, energy consumption, energy structure, and carbon emissions, and applied the LEAP model to simulate China low-carbon economic development level under different scenarios by 2050. Seyithan [17] employed the LEAP model to assess energy efficiency and CO2 abatement potential in Turkey’s iron–steel and cement sectors.
Zhao et al. [18] combined the LEAP model and land-use simulation to forecast Shenzhen’s carbon neutrality scenarios, guiding low-carbon urban development. Zou et al. [19] used the LEAP model to study Changsha public buildings’ carbon emissions, setting baseline and green scenarios for prediction. Studies using the STIRPAT model and its combination with the SD model [20,21,22] analyze drivers and scenarios of carbon emissions in land use, households, buildings, and national peaking in China.
In terms of carbon emissions, Fan et al. [23] used the STIRPAT model to evaluate how population, affluence, and technology affected total CO2 emissions in countries at various income levels between 1975 and 2000. Li et al. [24] categorized China’s 30 provinces into five regions based on provincial carbon emission data from 1990 to 2010 using the STIRPAT model for analysis. The results indicate that GDP, industrial structure, population, urbanization, and technological level are all major factors influencing carbon emissions, though the degree of impact varies among these factors.
Despite the extensive use of LEAP and STIRPAT models in energy and carbon emission research, the following several gaps remain: (1) most existing studies focus on national or municipal levels, with limited attention to provinces in hot-summer-cold-winter zones. (2) The combined use of energy balance table decomposition with both LEAP and STIRPAT is rare. (3) Few studies provide policy-realistic retrofit percentages with empirical justification. Energy balance table disaggregation, the LEAP model, and the STIRPAT model within a single analytical framework are combined. This is the systematic study to provide detailed terminal-level energy decomposition and long-term scenario analysis for a hot-summer-cold-winter province in central China (Anhui Province), where heating patterns differ fundamentally from northern China. Unlike purely theoretical scenarios, our blueprint scenario is anchored to actual provincial policy timelines (e.g., the 14th Five-Year Plan) and empirically derived retrofit rates. The aim is to identify a suitable implementation pathway for dual carbon goals in buildings in Anhui Province.
2. Materials and Methods
This section describes the data sources, modeling framework, and analytical methods used in this study. Section 2.1 presents the following three core models: the energy balance table method for disaggregating building energy consumption, the LEAP model for scenario-based energy projection, and the STIRPAT model for driver analysis. Section 2.2 describes the data sources and model validation. Section 2.3, Section 2.4 and Section 2.5 present the key input parameters (population, urbanization rate, per capita building area, and terminal energy intensity), and Section 2.6 provides a terminal-level decomposition of energy consumption and carbon emissions.
2.1. Models and Methods
2.1.1. Energy Balance Table Method
The energy balance table is a matrix table used to comprehensively reflect the supply, consumption, and conversion of various types of energy. It includes seven categories of energy-consuming sectors. By employing the method proposed by Cai et al. [25], we can calculate the energy consumption data of existing civilian buildings in Anhui Province based on the energy balance table.
- (1)
- Building energy consumption disaggregation
Building energy consumption baseline and total building energy consumption are represented by Equations (1) and (2) respectively:
where represents the baseline building energy consumption. represents the energy consumption of wholesale, retail, and catering industries. represents other energy consumption. represents residential living consumption energy. represents total building energy consumption. represents deducted transportation energy consumption. represents heating energy consumption correction. represents unaccounted building energy consumption in other sectors.
- (2)
- The calculation of deducted energy consumption
To compute energy consumption in the transportation sector, this work followed the approach of Wang et al. [26]. This method involves deducting 95% of gasoline and 35% of diesel from the industrial, construction, commercial, and public service sectors, as well as all gasoline from residential and agricultural consumption, and 95% of diesel from residential consumption.
Regarding the calculation for heating, as Anhui Province belongs to a region characterized by hot summers and cold winters, where the majority of buildings do not have centralized heating, the process of heating energy consumption correction can be simplified when calculating energy consumption for existing buildings in this region, as shown in Equation (3).
where represents the correction of heating energy consumption; represents the energy consumption of centralized heating in northern heating areas (based on statistical yearbooks); and represents the heat energy consumption in the baseline energy consumption that should be deducted.
The energy consumption accounting for the transportation sector is as shown in Equations (4)–(6):
where represents the unaccounted building energy consumption in the transportation sector; represents the coal consumption within it; represents the electricity consumption for buildings within it; represents the total electricity consumption within it; represents the total electricity consumption of municipal transportation vehicles; and , and represent the electricity consumption of railways, pipeline transportation, and urban public transportation respectively.
- (3)
- Calculation of Building Energy Consumption
Urban residential building energy consumption and rural residential building energy consumption are represented by Equations (7) and (8) respectively:
where represents urban residential building energy consumption; represents urban living consumption energy; represents the deducted transportation energy consumption within urban residential buildings; represents the corrected heating energy consumption allocated to urban residential buildings; represents the proportion of heating consumption in urban residential buildings to total heating consumption; represents rural residential building energy consumption; represents rural living consumption energy; and TEV represents the deducted transportation energy consumption within rural residential buildings.
The energy consumption of public buildings is represented by Equation (9):
where represents the energy consumption of public buildings; represents the energy consumption of wholesale, retail, and catering industries; represents the unaccounted building energy consumption in other sectors; represents the deducted transportation energy consumption within public buildings; represents the corrected heating energy consumption allocated to public buildings; represents the proportion of heating consumption in public buildings to total heating consumption; and represents the unaccounted building energy consumption in the transportation sector.
2.1.2. LEAP Model
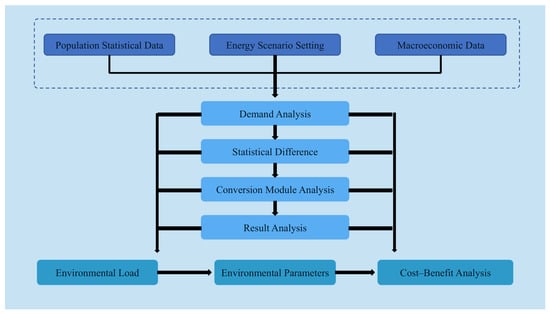
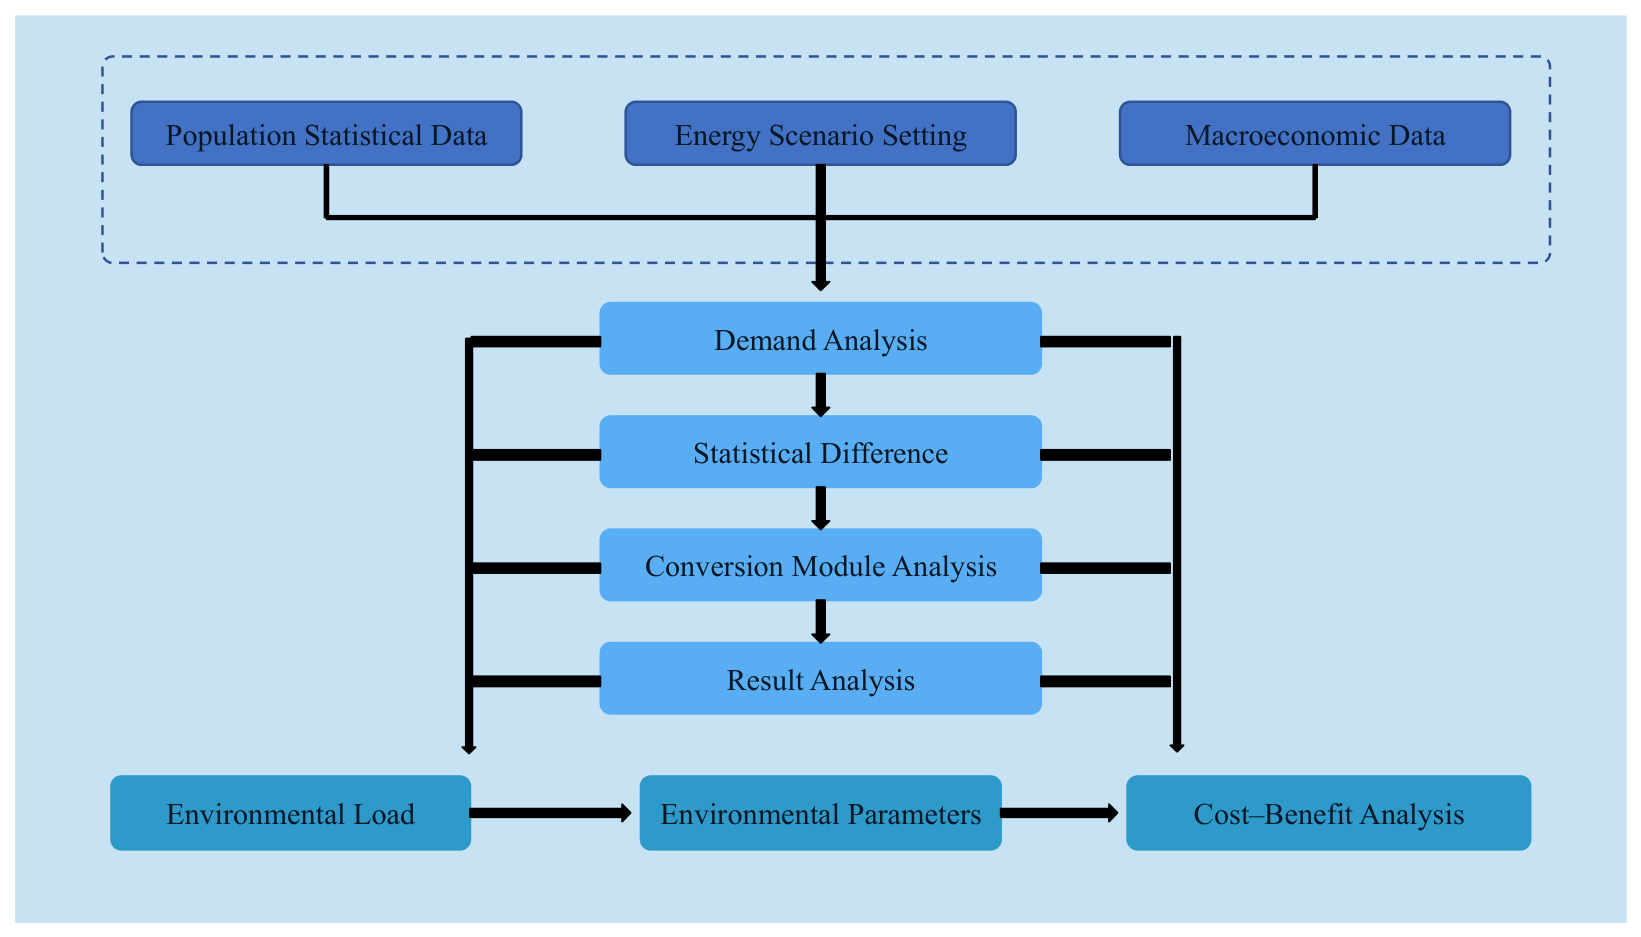
The Long-Range Energy Alternative Planning System 2025, also known as the Low-Emission Analysis Platform, is a scenario-based, bottom-up multi-functional modeling software for energy and environment analysis. The model features flexible data structures that allow researchers to build models according to their research objectives, content, and targets. With rich technical specifications and detailed user interfaces, it is widely used in energy policy analysis and climate change assessment. Currently, this model has been adopted by organizations in over 190 countries for research and development. Its application spans industries including steel and iron manufacturing, power generation, construction, and transportation, with implementation covering urban, provincial, regional, national, and even global scales. As an integrated modeling tool, the LEAP model comprehensively considers factors such as population, GDP, energy intensity, and technology to predict energy supply–demand balance and pollutant emissions. The computational framework is illustrated in Figure 2.
Figure 2.
Calculation structure diagram of LEAP model.
The LEAP model consists of the following five different modules: energy demand, Energy Conversion, biomass energy, Environmental Impact Assessment, and Cost Analysis. This paper utilizes the Energy Demand Analysis module of the LEAP model, with specific calculations as shown in Formulas (10) and (11).
where represents the energy consumption of existing buildings in Anhui Province; represents the energy consumption intensity of buildings; represents the building area; represents the conversion coefficient of primary energy; represents the building type; s represents the terminal type; represents the carbon emissions of buildings; represents the corresponding classified energy consumption in building energy consumption; represents the carbon emission factor corresponding to various types of energy; and represents the type of energy, including various types of fossil energy in primary energy and electricity and heat in secondary energy.
2.1.3. STIRPAT Model
In this study, considering that the reduction in emissions in buildings may be constrained by existing conditions, the STIRPAT model was chosen, which simulates relatively small carbon emission reductions, as the analysis tool for the factors influencing building carbon emissions. The Stochastic Impacts by Regression on Population, Affluence and Technology (STIRPATs) model is derived from the IPAT equation [27]. Subsequently, York et al. [28] proposed the STIRPAT model based on the IPAT equation. Its expressions are as shown in Formulas (12) and (13).
where represents environmental impact; represents population size; represents affluence; represents technological level; represents the model coefficient; , , represent the influence indices of the corresponding driving factors; and represents the model error.
On the basis of the STIRPAT model, taking the logarithm of both sides of the equation yields Formula (14):
where represents carbon emissions during the operational phase of residential buildings; represents the constant term; represents permanent resident population; represents per capita GDP; represents energy structure; represents residential building area; represents energy consumption per unit area of residential buildings; α1, α2, α3, α4, α5 represent the elasticity coefficients of each factor; and represents the error term.
2.2. Data Source and Model Validation
The research data is based on the “Anhui Statistical Yearbook 2006–2022” and the “Study on Carbon Emission Factors of China’s Regional Power Grids 2023”, predicting the population, urbanization rate, existing building area, building energy consumption intensity, building energy structure, and carbon emission factors for Anhui Province from 2020 to 2060. A back-casting validation was performed using historical data from 2005 to 2015. Specifically, the LEAP and STIRPAT models were calibrated using data from 2005 to 2010, then simulated the energy consumption and carbon emissions of residential and public buildings for the period 2011–2015. We compared these simulated results with the actual values derived from the energy balance tables for the same years (2011–2015). The results show good agreement as follows: the mean absolute percentage error for total building carbon emissions is 4.8% for residential buildings and 5.6% for public buildings.
2.3. Population and Urbanization Rate
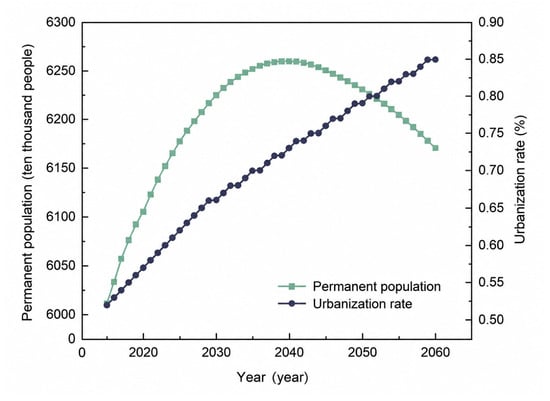
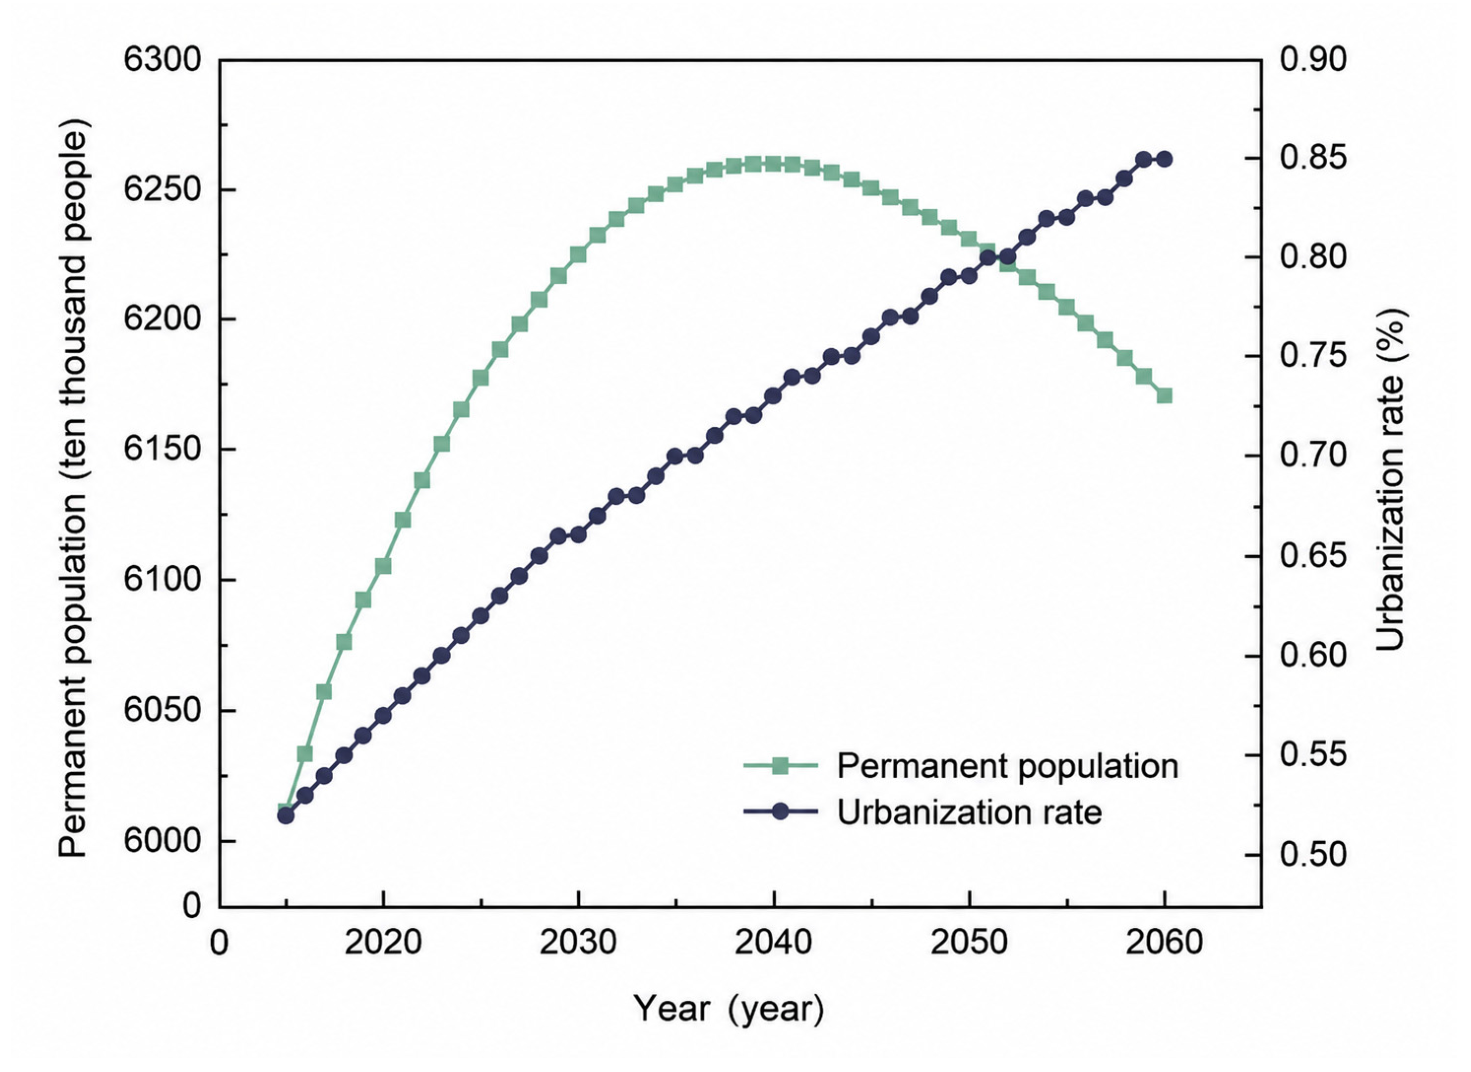
Under the baseline scenario, according to the main population development indicators in the Anhui Province 14th Five-Year Plan for Urban Housing Development (hereinafter referred to as the Plan), as depicted in Figure 3, it is projected that by 2025, the permanent population of Anhui Province will reach approximately 61.8 million people, with an annual increase of 150,000 people and an average annual growth rate of 0.25%. The average annual growth rate of the permanent population decreases by 0.1% every five years, with the average growth rate set at 0.15% from 2025 to 2030. According to data from the “2016 Anhui Province Labor Employment and Social Security Development Report,” it is projected that the population of Anhui Province will peak in 2037, reaching a peak of 62.6316 million people. After reaching the peak, the population shows a declining trend, falling to 61.7014 million people by 2060. The urbanization rate of Anhui Province is referenced from the “Anhui Province National Economic and Social Development 14th Five-Year Plan and 2035 Vision Outline” and the “Research on Low-carbon Building Scenarios and Policy Roadmaps in China”: in 2020, the urbanization rate is 58.33%, reaching around 62% by 2025, around 70% by 2035, around 80% by 2050, and around 85% by 2060.
Figure 3.
Forecast of resident population and urbanization rate under the baseline scenario.
2.4. Per Capita Building Area
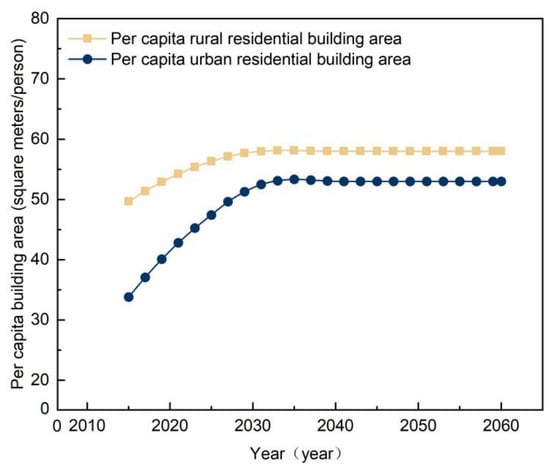
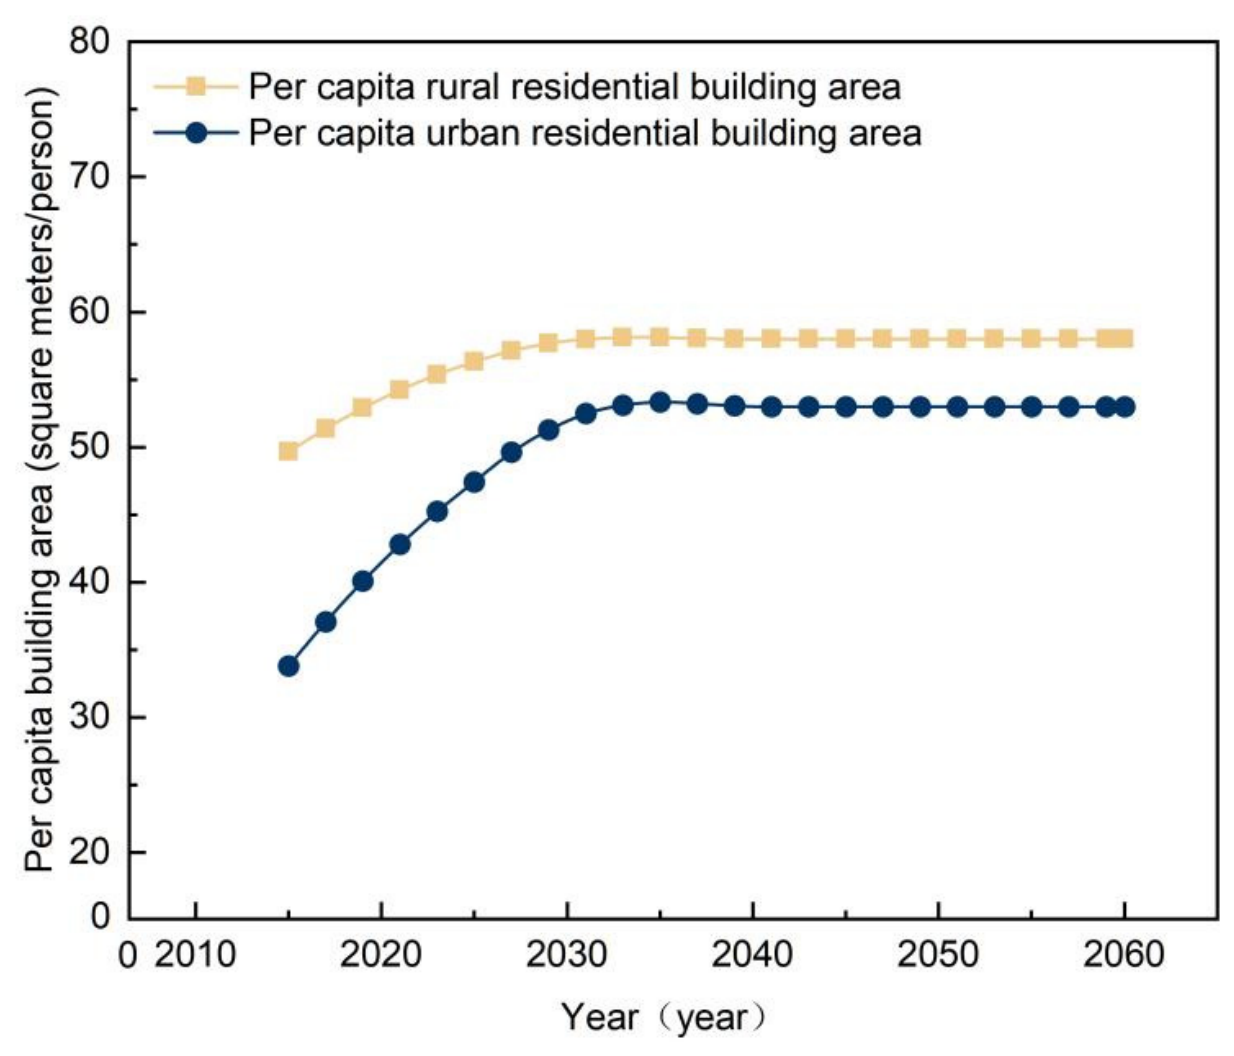
The per capita building area indicator reflects the intensity of building stock and is also one of the key factors affecting urban residential building energy consumption and carbon emissions. According to the Plan, the per capita urban building area in Anhui Province is expected to reach 47.1 m2 per person by 2025. According to the “Annual Development Research Report on Building Energy Efficiency in China,” the urban residential building area in China is expected to peak around 2030. The growth trend of per capita rural residential building area is roughly the same as that of urban residential building area. The specific values are shown in Figure 4.
Figure 4.
Predicted per capita building area under the baseline scenario.
2.5. Terminal Energy Intensity
Building terminal energy consumption intensity is influenced by various factors, including living habits, policies, and the level of building energy-saving technologies. In recent years, as living standards have improved, the demand for thermal comfort in buildings has increased. In Anhui Province, a region with hot summers and cold winters, the issue of winter heating has become more prominent. The use of air conditioners and new heat pump systems has gradually increased building energy consumption. In summer, the energy consumption for air conditioning, domestic hot water, and cooking has also increased. Additionally, as living standards improve, the use of household appliances has increased, further raising energy consumption. However, energy consumption for lighting has decreased due to the promotion of energy-saving lamps.
The building energy consumption intensity in this paper is primarily based on data from the annual “China Building Energy Efficiency Development Report” over the years. Combined with historical development trends, Anhui Province’s economic development level, and the relevant literature, various factors were comprehensively considered to forecast and analyze energy consumption data for the next 40 years. Specific data can be found in Table 1 [29,30,31,32,33,34,35].
Table 1.
Development and prediction of terminal energy intensity of residential buildings under the baseline scenario in Anhui Province.
2.6. Decomposition of Terminal Energy Consumption and Carbon Emission Analysis
In the previous section, a top-down approach to preliminarily estimate the energy consumption and carbon emissions of existing buildings in Anhui Province was used and explored the trends in these emissions. The energy consumption and carbon emissions of existing buildings in this region show significant spatial differences between the north and south, with the Huai River as the boundary. These differences are not only reflected in social scale factors such as the resident population and building area but also in economic and urbanization rates. Moving forward, based on the total data of energy consumption and carbon emissions from existing buildings in Anhui Province, we will use the terminal energy consumption decomposition model to further break down these emissions into the energy consumption and carbon emissions of each terminal category, enabling deeper analysis. This will help us gain a more comprehensive understanding of the contributions of each terminal to building energy consumption and carbon emissions, providing a more detailed data foundation for future research.
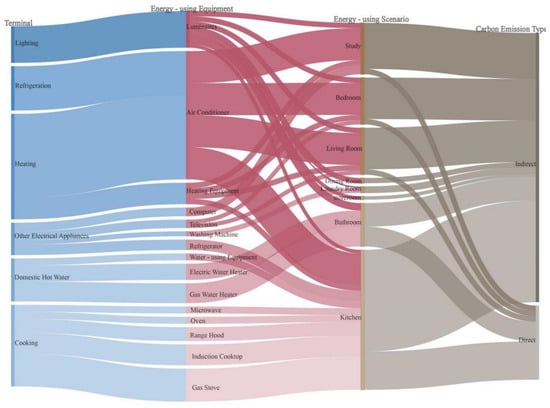
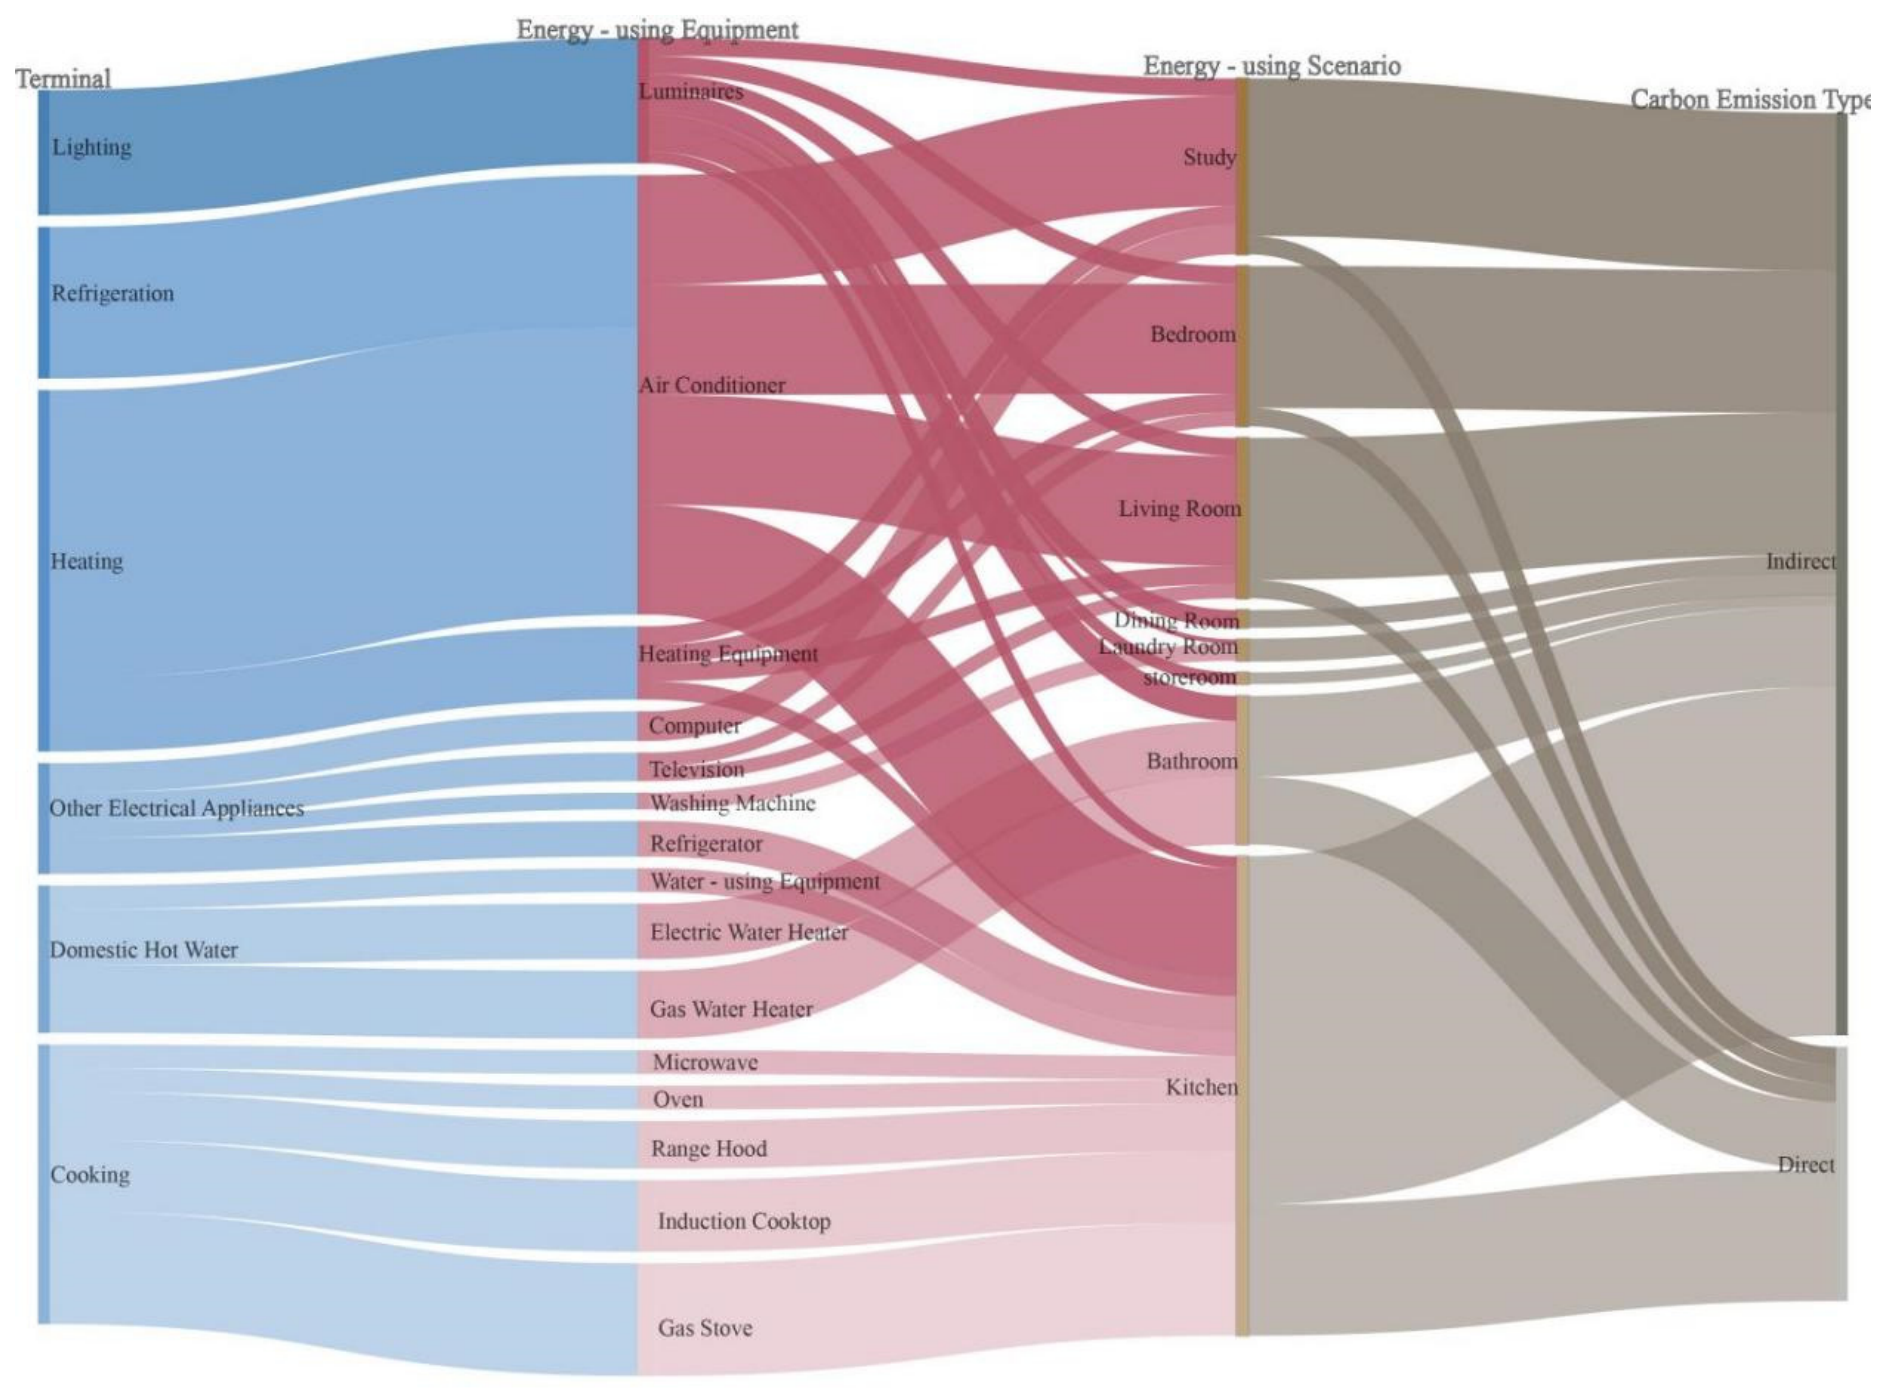
As shown in Figure 5, a detailed analysis of the carbon emission flow from residential buildings in Anhui Province in 2015 is conducted based on terminal decomposition. It is evident that heating emissions are the highest among all terminals, encompassing both direct and indirect emissions. Anhui Province, located in a region with hot summers and cold winters, has a relatively short heating season, averaging about 2 months, with temperatures typically ranging from 0 to 10 °C, and very few days below 0 °C. Therefore, residents in this area rarely use centralized heating systems; instead, they prefer local heating devices such as charcoal stoves, electric heaters, and split air conditioners, leading to a “part-time, part-space” usage pattern. This results in higher energy consumption for heating in buildings. As residents‘ income levels rise, some high-income households may opt for boiler floor heating, and some upscale communities have started to adopt centralized heating systems, although these are still rare. Currently, the primary source of heating energy in Anhui Province is electricity, with significant differences in winter heating energy consumption among households with different income levels. The winter heating energy intensity for most residential buildings ranges from 8 to 18 kWh/(m2·a). In addition to heating, the other five terminals primarily consume energy sources such as electricity, coal, natural gas, and liquefied petroleum gas. In Anhui Province, cooling terminals are similar to heating terminals, mainly using split air conditioners and electric fans, which also follow a “part-time, part-space” usage pattern, meaning the main energy consumption is electricity. Unlike heating, although cooling terminals vary among households, they are more influenced by residents’ living habits, including operating duration, time periods, and temperature, as well as the time for opening windows for ventilation at night. Cooking terminals refer to energy consumption during cooking activities. This part of energy consumption is mainly related to lifestyle, energy type, and cooking appliance efficiency. China has a variety of traditional cooking methods, such as stir-frying, boiling, steaming, and frying, each with different energy consumption. For example, stir-frying and frying typically require higher temperatures, potentially consuming more primary energy or electricity, while steaming and boiling are relatively more energy-efficient. The energy consumption for cooking in households has evolved from biomass energy, coal, liquefied petroleum gas (LPG), to piped natural gas, and electric appliances like rice cookers, induction cookers, and microwave ovens have become widely popular. Domestic hot water consumption refers to energy consumption for meeting the domestic water needs of washing, cleaning, and drinking within households. The differences in this area mainly stem from the living habits of different households and the heat production efficiency of hot water devices. Currently, the main types of hot water equipment in residential buildings include solar water heaters, gas water heaters, and electric water heaters, with carbon emissions from these energy sources being both direct and indirect. Lighting terminals primarily consume electricity. According to the survey results on lighting electricity use, the lighting energy intensity in residential buildings in Anhui Province is approximately 5.6 kWh/m2. Other electrical appliances, such as computers, televisions, washing machines, and refrigerators, mainly consume electricity.
Figure 5.
Terminal carbon emission flow of residential buildings in Anhui Province (2015). All energy intensities are given in kWh/m2·a. Carbon flow percentages represent the share of total emissions for each end-use. Direct versus indirect emissions are indicated by color, as shown in the legend.
3. Analysis of Factors Influencing Carbon Emissions
3.1. Ridge Regression Analysis
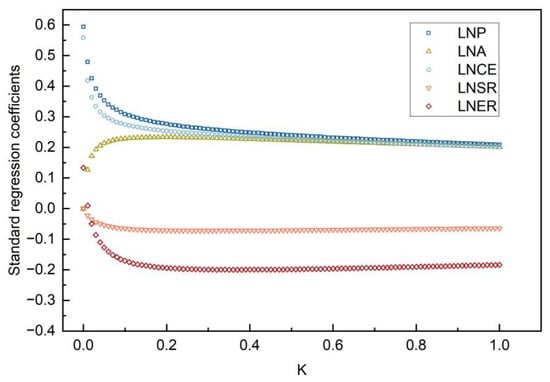
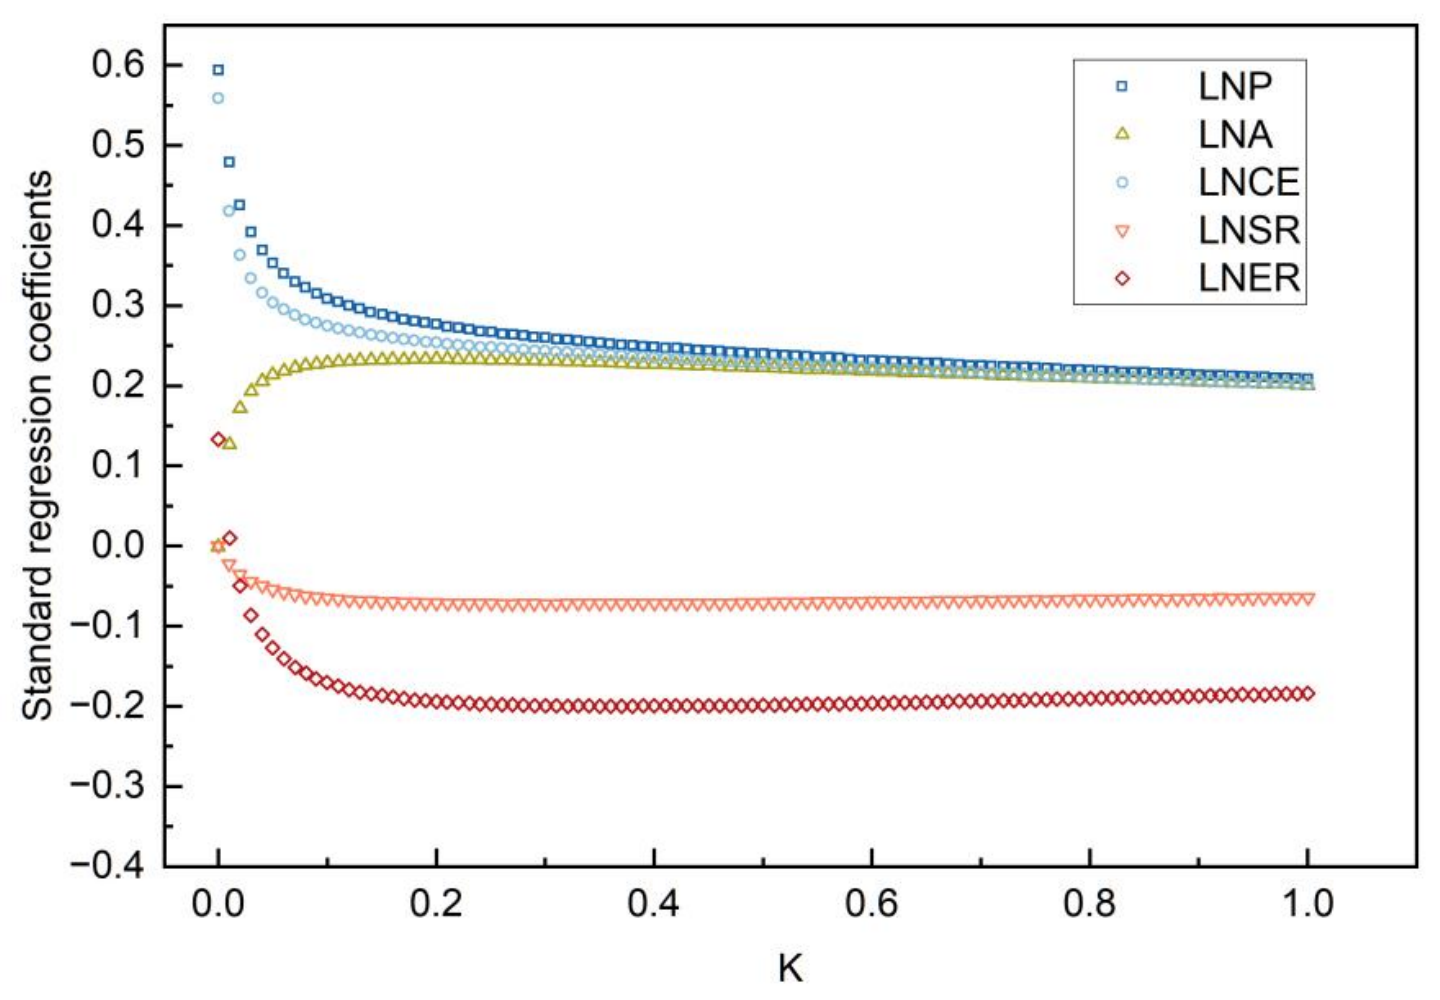
In time series prediction tasks, ridge regression (RR) [36,37] has become popular because of its advantages in dealing with multicollinearity and simple modeling mechanism [38,39]. In this paper, the ridge regression coefficient K is set to 0~1, the step size ins is set to 0.01, and the ridge regression program is run in SPSS V30.0 software, and the ridge trace diagram of the STIRPAT model of residential building carbon emissions in the construction field of Anhui Province is obtained, as shown in Figure 6.
Figure 6.
Ridge map of the regression of carbon emission model of residential buildings in Anhui Province.
It can be seen from the figure that the ridge traces of the five influencing factors tend to be stable when the residential building is K = 0.4, and the analysis results after obtaining the corresponding K values are shown in Table 2.
Table 2.
Ridge regression analysis results of residential building carbon emission model in Anhui Province (K = 0.4).
Get the STIRPAT model formula for residential buildings as shown in Equation (15)
3.2. Analysis of Influencing Factors
Through the STIRPAT model and ridge regression analysis, the final expression of the STIRPAT model for living in Anhui Province was obtained. As shown in Table 3, we can intuitively understand the impact of each factor on carbon emissions, including whether the impact is positive or not, and the extent of the impact.
Table 3.
Factors influencing carbon emissions in residential buildings.
- (1)
- Demographic factors
The permanent population was selected as the influencing factor for analysis, and the regression coefficient was −2.646. The negative effect of the demographic factor of residential buildings is due to the fact that before 2010, the economic development of Anhui Province was relatively lagging behind, at the level of the middle and lower reaches of the country, and its economic strength was relatively weak. During this period, a large number of people chose to go out to work every year, resulting in a large annual loss of people, which had a reduction effect on building carbon emissions.
- (2)
- Economic factors
Per capita GDP and added value of tertiary industry were selected as influencing factors, and the regression coefficient was +0.149. The economy stimulates energy consumption and promotes the growth of carbon emissions.
- (3)
- Technical factors
The impact of energy structure on residential construction is inverse, and the regression coefficient is −1.465. The energy structure of building consumption in Anhui Province has been continuously optimized, and the proportion of coal has decreased from 28.48% in 2005 to 0.45% in 2020. The proportion of electricity increased from 39.86% in 2005 to 59.01% in 2020, and the carbon emission factor of electricity continued to decrease. The floor area and unit energy intensity are positive, and the regression coefficients are +0.455 and +0.335 in residential construction.
4. Peak Prediction Analysis of Carbon Emissions from Residential Buildings in Anhui Province
The scenario analysis that follows take into account to carbon emissions from all civil buildings in Anhui Province. This aggregate comprises urban residential, rural residential, and public buildings. The energy consumption and carbon emissions of these three categories were aggregated into a single variable (total building carbon emissions).
4.1. Scenario Setting
- (1)
- Benchmark Scenario: Using 2015 as the base year and based on the current socio-economic development status of Anhui Province, this scenario mainly considers the social development policies and energy-saving and emission-reduction technologies, standards, and policy measures announced or implemented by the state and Anhui Province. In this scenario, the key driving factors are the development goals of the resident population and urbanization rate as planned, along with the rate of change in energy consumption levels of existing buildings set according to the energy-saving levels driven by future socio-economic development in Anhui Province, which essentially reflects the development state under natural guidance.
- (2)
- Green scenario: With a development positioning focused on green and sustainable development, and building an ecological civilization city, new buildings will implement a 75% energy-saving standard by 2030, an 83% energy-saving standard by 2040, and a standard of over 90% energy savings by 2050. For the renovation of existing buildings, by 2025, the energy-saving renovation area of residential buildings will account for 5% of the province’s residential buildings, 15% by 2045, and 25% by 2060.
- (3)
- Regulatory Scenario: With the goal of achieving peak carbon emissions in the construction sector by 2030, promoting high-quality green building development, and accelerating the improvement of building energy efficiency as the development orientation. New buildings will implement a 75% energy-saving standard by 2025, an 83% energy-saving standard by 2035, and a 90% or more energy-saving standard by 2045, with continued deepening of existing building renovations. Furthermore, the growth of the permanent population in Anhui Province is constrained by macro-control factors such as food production and supply, birth rates, and death rates, with a larger subsequent decline in population expected to reach a peak in 2033 and then drop by 2060.
- (4)
- Blueprint Scenario: Based on the goal of carbon peak in the construction sector by 2030, accelerate the energy-saving retrofitting of existing buildings, implement green buildings and renewable energy buildings on a large scale, achieving significant optimization in energy structure, industrial structure, and energy-saving levels, while the modern service industry is fully developed. Low-carbon technologies achieve breakthroughs, building energy-saving and emission reduction technologies become more comprehensive and refined, and the promotion and training of energy-saving knowledge receive widespread attention. The energy consumption methods of residents become more rational, the total regional population decreases further compared to the controlled scenario, ultimately reflecting the socioeconomic development state resulting from the combination of technological progress and policy guidance.
The specific settings of the implementation time for different energy-saving standards in various situations and the percentage of energy-saving renovation areas for existing buildings are shown in Table 4 and Table 5.
Table 4.
Execution time of different energy-saving standards under various scenarios.
Table 5.
Percentage of energy-saving renovation area of existing buildings in various scenarios.
4.2. Carbon Emission Analysis in Various Scenarios
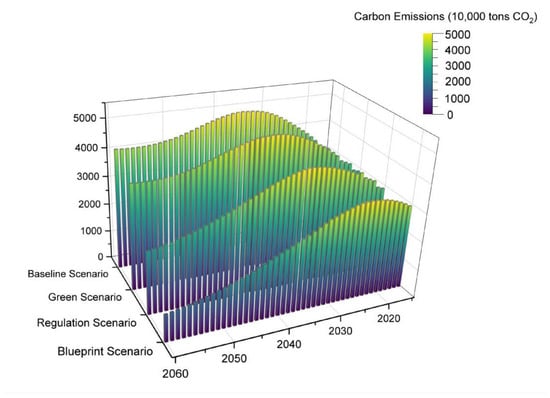
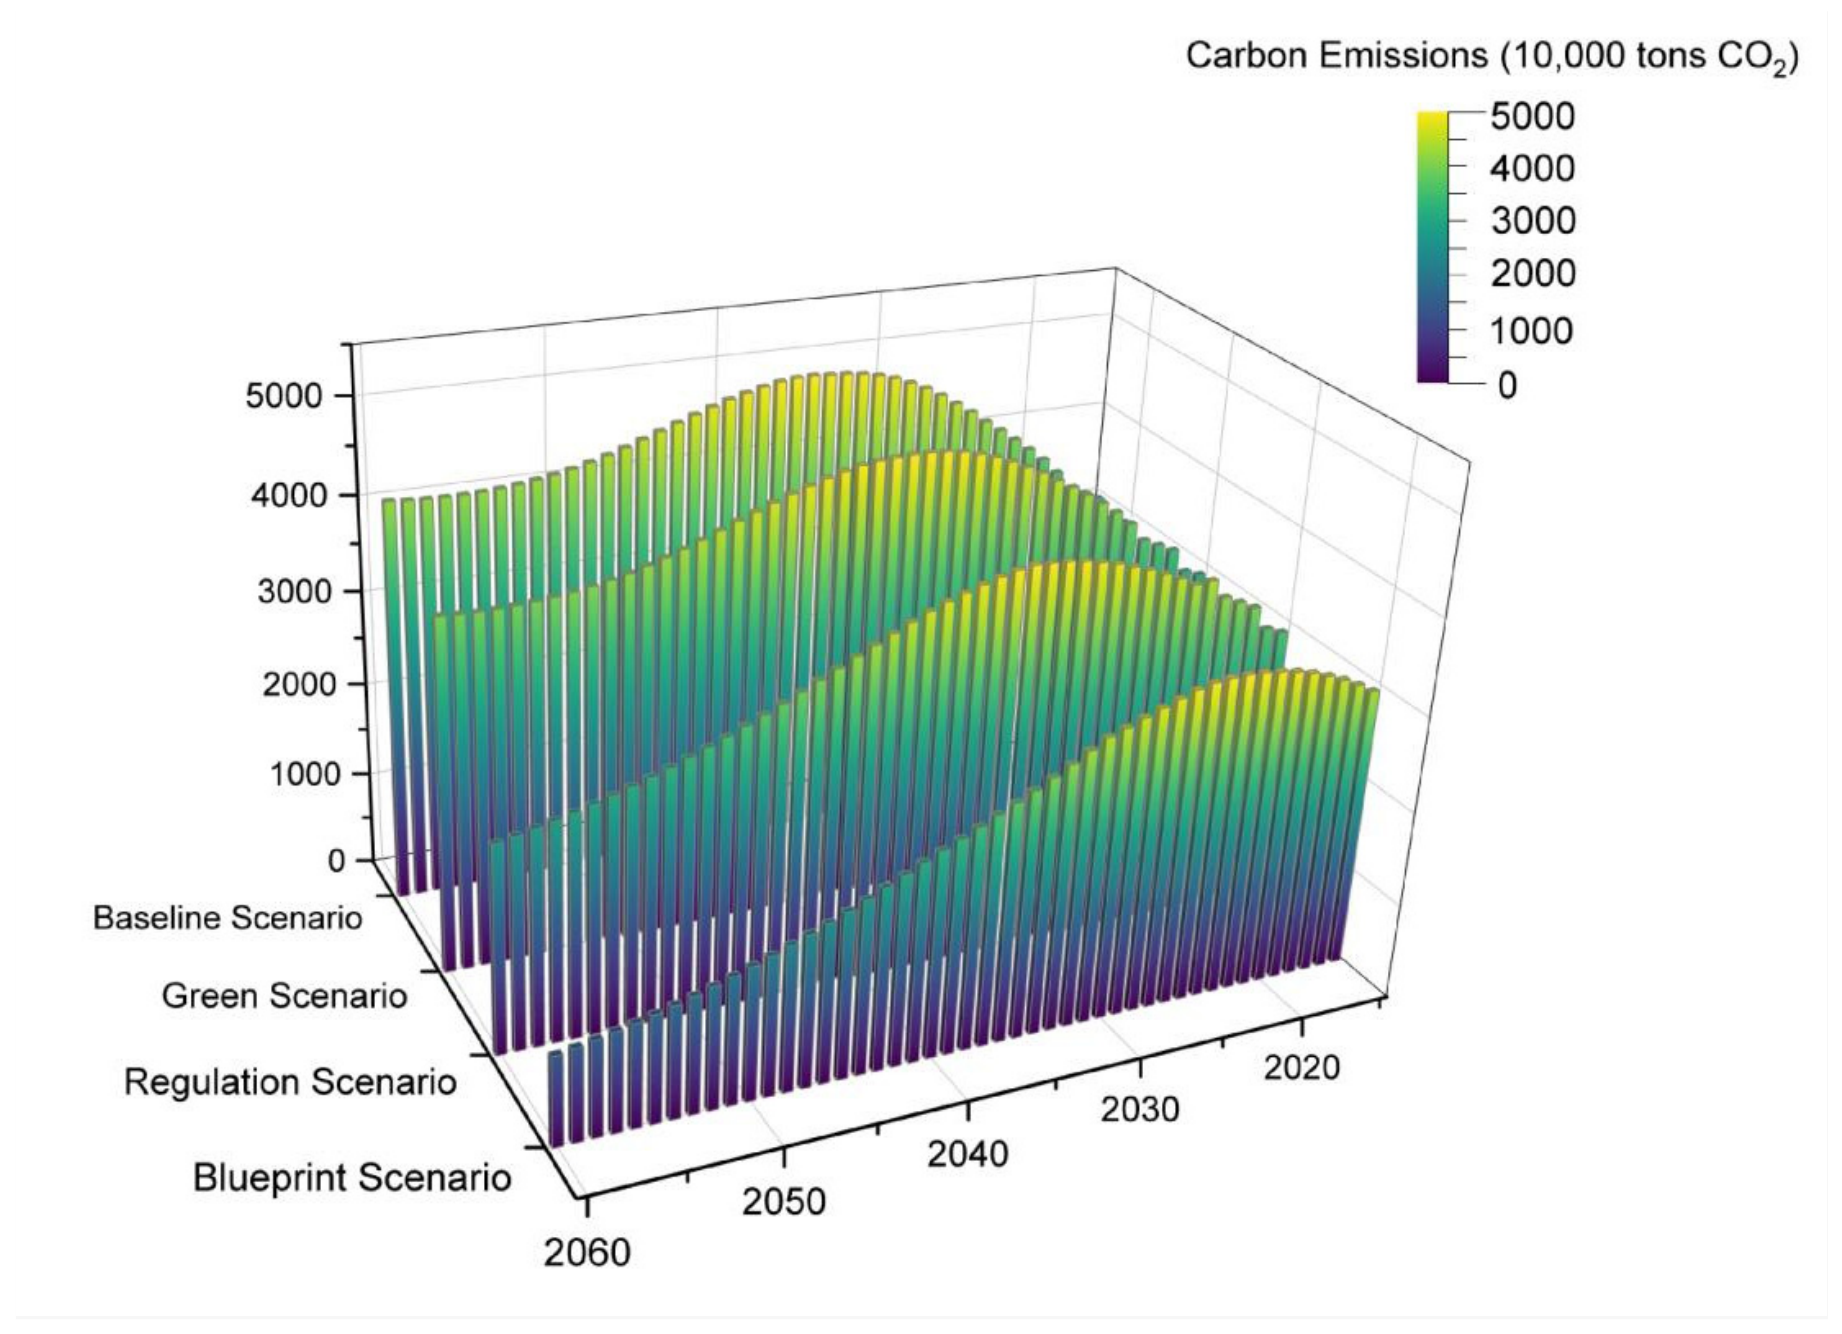
Figure 7 illustrates that under the baseline scenario, total carbon emissions from residential buildings in Anhui Province first increase rapidly, then rise more slowly, and finally decline gradually. Peak emissions are expected to occur in 2036, with the total peak carbon emissions from existing buildings reaching 49.4615 million tons of CO2—nearly 1.5 times that of 2015. Starting in 2036, carbon emissions from existing buildings will gradually decline, reaching 41.7864 million tons of CO2 by 2060, but still failing to meet the “30·60” dual carbon target. In both the green scenario and the baseline scenario, the various parameters are roughly the same. Under the assumption of only improving building energy efficiency, the carbon emissions from existing buildings show a slight decrease, with the peak time moved forward to 2031, but they still reach 36.6057 million tons of CO2 by 2060, making the carbon neutrality target still out of reach. In the regulatory scenario, after a series of regulatory optimizations regarding population, urbanization rate, and energy structure for buildings, the peak carbon emissions time is moved forward to 2030, achieving the 2030 peak target in the “30·60” dual carbon target, with emissions in 2060 reduced to 21.604 million tons of CO2. The blueprint scenario benefits from further control of the resident population, stricter energy-saving policies, large-scale use of renewable energy, and the promotion of comprehensive electrification in buildings, showing significant energy-saving potential. After reaching peak emissions in 2025, they fall to 9.1869 million tons of CO2 by 2060.
Figure 7.
Carbon emissions from residential buildings in Anhui Province under each scenario.
4.3. Uncertainty and Sensitivity Analysis
A one-factor-at-a-time sensitivity analysis was conducted on the blueprint scenario by varying the following three key parameters independently by ±10% and ±20%: (1) permanent population growth rate, (2) energy structure (proportion of electricity in terminal energy), and (3) building energy intensity improvement rate. The results show that carbon emissions in 2060 are most sensitive to energy structure (−1.8% to +2.1% change per 10% change in electricity share), followed by energy intensity, while population has a lower but non-negligible impact (approximately ±1.2% per 10% change). The peak year (2025) remained unchanged in all sensitivity runs, indicating the robustness of the blueprint scenario’s peak timing.
5. Conclusions
This article applies the energy balance method and the LEAP model to calculate the baseline scenario based on the current development status of Anhui Province. Using the STIRPAT model, it analyzes the factors affecting carbon emissions from residential buildings in Anhui Province from 2005 to 2020. After studying these influencing factors, scenario parameters are established, and four different scenarios are set using scenario analysis to propose implementation paths for residential building development suitable for the conditions of Anhui Province.
- (1)
- The permanent population and energy structure have negative effects on carbon emissions from residential buildings in Anhui Province, recorded at −2.646 and −1.465 respectively, with the permanent population being the main influencing factor. Per capita GDP, building area, and energy consumption intensity show positive effects, recorded at 0.149, 0.455, and 0.465 respectively.
- (2)
- Combining scenario analysis with the LEAP model, four different developmental scenarios are set to predict the peak time and peak amount of carbon emissions in the construction sector of Anhui Province. Under the baseline scenario, carbon emissions in the construction sector will peak in 2036 at 49.4615 million tons. In the green scenario, carbon emissions will peak in 2031 at 46.5454 million tons. In the regulatory scenario, the peak will be reached in 2030 at 41.1905 million tons, but achieving carbon neutrality by 2060 remains difficult. The blueprint scenario will peak in 2025 at 34.2929 million tons.
- (3)
- The optimal implementation path for reaching the carbon peak in the construction sector of Anhui Province should follow the blueprint scenario. By 2025, 10% of residential buildings should be retrofitted, while ensuring that new buildings meet 75% of energy-saving standards; by 2030, the energy-saving standards for new buildings should be raised to 83%; by 2035, standards for nearly zero-energy consumption buildings should exceed 90%; by 2045, the retrofitting ratio of residential buildings should increase to 25%; and by 2060, this ratio should reach 50%. At the same time, the construction sector should continue to increase the utilization of renewable energy, vigorously promote the electrification of buildings, improve energy use structures, disseminate knowledge about building energy-saving, and enhance public awareness of building energy efficiency.
Based on the aforementioned research conclusions, our study also has certain limitations. Future research can be further conducted from the following perspectives: (1) incorporating dynamic carbon emission factors for electricity based on grid decarbonization pathways; (2) adding embodied carbon from building materials using life-cycle assessment (LCA); and (3) developing a spatially disaggregated model to capture intra-provincial differences. It is worth noting that the policy recommendations presented in this study (e.g., retrofit percentages, energy-saving standards, and renewable energy integration) are derived directly from the LEAP and STIRPAT model. These quantitative results are intended to serve as scientific references for policy makers. However, the practical feasibility of implementing these recommendations depends on multiple real-world factors—including economic costs, energy security, industrial structure, social acceptance, technological maturity, and local grid infrastructure—which are beyond the scope of this modeling study. Therefore, the proposed measures should be viewed as indicative targets rather than prescriptive mandates. Further research integrating multi-criteria decision analysis or detailed cost–benefit assessment is needed to validate practical feasibility. This is another key direction for our future work.
Author Contributions
The authors confirm their contribution to the paper as follows: conceived and designed the study, performed the data analysis: G.Z.; conceived and designed the study, revised the manuscript critically for important intellectual content, and served as the corresponding author: H.H. (Haowei Hu); collected and sorted the original data, assisted in data analysis: Z.W., D.W. and Y.W.; drafted the initial manuscript, reviewed and polished the writing: Z.W. and H.H. (Huidi Huang). All authors have read and agreed to the published version of the manuscript.
Funding
This work was supported by the National Natural Science Foundation of China (No. 52576051), the University Outstanding Youth Fund Project of Anhui Province under grant (No. 2022AH020028), the Natural Science Foundation of Anhui Province under grant (No. 2308085ME173), the Open Project Program of Engineering Research Center of Building Energy Efficiency Control and Evaluation, Ministry of Education under grant (No. AHJZNX-2024-05), Key Natural Science Project of Anhui Provincial Department of Education (No. 2025AHGXZK30017).
Data Availability Statement
Data can be made available from the corresponding author following a special request due to (specify the reason for the restriction).
Conflicts of Interest
Author Donghong Wang was employed by the company Anhui Province Architectural Design and Research Institute Co., Ltd. The remaining authors declare that the research was conducted in the absence of any commercial or financial relationships that could be construed as a potential conflict of interest.
References
- China Building Energy Conservation Association; Chongqing University (Eds.) Research Report on Carbon Emissions in the Field of Urban and Rural Development in China, 2024th ed.; China Building Energy Conservation Association: Beijing, China, 2025. [Google Scholar]
- Wu, R.; Wang, J.; Wang, S. The drivers of declining CO2 emissions trends in developed nations using an extended STIRPAT model: A historical and prospective analysis. Renew. Sustain. Energy Rev. 2021, 149, 111370. [Google Scholar] [CrossRef] [Scilit]
- Zhang, S.; Xu, W.; Yang, X.; Fu, Y. Contribution of nearly-zero energy buildings standards enforcement to achieve carbon neutral in urban area by 2060. Adv. Clim. Change Res. 2021, 12, 734–743. [Google Scholar] [CrossRef] [Scilit]
- Liu, H.; Yin, W.; Yan, F.; Cai, W.; Du, Y.; Wu, Y. A coupled STIRPAT-SD model method for land-use carbon emission prediction and scenario simulation at the county level. Environ. Impact Assess. Rev. 2024, 108, 107595. [Google Scholar] [CrossRef] [Scilit]
- Islas, J.; Manzini, F.; Martínez, M. Renewable energies in electricity generation for reduction of greenhouse gases in Mexico 2025. Ambio 2002, 31, 35–39. [Google Scholar] [CrossRef] [PubMed]
- Huang, Y.; Bor, Y.J.; Peng, C.Y. The long-term forecast of Taiwan’s energy supply and demand: LEAP model application. Energy Policy 2011, 39, 6790–6803. [Google Scholar] [CrossRef] [Scilit]
- Rout, U.K.; Voß, A.; Singh, A. Energy and emissions forecast of China over a long-time horizon. Energy 2011, 36, 1–11. [Google Scholar] [CrossRef] [Scilit]
- Qiu, S.; Lei, T.; Wu, J.; Bi, S. Energy demand and supply planning of China through 2060. Energy 2021, 234, 121193. [Google Scholar] [CrossRef] [Scilit]
- Hernández, K.D.; Fajardo, O. Estimation of industrial emissions in a Latin American megacity under power matrix scenarios projected to the year 2050 implementing the LEAP model. J. Clean. Prod. 2021, 303, 126921. [Google Scholar] [CrossRef] [Scilit]
- Emodi, N.V.; Emodi, C.C.; Murthy, G.P.; Emodi, A.S.A. Energy policy for low carbon development in Nigeria: A LEAP model application. Renew. Sustain. Energy Rev. 2017, 68, 247–261. [Google Scholar] [CrossRef] [Scilit]
- Pan, L.; Xie, Y.; Li, W. An analysis of emission reduction of chief air pollutants and greenhouse gases in Beijing based on the LEAP model. Procedia Environ. Sci. 2013, 18, 347–352. [Google Scholar] [CrossRef] [Scilit]
- Nieves, J.A.; Aristiz’abal, A.J.; Dyner, I.; Báez, O.; Ospina, D.H. Energy demand and greenhouse gas emissions analysis in Colombia: A LEAP model application. Energy 2019, 169, 380–397. [Google Scholar] [CrossRef] [Scilit]
- Maduekwe, M.; Akpan, U.; Isihak, S. Road transport energy consumption and vehicular emissions in Lagos, Nigeria: An application of the LEAP model. Transp. Res. Interdiscip. Perspect. 2020, 6, 100172. [Google Scholar] [CrossRef] [Scilit]
- Yang, D.; Liu, D.; Huang, A.; Lin, J.; Xu, L. Critical transformation pathways and socio-environmental benefits of energy substitution using a LEAP scenario modeling. Renew. Sustain. Energy Rev. 2021, 135, 110116. [Google Scholar] [CrossRef] [Scilit]
- Hong, S.; Chung, Y.; Kim, J.; Chun, D. Analysis on the level of contribution to the national greenhouse gas reduction target in Korean transportation sector using LEAP model. Renew. Sustain. Energy Rev. 2016, 60, 549–559. [Google Scholar] [CrossRef] [Scilit]
- Zhao, T.; Liu, Z.; Zhao, C.X. Research on the prospects of low-carbon economic development in China based on LEAP model. Energy Procedia 2011, 5, 695–699. [Google Scholar] [CrossRef] [Scilit]
- Seyithan, A.A. Energy efficiency and CO2 mitigation potential of the Turkish iron and steel industry using the LEAP system. Energy 2015, 90, 417–428. [Google Scholar] [CrossRef] [Scilit]
- Zhao, X.; Rao, Z.; Lin, J.; Zhang, X. Scenario forecasting of carbon neutrality by combining the LEAP model and future land-use simulation: An empirical study of Shenzhen, China. Sustain. Cities Soc. 2025, 125, 106367. [Google Scholar] [CrossRef] [Scilit]
- Zou, Q.; Zeng, G.P.; Zou, F.; Zhou, S. Carbon emissions path of public buildings based on LEAP model in Changsha city (China). Sustain. Futur. 2024, 8, 100231. [Google Scholar] [CrossRef] [Scilit]
- Yu, S.; Zhang, Q.; Hao, J.L.; Wenting, M.; Sun, Y.; Wang, X.; Song, Y. Development of an extended STIRPAT model to assess the driving factors of household carbon dioxide emissions in China. Environ. Manag. 2023, 325, 116502. [Google Scholar] [CrossRef] [Scilit] [PubMed]
- Cong, X.; Zhao, M.; Li, L. Analysis of carbon dioxide emissions of buildings in different regions of China based on STIRPAT model. Procedia Eng. 2015, 121, 645–652. [Google Scholar] [CrossRef] [Scilit]
- Liu, D.; Xiao, B. Can China achieve its carbon emission peaking? A scenario analysis based on STIRPAT and system dynamics model. Ecol. Indic. 2018, 93, 647–657. [Google Scholar] [CrossRef] [Scilit]
- Fan, Y.; Liu, L.; Wu, G.; Wei, Y. Analyzing impact factors of CO2 emissions using the STIRPAT model. Environ. Impact Assess. Rev. 2006, 26, 377–395. [Google Scholar] [CrossRef] [Scilit]
- Li, H.; Mu, H.; Zhang, M.; Gui, S. Analysis of regional difference on impact factors of China’s energy-related CO2 emissions. Energy 2012, 39, 319–326. [Google Scholar] [CrossRef] [Scilit]
- Cai, W.; Li, X.; Wang, X.; Chen, M.; Yong, W.; Wei, F. Split model and application of building energy consumption based on energy balance table. HVAC 2017, 47, 27–34. (In Chinese) [Google Scholar] [CrossRef]
- Wang, Q. China’s end-use energy consumption and energy efficiency in accordance with international standards. China Energy 2006, 28, 5–9. Available online: https://kns.cnki.net/kcms2/article/abstract?v=wxNydmF1-_R01mEpup7DYD8GmKcb113W75Fwd3pDzo4AtDaCBcypq1pSITFau0zOZMBwEqRKi3BoCnRkEPHeoUbO6KI5QsbzE90zXG1bRKUNDfU3ngWehjpZvFAbOvoEm0_9g7oS2mBEr33ljcgWIRFyrS70JGGb1k3xJ0lpl1bg2139xZTp7Q==&uniplatform=NZKPT&language=CHS (accessed on 6 April 2026). (In Chinese)
- Zhu, Y.; Li, L.; He, S.; Li, H.; Wang, Y. Peak year prediction of Shanxi Province’s carbon emissions based on IPAT modeling and scenario analysis. Resour. Sci. 2016, 38, 2316–2325. (In Chinese) [Google Scholar] [CrossRef] [Scilit]
- York, R.; Rosa, E.A.; Dietz, T. STIRPAT, IPAT and ImPACT: Analytic tools for unpacking the driving forces of environmental impacts. Ecol. Econ. 2003, 46, 351–365. [Google Scholar] [CrossRef] [Scilit]
- Wang, J.; Shen, H.; Yuan, W.; Yang, Y.; Wang, X. Research on calculation methods of civil building area and energy consumption intensity. Build. Sci. 2020, 36, 390–401. (In Chinese) [Google Scholar]
- Na, W.; Wang, M.; Zhao, X.; Cao, Y. Interaction effects of influencing factors on annual energy consumption intensity of public buildings. Gas. Heat. 2022, 42, 17–20. (In Chinese) [Google Scholar] [CrossRef]
- Gong, Y.; Niu, X. Analysis of basic conditions and implementation pathways for carbon peak in the building sector of hot summer and cold winter regions. J. Nanjing Tech Univ. (Nat. Sci. Ed.) 2022, 44, 357–364. (In Chinese) [Google Scholar]
- Fan, J.H.; Hu, S.S.; Wu, Y. Analysis of influencing factors on energy consumption intensity of urban residential buildings in hot summer and cold winter regions. Constr. Sci. Technol. 2021, 23–27. (In Chinese) [Google Scholar] [CrossRef]
- Tsinghua University Building Energy Efficiency Research Center. Annual Report on China Building Energy Efficiency 2017; China Architecture & Building Press: Beijing, China, 2017. [Google Scholar]
- Tsinghua University Building Energy Efficiency Research Center. Annual Report on China Building Energy Efficiency 2021; China Architecture & Building Press: Beijing, China, 2021. [Google Scholar]
- Tsinghua University Building Energy Efficiency Research Center. Annual Report on China Building Energy Efficiency 2020; China Architecture & Building Press: Beijing, China, 2020. [Google Scholar]
- Hoerl, A.E.; Kennard, R.W. Ridge regression: Biased estimation for nonorthogonal problems. Technometrics 1970, 12, 55–67. [Google Scholar] [CrossRef]
- Golub, G.H.; Heath, M.; Wahba, G. Generalized cross-validation as a method for choosing a good ridge parameter. Technometrics 1979, 21, 215–223. [Google Scholar] [CrossRef]
- Zheng, Y.; Ge, Y.; Muhsen, S.; Wang, S.; Elkamchouchi, D.H.; Ali, E.A.; Ali, H.E. New ridge regression, artificial neural networks and support vector machine for wind speed prediction. Adv. Eng. Softw. 2023, 179, 103426. [Google Scholar] [CrossRef] [Scilit]
- Sun, Q.Q.; Zhang, H.C.; Sun, Z.J.; Xia, Y. Ridge regression and artificial neural network to predict the thermodynamic properties of alkali metal Rankine cycles for space nuclear power. Energy Convers. Manag. 2022, 273, 116385. [Google Scholar] [CrossRef] [Scilit]

Disclaimer/Publisher’s Note: The statements, opinions and data contained in all publications are solely those of the individual author(s) and contributor(s) and not of MDPI and/or the editor(s). MDPI and/or the editor(s) disclaim responsibility for any injury to people or property resulting from any ideas, methods, instructions or products referred to in the content. |
© 2026 by the authors. Licensee MDPI, Basel, Switzerland. This article is an open access article distributed under the terms and conditions of the Creative Commons Attribution (CC BY) license.