


Abstract
This study investigates the energy performance of anaerobic digesters in a municipal wastewater treatment plant by integrating empirical data from two tanks located at different distances from the heat source with simulation results. The analysis of measurements enabled the determination of heat transferred to the raw sludge, total heat losses of both systems, and provided input data for an hourly simulation of the thermal balance of the digester envelope. An analytical model was developed, including separate equations for the sludge and biogas phases, considering heat losses caused by mass transfer, conduction, convection, and radiation, as well as solar heat gains. The results show that the temperature difference between sludge and biogas exhibits seasonal variation, with a maximum value of 10.5 K, while the desired operational temperature of sludge fermentation is maintained at 38 °C. The total annual heat balance of the anaerobic digester in 2024 was estimated at 202.8 MWh, with the following structure: aboveground walls 46%, ground-contact partitions 30%, and dome 24%. Model validation using data from one of the digesters indicated a total system energy demand of 1812.0 MWh, distributed as follows: heat transferred to raw sludge 88.6%, heat transfer losses 0.2%, and digester envelope balance 11.2%. Replacing the thermal insulation of the aboveground section could reduce heat losses by 70.7 MWh, decreasing the total energy demand of the system by 3.9%. Comparison with the second digester revealed an energy gap of 166.3 MWh, which may be attributed to higher transmission losses or degradation of the insulation layer.
1. Introduction
The global energy sector is currently undergoing a dynamic transformation driven by the need to improve energy efficiency, increase the share of renewable energy sources, and reduce greenhouse gas emissions [1]. Among the many developing environmentally friendly technologies, biogas production in wastewater treatment plants plays a particularly important role, combining the objectives of sludge management with the generation of renewable energy [2]. The anaerobic digestion process, well-established and widely applied in wastewater treatment, enables the conversion of sewage sludge into biogas, which is subsequently used for electricity and heat production. Maintaining an appropriate internal temperature within the digestion chamber is essential for the stable operation of the anaerobic digestion system. He et al. [3] emphasized that temperature significantly affects microbial activity and the balance between hydrolysis and methanogenesis processes, directly determining methane yield. Zhao et al. [4] demonstrated a strong relationship between microbiological kinetics and temperature deviations, confirming that methanogens are particularly sensitive to thermal fluctuations. These variations necessitate compensating for heat losses under changing external conditions, which leads to a decrease in the overall energy efficiency of the process. Steiniger et al. [5], Conrad [6], and Chen and Chang [7] consistently indicated that both the structure of methanogenic communities and the efficiency of methanogenesis strongly depend on the operational temperature range. These studies confirm that optimal conditions for mesophilic fermentation typically fall within the range of 35–45 °C, where the highest microbiological stability and most efficient decomposition of organic substrates are observed. The thermal stability of the digestion process is strongly influenced by external conditions and heat losses through the digester envelope, making the accurate analysis of its thermal balance and improvement of insulation properties key elements in enhancing the overall energy efficiency of wastewater treatment plants.
Various approaches to the thermal modeling of anaerobic digesters have been described in the literature, ranging from simple analytical models to advanced numerical simulations. In the context of thermal modeling of digestion chambers, the model developed by Gracia et al. [8] is particularly noteworthy, as it predicts the internal temperature of the anaerobic reactor as a function of ambient temperature and heating power, with a maximum prediction error below ±1 °C. This model, based on the energy balance equation and accounting for the system’s thermal inertia, provides an alternative to complex dynamic models such as the one proposed by Haugen et al. [9] or the widely used Anaerobic Digestion Model No. 1 (ADM1) developed by Batstone et al. [10]. In recent years, numerous studies have also focused on integrating the thermal balance with dynamic models of anaerobic digestion, including both numerical simulations and experimental validations. Emebu et al. [11] presented a comprehensive review of anaerobic digestion models, classifying them according to their complexity and the extent to which they represent physical, chemical, and biological phenomena. Yuki Junior et al. [12] developed a coupled model that combines the thermal balance with ADM1 biochemical kinetics, enabling the analysis of environmental conditions and heat exchange effects on process stability. Similarly, Pal and Ilango [13] developed an experimentally validated thermal model that allows for the assessment of heat losses and ensures stable biogas production under variable external conditions. Ahmadi, Avila, and Barna [14] developed a conduction–convection heat transfer model for a multi-dome digester, accounting for the effects of insulation thickness, ambient temperature, and tank structure on the thermal balance. The authors emphasized that proper design of thermal insulation can significantly reduce heat losses, particularly in temperate climates. In recent years, Computational Fluid Dynamics (CFD) models have gained increasing popularity, as they enable simultaneous modeling of sludge flow, mass transport, heat transfer, and mixing processes. Hreiz et al. [15] developed and implemented a three-dimensional CFD model of heat transfer in a semi-buried anaerobic digester operating under low ambient temperature conditions. This model allowed for the analysis of the influence of external conditions and material properties on the temperature distribution within the reactor, and its results were validated with experimental data, confirming the accuracy of the proposed approach. Miana et al. [16] proposed a practical approach that couples CFD (multiphase flow and heat transfer) with a simplified biochemical reaction model calibrated with process data, providing a more realistic representation of digester operation (demonstrated using a winery wastewater reactor). Farid et al. [17] presented a review of CFD applications in the analysis of anaerobic digestion, highlighting their potential for assessing heat losses and mixing efficiency in reactors.
Empirical studies represent an important source of information on real operational challenges associated with anaerobic digesters, as they enable precise identification of zones with the highest energy losses. Using infrared thermography and a network of temperature sensors distributed over the digester shell and dome, Teleszewski and Żukowski [18] analyzed a biogas plant operating under Polish climatic conditions. Their results indicated insufficient insulation and dominant heat losses in the upper parts of the tank and the gas dome. Rynkowski et al. [19] compared actual and modeled heat losses in a semi-buried digester, confirming that the highest losses occur in the cover zone, while partial burial of the tank in the ground significantly reduces heat exchange. Gelegenis et al. [20] proposed a classical approach to assessing the energy balance of digesters, including the analysis of heat gains and losses as well as the energy required for substrate heating. The study by Godar et al. [21] integrated empirical measurements with thermal modeling and economic analyses, demonstrating that, in temperate climates, heat losses may account for 20–45% of the energy contained in biogas. Wang et al. [22] and Garkoti et al. [23] emphasized that, under low ambient temperature conditions, the net energy gain can be almost entirely offset by the system’s heat demand. Therefore, reducing energy losses through improved insulation and optimized heat exchange has become an essential direction of research. Avila-Lopez et al. [24], analyzing large-scale biogas installations, showed that the appropriate design of insulation systems, heat exchangers, and digester structures can significantly enhance the thermal self-sufficiency of the entire system. Furthermore, in recent years, increasing attention has been paid to the integration of heating and substrate mixing systems to improve the overall energy efficiency of the digestion process. El Ibrahimi et al. [25] demonstrated that coupling the mixing system with heat recovery results in a more uniform temperature distribution and a reduction in thermal energy demand.
The aforementioned studies demonstrate, among other findings, that heat losses generated through the digester envelope can significantly reduce the positive effects of biogas production. Comprehensive energy analyses make it possible to identify system components responsible for the greatest heat losses and support the design of modern, energy-efficient digesters with a low carbon footprint. However, despite substantial progress in analytical, numerical, and CFD-based modeling approaches, current research still largely lacks validation against long-term operational data from full-scale municipal digesters. Despite progress in modeling, there remains a lack of studies based on real measurement data obtained under operational conditions, particularly for municipal facilities. Most available analyses focus on agricultural biogas plants, which differ from wastewater treatment plant digesters in terms of structure, insulation, substrate type, and mixing methods. Digesters in wastewater treatment plants are typically partially buried, have large volumes, and include integrated heating and sludge mixing systems. Moreover, sewage sludge is characterized by a lower dry matter content and different flow behavior compared to typical agricultural substrates, which affects heat transfer and temperature distribution within the reactor. Due to these differences, conclusions drawn from studies on agricultural biogas plants cannot be directly applied to municipal facilities. Consequently, the literature lacks integrated assessments that combine empirical measurements with detailed, component-level thermal balance modeling under dynamic climatic and operational conditions.
In summary, the anaerobic digestion of sewage sludge is a highly energy-intensive process. The heat demand of the digestion chamber results from both the need to heat the raw sludge and from heat losses through the tank’s envelope. Accurate identification of heat losses, their locations, and seasonal variations is crucial for improving the energy efficiency of wastewater treatment plants, particularly in temperate climates. Studies conducted directly on real facilities enable the development of reliable models of heat losses, optimization of energy consumption, and enhancement of digester performance. Therefore, the aim of the case study presented in this paper was to determine the heat balance of the digester envelope (with hourly simulations carried out under dynamic operating conditions), to integrate its results into the overall energy balance of the system based on empirical data, and to assess the potential for reducing the energy demand of such facilities through thermal modernization of the tank. Analyses that simultaneously incorporate long-term operational data from full-scale municipal digesters and detailed thermal balance modeling remain relatively rare in the available literature, which highlights the relevance and added value of the approach presented in this study.
2. Materials and Methods
2.1. Description of the System
The study was conducted on a system comprising six separate anaerobic digesters (ADs) operating at the municipal wastewater treatment plant in Wrocław, Poland. The current capacity of the plant is approximately 140,000 m3 of wastewater per day. Each digester has the same usable volume. The tanks are arranged in two parallel rows in a symmetrical layout relative to the technological axis of the facility.
A single AD is a closed, cylindrical reinforced-concrete tank equipped with an external heating system, a mixer, and a biogas collection installation. The digester operates under anaerobic conditions, involving the processes of hydrolysis, acidogenesis, acetogenesis, and methanogenesis. As a result, sludge stabilization, reduction in organic matter content, and biogas production occur, the latter being a valuable source of renewable energy. Anaerobic digestion is sensitive to thermal disturbances; therefore, temperature fluctuations may significantly reduce biogas production efficiency. For this reason, the sludge temperature is maintained at a constant level (approximately 38 °C) by heating both the recirculated and raw sludge. The sludge fed into each AD is heated in a heat exchanger (individual for each reactor). The digesters are located at different distances from the technical room housing the heat exchangers responsible for maintaining the required thermal conditions of the digestion process.
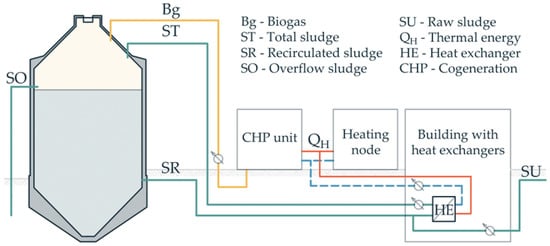
A schematic diagram illustrating the sludge and heat transport system for a single AD is presented in Figure 1. The biogas (Bg) produced during the digestion process is directed to a combined heat and power (CHP) unit, where it is combusted to simultaneously generate heat and electricity. The recovered heat (QH) from the CHP system, together with the heat produced in the heating node, is transferred to the heat exchanger (HE) and used to maintain the required fermentation temperature by heating the raw sludge (SU) along with the recirculated sludge (SR) drawn from the AD before re-entering the digester. Stabilization of temperature conditions in the digester translates into improved continuity and efficiency of biogas production. In addition to being used for sludge heating, the produced biogas also serves as an energy carrier for heat generation in other wastewater treatment plant facilities, such as process buildings, administrative areas, and auxiliary installations supporting wastewater treatment operations.
Figure 1.
Simplified process diagram of a single anaerobic digester system.
The diameter of each anaerobic digester (AD) is 19.2 m. Its walls are 60 cm thick and consist of 50 cm of reinforced concrete and 10 cm of thermal insulation, with most of the surface covered by galvanized steel sheet. The upper part of the tank (the dome) is made of 30 cm of concrete, 10 cm of thermal insulation, and 1.9 cm of formwork, and is covered with 0.8 mm aluminum sheet. The wall of the tank, embedded 1.5 m below and extending 0.5 m above ground level, is insulated with a 5 cm layer of polystyrene and reinforced with solid clinker brick on cement mortar. The total height of the tank above ground level is 27 m, and its embedded depth is 10.0 m.
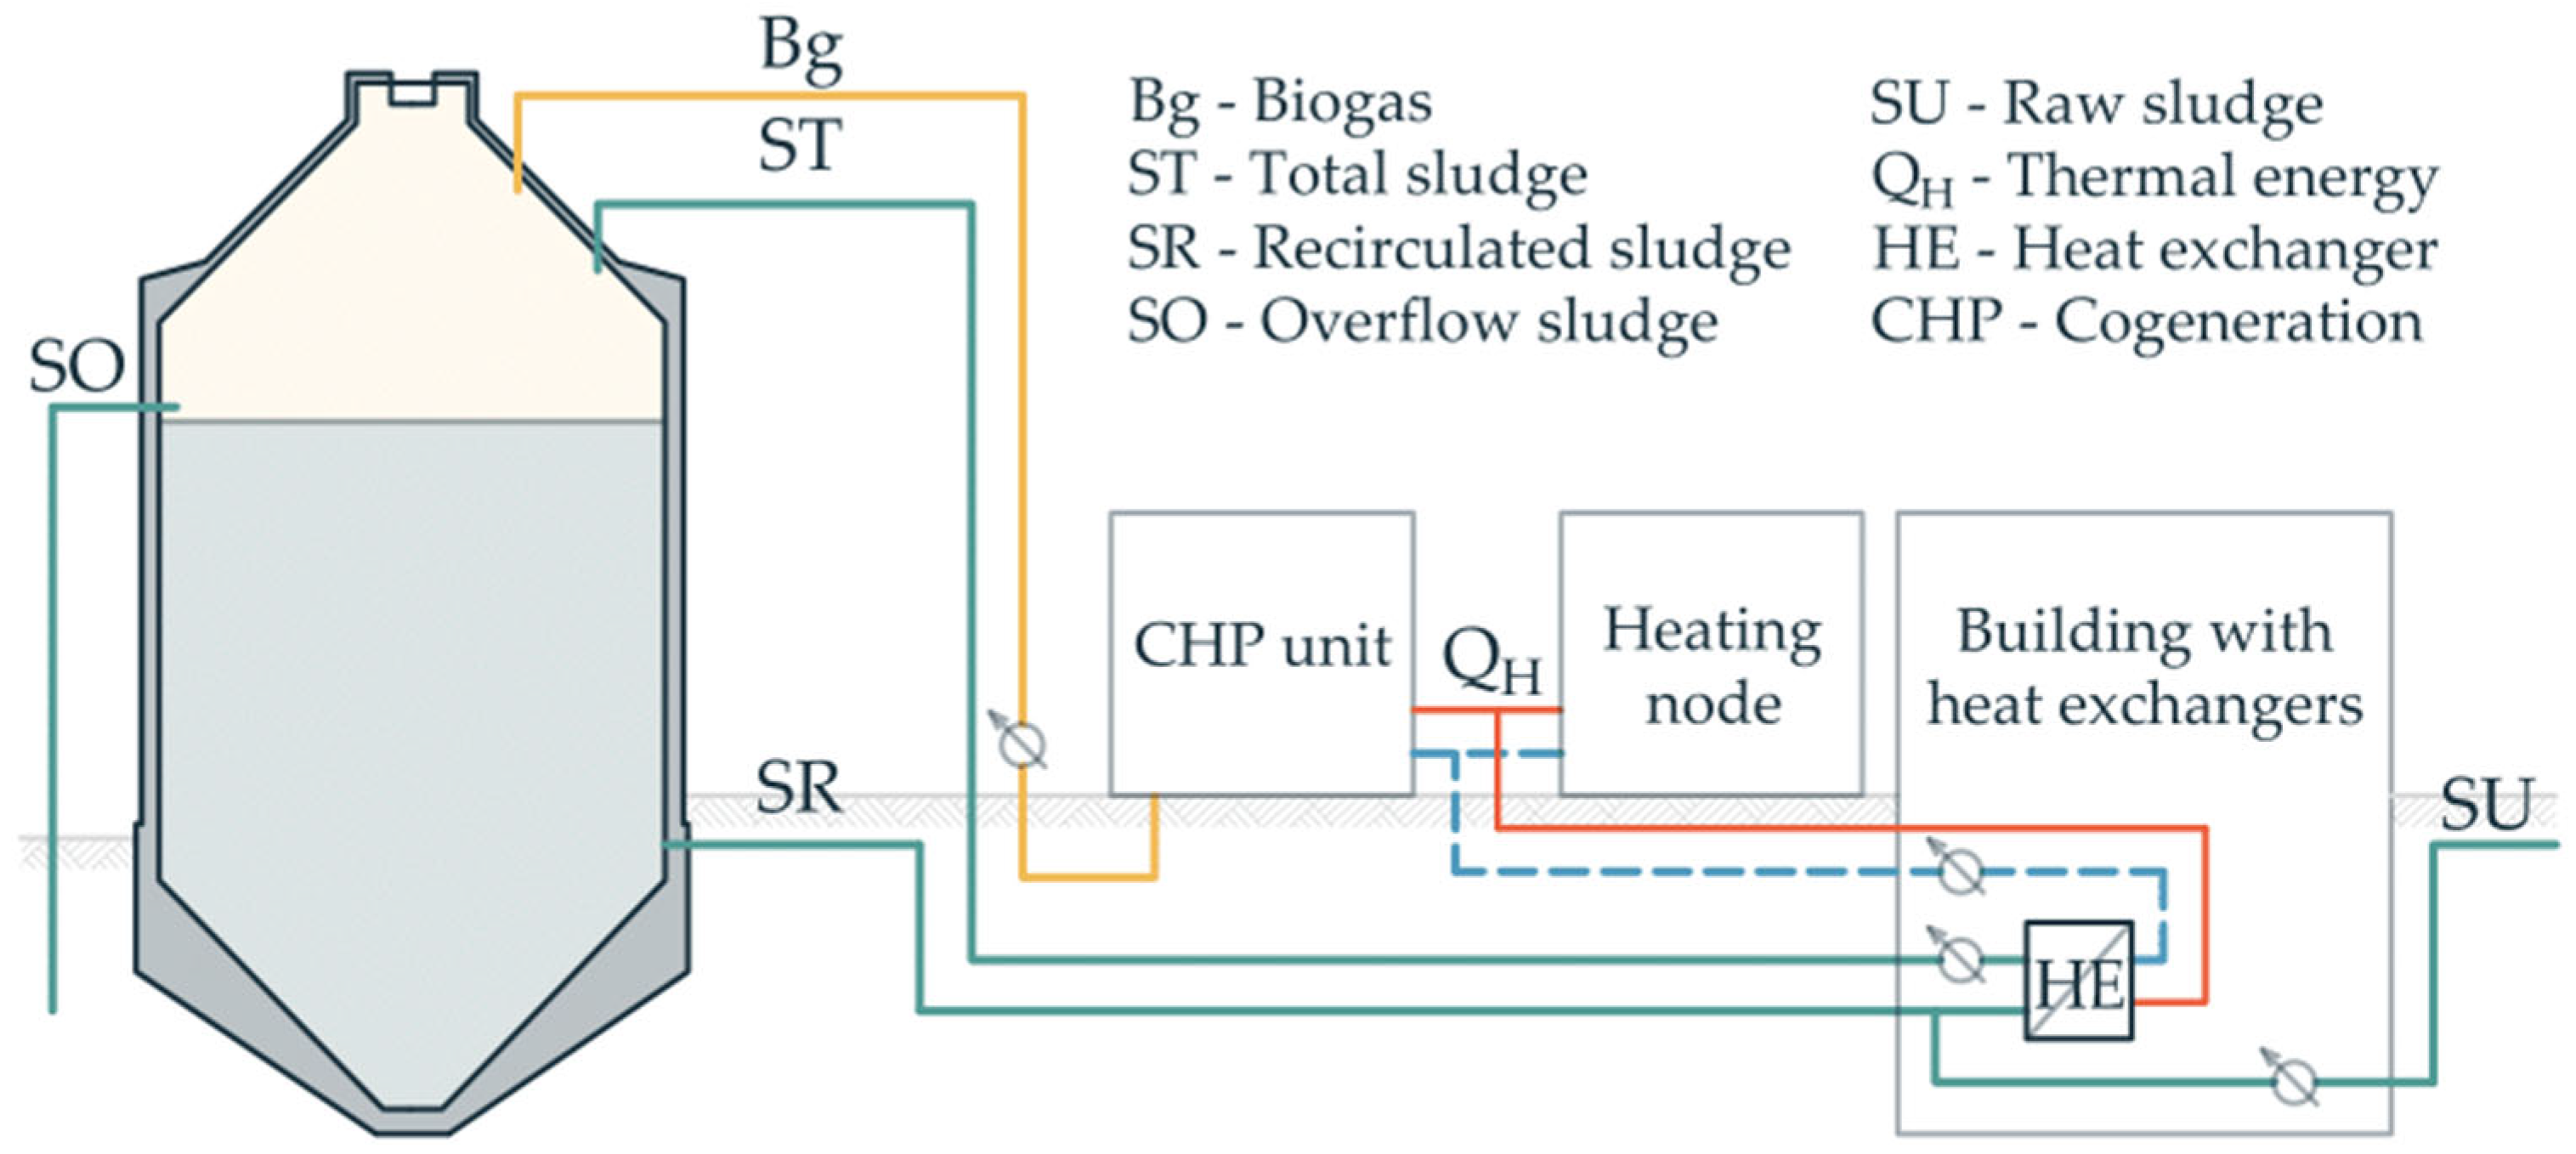
Due to the cylindrical shape of the AD and the method used to determine the heat transfer coefficient for this type of structure, the tank was divided into computational layers (A–J) characterized by a uniform construction. In addition, the sloped sections of the digester were divided into representative segments based on their distance from the central axis of the tank. The division of the digester into computational layers is shown in Figure 2.
Figure 2.
Division of the digester into computational layers (A–J).
2.2. Analytical Model
2.2.1. General Heat Balance Equation for the Anaerobic Digester
Thermal models developed in similar studies often include a single heat balance equation formulated for the entire reactor [26], assuming that the sludge and biogas temperatures are comparable. However, experimental research has shown that even in medium-sized digesters and under mild weather conditions, the temperature difference between biogas and sludge can exceed 10 K [27]. Therefore, in the present study, a computational approach described in detail by Hreiz et al. [15] was adopted, involving separate heat balance equations for the sludge and biogas phases, with the temperature of each phase assumed to be uniform.
The heat balance of the digester envelope in contact with the sludge was determined using Equation (1).
The heat balance of the digester envelope in contact with the biogas was determined using Equation (2).
Determining the heat balance for each phase required knowledge of the temperature of the working medium. The sludge temperature (TS) was adopted based on measurement data from 2024. However, the biogas temperature (TBg) was not measured, which made its determination necessary. For this purpose, Equation (3), describing the overall energy balance of the biogas phase, was applied to perform iterative calculations of the equilibrium temperature of the system.
It should be noted that in the developed model, radiative heat transfer to and from the biogas phase was neglected. This assumption is justified by the fact that gases have very low emissivity and, in most cases, are nearly transparent to infrared radiation.
2.2.2. Heat Transferred with Biogas
The heat carried away by biogas is described by Equation (4). In this equation, the initial biogas temperature was assumed to be equal to the sludge temperature (TS).
2.2.3. Convective Heat Transfer from Sludge to Biogas
The heat transferred by convection from sludge to biogas is described by Equation (5).
The contact surface area between sludge and biogas (AS-Bg) was assumed to be equal to the internal cross-sectional area of the digester. The convective heat transfer coefficient between sludge and biogas (hS-Bg) was calculated using Equation (6).
Considering the low biogas velocities, the effects of forced convection were neglected, assuming that the convective heat transfer coefficient (hS-Bg) results solely from natural convection. Accordingly, the Nusselt number (Nu) was determined based on the Rayleigh number (Ra) using Equation (7) [28].
In the analyzed case, natural convection was considered when the condition TS > TBg, was met, in which case the temperature difference ΔT was calculated as TS–TBg.
2.2.4. Transmission Heat Losses
The transmission heat losses were determined separately for the surfaces separating biogas from ambient air (Equation (8)), sludge from ambient air (Equation (9)), and sludge from the ground (Equation (10)).
The transmission heat transfer coefficient for cylindrical surfaces of the anaerobic digester is described by Equation (11), and for flat surfaces by Equation (12).
The thermal transmittance coefficient for the cylindrical surfaces of the anaerobic digester was calculated using Equation (13), and for the flat surfaces using Equation (14).
In the above calculations, the following values of thermal conductivity coefficients () were adopted: reinforced concrete 2.0 W/(m·K); clinker brick 0.8 W/(m·K); and metal sheet 50.0 W/(m·K). The thermal conductivity of polystyrene was assumed to be 0.05 W/(m·K), taking into account the deterioration of its physical properties during operation and possible installation imperfections. The model does not account for the effect of fouling on the heat transfer resistance due to the lack of reliable operational data that would allow its quantitative estimation.
The external convective heat transfer coefficient from the envelope to the air (hse) was determined according to the PN-EN 6946 [29] standard, similarly to the calculation of transmission heat losses in buildings. The thermal resistance of heat transfer to the ground was calculated based on the PN-EN ISO 13370 [30] standard.
The internal convective heat transfer coefficient from the biogas to the digester envelope (hsi) was determined using Equations (6) and (7). In this case, convection between the biogas and the envelope was considered when the condition TBg > Tsi was met, and the temperature difference ΔT was calculated as TBg–Tsi.
The internal convective heat transfer coefficient from the sludge to the digester envelope (hsi) was determined using Equation (6). Considering the sludge flow velocity (wS) of approximately 0.05 m/s (as the medium velocity zone [31]), the Nusselt number (Nu) was determined based on the Reynolds (Re) and Prandtl (Pr) numbers using Equation (15) [28].
2.2.5. Heat Losses Through Longwave Radiation to the Sky
The heat losses associated with longwave radiation to the sky for the digester envelope (QSky-S and QSky-Bg) were calculated using Equation (16), derived from the PN-EN 52016 [32] standard.
The values of the view factor (FSky) were assumed to range from 0.5 for vertical surfaces to 0.9 for horizontal ones. The external surface heat transfer resistance (Rse) was adopted in accordance with the standard [29] as 0.04 m2K/W. The sky temperature was estimated using Equation (17) [15]. The external solar radiation coefficient was calculated based on Equation (18).
2.2.6. Solar Heat Gains
The solar heat gains (QSol-S and QSol-Bg) were calculated using Equation (19), derived from the PN-EN 52016 [32] standard.
The values of the solar absorptivity coefficient (αSol) were assumed to range from 0.3 for the digester dome to 0.9 for the wall covered with clinker brick. The anaerobic digesters are located in an area without external shading; therefore, the value of the shading factor (FSh) was assumed to be 1.
2.2.7. Heat Transferred to Raw Sludge and Total Heat Losses of the Anaerobic Digester System
Using the measurement data (described in detail in the following section of the article), the amount of heat transferred in the heat exchanger to the raw sludge was calculated using Equation (20).
The information on the amount of heat supplied for heating the raw and recirculated sludge, as well as for covering the heat losses of the anaerobic digester (QH), made it possible to determine, using Equation (21), the total heat losses of the digester system (QAD). These losses represent the sum of the heat balance of the digester envelope (QAD) and the heat losses occurring between the heat exchanger and the anaerobic digester (QDist).
2.3. Input Data for Analysis
2.3.1. General Information
The input data for the analyses were obtained from the Building Management System (BMS). The system continuously recorded temperature and flow parameters in various parts of the anaerobic digester system, including the following:
- temperature of the raw sludge directed to the heat exchanger (TSU),
- temperature of the recirculated sludge (TSR),
- temperature of the overflow sludge from the anaerobic digester (TSO),
- temperature of the sludge supplied to the anaerobic digester (TST),
- volumetric flow rate of raw sludge (),
- volumetric flow rate of sludge supplied to the anaerobic digester (),
- volumetric flow rate of biogas (),
- amount of heat supplied to the heat exchangers (QH).
To determine the physicochemical parameters of the biogas, its composition was established based on analytical reports [33], according to which the main components of the biogas were as follows: methane (CH4) 60.19%, carbon dioxide (CO2) 34.78%, nitrogen (N2) 4.82%, and oxygen (O2) 0.21%. The physical parameters of biogas were assumed for a temperature of 30 °C, which was considered the expected annual average operating temperature of the biogas. The thermal expansion coefficient of biogas (βBg) was calculated as 1/(TBg + 273.15). Due to the high water content of the sludge, its thermophysical properties were assumed to be equal to those of water at the same temperature (corresponding to a temperature of 38 °C). The physical parameters of biogas and sludge are summarized in Table 1.
Table 1.
Physical parameters of biogas and sludge.
Meteorological data, including air temperature, wind speed and direction, and global solar radiation on a horizontal plane, were obtained from the NASA POWER database [34]. In this study, the TRNSYS 18 software was used as a solar radiation preprocessor. The calculations were carried out in the simulation environment, taking into account the local latitude of 51.1° N and the solar time correction resulting from the facility’s position relative to the standard meridian. The simulation (using model Type 16k) was carried out with a fixed time step of 1 h, consistent with the temporal resolution of the meteorological data retrieved from NASA POWER. The simulation enabled the conversion of the global horizontal irradiance (from NASA POWER) into the direct and diffuse components of solar radiation incident on the vertical walls and the sloped dome of the digester (for the cardinal and intercardinal directions: N, NE, E, SE, S, SW, W, NW). These hourly radiation values were imported into the analytical heat balance model as ISol in Equation (19) for the corresponding envelope components.
2.3.2. Data for the Heat Balance Assessment of the Anaerobic Digester System
In the analysis of the heat balance of the anaerobic digester (AD) system, measurement data from two of the six digesters—AD 1 and AD 3—were used. Their selection was considered representative, as they provided the most complete measurement datasets and differed in their distance from the heat source.
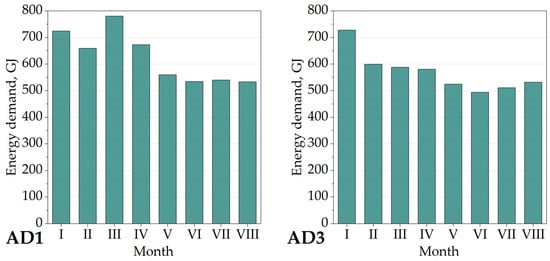
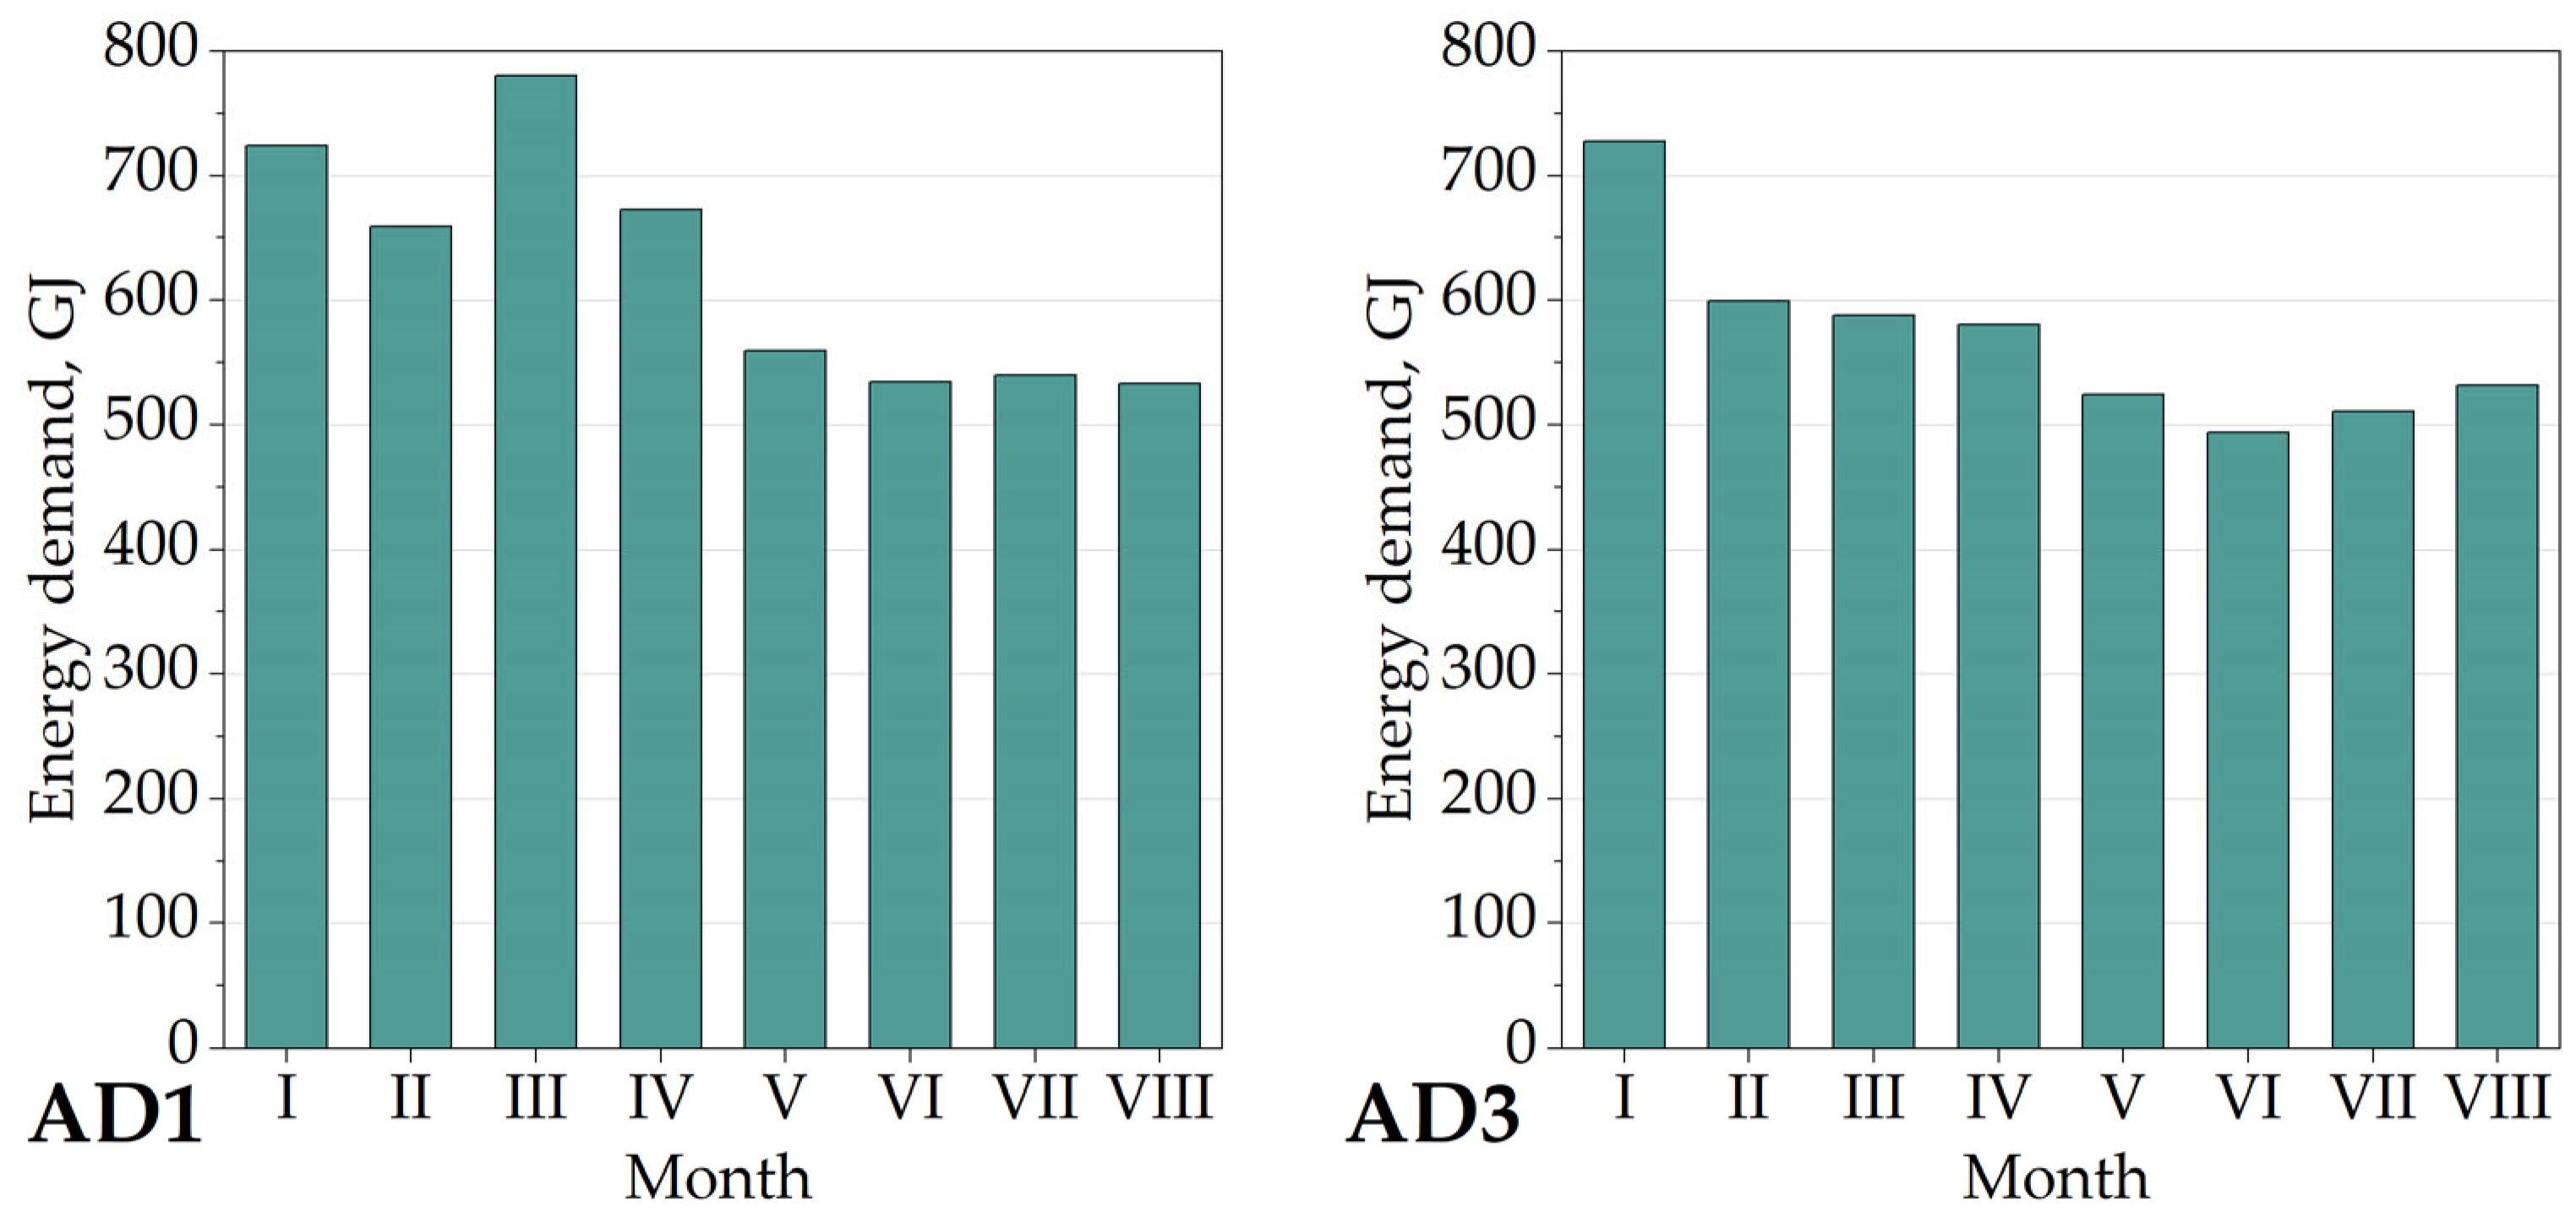
Figure 3 presents the monthly heat consumption recorded by the heat meters LC1 (AD 1) and LC3 (AD 3) during the period from January to August 2025. The highest values were observed in the winter months. As the ambient temperature increased, heat consumption gradually decreased, reaching its lowest values in the summer period.
Figure 3.
Monthly heat consumption (QH) recorded by meters LC1 and LC3 from January to August 2025.
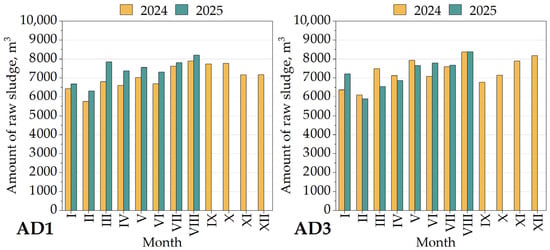
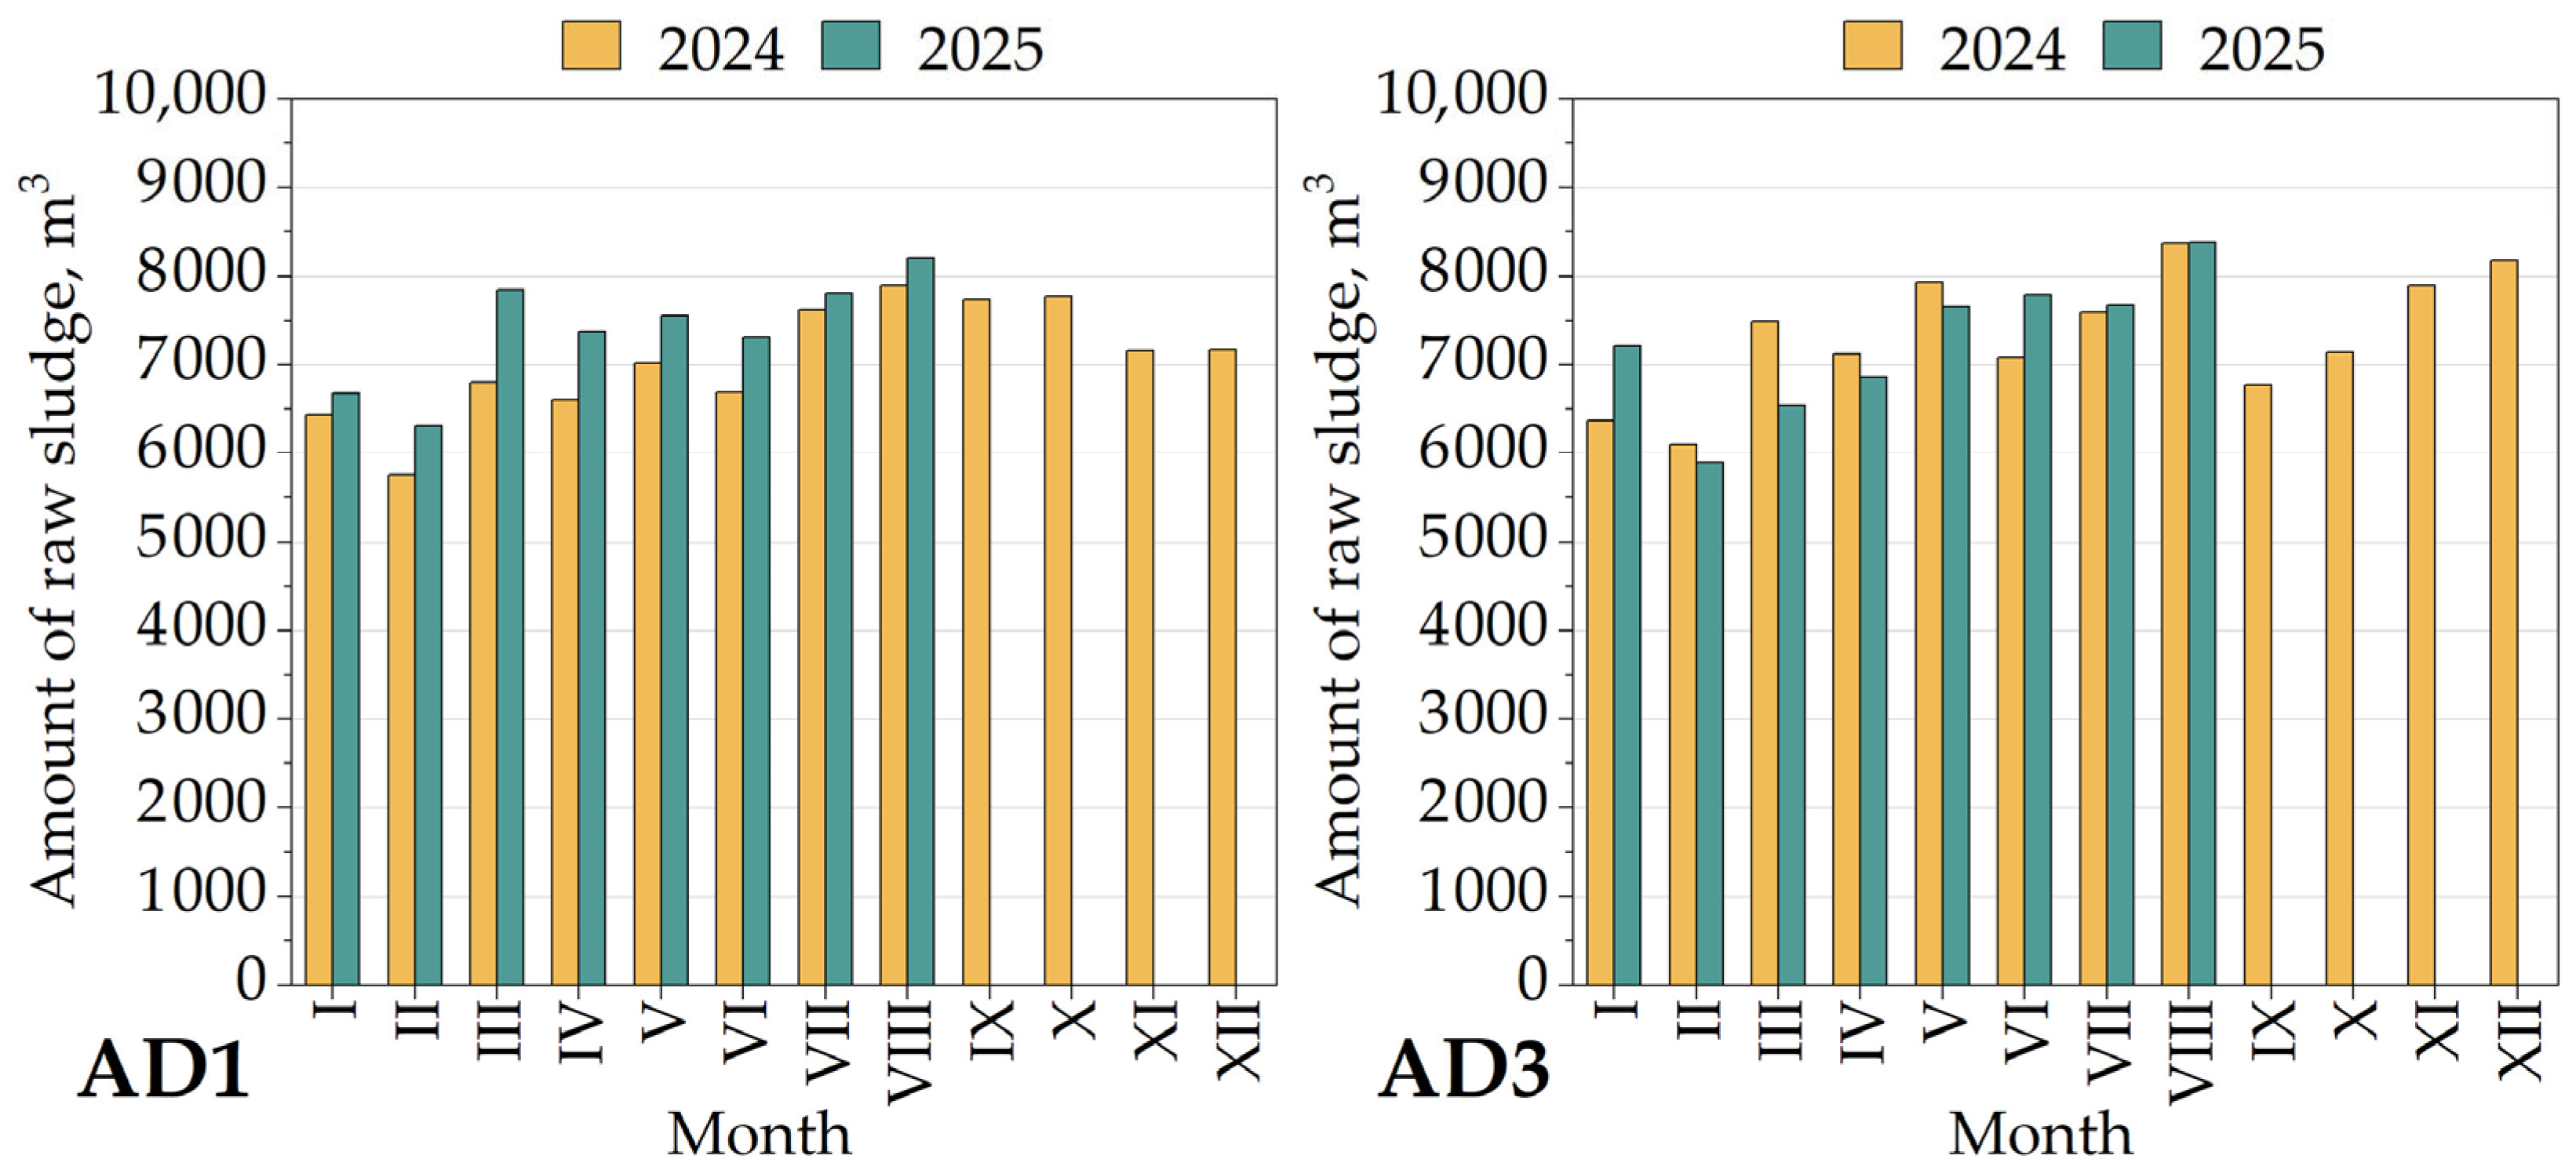
Figure 4 presents the volume flow rate of raw sludge () supplied to the anaerobic digesters AD 1 and AD 3 during the period from January 2024 to August 2025. The amount of sludge remained relatively stable, with minor variations between individual months and no significant seasonal trend observed.
Figure 4.
Volume flow rate of raw sludge () supplied to AD 1 and AD 3 from January to December 2024 and from January to August 2025.
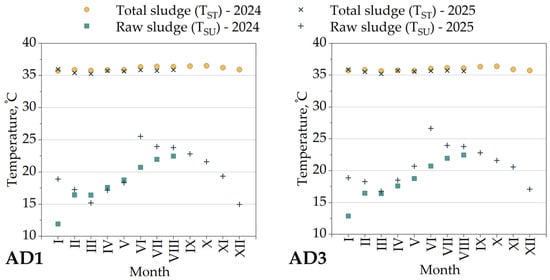
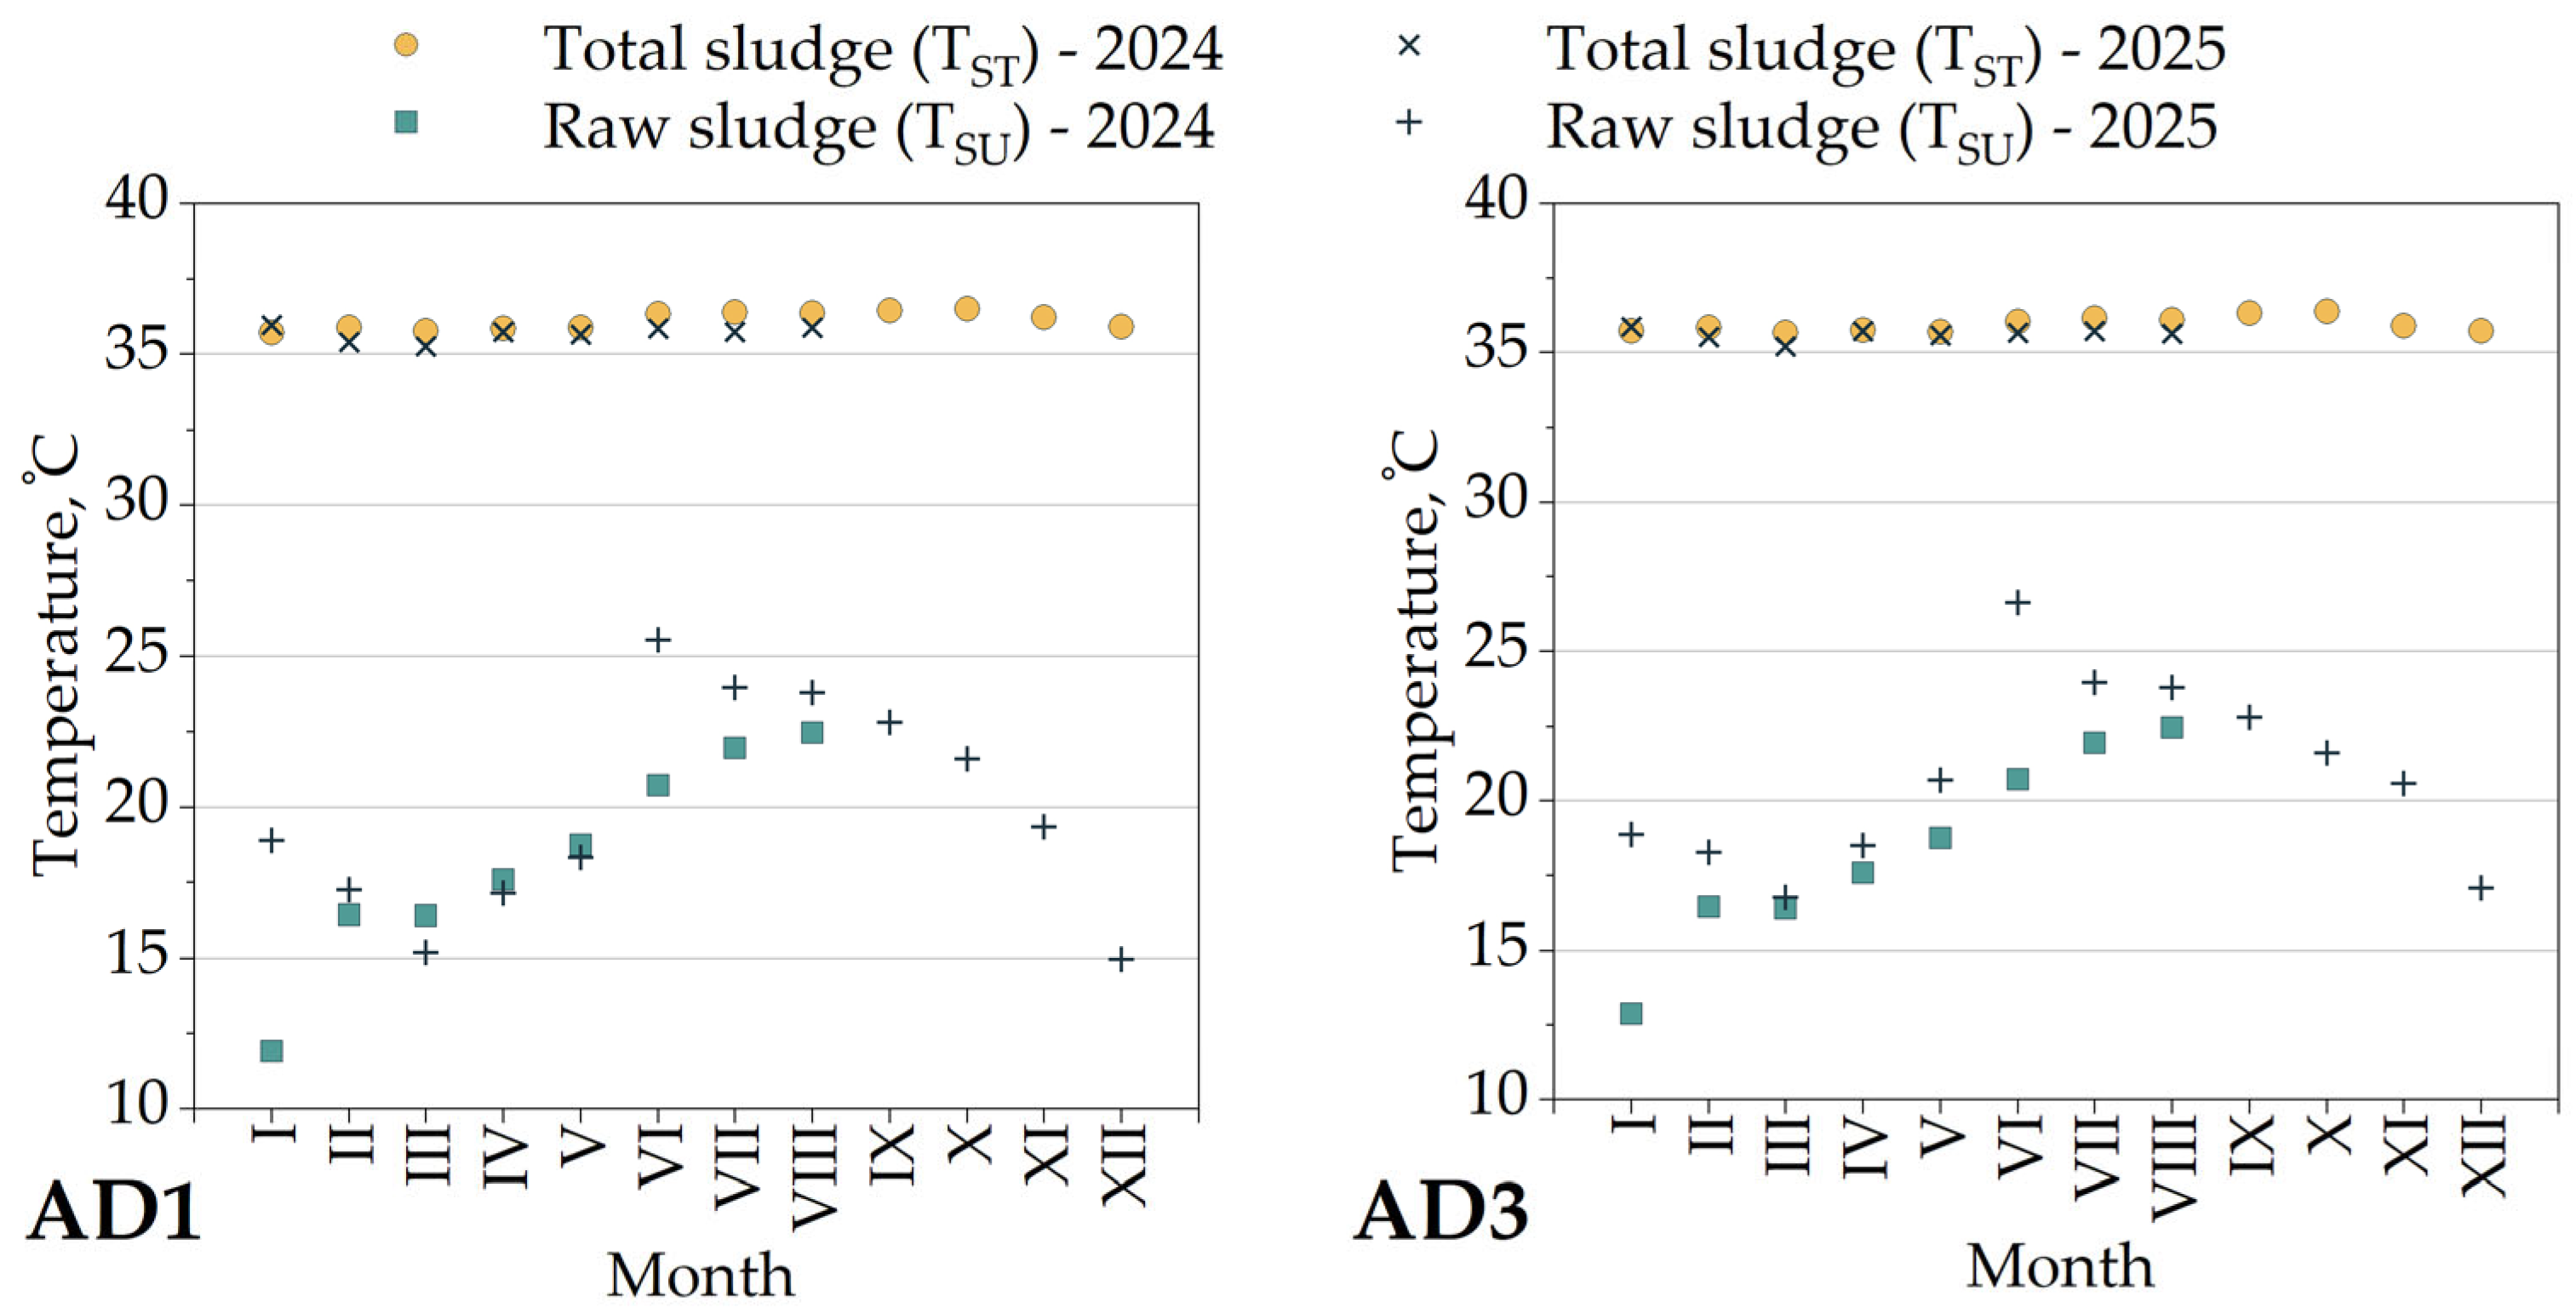
Figure 5 presents the temperature of the raw sludge supplied to the heat exchanger (TSU) and the temperature of the sludge (raw and recirculated) after the heat exchanger (TST), for digesters AD 1 and AD 3 in 2024 and 2025, respectively. A clear seasonal variation in the temperature of the raw sludge is observed, with more intensive heating required during the winter period.
Figure 5.
Temperature of raw sludge supplied to the heat exchanger () and temperature of raw and recirculated sludge after the heat exchanger () for AD 1 and AD 3 from January to December 2024 and from January to August 2025.
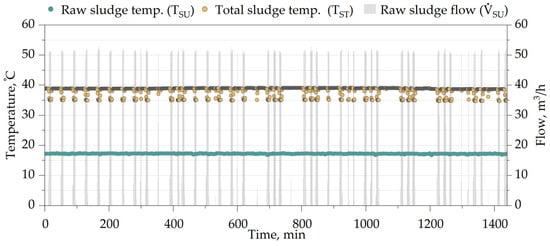
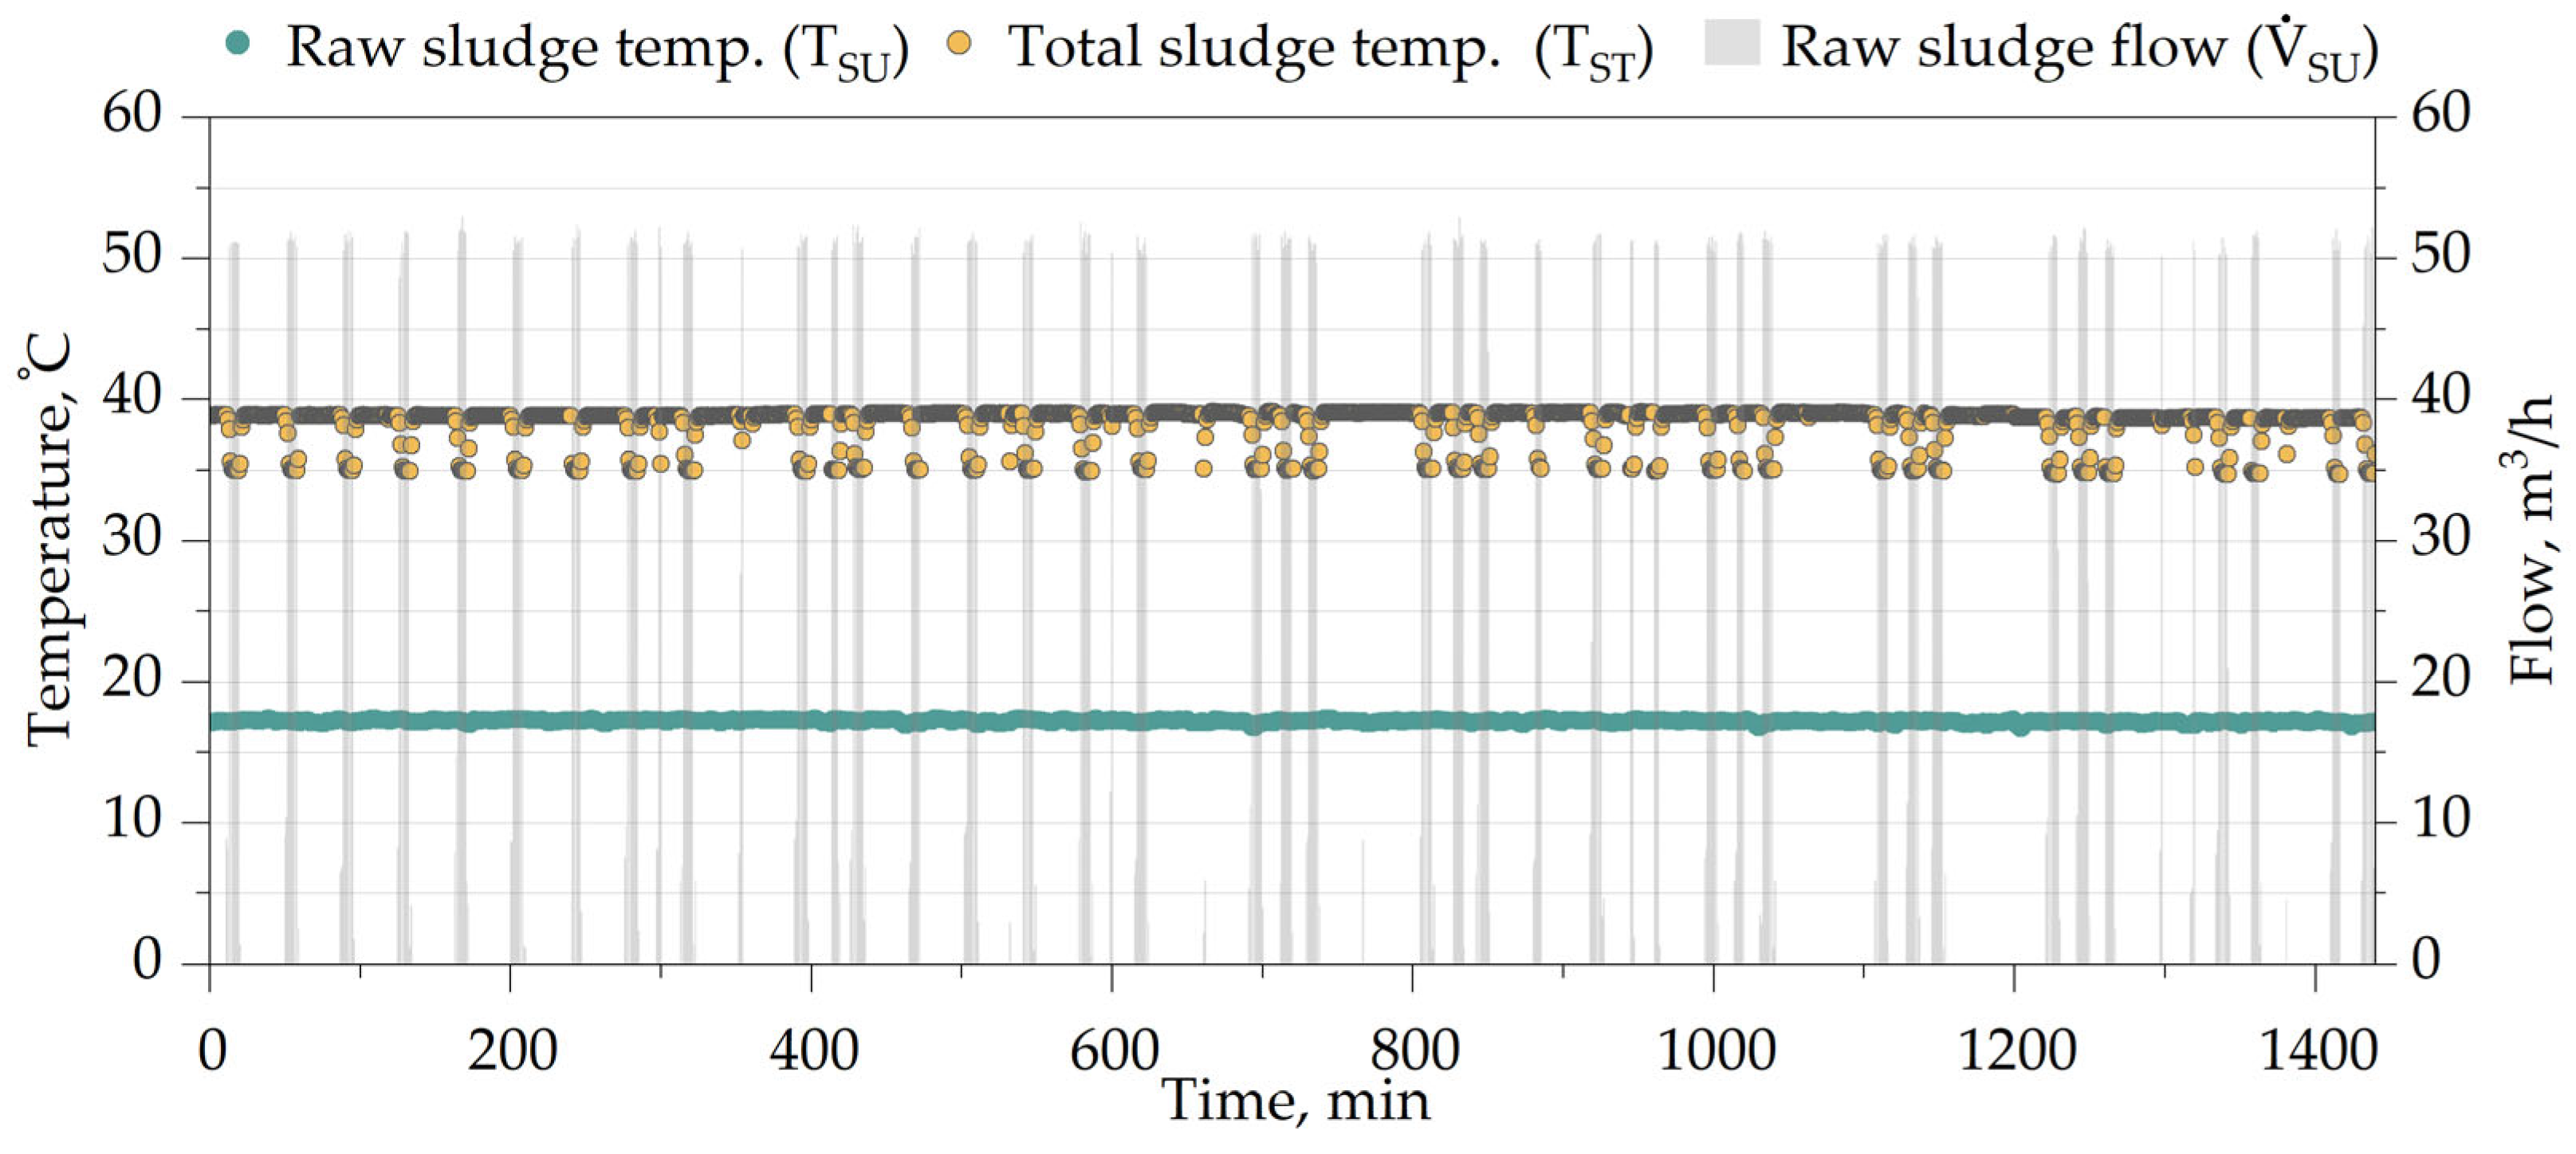
Figure 6 presents the minute-by-minute values of the raw sludge temperature (TST) sludge temperature after the heat exchanger (TSU), and instantaneous sludge flow rate (). Cyclical temperature changes are observed, reflecting the operational characteristics of the system. During raw sludge dosing periods, typically lasting from 7 to 10 min, a short-term decrease in the post-exchanger temperature can be observed. This drop results from the inflow of colder raw sludge, which temporarily lowers the temperature of the medium subsequently directed to the anaerobic digester (AD). In the analyzed cycles, the minimum sludge temperature after the heat exchanger reaches approximately 35 °C, which influences the amount of heat transferred to the raw sludge, as accounted for in the calculations.
Figure 6.
Typical daily variation in minute-by-minute raw sludge temperature and flow rate (TSU, ) and sludge temperature after the heat exchanger (TST) on 10 December 2024.
2.4. Input Data for the Heat Balance Simulation of the Anaerobic Digester
The heat balance calculations for the anaerobic digester (AD) tank were performed on an hourly basis using meteorological data from 2024. Weather data were obtained from the NASA database [34]. Table 2 presents the mean monthly and annual values of ambient air temperature (TAtm), wind speed (w), and daily solar irradiation (ISol) for the wastewater treatment plant area.
Table 2.
Weather data adopted for the heat balance simulation of the anaerobic digester (average monthly values).
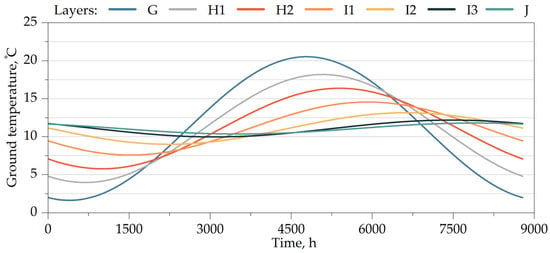
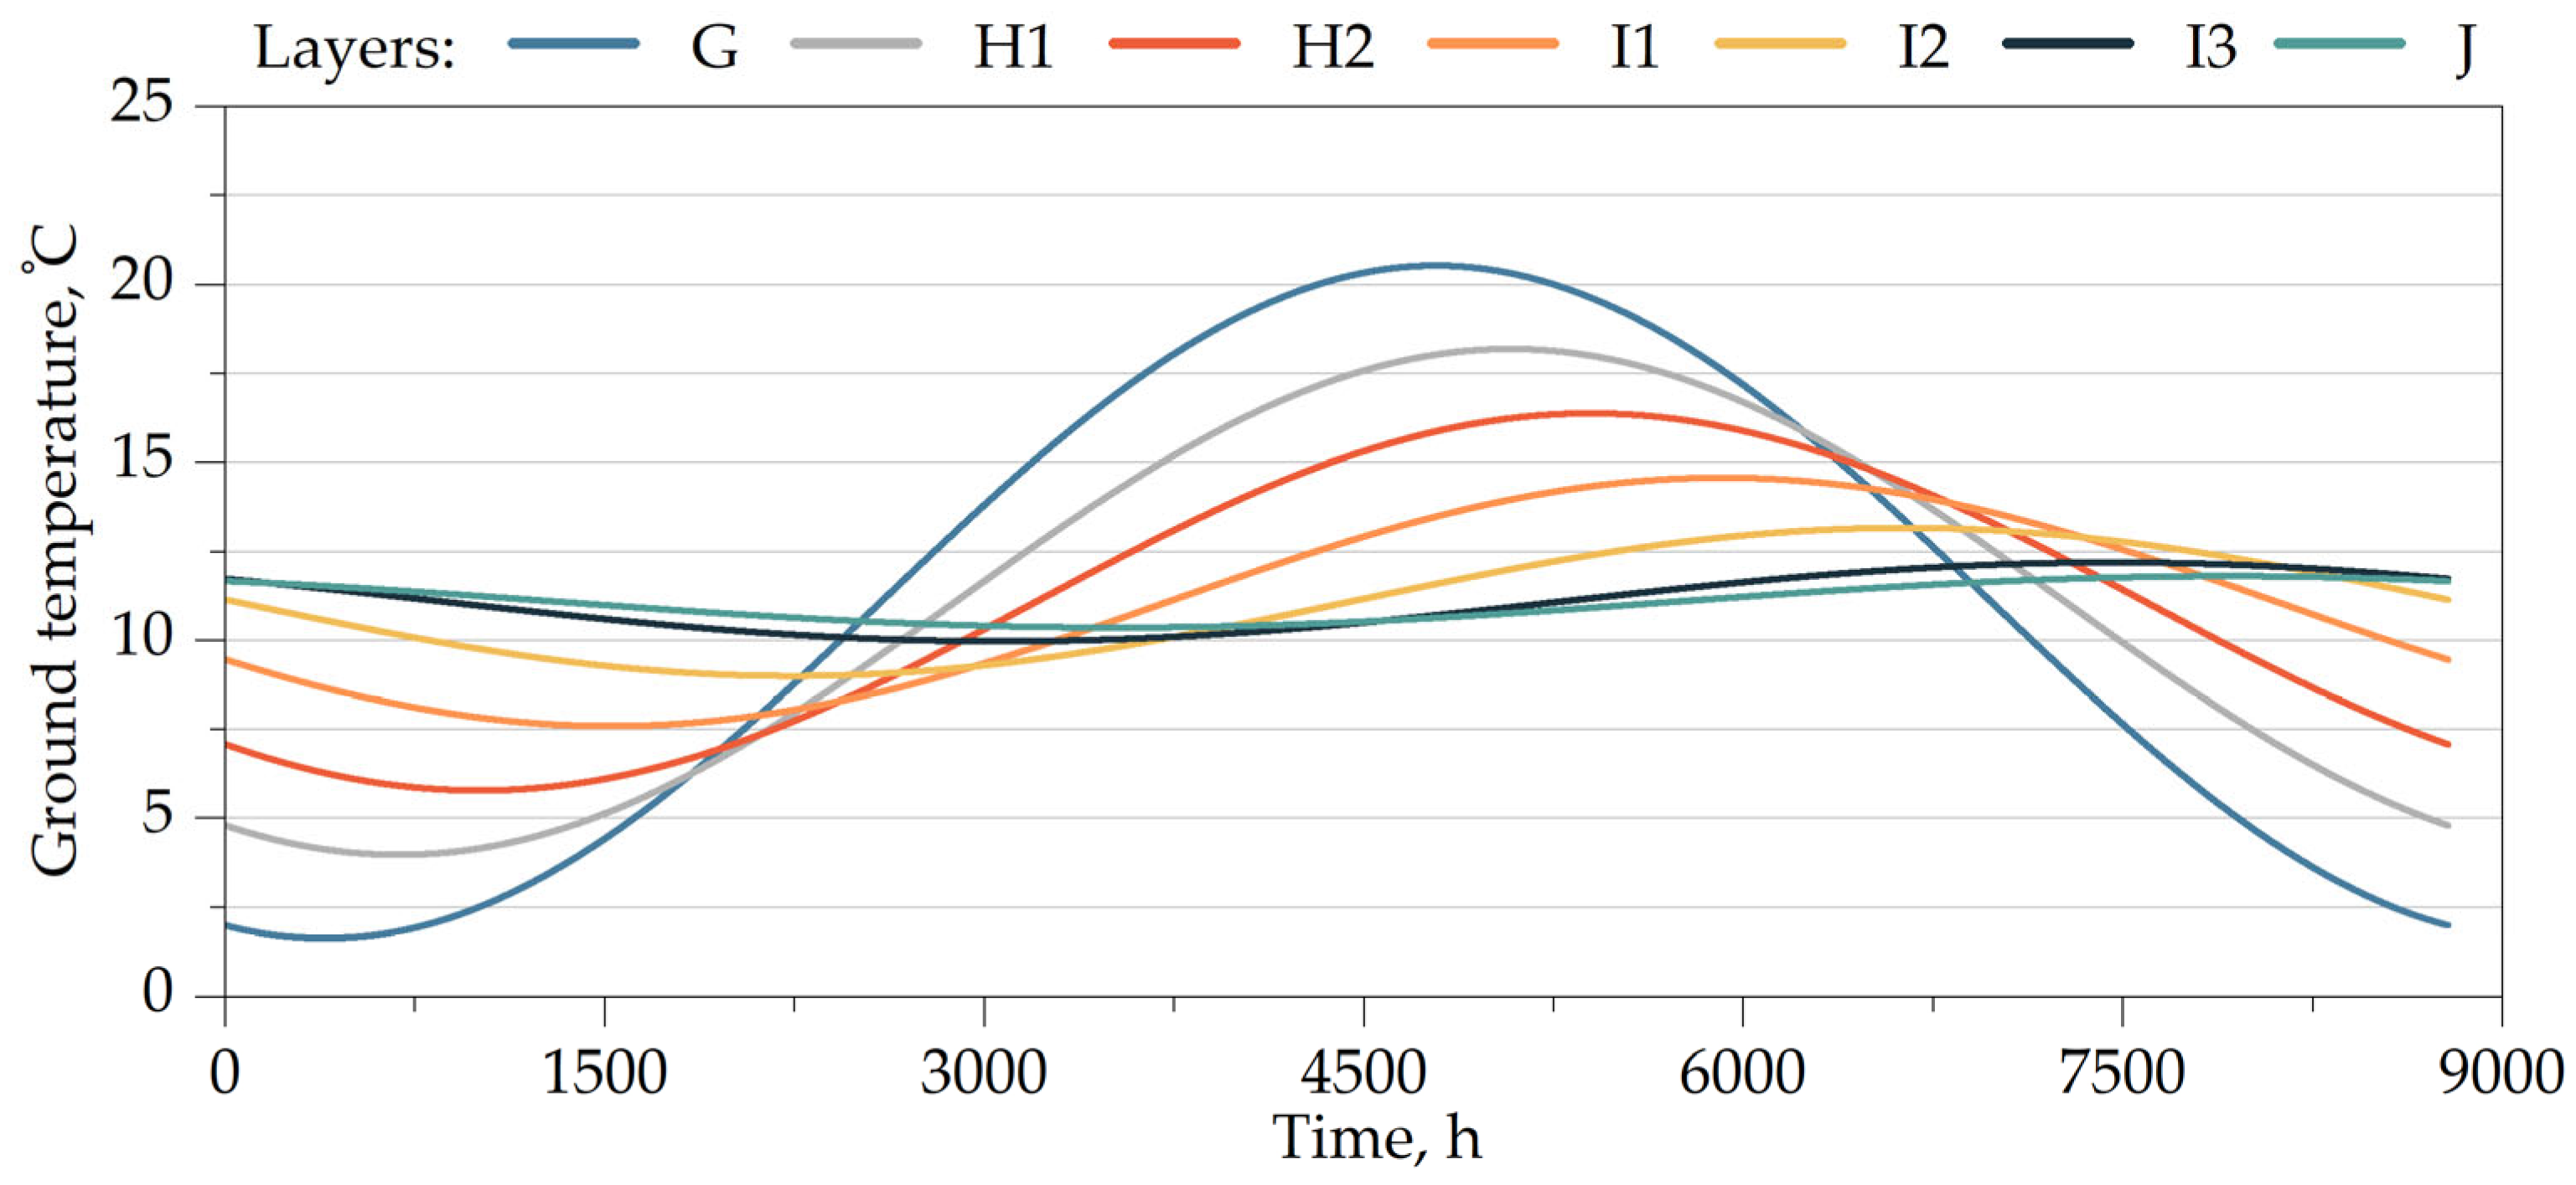
The ground temperature values (), necessary to determine the heat losses of the buried section of the anaerobic digester, were calculated on an hourly basis according to EN 15241 [35] for depths corresponding to the midpoints of each designated envelope layer: G, H1, H2, I1–3, and J. The variation in ground temperature at different depths, based on the 2024 meteorological data, is presented in Figure 7.
Figure 7.
Ground temperature profile () at different depths from 1 January to 31 December 2024.
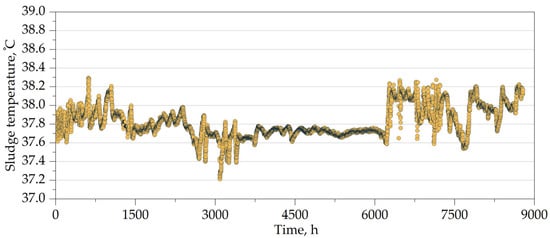
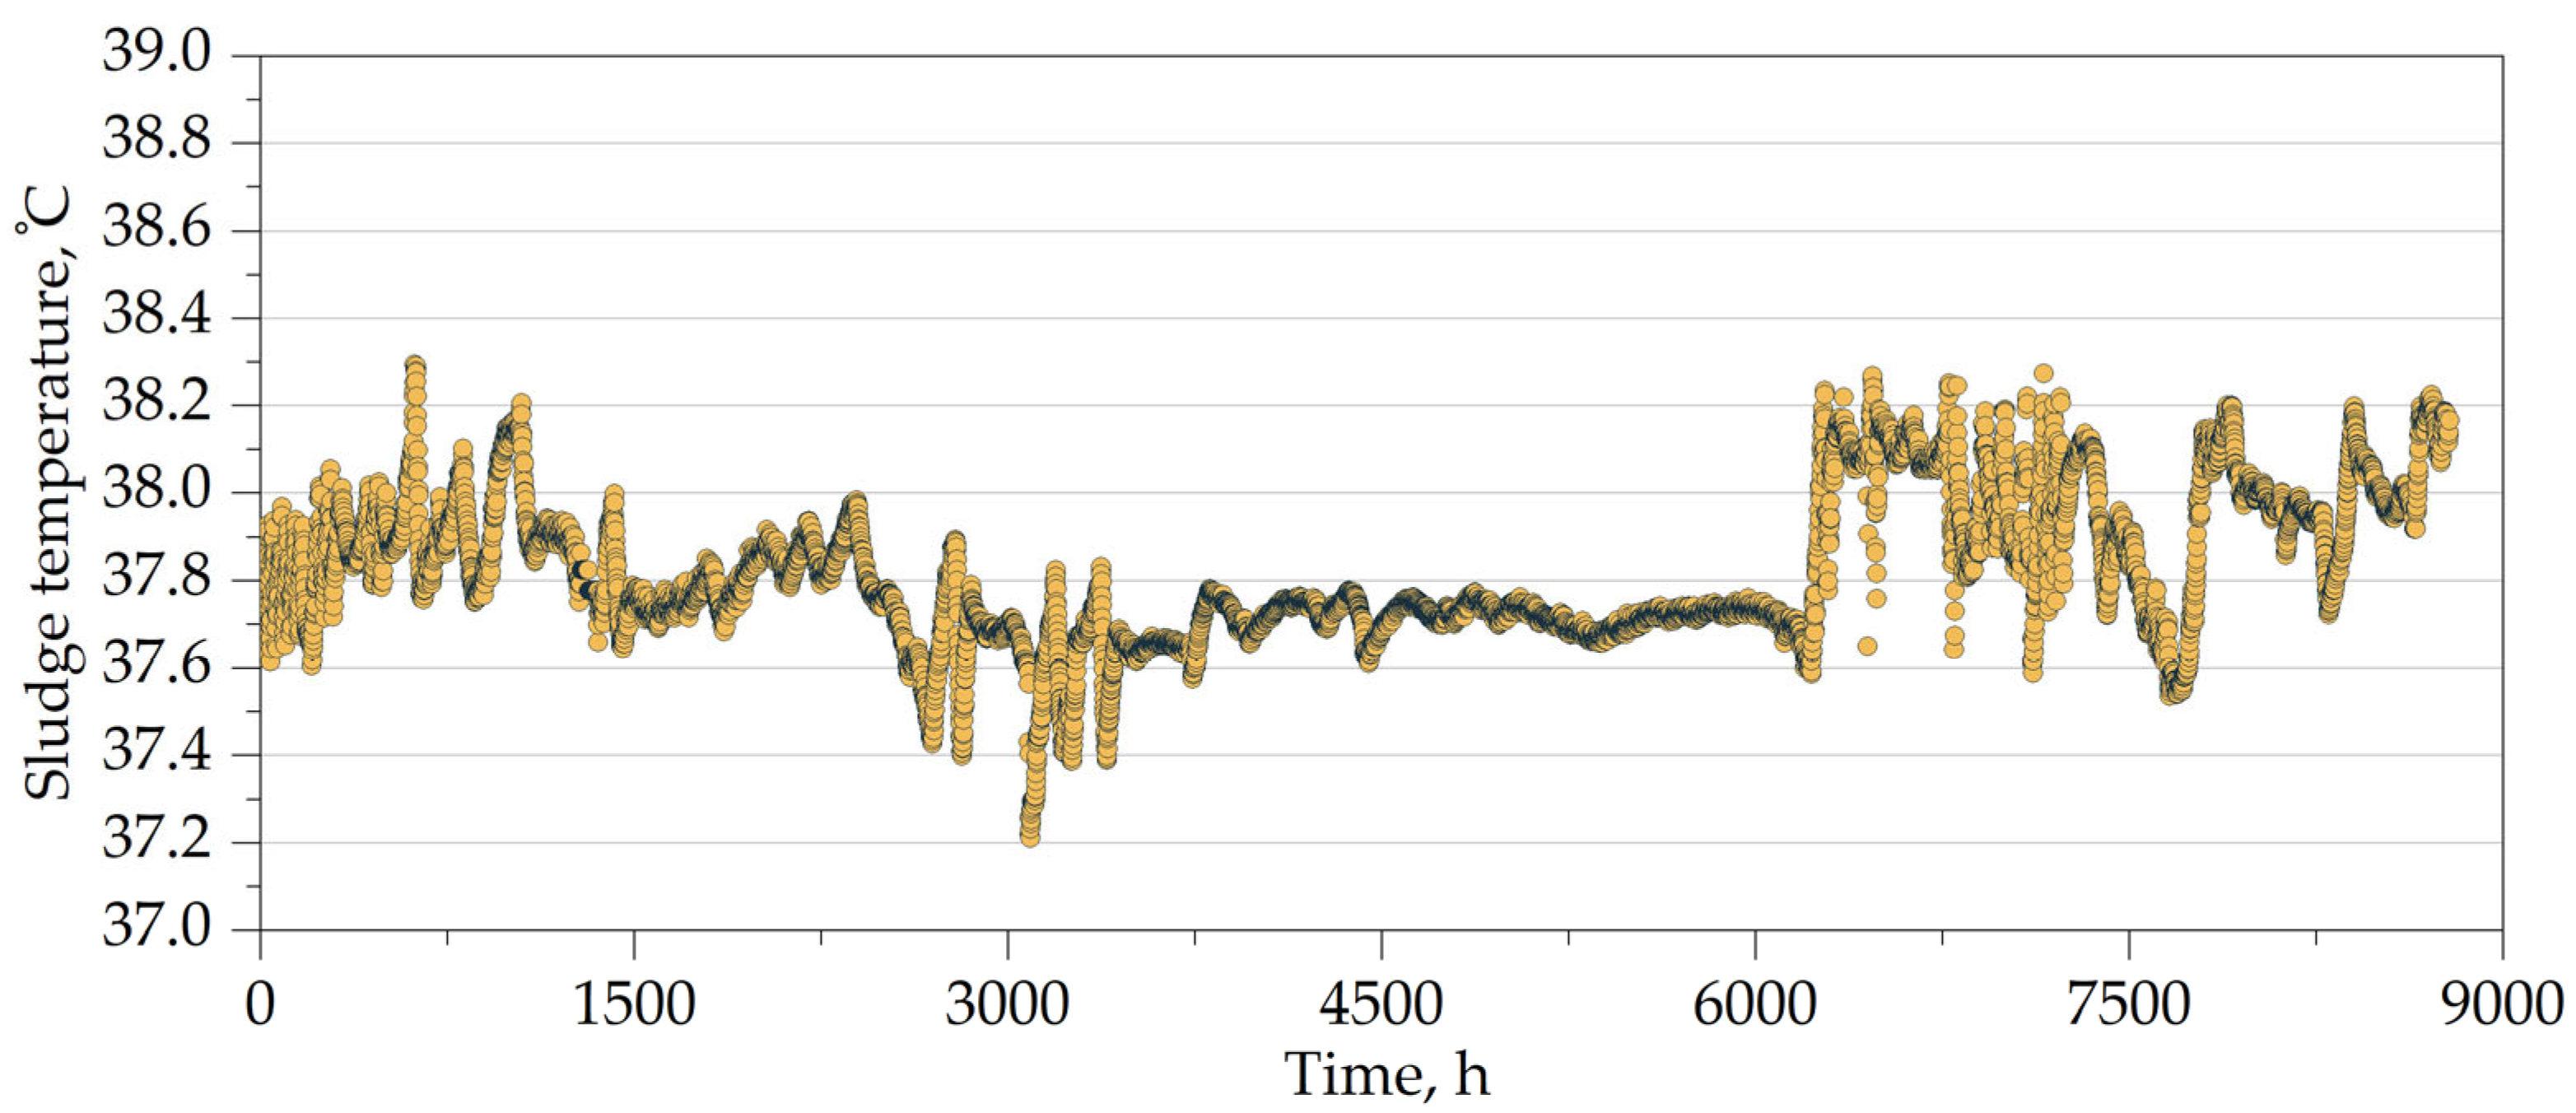
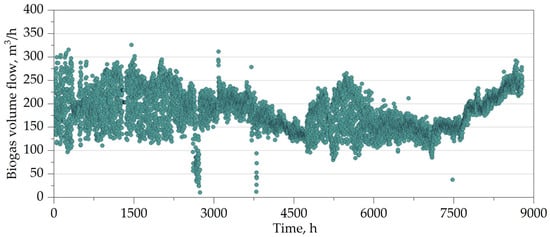
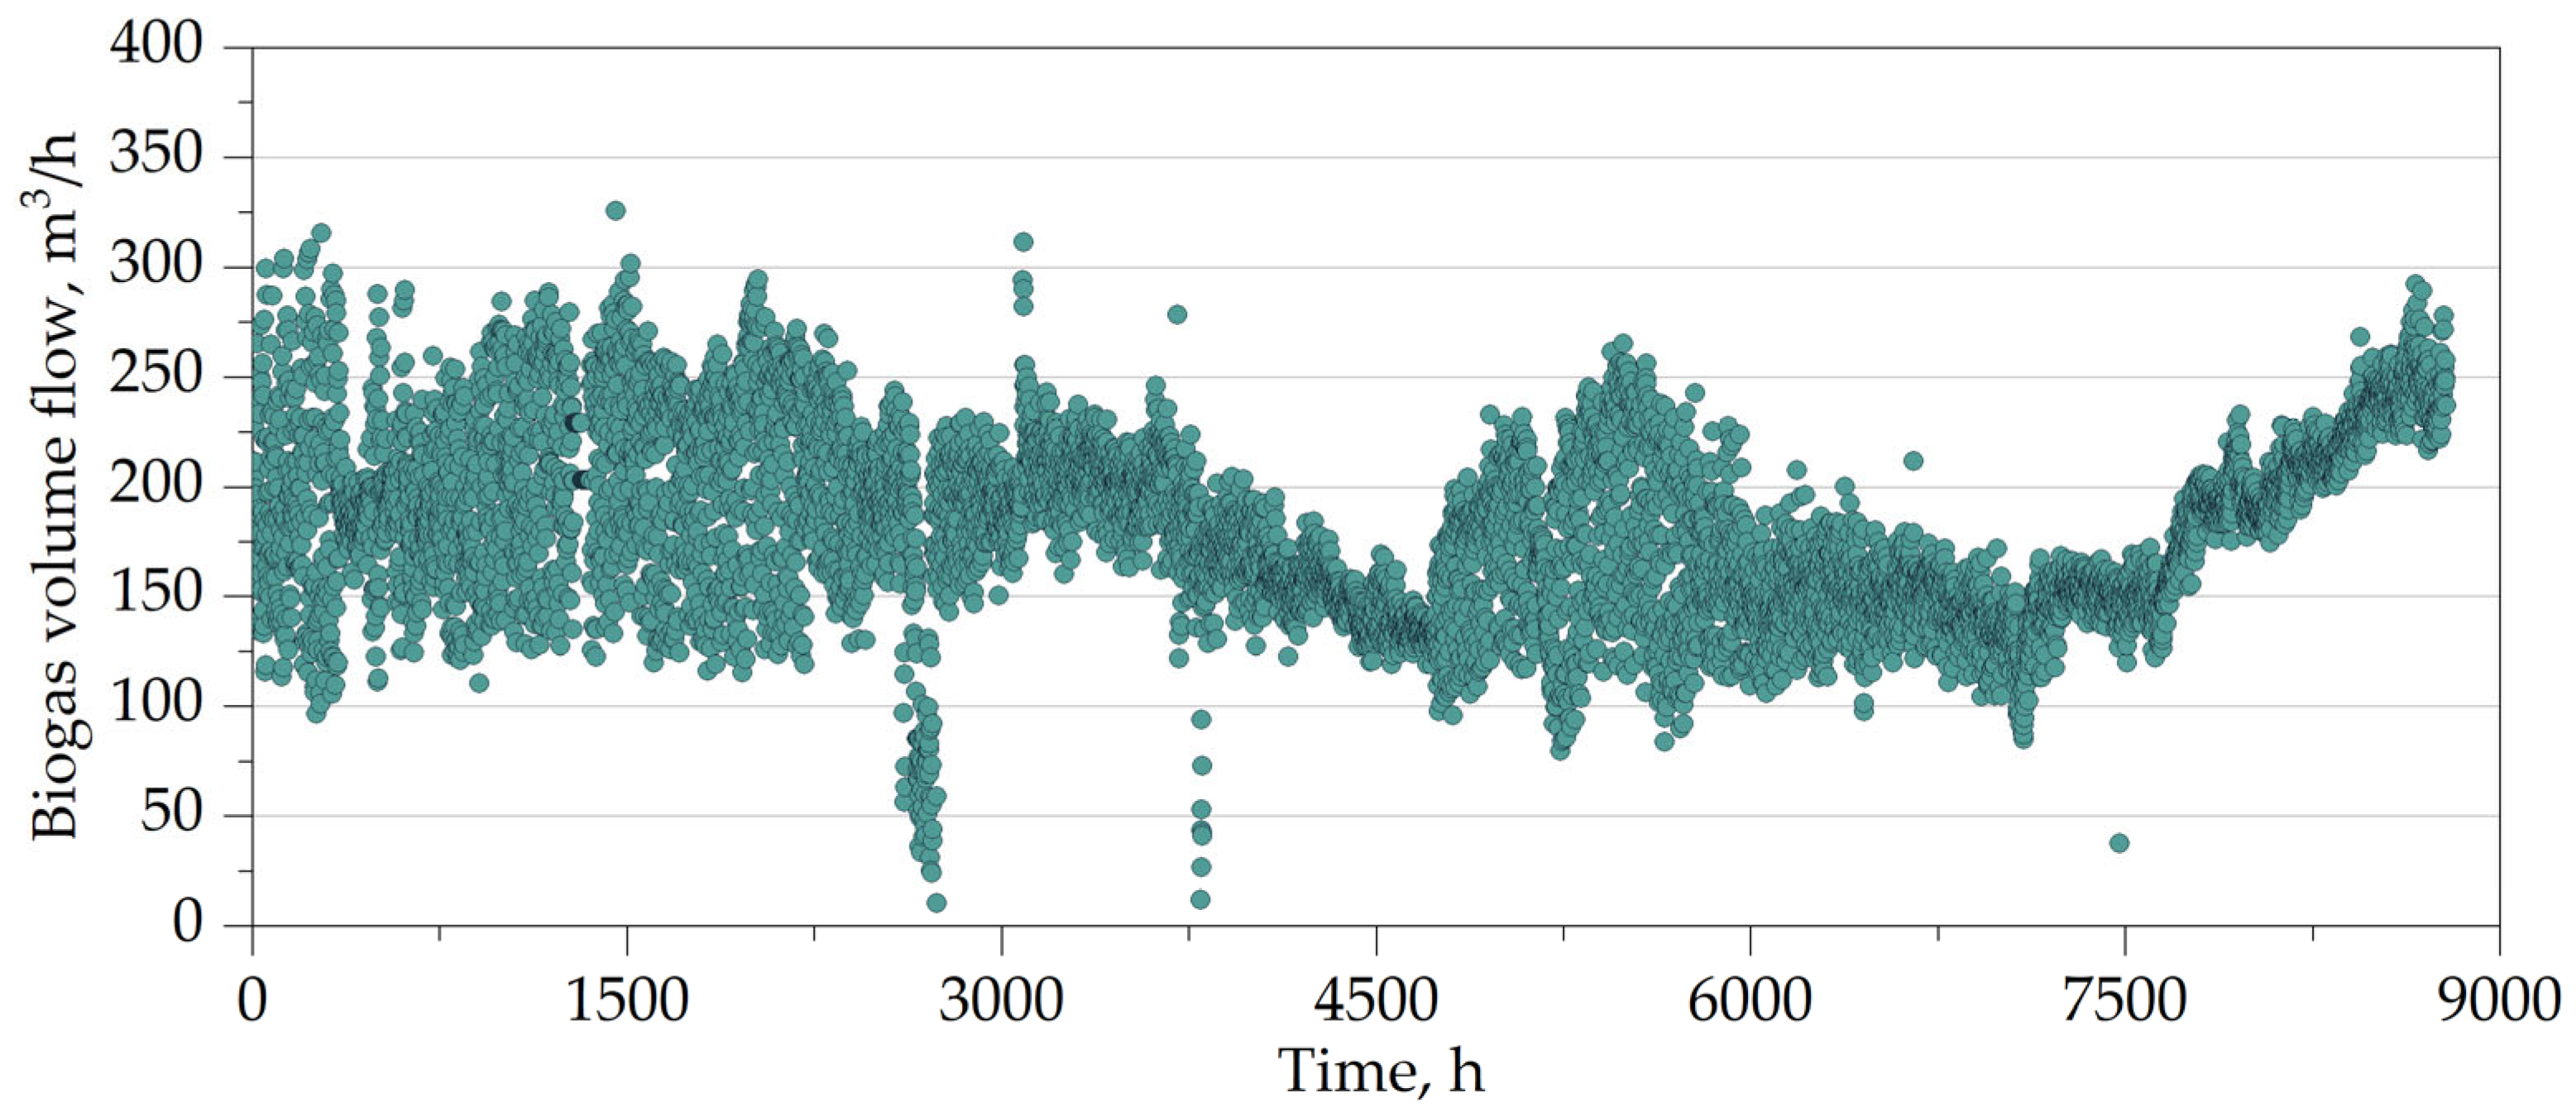
In the heat balance analysis, dynamic operating conditions of the anaerobic digester were assumed. The sludge temperature (TS) inside the reactor and the biogas flow rate () discharged from the reactor were adopted based on the measured values from 2024 at the outlet of AD 3. These values are presented in Figure 8 and Figure 9.
Figure 8.
Recirculated sludge temperature (TSR) measured in AD 3 from 1 January to 31 December 2024.
Figure 9.
Biogas flow rate () discharged from AD 3 from 1 January to 31 December 2024.
As can be observed, during the winter period, the sludge temperature at the outlet of the digester exhibits greater variability, which may be attributed to the influence of atmospheric conditions. However, it should be noted that the temperature inside the digester remains relatively stable throughout the year, with a minimum value of 37.2 °C and a maximum value of 38.3 °C.
3. Results
3.1. Heat Transfer Coefficients
For each designated computational layer of the anaerobic digester (Figure 2), the following parameters were determined: heat exchange surface area calculated based on the external dimensions (A); thermal transmittance coefficient referred to the heat exchange surface (k), and total transmission heat transfer coefficient (HT). The results of these calculations are summarized in Table 3.
Table 3.
Summary of surface areas (A), average thermal transmittance coefficient of the group of layers (k), and total transmission heat transfer coefficient (HT) for individual envelope layers of the anaerobic digester.
It was found that the average thermal transmittance coefficient of the anaerobic digester envelope is 0.44 W/(m2·K). The aboveground part of the tank is significantly better insulated than the underground section. The mean thermal transmittance coefficient for the aboveground portion is 0.41 W/(m2·K), while for the underground portion—after accounting for the thermal resistance of the soil—it is 0.53 W/(m2·K).
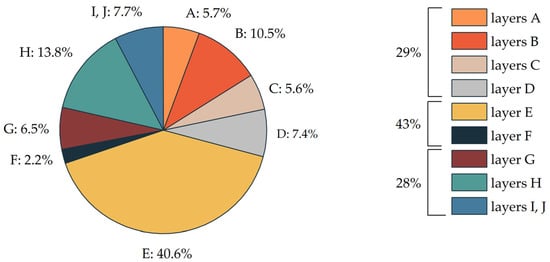
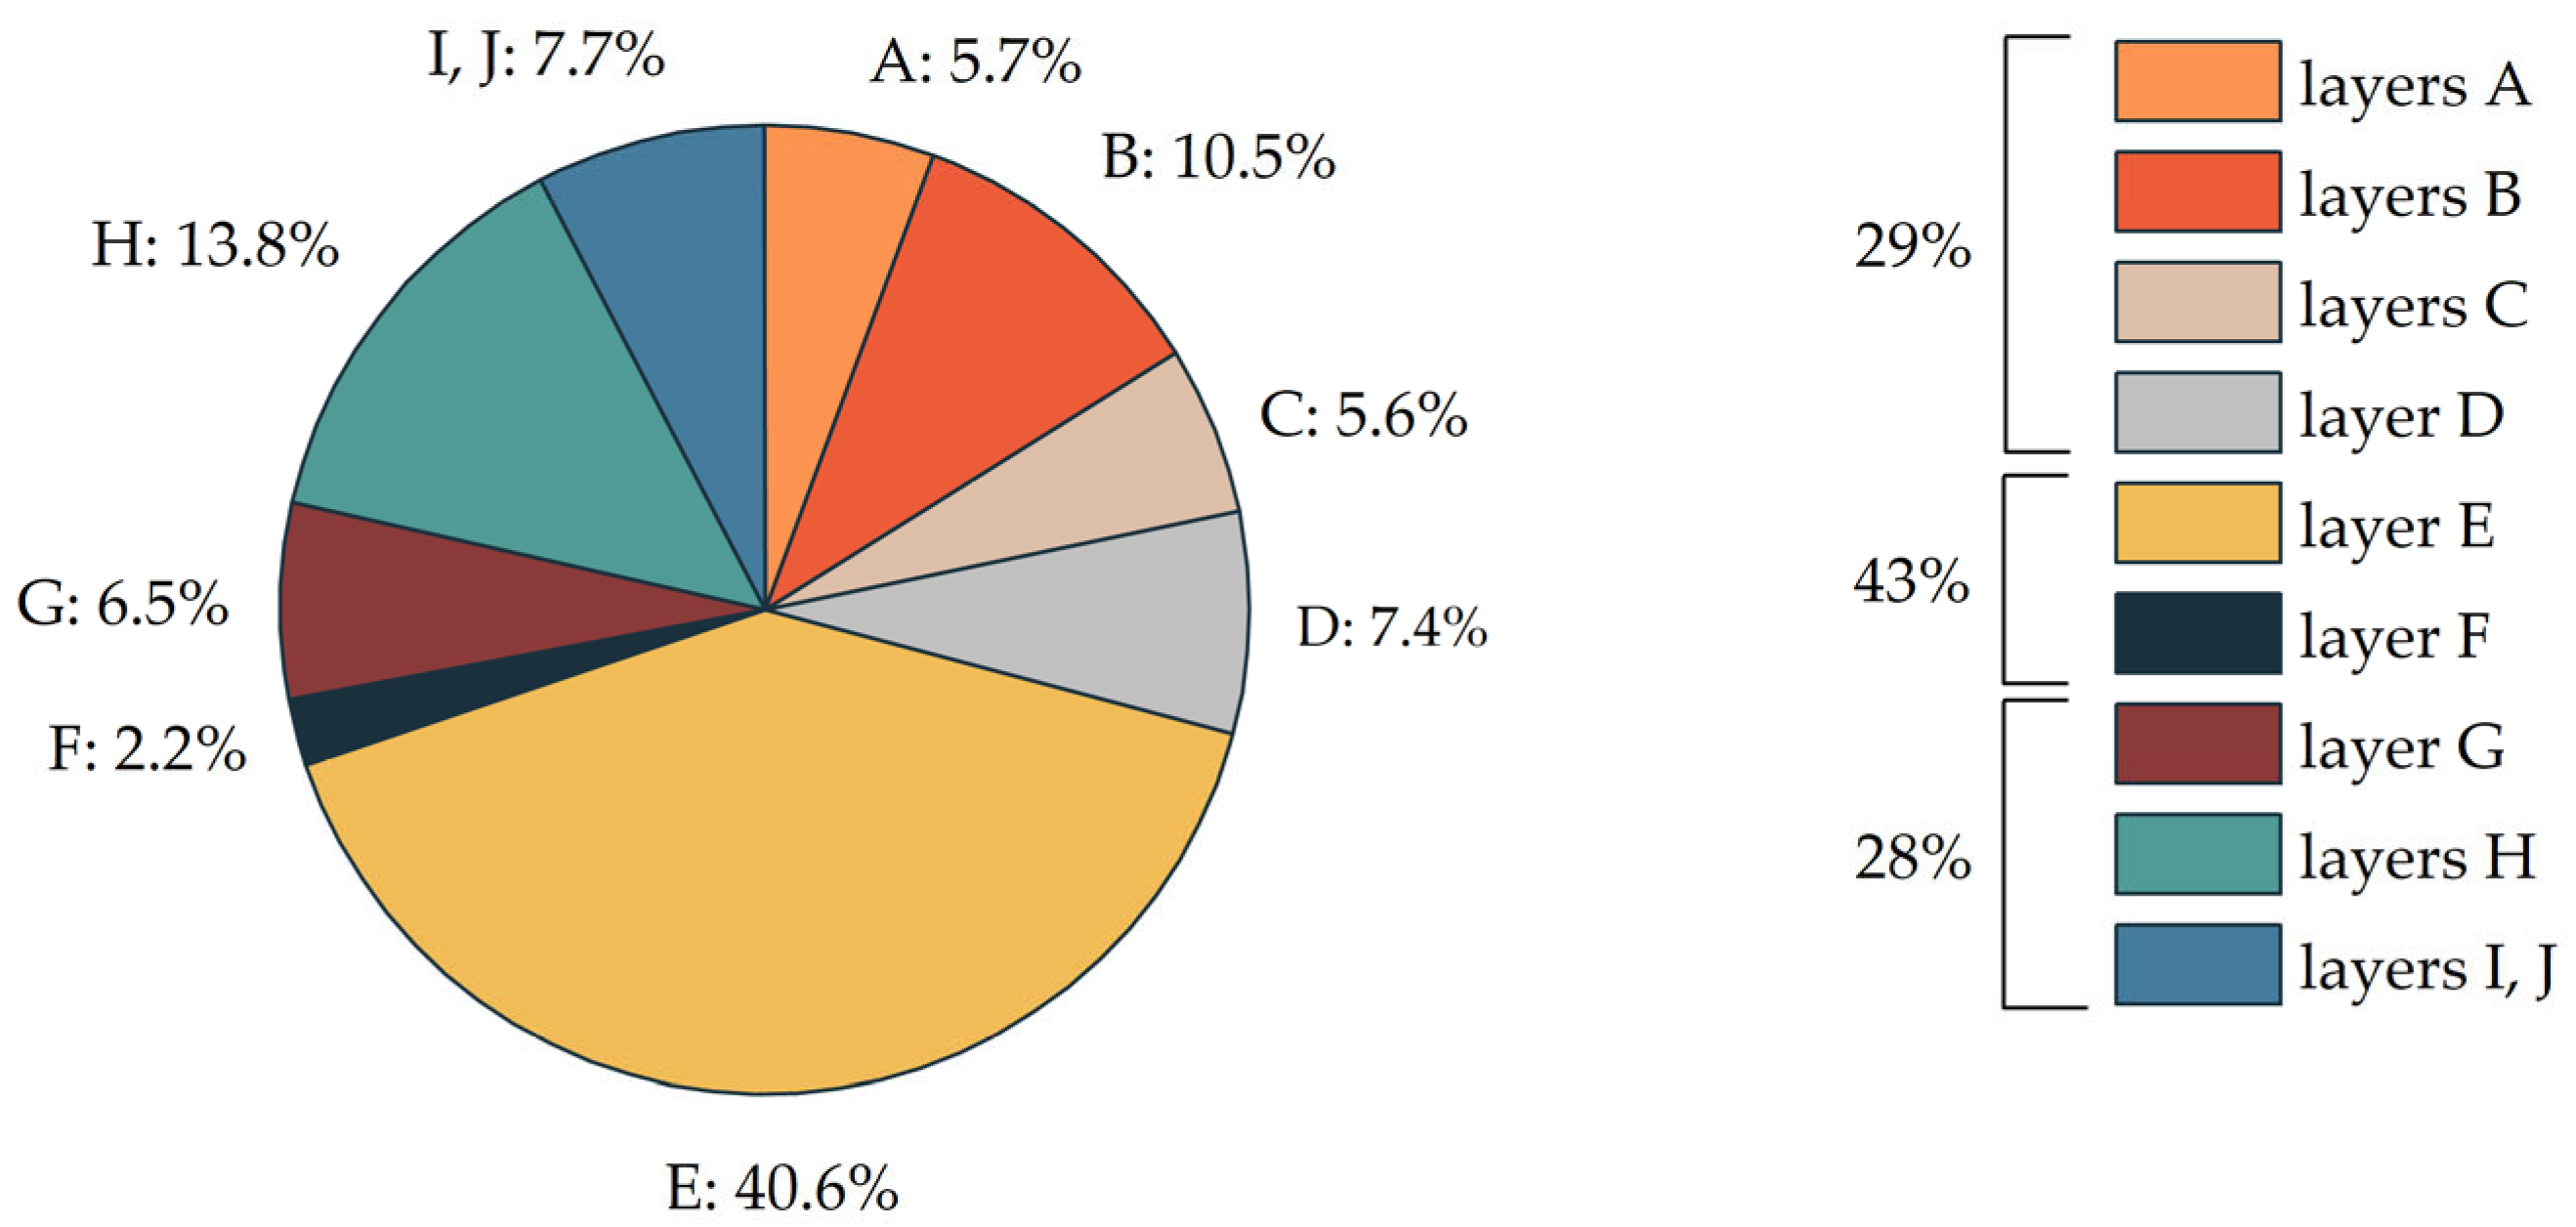
Particularly important is the analysis of the transmission heat transfer coefficients (HT) for individual components of the digester, as these values provide a good indication of the magnitude of heat losses generated by each part. Therefore, Figure 10 presents the contribution of individual digester components to the total heat transfer coefficient for the entire system.
Figure 10.
Contribution of individual layers of anaerobic digester components to the total heat transfer through transmission (HT).
The largest contribution to the total value of the transmission heat transfer coefficients (HT) is associated with the partitions separating the sludge from the ambient air, accounting for 43%. This results from the very large surface area of this part of the tank, which represents 44% of the total heat exchange area. The partitions in contact with the ground contribute 28% to the total HT value, mainly due to the lack of insulation in this section of the tank and its considerable heat exchange surface area (the ground-contact partitions constitute 23% of the total digester envelope area). The heat transfer associated with the partitions separating the biogas from the external air accounts for 29% of the total HT value, with this surface representing 24% of the total heat exchange area of the anaerobic digester.
3.2. Biogas Temperature
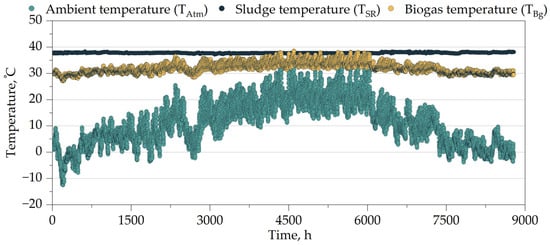
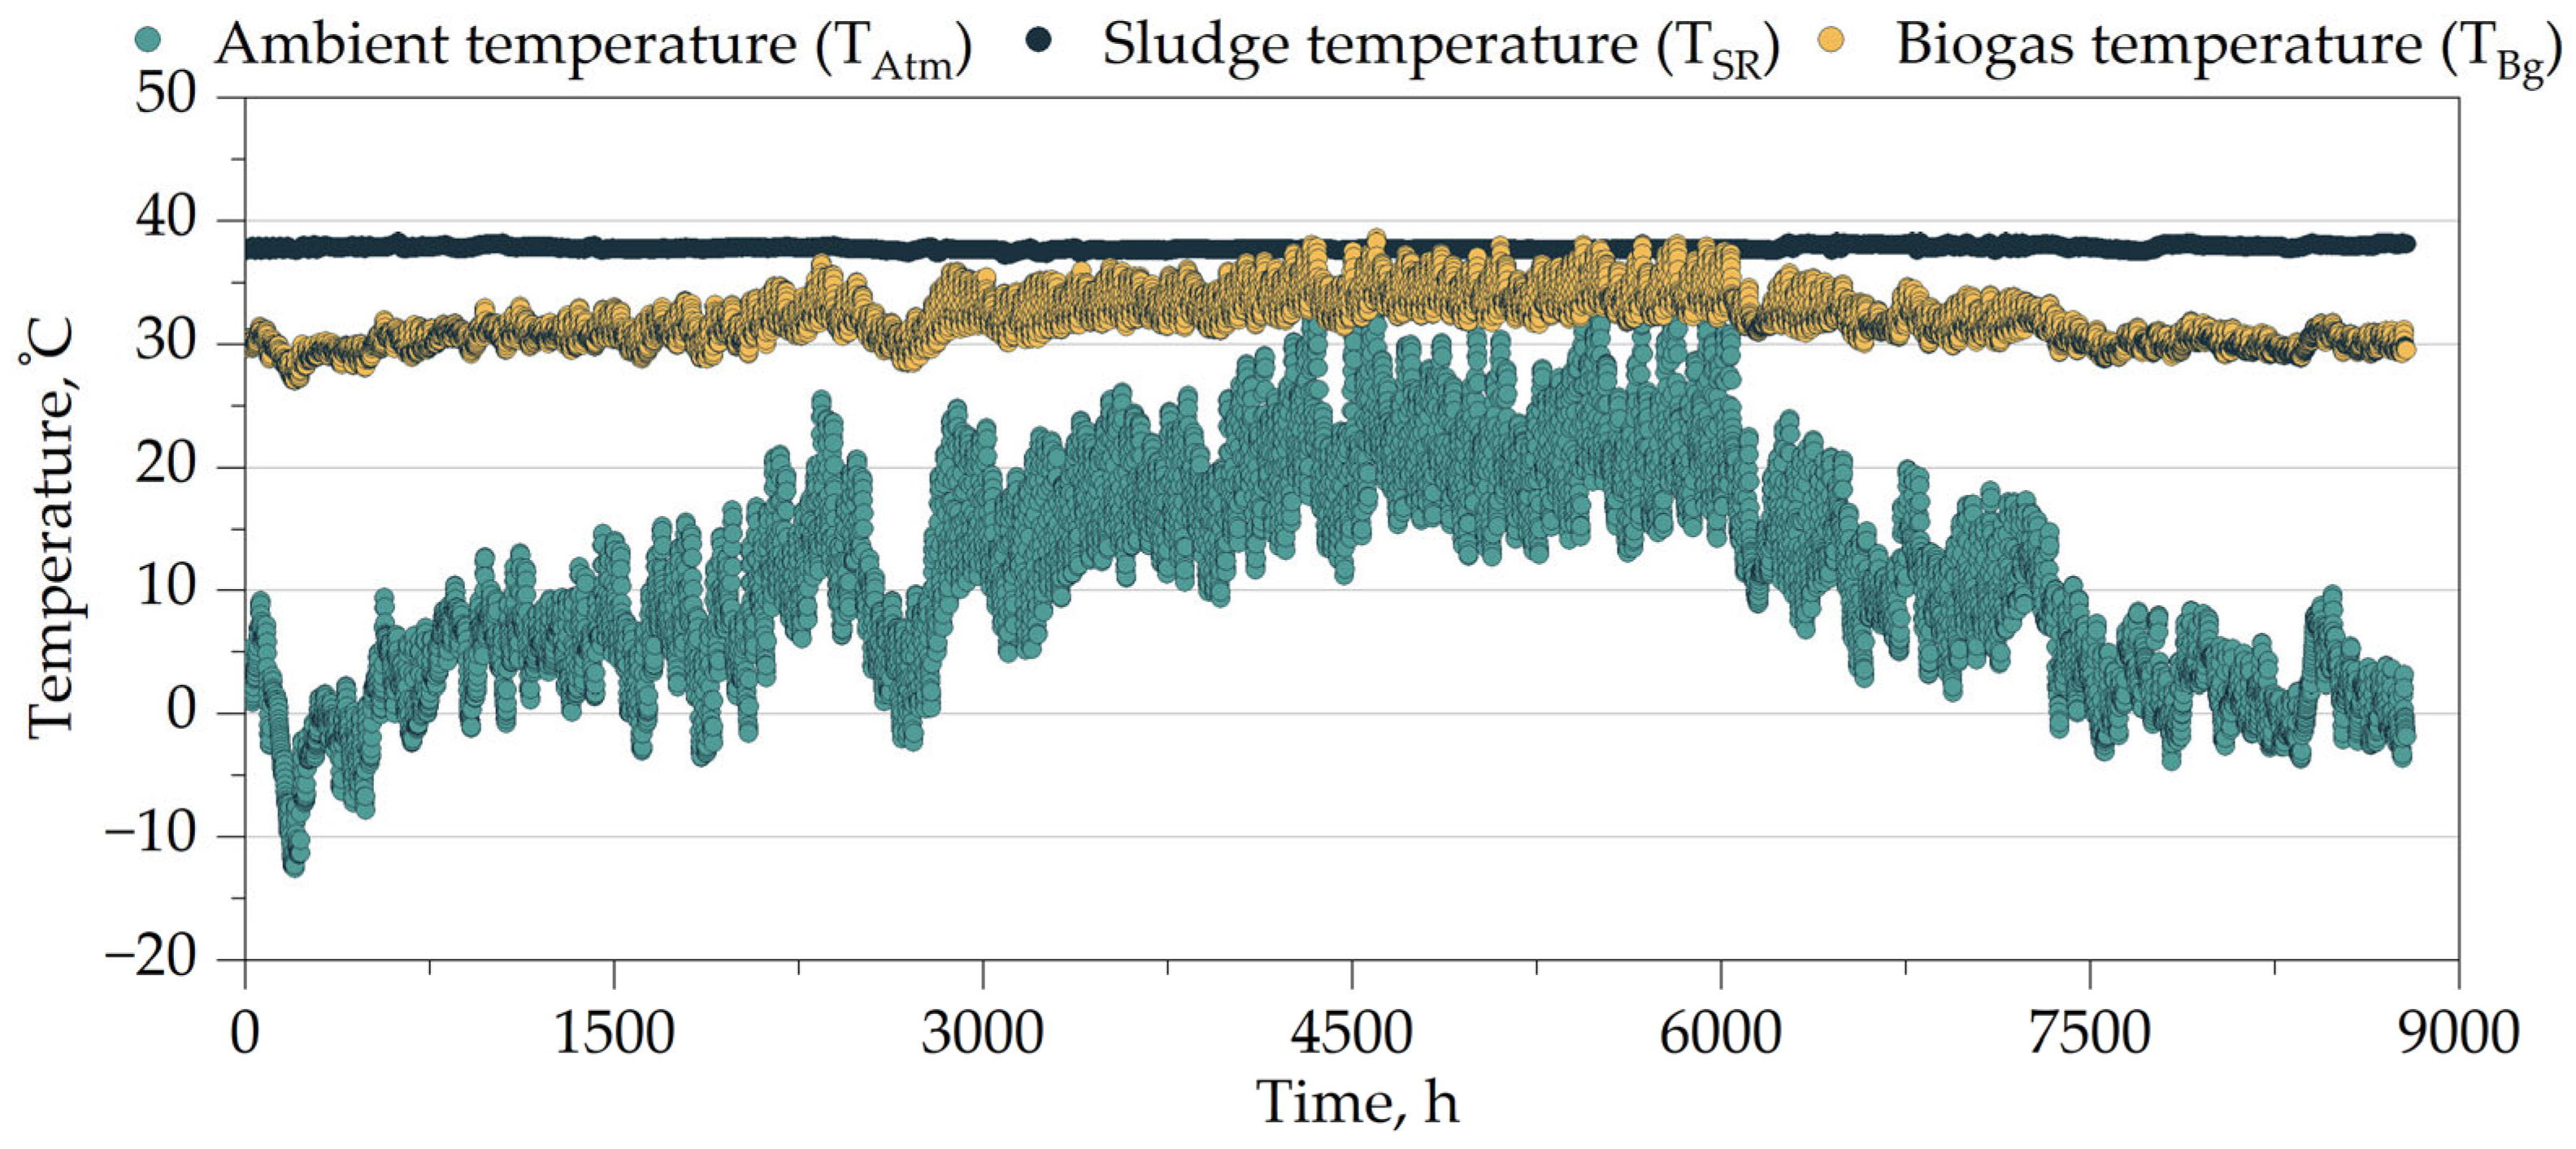
The biogas temperature (TBg) was determined based on the hourly heat gain and loss balance of the biogas phase. The biogas temperature was determined iteratively based on the heat balance described by Equation (2). In the first step, an initial approximation of the biogas temperature was assumed to be equal to the sludge temperature. Then, the heat fluxes appearing in the balance equation and the resulting biogas temperature were calculated. In the next step, the biogas temperature value was updated until the convergence criterion was met. The results of these simulations are presented in Figure 11, alongside the variations in sludge temperature (TSR) and ambient air temperature (TAtm). The results indicate a clear dependence of the biogas temperature on ambient air temperature, as well as a seasonal variation in the temperature difference between the sludge and biogas. The largest difference between them occurs during the winter period, reaching 10.6 K. In contrast, during the summer, the biogas temperature periodically exceeds the sludge temperature by up to 0.8 K.
Figure 11.
Simulation results of biogas temperature (TBg) compared with ambient air temperature (TAtm) and sludge temperature (TSR) from 1 January to 21 December 2024.
3.3. Heat Balance Simulation for WKF
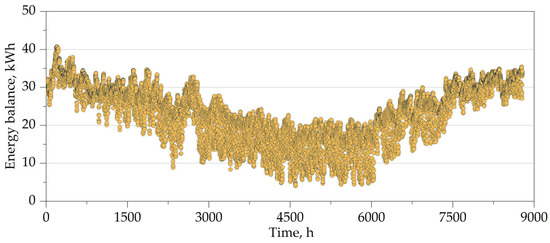
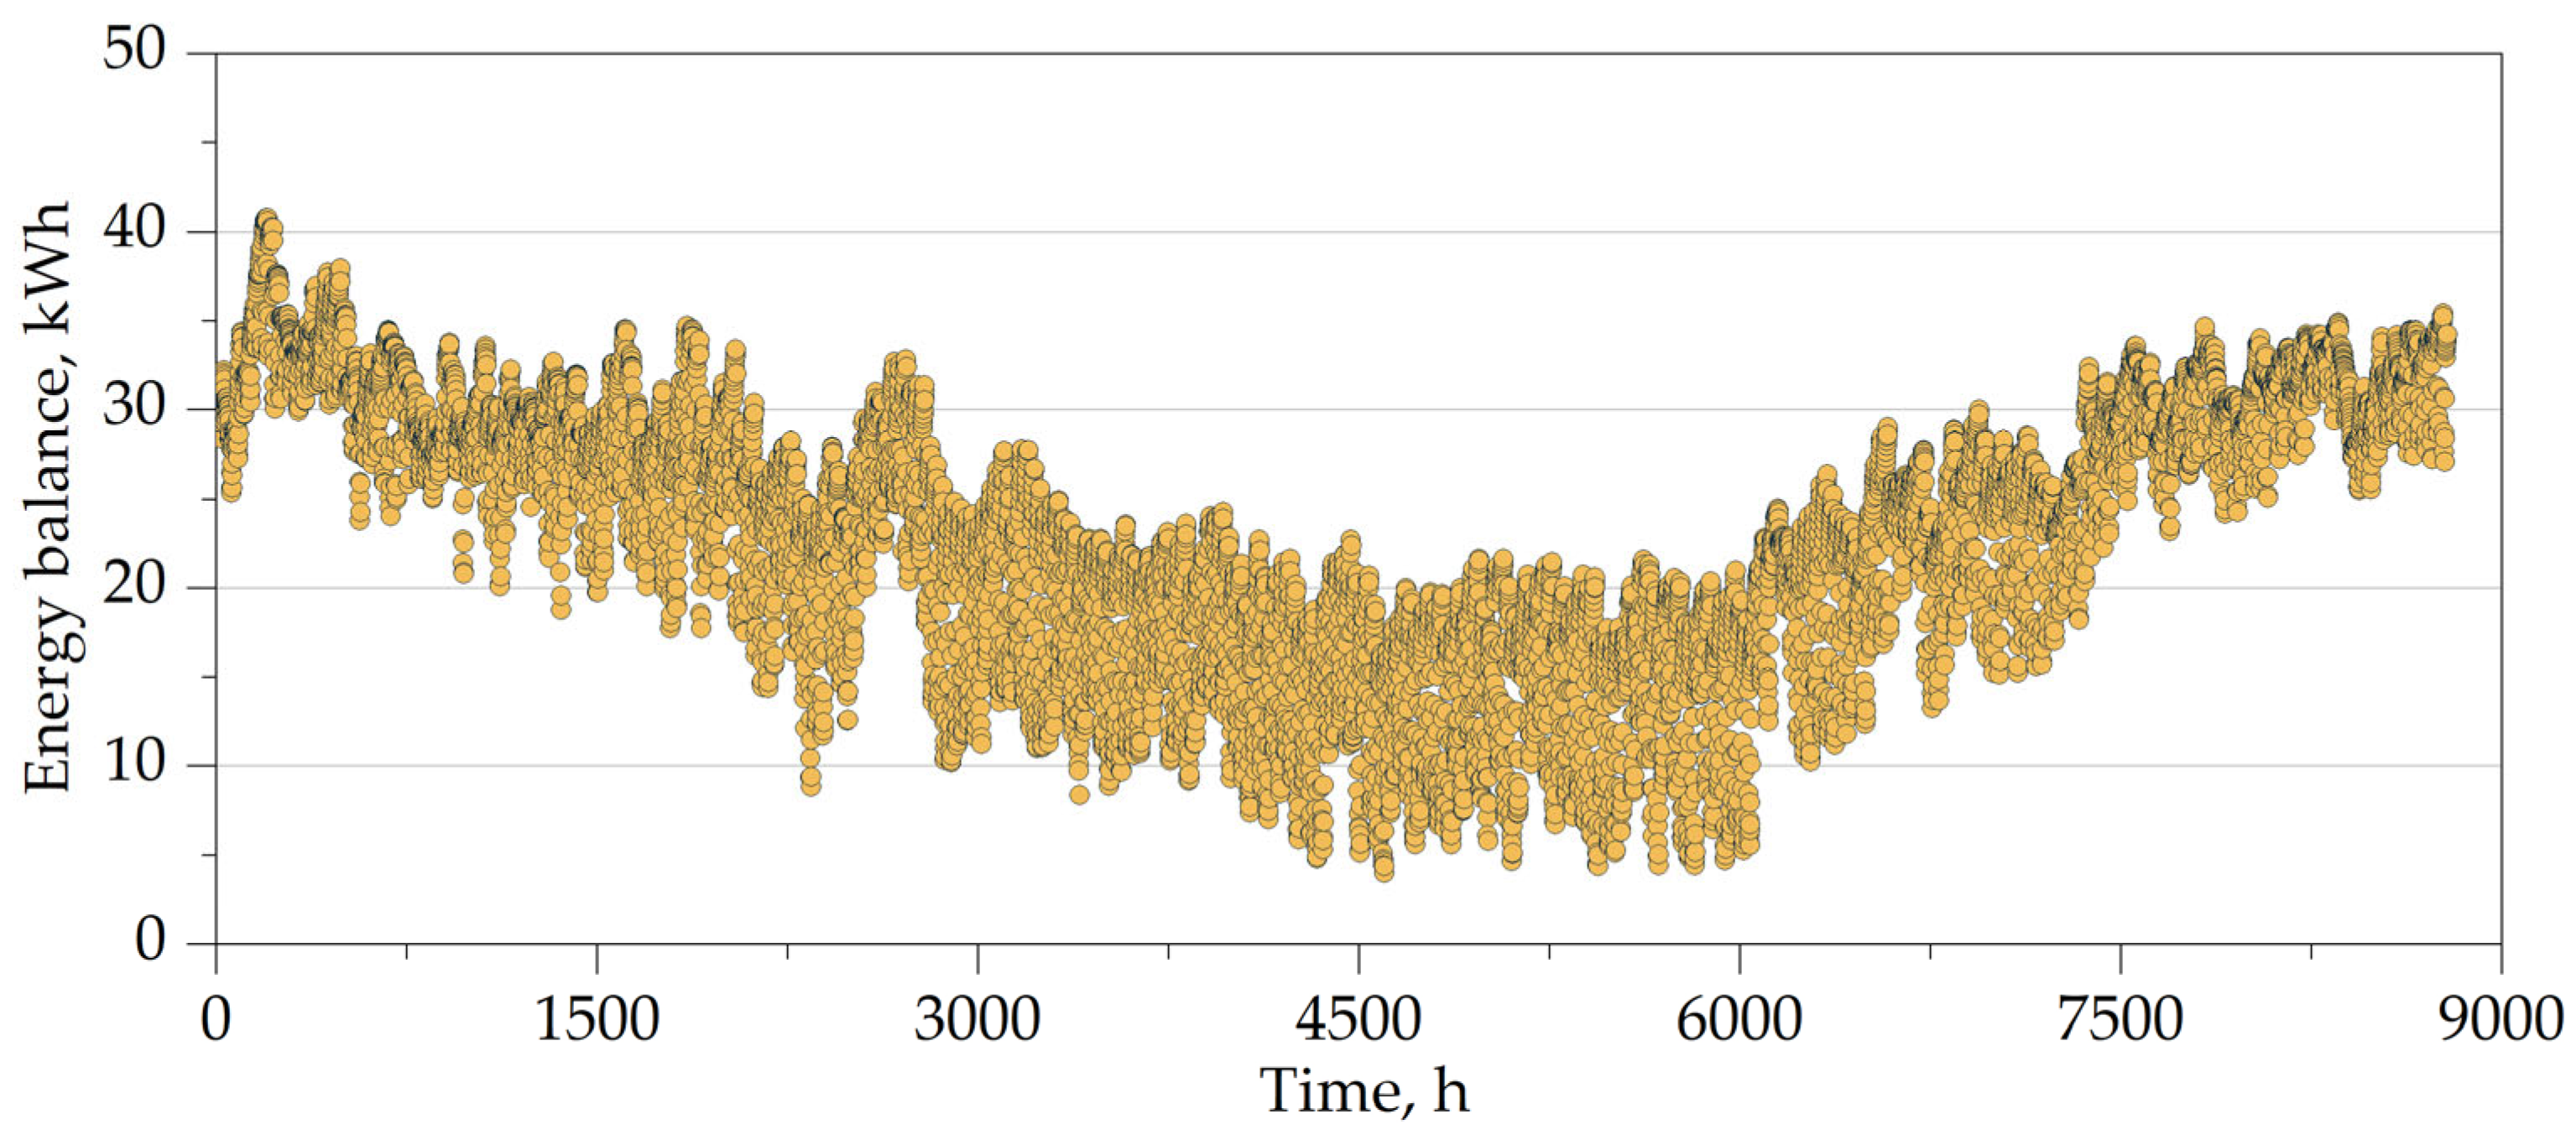
The results of the hourly simulation performed using 2024 data indicate that the annual heat balance of the anaerobic digester envelope (QAD), defined as the difference between heat losses and heat gains, amounts to 202.8 MWh/year. This balance (Figure 12) exhibits typical seasonality, reaching the highest instantaneous values during the winter season (approximately 40 kWh) and the lowest—sometimes even negative—values during the summer period.
Figure 12.
Hourly heat balance of the anaerobic digester envelope (QAD) from 1 January to 21 December 2024.
The results of the heat balance of the anaerobic digester envelope, aggregated on a monthly basis, are presented in Table 4. The main component of this balance (46%) is heat exchange through the partitions separating the sludge from the ambient air. The heat losses for this part of the tank amount to 100,979 kWh/year and are partially compensated by solar heat gains totaling 8090 kWh/year. Another significant component of the balance (30%) is the heat exchange through the partitions in contact with the ground. The remaining component, namely the partitions separating the biogas from the ambient air, accounts for 24% of the total heat exchange. The heat losses for this section of the tank are 51,638 kWh/year and are partially offset by solar gains of 3503 kWh/year.
Table 4.
Heat balance of the digester casing (QAD) in subsequent months of 2024.
Overall, for the digester analyzed in this study, solar heat gains have a relatively minor effect on the total heat balance, adjusting the total heat balance approximately 1% during the winter period and up to 15% during the summer.
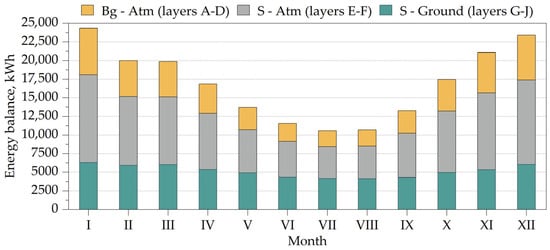
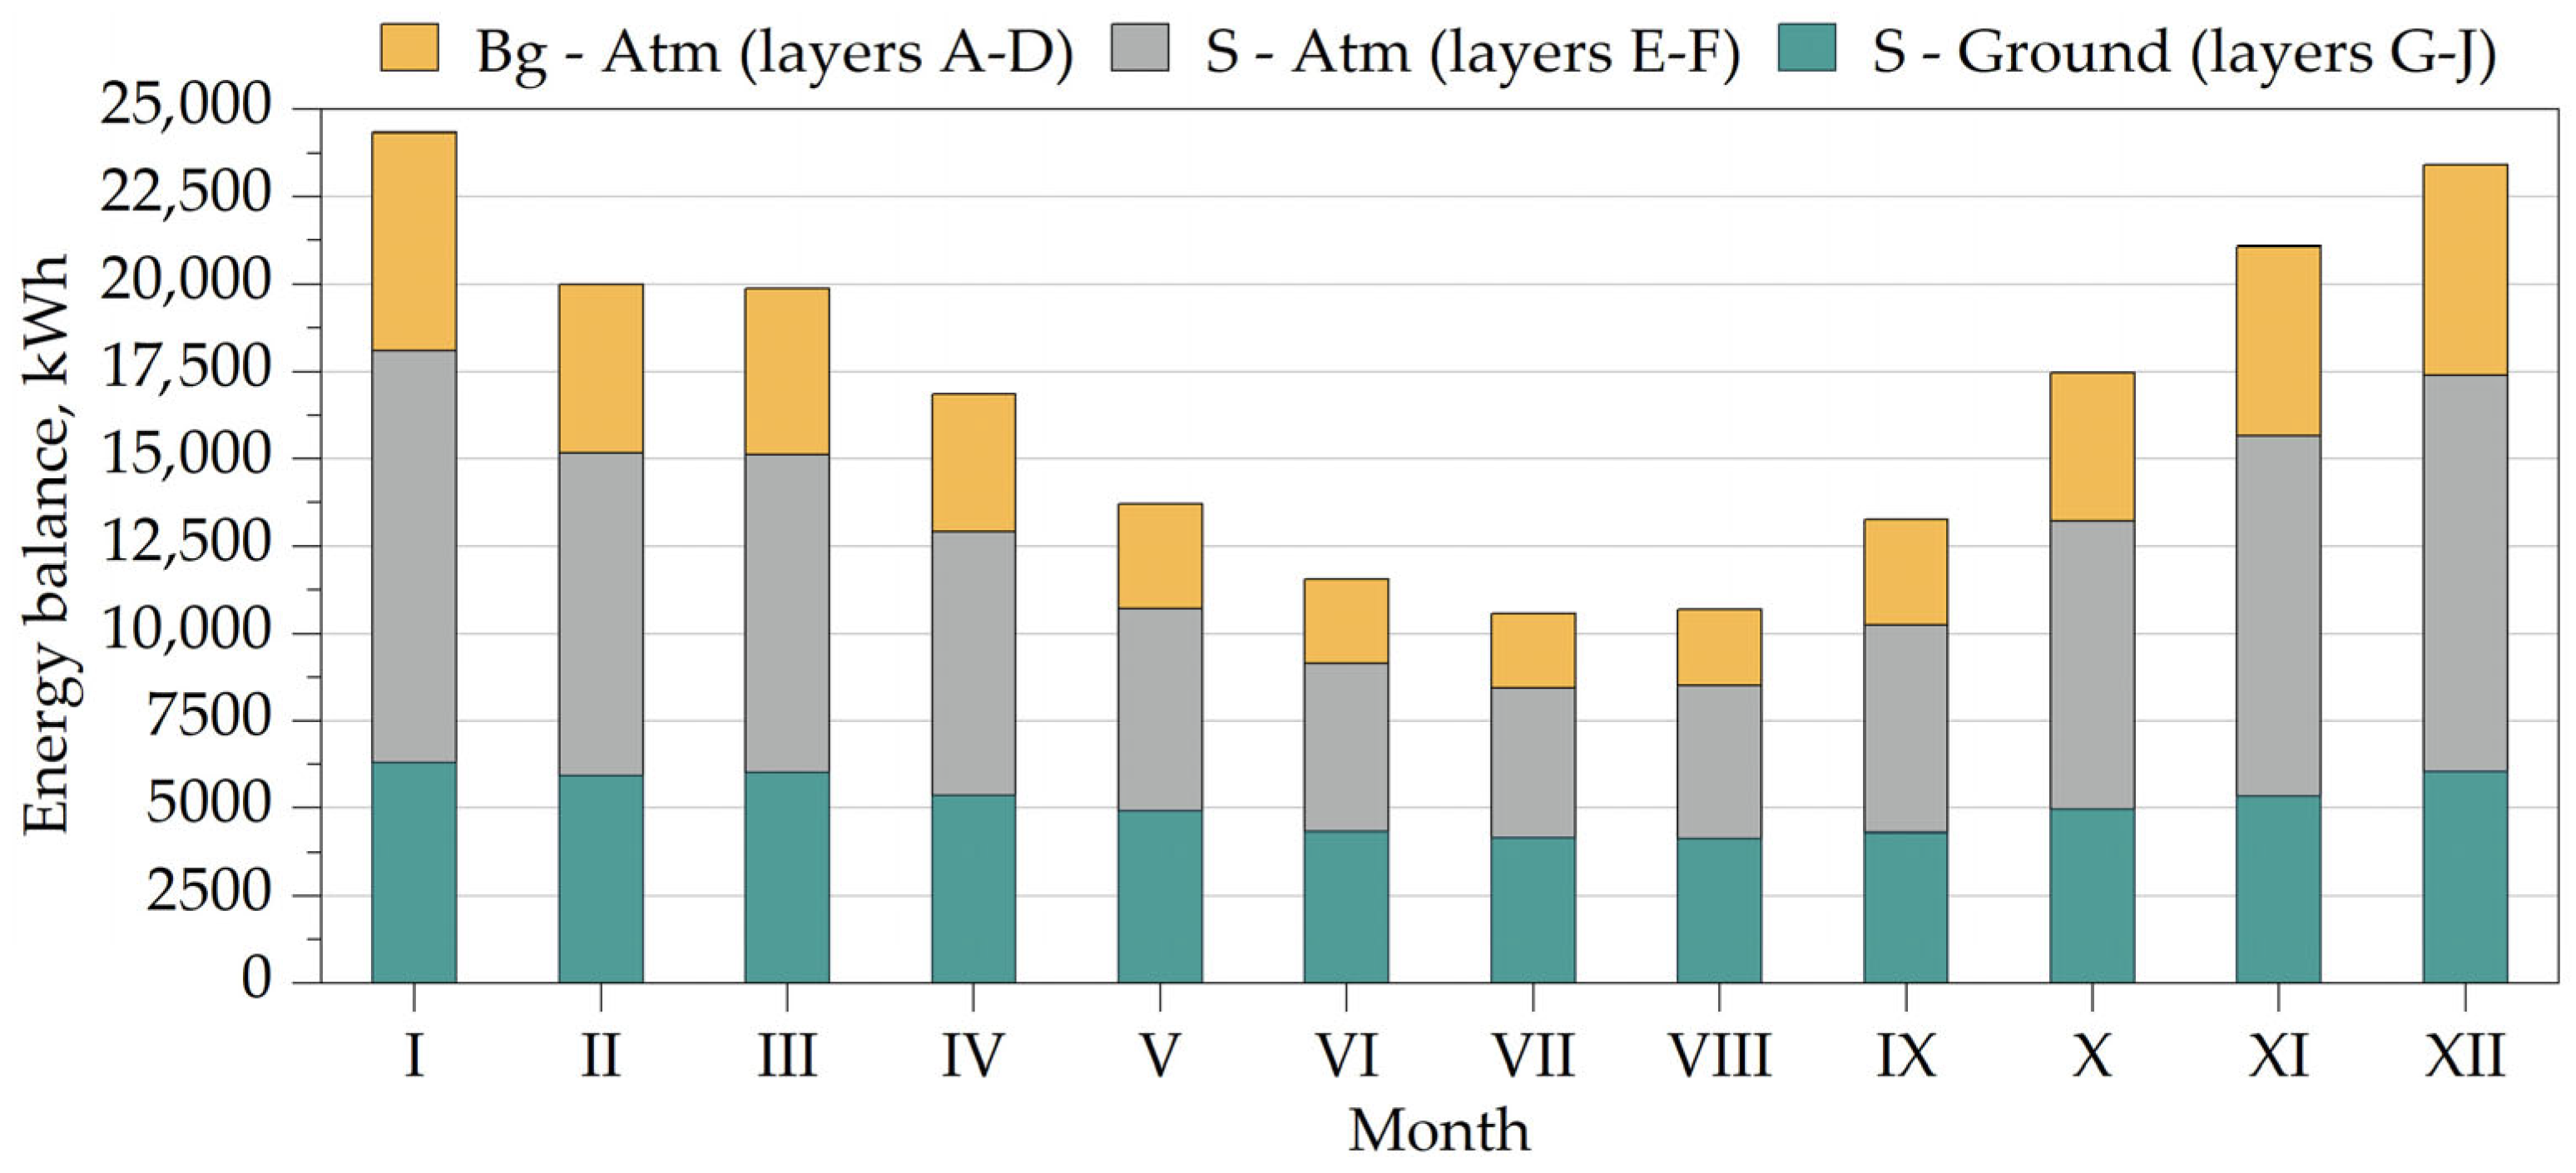
On Figure 13, it can be observed that the heat balance of the anaerobic digester envelope (QAD) undergoes significant seasonal variation, reaching its highest values in January and December, and its lowest during the summer months. For instance, in January, the heat balance was estimated at 24.3 MWh (accounting for 12% of the annual balance), while in July it was 10.6 MWh (5% of the annual balance). This variation results primarily from the strong influence of outdoor air temperature fluctuations and solar heat gains on the heat exchange through the envelope layers A–F. The contribution of the walls separating the sludge from the ambient air (layers E–F) to the total heat balance ranges from 41% to 49%, while for the partitions separating the biogas from the ambient air (layers A–D), the range is 20% to 26%. Consequently, although the magnitude of heat exchange through the ground-contacting layers (G–J) remains relatively stable throughout the year, their share in the total heat balance varies from 25% in November to 39% in July and August.
Figure 13.
Monthly heat balance of the anaerobic digester envelope (QAD) from January to December 2024.
3.4. Measured Heat Consumption of the WKF System
To investigate the heat balance of the anaerobic digester (AD) system, an analysis of heat meter data installed at the heat exchangers serving tanks AD 1 and AD 3 was carried out. The analysis covered a six-month period from January to June 2025 and enabled the determination of the total heat supplied to the AD system (QH). For the same period, based on measurement data, the amount of heat transferred to the raw sludge (QSU) was calculated.
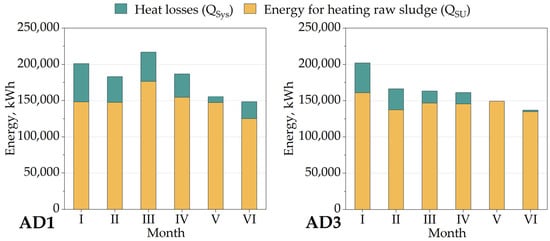
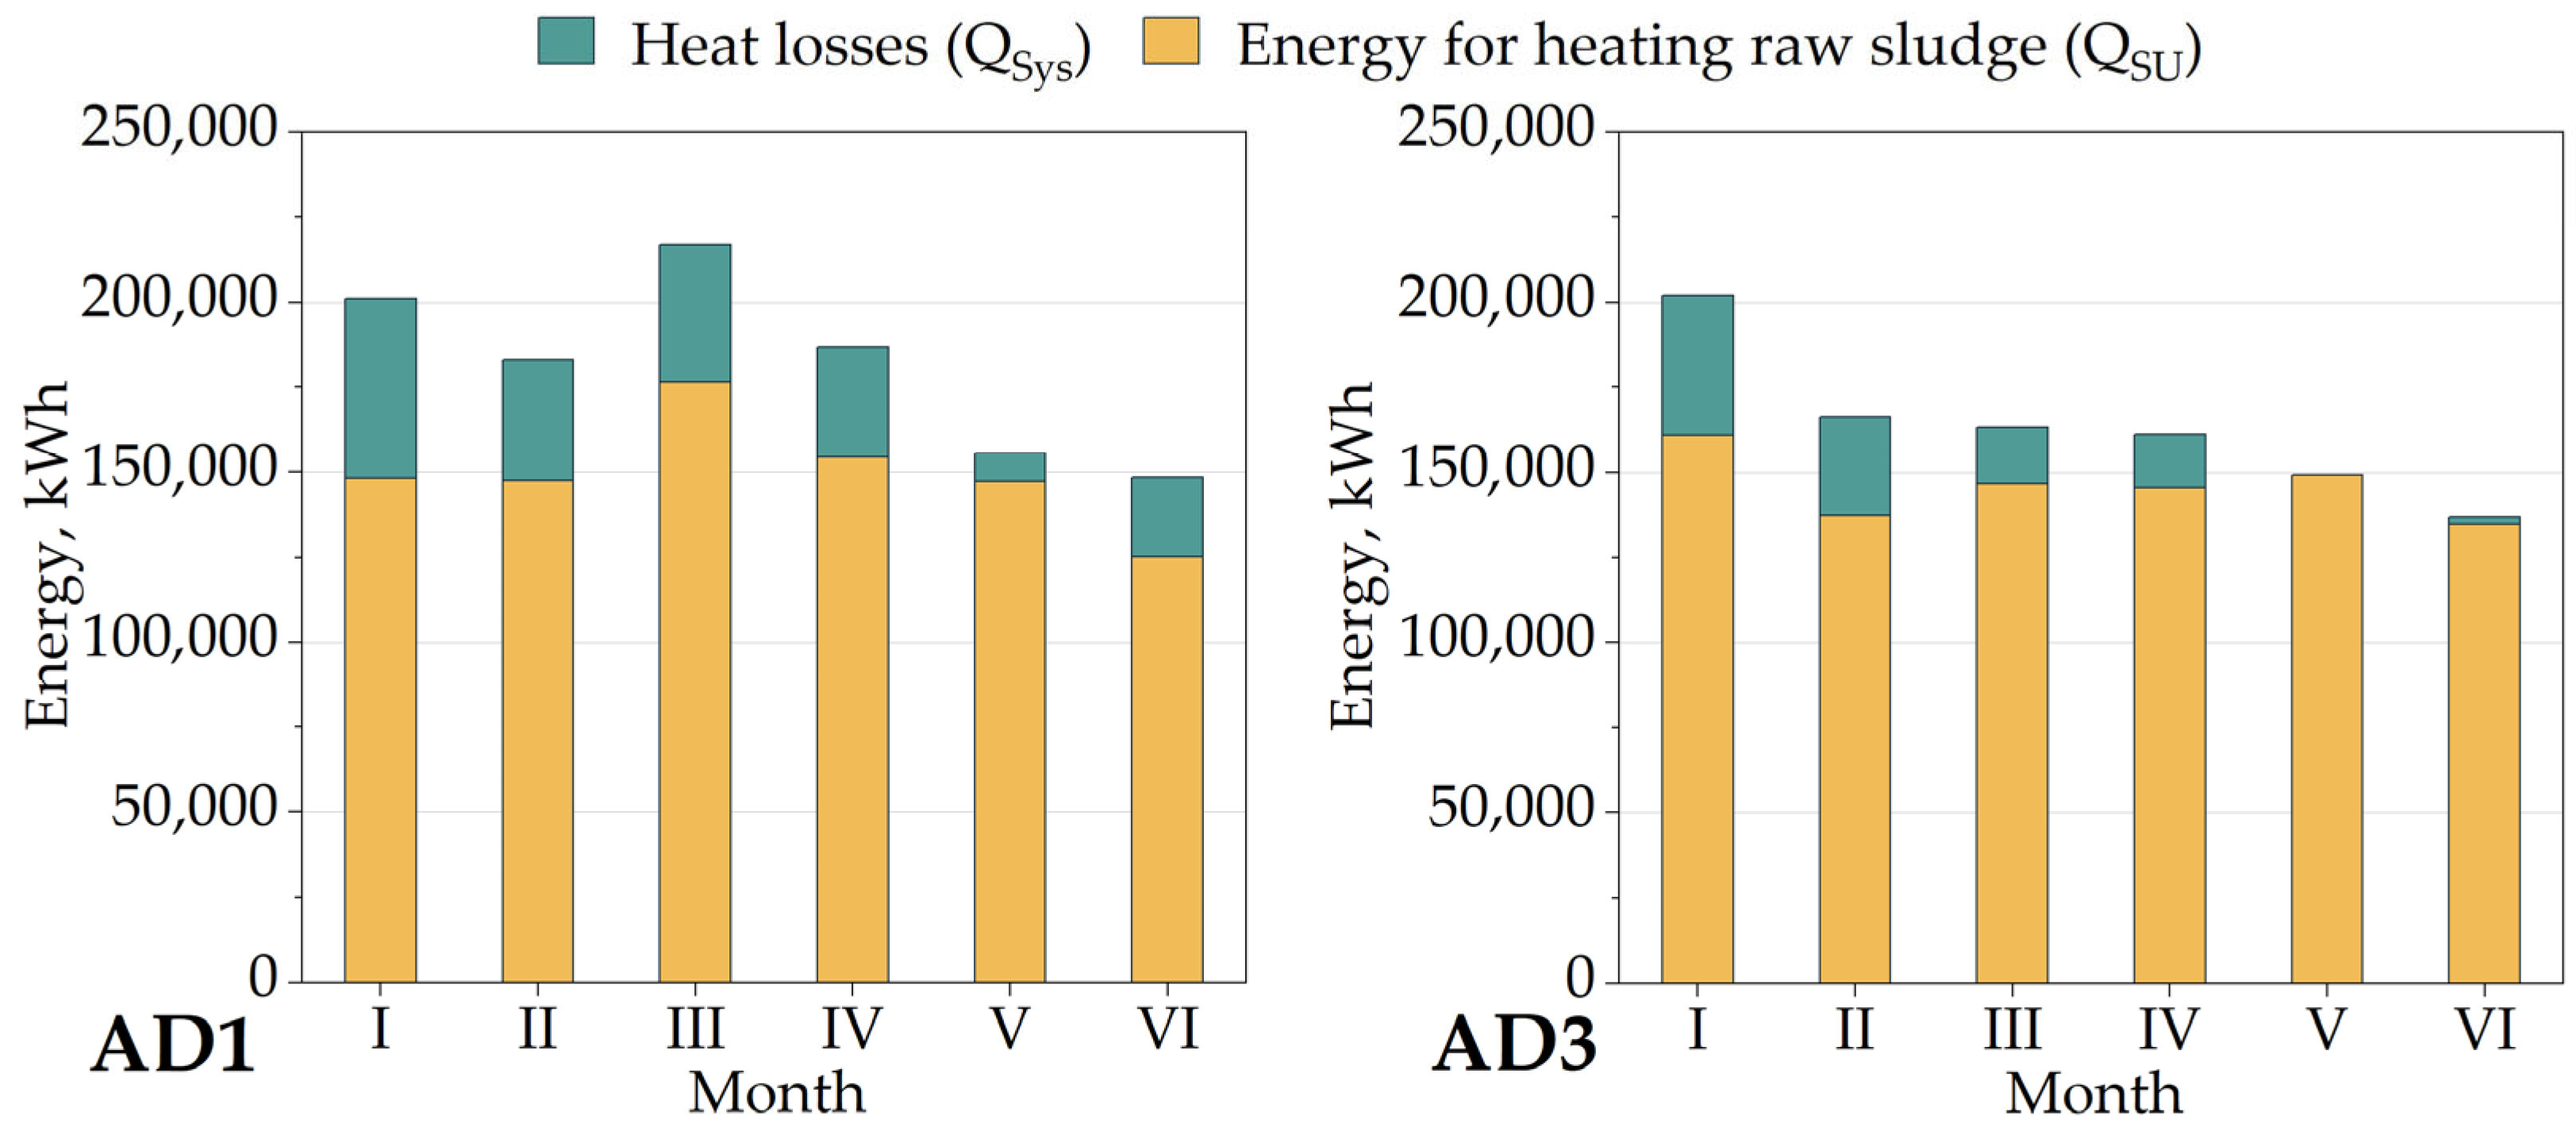
The results of these analyses, showing the monthly thermal energy consumption (QH), divided into the energy required for heating the raw sludge (QSU) and the total heat losses of the AD system (QSys), are presented in Figure 14. Similar seasonal trends were observed for both digesters. The highest demand for energy to heat the raw sludge (QSU) occurred during the colder months (January–March), which results from the lower temperature of the sludge supplied to the heat exchanger (TSU) (Figure 5). During warmer periods, as the raw sludge temperature increased, the heat demand required for its heating decreased, which is reflected in the lower energy values recorded by the meters.
Figure 14.
Energy required to heat the raw sludge (QSU) and to cover the total heat losses of the system (QSys) for digesters AD 1 and AD 3 from January to June 2025.
The total heat losses of the AD system (QSys) were determined as the difference between the heat meter readings (QH) and the amount of energy required to heat the raw sludge (QSU). It was found that the share of total heat losses in the AD 1 system ranged from 5% in May to 26% in January, while in the AD 3 system it ranged from 0% in May to 20.4% in January.
The comparison of heat balances for systems AD 1 and AD 3, presented in Table 5, reveals significant differences between them. The share of total heat losses (QSys) in the overall energy balance (QH) system AD 1 amounted to approximately 18%, whereas for AD 3 it was only 10%. This difference is not related to the process parameters, as both the temperature (TSU) and the flow rate of raw sludge () supplied to the heat exchangers were comparable in both units. The variation in the total heat losses (QSys) is likely due to the relative location of the digesters with respect to the heat source. AD 1 is situated at a greater distance from the technical room housing the heat exchangers, which results in longer pipelines and increased transmission losses. Another potential cause of this difference could be the higher thermal energy demand of the AD 1 envelope, possibly caused by degradation or damage to the thermal insulation material [18].
Table 5.
Heat balance for the AD1 and AD3 digester systems from January to June 2025.
4. Discussion
The anaerobic digester (AD) system includes the heat exchanger, the pipelines and devices located between the exchanger and the digester, as well as the digester envelope itself. The total thermal energy demand of this system (QH) consists of the heat transferred to the raw sludge (QSU), the heat transmission losses between the exchanger and the digester (QDist), and the heat balance of the digester envelope (QAD). Based on the results of the heat balance simulations of the digester envelope and the analysis of measurement data, the three most probable variants of the heat balance of a single AD system were developed (Table 6). In the following section, the potential for reducing the system’s total energy demand through thermal modernization of the digester envelope is also discussed.
Table 6.
Variants of the total heat balance of the anaerobic digester (AD) system for the year 2024.
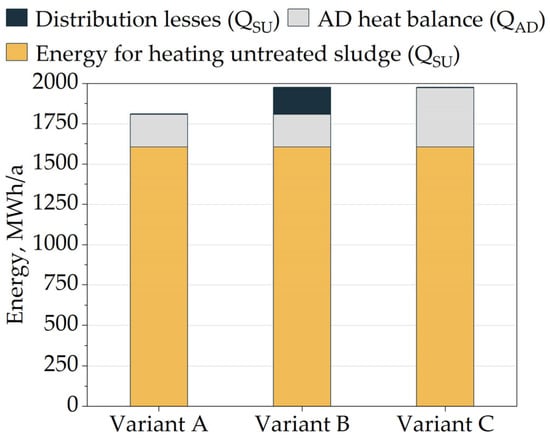
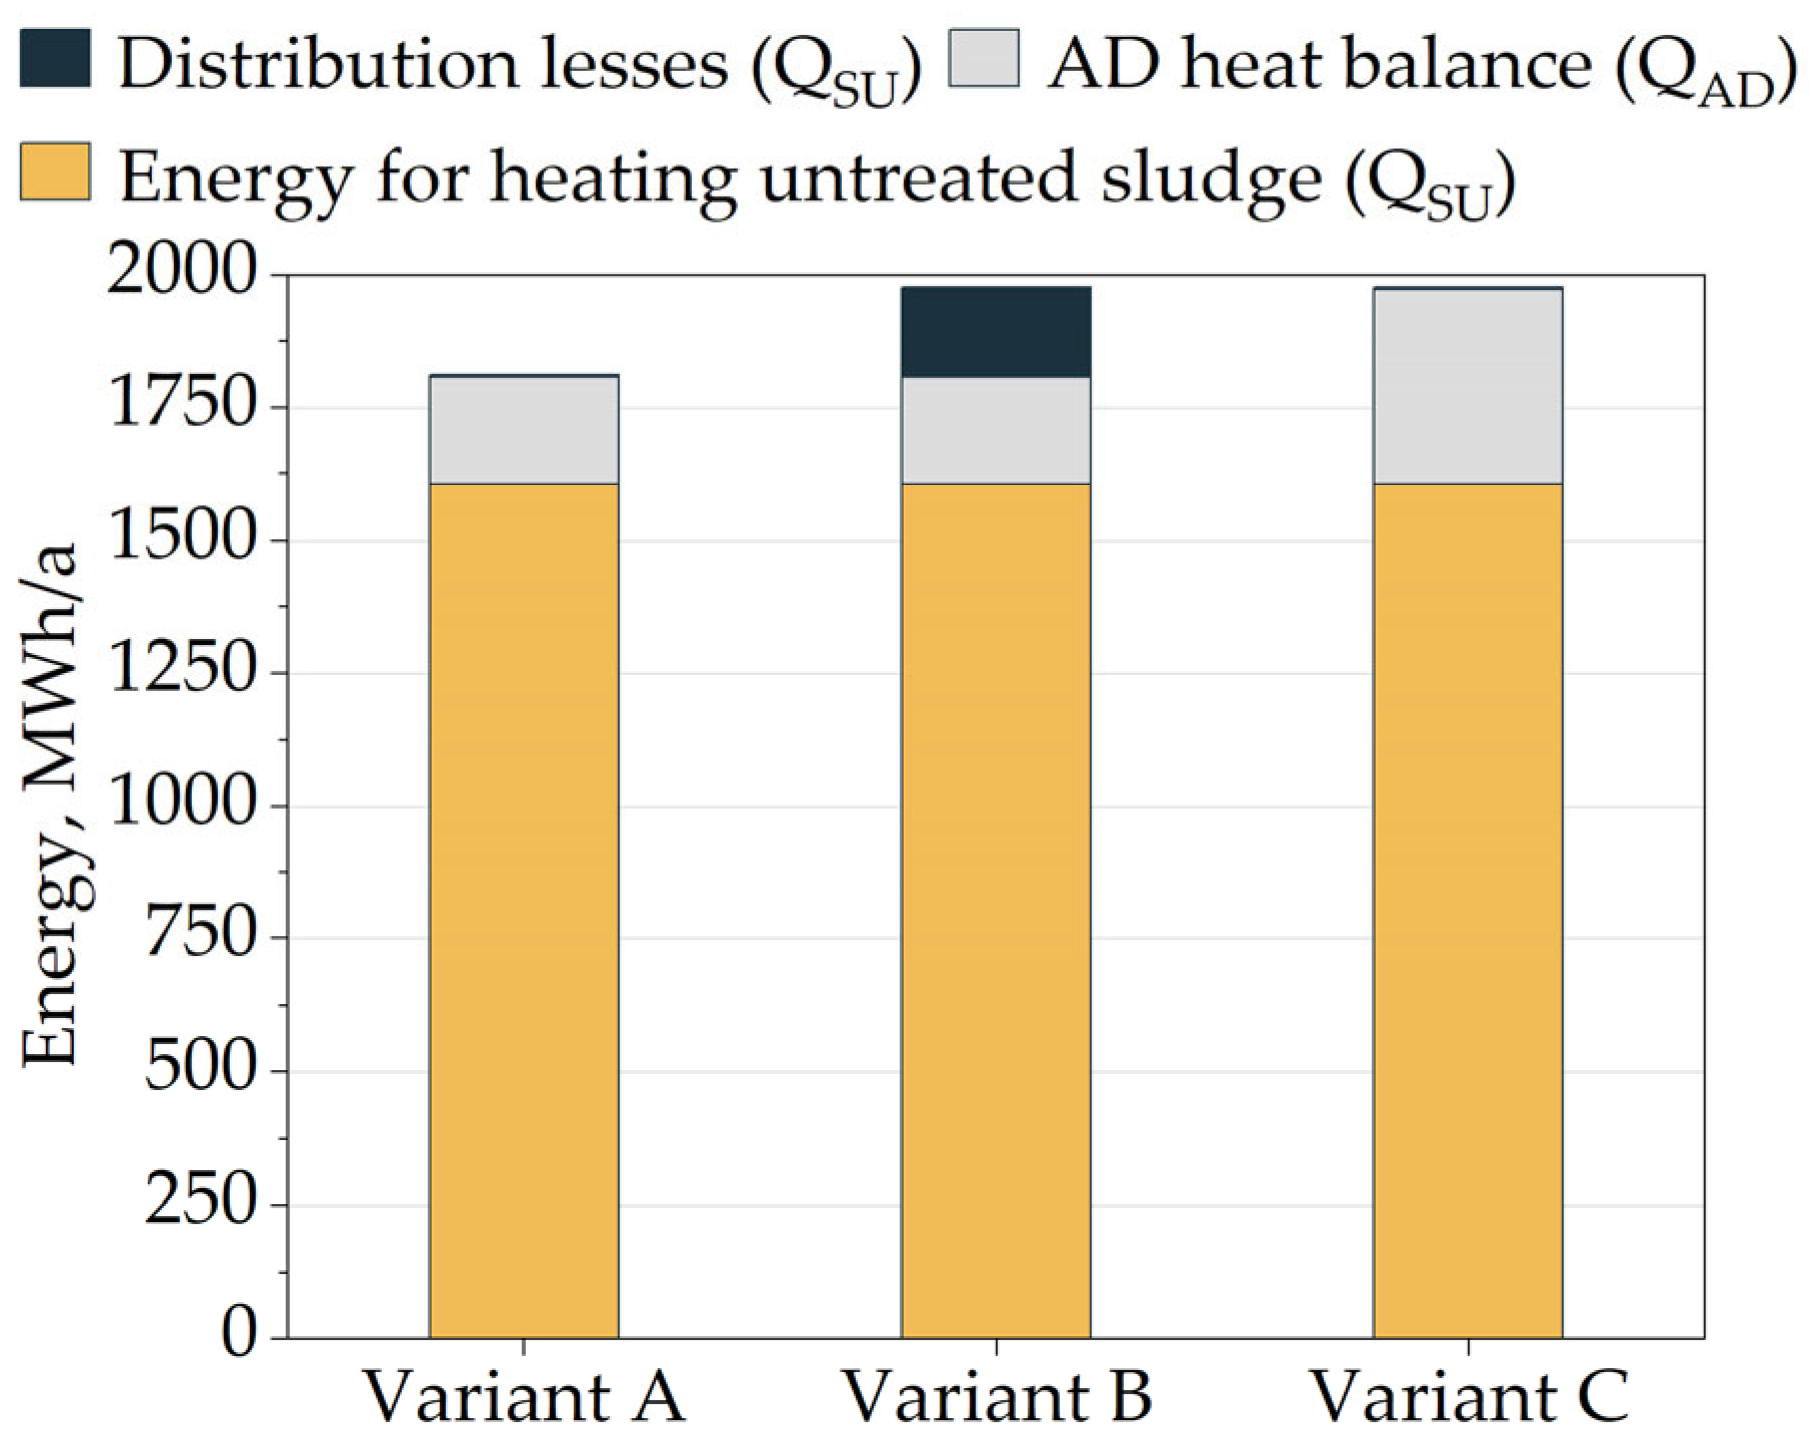
Variant A of the AD system heat balance was developed based on the following: the average amount of heat transferred to the raw sludge supplied to digesters AD 1 and AD 3 in 2024, the simulated heat balance of the AD envelope performed for 2024 meteorological data, and the heat transfer efficiency of the AD 3 system estimated from 2025 measurement data. The total heat balance for the AD system (QH) amounts to 1812.0 MWh/year. The heat balance of the AD envelope (QAD) equals approximately 202.8 MWh/year (11.2% of the system balance). Heat transmission losses between the heat exchanger and the digester are marginal (0.2%). The remaining 88.6% of the system balance corresponds to the heat transferred to the raw sludge (1604.9 MWh/year).
Variant B of the AD system heat balance was developed based on the following: the average amount of heat transferred to the raw sludge supplied to digesters AD 1 and AD 3 in 2024, the simulated heat balance of the AD envelope performed for 2024 meteorological data, and the heat transfer efficiency of the AD 1 system estimated from 2025 measurement data. The total heat balance for the AD system (QH) amounts to 1978.3 MWh/year. The heat balance of the AD envelope (QAD) equals approximately 202.8 MWh/year (10.3% of the system balance). A significant component of the system balance is the heat transmission losses (170.6 MWh/year), accounting for 8.6% of the total balance. The heat transferred to the raw sludge amounts to 1604.9 MWh/year, representing 81.1% of the system balance.
Variant C of the AD system heat balance was developed based on the following: the average amount of heat transferred to the raw sludge supplied to digesters AD 1 and AD 3 in 2024, and the heat transfer efficiency of the AD 3 system, estimated from 2025 measurement data. The total heat balance for the AD system (QH) amounts to 1978.3 MWh/year. The heat transmission losses between the heat exchanger and the digester are marginal (0.2%). The heat transferred to the raw sludge equals 1604.9 MWh/year (81.1% of the system balance). Under these assumptions, the heat balance of the AD envelope (QAD) amounts to 369.1 MWh/year, representing 18.7% of the energy supplied by the heat exchanger.
These three possible variants are presented in Figure 15. The results suggest that the actual heat balance of the AD 3 system is close to Variant A, while the heat balance of the AD 1 system corresponds more closely to Variant B or C. Digester AD 1 is located farther from the heat exchanger; the sludge transport pipes are uninsulated and partially routed outside the heated space. Therefore, the estimated heat transfer efficiency of about 91.4% appears realistic. However, it is possible that the actual heat balance of the AD 1 system corresponds to Variant C or represents an intermediate state between Variant B and Variant C. The energy gap between the measurement results for the AD 1 and AD 3 systems does not necessarily result from heat transmission losses. Differences may also arise from variations in the actual thermal transmittance values of individual digester components, caused by insulation degradation or the presence of thermal bridges. Nevertheless, the conducted analysis did not allow for an unambiguous determination of the extent to which these differences are due to heat transmission losses or heat losses through the digester envelope.
Figure 15.
Components of the heat balance of the anaerobic digester (AD) system for the analyzed variants for the year 2024.
The potential for thermal modernization of the analyzed anaerobic digesters (AD) is limited by their structural design. A significant portion of the tank walls is embedded in the ground, making it technically impossible to improve their insulation. It was assumed that thermal modernization could be carried out only on the aboveground parts of the digesters, from layers A2 to F. The proposed modernization involves replacing the existing insulation with a 15 cm thick thermal insulation material characterized by a thermal conductivity coefficient of 0.031 W/(m·K). This modification reduces the heat balance of the digester envelope by 35%, from approximately 202.8 MWh/year to 132.1 MWh/year. Consequently, the share of the envelope heat losses in the total system heat balance (for Variant A) decreases from 11.2% to 7.6%. Increasing the insulation thickness beyond 15 cm would have only a marginal effect on further efficiency improvement.
If, in practice, the heat balance of a single digester corresponds to Variant B, the reduction in heat losses due to modernization would be similar in absolute terms, but its relative impact on the overall system efficiency would be smaller. Conversely, if the actual thermal transmittance of the digester envelope is significantly higher, for example, due to insulation material degradation, and the system balance is closer to Variant C, the potential benefits of modernization would be greater. However, an accurate assessment of these effects would require a detailed inspection of the digester envelope to identify which structural components deviate from the design specifications. Such investigations could not be carried out within the scope of this study.
5. Conclusions
In the conducted assessment of the energy performance of two anaerobic digesters (ADs) operating in a wastewater treatment plant located in Wrocław, analytical and empirical studies were integrated. For a representative operational year (2024), three possible variants of the AD system’s energy performance were determined.
In the first variant (Variant A), the total system energy demand amounts to 1812.0 MWh/year, with the following structure: heat balance of the AD envelope 202.8 MWh/year (11.2%), heat supplied for raw sludge heating 1604.9 MWh/year (88.6%), and heat transmission losses 4.4 MWh/year (0.2%).
Assuming that both digesters exhibit similar process-related energy characteristics, and that the differences between systems result mainly from heat losses in the sludge transport pipelines—caused by varying distances between the digesters and the heat exchanger unit—the second energy performance variant (Variant B) was defined. In this case, the total system energy demand amounts to 1978.3 MWh/year, with the following structure: heat balance of the AD envelope 202.8 MWh/year (10.3%), heat supplied for raw sludge heating 1604.9 MWh/year (81.1%), and heat transmission losses 170.6 MWh/year (8.6%).
Due to insufficient data confirming Variant B, an alternative explanation for the observed energy gap between the two analyzed systems was also considered: degradation of the thermal envelope of one of the digesters. In this scenario (Variant C), the total system energy demand is 1978.3 MWh/year, and the structure is as follows: heat balance of the AD envelope 369.1 MWh/year (18.7%), heat supplied for raw sludge heating 1604.9 MWh/year (81.1%), and heat transmission losses 4.4 MWh/year (0.2%).
The assessment of the energy performance of anaerobic digestion (AD) systems operating in wastewater treatment plants is a complex process. These systems are characterized by intricate technological processes and sophisticated structural configurations, both of which generate numerous computational challenges. Validation of simulation results against measurement data led to important conclusions regarding potential operational issues that could not have been identified through analytical studies alone.
In the analyzed system, it was found that most of the heat is used to maintain the technological process itself, namely, to heat the raw sludge. Depending on the variant, the share of total system heat losses ranges between 10.3% and 18.7%. Analytical calculations made it possible to accurately identify potential areas for thermal modernization of the digester envelope and demonstrated the possibility of reducing the system’s energy consumption by at least 70.7 MWh, corresponding to 3.9%.
The integration of simulation and empirical research also enabled the identification of other areas that may be relevant to achieving near-zero-emission operation, drawing attention to potential operational problems such as insulation degradation or heat losses during transmission. However, precisely determining the factors responsible for the energy gap between the two analyzed digesters requires further detailed research on the described system. Further research should also include the effect of biogas temperature on methane content, detailed investigations of energy transfer efficiency in AD systems, and the evaluation of control strategies.
The research methodology on the energy efficiency of anaerobic digestion systems presented in this work, which includes the integration of measurement data with analytical assessment, can be applied to other facilities. The proposed computational model may be used for various types of digestion chambers, regardless of differences in design, thermal insulation, heating system configuration, or climatic conditions. The results obtained in these studies, carried out for a cold climate (Poland), indicate a particularly large share of heat losses through the vertical walls of the tank and into the ground, as well as minor heat gains from solar radiation. This highlights the need for appropriate thermal insulation of such facilities. Although the results of these studies cannot be directly transferred to tanks of this type operating in different climatic conditions, they may serve as a reference point for research on the energy efficiency of such facilities conducted under other climatic conditions.
Author Contributions
Conceptualization, E.S., A.C. and M.S.-Z.; Methodology, E.S., A.C. and M.S.-Z.; Software, E.S., A.C. and M.S.-Z.; Validation, E.S., A.C. and M.S.-Z.; Formal analysis, E.S., A.C. and M.S.-Z.; Investigation, E.S., A.C. and M.S.-Z.; Resources, E.S., A.C. and M.S.-Z.; Writing—original draft, E.S., A.C. and M.S.-Z.; Writing—review & editing, E.S., A.C. and M.S.-Z.; Visualization, E.S., A.C. and M.S.-Z.; Supervision, E.S., A.C. and M.S.-Z.; Project administration, E.S., A.C. and M.S.-Z. All authors have read and agreed to the published version of the manuscript.
Funding
This research received no external funding.
Data Availability Statement
The data used in this study are not publicly available, as they were provided by the operating company solely for the purpose of the analyses presented in this article.
Conflicts of Interest
The authors declare no conflict of interest.
Nomenclature
| Surface area, m2 | |
| C | Specific heat capacity, J/(kg·K) |
| Directional view factor between the element and the sky, - | |
| Dimensionless shading coefficient for external obstacles, - | |
| Gravitational acceleration, m/s2 | |
| Convective heat transfer coefficient, W/(m2K) | |
| Radiative heat transfer coefficient, W/(m2K) | |
| Transmission heat transfer coefficient, W/K | |
| Solar irradiance on a given surface, W/m2 | |
| Thermal transmittance coefficient, W/(m2K) | |
| Thermal transmittance coefficient, W/(m·K) | |
| Average thermal transmittance coefficient of the group of layers, W/(m2K) | |
| Cylinder height, m | |
| Characteristic length, m | |
| Mass flow rate, kg/h | |
| Nusselt number, - | |
| Prandtl number, - | |
| Reynolds number, - | |
| Overall heat balance of the digester envelope, kWh | |
| Heat balance of the digester envelope—sludge phase, kWh | |
| Heat balance of the digester envelope—biogas phase, kWh | |
| Heat carried away with the discharged biogas, kWh | |
| Heat loss by transmission from biogas to ambient air, kWh | |
| Heat loss between the heat exchanger and the digester, kWh | |
| Heat supplied to the heat exchanger, kWh | |
| Heat loss by transmission from sludge to ambient air, kWh | |
| Heat transferred by convection from sludge to biogas, kWh | |
| Heat loss by transmission from sludge to ground, kWh | |
| Longwave radiation heat loss to the sky for the digester envelope, kWh | |
| Longwave radiation heat loss to the sky for the sludge phase, kWh | |
| Longwave radiation heat loss to the sky for the biogas phase, kWh | |
| Solar heat gains for the digester envelope, kWh | |
| Solar heat gains for the sludge phase, kWh | |
| Solar heat gains for the biogas phase, kWh | |
| Heat transferred in the heat exchanger to the raw sludge, kWh | |
| Heat losses of the digester system, kWh | |
| Inner radius of the i-th layer (for a cylindrical wall), m | |
| Inner radius of the wall, m | |
| Outer radius of the wall, m | |
| R | Heat transfer resistance, m2K/W |
| Rayleigh number, - | |
| Time, h | |
| Temperature, °C | |
| Volumetric flow rate, m3/h | |
| Kinematic viscosity, m2/s | |
| Velocity, m/s | |
| Thermal expansion coefficient, 1/K | |
| Surface emissivity, - | |
| Thermal conductivity, W/(m·K) | |
| Thermal conductivity of the i-th layer, W/(m·K) | |
| ρ | Density, kg/m3 |
| Thickness of the i-th layer (for a flat wall), m | |
| Stefan–Boltzmann constant, W/(m2K4) | |
| ϕ | Relative humidity, % |
| Absorption coefficient for solar radiation, - | |
| Indices: | |
| AD | Anaerobic digester |
| Ambient air | |
| Bg | Biogas |
| Cyl | Cylindrical wall |
| Flat | Flat wall |
| Ground | |
| H | Thermal energy |
| S | Sludge |
| ST | Recirculated and raw sludge (total sludge) |
| SR | Recirculated sludge |
| SU | Raw sludge |
| SO | Overflow sludge |
| External side of the wall | |
| Internal side of the wall | |
| Sky |
References
- Hassan, Q.; Viktor, P.; Al-Musawi, T.J.; Mahmood Ali, B.; Algburi, S.; Alzoubi, H.M.; Khudhair Al-Jiboory, A.; Zuhair Sameen, A.; Salman, H.M.; Jaszczur, M. The Renewable Energy Role in the Global Energy Transformations. Renew. Energy Focus 2024, 48, 100545. [Google Scholar] [CrossRef] [Scilit]
- Jameel, M.K.; Mustafa, M.A.; Ahmed, H.S.; Mohammed, A.; Ghazy, H.; Shakir, M.N.; Lawas, A.M.; Mohammed, S.; Idan, A.H.; Mahmoud, Z.H.; et al. Biogas: Production, Properties, Applications, Economic and Challenges: A Review. Results Chem. 2024, 7, 101549. [Google Scholar] [CrossRef] [Scilit]
- He, H.; Chen, X.; Peng, Z.; Zhang, Z.; Ren, X.; Ma, S.; Khan, M.U.; Cui, Z.; Yuan, X. A Review of Temperature and Key Parameters Influencing the Hydrolysis-Methanogenesis Balance in Anaerobic Digestion. Fuel 2025, 394, 134927. [Google Scholar] [CrossRef] [Scilit]
- Wang, Z.; He, H.; Yan, J.; Xu, Z.; Yang, G.; Wang, H.; Zhao, Y.; Cui, Z.; Yuan, X. Influence of Temperature Fluctuations on Anaerobic Digestion: Optimum Performance Is Achieved at 45 °C. Chem. Eng. J. 2024, 492, 152331. [Google Scholar] [CrossRef] [Scilit]
- Steiniger, B.; Hupfauf, S.; Insam, H.; Schaum, C. Exploring Anaerobic Digestion from Mesophilic to Thermophilic Temperatures—Operational and Microbial Aspects. Fermentation 2023, 9, 798. [Google Scholar] [CrossRef] [Scilit]
- Conrad, R. Complexity of Temperature Dependence in Methanogenic Microbial Environments. Front. Microbiol. 2023, 14, 1232946. [Google Scholar] [CrossRef] [Scilit]
- Chen, H.; Chang, S. Dissecting Methanogenesis for Temperature-Phased Anaerobic Digestion: Impact of Temperature on Community Structure, Correlation, and Fate of Methanogens. Bioresour. Technol. 2020, 306, 123104. [Google Scholar] [CrossRef] [Scilit] [PubMed]
- Jeniffer, G.; Carlos, M.; Paulo, G.G.; Francisco, R. Adaptation of a Temperature Model for Semi Continuous Anaerobic Digestion Reactor. SN Comput. Sci. 2025, 6, 307. [Google Scholar] [CrossRef] [Scilit]
- Haugen, F.; Bakke, R.; Lie, B. Adapting Dynamic Mathematical Models to a Pilot Anaerobic Digestion Reactor. Model. Identif. Control 2013, 34, 35–54. [Google Scholar] [CrossRef] [Scilit]
- Batstone, D.J.; Keller, J.; Angelidaki, I.; Kalyuzhnyi, S.V.; Pavlostathis, S.G.; Rozzi, A.; Sanders, W.T.M.; Siegrist, H.; Vavilin, V.A. Anaerobic Digestion Model No. 1 (ADM1). Water Sci. Technol. 2002, 45, 65–73. [Google Scholar] [CrossRef] [Scilit]
- Emebu, S.; Pecha, J.; Janáčová, D. Review on Anaerobic Digestion Models: Model Classification & Elaboration of Process Phenomena. Renew. Sustain. Energy Rev. 2022, 160, 112288. [Google Scholar] [CrossRef] [Scilit]
- Yuki Junior, G.M.; Sochard, S.; Dela Pierre, F.; Dinuccio, E.; Marias, F. Combining Thermal Model and Kinetics: Implications in Dynamic Simulation of Anaerobic Digesters. Bioresour. Technol. 2024, 413, 131343. [Google Scholar] [CrossRef] [Scilit]
- Pal, A.; Ilango, G.S. Design and Experimental Validation of a Thermal Model for Anerobic Digester for Consistent Biogas Production. Energy 2025, 334, 137632. [Google Scholar] [CrossRef] [Scilit]
- Ahmadi, A.; Avila, M.; Barna, L. Pathways for the Thermally Optimal Design and Practice of Anaerobic Digestion in Large-Scale Biogas Plants: Heat Transfer Modeling and Energy Analysis. Chem. Eng. Res. Des. 2023, 197, 884–907. [Google Scholar] [CrossRef] [Scilit]
- Hreiz, R.; Adouani, N.; Jannot, Y.; Pons, M.N. Modeling and Simulation of Heat Transfer Phenomena in a Semi-Buried Anaerobic Digester. Chem. Eng. Res. Des. 2017, 119, 101–116. [Google Scholar] [CrossRef] [Scilit]
- Miana, M.; Santamaría, A.M.; Carbajo, J.B.; Bengoechea, C.; García, G.; Izquierdo, S. A Practical Approach for Biochemical Modeling in the CFD Evaluation of Novel Anaerobic Digester Concepts for Biogas Production. Processes 2023, 11, 2851. [Google Scholar] [CrossRef] [Scilit]
- Farid, M.U.; Olbert, I.A.; Bück, A.; Ghafoor, A.; Wu, G. CFD Modelling and Simulation of Anaerobic Digestion Reactors for Energy Generation from Organic Wastes: A Comprehensive Review. Heliyon 2025, 11, e41911. [Google Scholar] [CrossRef] [Scilit]
- Teleszewski, T.J.; Żukowski, M. Analysis of Heat Loss of a Biogas Anaerobic Digester in Weather Conditions in Poland. J. Ecol. Eng. 2018, 19, 242–250. [Google Scholar] [CrossRef] [Scilit]
- Rynkowski, P. Heat Loss Analysis in the Semi-Buried Anaerobic Digester in Northeast Poland. In Proceedings of the E3S Web of Conferences, Białystok, Poland, 3 July 2018; EDP Sciences: London, UK, 2018; Volume 44. [Google Scholar]
- Gelegenis, J.; Samarakou, M.; Axaopoulos, P.; Tsilingiris, P. Energy Evaluation of Anaerobic Digesters. In Proceedings of the 2006 IASME/WSEAS International Conference on Energy & Environmental Systems, Chalkida, Greece, 8–10 May 2006. [Google Scholar]
- Godara, R.; Gakkhar, N.; Jha, M.K.; Vijay, V. Comprehensive Thermal Assessment of Anaerobic Digestion Process in Biogas Plants. Renew. Sustain. Energy Rev. 2026, 226, 116265. [Google Scholar] [CrossRef] [Scilit]
- Wang, H.; Zhou, Q. Dominant Factors Analyses and Challenges of Anaerobic Digestion under Cold Environments. J. Environ. Manag. 2023, 348, 119378. [Google Scholar] [CrossRef] [Scilit]
- Garkoti, P.; Ni, J.Q.; Thengane, S.K. Energy Management for Maintaining Anaerobic Digestion Temperature in Biogas Plants. Renew. Sustain. Energy Rev. 2024, 199, 114430. [Google Scholar] [CrossRef] [Scilit]
- Avila-Lopez, M.; Robles-Rodriguez, C.; Tiruta-Barna, L.; Ahmadi, A. Toward Thermal Autarky for Large-Scale Biogas Plants: Dynamic Energy Modeling for Energy Efficiency in Anaerobic Digesters with Enhanced Multimembrane Gasholders. Fuel 2023, 339, 126978. [Google Scholar] [CrossRef] [Scilit]
- El Ibrahimi, M.; Khay, I.; El Maakoul, A.; Bakhouya, M. A Novel Coupled Mixing and Heating Strategy for Improving the Energy Efficiency of Anaerobic Digesters with Submerged Waste: An Integrated Experimental and Numerical Study. Chem. Eng. J. 2025, 513, 162610. [Google Scholar] [CrossRef] [Scilit]
- Lindorfer, H.; Braun, R.; Kirchayr, R. Self-Heating of Anaerobic Digesters Using Energy Crops. Water Sci. Technol. 2006, 53, 159–166. [Google Scholar] [CrossRef] [Scilit]
- Axaopoulos, P.; Panagakis, P.; Tsavdaris, A.; Georgakakis, D. Simulation and Experimental Performance of a Solar-Heated Anaerobic Digester. Sol. Energy 2001, 70, 155–164. [Google Scholar] [CrossRef] [Scilit]
- Werszko, D. Wybrane Zagadnienia z Techniki Cieplnej; Oficyna Wydawnicza Politechniki Wrocławskiej: Warsaw, Poland, 2003; Edition III; ISBN 83-7985-740-X. [Google Scholar]
- PN-EN 6946; Building Components and Building Elements—Thermal Resistance and Thermal Transmittance—Calculation Method. Polish Committee for Standardization (PKN): Warsaw, Poland, 2017.
- ISO 13370; Thermal Performance of Buildings—Heat Transfer via the Ground—Calculation Methods. Polish Committee for Standardization (PKN): Warsaw, Poland, 2017.
- Caillet, H.; Bastide, A.; Adelard, L. Advances in Computational Fluid Dynamics Modeling of Anaerobic Digestion Process for Renewable Energy Production: A Review. Clean. Waste Syst. 2023, 6, 100124. [Google Scholar] [CrossRef] [Scilit]
- EN 52016; Energy Performance of Buildings—Energy Needs for Heating and Cooling, Internal Temperatures and Sensible and Latent Heat Loads—Part 1: Calculation Procedures. Polish Committee for Standardization (PKN): Warsaw, Poland, 2017.
- Chem, G.P. Raport z Wyników Badań Zgodnie z ISO/IEC 17025:2018-02: Badania Laboratoryjne Biogazu (Biogaz Surowy); Laboratory of Biogas Testing and Analysis GP CHEM: Toruń, Poland, 2023. [Google Scholar]
- Prediction of Worldwide Energy Resources (POWER) Project NASA Langley Research Center (LaRC). Available online: https://power.larc.nasa.gov/ (accessed on 28 April 2025).
- PN-EN 15241; Ventilation for Buildings—Calculation Methods for Energy Losses Due to Ventilation and Infiltration in Commercial Buildings. Polish Committee for Standardization (PKN): Warsaw, Poland, 2011.

Disclaimer/Publisher’s Note: The statements, opinions and data contained in all publications are solely those of the individual author(s) and contributor(s) and not of MDPI and/or the editor(s). MDPI and/or the editor(s) disclaim responsibility for any injury to people or property resulting from any ideas, methods, instructions or products referred to in the content. |
© 2025 by the authors. Licensee MDPI, Basel, Switzerland. This article is an open access article distributed under the terms and conditions of the Creative Commons Attribution (CC BY) license.