


Abstract
Background and Objectives: Relative dose intensity (RDI) reflects how closely chemotherapy follows the planned dose and schedule. We aimed to identify pretreatment factors associated with low RDI during first-line chemotherapy for epithelial ovarian cancer (EOC) and to examine the relationship between RDI and survival. Materials and Methods: This single-center retrospective cohort included 355 patients with EOC who received first-line platinum-based chemotherapy between 2015 and 2025. Mean RDI was calculated from taxane and platinum RDI, with low RDI defined as <85%. Logistic regression was used to identify related factors and construct a nomogram, which was internally validated by 1000 bootstrap resamples. Progression-free survival (PFS) and overall survival (OS) were evaluated using Kaplan–Meier analysis, multivariable Cox regression, and a 6-month landmark analysis. Results: Low RDI occurred in 128 patients (36.1%). Higher BMI category, bilateral/multifocal tumor distribution, baseline neutropenia, and lower prognostic nutritional index were independently associated with low RDI. The nomogram showed an apparent AUC of 0.726 (95% CI: 0.670–0.782) and a bootstrap-corrected AUC of 0.719. After multivariable adjustment, low RDI remained associated with shorter PFS (adjusted HR = 2.234, 95% CI: 1.466–3.405) and OS (adjusted HR = 3.074, 95% CI: 1.658–5.700). The landmark analysis showed a similar pattern. Conclusions: Low RDI may reflect greater treatment vulnerability and difficulty in completing first-line chemotherapy according to the planned dose and schedule. Pretreatment risk assessment may help identify patients who need closer monitoring, while external validation of the nomogram remains necessary.
1. Introduction
Epithelial ovarian cancer (EOC) remains one of the most lethal gynecologic malignancies worldwide. Because early symptoms are often vague and effective screening strategies are limited, many patients are diagnosed at an advanced stage [1]. Although cytoreductive surgery combined with platinum-based chemotherapy has improved disease control, recurrence after initial treatment remains common and continues to be a major clinical challenge [2]. In recent years, the treatment landscape of ovarian cancer has changed substantially with wider use of biomarker testing, antiangiogenic agents, PARP inhibitors, and maintenance therapy [3,4,5]. Even in this evolving treatment era, however, first-line platinum-based chemotherapy remains a central component of care, whether administered after primary debulking surgery or before interval debulking surgery as neoadjuvant chemotherapy [6].
For most patients with EOC, first-line chemotherapy is based on a platinum-taxane regimen, commonly carboplatin plus paclitaxel [3]. In clinical practice, however, treatment is not always delivered exactly as planned. Dose reductions, cycle delays, schedule changes, and early discontinuation may occur because of hematologic toxicity, postoperative recovery, neuropathy, organ dysfunction, poor nutritional status, or reduced general condition [7,8]. These modifications are often clinically necessary and may protect patients from excessive toxicity. At the same time, they can reduce the actual amount of chemotherapy delivered over time and may affect treatment intensity during a period when disease control is especially important.
Relative dose intensity (RDI) can be used to describe the difference between delivered and planned chemotherapy. Unlike total dose alone, RDI considers both dose reduction and treatment delay, and therefore provides a broader measure of treatment intensity in routine care [9]. A patient may receive a lower dose, experience a prolonged interval between cycles, change from a standard 3-weekly regimen to a weekly or otherwise adjusted schedule, or stop treatment early; all of these changes can lower the final RDI. Previous studies in ovarian cancer have commonly used 85% as the cutoff for reduced RDI [10,11], and this threshold has also been applied in broader oncology studies [9,12]. We therefore selected 85% as the primary cutoff in the present study. Because RDI is a continuous measure, sensitivity analyses using thresholds of 80% and 90% were also performed.
Earlier studies reported that reduced RDI during primary chemotherapy was associated with poorer survival in patients with epithelial ovarian cancer [10,11], while more recent studies have shown that chemotherapy modification and inter-cycle treatment delay remain common in contemporary ovarian cancer care [12,13]. Low RDI may therefore reflect not only reduced chemotherapy delivery, but also difficulty in maintaining the planned treatment course. This difficulty may be related to baseline physical condition, body weight, nutritional reserve, disease burden, postoperative recovery, organ function, and hematologic tolerance [14,15]. Although RDI has clinical value, most previous studies have focused on only one or two aspects of reduced RDI, such as survival, body mass index, treatment delay, or chemotherapy dose modification [12,14,16]. Less attention has been given to the combined clinical factors associated with difficulty in maintaining chemotherapy intensity. We therefore evaluated clinicopathological characteristics, surgical information, baseline laboratory findings, and chemotherapy-delivery data together, with the aim of identifying patients at greater risk of low RDI.
In this study, we reviewed a single-center cohort of patients with epithelial ovarian cancer who received first-line platinum-based chemotherapy. We examined clinical factors associated with low RDI and developed a prediction model using the independent predictors. We also evaluated the association between RDI status and survival outcomes, with additional analyses to reduce the influence of confounding and time-related bias. The findings may provide information for earlier recognition of patients at risk of low RDI and closer management during first-line chemotherapy.
2. Materials and Methods
This study was designed as a single-center retrospective cohort study. The study was approved by the institutional ethics review committee of Beijing Chaoyang Hospital, Capital Medical University (2026-sci-822). The study was reported in accordance with the STROBE checklist provided in the Supplementary Materials Table S1.
2.1. Study Population
We retrospectively screened patients with histologically confirmed epithelial ovarian cancer who received first-line treatment at Beijing Chaoyang Hospital, Capital Medical University, between 1 January 2015 and 31 December 2025.
Patients were included if they met the following criteria: histologically confirmed epithelial ovarian cancer; receipt of first-line platinum-based systemic chemotherapy at our center; available chemotherapy records needed to calculate RDI, including the planned regimen, administered doses, treatment dates, and number of cycles. Baseline clinicopathological data, treatment response assessments, and follow-up information were also required. Patients who did not receive first-line platinum-based chemotherapy were excluded, as were those with another malignancy that could influence treatment choice, dose modification, response assessment, or prognosis.
2.2. RDI Assessment and Study Variables
Relative dose intensity (RDI) was calculated separately for the taxane and platinum components of first-line chemotherapy. For each agent, planned dose intensity was calculated as the planned cumulative dose divided by the planned treatment duration, while delivered dose intensity was calculated as the actual cumulative administered dose divided by the actual treatment duration. The expected dose for each administration was determined according to the specific agent, treatment schedule, and individual dosing requirements. The formulas were as follows:
Taxane RDI and platinum RDI were first calculated separately, and mean RDI was then defined as the arithmetic average of the two values:
Dose reduction was reflected by a lower actual cumulative administered dose than the corresponding cumulative expected dose, while treatment delay or interruption increased the actual treatment duration. For patients who discontinued chemotherapy early, the actual cumulative administered dose was used as the delivered dose, while the intended planned dose and duration were retained. When the chemotherapy agent or schedule changed, including a change to weekly administration, the expected dose and interval for subsequent administrations were recalculated according to the new regimen; the actual administered doses and treatment dates were then used to calculate delivered dose intensity. No dose equivalence was assumed between different taxane or platinum agents. Patients were classified as standard RDI (mean RDI ≥ 85%) or low RDI (mean RDI < 85%). The 85% cutoff was selected based on previous ovarian cancer and broader oncology studies [9,10,11], and 80% and 90% were used as alternative thresholds in sensitivity analyses.
Clinical, pathological, surgical, laboratory, and chemotherapy-related variables were extracted from the medical records. Laboratory data were collected from routine blood tests within 1 week before the first chemotherapy cycle, including complete blood count and serum biochemical tests. PNI, NLR, and PLR were calculated from baseline albumin, neutrophil, lymphocyte, and platelet measurements and were considered in the exploratory assessment of nutritional and inflammatory status. PNI was calculated as serum albumin (g/L) + 5 × absolute lymphocyte count (×109/L); NLR was calculated as neutrophil count divided by lymphocyte count. Baseline neutropenia used in the regression analyses was defined as ANC < 1.8 × 10⁹/L, based on the lower reference limit used for laboratory classification in our dataset.
Chemotherapy delivery data included the planned regimen, administered agents and doses, treatment dates, cycle intervals, and the number of completed cycles. Treatment modification was defined as any change from the initially planned chemotherapy delivery, including dose reduction, chemotherapy delay, change from the standard 3-weekly schedule to weekly administration or another adjusted schedule, and early discontinuation before completion of the planned treatment course. The main recorded adverse reaction during chemotherapy was also reviewed and classified according to the leading reaction documented in the medical record, including myelosuppression, drug-induced liver injury or liver dysfunction, gastrointestinal or other intercurrent clinical conditions, allergic reaction or hypersensitivity, renal impairment or urinary tract condition, and poor general condition. Free-text records were additionally reviewed for patient preference or refusal and neuropathy symptoms. Myelosuppression was categorized as grade I–II or grade III–IV according to the highest documented grade during first-line chemotherapy.
To describe changes in treatment practice over time, chemotherapy start year, bevacizumab use, and PARP inhibitor use were extracted when available. Treatment era was defined according to chemotherapy start year and was grouped as before 2020 or 2020 and later. Because PARP inhibitor records were incomplete in some patients, analyses involving PARP inhibitor use were performed using available records only.
2.3. Follow-Up and Survival Outcomes
Follow-up information was obtained from medical and outpatient records. The initiation of first-line treatment was used as the index date for survival analysis. PFS was measured from this date to disease progression, recurrence, death, or last follow-up, while OS was measured to death from any cause or last follow-up. Because final RDI was determined during chemotherapy, we also performed a 6-month landmark analysis to reduce potential time-related bias, as this period approximately corresponds to the duration of first-line platinum-based chemotherapy. Patients who experienced the corresponding event or were censored before the landmark were excluded, and survival time was recalculated from the 6-month landmark.
2.4. Statistical Analysis
Statistical analyses were performed using R software (v4.4.1, R Foundation for Statistical Computing, Vienna, Austria), SPSS Statistics (v28.0, IBM Corp., Armonk, NY, USA), and GraphPad Prism (v9.5.0, GraphPad Software, Boston, MA, USA).
Continuous variables were summarized as mean ± standard deviation or median with interquartile range, as appropriate, while categorical variables were presented as numbers and percentages. Between-group comparisons used parametric or nonparametric tests for continuous variables, and chi-square or Fisher’s exact tests for categorical variables, as appropriate.
Univariable logistic regression was used to identify factors associated with low RDI. BMI was classified according to Chinese adult criteria as <18.5, 18.5–23.9, 24.0–27.9, and ≥28.0 kg/m2. Variables showing significant univariable associations and considered clinically relevant were considered for the multivariable model. Variables with substantial missingness, sparse observations, or overlapping information were not entered simultaneously. Missing data were handled by complete-case analysis without imputation, and collinearity was assessed using variance inflation factors. A reduced logistic regression model including the four independent predictors identified in the multivariable analysis was refitted using patients with complete data for these predictors and was used to construct the nomogram. Model performance was assessed by ROC analysis with a 95% confidence interval, 1000 bootstrap resamples for internal validation, calibration plot, calibration slope and intercept, Brier score, and decision curve analysis. Calibration was further assessed across deciles of predicted risk by comparing the mean predicted probability with the observed proportion of low RDI in each risk group.
PFS and OS were compared using Kaplan–Meier curves and log-rank tests. Restricted mean survival time (RMST) up to 60 months was additionally estimated for PFS and OS, and between-group RMST differences were calculated with a 95% confidence intervals. Multivariable Cox proportional hazards models were used to adjust for potential confounders, including age, FIGO stage, histological subtype, treatment sequence, R0 resection, treatment era, and bevacizumab use; PARP inhibitor use was included in a secondary model for patients with available records.
Sensitivity analyses used mean RDI thresholds of 80% and 90%, with 85% retained as the primary cutoff. We also repeated the multivariable logistic regression after excluding patients who underwent a regimen or schedule modification during first-line chemotherapy. Dose reductions and treatment delays were retained because they are intrinsic components of RDI rather than alternative treatment strategies. The baseline neutropenia definition was further tested using ANC cutoffs of 1.5 and 1.0 × 10⁹/L. A two-sided p value < 0.05 was considered statistically significant.
3. Results
3.1. Study Cohort and Baseline Characteristics According to RDI Status
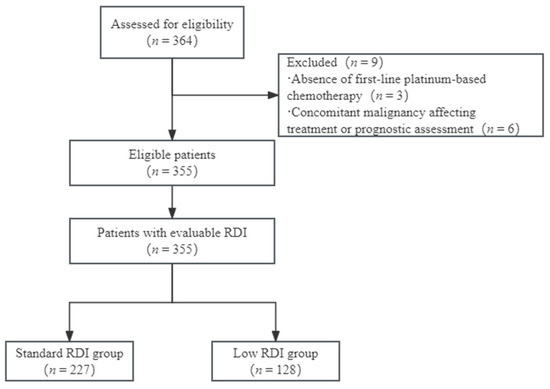
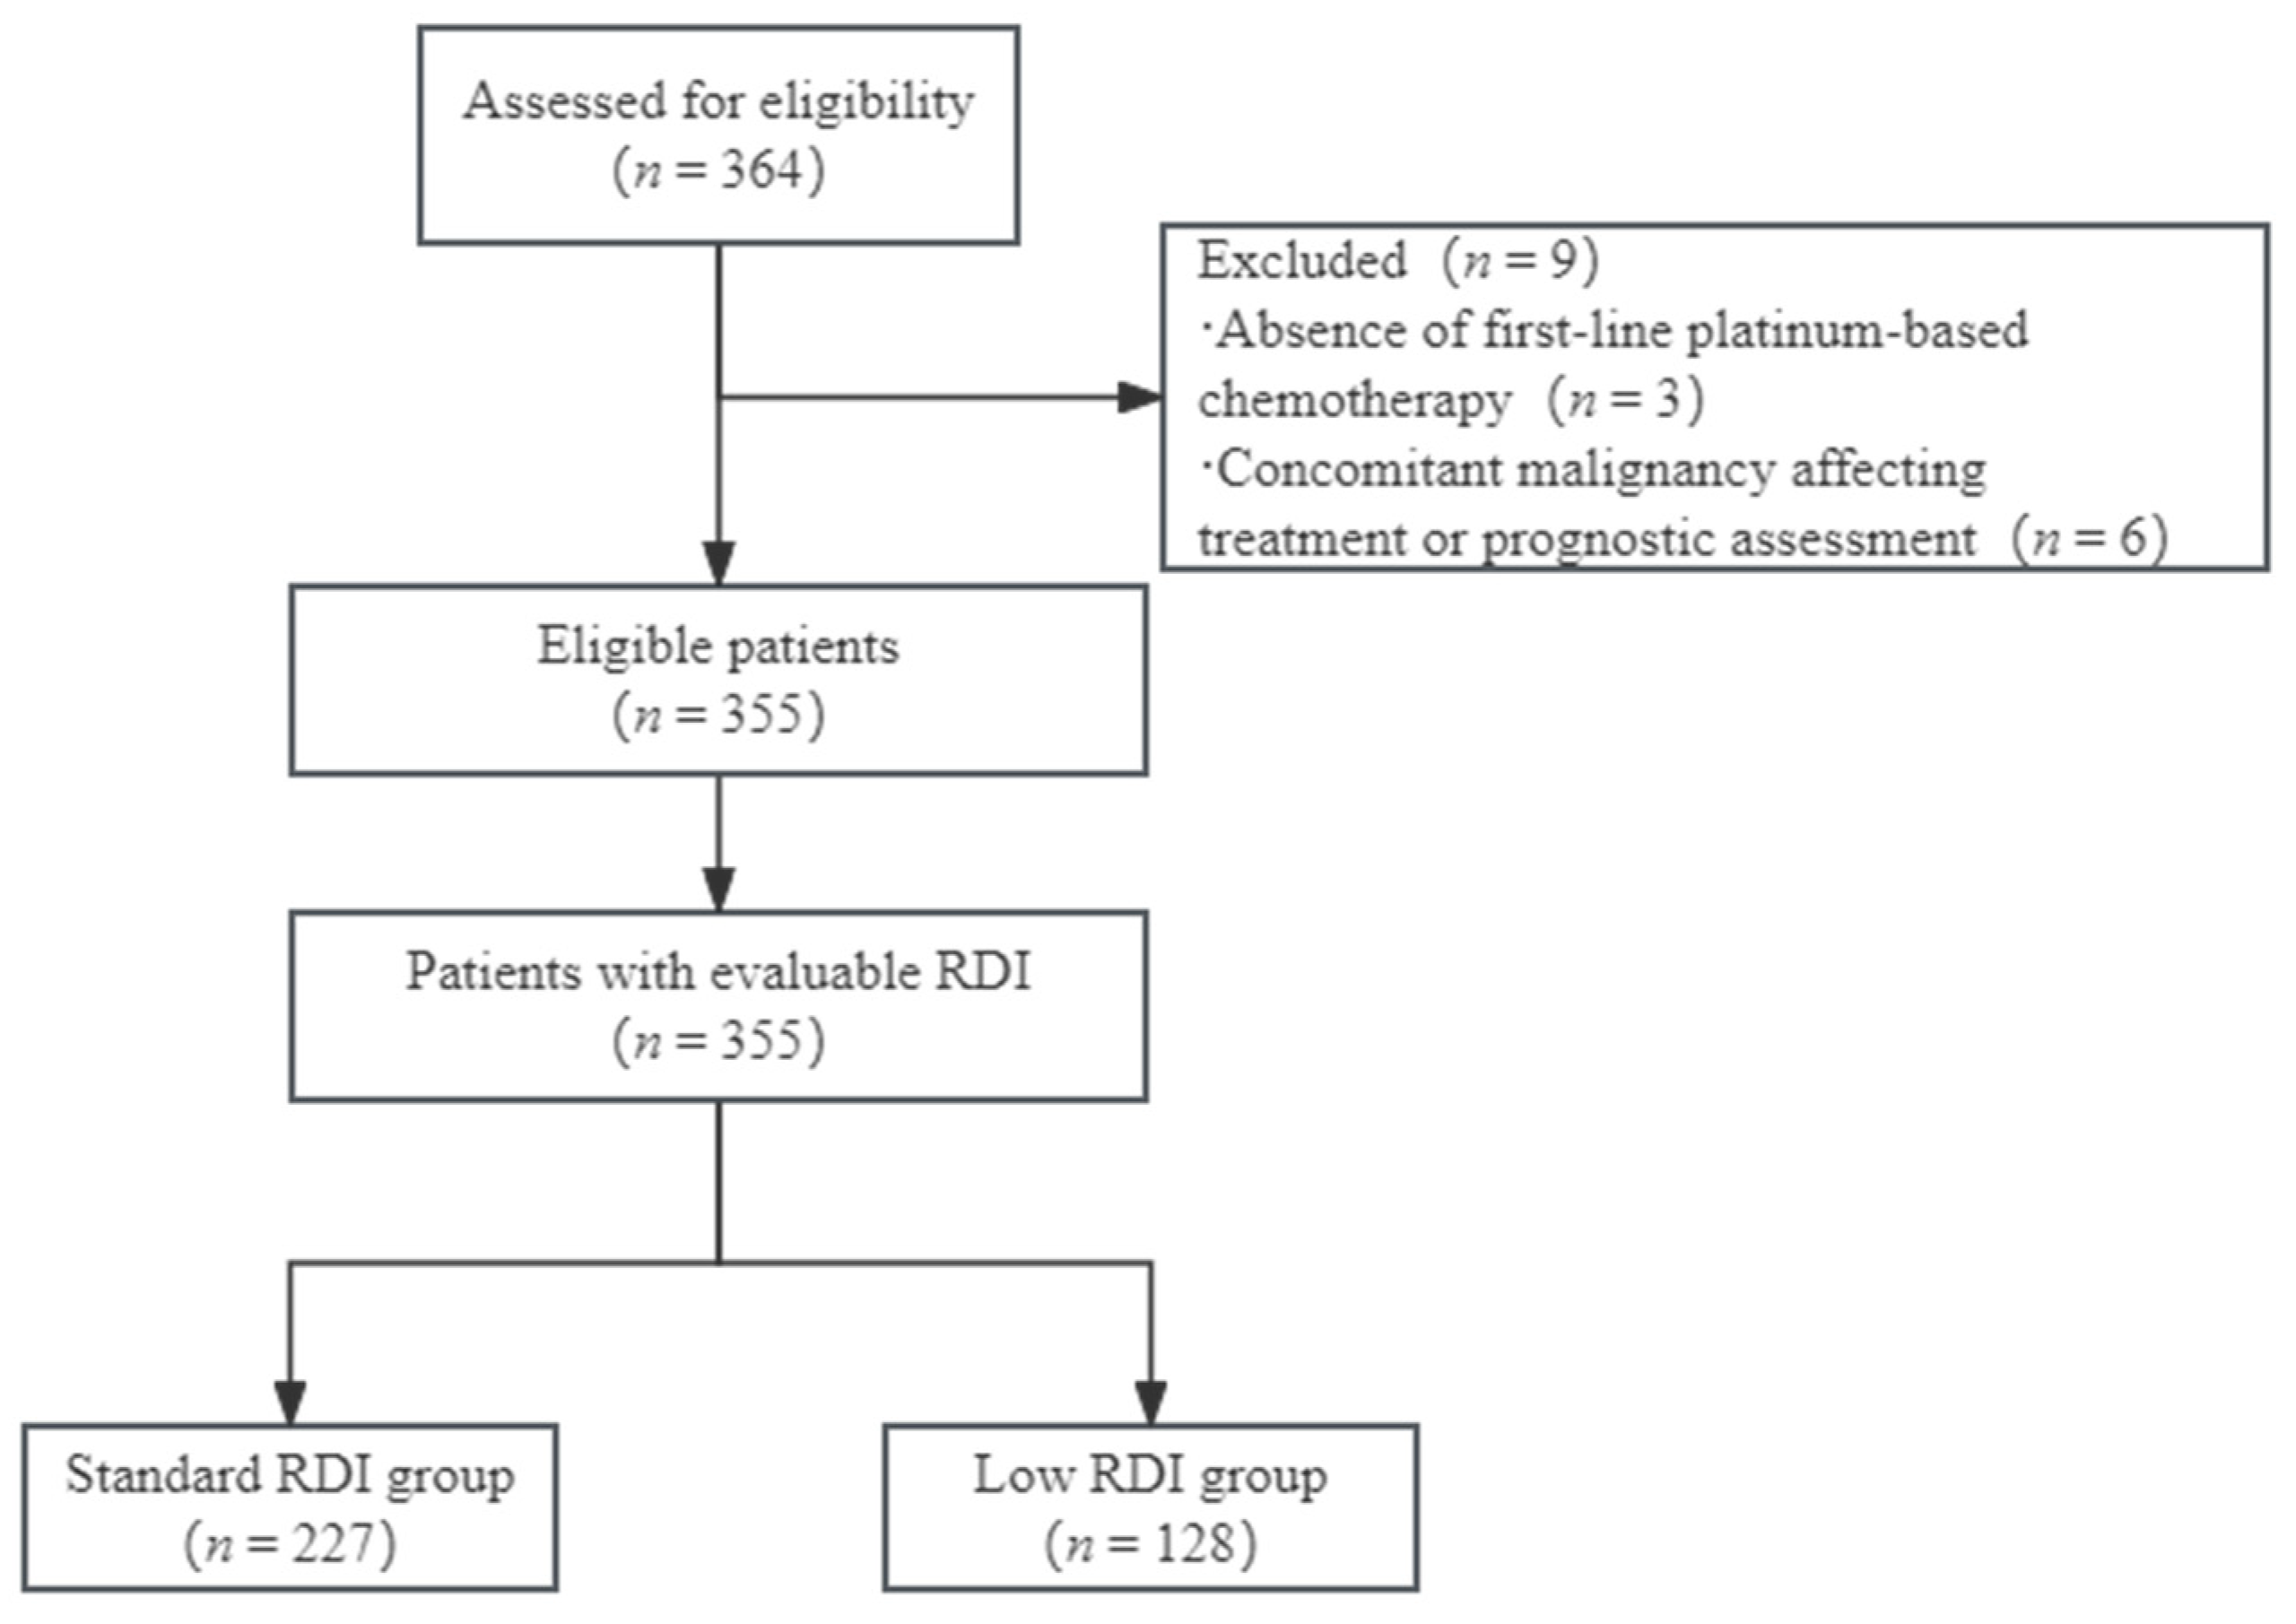
A total of 364 patients with epithelial ovarian cancer were screened during the study period; 9 patients were excluded, including 3 who did not receive first-line platinum-based chemotherapy and 6 who had concomitant malignancies that could affect treatment choice or prognostic assessment. Finally, 355 patients with evaluable relative dose intensity (RDI) were included in the analysis. According to the prespecified cutoff of 85%, 227 patients were classified into the standard RDI group, and 128 patients were classified into the low RDI group. The patient screening, exclusion, and grouping process is shown in Figure 1.
Figure 1.
Flowchart of patient selection and RDI grouping.
After grouping patients by RDI status, we compared their baseline characteristics to identify clinical features associated with reduced chemotherapy intensity. Key clinicopathological, surgical, and laboratory variables are shown in Table 1, and the full baseline comparison is provided in Supplementary Table S2. Most demographic, pathological, and routine laboratory variables were similar between the groups.
Table 1.
Key clinicopathological, surgical, and laboratory characteristics according to RDI status.
Several differences were observed in tumor burden, surgical findings, and baseline laboratory measures. BMI showed no significant overall four-category difference (p = 0.190), and the proportion of patients with low RDI differed across BMI categories, with relatively higher proportions observed in the overweight and obesity groups. The low-RDI group more often had bilateral or non-lateralized diffuse disease, FIGO stage III–IV disease (77.34% vs. 55.51%), and positive ascites cytology (60.16% vs. 36.56%); it also had a lower R0 resection rate (69.53% vs. 85.46%) and greater intraoperative blood loss. The distributions of lymphovascular space invasion and lymph node metastasis also differed significantly between the two groups (p = 0.017 and p = 0.046, respectively). Baseline ALC, Hb, ALB, PA, PNI, TBIL, and potassium were also lower in the low-RDI group, while NLR and PLR were similar between groups.
3.2. First-Line Chemotherapy Delivery by RDI Status
First-line chemotherapy delivery differed between the two RDI groups (Table 2). Taxane use was similar, whereas carboplatin use was lower in the low-RDI group (82.81%). Patients with low RDI were also more likely to receive a weekly or otherwise modified schedule rather than the standard 3-weekly regimen (14.84% vs. 2.20%).
Table 2.
Comparison of first-line chemotherapy delivery by RDI status.
Treatment modification was closely related to RDI status. All patients in the low RDI group had at least one modification during first-line chemotherapy, whereas this occurred in 24.70% of patients in the standard RDI group (p < 0.0001). Treatment modification included dose reduction, treatment delay, changes in regimen or schedule, and early discontinuation before completing the planned chemotherapy course. Because these changes directly contributed to the calculation of RDI, they were considered components of the low-RDI treatment pattern rather than independent clinical associations. We also reviewed the main adverse reactions recorded during chemotherapy (Table 2). Because these changes directly affect RDI, they were treated as part of the treatment-delivery pattern rather than as independent predictors. Grade III–IV myelosuppression was also more frequent in the low-RDI group (81.25% vs. 60.35%), while other recorded adverse reactions showed no clear difference.
Treatment era and targeted or maintenance therapy use are shown in Table S3. Patients treated from 2020 onward were less common in the low-RDI group (60.9% vs. 78.4%), whereas bevacizumab and PARP inhibitor use were similar between groups. Use of these therapies increased over time, particularly after 2020.
3.3. Factors Associated with Low RDI and Nomogram-Based Risk Prediction
Logistic regression was used to identify factors associated with low RDI (Table 3 and Table 4). In the univariable analysis, several tumor-related, hematologic, nutritional, and biochemical variables showed associations with low RDI; lower PNI was significant, whereas NLR and PLR were not. Baseline neutropenia was used in the regression analyses. The multivariable model included 340 complete cases, 122 low-RDI events, and eight predictors; all VIF values were below 2.0. After adjustment, higher BMI category (OR = 1.404, 95% CI: 1.044–1.889), bilateral/multifocal tumor distribution (OR = 1.959, 95% CI: 1.164–3.298), baseline neutropenia (OR = 4.359, 95% CI: 1.635–11.627), and lower PNI (OR = 1.267 per 5-point decrease, 95% CI: 1.049–1.529) remained independently associated with low RDI. FIGO stage III–IV, positive ascites cytology, anemia, and hypokalemia were not significant after adjustment.
Table 3.
Univariable logistic regression analysis of factors associated with low RDI.
Table 4.
Multivariable logistic regression analysis of factors associated with low RDI.
Sensitivity analyses showed a generally similar pattern. Obesity remained associated with higher odds of low RDI compared with normal BMI, while continuous BMI showed the same direction but did not reach statistical significance (Table S4). After excluding 15 patients with regimen or schedule modifications, higher BMI category, baseline neutropenia, and lower PNI remained associated with low RDI, whereas the association with bilateral/multifocal tumor distribution was attenuated (adjusted OR = 1.711, 95% CI: 0.994–2.944; p = 0.052) (Table S5). Using an ANC cutoff of <1.5 × 10⁹/L, the association with low RDI remained in the same direction but was no longer statistically significant after adjustment (adjusted OR = 2.171, 95% CI: 0.690–6.833; p = 0.185). No patient had baseline ANC < 1.0 × 10⁹/L, so this threshold could not be examined further.
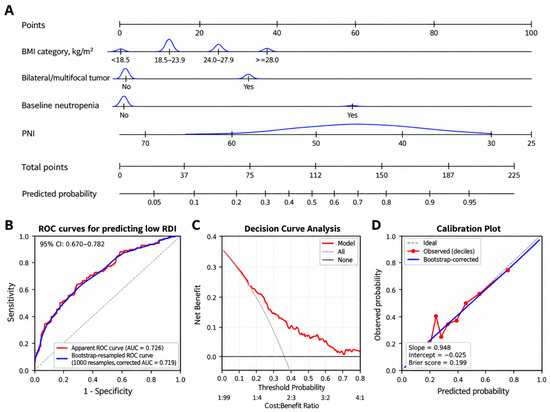
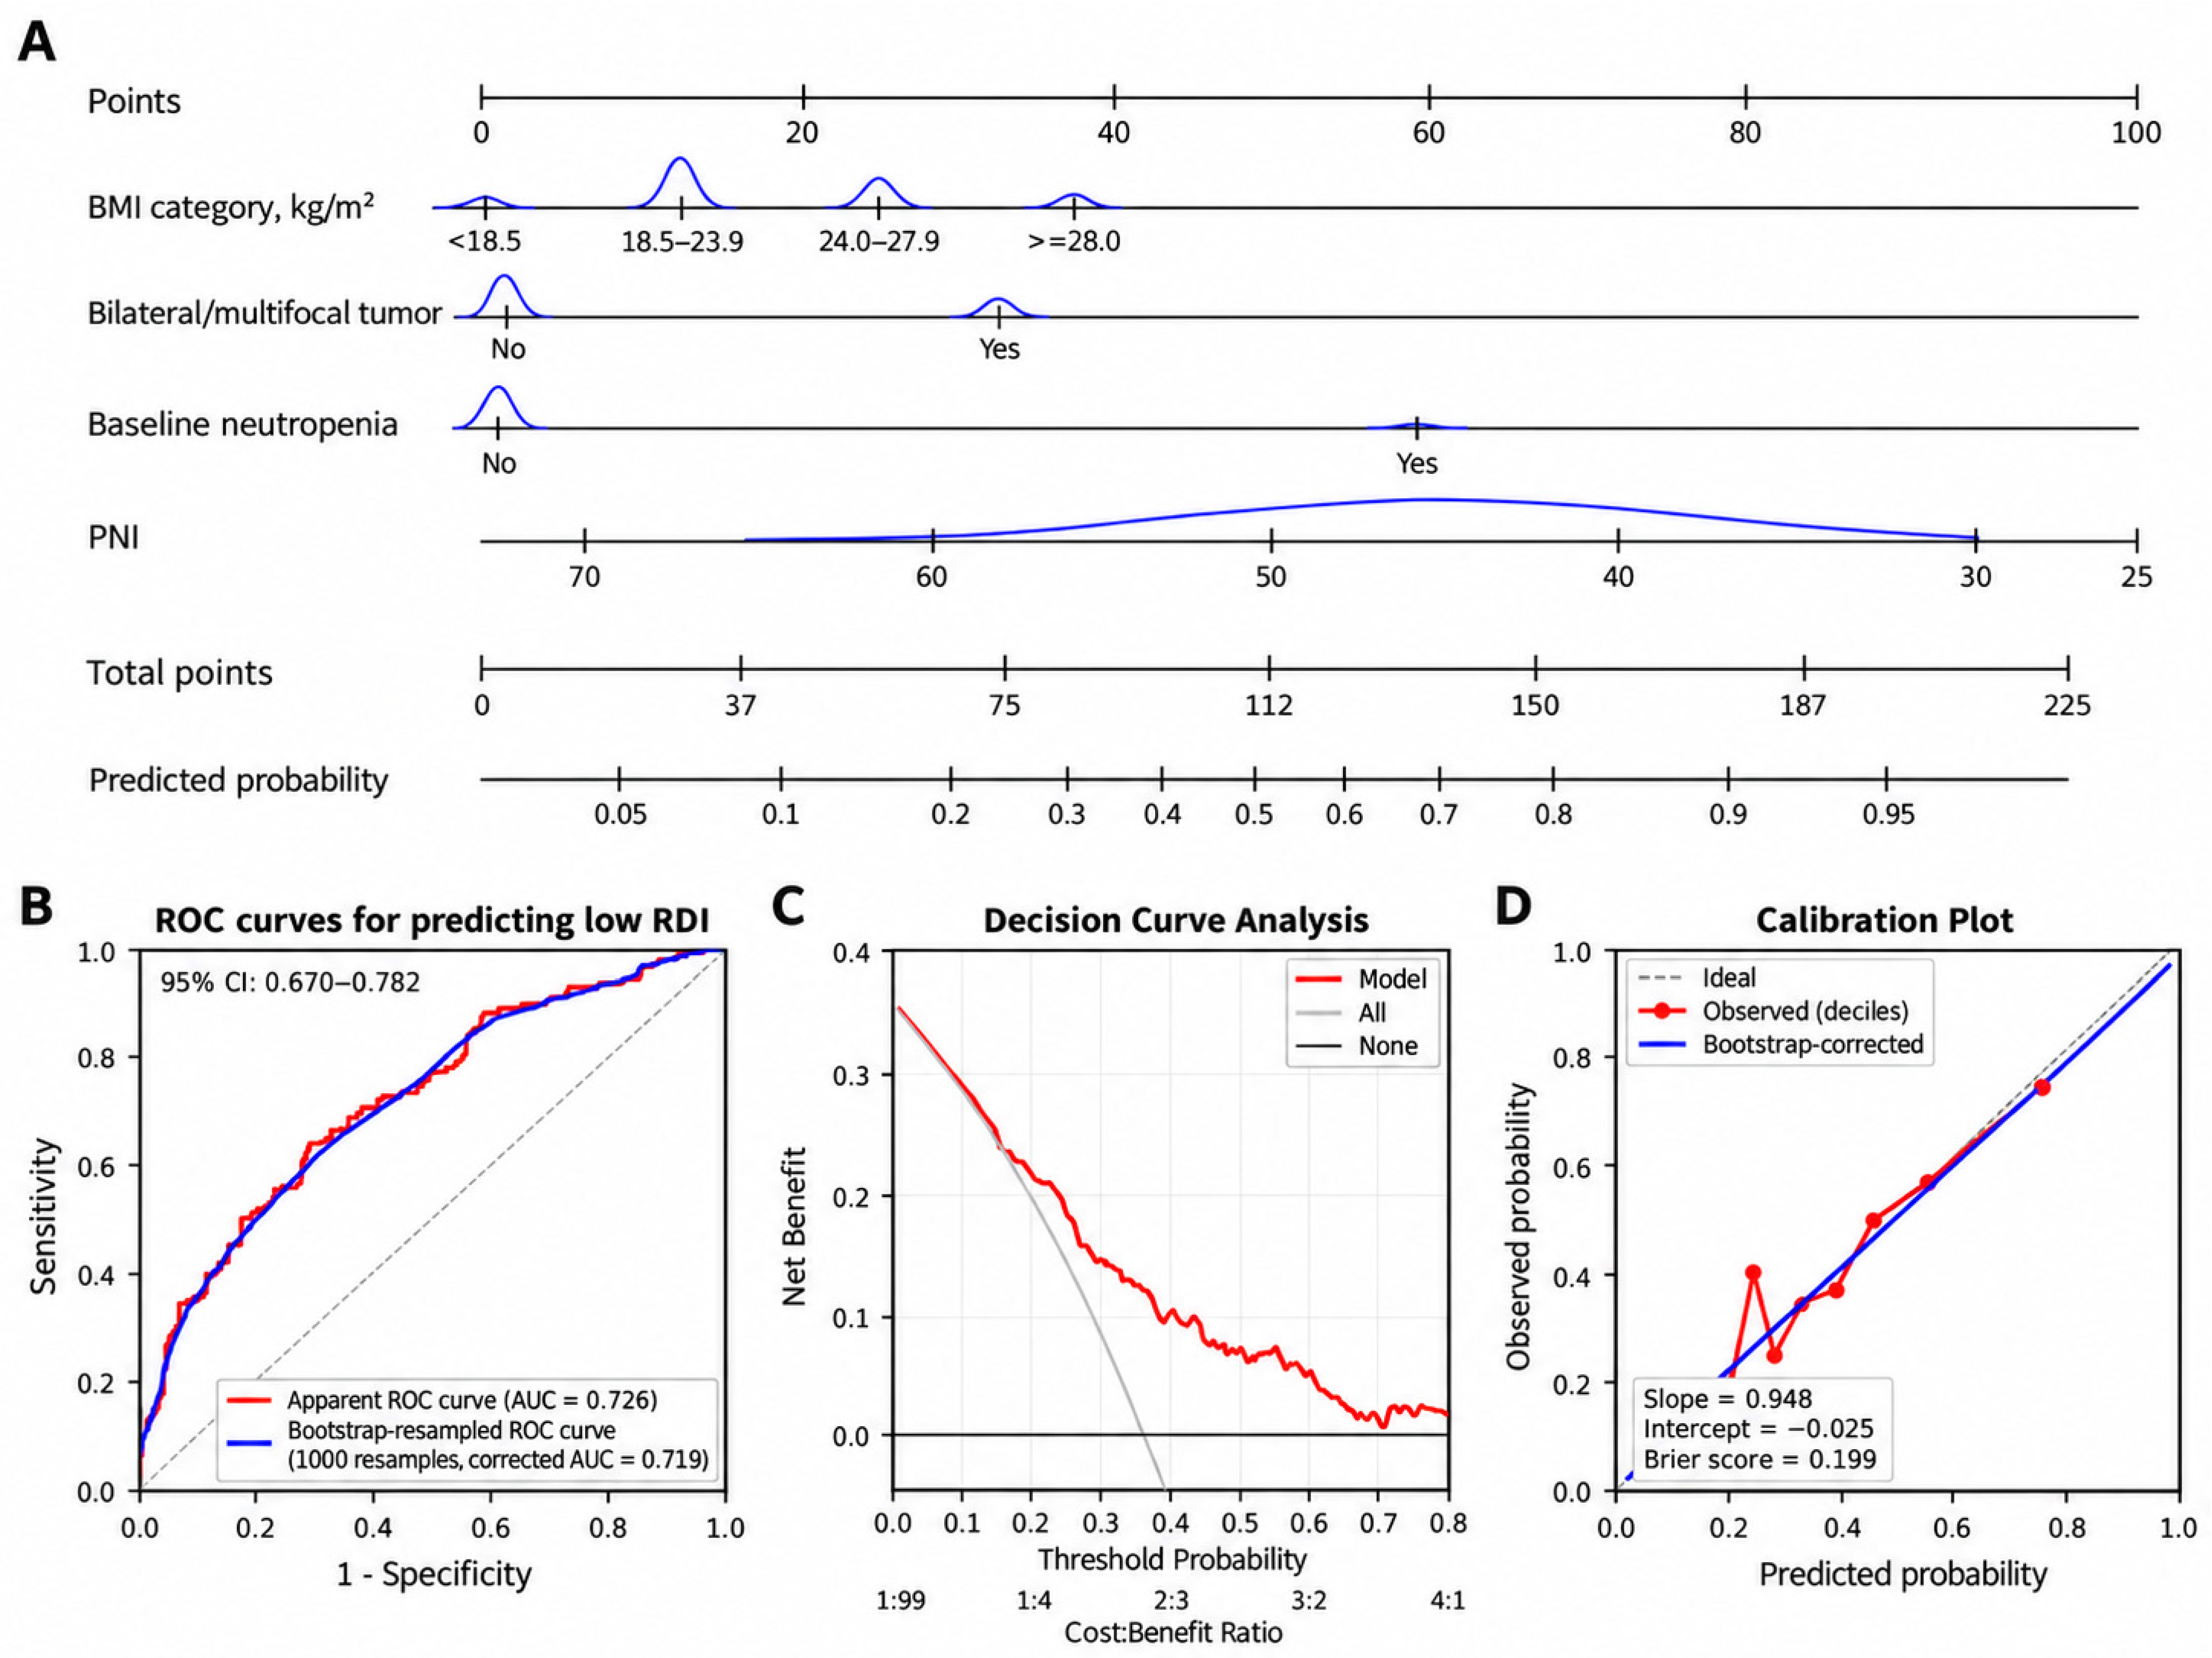
To develop the nomogram, a reduced four-predictor logistic model was refitted using BMI category, bilateral/multifocal tumor distribution, baseline neutropenia, and PNI (Figure 2A). For each patient, points are assigned for the four predictors and summed to obtain a total score; this score is then projected onto the “Predicted probability” scale to estimate the probability of low RDI.
Figure 2.
Nomogram-based prediction and internal validation of low relative dose intensity risk. (A) Nomogram constructed using BMI category, bilateral/multifocal tumor distribution, baseline neutropenia, and PNI. (B) Receiver operating characteristic curves showing an apparent AUC of 0.726 (95% CI: 0.670–0.782) and a bootstrap-corrected AUC of 0.719 after 1000 resamples; the gray dashed diagonal line indicates the no-discrimination reference line. (C) Decision curve analysis showing the net benefit of the nomogram across threshold probabilities. (D) Calibration plot comparing predicted and observed probabilities of low RDI; the gray dashed line indicates ideal calibration, and the red points represent the observed low-RDI proportions across deciles of predicted risk. The bootstrap-corrected calibration slope was 0.948, the calibration intercept was −0.025, and the Brier score was 0.199.
The nomogram showed moderate discrimination, with an apparent AUC of 0.726 (95% CI: 0.670–0.782). After 1000 bootstrap resamples, the optimism-corrected AUC was 0.719, indicating relatively stable internal performance (Figure 2B). Decision curve analysis suggested potential net benefit across part of the evaluated threshold range (Figure 2C). Calibration was generally good, with a bootstrap-corrected slope of 0.948, an intercept of −0.025, and a Brier score of 0.199; the decile-based observed points also showed reasonable agreement between predicted and observed risk (Figure 2D). External validation is still required before routine clinical use.
3.4. Association Between RDI Status and Survival Outcomes
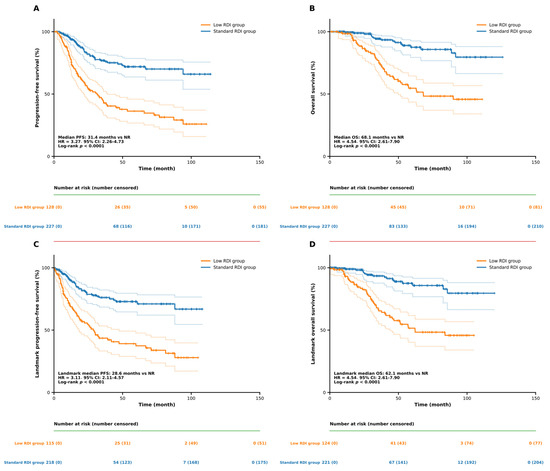
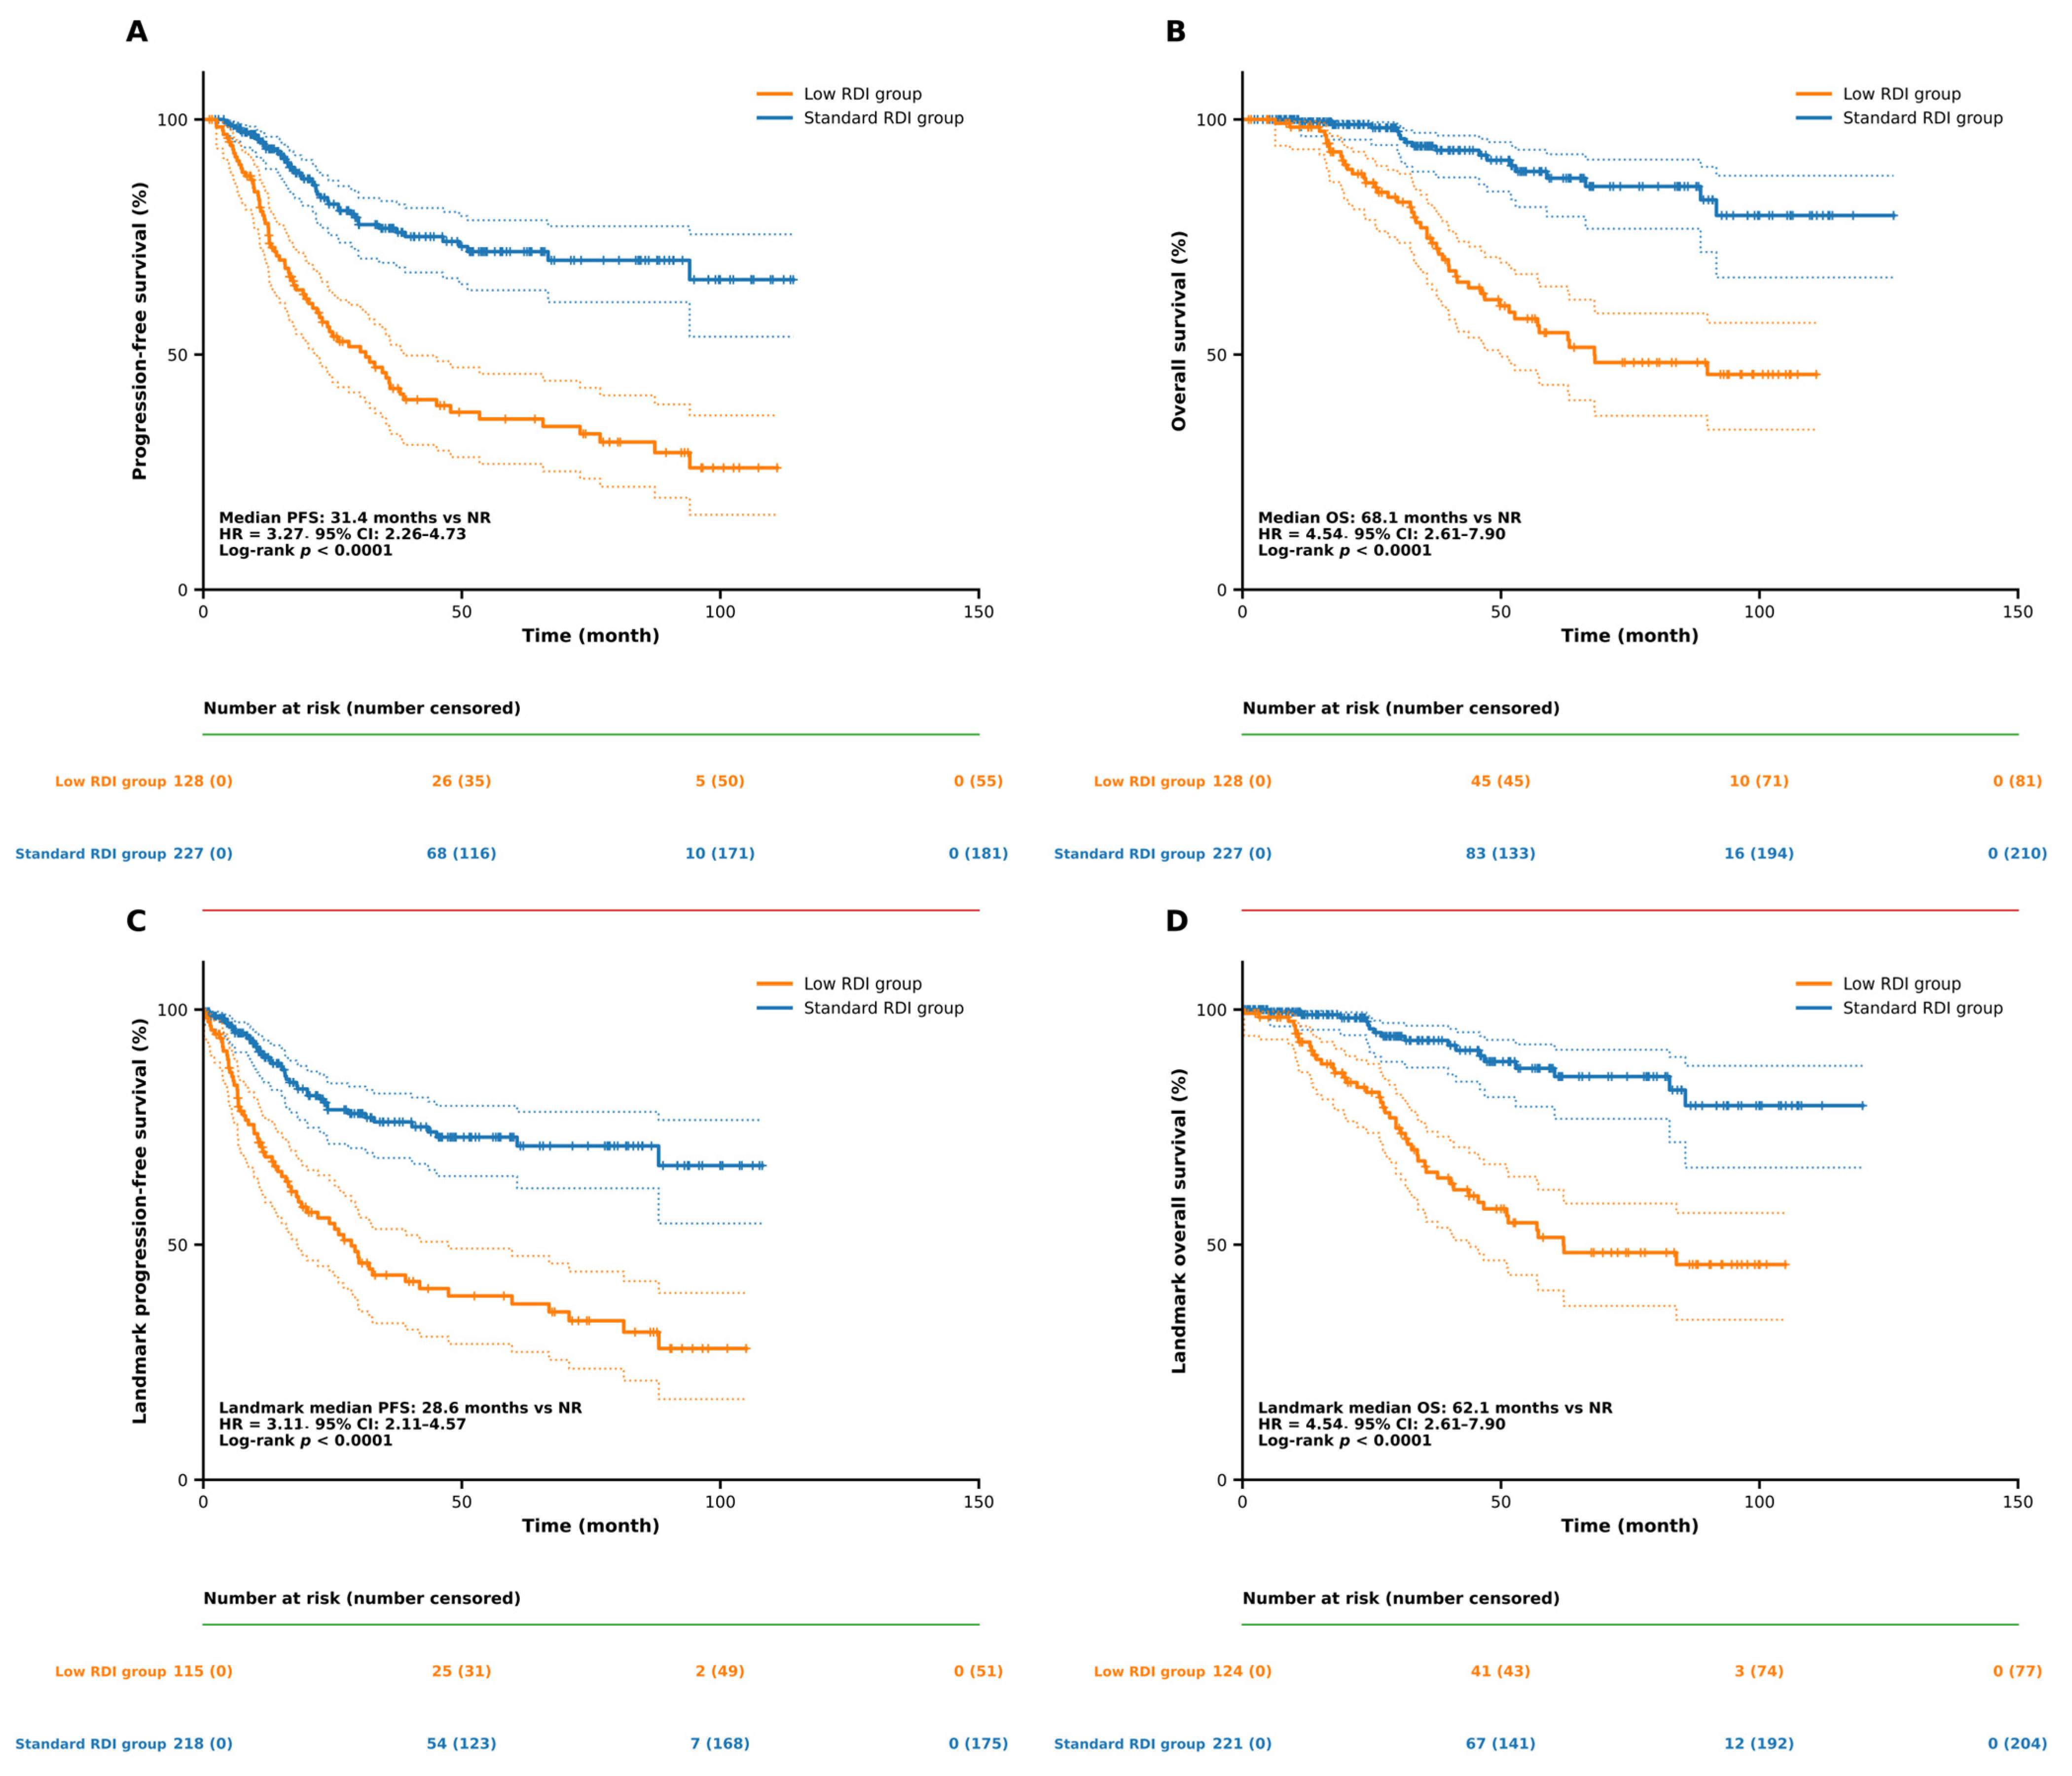
Kaplan–Meier analysis showed shorter PFS and OS in the low-RDI group than in the standard-RDI group (Figure 3A,B). Median PFS was 31.4 months in the low-RDI group and was not reached in the standard-RDI group (HR = 3.27, 95% CI: 2.26–4.73; log-rank p < 0.0001). Median OS was 68.1 months in the low-RDI group and was not reached in the standard-RDI group (HR = 4.54, 95% CI: 2.61–7.90; log-rank p < 0.0001). At 60 months, the RMST difference between the standard- and low-RDI groups was 15.16 months for PFS (95% CI: 10.13–20.16; p < 0.001) and 9.15 months for OS (95% CI: 5.74–12.47; p < 0.001). The 6-month landmark analysis showed the same overall pattern, with shorter PFS and OS in the low-RDI group after excluding earlier events or censoring (Figure 3C,D).
Figure 3.
Kaplan–Meier survival curves according to RDI status and 6-month landmark sensitivity analyses. (A) Progression-free survival and (B) overall survival in the low-RDI and standard-RDI groups. Six-month landmark analyses are shown for (C) progression-free survival and (D) overall survival. Dotted lines indicate the 95% confidence intervals.
Multivariable Cox regression confirmed the association between low RDI and poorer survival (Table 5). After adjustment for age, FIGO stage, histological subtype, treatment sequence, R0 resection, treatment era, and bevacizumab use, low RDI remained associated with shorter PFS (adjusted HR = 2.234, 95% CI: 1.466–3.405; p < 0.001) and OS (adjusted HR = 3.074, 95% CI: 1.658–5.700; p < 0.001). A secondary model including PARP inhibitor use produced similar estimates, while BRCA mutation status and HRD were not included because these data were not consistently available.
Table 5.
Multivariable Cox regression analyses for PFS and OS according to RDI status.
Sensitivity analyses using RDI thresholds of 80% and 90% showed that lower RDI remained associated with shorter PFS and OS across the tested cutoffs (Table S6). The strength of the associations varied, and the 90% threshold classified a substantially larger proportion of patients as having low RDI.
4. Discussion
4.1. Low RDI as a Signal of Treatment Vulnerability During First-Line Chemotherapy
In this single-center retrospective cohort, low RDI was associated with greater difficulty in maintaining the planned course of first-line platinum-based chemotherapy. Higher BMI category, bilateral/multifocal tumor distribution, baseline neutropenia, and lower PNI remained independently associated with low RDI. These factors are available before chemotherapy and may reflect differences in body size, disease burden, bone marrow reserve, and nutritional status. Final RDI is also affected by events during treatment, including dose reduction, delay, schedule modification, and toxicity; it may therefore reflect both baseline vulnerability and subsequent treatment tolerance.
Previous real-world studies in advanced breast and ovarian cancer have shown that dose delays, dose reductions, and RDI <85% are common during chemotherapy and may be associated with poorer outcomes [17,18]. A broader review of metastatic solid tumors also reported that lower RDI was related to worse survival, although the strength of this relationship was not the same across different tumor types and treatment regimens [19]. Our findings are generally consistent with these reports, while also showing that low RDI should be interpreted together with the patient’s baseline condition and clinical course.
Low RDI should not be viewed simply as undertreatment, because dose modification may be necessary when patients develop severe toxicity or have limited tolerance. One study in advanced epithelial ovarian cancer found that reduced adjuvant chemotherapy dose did not significantly worsen survival when dose adjustment was made according to clinical condition [20]. This supports interpreting RDI in the context of why treatment was modified, rather than treating a lower value as an isolated therapeutic choice.
4.2. Factors Associated with Low RDI: Patient Condition, Disease Burden, and Hematologic Tolerance
BMI remained independently associated with low RDI after adjustment. The proportion of low RDI differed across BMI categories, with relatively higher proportions observed in the overweight and obesity groups. Sensitivity analyses suggested that the association was mainly related to higher BMI, particularly obesity, rather than underweight. Previous studies in ovarian cancer have shown that body composition, sarcopenia, nutritional status, and BMI may influence chemotherapy completion, toxicity, and survival [21,22,23,24,25,26]. BMI may therefore provide a simple marker of treatment tolerance, although it cannot fully represent nutritional reserve or body composition. Patients with higher BMI may require particular attention during chemotherapy, but obesity itself should not be used as a reason for empirical dose reduction. Current evidence supports chemotherapy dosing according to established treatment principles rather than routinely reducing doses because of obesity [8,27]. Although chemotherapy dosing is generally calculated according to body surface area, patients with higher BMI may receive larger calculated doses, which could increase concerns regarding toxicity and potentially influence subsequent dose modifications in clinical practice [28]. Careful dose calculation, assessment of comorbidities, and toxicity monitoring may therefore be more appropriate. Nutritional assessment remains important when malnutrition or muscle loss is suspected, regardless of BMI [29]. Our findings therefore support BMI mainly as a marker associated with difficulty in maintaining chemotherapy intensity, rather than as an indication for a specific treatment intervention.
Tumor-related characteristics were also associated with chemotherapy delivery. Bilateral or multifocal tumor distribution remained independently associated with low RDI, while other indicators of disease burden, including FIGO stage and positive ascites cytology, showed associations in the baseline or univariable analyses but did not remain significant after multivariable adjustment. Positive ascites cytology has been associated with unfavorable outcomes in epithelial ovarian cancer [30,31], and residual disease, tumor burden, and surgical complexity have also been related to prognosis after cytoreductive surgery [32,33]. In our cohort, the lower R0 resection rate and greater intraoperative blood loss in the low-RDI group may similarly reflect greater disease and surgical complexity before chemotherapy.
Baseline nutritional and laboratory status also appeared to be important. Several baseline laboratory markers differed between groups, but lower PNI remained independently associated with low RDI after multivariable adjustment. Because PNI combines serum albumin and lymphocyte count, it reflects both nutritional and immune-related aspects of the patient’s baseline condition. Previous evidence in ovarian cancer has shown that lower PNI is associated with poorer clinical outcomes [34], while prospective data have shown changes in PNI, albumin, prealbumin, and other nutritional measures during chemotherapy [35]. More recent evidence has also supported the prognostic value of preoperative PNI in epithelial ovarian cancer [36]. The lower albumin and prealbumin levels seen in the low-RDI group were consistent with this pattern. Because albumin and lymphocyte count are components of PNI, and several nutritional variables provide overlapping information, related variables were not entered simultaneously into the multivariable model. Lower PNI may therefore help identify patients who need closer nutritional assessment before chemotherapy; however, this study did not evaluate whether nutritional intervention can improve RDI.
Baseline neutropenia was another independent factor associated with low RDI. Importantly, the neutropenia included in the model was present before the first chemotherapy cycle rather than being treatment-emergent neutropenia. The association remained in the same direction when the ANC cutoff was lowered to 1.5 × 10⁹/L, although the estimate became less precise and was no longer statistically significant because relatively few patients met the stricter definition. This may reflect limited pretreatment bone marrow reserve and greater susceptibility to hematologic toxicity during chemotherapy. Chemotherapy-induced neutropenia can lead to treatment delay, dose reduction, and loss of delivered dose intensity [37]. Current guidance recommends individualized assessment of neutropenia risk, and appropriate use of granulocyte colony-stimulating factor may help prevent febrile neutropenia and treatment interruption in selected patients [38,39]. However, this study did not directly evaluate the effectiveness of G-CSF or other supportive interventions. Our findings therefore mainly support early recognition and closer hematologic monitoring of patients with baseline neutropenia, rather than a specific supportive-care strategy.
4.3. From Risk Prediction to Chemotherapy Delivery
The nomogram translated the independent predictors of low RDI into an individualized risk estimate and showed moderate discrimination, with an apparent AUC of 0.726 and a bootstrap-corrected AUC of 0.719. Calibration was generally good, with a bootstrap-corrected slope of 0.948, an intercept of −0.025, and a Brier score of 0.199, while decision curve analysis suggested potential net benefit across part of the evaluated threshold range. There is no universally accepted minimum AUC that defines clinical usefulness, because model performance should be considered together with calibration, decision-curve analysis, the consequences of misclassification, and the intended clinical use [40,41,42]. Therefore, the current model should be interpreted as a risk-stratification tool rather than a tool for making treatment decisions.
At present, the nomogram should not be used to determine chemotherapy dose reduction, regimen selection, or treatment discontinuation. Its potential role is to identify patients who may require closer assessment before and during chemotherapy, including blood-count monitoring, nutritional evaluation, dose calculation, and supportive care when clinically appropriate. Future prospective interventional studies could evaluate whether risk-directed supportive strategies improve chemotherapy delivery and clinical outcomes. In such studies, the nomogram may help identify patients who may benefit from intensified monitoring or supportive management, although its use for treatment allocation would require external validation and prospective confirmation.
The long study period and differences in treatment practice should also be considered. Treatment patterns and supportive care changed over time, which may affect the baseline risk of low RDI and model calibration. Recalibration may therefore be required when the nomogram is applied to contemporary cohorts. Its performance may also differ across healthcare systems, particularly where chemotherapy schedules and dose-modification practices differ, such as centers where weekly or dose-dense paclitaxel is routinely used. External validation should therefore assess both discrimination and calibration before the model is applied in other treatment settings.
4.4. Low RDI and Survival: A Marker Worth Attention
Low RDI was associated with shorter PFS and OS in our cohort, and this relationship remained consistent after multivariable adjustment and landmark analysis. These findings are in line with previous studies showing that reduced chemotherapy intensity may be associated with poorer outcomes in patients with ovarian cancer and other solid tumors [17,18,19]. However, the association between low RDI and survival should be interpreted carefully. Because RDI is influenced by both planned treatment delivery and patient-related factors occurring during chemotherapy, a lower RDI may partly reflect underlying disease burden, poorer tolerance, or reduced physiological reserve rather than representing an isolated treatment effect.
In clinical practice, chemotherapy modification is sometimes necessary to manage toxicity and maintain patient safety. Therefore, the goal should not be to maintain the highest possible RDI regardless of clinical circumstances, but rather to identify patients at risk of treatment interruption and provide appropriate supportive management when feasible. Our findings suggest that low RDI may serve as a marker of treatment vulnerability and identify patients who may require closer monitoring during first-line chemotherapy. Whether strategies aimed at preserving chemotherapy intensity can improve survival outcomes requires further prospective investigation.
4.5. Limitations
This study has several limitations. First, the retrospective, single-center design may introduce selection bias and limit generalizability. To reduce potential confounding, we included a broad range of clinical and treatment-related variables in the multivariable analyses, although unmeasured confounding may still remain.
Second, some variables were unavailable for all patients because of the retrospective data collection. Missing data were handled using complete-case analysis without imputation, and a secondary Cox model additionally included PARP inhibitor use among patients with available records. BRCA mutation status and HRD were not consistently available and therefore could not be included in the adjusted survival models.
Third, final RDI was determined during chemotherapy rather than at baseline, which may introduce time-related bias and reverse causation. We therefore performed a 6-month landmark analysis, which produced results consistent with the primary analysis, although these biases cannot be completely eliminated.
Fourth, treatment patterns changed during the long study period. Treatment era, bevacizumab use, and, when available, PARP inhibitor use were considered in the adjusted survival analyses, although changes in treatment practice may not have been fully captured. These temporal changes may also affect the calibration and transportability of the nomogram, particularly when it is applied to contemporary cohorts or healthcare systems with different chemotherapy schedules.
Finally, the nomogram was developed in a single cohort. Bootstrap internal validation showed relatively stable discrimination and generally good calibration, but external validation remains necessary before routine clinical use.
5. Conclusions
Low RDI during first-line platinum-based chemotherapy may reflect greater treatment vulnerability and difficulty in maintaining chemotherapy as planned in patients with epithelial ovarian cancer. Patients with low RDI had shorter PFS and OS in our cohort. Early identification of patients at risk may help support closer treatment monitoring, while the proposed nomogram still requires external validation before wider clinical use.
Supplementary Materials
The following supporting information can be downloaded at: https://www.mdpi.com/article/10.3390/medicina62112081/s1, Table S1: STROBE Checklist: Strengthening the Reporting of Observational Studies in Epidemiology checklist for cohort studies. Table S2: Complete comparison of clinicopathological, surgical, laboratory, and treatment characteristics according to RDI status. Table S3: Treatment era and targeted and maintenance therapy use. Table S4: Sensitivity analyses of the association between BMI and low RDI. Table S5: Sensitivity analysis of factors associated with low RDI after excluding patients with regimen or schedule modifications. Table S6: Sensitivity analyses using alternative mean RDI thresholds.
Author Contributions
Conceptualization, S.X. and H.L.; Methodology, S.X. and R.H.; Software, S.X. and R.H.; Validation, S.X., R.H., W.L. and H.L.; Formal Analysis, S.X. and R.H.; Investigation, S.X., R.H. and Y.Z.; Resources, H.L.; Data Curation, S.X., R.H., J.H. and W.L.; Writing—Original Draft Preparation, S.X.; Writing—Review and Editing, S.X., R.H., W.L., Y.Z., J.H. and H.L.; Visualization, S.X. and R.H.; Supervision, H.L.; Project Administration, H.L.; Funding Acquisition, H.L. All authors have read and agreed to the published version of the manuscript.
Funding
This research received no external funding.
Institutional Review Board Statement
The study was conducted in accordance with the Declaration of Helsinki and was approved by the Ethics Committee of Beijing Chaoyang Hospital, Capital Medical University (protocol code: 2026-sci-822, approval date:12 August 2026).
Informed Consent Statement
Informed consent was obtained from all subjects involved in the study.
Data Availability Statement
The data presented in this study are not publicly available due to privacy and ethical restrictions. De-identified data may be available from the corresponding author upon reasonable request and with approval from the relevant ethics committee.
Acknowledgments
The authors thank the clinical and laboratory staff of Beijing Chaoyang Hospital, Capital Medical University, for their assistance with clinical data collection and laboratory testing.
Conflicts of Interest
The authors declare no conflicts of interest.
Abbreviations
The following abbreviations are used in this manuscript:
| EOC | Epithelial ovarian cancer |
| RDI | Relative dose intensity |
| BMI | Body mass index |
| PNI | prognostic nutritional index |
| PLR | platelet-to-lymphocyte ratio |
| PFS | Progression-free survival |
| OS | Overall survival |
| HR | Hazard ratio |
| CI | Confidence interval |
| IQR | Interquartile range |
| FIGO | International Federation of Gynecology and Obstetrics |
| NACT | Neoadjuvant chemotherapy |
| IDS | Interval debulking surgery |
| ROC | Receiver operating characteristic |
| AUC | Area under the curve |
| DCA | Decision curve analysis |
| LVSI | Lymphovascular space invasion |
| HIPEC | Hyperthermic intraperitoneal chemotherapy |
| G-CSF | Granulocyte colony-stimulating factor |
| PARP | Poly(ADP-ribose) polymerase |
| RBC | Red blood cell |
| WBC | White blood cell |
| ANC | Absolute neutrophil count |
| ALC | Absolute lymphocyte count |
| NLR | Neutrophil-to-lymphocyte ratio |
| Hb | Hemoglobin |
| PLT | Platelet count |
| ALB | Albumin |
| PA | Prealbumin |
| AST | Aspartate aminotransferase |
| ALT | Alanine aminotransferase |
| TBIL | Total bilirubin |
| Scr | Serum creatinine |
| Na | Sodium |
| K | Potassium |
References
- Bray, F.; Laversanne, M.; Sung, H.; Ferlay, J.; Siegel, R.L.; Soerjomataram, I.; Jemal, A. Global cancer statistics 2022: GLOBOCAN estimates of incidence and mortality worldwide for 36 cancers in 185 countries. CA Cancer J. Clin. 2024, 74, 229–263. [Google Scholar] [CrossRef] [Scilit] [PubMed]
- Siegel, R.L.; Kratzer, T.B.; Giaquinto, A.N.; Sung, H.; Jemal, A. Cancer statistics, 2025. CA Cancer J. Clin. 2025, 75, 11–45. [Google Scholar] [CrossRef] [Scilit] [PubMed] [PubMed Central]
- González-Martín, A.; Harter, P.; Leary, A.; Lorusso, D.; Miller, R.E.; Pothuri, B.; Ray-Coquard, I.; Tan, D.; Bellet, E.; Oaknin, A.; et al. Newly diagnosed and relapsed epithelial ovarian cancer: ESMO clinical practice guideline for diagnosis, treatment and follow-up. Ann. Oncol. Off. J. Eur. Soc. Med. Oncol. 2023, 34, 833–848. [Google Scholar] [CrossRef] [Scilit] [PubMed]
- Liu, J.; Berchuck, A.; Backes, F.J.; Cohen, J.; Grisham, R.; Leath, C.A.; Martin, L.; Matei, D.; Miller, D.S.; Robertson, S.; et al. NCCN guidelines® insights: Ovarian cancer/fallopian tube cancer/primary peritoneal cancer, version 3.2024. J. Natl. Compr. Cancer Netw. JNCCN 2024, 22, 512–519. [Google Scholar] [CrossRef] [Scilit] [PubMed]
- Ledermann, J.A.; Matias-Guiu, X.; Amant, F.; Concin, N.; Davidson, B.; Fotopoulou, C.; González-Martin, A.; Gourley, C.; Leary, A.; Lorusso, D.; et al. ESGO-ESMO-ESP consensus conference recommendations on ovarian cancer: Pathology and molecular biology and early, advanced and recurrent disease. Ann. Oncol. Off. J. Eur. Soc. Med. Oncol. 2024, 35, 248–266. [Google Scholar] [CrossRef] [Scilit] [PubMed]
- Gaillard, S.; Lacchetti, C.; Armstrong, D.K.; Cliby, W.A.; Edelson, M.I.; Garcia, A.A.; Ghebre, R.G.; Gressel, G.M.; Lesnock, J.L.; Meyer, L.A.; et al. Neoadjuvant chemotherapy for newly diagnosed, advanced ovarian cancer: ASCO guideline update. J. Clin. Oncol. Off. J. Am. Soc. Clin. Oncol. 2025, 43, 868–891. [Google Scholar] [CrossRef] [Scilit] [PubMed] [PubMed Central]
- Clamp, A.R.; James, E.C.; McNeish, I.A.; Dean, A.; Kim, J.W.; O’Donnell, D.M.; Gallardo-Rincon, D.; Blagden, S.; Brenton, J.; Perren, T.J.; et al. Weekly dose-dense chemotherapy in first-line epithelial ovarian, fallopian tube, or primary peritoneal cancer treatment (ICON8): Overall survival results from an open-label, randomised, controlled, phase 3 trial. Lancet Oncol. 2022, 23, 919–930. [Google Scholar] [CrossRef] [Scilit] [PubMed] [PubMed Central]
- Griggs, J.J.; Bohlke, K.; Balaban, E.P.; Dignam, J.J.; Hall, E.T.; Harvey, R.D.; Hecht, D.P.; Klute, K.A.; Morrison, V.A.; Pini, T.M.; et al. Appropriate systemic therapy dosing for obese adult patients with cancer: ASCO guideline update. J. Clin. Oncol. Off. J. Am. Soc. Clin. Oncol. 2021, 39, 2037–2048. [Google Scholar] [CrossRef] [Scilit] [PubMed]
- Nielson, C.M.; Bylsma, L.C.; Fryzek, J.P.; Saad, H.A.; Crawford, J. Relative dose intensity of chemotherapy and survival in patients with advanced stage solid tumor cancer: A systematic review and meta-analysis. Oncologist 2021, 26, e1609–e1618. [Google Scholar] [CrossRef] [Scilit] [PubMed] [PubMed Central]
- Fauci, J.M.; Whitworth, J.M.; Schneider, K.E.; Subramaniam, A.; Zhang, B.; Frederick, P.J.; Kilgore, L.C.; Straughn, J.M. Prognostic significance of the relative dose intensity of chemotherapy in primary treatment of epithelial ovarian cancer. Gynecol. Oncol. 2011, 122, 532–535. [Google Scholar] [CrossRef] [Scilit] [PubMed]
- Hanna, R.K.; Poniewierski, M.S.; Laskey, R.A.; Lopez, M.A.; Shafer, A.; Van Le, L.; Crawford, J.; Dale, D.C.; Gehrig, P.A.; Secord, A.A.; et al. Predictors of reduced relative dose intensity and its relationship to mortality in women receiving multi-agent chemotherapy for epithelial ovarian cancer. Gynecol. Oncol. 2013, 129, 74–80. [Google Scholar] [CrossRef] [Scilit] [PubMed]
- Steventon, L.; Man, K.K.C.; Nicum, S.; Miller, R.E.; Peleg Hasson, S.; Shah, S.; Baser, M.; Kipps, E.; Forster, M.D.; Almossawi, O.; et al. The impact of inter-cycle treatment delays on overall survival in patients with advanced-stage ovarian cancer. Oncologist 2024, 29, e1532–e1539. [Google Scholar] [CrossRef] [Scilit] [PubMed] [PubMed Central]
- Hatsy, S.; Brambs, C.; Kiechle, M. Incidence and predictors for chemotherapy modifications and their impact on the outcome of ovarian cancer patients. Arch. Gynecol. Obstet. 2023, 307, 1891–1899. [Google Scholar] [CrossRef] [Scilit] [PubMed] [PubMed Central]
- Bandera, E.V.; Lee, V.S.; Rodriguez-Rodriguez, L.; Powell, C.B.; Kushi, L.H. Impact of chemotherapy dosing on ovarian cancer survival according to body mass index. JAMA Oncol. 2015, 1, 737–745. [Google Scholar] [CrossRef] [Scilit] [PubMed] [PubMed Central]
- Cao, A.; Cartmel, B.; Ratner, E.; Li, F.Y.; Schlumbrecht, M.P.; Kumar, A.; E Crane, T.; A Esserman, D.; Irwin, M.L.; Ferrucci, L.M. Body mass index and chemotherapy completion among patients with newly diagnosed ovarian cancer. JNCI Cancer Spectr. 2026, 10, pkaf121. [Google Scholar] [CrossRef] [Scilit] [PubMed] [PubMed Central]
- Wonders, K.Y.; Schmitz, K.; Harness, J. Dose delays, dose reductions, and relative total dose intensity in patients with advanced cancer who exercised during neoadjuvant chemotherapy treatment. Integr. Cancer Ther. 2023, 22, 15347354231168368. [Google Scholar] [CrossRef] [Scilit] [PubMed] [PubMed Central]
- Denduluri, N.; Lyman, G.H.; Wang, Y.; Morrow, P.K.; Barron, R.; Patt, D.; Bhowmik, D.; Li, X.; Bhor, M.; Fox, P.; et al. Chemotherapy dose intensity and overall survival among patients with advanced breast or ovarian cancer. Clin. Breast Cancer 2018, 18, 380–386. [Google Scholar] [CrossRef] [Scilit] [PubMed]
- Crawford, J.; Denduluri, N.; Patt, D.; Jiao, X.; Morrow, P.K.; Garcia, J.; Barron, R.; Lyman, G.H. Relative dose intensity of first-line chemotherapy and overall survival in patients with advanced non-small-cell lung cancer. Support. Care Cancer 2020, 28, 925–932. [Google Scholar] [CrossRef] [Scilit] [PubMed] [PubMed Central]
- Havrilesky, L.J.; Reiner, M.; Morrow, P.K.; Watson, H.; Crawford, J. A review of relative dose intensity and survival in patients with metastatic solid tumors. Crit. Rev. Oncol. Hematol. 2015, 93, 203–210. [Google Scholar] [CrossRef] [Scilit] [PubMed]
- Lee, J.; Kim, J.M.; Lee, Y.H.; Chong, G.O.; Hong, D.G. Survival outcomes with reduced doses of adjuvant chemotherapy in advanced epithelial ovarian cancer. In Vivo 2022, 36, 1868–1874. [Google Scholar] [CrossRef] [Scilit] [PubMed] [PubMed Central]
- Shah, R.; Polen-De, C.; McGree, M.; Fought, A.; Kumar, A. Re-evaluating chemotherapy dosing strategies for ovarian cancer: Impact of sarcopenia. Curr. Oncol. 2023, 30, 9501–9513. [Google Scholar] [CrossRef] [Scilit] [PubMed] [PubMed Central]
- Staley, S.A.; Tucker, K.; Newton, M.; Ertel, M.; Oldan, J.; Doherty, I.; West, L.; Zhang, Y.; Gehrig, P.A. Sarcopenia as a predictor of survival and chemotoxicity in patients with epithelial ovarian cancer receiving platinum and taxane-based chemotherapy. Gynecol. Oncol. 2020, 156, 695–700. [Google Scholar] [CrossRef] [Scilit] [PubMed]
- Bruno Kde, A.; Sobreira da Silva, M.J.; Chaves, G.V. Association of body composition with toxicity to first-line chemotherapy and three-year survival in women with ovarian adenocarcinoma. Acta Oncol. 2021, 60, 1611–1620. [Google Scholar] [CrossRef] [Scilit] [PubMed]
- Rizzo, S.; Raia, G.; Del Grande, M.; Gasparri, M.L.; Colombo, I.; Manganaro, L.; Papadia, A.; Del Grande, F. Body composition as a predictor of chemotherapy-related toxicity in ovarian cancer patients: A systematic review. Front. Oncol. 2022, 12, 1057631. [Google Scholar] [CrossRef] [Scilit] [PubMed] [PubMed Central]
- Benna-Doyle, S.; Baguley, B.J.; Laing, E.; Kiss, N. Nutritional interventions during treatment for ovarian cancer: A narrative review and recommendations for future research. Maturitas 2024, 183, 107938. [Google Scholar] [CrossRef] [Scilit] [PubMed]
- Shao, Z.; Fu, L.; Lu, Y.; Zhou, H.; Zhu, Y.; Zhu, T. Ovarian cancer and malnutrition: A literature review. Transl. Cancer Res. 2025, 14, 3239–3254. [Google Scholar] [CrossRef] [Scilit] [PubMed] [PubMed Central]
- Griggs, J.J.; Mangu, P.B.; Temin, S.; Lyman, G.H. Appropriate Chemotherapy Dosing for Obese Adult Patients With Cancer: American Society of Clinical Oncology Clinical Practice Guideline. J. Oncol. Pract. 2012, 8, e59–e61. [Google Scholar] [CrossRef] [Scilit] [PubMed] [PubMed Central]
- Barras, M.; Legg, A. Drug dosing in obese adults. Aust. Prescr. 2017, 40, 189–193. [Google Scholar] [CrossRef] [Scilit] [PubMed] [PubMed Central]
- Muscaritoli, M.; Arends, J.; Bachmann, P.; Baracos, V.; Barthelemy, N.; Bertz, H.; Bozzetti, F.; Hütterer, E.; Isenring, E.; Kaasa, S.; et al. ESPEN practical guideline: Clinical Nutrition in cancer. Clin. Nutr. 2021, 40, 2898–2913. [Google Scholar] [CrossRef] [Scilit] [PubMed]
- Yoshihara, M.; Emoto, R.; Kitami, K.; Iyoshi, S.; Uno, K.; Mogi, K.; Tano, S.; Yoshikawa, N.; Matsui, S.; Kajiyama, H. A large-scale multi-institutional study evaluating prognostic aspects of positive ascites cytology and effects of therapeutic interventions in epithelial ovarian cancer. Sci. Rep. 2021, 11, 15154. [Google Scholar] [CrossRef] [Scilit] [PubMed] [PubMed Central]
- Chase, D.M.; Mahajan, A.; Scott, D.A.; Hawkins, N.; Kalilani, L. The impact of varying levels of residual disease following cytoreductive surgery on survival outcomes in patients with ovarian cancer: A meta-analysis. BMC Womens Health 2024, 24, 179. [Google Scholar] [CrossRef] [Scilit] [PubMed] [PubMed Central]
- Angeles, M.A.; Rychlik, A.; Cabarrou, B.; Spagnolo, E.; Guyon, F.; Pérez-Benavente, A.; Gil-Moreno, A.; Siegrist, J.; Querleu, D.; Mery, E.; et al. A multivariate analysis of the prognostic impact of tumor burden, surgical timing and complexity after complete cytoreduction for advanced ovarian cancer. Gynecol. Oncol. 2020, 158, 614–621. [Google Scholar] [CrossRef] [Scilit] [PubMed]
- Aletti, G.D.; Dowdy, S.C.; Podratz, K.C.; Cliby, W.A. Relationship among surgical complexity, short-term morbidity, and overall survival in primary surgery for advanced ovarian cancer. Am. J. Obstet. Gynecol. 2007, 197, 676.e1–676.e7. [Google Scholar] [CrossRef] [Scilit] [PubMed]
- Tan, X.; Chen, H. The Prognostic Value of Prognostic Nutritional Index in Patients with Ovarian Cancer: A Systematic Review and Meta-Analysis. Nutr. Cancer 2023, 75, 73–81. [Google Scholar] [CrossRef] [Scilit] [PubMed]
- Zhang, M.; He, Y.; Liu, X.; Liu, Y.; Tian, Y.; Dan, X.; Ren, J. Trends in nutritional status and factors affecting prognostic nutritional index in ovarian cancer patients during chemotherapy: A prospective longitudinal study based on generalized estimating equations. Support. Care Cancer 2024, 32, 191. [Google Scholar] [CrossRef] [Scilit] [PubMed]
- Chen, J.; Jin, L.; Luo, R.; Zhang, X.; Chen, Y.; Han, Z.; Liu, T. Predictive value of preoperative systemic immune-inflammation index and prognostic nutrition index in patients with epithelial ovarian cancer. J. Ovarian Res. 2025, 18, 45. [Google Scholar] [CrossRef] [Scilit] [PubMed]
- Lalami, Y.; Klastersky, J. Impact of chemotherapy-induced neutropenia (CIN) and febrile neutropenia (FN) on cancer treatment outcomes: An overview about well-established and recently emerging clinical data. Crit. Rev. Oncol. Hematol. 2017, 120, 163–179. [Google Scholar] [CrossRef] [Scilit] [PubMed]
- Griffiths, E.A.; Roy, V.; Alwan, L.; Bachiashvili, K.; Baird, J.; Cool, R.; Dinner, S.; Geyer, M.; Glaspy, J.; Gojo, I.; et al. NCCN guidelines® insights: Hematopoietic growth factors, version 1.2022. J. Natl. Compr. Cancer Netw. JNCCN 2022, 20, 436–442. [Google Scholar] [CrossRef] [Scilit] [PubMed]
- Gascón, P.; Awada, A.; Karihtala, P.; Lorenzen, S.; Minichsdorfer, C. Optimal use of granulocyte colony-stimulating factor prophylaxis to improve survival in cancer patients receiving treatment: An expert view. Wien. Klin. Wochenschr. 2024, 136, 362–368. [Google Scholar] [CrossRef] [Scilit] [PubMed] [PubMed Central]
- Collins, G.S.; Dhiman, P.; Ma, J.; Schlussel, M.M.; Archer, L.; Van Calster, B.; E Harrell, F.; Martin, G.P.; Moons, K.G.M.; van Smeden, M.; et al. Evaluation of clinical prediction models (part 1): From development to external validation. BMJ 2024, 384, e074819. [Google Scholar] [CrossRef] [Scilit] [PubMed] [PubMed Central]
- Vickers, A.J.; Elkin, E.B. Decision curve analysis: A novel method for evaluating prediction models. Med. Decis. Mak. Int. J. Soc. Med. Decis. Mak. 2006, 26, 565–574. [Google Scholar] [CrossRef] [Scilit] [PubMed] [PubMed Central]
- Vickers, A.J.; van Calster, B.; Steyerberg, E.W. A simple, step-by-step guide to interpreting decision curve analysis. Diagn. Progn. Res. 2019, 3, 18. [Google Scholar] [CrossRef] [Scilit] [PubMed] [PubMed Central]

Disclaimer/Publisher’s Note: The statements, opinions and data contained in all publications are solely those of the individual author(s) and contributor(s) and not of MDPI and/or the editor(s). MDPI and/or the editor(s) disclaim responsibility for any injury to people or property resulting from any ideas, methods, instructions or products referred to in the content. |
© 2026 by the authors. Published by MDPI on behalf of the Lithuanian University of Health Sciences. Licensee MDPI, Basel, Switzerland. This article is an open access article distributed under the terms and conditions of the Creative Commons Attribution (CC BY) license.