


Abstract
Irrigation relieves water limitation in dryland soils and may shift soil microbes from stress tolerance towards resource acquisition. Field tests are scarce and often confound irrigation with site. In this exploratory study, we compared twelve long-read nanopore metagenomes from six spatially matched pairs of irrigated and rainfed fields in the East Kazakhstan Region, with one composite sample per field, and tested irrigation within pairs. With six pairs, the design can detect only large effects. Sequencing was shallow (0.16–2.19 Gb per soil) and read accuracy modest (median Q17). We detected no large or consistent community-wide shift: site explained 50–52% of compositional variance and irrigation 8–10%, close to the 8% expected by chance. A reference-free comparison agreed; equal-depth Aitchison tests hint at a weak log-ratio shift. Trait-level signals were consistent in direction but failed multiple-testing correction. The desiccation-tolerant genus Rubrobacter was 2- to 40-fold less abundant in the irrigated field of five of six pairs, and polysaccharide-degradation genes were 26% more abundant under irrigation, whereas compatible-solute genes did not differ. Most reads (64–80%) could not be placed against reference genomes. These results identify Rubrobacter depletion and greater polysaccharide-degradation potential as hypotheses to test in larger, crop-balanced studies with measured soil properties.
1. Introduction
Soil hosts one of the most diverse, abundant and functionally complex microbial communities in the world [1,2]. These microorganisms underpin key ecosystem services such as organic matter turnover, nutrient cycling and plant productivity [3,4]. Although soil communities are highly rich and diverse, a relatively small set of microbial taxa tends to dominate across biomes [5,6].
In arid and semi-arid regions, water is the dominant constraint [7]. Across 80 dryland sites worldwide, increasing aridity reduced both the diversity and the abundance of soil bacteria and fungi, largely through its effect on soil organic carbon [8]. Irrigation reverses that constraint directly. Drought leaves a reproducible taxonomic signature [9]. Actinobacteria (Actinomycetota) are consistently enriched under these conditions: the pattern held across 18 grass species in a controlled drought experiment [10], and in sorghum, drought both delayed root microbiome assembly and selected for monoderm lineages, Actinobacteria foremost among them [11,12]. Within this phylum, Rubrobacter is among the most desiccation- and radiation-tolerant genera known [13,14,15]. If drought enriches these taxa, irrigation should deplete them. This is a directional prediction, and it can be tested.
Whether irrigation restructures the community as a whole is less settled. Some field studies report strong effects [16,17,18]. In a three-year semi-arid wheat trial, irrigation influenced bacterial composition more than nitrogen fertilisation [19]. Other studies find the opposite. A ±60% precipitation manipulation in the Junggar desert left the dominant phyla unchanged, with pH and total nitrogen explaining composition instead [20]. Most designs also confound treatment with site, which makes the two difficult to separate. A perturbation may also increase the variance among samples while leaving the average unmoved—the Anna Karenina principle, under which stressed or perturbed communities become more dissimilar to each other rather than uniformly different from controls [21]. The principle is rarely tested in agricultural soils, even though irrigation is a plausible candidate: relieving a shared water constraint may allow field-specific factors to express themselves, widening the spread among fields without displacing the centroid [22].
Testing either hypothesis in soil is limited by reference databases. Soil is the least well catalogued of the major microbiomes [23]. Recent ultra-deep sequencing indicates that 1–4 Tb per sample would be needed to capture 95% of the community, and that reference-based profilers classify under 10% of soil reads [24]. Long-read work reaches the same conclusion from the other direction: even at 270 Gb, saturation remains orders of magnitude away, and only a small minority of assembled contigs can be assigned to a species with a cultured representative [25]. In this setting, read-based profiling, which uses every read, including those that would never assemble into a contig, is a reasonable alternative to assembly. Nanopore sequencing carries a higher per-base error rate than short-read platforms, and any interpretation of unmapped reads must account for it [26].
Soil microbial research in Kazakhstan remains sparse and almost entirely amplicon-based. Published studies cover dryland soils of the western Caspian region, natural salinity gradients across the steppe-to-semidesert transition, and land-use conversion in the northwest [27,28,29]. Nanopore sequencing has been applied to heavy metal-contaminated soil microbiomes in the East Kazakhstan Region [30,31]. The region is also a centre of mining and non-ferrous metallurgy. In the Belousovka mining area, zinc and copper in soil exceeded maximum permissible concentrations by up to about 70-fold [32]. In Ust-Kamenogorsk, contamination clustered around the metallurgical plants, and cadmium was the main driver of ecological risk [33]. None of these studies compared irrigated and rainfed fields. To our knowledge, no long-read metagenomic comparison of irrigated and rainfed soils has been reported for Kazakhstan or for the wider Eurasian steppe.
Here, we compare twelve long-read soil metagenomes from East Kazakhstan, sampled as six spatially matched pairs of irrigated and rainfed fields. The study is exploratory. Its central question is whether relieving water limitation shifts soil microbes from stress tolerance towards resource acquisition. The aims were: (i) to determine whether irrigation shifts soil microbial community composition, and at which taxonomic ranks; (ii) to test whether irrigation instead alters the heterogeneity among fields, as the Anna Karenina principle would predict; (iii) to test the prediction that desiccation-associated taxa, and Rubrobacter in particular, are depleted under irrigation; and (iv) to examine whether functional potential shifts from stress tolerance (compatible-solute synthesis) towards resource acquisition (polysaccharide degradation), and to describe the resistance-gene profiles of these soils. We further quantify how much of this community can be placed against existing reference genomes, which bounds what any reference-based survey of dry steppe soils can currently resolve. All findings are treated as hypothesis-generating rather than confirmatory.
2. Materials and Methods
2.1. Study Area, Soil Collection and Analysis
2.1.1. Study Area
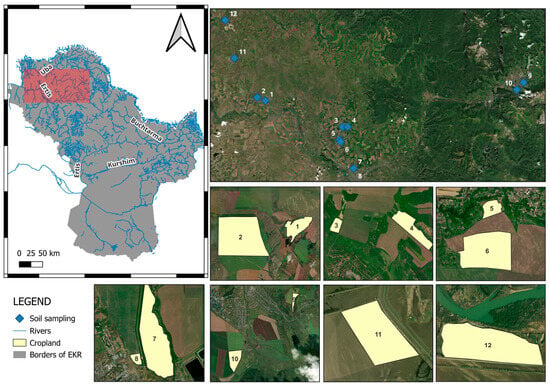
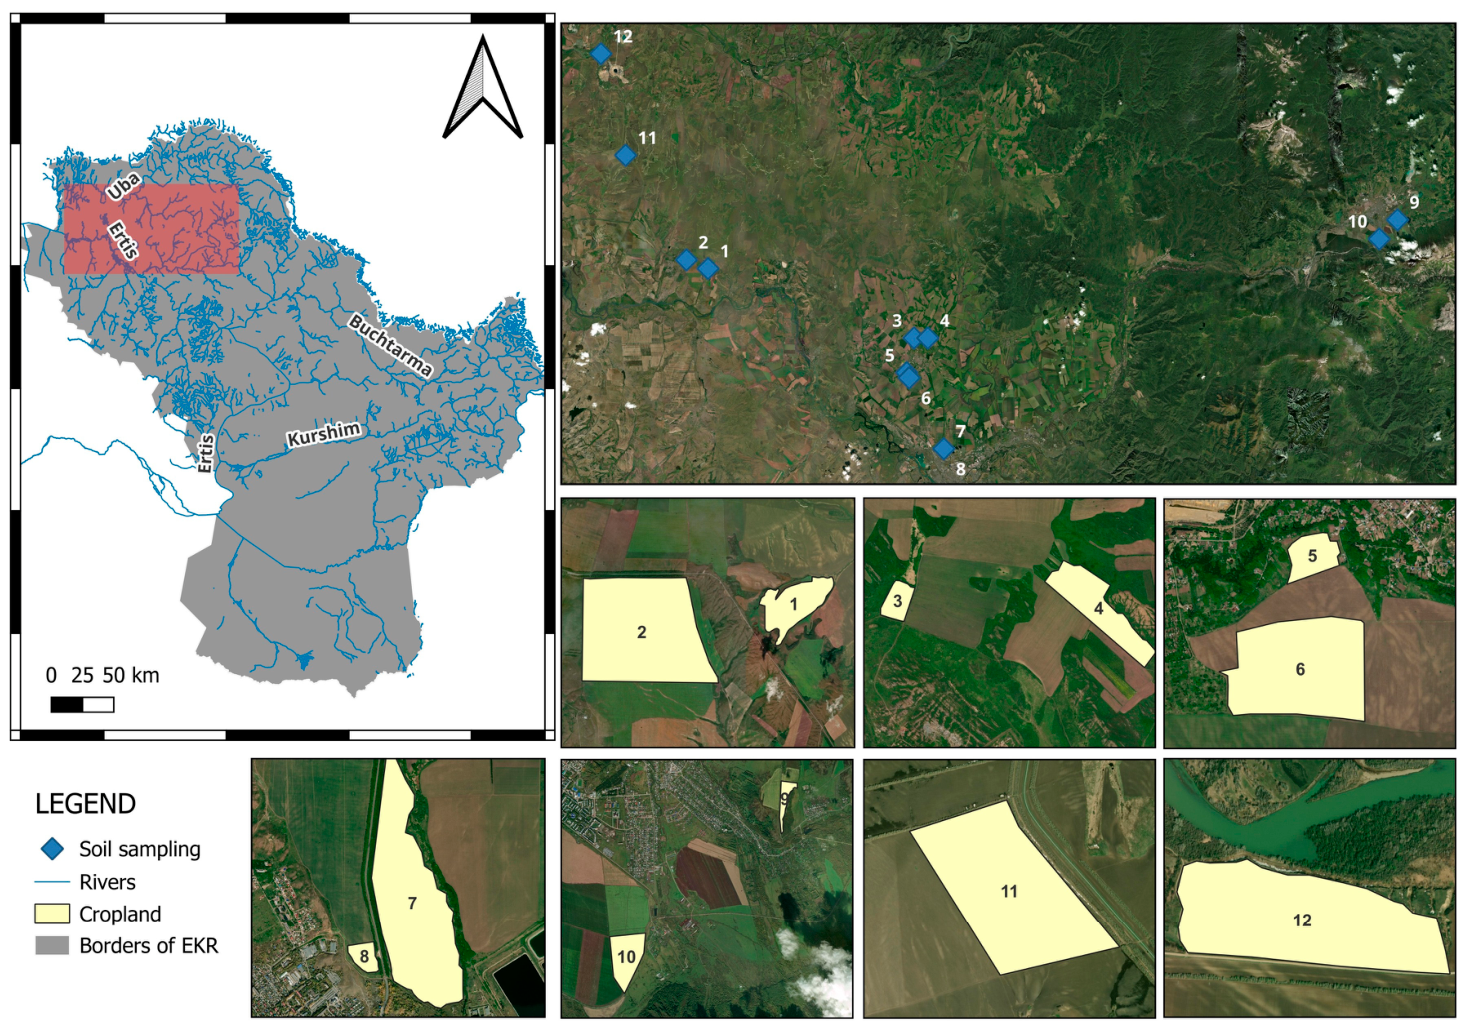
The study area is located in the north-western part of the East Kazakhstan Region, near the settlements of Ust-Talovka, Pervomaiskoe, Belousovka, Chernogorka, Krasnopartizanskoe, Ust-Kamenogorsk and Ridder (Figure 1). The region includes major elements of the Irtysh (Ertis) River basin.
Figure 1.
Study area and sampling sites. Left: the East Kazakhstan Region (EKR) with its main rivers; the red rectangle marks the study area. Upper right: satellite view of the study area with the twelve sampled fields (blue diamonds, numbered 1–12). Lower panels: boundaries of the sampled cropland fields.
Based on records from 12 Kazhydromet (Kazakhstan Hydrometeorological Service) meteorological stations, mean annual air temperature varies approximately from −2 to 5 °C. Annual precipitation is distributed unevenly across the region, ranging from about 195 mm in the drier western plains to as much as 637 mm in the eastern mountainous areas.
2.1.2. Soil Sampling
A total of 12 soil samples were collected from irrigated and rainfed (non-irrigated) agricultural fields. The fields formed six spatially matched pairs, each consisting of one irrigated and one rainfed field (Figure 1). Crop, irrigation water source and pair membership of each field are given in Table 1; crop differed between the two fields in four of the six pairs. Coordinates and modelled soil properties of each field are given in Table S1. Irrigation is therefore defined here only as the presence of regular irrigation; its history and dose are unknown.
Table 1.
Sampled fields, their management and pairing. Field numbers correspond to Figure 1; the rainfed field of each pair is listed first. Records of irrigation history, volume and timing, tillage and fertilisation were not available.
Sample collection took place over a single field campaign in May 2025, under consistent meteorological conditions. At each field, soil subsamples were collected from five points arranged in an envelope-shaped pattern (four corners and the centre of the sampling area), with approximately 3–4 m between adjacent sampling points. At each point, the uppermost 0–5 cm of soil was removed, and soil was taken from a depth of 5–10 cm. Sampling was performed within the crop row. The five subsamples were combined and thoroughly mixed in the field to form one composite soil sample per field, from which approximately 500 g was retained for analysis. Part of each sample was frozen in liquid nitrogen immediately after collection and stored at −80 °C until DNA extraction.
2.1.3. Sources of Digital Soil Data
Global soil property information was extracted from SoilGrids (version 2.0), a set of digital maps produced by ISRIC—World Soil Information at a spatial resolution of 250 m. In this study, the following SoilGrids properties were used: bulk density of the fine earth fraction, cation exchange capacity (CEC), volumetric fraction of coarse fragments, sand, silt and clay contents, total nitrogen, soil organic carbon, organic carbon density, organic carbon stock in the 0–30 cm layer, and soil pH measured in water.
Soil water retention at field capacity was obtained from the global OpenLandMap dataset “Soil Water Content at 33 kPa (Field Capacity)” at 250 m resolution, which is available via the Google Earth Engine (GEE) data catalogue.
2.1.4. Data Extraction in Google Earth Engine
For the organic carbon stock, the integral layer organic_carbon_stock_kg_m2_0-30cm_mean was used, which represents the predicted organic carbon stock in the 0–30 cm layer per unit area. For all other properties, the 5–15 cm layer, which contains the 5–10 cm sampling depth, was used in all analyses.
Field capacity was retrieved from the image OpenLandMap/SOL/SOL_WATERCONTENT-33KPA_USDA-4B1C_M/v01 in the GEE catalogue.
The 10 cm band (b10) was used in all analyses.
2.2. DNA Extraction, Library Preparation, and Sequencing
Genomic DNA was extracted from each of the 12 soil samples with the DNeasy PowerSoil Kit (Qiagen, Hilden, Germany), following the manufacturer’s protocol, and purified by sodium acetate precipitation. Sequencing libraries were prepared with the Rapid Sequencing DNA V14—Barcoding Kit (SQK-RBK114.24; Oxford Nanopore Technologies, Oxford, UK) according to the manufacturer’s protocol: barcoded samples were pooled in equal mass before loading. The pooled library of 12 barcoded samples was split across two R10.4.1 flow cells and sequenced on a PromethION 2 Solo (P2 Solo) device (Oxford Nanopore Technologies, Oxford, UK) running MinKNOW software (version 25.05.14). Reads from the two flow cells were merged for each sample. Basecalling and demultiplexing were carried out in MinKNOW using the corresponding kit configuration and the super-accuracy basecalling model.
2.3. Metagenomic Analysis
2.3.1. Read Quality Control
Raw reads were processed with the NanoPack suite: read-length and quality-score distributions were visualised with NanoPlot (version 1.47.1), and reads were filtered with NanoFilt (version 2.8.0.), retaining only reads with a minimum quality score of Q15 and a minimum length of 300 bp. Duplicate read identifiers were then removed (0.017% of reads). Each soil yielded 0.16–2.19 Gb in 82,290–1,096,636 reads, with read N50 of 2.8–4.6 kb and a median read quality of Q16.7–Q18.1. Reads shorter than 1 kb (31–44% of reads) were excluded from taxonomic mapping, as required by the classifier. Two technical descriptors were carried through every later analysis: library size, the number of microbial reads obtained from a soil, and mapping rate, the proportion of reads that MetaMaps could place.
2.3.2. Taxonomic Profiling
We analysed reads rather than assemblies. At 0.16–2.19 Gb per soil, most genomes were covered below 1×, so assembly would have recovered only the most abundant populations and discarded most reads. Read-level classification uses every read and tolerates the ~2% per-base error of Q17 reads, because a read is placed by whole-read alignment or by many k-mers. Reads were profiled with two independent classifiers. MetaMaps (version 0.1) was run against the miniSeq+H database (build of 19 January 2026) with k = 16, window 8, minimum read length 1000 bp and a minimum estimated identity of 80%, and per-read assignments were taken from the expectation–maximisation step. In parallel, Kraken2 (version 2.17.1) profiles generated against a bacterial, archaeal, viral and eukaryotic database (build of 16 October 2025) were used both as produced and after filtering, retaining only reads ≥1 kb for which ≥5% of non-ambiguous k-mers matched the database. Because Kraken2 was run without a confidence threshold, its assignments, particularly for low-abundance lineages far from the references, are treated as unreliable. MetaMaps is the primary profile, and Kraken2 is used only to check whether effects agree in direction. For all profiles, reads assigned to Metazoa or Viridiplantae were removed, and abundances were expressed as the proportion of reads assigned at each rank (domain to species) among the reads assigned at that rank. Strain-level tables were built by counting each read at its lowest assignment, with reads placed exactly on a species labelled as strain-unresolved. Genus accumulation curves were computed by Hurlbert rarefaction of per-read assignments.
Two further properties of the assignment were measured. First, the estimated identity of every placed read was attributed to the phylum and class of the reference genome it matched, which gives the distance from the reference genomes for each lineage rather than as a single distribution. Second, within each soil, the reads ≥1 kb that MetaMaps placed were compared with those it could not place, in length, basecall quality and guanine–cytosine (GC) content, and the two sets were contrasted by paired t-tests across the twelve soils.
2.3.3. Reference-Free Comparison
Because most reads cannot be placed against reference genomes, the soils were also compared without a database. Each soil contributed exactly 140 Mb of reads ≥1 kb; canonical 21-mers were hashed and sub-sampled with FracMinHash (scale 1/200), retaining k-mer counts. Sketches were built three times: from all reads, from the reads MetaMaps could not place, and from the reads it placed. Because most genomes in these soils are covered below 1×, distances were computed on the hashes observed in at least two soils, which removes singleton k-mers arising from sequencing error and from genomes sampled once. The resulting distance matrices were ordinated and tested for irrigation in the same way as the taxonomic ones, with the same within-pair permutation scheme.
2.3.4. Functional Annotation
First, taxa were mapped to ecological functions with FAPROTAX (Functional Annotation of Prokaryotic Taxa; version 1.2.12); a function’s abundance is the proportion of microbial reads assigned to taxa carrying it, so reads not resolved deeply enough contribute only to the denominator. Second, genes were annotated directly. The 100,000 reads per soil described below were translated in six frames, and stop-to-stop segments of ≥50 amino acids were retained (robust to the frameshifts expected at this error rate). Segments were searched with pyhmmer (version 0.12.3) against 109 of the 27,756 KOfam profiles (release downloaded 14 July 2026) covering nitrogen, carbon, sulfur and phosphorus cycling, osmotic- and desiccation-stress genes, mobile genetic elements and 15 single-copy marker genes. Each segment was assigned to its best-scoring orthologue at ≥50% of the KOfam score threshold, and counts were expressed per genome equivalent, defined as the mean number of hits to the single-copy markers.
2.3.5. Antibiotic and Metal Resistance Genes
For each soil, 100,000 random reads ≥1 kb (all such reads for the two smallest libraries) were compared by blastx with the Basic Local Alignment Search Tool (BLAST+; version 2.16.0) against the protein homolog models of the Comprehensive Antibiotic Resistance Database (CARD; version 4.0.1, released 29 May 2025) and the experimentally confirmed proteins of the Antibacterial Biocide and Metal Resistance Genes Database (BacMet; version 2.0; 753 proteins). Per read, best non-overlapping hits were retained (overlap ≤30% of the aligned read region) at ≥50% amino-acid identity over ≥70% of the reference protein; thresholds of ≥40%/70% and ≥80%/80% were used as sensitivity tiers. In addition, all reads were mapped with minimap2 (version 2.27-r1193) to the 6052 CARD nucleotide homolog models, retaining alignments with ≥80% identity over ≥60% of the gene, to quantify close relatives of known resistance genes.
2.4. Statistical Analysis
2.4.1. Design and Permutation Scheme
The statistical strategy had two goals: to respect the pairing of fields, and to separate irrigation from sequencing depth, which varied 14-fold between soils. The design is paired: irrigation is contrasted within six spatially matched field pairs, the two fields of a pair lying 0.06–16.0 km apart. Irrigation labels were therefore permuted within pairs, which gives 26 = 64 relabellings. The statistics used are symmetric in the two labels, so each relabelling and its mirror return the same value, and the smallest attainable p-value is 2/64 = 0.031. Only 32 distinct values therefore exist, and p < 0.05 is reached only when the observed labelling is the most extreme of these 32. This permutation floor is marked wherever p-values are plotted, and values resting on it are reported as such. Tests that ignore the pairing (924 unrestricted splits, floor 0.002) are reported alongside as a sensitivity check. Land use was tested by permutation within irrigation status (300 relabellings). All tests are two-sided except where a direction was specified before the analysis, which is stated explicitly at those points.
2.4.2. Community-Level Analyses
Community structure was analysed on Bray–Curtis, Jaccard (presence, on counts rarefied to the shallowest soil), Aitchison (Euclidean distance on centred log-ratio abundances) and Hellinger distances, at every rank and in every profile. Irrigation was tested by permutational multivariate analysis of variance (PERMANOVA; one-way and as an additive model with site), analysis of similarities (ANOSIM), multi-response permutation procedure (MRPP) and, for heterogeneity, permutational analysis of multivariate dispersions (PERMDISP). Partial redundancy analysis quantified the variance attributable to irrigation after site. Associations with metadata were assessed by marginal distance-based redundancy analysis (one variable at a time), by forward selection with adjusted R2, and by Mantel and partial Mantel tests controlling geography or library size. Because library size and mapping rate vary between soils, every community test was repeated with each of them entered as a covariate before irrigation.
2.4.3. Diversity Analyses
Alpha diversity was computed on counts rarefied to the shallowest soil by multivariate hypergeometric sampling (mean of 50 draws): observed richness, Chao1, Shannon, Simpson, inverse Simpson and Pielou evenness, at genus, species and strain level in every profile. Irrigation was tested by paired t-test and Wilcoxon signed-rank test, land use by permutation within irrigation status, and associations with soil properties by Spearman and partial Spearman correlation given library size.
2.4.4. Feature-Level Tests
Taxa, functions, genes and resistance classes were tested as within-pair differences of centred log-ratio (taxa) or log2 (functions, genes, resistance) abundances, with and without the within-pair differences in library size and mapping rate as covariates. Residual variances were shrunk towards a common prior estimated across all features (empirical Bayes, following the approach of limma), and moderated t statistics were converted to Benjamini–Hochberg q-values within each table. Directions specified before analysis—the predicted depletion of desiccation-associated taxa under irrigation—were tested one-sided with Holm correction across that family. Counts of nominally significant results are reported against the number expected by chance throughout.
2.4.5. Sequencing Depth and Detectable Effects
Two analyses tested how far sequencing depth and sample size limit the conclusions. First, each library was subsampled without replacement to the number of assigned reads in the smallest library, 100 times. For the abundant genera (above 0.4% of assigned reads and present in all twelve soils), Bray–Curtis and Aitchison dissimilarities were computed among the subsamples of each soil and between soils. If depth limited the estimates, the dissimilarity among subsamples of one soil would approach that between soils, including between paired fields. The community tests for irrigation were then repeated on equal-depth subsamples. Second, we quantified the effects the design could detect. For within-pair tests with six pairs and two-sided α = 0.05, 80% power requires a standardised effect (mean within-pair difference divided by its standard deviation) of dz = 1.43, and 50% power requires dz = 0.99. Effects of irrigation on taxa and gene groups are therefore reported as mean within-pair log2 fold changes with 95% confidence intervals (CIs). For partial redundancy analysis, the variance attributed to irrigation after site was compared with its expectation under random labelling. For a single within-pair contrast, this expectation is one-sixth of the within-pair variance, which we confirmed by averaging over all 64 relabellings.
2.4.6. Software
Read-level analyses used MetaMaps version 0.1, Kraken2 version 2.17.1, minimap2 version 2.27-r1193, BLAST+ version 2.16.0 and pyhmmer version 0.12.3. Statistical analysis and figures were produced in Python version 3.14.4 with numpy 2.5.3, scipy 1.18.1, scikit-learn 1.9.1 and matplotlib 3.11.2; FracMinHash sketching, the permutation tests, redundancy analysis and the empirical-Bayes moderation were implemented directly in numpy and scipy.
3. Results
3.1. Sequencing Depth and Taxonomic Assignment
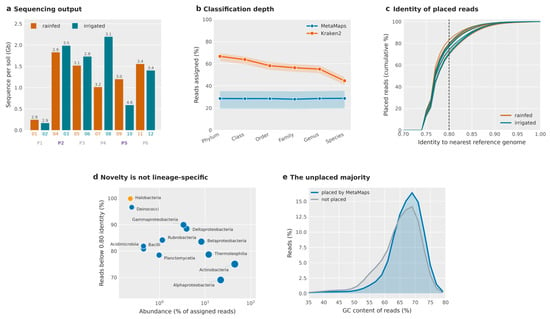
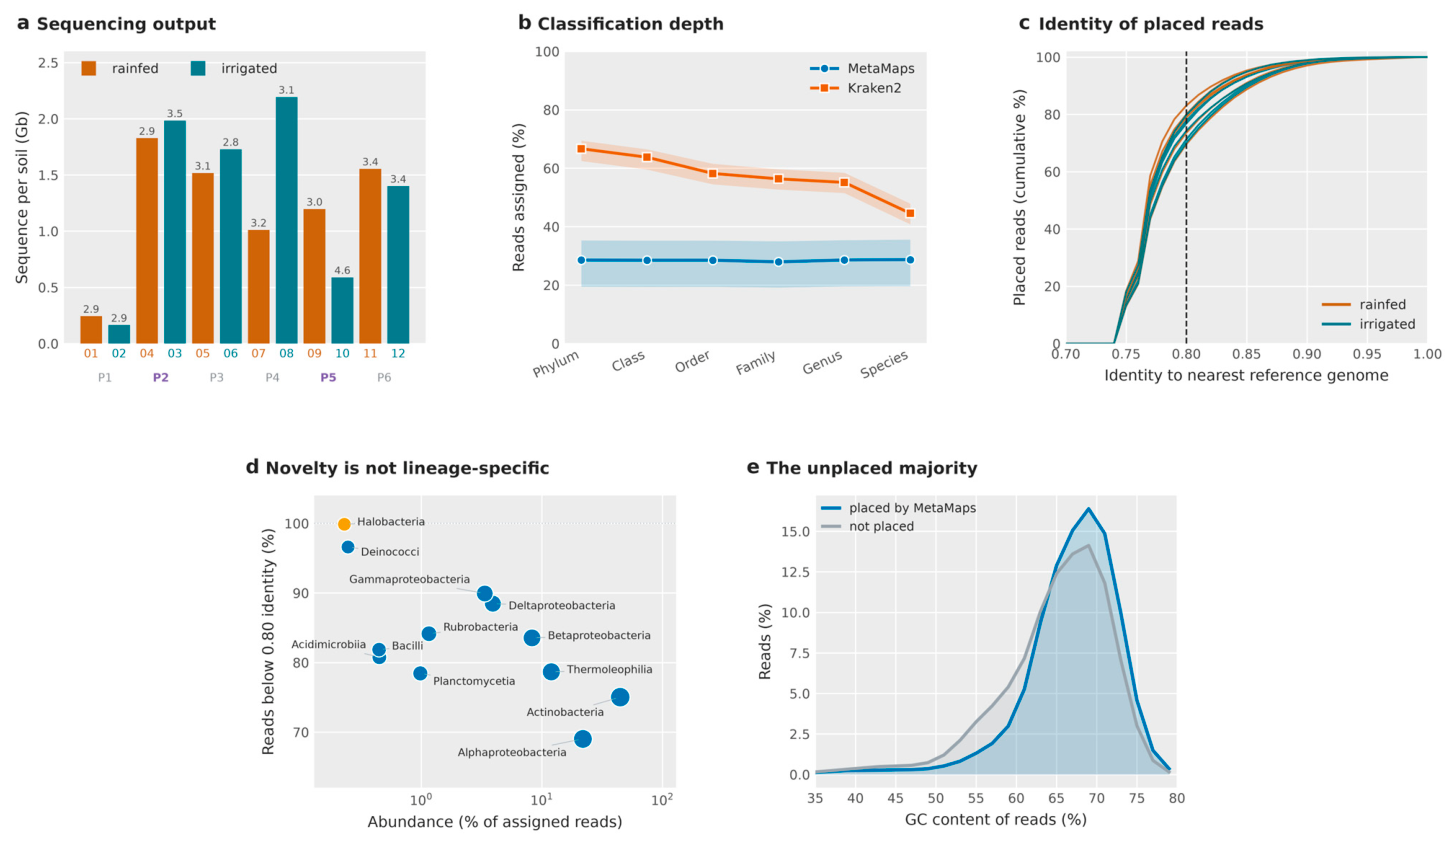
We first describe sequencing depth and how much of each metagenome could be classified, because these properties bound every later test. Sequencing yielded 0.16–2.19 Gb per soil, a 14-fold range, with read N50 of 2.8–4.6 kb (Figure 2a). Classification depth differed markedly between the two classifiers. Kraken2 assigned 45–67% of reads at ranks from phylum to species, whereas MetaMaps placed 28–29% at every rank, reflecting that it either maps a read to a reference genome or leaves it unassigned (Figure 2b). Of the reads ≥1 kb, 64–80% could not be placed at the 80% identity threshold at all; those that were placed sat close to that threshold, with a median identity of 0.77 and only 1.1–3.0% of reads reaching 0.90 (Figure 2c). Figure 2c,d show a separate, Poisson-model identity estimate that MetaMaps reports for each accepted mapping, so placed reads can fall below 0.80. Median read quality was Q17, corresponding to about 2% error. Distance from the references was a property of the whole community rather than of a few lineages: 75.0% of actinobacterial reads and 69.0% of alphaproteobacterial reads fell below 0.80 identity, rising to 83.5% in Betaproteobacteria, 89.9% in Gammaproteobacteria, 96.6% in Deinococci and 99.9% in the archaeal Halobacteria (Figure 2d). Nor were the unplaced reads the poor ones. Within each soil, they were about twice as long as the reads that were placed (median 2723 against 1375 bp), marginally lower in quality (Q17.0 against Q18.6) and lower in GC content (64.9% against 66.8%; paired t-test across the twelve soils, p < 0.0001 for all three, Figure 2e).
Figure 2.
Sequencing output, taxonomic assignment and distance from the reference genomes: (a) Sequence obtained per soil; read N50 in kb above each bar. (b) Percentage of reads assigned at each rank by the two classifiers (line, mean; band, range across soils). (c) Cumulative distribution of read identity to the nearest reference genome for the reads MetaMaps placed; the dashed line marks its 80% mapping threshold. (d) Share of each class’s reads below 0.80 identity against its abundance; symbol area scales with the number of reads and the archaeal class is shown in orange. (e) Guanine–cytosine (GC) content of the reads MetaMaps placed and of those it could not place, pooled over the twelve soils.
3.2. Dominance, Shared Core and Sampling Adequacy
Assignments were overwhelmingly bacterial (99.1% of assigned reads), and two phyla, Actinobacteria (58.1%) and Proteobacteria (37.4%), made up about 95% of assignments in every soil (Figure S4a–d). The 46 abundant genera formed three covarying modules, of which one tracked library size (Spearman ρ = +0.69, p = 0.014) and none separated irrigated from rainfed fields (paired t-test, p ≥ 0.069; Figure S5).
The soils shared not only their taxa but their abundance structure. Twelve genera accounted for half of the assigned reads in every soil (range 10–13), and the rank–abundance curves were almost superimposable across the twelve soils (Figure S4e). The ranking of the fifty most abundant genera agreed closely between any two soils (Spearman ρ = +0.68, range +0.22 to +0.96).
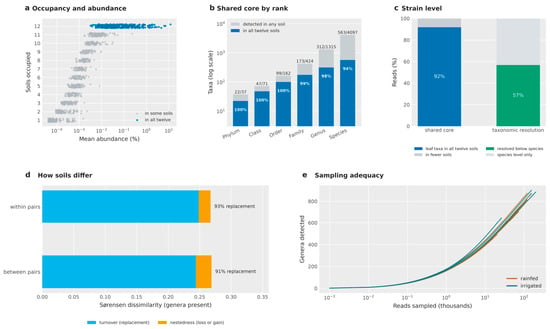
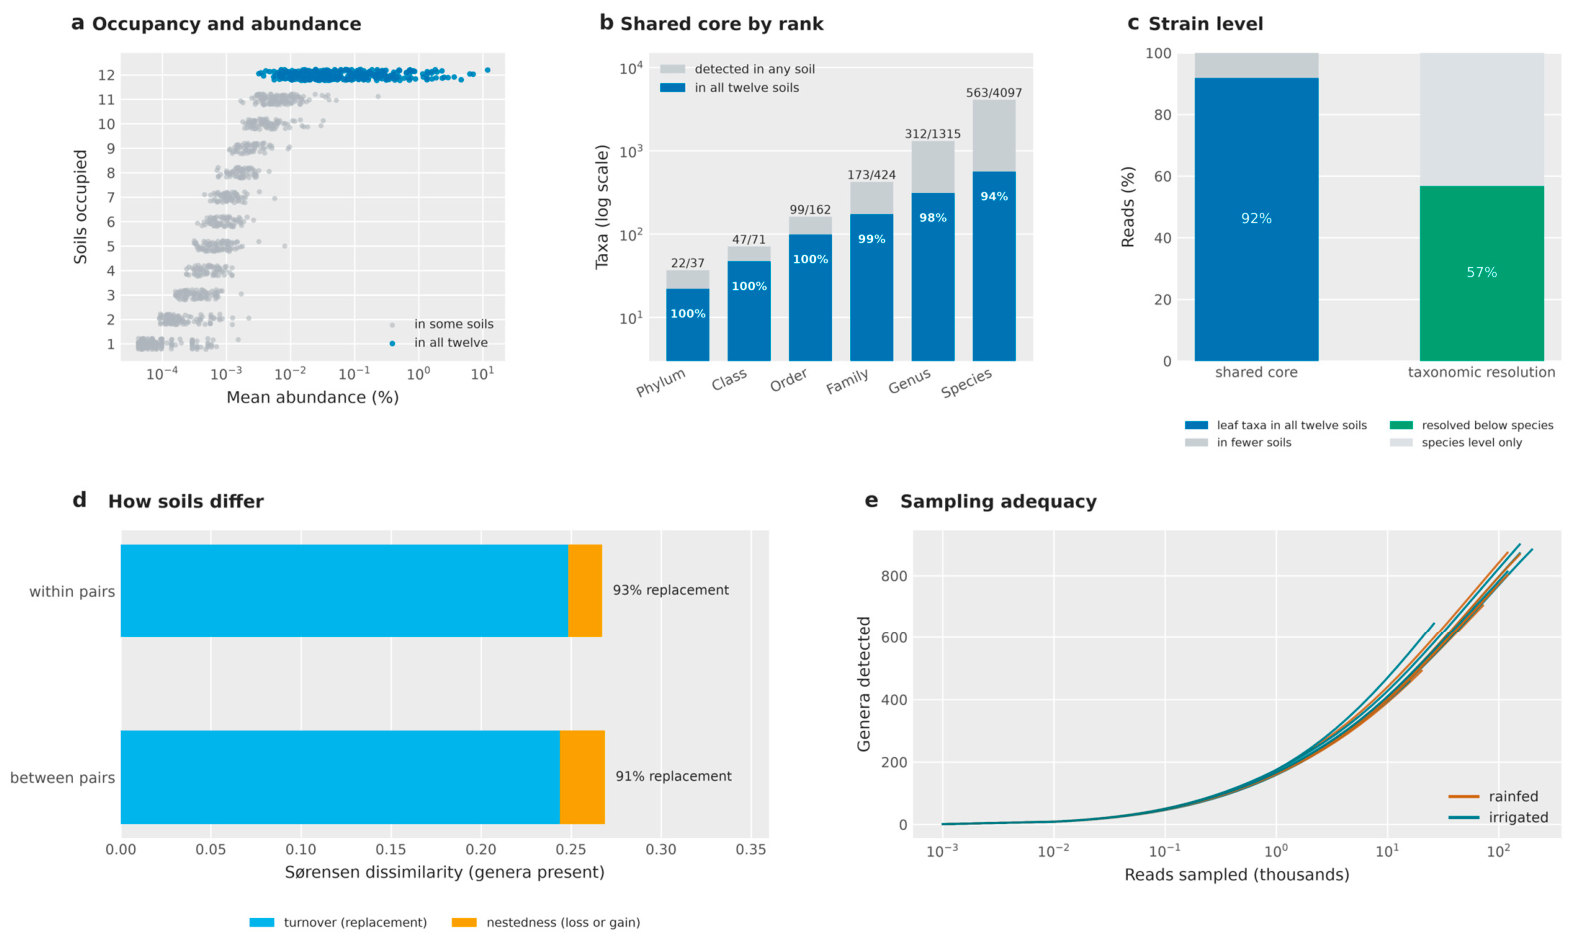
Occupancy was strongly bimodal: genera were either present in all twelve soils or in very few (Figure 3a). The 312 genera found in every soil represent 24% of all genera detected but carry 97.6% of assigned reads, while the 380 genera confined to three soils or fewer carry 0.09%. The same pattern held at every rank: 22 of 37 phyla, 47 of 71 classes, 99 of 162 orders, 173 of 424 families and 563 of 4097 species occurred in all twelve soils, and in each case, the shared taxa carried 94–100% of the reads (Figure 3b). At the finest resolution, 573 of 5033 leaf assignments occurred in every soil and carried 92% of reads (Figure 3c). Differences between soils therefore came from the exchange of rare taxa rather than from the loss of common ones: partitioning Sørensen dissimilarity into its components attributed 93% of the difference between paired fields, and 91% of the difference between pairs, to replacement rather than to nestedness (Figure 3d). None of this reflects saturated sampling: no rarefaction curve approached an asymptote, and at full depth, each soil still gained 261–406 genera per tenfold increase in reads (Figure 3e).
Figure 3.
Shared core, turnover and sampling adequacy. (a) Occupancy of each genus against its mean abundance. (b) Taxa detected in any soil and in all twelve, by rank; white figures give the share of reads carried by the shared taxa. (c) Leaf-level (strain) assignments: share of reads carried by leaf taxa found in all twelve soils, and share resolved below species. (d) Sørensen dissimilarity partitioned into replacement and nestedness, within and between pairs. (e) Genus rarefaction curves.
Sequencing depth did not limit the estimates for the abundant genera. After every library was subsampled to the depth of the smallest (16,379 assigned reads), subsamples of the same soil differed by a median Bray–Curtis dissimilarity of 0.026, against 0.177 between paired fields and 0.233 between all soils (Figure S3). On equal-depth data, irrigation was not significant with Bray–Curtis in any of 100 draws (median p = 0.19). With Aitchison distance, the median p was 0.09, and 22 of 100 draws reached the permutation floor (p = 0.031). This points to a weak log-ratio shift that a larger design could test. With six pairs, within-pair tests reach 80% power only for standardised effects of dz ≥ 1.43.
3.3. No Detectable Large or Consistent Community-Wide Shift Under Irrigation
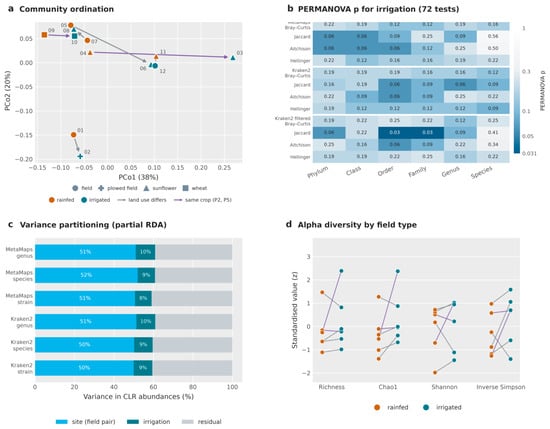
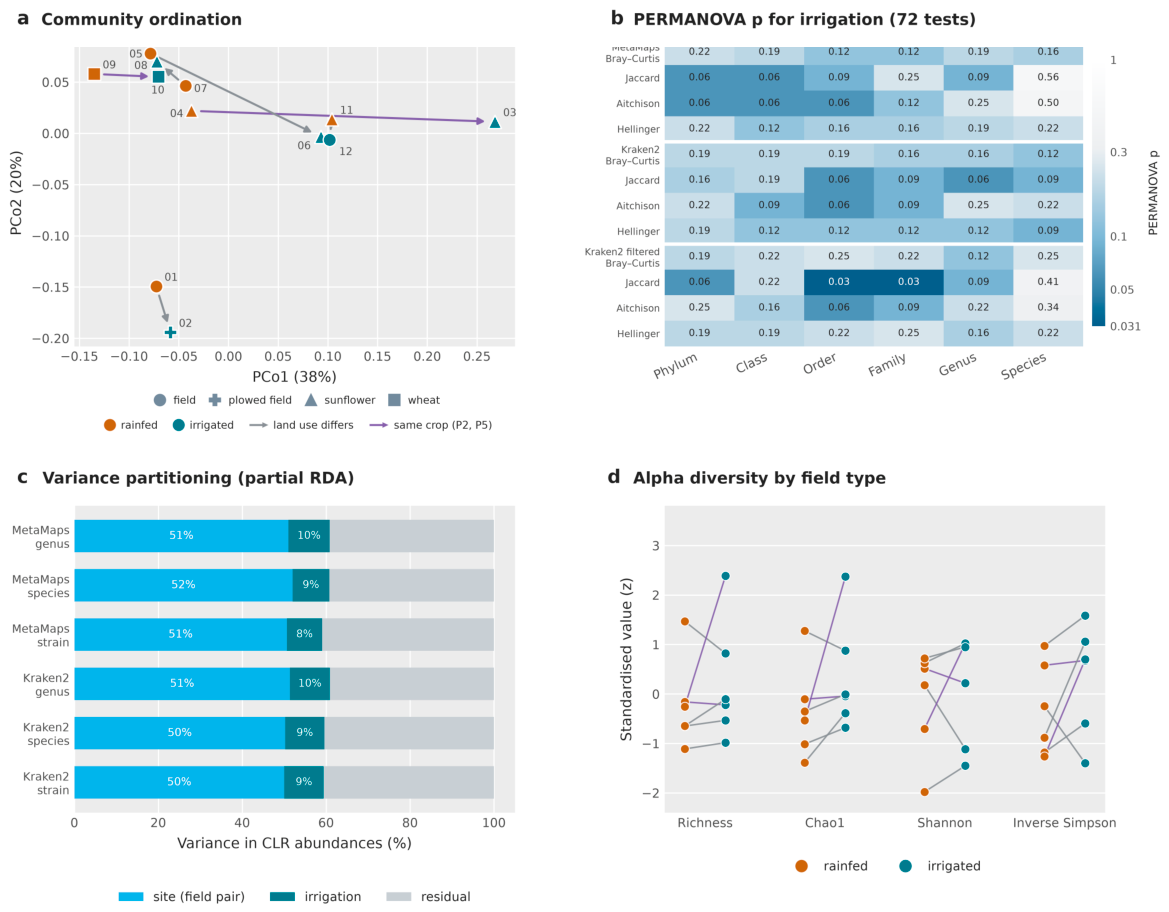
Irrigated and rainfed fields did not separate in ordination; paired fields moved in inconsistent directions (Figure 4a). Across 75 community tests (72 taxonomic tests spanning six ranks, four distance measures and three profiles, plus three reference-free tests on all, unplaced and placed reads), PERMANOVA p-values for irrigation ranged from 0.031 to 0.562. The only values at the permutation floor were presence/absence tests at order and family level in the filtered Kraken2 profile (Figure 4b). Tests that ignored pairing gave p ≥ 0.16. Partial redundancy analysis attributed 50–52% of the variance in log-ratio abundances to site and 8–10% to irrigation after site, consistently across classifiers and across genus, species and strain level (Figure 4c). This is close to the 8.0–8.3% expected by chance for a single within-pair contrast. No diversity metric differed between field types at any level or in any profile (paired t-test p ≥ 0.08; Figure 4d). The reference-free comparison agreed. Using all reads, or only the reads without a reference match, irrigation gave p = 0.09, while site explained about half of the variance and paired fields were more similar to each other (mean distance 0.81) than to other soils (0.88) (Figure S1a,b). Irrigated fields were initially more heterogeneous than rainfed fields, but this difference did not persist once library size was included as a covariate (Figure S1c).
Figure 4.
Irrigation at community level. (a) Principal coordinate (PCo) analysis of genus Bray–Curtis dissimilarity; arrows run from the rainfed to the irrigated field of each pair, and purple arrows mark the two pairs in which both fields carried the same crop (P2, P5). (b) Permutational multivariate analysis of variance (PERMANOVA) p for irrigation by rank, distance and profile (72 tests); labels were permuted within pairs (64 relabellings; minimum attainable p = 0.031). Only the 72 taxonomic tests are shown; the three reference-free tests (all, unplaced and placed reads; Section 3.3 and Figure S1) are not plotted. (c) Variance in centred log-ratio (CLR) abundances attributed to site, to irrigation after site, and residual (partial redundancy analysis, RDA). (d) Alpha diversity at species level after rarefaction, by field type, standardised per metric; lines join paired fields (purple, the two same-crop pairs). Mean difference, irrigated relative to rainfed (paired t-test): richness +2.2% (p = 0.38), Chao1 +3.5% (p = 0.20), Shannon +0.4% (p = 0.62) and inverse Simpson +10.1% (p = 0.22).
3.4. Taxa That Differ Between Field Types
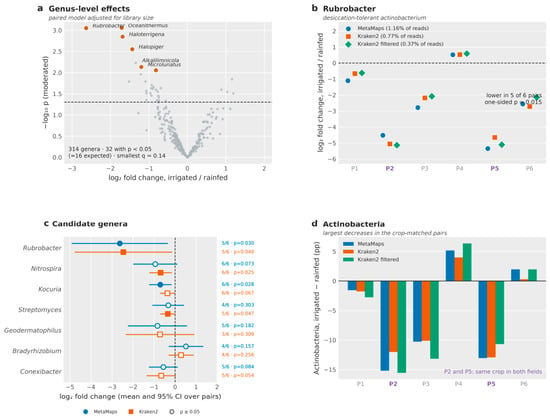
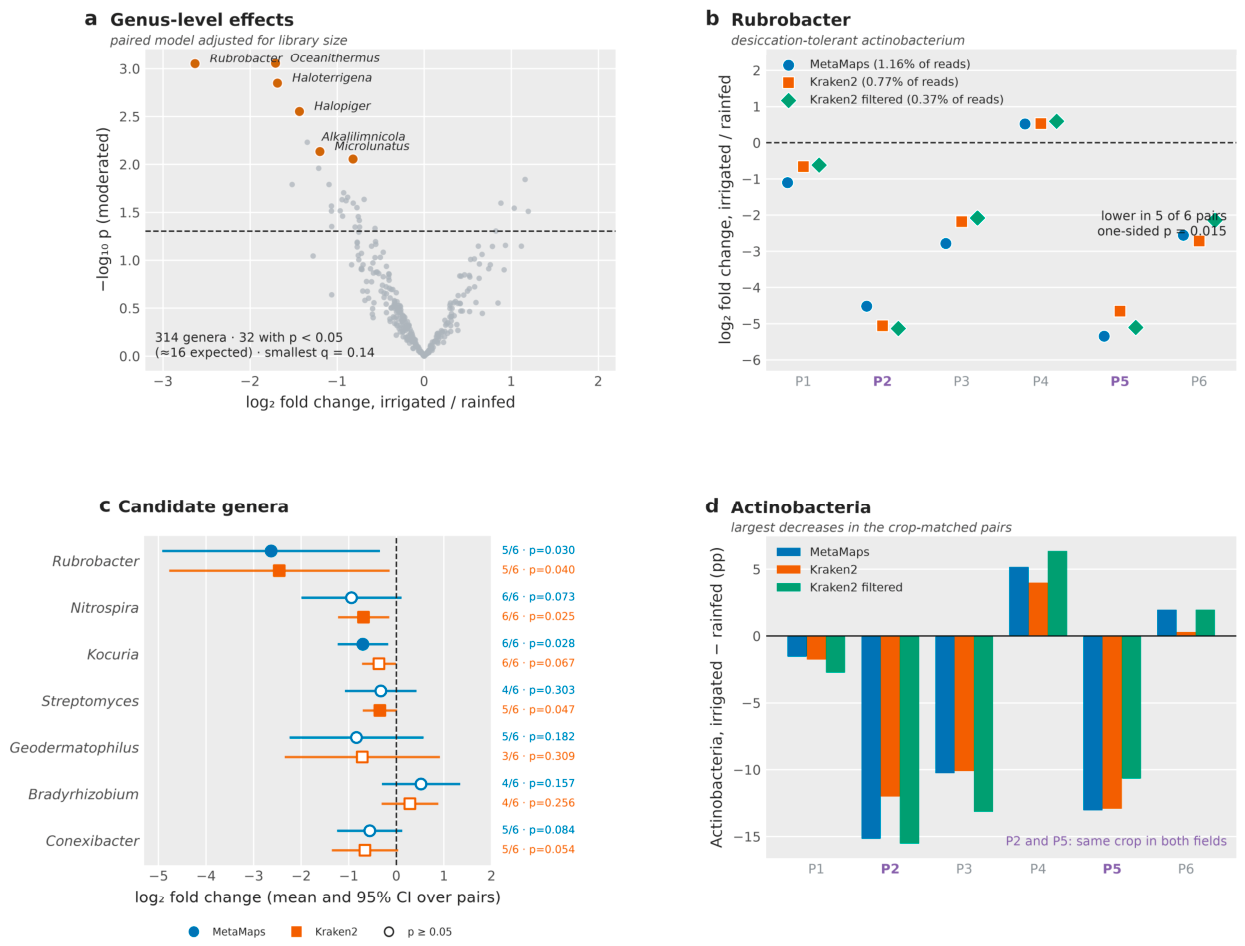
With library size as a covariate, variance-moderated paired models returned about twice as many nominally significant genera as expected by chance (32 of 314 in MetaMaps and 76 of 680 in Kraken2, against 16 and 34 expected). No taxon passed correction for multiple testing (smallest q = 0.14; Figure 5a). The strongest and most reproducible signal was Rubrobacter, which was 2- to 40-fold less abundant in the irrigated field of five of the six pairs in all three profiles (mean log2 fold change −2.6, 95% CI −5.0 to −0.3; one-sided p = 0.015, Holm-adjusted p = 0.23; Figure 5b). The genera with the next smallest p-values (Oceanithermus, the haloarchaea Haloterrigena and Halopiger, Alkalilimnicola and Microlunatus) were all lower in irrigated fields. However, they are mostly halophilic or extremophilic lineages whose reads lie far from their references (99.9% of reads in the archaeal Halobacteria and 96.6% in Deinococci fell below 0.80 identity; Figure 2d). We therefore do not interpret these assignments further. Nitrospira and Kocuria were lower in the irrigated field of all six pairs and Streptomyces in five of six, each nominally significant in at least one classifier (Figure 5c). At phylum level, Actinobacteria decreased by 5.4–5.7 percentage points on average, but the pairs differed widely. Actinobacteria fell by about 10–15 percentage points in P2, P3 and P5, changed by less than 3 points in P1 and P6, and rose by 4–6 points in P4 (Figure 5d). The two pairs in which both fields carried the same crop (P2 and P5) were among the largest decreases, but P3, whose fields carried different crops, fell by a similar amount.
Figure 5.
Taxa that differ between field types. (a) Within-pair irrigation effects on genus abundances, adjusted for library size (variance-moderated paired models); the dashed line marks p = 0.05, and q is the Benjamini–Hochberg adjusted p-value. (b) Within-pair change in Rubrobacter in the three profiles; the dashed line marks no change. (c) Candidate genera with mean effect and 95% confidence interval; filled symbols mark p < 0.05, and the dashed line marks no change. (d) Within-pair change in Actinobacteria, in percentage points (pp); P2 and P5 carried the same crop in both fields.
3.5. Functional Potential and Resistance Genes
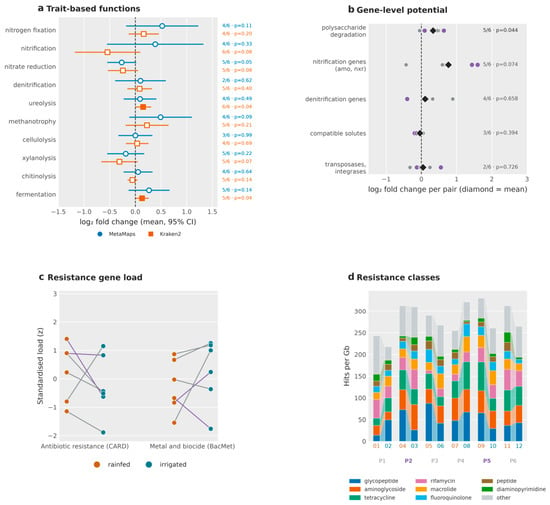
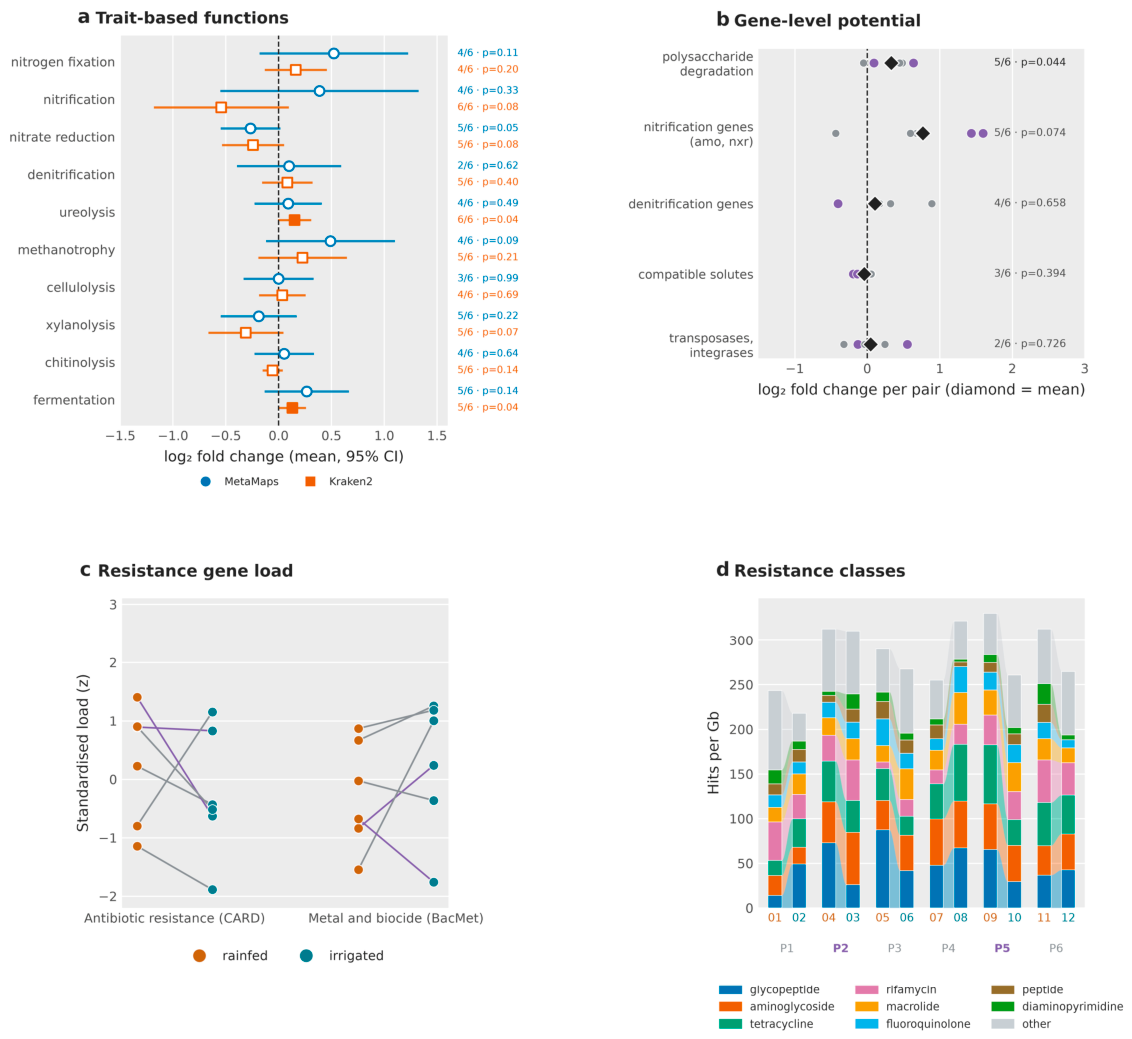
FAPROTAX assigned at least one function to 82–86% of MetaMaps reads and 44–51% of Kraken2 reads. Nitrogen-cycle functions gave most of the repeated differences. Nitrate reduction was lower in the irrigated field of five of six pairs in both profiles (p = 0.05 and 0.08). Kraken2 placed nitrification lower in six of six pairs (p = 0.08) and ureolysis higher in six of six (p = 0.04). Fermentation was also higher in five of six pairs in Kraken2 (p = 0.04). No function passed correction (Figure 6a). At the gene level, polysaccharide degradation genes (cellulases, β-glucosidase, chitinase, xylanase) were 26% more abundant per genome equivalent (95% CI +4% to +52%) in the irrigated field of five of six pairs (p = 0.027, and p = 0.044 with library size as a covariate). In contrast, compatible-solute genes (mean change −3%, 95% CI −10% to +5%) and mobile-element genes did not differ (p ≥ 0.39; Figure 6b). Nitrification genes were higher in five of six pairs, but the orthologues involved cannot be distinguished from respiratory nitrate reductase. Soils carried 218–330 antibiotic-resistance hits and 681–927 metal or biocide resistance hits per Gb, neither of which differed between field types (p = 0.40 for both; Figure 6c). Resistance profiles were dominated by efflux systems and by glycopeptide, aminoglycoside, tetracycline and rifamycin classes, in similar proportions in every soil (Figure 6d); close relatives of known resistance genes (≥80% nucleotide identity) were rare, at 21–60 hits per Gb.
Figure 6.
Functional potential and resistance genes. (a) Within-pair change in trait-based functions (Functional Annotation of Prokaryotic Taxa, FAPROTAX) with 95% confidence interval; circles, MetaMaps; squares, Kraken2; filled symbols mark p < 0.05. (b) Within-pair change in gene groups annotated with KOfam, expressed per genome equivalent; dots, individual pairs (purple, the two same-crop pairs P2 and P5); diamonds, mean; the dashed line marks no change. (c) Antibiotic (Comprehensive Antibiotic Resistance Database, CARD) and metal or biocide (Antibacterial Biocide and Metal Resistance Genes Database, BacMet) resistance load per Gb, standardised (z-score); lines join paired fields (purple, the two same-crop pairs). (d) Composition of the antibiotic resistance profile by drug class; field numbers are shown in orange (rainfed) and teal (irrigated).
3.6. What Explains the Communities
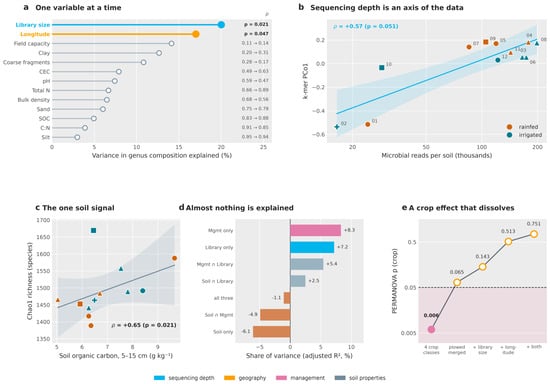
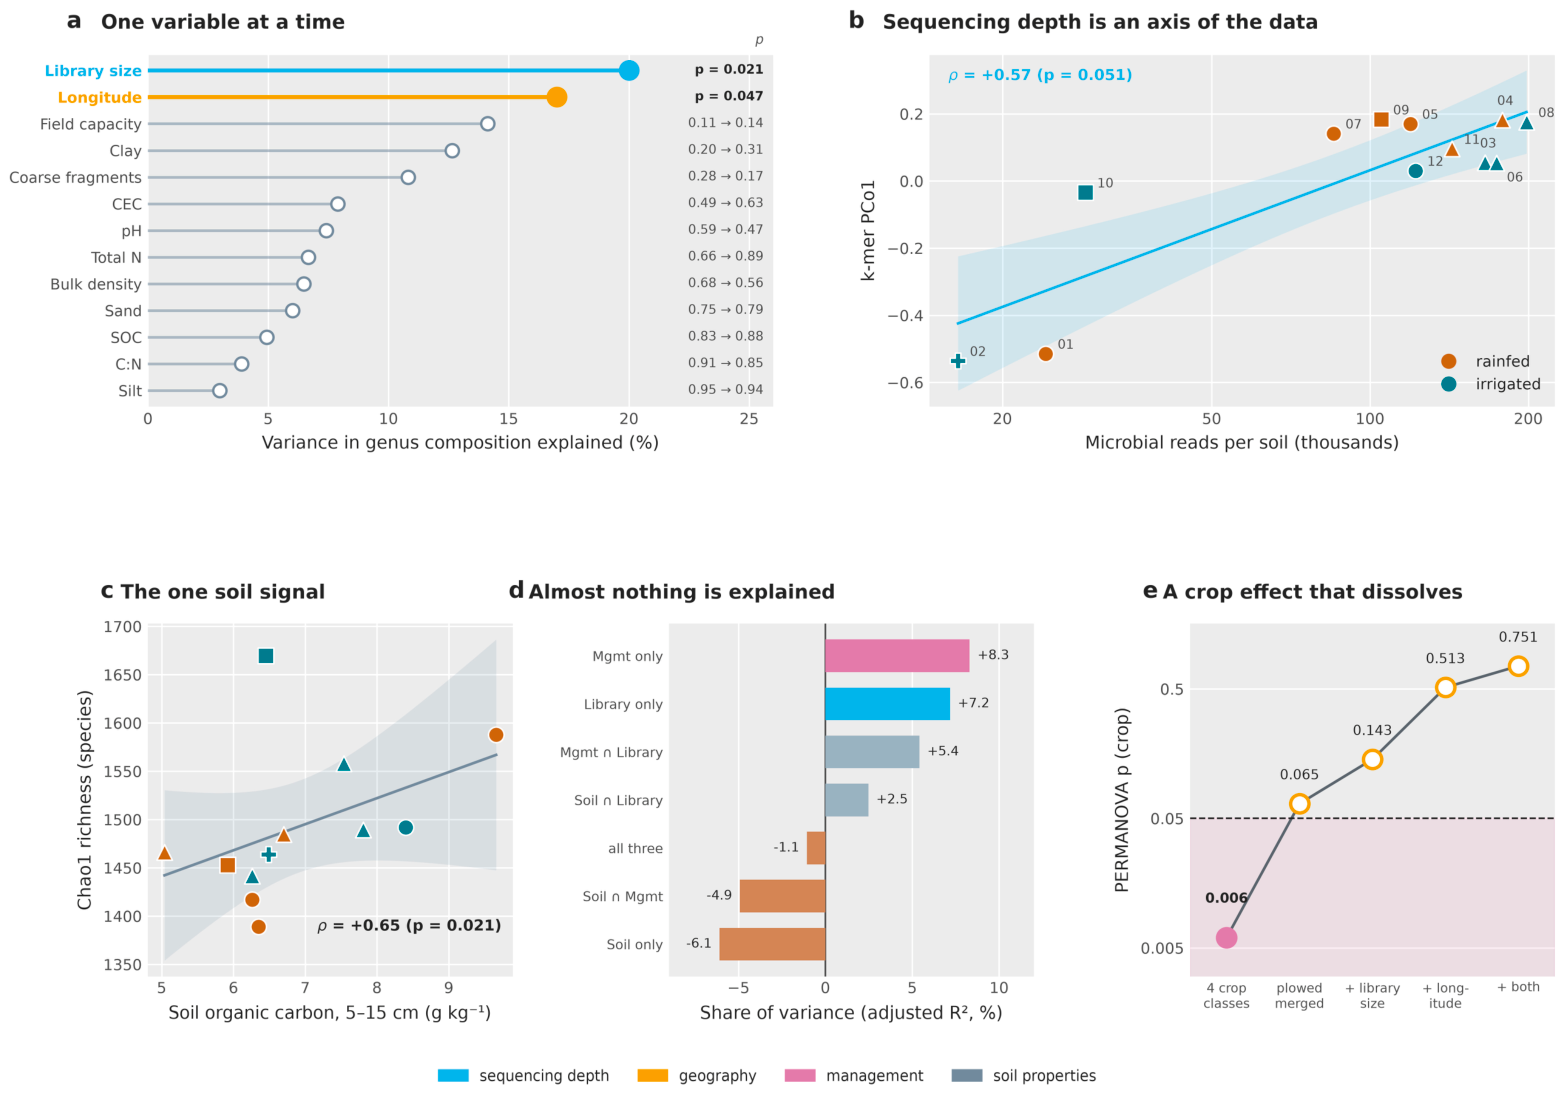
Considered one at a time, no soil property of the 5–15 cm SoilGrids layer explained community composition. Field capacity and clay gave the largest marginal effects (13–14% of variance), but p = 0.11–0.20. The two variables that did reach significance were library size (20%, p = 0.021) and longitude (17%, p = 0.047) (Figure 7a). Library size remained associated with community structure in the reference-free analysis even though every soil contributed an identical amount of sequence (R2 = 0.15, p = 0.003; Spearman ρ = +0.57 with the first axis; Figure 7b). Among diversity measures, richness increased with modelled soil organic carbon (Chao1, ρ = +0.65, p = 0.021; p = 0.031 after library size; Figure 7c). Variation partitioning left 89% of the variance in genus composition unexplained, with management, library size and soil properties each accounting for a small and partly shared fraction (Figure 7d). Land use showed the same pattern. Sunflower soils did not differ from the others (p ≥ 0.06 at every rank in both classifiers; Figure S2). An apparent four-class crop effect (p = 0.006) rested on a single field and disappeared once that class was merged and longitude was taken into account (p = 0.75; Figure 7e).
Figure 7.
Variables associated with community structure. (a) Variance in genus composition explained by each variable alone; for soil properties, the p-value before and after adjusting for library size is shown; filled symbols mark p < 0.05, colours give the type of variable, and CEC, SOC and C:N denote cation exchange capacity, soil organic carbon and the carbon-to-nitrogen ratio. (b) First principal coordinate (PCo1) of the reference-free k-mer ordination against library size. (c) Chao1 richness against modelled soil organic carbon (5–15 cm). In (b,c), the line and shaded band show a linear fit and its confidence band; symbol shape gives land use (circle, uncultivated/unspecified; cross, ploughed; triangle, sunflower; square, wheat), and colour gives water regime (orange, rainfed; teal, irrigated). (d) Variation partitioning of genus composition among soil properties, management and library size (Mgmt, management; ∩, shared fraction). (e) PERMANOVA p for crop with four classes, after merging the single ploughed field into the uncultivated/unspecified class, and after adjusting for library size and longitude; the filled symbol marks p < 0.05, and the dashed line and shading mark p = 0.05 and below.
4. Discussion
This study provides, to our knowledge, the first long-read metagenomic comparison of irrigated and rainfed soils in Kazakhstan and the wider Eurasian steppe. Its answers to the four aims are provisional, because six pairs can detect only large effects. First, we detected no large or consistent shift in community composition at any taxonomic rank tested, from phylum to strain, although equal-depth tests with Aitchison distance point to a weak log-ratio shift that a larger design could test. Second, irrigation did not increase heterogeneity among fields once sequencing depth was taken into account, so the Anna Karenina principle was not supported. Third, the predicted depletion of desiccation-associated taxa was observed in direction, most clearly for Rubrobacter, but it did not survive correction for multiple testing. Fourth, functional potential shifted only modestly, and the resistome did not differ between water regimes. In addition, most of the community lay far from reference genomes, which limits what any reference-based survey of these soils can currently resolve.
Most previous designs confound irrigation with site [34,35]. Our paired design allowed the two to be separated, and once this was done, site clearly dominated. Irrigation explained little more compositional variance than expected by chance, whereas site explained about half of it (Section 3.3).
The dominance of site over treatment agrees with work showing that soil type and geography, rather than a single management factor, shape soil microbial composition. In a global survey of 237 locations on six continents, only about 2% of bacterial phylotypes (around 500) consistently accounted for almost half of soil bacterial communities [5]. Our data show the same structure at a regional scale. When the same few hundred abundant genera occur in every field, a change in water supply has little room to move the community centroid.
The literature on irrigation is mixed, and our result lies at the weaker end of this range. In a three-year winter wheat experiment in a semi-arid region, irrigation affected bacterial abundance, diversity and composition more strongly than nitrogen fertilisation (PERMANOVA F = 4.1, p < 0.001, against F = 0.65, p = 0.76 for nitrogen) [19]. In contrast, precipitation manipulations of up to ±60% in the Junggar desert did not change the dominant bacterial phyla, and soil pH and total nitrogen explained composition instead [20]. Our fields resemble the Junggar case more than the controlled wheat trial.
The second aim tested an alternative response. At first, irrigated fields did appear more heterogeneous than rainfed fields. This difference disappeared once library size was included as a covariate. Uneven library sizes are known to create artefactual structure in ordinations and distance-based tests, so clustering by sequencing depth must be checked as a confounder [36].
The third aim tested a directional prediction. Drought consistently enriches Actinobacteria and other monoderm bacteria [10,11,12]. If drought enriches these taxa, added water should deplete them, and the direction we observed agreed with this: Rubrobacter was lower in the irrigated field of five of six pairs (Section 3.4). Radiation- and desiccation-resistant bacteria are characteristic of arid soils, where efficient antioxidant systems protect them against oxidative damage during drying [37,38]. A decline of Rubrobacter under irrigation is therefore biologically coherent. When water is no longer limiting, its stress tolerance offers little advantage over faster-growing competitors.
The number of nominally significant genera was about twice the chance expectation, yet none passed correction. Power was limited: even Rubrobacter, the strongest signal, reached only dz = 1.17, below the effect size that six pairs can detect with 80% power (Section 2.4.5). This is the pattern expected from many small effects spread across many taxa, rather than from a few strong responders.
Crop may contribute to the phylum-level decrease in Actinobacteria, which was largest in the two pairs with the same crop in both fields, but P3, whose fields carried different crops, fell by a similar amount, and with only two crop-matched pairs the effect of crop cannot be separated from that of site.
The fourth aim concerned functional and resistance-gene profiles. Functional shifts were in plausible directions but statistically weak. In the FAPROTAX profiles, nitrate reduction and nitrification tended to be lower and ureolysis higher in irrigated fields, but none of these differences passed correction (Section 3.5). Gene-based annotation was more informative for carbon. Polysaccharide-degradation genes (cellulases, β-glucosidase, chitinase and xylanase) were more abundant in the irrigated field in five of six pairs. In dry soils, microbial activity is limited by substrate diffusion, and wetting releases this limitation [39]. Irrigation also increases plant growth and residue inputs [40]. Both mechanisms would favour decomposers of plant polysaccharides.
FAPROTAX assigns functions from taxonomy and cannot capture metabolic variation within taxa [41]. In the gene-based analysis, nitrification genes were nominally higher in five of six pairs, but their orthologues cannot be distinguished reliably from respiratory nitrate reductase; we therefore do not interpret this as evidence of greater nitrification. We also expected irrigation to lower the genetic investment in drought tolerance, because water limitation favours organisms able to accumulate osmolytes, and trait-based frameworks predict that such traits shift with water availability [42]. However, compatible-solute genes did not differ between water regimes. These communities therefore carry similar stress-tolerance potential regardless of irrigation, and any response is more likely to occur in gene expression and activity than in gene content.
The resistome did not differ between irrigated and rainfed fields (Figure 6c). Profiles were dominated by efflux systems, and close relatives of known resistance genes (≥80% nucleotide identity) were rare (Section 3.5). This is the signature of an intrinsic background resistome rather than an acquired, mobile one. Soil resistomes are structured mainly by bacterial phylogeny, and soil resistance genes are rarely associated with mobility elements [43]. An unchanged resistome is expected here, because the fields were irrigated with river water through canals or pumping systems.
We also set out to quantify how much of this community can be placed against existing reference genomes. The answer is very little. Most reads of at least 1 kb could not be placed at 80% identity, and few placed reads came close to 90% identity (Section 3.1; Figure 2c). Because nanopore reads carry more errors than short reads, unplaced reads must be interpreted with care. Sequencing error does not explain this pattern. At a median read quality of Q17, or about 2% error, a read from a genome present in the database would still align at well above 90% identity. Long, good-quality reads with a distinct GC signature that do not map indicate genuinely novel lineages, not sequencing failure.
This agrees with what is now known about soil as the least catalogued major microbiome. Ultra-deep short-read sequencing of 600 agricultural soils, with an average of 107 Gb per sample, projected that 1–4 Tb per sample would be needed to capture 95% of the community [24]. Against this background, our yield of 0.16–2.19 Gb per soil and the large unplaced fraction are expected. Reference-based profilers will classify only a minority of reads from dry steppe soils until reference catalogues improve. This is why read-level analyses that use every read are valuable. The reference-free k-mer comparison, which does not depend on any database, reached the same conclusion as the taxonomic analyses: irrigation was not significant whether all reads or only the unplaced reads were used, and site explained about half of the variance.
Several limitations bound our conclusions. The design included only six pairs, and the within-pair permutation floor was p = 0.031 with 64 possible relabellings, so the study can detect only large effects. Our null result should therefore be read as “no large effect of irrigation”, not as “no effect”. Sequencing depth was modest (0.16–2.19 Gb per soil), and no rarefaction curve saturated, so rare taxa were undersampled. The community comparisons therefore rest mainly on the shared core, which carried almost all assigned reads and was detected in every soil. Crop and irrigation were confounded in four of six pairs, which reduced power to isolate the water signal. Farm records of irrigation history, volume and timing, tillage and fertilisation were not available, so irrigation is defined only by its presence. We sampled in a single campaign, so seasonal dynamics and the time since last irrigation were not captured. Each field was represented by one composite of five subsamples, so within-field variation was averaged rather than measured. DNA-based profiles include relic DNA from dead cells, which can make up a large share of soil DNA and can dampen treatment signals [44]. We did not remove relic DNA (for example, by propidium monoazide treatment), so differences between the living communities may be larger than those observed here. Soil properties were modelled at 250 m resolution rather than measured, and paired fields as close as 60 m can fall in the same grid cell, so these covariates cannot separate paired fields. No soil was retained for direct measurement, and electrical conductivity, which would reveal irrigation-driven salinisation, could not be assessed. No DNA remained to resequence the smallest libraries. The per-base error of nanopore reads, about 2% at Q17, affects gene annotation and k-mer analyses. Finally, our functional and resistance profiles describe genetic potential, not realised activity.
Future work should measure soil moisture and chemistry directly, include more pairs, sequence more deeply, and hold crop constant within pairs. Repeated sampling of the same fields across the season, before and after irrigation events, would hold site and soil constant; together with irrigation chronosequences, it would show whether the depletion of desiccation-tolerant taxa strengthens with cumulative water input.
5. Conclusions
In this exploratory study, we found no large or consistent shift in the soil microbial communities between irrigated and rainfed fields of the East Kazakhstan steppe, although a weak log-ratio shift that a larger design could test cannot be excluded. Site and geography were the main sources of variation and explained several times more compositional variance than water regime. Desiccation-tolerant Actinobacteria, most clearly Rubrobacter, were depleted in irrigated fields consistently in direction, although not significantly after correction for multiple testing. Irrigated fields also showed a higher potential for polysaccharide degradation. The resistome was unchanged.
Sequencing was shallow (0.16–2.19 Gb per soil) and read accuracy modest (median Q17), so our conclusions concern the abundant, shared core of the community and cannot resolve rare taxa or strains. Most of the community lay far from reference genomes, and the unplaced reads were long and of good quality, which suggests genuine novelty rather than poor data. Dry steppe soils therefore remain largely uncharacterised, and reference-based surveys capture only a minority of their diversity. With six field pairs, our results exclude large effects of irrigation but not small ones. Measured soil data, farm records of irrigation, balanced crop designs, time series and deeper genome-resolved sequencing are the next steps.
Supplementary Materials
The following supporting information can be downloaded at https://www.mdpi.com/article/10.3390/d18110666/s1, Figure S1: Reference-free comparison and dispersion; Figure S2: Land use and library yield; Figure S3: Dissimilarity among equal-depth subsamples of each soil and between soils; Figure S4: Taxonomic composition from domain to genus; Figure S5: Covariation among the abundant genera; Table S1: Location, management and modelled soil properties of the twelve sampled fields.
Author Contributions
Conceptualization, I.I. and M.S.; methodology, Z.A. and Z.S.; software, I.I. and M.T.; validation, Z.S.; formal analysis, Z.A. and M.T.; investigation, Z.A., D.D., Z.S. and M.T.; resources, M.S.; data curation, Z.S., Z.A. and M.T.; writing—original draft preparation, I.I., M.T. and D.D.; writing—review and editing, I.I. and M.S.; visualization, I.I.; supervision, M.S.; project administration, D.D.; funding acquisition, M.S. All authors have read and agreed to the published version of the manuscript.
Funding
This research was funded by the Ministry of Agriculture of the Republic of Kazakhstan, program number BR22885097.
Institutional Review Board Statement
Not applicable.
Data Availability Statement
The raw sequencing data generated in this study have been deposited in the National Center for Biotechnology Information (NCBI) Sequence Read Archive (SRA) and are available under BioProject accession number PRJNA1533358 at https://www.ncbi.nlm.nih.gov/bioproject/PRJNA1533358 (accessed on 24 October 2026). Associated BioSample and SRA accessions can be found linked to this BioProject record.
Conflicts of Interest
The authors declare no conflicts of interest.
References
- Tecon, R.; Or, D. Biophysical processes supporting the diversity of microbial life in soil. FEMS Microbiol. Rev. 2017, 41, 599–623. [Google Scholar] [CrossRef] [Scilit] [PubMed]
- Simon, E.; Guseva, K.; Darcy, S.; Alteio, L.; Pjevac, P.; Schmidt, H.; Jenab, K.; Ranits, C.; Kaiser, C. Distinct microbial communities are linked to organic matter properties in millimetre-sized soil aggregates. ISME J. 2024, 18, wrae156. [Google Scholar] [CrossRef] [Scilit] [PubMed]
- Asiloglu, R.; Bodur, S.O.; Fujino, M. Predatory Protists: The Key Players in the Quest for Sustainable Agricultural Practices. J. Agric. Sci. 2024, 30, 436–443. [Google Scholar] [CrossRef] [Scilit]
- Delgado-Baquerizo, M.; Maestre, F.T.; Reich, P.B.; Jeffries, T.C.; Gaitan, J.J.; Encinar, D.; Berdugo, M.; Campbell, C.D.; Singh, B.K. Microbial diversity drives multifunctionality in terrestrial ecosystems. Nat. Commun. 2016, 7, 10541. [Google Scholar] [CrossRef] [Scilit] [PubMed]
- Delgado-Baquerizo, M.; Oliverio, A.M.; Brewer, T.E.; Benavent-González, A.; Eldridge, D.J.; Bardgett, R.D.; Maestre, F.T.; Singh, B.K.; Fierer, N. A global atlas of the dominant bacteria found in soil. Science 2018, 359, 320–325. [Google Scholar] [CrossRef] [Scilit] [PubMed]
- Bickel, S.; Or, D. The chosen few—Variations in common and rare soil bacteria across biomes. ISME J. 2021, 15, 3315–3325. [Google Scholar] [CrossRef] [Scilit] [PubMed]
- Li, W.; Jiang, L.; Zhang, Y.; Teng, D.; Wang, H.; Wang, J.; Lv, G. Structure and driving factors of the soil microbial community associated with Alhagi sparsifolia in an arid desert. PLoS ONE 2021, 16, e0254065. [Google Scholar] [CrossRef] [Scilit] [PubMed]
- Maestre, F.T.; Delgado-Baquerizo, M.; Jeffries, T.C.; Eldridge, D.J.; Ochoa, V.; Gozalo, B.; Quero, J.L.; García-Gómez, M.; Gallardo, A.; Ulrich, W.; et al. Increasing aridity reduces soil microbial diversity and abundance in global drylands. Proc. Natl. Acad. Sci. USA 2015, 112, 15684–15689. [Google Scholar] [CrossRef] [Scilit] [PubMed]
- Knight, C.G.; Nicolitch, O.; Griffiths, R.I.; Goodall, T.; Jones, B.; Weser, C.; Langridge, H.; Davison, J.; Dellavalle, A.; Eisenhauer, N.; et al. Soil microbiomes show consistent and predictable responses to extreme events. Nature 2024, 636, 690–696. [Google Scholar] [CrossRef] [Scilit] [PubMed]
- Naylor, D.; DeGraaf, S.; Purdom, E.; Coleman-Derr, D. Drought and host selection influence bacterial community dynamics in the grass root microbiome. ISME J. 2017, 11, 2691–2704. [Google Scholar] [CrossRef] [Scilit] [PubMed]
- Martins, B.R.; Siani, R.; Treder, K.; Michałowska, D.; Radl, V.; Pritsch, K.; Schloter, M. Cultivar-specific dynamics: Unravelling rhizosphere microbiome responses to water deficit stress in potato cultivars. BMC Microbiol. 2023, 23, 377. [Google Scholar] [CrossRef] [Scilit] [PubMed]
- Xu, L.; Naylor, D.; Dong, Z.; Simmons, T.; Pierroz, G.; Hixson, K.K.; Kim, Y.M.; Zink, E.M.; Engbrecht, K.M.; Wang, Y.; et al. Drought delays development of the sorghum root microbiome and enriches for monoderm bacteria. Proc. Natl. Acad. Sci. USA 2018, 115, E4284–E4293. [Google Scholar] [CrossRef] [Scilit] [PubMed]
- Egas, C.; Barroso, C.; Froufe, H.J.; Pacheco, J.; Albuquerque, L.; da Costa, M.S. Complete genome sequence of the Radiation-Resistant bacterium Rubrobacter radiotolerans RSPS-4. Stand. Genom. Sci. 2014, 9, 1062–1075. [Google Scholar] [CrossRef] [Scilit] [PubMed]
- Terato, H.; Suzuki, K.; Nishioka, N.; Okamoto, A.; Shimazaki-Tokuyama, Y.; Inoue, Y.; Saito, T. Characterization and Radio-resistant Function of Manganese Superoxide Dismutase of Rubrobacter radiotolerans. J. Radiat. Res. 2011, 52, 735–742. [Google Scholar] [CrossRef] [Scilit] [PubMed]
- Nobre, A.; Alarico, S.; Fernandes, C.; Empadinhas, N.; da Costa, M.S. A Unique Combination of Genetic Systems for the Synthesis of Trehalose in Rubrobacter xylanophilus: Properties of a Rare Actinobacterial TreT. J. Bacteriol. 2008, 190, 7939–7946. [Google Scholar] [CrossRef] [Scilit] [PubMed]
- Hartmann, M.; Brunner, I.; Hagedorn, F.; Bardgett, R.D.; Stierli, B.; Herzog, C.; Chen, X.; Zingg, A.; Graf-Pannatier, E.; Rigling, A.; et al. A decade of irrigation transforms the soil microbiome of a semi-arid pine forest. Mol. Ecol. 2017, 26, 1190–1206. [Google Scholar] [CrossRef] [Scilit] [PubMed]
- Ma, G.; Kang, J.; Wang, J.; Chen, Y.; Lu, H.; Wang, L.; Wang, C.; Xie, Y.; Ma, D.; Kang, G. Bacterial Community Structure and Predicted Function in Wheat Soil From the North China Plain Are Closely Linked With Soil and Plant Characteristics After Seven Years of Irrigation and Nitrogen Application. Front. Microbiol. 2020, 11, 506. [Google Scholar] [CrossRef] [Scilit] [PubMed]
- Ding, F.; Ji, S.; Sa, R.; Nin, C.; Ma, F.; Yan, H. Effects of water-saving irrigation on microbial community structures, assembly, and metabolic activities in alfalfa rhizosphere soils. Int. Microbiol. 2025, 28, 1993–2006. [Google Scholar] [CrossRef] [Scilit] [PubMed]
- Li, H.; Wang, H.; Jia, B.; Li, D.; Fang, Q.; Li, R. Irrigation has a higher impact on soil bacterial abundance, diversity and composition than nitrogen fertilization. Sci. Rep. 2021, 11, 16901. [Google Scholar] [CrossRef] [Scilit] [PubMed]
- Wu, K.; Xu, W.; Yang, W. Effects of precipitation changes on soil bacterial community composition and diversity in the Junggar desert of Xinjiang, China. PeerJ 2020, 8, e8433. [Google Scholar] [CrossRef] [Scilit] [PubMed]
- Zaneveld, J.R.; McMinds, R.; Vega Thurber, R. Stress and stability: Applying the Anna Karenina principle to animal microbiomes. Nat. Microbiol. 2017, 2, 17121. [Google Scholar] [CrossRef] [Scilit] [PubMed]
- Naylor, D.; Naasko, K.; Smith, M.; Couvillion, S.; Nicora, C.; Trejo, J.; Fransen, S.; Danczak, R.; McClure, R.; Hofmockel, K.S.; et al. Interactive effects of depth and differential irrigation on soil microbiome composition and functioning. Front. Microbiomes 2023, 2, 1078024. [Google Scholar] [CrossRef] [Scilit] [PubMed]
- Ma, B.; Lu, C.; Wang, Y.; Yu, J.; Zhao, K.; Xue, R.; Ren, H.; Lv, X.; Pan, R.; Zhang, J.; et al. A genomic catalogue of soil microbiomes boosts mining of biodiversity and genetic resources. Nat. Commun. 2023, 14, 7318. [Google Scholar] [CrossRef] [Scilit] [PubMed]
- Johansen, P.L.; Chatzigiannidou, I.; Berzina, L.; Kristiansen, K.; Brix, S. Unveiling soil microbial diversity through ultra-deep short-read metagenomic sequencing and co-assembly. iMeta 2025, 4, e70075. [Google Scholar] [CrossRef] [Scilit] [PubMed]
- Bağcı, C.; Negri, T.; Buena-Atienza, E.; Gross, C.; Ossowski, S.; Ziemert, N. Ultra-deep long-read metagenomics captures diverse taxonomic and biosynthetic potential of soil microbes. GigaScience 2025, 14, giaf135. [Google Scholar] [CrossRef] [Scilit] [PubMed]
- Bejaoui, S.; Nielsen, S.H.; Rasmussen, A.; Coia, J.E.; Andersen, D.T.; Pedersen, T.B.; Møller, M.V.; Kusk Nielsen, M.T.; Frees, D.; Persson, S. Comparison of Illumina and Oxford Nanopore sequencing data quality for Clostridioides difficile genome analysis and their application for epidemiological surveillance. BMC Genom. 2025, 26, 92. [Google Scholar] [CrossRef] [Scilit] [PubMed]
- Nagiyeva, A.; Sergaliyev, N.; Bissembayev, A.T. PSXI-21 Soil emission of carbon dioxide and behavior of microorganisms in soils of Western Kazakhstan. J. Anim. Sci. 2021, 99, 345–347. [Google Scholar] [CrossRef] [Scilit]
- Nauanova, A.; Onggarbay, A.; Ordabayeva, A.; Abdigulov, B.; Kassipkhan, A.; Maxutbekova, G.; Nazarova, A.; Shevtsov, A. Bacterial and Fungal Community Responses to Long-Term Salinity Gradients in Natural Soils of Kazakhstan. Microorganisms 2026, 14, 1337. [Google Scholar] [CrossRef] [Scilit] [PubMed]
- Rolinski, S.; Prishchepov, A.V.; Guggenberger, G.; Bischoff, N.; Kurganova, I.; Schierhorn, F.; Müller, D.; Müller, C. Dynamics of soil organic carbon in the steppes of Russia and Kazakhstan under past and future climate and land use. Reg. Environ. Change 2021, 21, 73. [Google Scholar] [CrossRef] [Scilit]
- Isgandarov, I.; Abilda, Z.; Kanat, R.; Daurov, D.; Sapakhova, Z.; Daurova, A.; Zhambakin, K.; Volkov, D.; Begaly, A.; Shamekova, M. Long-Read Metagenomics Profiling for Identification of Key Microorganisms Affected by Heavy Metals at Technogenic Zones. Microorganisms 2026, 14, 196. [Google Scholar] [CrossRef] [Scilit] [PubMed]
- Abilda, Z.; Isgandarov, I.; Kanat, R.; Daurov, D.; Sapakhova, Z.; Zhambakin, K.; Daurova, A.; Begaliyeva, D.; Choi, K.; Shamekova, M. Genome-resolved metagenomics reveals co-selection of antibiotic and metal resistance in chronically polluted industrial soils. Front. Microbiol. 2026, 17, 1829529. [Google Scholar] [CrossRef] [Scilit] [PubMed]
- Daurov, D.; Zhambakin, K.; Daurova, A.; Sapakhova, Z.; Isgandarov, I.; Abilda, Z.; Sunatullayev, Z.; Klein, I.; Vyrakhmanova, A.; Ramazanova, R.; et al. Integrated assessment of heavy metal dynamics, ecological risk, and plant-mediated phytostabilization in mining-affected soils. Front. Plant Sci. 2026, 17, 1894392. [Google Scholar] [CrossRef] [Scilit] [PubMed]
- Daurov, D.; Abilda, Z.; Zhambakin, K.; Daurova, A.; Sapakhova, Z.; Toishimanov, M.; Isgandarov, I.; Mukhametov, A.; Kanat, R.; Otynshiev, M.; et al. Legacy of non-ferrous metallurgy driving heavy metal-induced geochemical transformation of urban soils. Front. Soil Sci. 2026, 6, 1949558. [Google Scholar] [CrossRef] [Scilit]
- Li, C.-H.; Tang, L.-S.; Jia, Z.-J.; Li, Y. Profile Changes in the Soil Microbial Community When Desert Becomes Oasis. PLoS ONE 2015, 10, e0139626. [Google Scholar] [CrossRef] [Scilit] [PubMed]
- Calderón, F.J.; Nielsen, D.; Acosta-Martínez, V.; Vigil, M.F.; Lyon, D. Cover Crop and Irrigation Effects on Soil Microbial Communities and Enzymes in Semiarid Agroecosystems of the Central Great Plains of North America. Pedosphere 2016, 26, 192–205. [Google Scholar] [CrossRef] [Scilit]
- Weiss, S.; Xu, Z.Z.; Peddada, S.; Amir, A.; Bittinger, K.; Gonzalez, A.; Lozupone, C.; Zaneveld, J.R.; Vázquez-Baeza, Y.; Birmingham, A.; et al. Normalization and microbial differential abundance strategies depend upon data characteristics. Microbiome 2017, 5, 27. [Google Scholar] [CrossRef] [Scilit] [PubMed]
- Fredrickson, J.K.; Li, S.-m.W.; Gaidamakova, E.K.; Matrosova, V.Y.; Zhai, M.; Sulloway, H.M.; Scholten, J.C.; Brown, M.G.; Balkwill, D.L.; Daly, M.J. Protein oxidation: Key to bacterial desiccation resistance? ISME J. 2008, 2, 393–403. [Google Scholar] [CrossRef] [Scilit] [PubMed]
- Rainey, F.A.; Ray, K.; Ferreira, M.; Gatz, B.Z.; Nobre, M.F.; Bagaley, D.; Rash, B.A.; Park, M.-J.; Earl, A.M.; Shank, N.C.; et al. Extensive Diversity of Ionizing-Radiation-Resistant Bacteria Recovered from Sonoran Desert Soil and Description of Nine New Species of the Genus Deinococcus Obtained from a Single Soil Sample. Appl. Environ. Microbiol. 2005, 71, 5225–5235. [Google Scholar] [CrossRef] [Scilit] [PubMed]
- Liu, D.; Keiblinger, K.M.; Leitner, S.; Wegner, U.; Zimmermann, M.; Fuchs, S.; Lassek, C.; Riedel, K.; Zechmeister-Boltenstern, S. Response of Microbial Communities and Their Metabolic Functions to Drying–Rewetting Stress in a Temperate Forest Soil. Microorganisms 2019, 7, 129. [Google Scholar] [CrossRef] [Scilit] [PubMed]
- Yao, X.; Zhang, Z.; Yuan, F.; Song, C. The impact of global cropland irrigation on soil carbon dynamics. Agric. Water Manag. 2024, 296, 108806. [Google Scholar] [CrossRef] [Scilit]
- Malik, A.A.; Martiny, J.B.H.; Brodie, E.L.; Martiny, A.C.; Treseder, K.K.; Allison, S.D. Defining trait-based microbial strategies with consequences for soil carbon cycling under climate change. ISME J. 2020, 14, 1–9. [Google Scholar] [CrossRef] [Scilit] [PubMed]
- Bouskill, N.J.; Wood, T.E.; Baran, R.; Ye, Z.; Bowen, B.P.; Lim, H.; Zhou, J.; Nostrand, J.D.V.; Nico, P.; Northen, T.R.; et al. Belowground Response to Drought in a Tropical Forest Soil. I. Changes in Microbial Functional Potential and Metabolism. Front. Microbiol. 2016, 7, 525. [Google Scholar] [CrossRef] [Scilit] [PubMed]
- Forsberg, K.J.; Patel, S.; Gibson, M.K.; Lauber, C.L.; Knight, R.; Fierer, N.; Dantas, G. Bacterial phylogeny structures soil resistomes across habitats. Nature 2014, 509, 612–616. [Google Scholar] [CrossRef] [Scilit] [PubMed]
- Carini, P.; Marsden, P.J.; Leff, J.W.; Morgan, E.E.; Strickland, M.S.; Fierer, N. Relic DNA is abundant in soil and obscures estimates of soil microbial diversity. Nat. Microbiol. 2016, 2, 16242. [Google Scholar] [CrossRef] [Scilit] [PubMed]

Disclaimer/Publisher’s Note: The statements, opinions and data contained in all publications are solely those of the individual author(s) and contributor(s) and not of MDPI and/or the editor(s). MDPI and/or the editor(s) disclaim responsibility for any injury to people or property resulting from any ideas, methods, instructions or products referred to in the content. |
© 2026 by the authors. Licensee MDPI, Basel, Switzerland. This article is an open access article distributed under the terms and conditions of the Creative Commons Attribution (CC BY) license.