


Abstract
Many Neotropical parrots are threatened or in danger of extinction due to exploitation and habitat destruction, but mitigating impacts is difficult because key components of their ecology, such as home range sizes, seasonal movements, effective population sizes, and dispersal patterns are not well-understood. We used non-invasive genetic sampling of feathers to evaluate the genetic diversity, population genetic structure, and the effective population size of Red-and-green Macaw (Ara chloropterus) and Scarlet Macaw (Ara macao) in intact rainforest in Peru. We sampled macaws from three to four locations across the Peruvian Amazon and generated genetic data for 12 nuclear microsatellite loci and 381 bp of the mitochondrial control region. Diversity was high across intact habitat for both macaws but was higher for Scarlet Macaw than for Red-and-green Macaw (He = 0.78 vs. 0.56, p = 0.0762; A = 5.6 vs. 3.9, p = 0.0256). For each species, Bayesian clustering analyses gave the greatest support for K = 1, suggesting one genetic group across the areas sampled. Pairwise FST values were low and not significantly different from zero, suggesting high gene flow across the region. Scarlet Macaws had higher overall FST values than Red-and-green Macaws, and more loci with differentiated allele frequencies, indicating that Scarlet Macaws may have more restricted gene flow than Red-and-green Macaws. Effective population size estimates for Scarlet Macaws were three to five times larger than for Red-and-green Macaws. These data provide baseline information on genetic diversity and population structure of macaws in intact habitat and can be used to inform conservation planning and as a reference to determine effects of human activities on macaw populations in Peru and throughout the Amazon Basin.
1. Introduction
Mitigating impacts to Neotropical parrot populations due to habitat destruction and population declines is difficult because key components of their biology and ecology are not well-understood. More than 30% of the 140 Neotropical parrot species are in danger of extinction due to exploitation and habitat loss [1]. Despite their charismatic nature, little is known about home range sizes, seasonal movement, and dispersal patterns of parrots, and this gap in knowledge is particularly striking for the large macaws [2,3,4]. Large macaws are capable of making large-scale movements [4,5,6], so they are thought to be area-sensitive species that require large tracts of habitat to maintain viable populations, but it is currently difficult to measure how anthropogenic changes impact populations because natural population dynamics are not well-understood.
Some threatened species of large macaw, such as Red-and-green Macaw (Ara chloropterus) and Scarlet Macaw (Ara macao), still have large tracts of habitat that are relatively pristine and are likely to maintain populations with natural dynamics. Comparing population dynamics in relatively undisturbed habitat to areas where macaws are more affected by anthropogenic activities will allow researchers and managers to quantify the effects of human alterations to the landscape and design management plans to minimize these effects. Studying macaw population dynamics in areas with large tracts of intact habitat will also provide critical information about the scale of natural population processes.
The eastern edge of Peru contains some of the most intact rainforest remaining in the Amazon basin [7,8]. Forest in Peru has remained intact in part due to its inaccessibility and in part due to the large percentage of land designated as protected areas. For example, close to 50% of land within the southeastern department of Madre de Dios currently has protected status, although oil and gas prospecting, timber extraction, gold mining, farming, and tourism development threaten to degrade protected forests [9,10]. Increased access to protected rainforest and exacerbation of threats have been caused by the recently developed (2011) transoceanic highway in southern Peru connecting the western Amazon basin of Brazil with the Pacific Coast [11]. Understanding current population dynamics for species in this area is imperative for determining how the highway, gold mining, and other human habitat alterations may affect viability of populations.
The Red-and-green Macaw and the Scarlet Macaw, the two largest species of macaw in Peru, reside in this area of intact rainforest. Surveys along rivers throughout Peru suggest that both species exist in large, healthy populations [12,13]. Both of these species are distributed throughout the Amazon Basin and are of conservation concern in Brazil and most countries where they occur. Additionally, the range of the Scarlet Macaw extends north into Central America [14]. At an international level, Red-and-green Macaw and Scarlet Macaw have IUCN Red List designations of “least concern” [1], because large populations remain in remote areas such as in Peru. However, the Scarlet Macaw has CITES Appendix I status and elevated restrictions on international trade because of conservation concerns throughout Central America due to severe exploitation and habitat fragmentation. Because of these declines, Scarlet Macaw has been more extensively studied than Red-and-green Macaw [15,16].
Studying Red-and-green Macaw and Scarlet Macaw in intact habitat is challenging because they are difficult to capture [6,17], inhabit the canopy of the forest [14], and can move relatively long distances [4,18]. Studies employing the use of radio telemetry and GPS technology in Peru have evaluated fine-scale movement patterns of macaws [4,18], but these methods are costly and challenging to implement in the remote rainforest. These studies have found evidence of much larger home range sizes in the non-breeding season and documented the importance of palm habitat for the Scarlet Macaw [4,5]. Fine-scale and seasonal movements are important for local conservation efforts; however, survival of populations depends on maintaining dispersal and gene flow patterns. Dispersal is an important mechanism in avoiding inbreeding and maintaining genetic diversity, which has been correlated with fitness of individuals and populations [19]. Consequently, we chose to use genetic tools to study parrots in Peru [20], which allow us to indirectly examine dispersal capabilities of parrots by evaluating population structure across their ranges [21], monitor genetic diversity levels in fragmented and unfragmented habitat [22], define appropriate conservation and management units [23], and estimate effective population size [24]. An additional benefit of using genetic tools is that valuable data can be obtained via non-invasive collection of molted feathers which decreases costs, field effort, and risk to the birds [20,25,26,27].
Previous work on parrots using nuclear DNA microsatellite loci has generally found low population structure and high connectivity across sampling areas [26,28,29,30,31], but studies have also found low levels of differentiation and significant Fst values [28,29,30,31]. Microsatellite analysis studies in parrots have found high level of genetic variation in less impacted areas and lower diversity in endangered and captive populations [26,27,28,29,30,32,33]. There is one large scale mtDNA genetic study for Scarlet Macaws, which found support for the two subspecies and regional substructure within subspecies [34].
By utilizing a sampling approach of obtaining feathers at clay licks [25,26,27], we provide a large-scale population genetic evaluation of Red-and-green Macaw and Scarlet Macaw in intact habitat. Specifically, we use 12 nuclear DNA (nDNA) microsatellite loci and sequence data from 381 base pairs (bp) of the mitochondrial DNA (mtDNA) control region to characterize genetic diversity, evaluate population genetic structure, and estimate effective population size. These data provide critical baseline information about population level diversity and structure as well as provide insight into differences in life history between these two macaw species.
2. Materials and Methods
2.1. Study Area
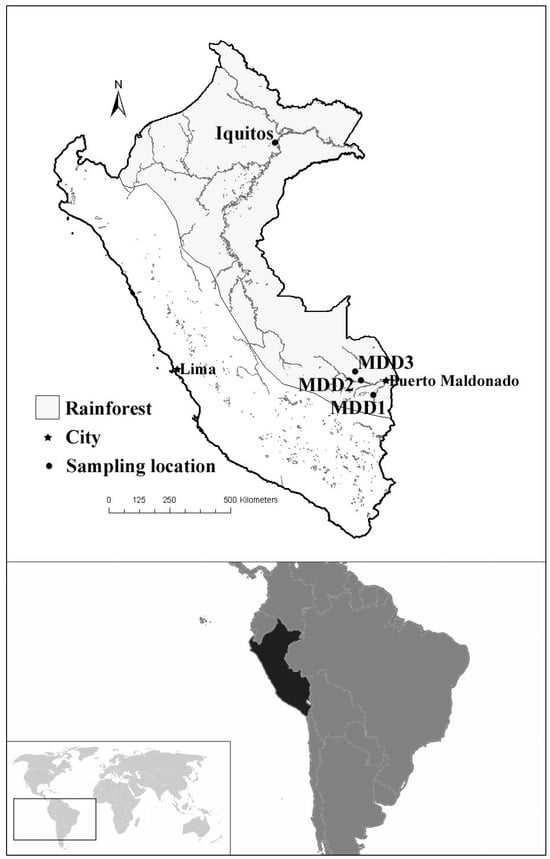
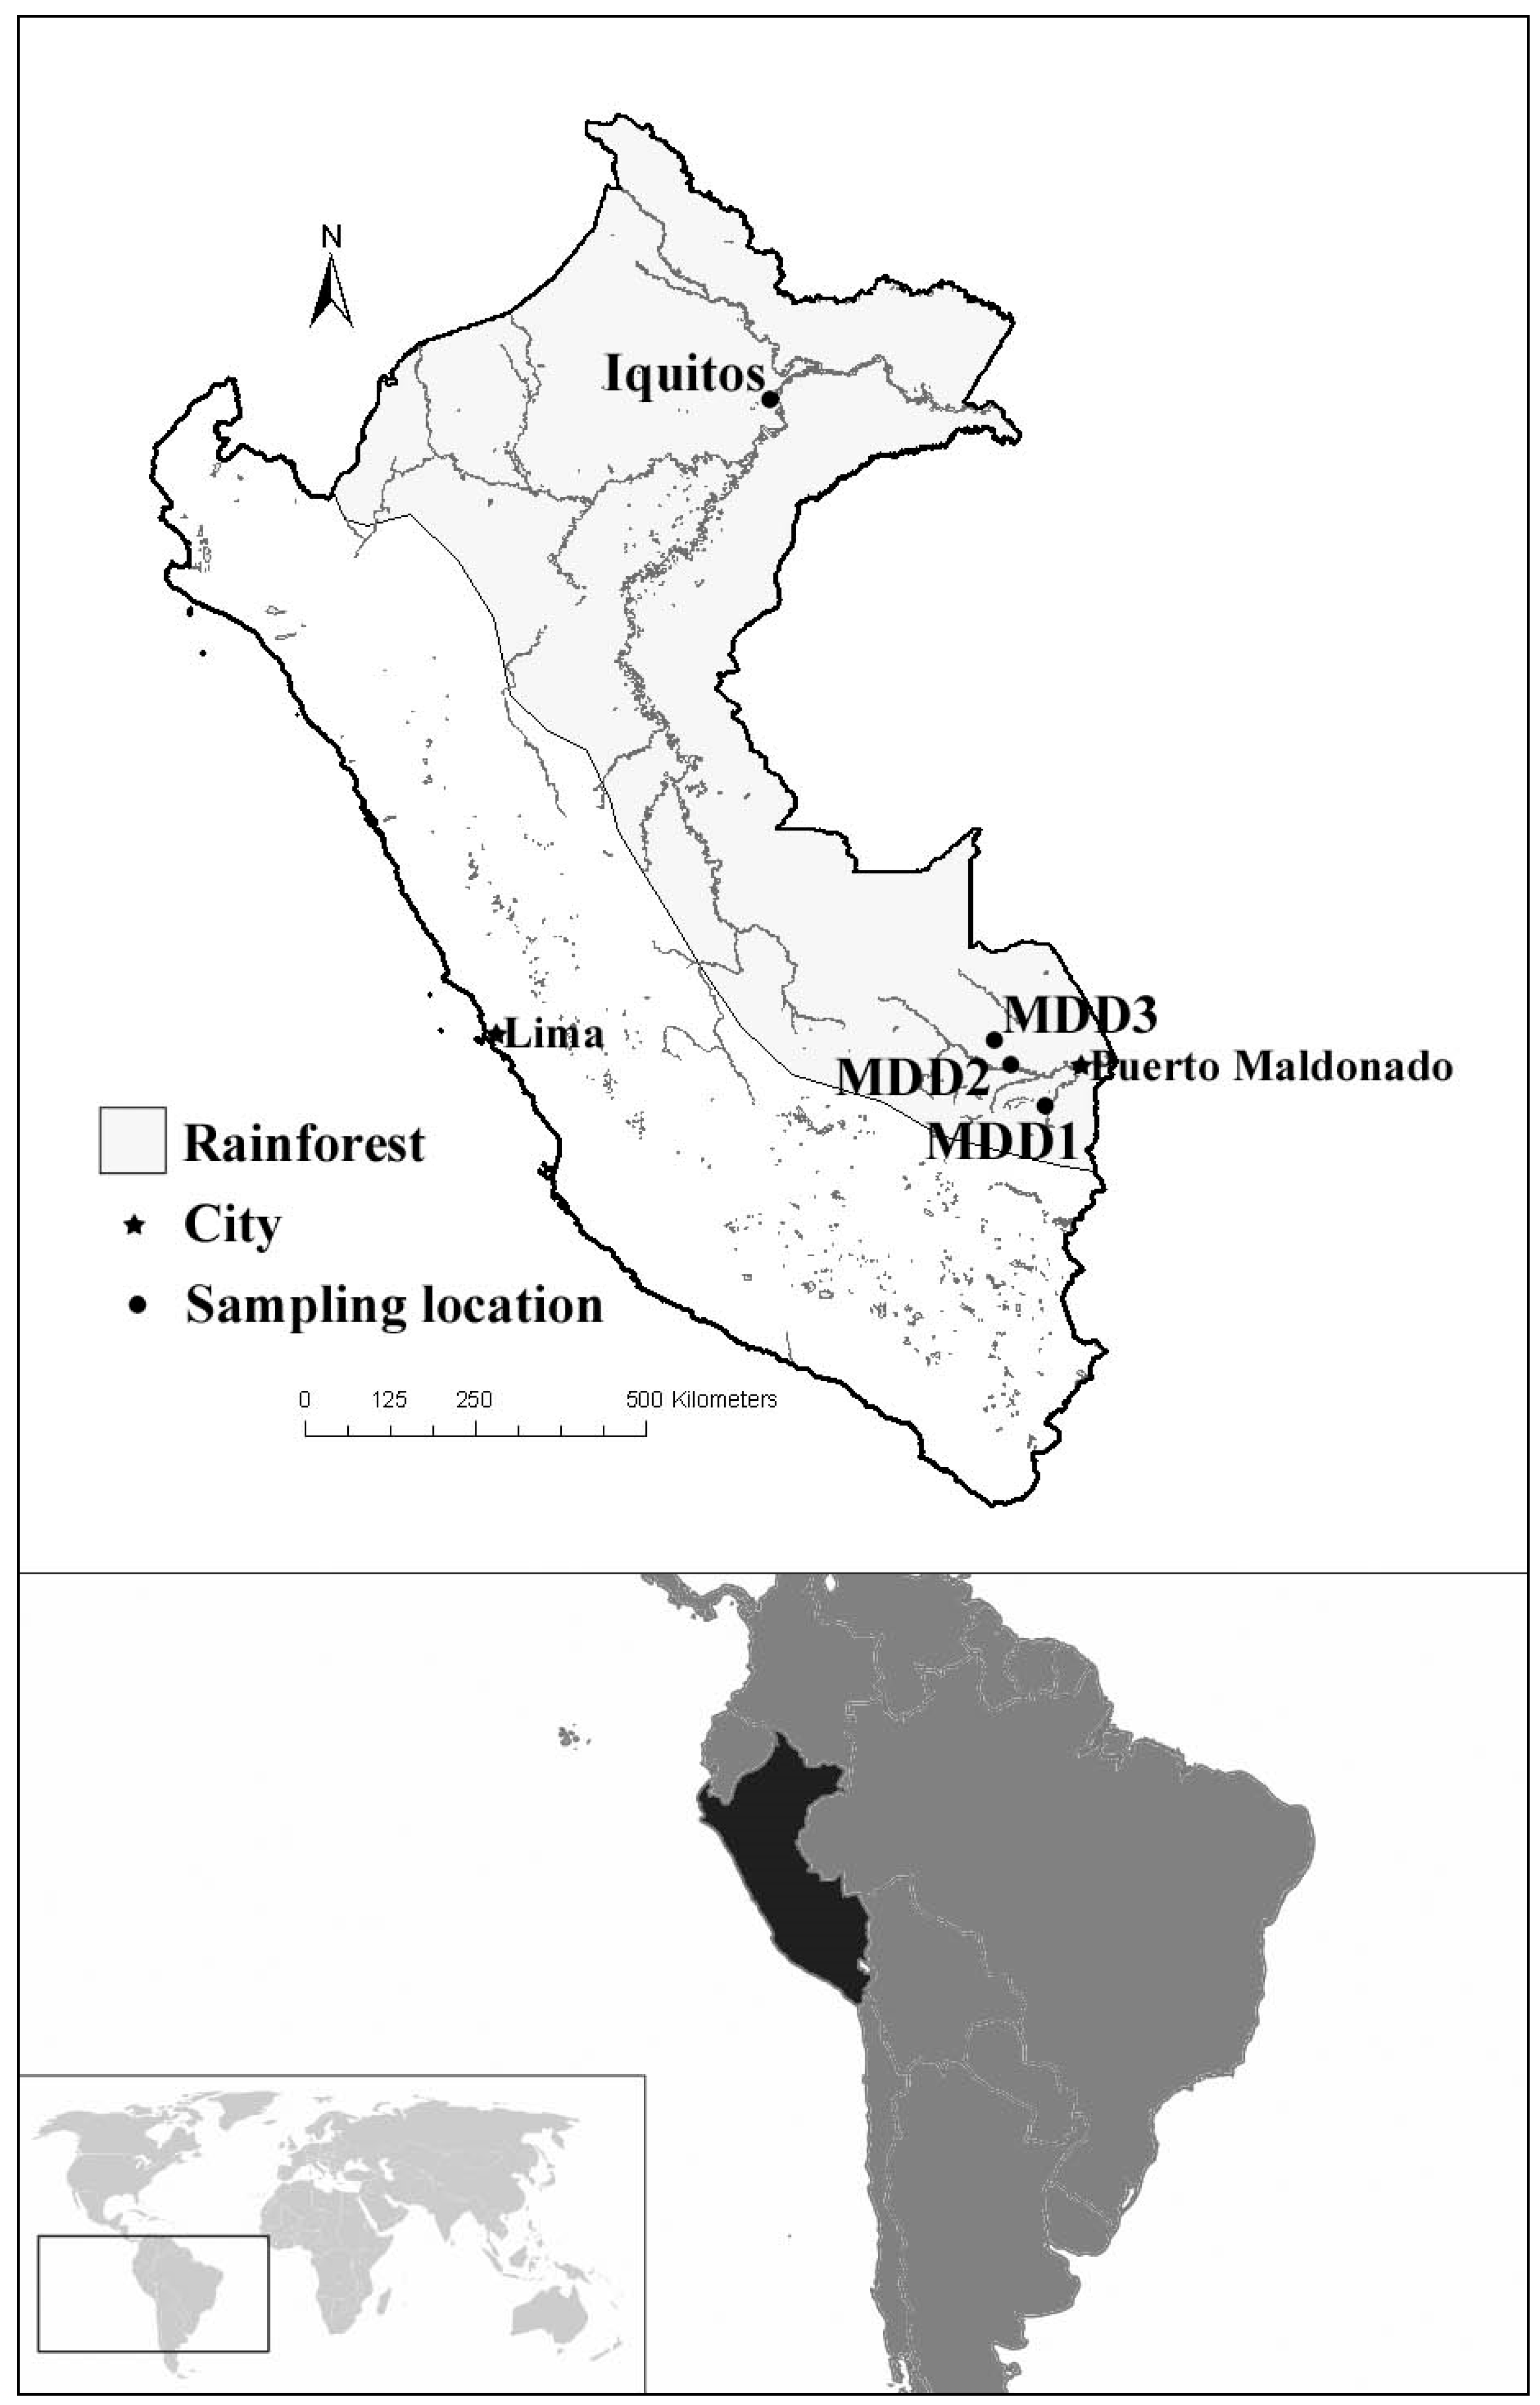
Red-and-green Macaws and Scarlet Macaws were sampled from three to four different areas (Figure 1), including three within the department of Madre de Dios in southeastern Peru: (1) the Colorado clay lick (MDD1, 13 08′ S, 69 37′ W) in the Tambopata National Reserve, (2) the Cocha clay lick (MDD2, 12 33′ S, 70 05′ W) within Los Amigos Conservancy Concession, (3) the Los Amigos macaw clay lick (MDD3, 12 14′ S, 70 19′W) within the Los Amigos Conservancy Concession, and one within the department of Loreto in northeastern Peru, (4) at a marketplace near Iquitos (Iquitos, 03 45′ S, 73 12′ W) between 2004–2006. Distances among sampling locations are shown in Table 1.
Figure 1.
Map of Peru showing the extent of the Amazon rainforest, three cities (Lima, Iquitos, and Puerto Maldonado) as landmarks, and the four sampling locations. The distribution of Red-and-green Macaws and Scarlet Macaws is suggested to be throughout the shaded region, which corresponds to the Amazon rainforest in Peru; however, fine-scale distribution mapping is unavailable. The black shading in the lower panel shows the location of Peru in South America.
Table 1.
Distances (km) between sampling locations across Perú.
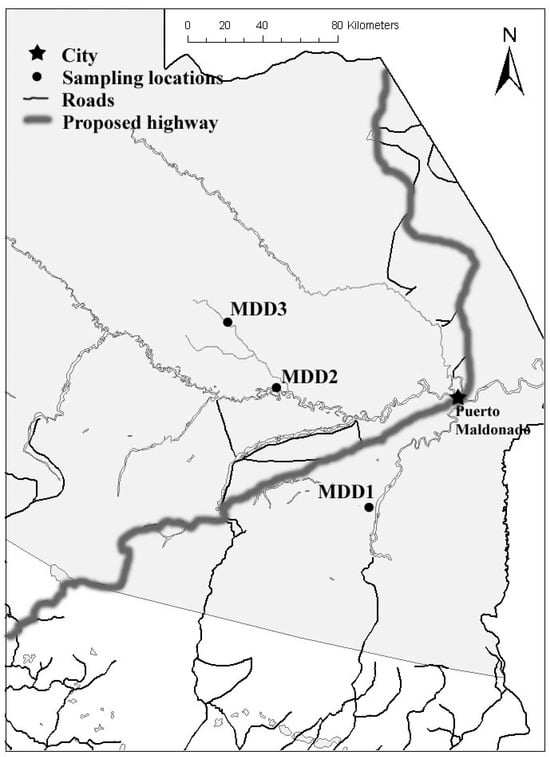
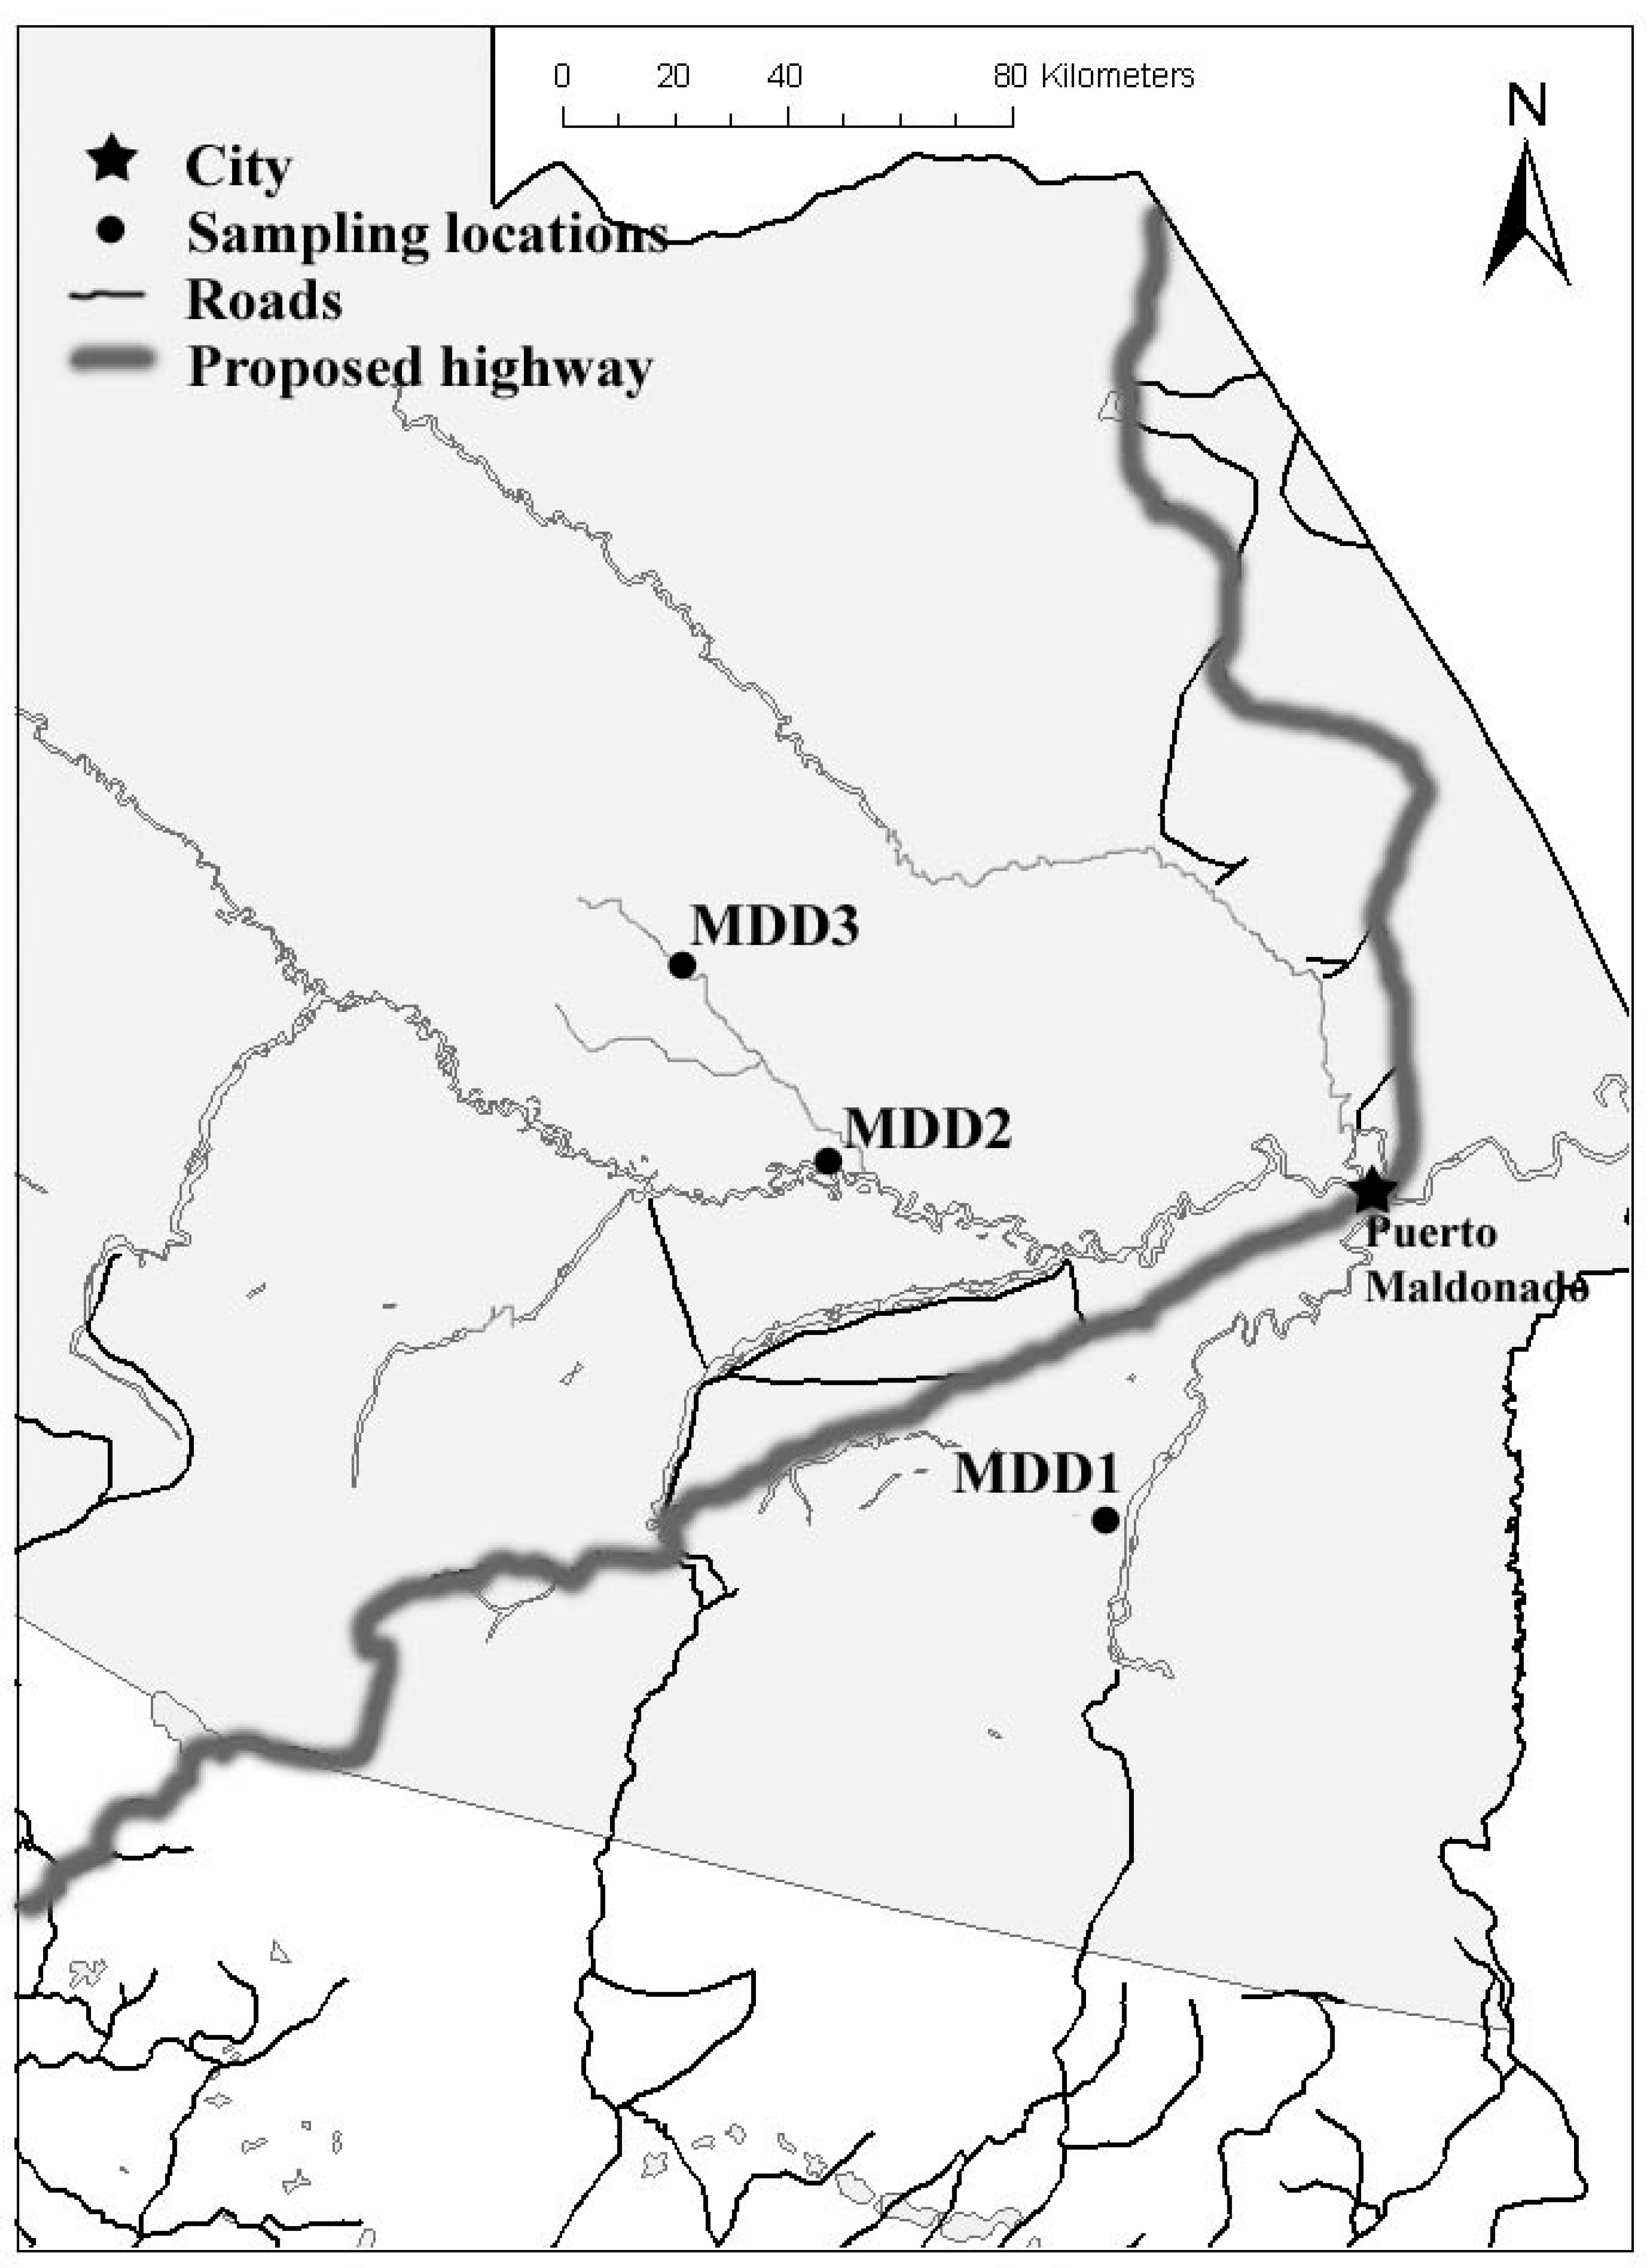
Human densities are low near protected areas in Madre de Dios, and parrot populations are healthy and apparently stable [12]. A major highway bisecting contiguous forest in Madre de Dios and connecting the western Amazon Basin with the Pacific coast was developed after our sample collection (Figure 2). Human densities are also low in the majority of Loreto, however Iquitos is a large city (400,000 people) and parrot populations in the immediate vicinity have been heavily impacted by harvesting for food, feathers, and the pet trade.
Figure 2.
Detailed map of southeastern Peru showing major rivers, roads, the transoceanic highway, and the sampling locations.
2.2. Sampling
Genetic sampling was conducted with Peruvian research permits N°29 C/C-2004-INRENA-IANP, N°032-2005-INRENA-IFFS-DCB, N°009 C/C-2006-INRENA-IANP, N°0071-2006-INRENA-IFFS-DCB, N°036 C/C-2006-INRENA-IANP, N°03 C/C-2007-INRENA-IANP, N°029 C/C-2007-INRENA-IANP, and N°082-2007-INRENA-IFFS-DCB. Because molted feathers from clay licks were previously shown to be cost efficient, useful sources of DNA from parrots [25], we selected to use this non-invasive methodology. Naturally shed feathers were collected from November 2004 through January 2007 at Colorado clay lick (MDD1), from March through June 2005 at Cocha clay lick (MDD2), and during March 2005 at Los Amigos macaw clay lick (MDD3), while additional feathers were plucked from individuals captured at the clay lick at MDD1 and at nests at MDD2. A clay lick is an area of exposed clay, usually along a riverbank, where animals visit to supplement their diet with sodium-rich and toxin absorbing clays [35,36,37]. Feathers were collected from parrots of the Loreto region (Iquitos) by sampling from vendors at marketplaces during August 2007. These feathers were said to have been obtained from birds within 100 km from the marketplace. Collected feathers were stored in coin envelopes with desiccant and later identified to species (Blue-and-yellow Macaw, Ara ararauna; Red-and-green Macaw, A. chloropterus; or Scarlet Macaw, A. macao) by morphological comparisons with specimens at the Museo de Historia Natural in Lima, Peru. Molted primary and secondary wing feathers from Red-and-green Macaw and Scarlet Macaw are almost indistinguishable morphologically so species identification was verified using genetic analysis (see below).
2.3. DNA Extraction
Feathers were imported to the United States for DNA analysis with permits from the United States Department of Agriculture (USDA, 54227) and the Convention on International Trade in Endangered Species (CITES, 06US118378/9 and 07US140441/9). DNA extraction was performed in a laboratory free of concentrated DNA and post-PCR product processing for feathers using the Qiagen DNeasy tissue kit (QIAGEN Inc., Valencia, CA, USA) with slight modifications to the manufacturer’s protocol described in [25]. Negative controls were extracted alongside feathers to monitor for contamination of reagents.
2.4. Microsatellite Genotyping
Primers redesigned for microsatellite loci developed from St. Vincent’s Amazon (Amazona guildingii) [38,39] and Blue-and-yellow Macaw (Ara ararauna) [40] were tested and optimized for their use in Red-and-green Macaw and Scarlet Macaw [41]. The following suite of loci were amplified in three multiplex PCRs described by Gebhardt and Waits [41]: for Red-and-green Macaw and Scarlet Macaw: AgGT17 (A17), AgGT19 (A19), AgGT21 (A21), AgGT32 (A32), AgGT42 (A42), AgGT90 (A90), UnaCT21 (U21), UnaCT32 (U32), UnaCT41 (U41), UnaCT43 (U43), UnaCT55 (U55), and UnaCT74 (U74). All PCR runs included a negative control to monitor for contamination of reagents. PCR products were visualized on an ABI 3130xl Genetic Analyzer (Applied Biosystems, Foster City, CA, USA) and analyzed with the associated GENESCAN 3.1.2 (Applied Biosystems) and GENOTYPER 2.5 (Perkin Elmer, CT, USA) software. Two to six PCR replicates were conducted per sample. For each sample at each locus, PCR was replicated until each recorded allele was identified twice to minimize errors due to allelic dropout and false alleles.
2.5. Mitochondrial DNA Sequencing
Domain I of the mitochondrial control region was amplified and sequenced for Red-and-green Macaw using primers LGlu (5′ GCCCTGAAAARCCATCGTTG) and CR522rb (5′ TGGCCCTGACYTAGGAACCAG) [42] and for Scarlet Macaw using primers LGlu and CR1H573 (5′ CCTGACYTAGGAACCAGAGG, modified from [42]). PCR profiles were the following: six cycles of 95 °C for 45 s, 50 °C for 30 s, 72 °C for 40 s, then 31 cycles of 95 °C for 45 s, 56 °C for 30 s, 72 °C for 40 s, followed by 72 °C for 5 m. Sequenced fragments were separated on an ABI3130xl Genetic Analyzer, analyzed with the associated Sequencing Analysis software, and edited and aligned using Sequencher version 4.5 (Gene Codes Corporation, Ann Arbor, MI, USA). Sequences of unique haplotypes characterized by only one individual were verified by resequencing.
2.6. Species Identification and Individual Identification
The species identification of samples was verified by assigning samples to genetic groups using microsatellite genotypes and mitochondrial sequences. To establish species identification tests and evaluate their reliability, feathers were plucked from 10 known Red-and-green Macaws and 13 known Scarlet Macaws. Program Structure [43] was used to assign both known and unknown feather samples to species using microsatellite data. The parameter set for the test used the admixture model, with correlated allele frequencies and 80,000 MCMC reps after a burnin period of 40,000 generations. K was set to 2 and the STRUCTURE 2.2 software assigned ancestry values to each of the two groups for all samples. A sample was assigned to a group if the ancestry for that group was greater than 90%. For a subset of samples (30%), we also verified species identification by phylogenetic analysis of mitochondrial control region sequences using parsimony settings and a heuristic search in the PAUP* program version 4.0b10 (Sinauer Associates, Inc., Sunderland, MA, USA). Subsequent analyses were conducted on each species separately.
It is important to remove known close relatives and resampled individuals from datasets because their inclusion is pseudoreplication [44] and can cause underestimates of diversity, increased differentiation among sampling locations, and deviations from Hardy–Weinberg and linkage equilibrium. The majority of feathers were sampled from clay licks, and thus were representative of the total population. When more than one bird was captured from a nest, samples were not considered independent, so we removed related individuals and included either only parents or a single member of a family group in our analysis. Samples with identical microsatellite genotypes were identified with the GIMLET program version 1.3.3 [45] and duplicates were removed from the dataset. Potential full sibling and parent–offspring pairs were evaluated using GIMLET version 1.3.3 [45]. The probability of identity (PID) and the probability of identity among siblings (PIDsibs) was calculated in each species for each locus and across all loci to assess the power of the loci for individual identification [46]. PIDsibs is a measure that assesses the likelihood that two siblings would have identical genotypes [46].
2.7. Hardy-Weinberg, Genetic Diversity and Phylogenetic Analysis
We combined samples from all locations and tested microsatellite genotype frequencies for Hardy–Weinberg proportions and linkage equilibrium (GENEPOP version 3.1, [47]). Significance was corrected for multiple comparisons using the sequential method [48]. We quantified diversity for each species at each location by calculating observed and expected heterozygosity (GENEPOP version 3.1) and allelic richness (FSTAT version 2.9.3.2, [49]). Expected heterozygosity is a less biased estimate of diversity than observed heterozygosity when sample sizes are small [50]. Allelic richness is the average number of alleles per locus corrected by the smallest sample size [51,52]. Differences in expected heterozygosity and allelic richness between Red-and-green and Scarlet Macaws were examined using a Wilcoxon rank-sum test [53].
Relationships among mitochondrial haplotypes for each species were visualized with minimum spanning networks assembled by TCS version 1.21 [54]. Haplotypes were coded according to the location from which they were sampled. DnaSP version 4 [55] was used to quantify the total number of variable sites (S), and to calculate haplotype diversity (h) and nucleotide diversity (π) for each species across sampling locations.
2.8. Bayesian Clustering Analysis and Genetic Differentiation
The STRUCTURE 2.2 program [43] was used with the microsatellite data to identify the most likely number of genetic clusters represented by the sampling locations. This program uses a Bayesian Markov chain Monte Carlo (MCMC) approach to assign individuals to a predefined number of clusters (K) and calculate the likelihood or probability of that assignment. Program STRUCTURE was run for 20 replicates at each K = 1 through 6, with a burn-in period of 40,000 replications and 80,000 MCMC replications. Adequacy of replicates and the burn-in period was determined by noting stabilization of alpha and the likelihood results. Two datasets were run for each species: one included all loci, and the other final dataset excluded loci that were difficult to score and those that were out of Hardy–Weinberg equilibrium.
To measure differentiation among sampling locations, we examined pairwise FST, GST’, and significant differences in allele frequency distributions. Pairwise FST [56,57] was calculated from microsatellite loci with less than 10% missing data for each species using program Arlequin 3.0 [58] and tested for significant differences from zero using 10,000 permutations. Because FST (or GST) can reach a maximum less than 1 for highly variable loci, Hedrick [59] suggests correcting values by the maximum possible GST for a locus and then averaging across loci to allow comparison among data with markers of different variabilities. Hedrick’s GST’ statistic was calculated to allow comparison of differentiation indices between the two species of macaw. Differences in allele frequency distributions among sampling locations was tested using GENEPOP version 3.1 [47] with default Markov chain parameters.
Pairwise FST was also computed among sampling locations for conventional F-statistics using mitochondrial haplotype frequencies in program Arlequin 3.0 [58] and tested for differences from zero using 10,000 permutations.
2.9. Effective Population Size
To estimate the effective population size, Θ, the effective population size times the mutation rate per site [60], was estimated for genetic population clusters from mitochondrial control region sequences and from nuclear microsatellite genotypes using the program LAMARC 2.0 [61]. The likelihood method was employed for both types of data. For microsatellite data, the Brownian step mutation model was used with the following Markov chain parameters: number of initial chains = 25, recorded genealogies = 500, sampling increment = 50, trees discarded = 250,000, number of final chains = 5, trees sampled = 15,000, sampling increment = 50, and trees discarded = 250,000. Convergence of Θ estimates was confirmed by independent replicates. For mitochondrial data, default Markov chain parameters were used due to convergence of Θ estimates at default settings. From Θ, we calculated the effective population size of a genetic cluster as Ne = Θ/4μ for microsatellite data and Ne = (2 Nef) = 2(Θ/2μ) for mitochondrial data, assuming that the male and female sex ratios and reproductive outputs are equal. For the estimate of Θ from microsatellite data, we chose μ = 1 × 10⁻³ substitutions/site/generation (ranging from 1 × 10⁻²–1 × 10⁻⁴) from an average mutation rate for human microsatellite loci [62]. This rate was chosen for microsatellites because it represents the best known genome-wide average for microsatellites. The published estimates of microsatellite mutation rate in birds use hypervariable loci that are not representative of most loci used in genetic studies [63,64]. Mutation rates in microsatellites vary widely within an individual, and between species, making an accurate estimate of the mutation rate very difficult [62]. For the estimate of Θ from mitochondrial data, we chose μ = 1.54 × 10⁻⁵ substitutions/site/generation (95% confidence interval 6.8 × 10⁻⁶ to 2.4 × 10⁻⁵) based on the estimate of the mutation rate for the mitochondrial control region hypervariable region I of Adélie penguins [65], corrected for an approximate generation time of 17 years for large macaws [66]. We chose this mutation rate because it was the best estimate for the specific region of the mitochondrion that we sequenced in birds. There is no estimate specifically for that region in macaws, and no other estimates use several ages of fossils for calibration.
To evaluate whether or not our data have experienced recent population expansions or declines, which may affect Ne estimates, we calculated Tajima’s D statistic [67] from mtDNA for each species using program Arlequin and tested significance from zero using 10,000 simulated samples. Tajima’s D statistic is a measure of the difference between θπ, based on nucleotide differences, and θS, based on the number of segregating sites. For a selectively neutral locus, a negative value of Tajima’s D statistic indicates that a population has experienced a recent range expansion, and a positive value indicates recent range restrictions or population declines. It is standard in population genetic studies to assume that the mutations in the majority of the hypervariable region of the mtDNA control region are selectively neutral because the region is non-coding, has a high mutation rate, and is extremely variable within and among species [68].
3. Results
3.1. Species Identification
Out of 204 feathers collected and genotyped, 145 samples yielded genotypes at six–twelve loci. Of those 145 samples, more than 67% of samples had genotypes at 100% of loci (12 for Red-and-green Macaws and 11 for Scarlet Macaws), 28% were missing only one or two loci, 3% were missing three loci and less than 2% of samples were missing genotypes at four or five loci. Because there were only a few missing loci, and missing data is expected from poor quality DNA, we retained samples with data for at least six loci and coded missing data to maximize our samples sizes.
Nuclear microsatellite loci and mitochondrial control region sequences proved sufficient to assign species to molted feather samples. Program Structure [43] correctly assigned samples from plucked feathers of known species to the correct species group 100% of the time. A total of 97% of samples had > 95% ancestry and 100% of samples had >90% ancestry to the species group assigned. Even the few samples with missing data were assigned to a group with high ancestry indicating that loci had high power to differentiate between species. Haplotypes from all control region sequences from samples of each species correctly clustered together. The number of mutational steps between the two species groups was 41, compared to six mutations as the greatest genetic distance separating haplotypes within a species group. Thus, we have a high degree of confidence in the genetic species assignment of each sample, even though morphological species ID was incorrect in approximately 45% of feathers.
3.2. Individual Identification and Missing Data
Three Red-and-green Macaw and four Scarlet Macaw samples collected at clay licks had an identical genotype to another sample. Two family groups that were captured at nests had their relationships verified, and offspring were removed from the dataset. For Red-and-green Macaws, unbiased probability of identity across all microsatellite loci was 6.56 × 10⁻⁸ and for Scarlet Macaws, it was 1.57 × 10⁻¹². The probability of identity among siblings for Red-and-green Macaw was 0.00176, indicating that there was a 1 in 568 chance that duplicate genotypes were actually full siblings. For Scarlet Macaw, PIDsibs was lower at 0.000168. Thus, we had sufficient power to identify individual parrots using these loci. After correction of species identification and removal of duplicate and related individuals, the final dataset consisted of 76 Red-and-green Macaws (31 from MDD1, 18 from MDD2, 34 from MDD3) and 60 Scarlet Macaws (34 from MDD1, seven from MDD2, seven from MDD3, and 12 from Iquitos (Table S4a,b).
Complete genotypes were obtained for the majority of individuals in the final dataset at all 12 loci, with the exception of Scarlet Macaws for whom locus U55 did not amplify. Missing data at microsatellite loci were expected because loci were developed for other species and DNA from molted feathers is of low quality. For most loci missing data comprised less than 3% of the dataset, with many loci having no missing data. At locus U21 for Red-and-green Macaws missing data was 8%. For loci A42 and A90, the proportion of missing genotypes was high at 15% and 16% for Scarlet Macaws and 25% and 35% for Red-and-green Macaws.
3.3. Hardy-Weinberg and Linkage Equilibrium
For Red-and-green Macaws, genotypes at all loci were in Hardy–Weinberg proportions, but locus A17 was not polymorphic and locus A42 was difficult to score, with many alleles not following the typical 2 base pair mutation pattern for dinucleotide repeats (Table S1). Locus A42 from removed from additional analyses. For Scarlet Macaws, genotypes at locus A42 and U32 were not in Hardy–Weinberg proportions, with locus A42 also being difficult to score with atypical allele patterns (Table S1). Both were removed from additional analyses. Tests for the loci used in this study showed linkage disequilibrium between A17–U74 for Scarlet Macaw. Tests by population indicated that this pair was in linkage disequilibrium only at MDD1, and tests for the remaining three populations were not significant (Table S2); thus. these loci were included in subsequent analyses.
3.4. Nuclear DNA Genetic Diversity
Observed heterozygosity values for individual microsatellite loci for Red-and-green Macaw ranged from 0.00 (loci A17 and A32) to 0.87 (loci A19 and U21, Table S4a). Observed heterozygosity values for Scarlet Macaw ranged from 0.33 (A90 and U41) to 1.00 (U21 and U74, Table S4b). Allelic richness was standardized to a minimum sample size of six individuals, and for Red-and-green Macaw ranged from 1.0 allele for the monomorphic locus A17 to 6.9 alleles for the atypically polymorphic locus A42. For Scarlet macaws, all amplified loci were polymorphic, and allelic richness ranged from 2.8 alleles for locus A32 to 8.4 alleles for locus U21.
Diversity measures averaged across all microsatellite loci did not include locus A17 for Red-and-green Macaw because that locus was monomorphic. Expected heterozygosity values averaged across all loci for Red-and-green Macaw ranged from 0.53 at MDD2 to 0.60 at MDD3, and average allelic richness ranged from 3.6 to 4.2 alleles/locus (Table S1). For Scarlet Macaw, average expected heterozygosity ranged from 0.73 at MDD3 to 0.82 at Iquitos, and average allelic richness ranged from 5.2 to 6.2 alleles/locus (Table S1). Allelic richness was significantly higher for Scarlet Macaws than for Red-and-green Macaws (p = 0.0256), but expected heterozygosity differences were only marginally significant (p = 0.0762).
3.5. Mitochondrial DNA Haplotypes and Diversity
A mtDNA sequence of 381 bp was obtained for a total of 23 Red-and-green Macaws from MDD1, 13 Scarlet Macaws from MDD1, and nine Scarlet Macaws from Iquitos (Table 2). We also obtained sequences with one to 26 base pairs of ambiguous data (two different nucleotides at a single position) for additional Scarlet Macaws from MDD1 (n = 8) and Iquitos (n = 1), but these individuals were not included in our analysis.
Table 2.
Diversity measures for Red-and-green Macaw and Scarlet Macaw estimated from 381 bp of the mitochondrial control region domain I. N is number of individuals sequenced, S is number of variable sites, NH is number of haplotypes, π is nucleotide diversity, and h is haplotype diversity.
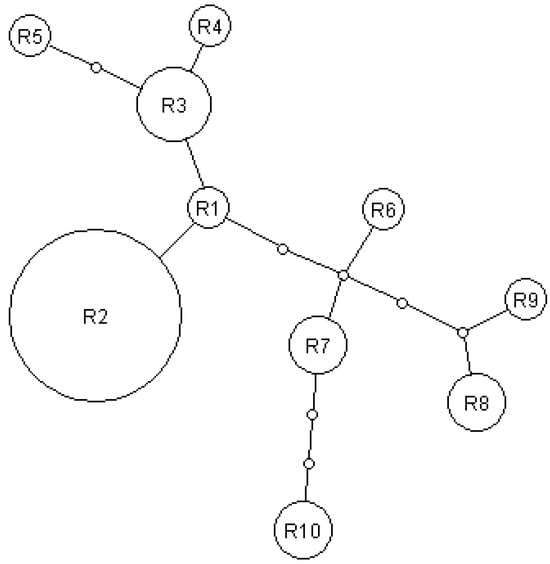
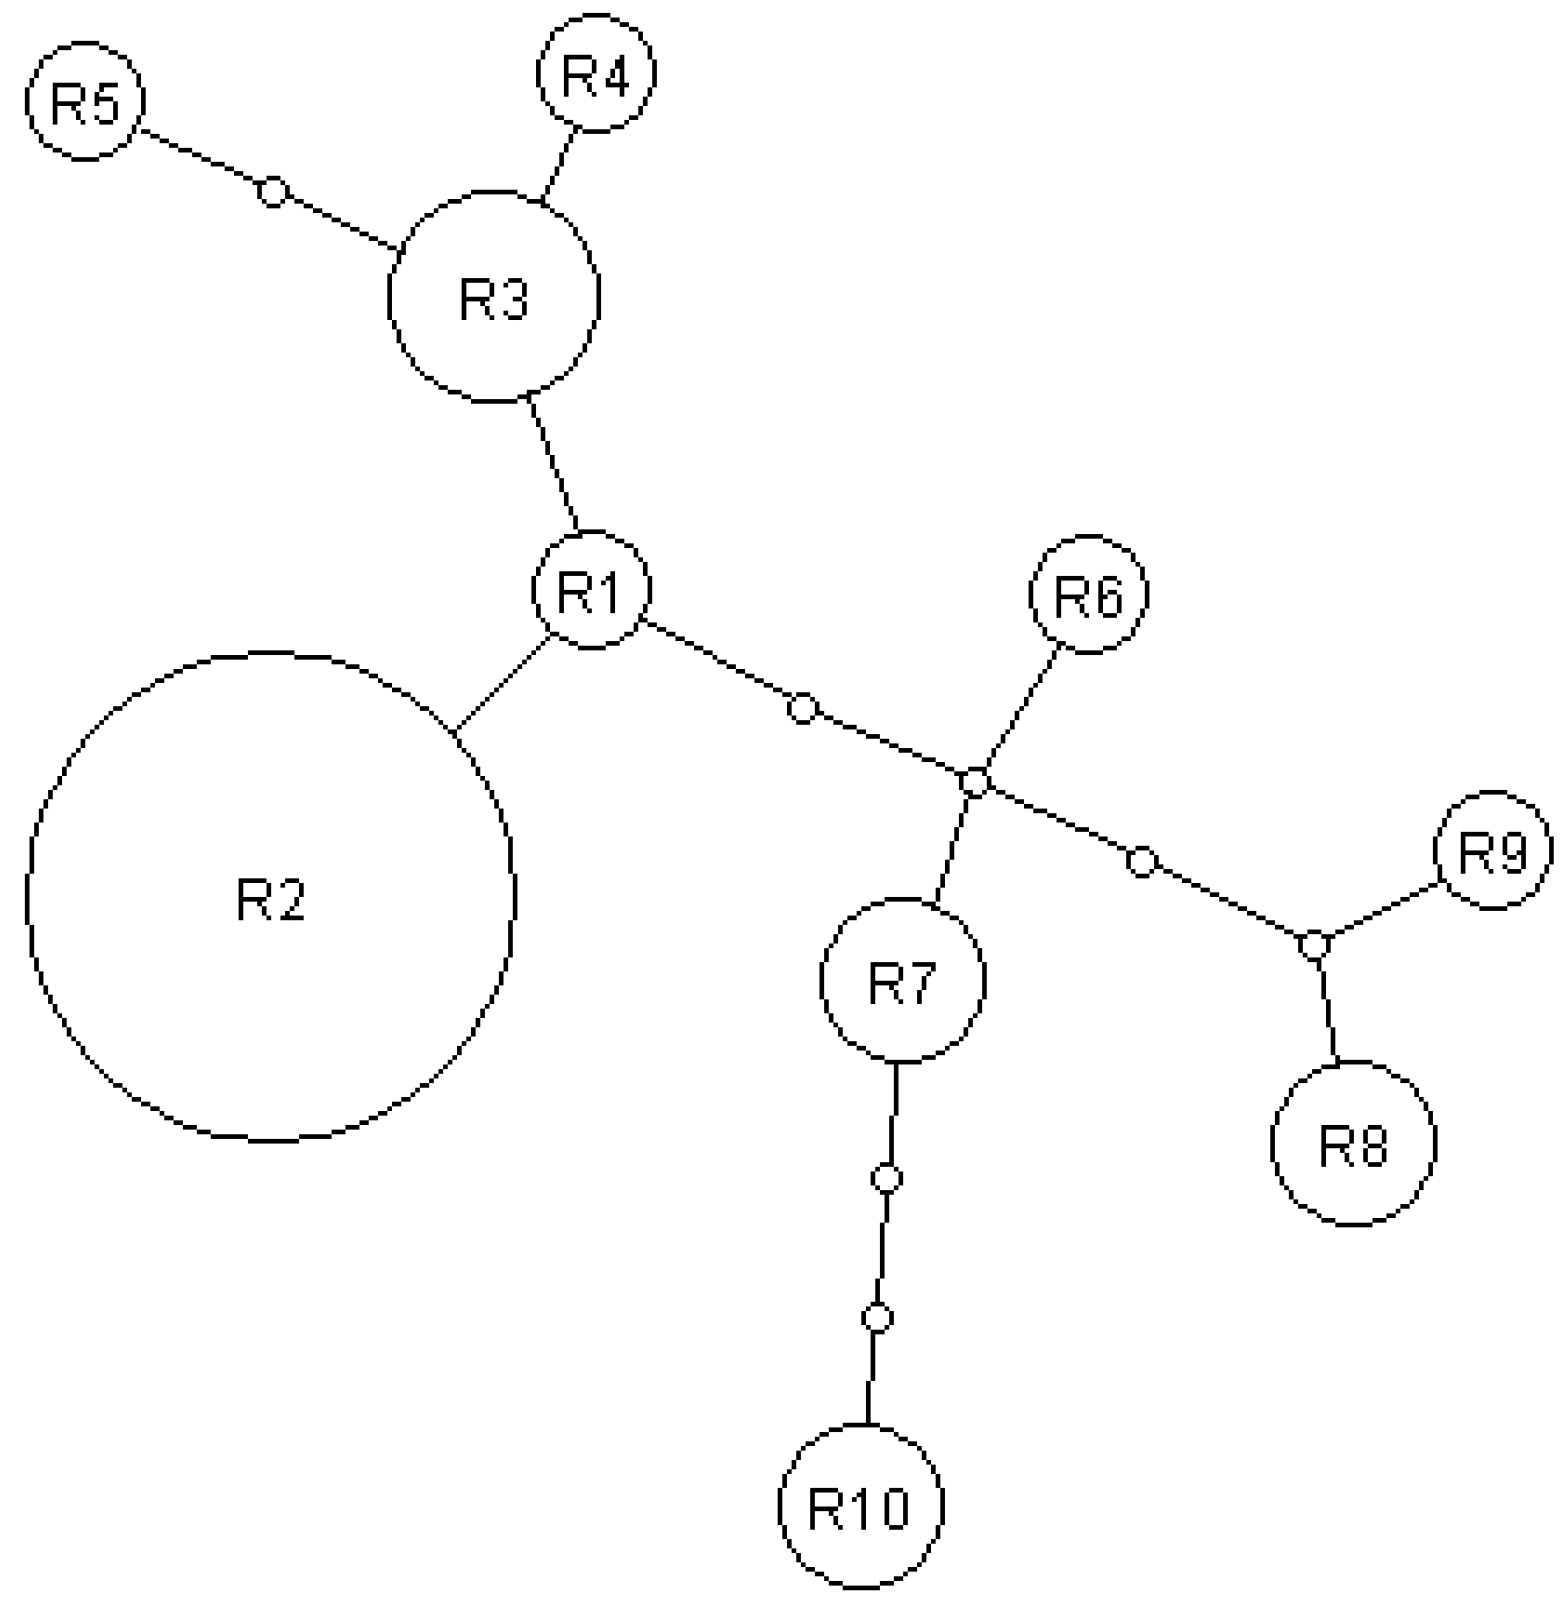
For Red-and-green Macaws sampled at MDD1, 10 haplotypes were detected (Figure 3). Among these haplotypes there were 14 variable sites: 13 were transitions and one was a 1-bp deletion (Table 2). Haplotype diversity was relatively high (0.834) and nucleotide diversity was low (0.00944, Table 2).
Figure 3.
Minimum spanning network showing mutational relationships among mtDNA haplotypes generated by TCS for Red-and-green Macaw sampled at MDD1 (white). The size of a circle corresponds to the frequency of that haplotype in the sample; the smallest circle represents one haplotype and the largest circle represents nine haplotypes. Nodes represent unsampled haplotypes or number of base-pair changes between sampled haplotypes. R1–R10 represent haplotypes 1–10.
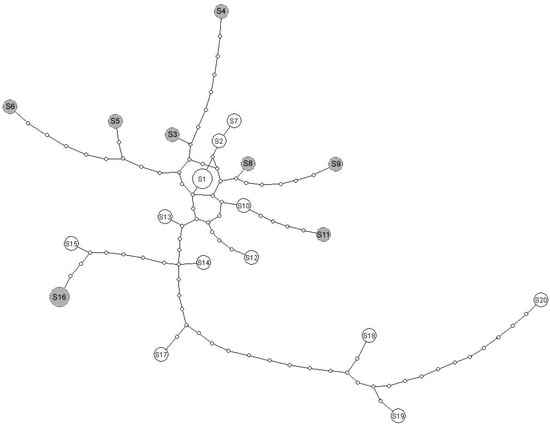
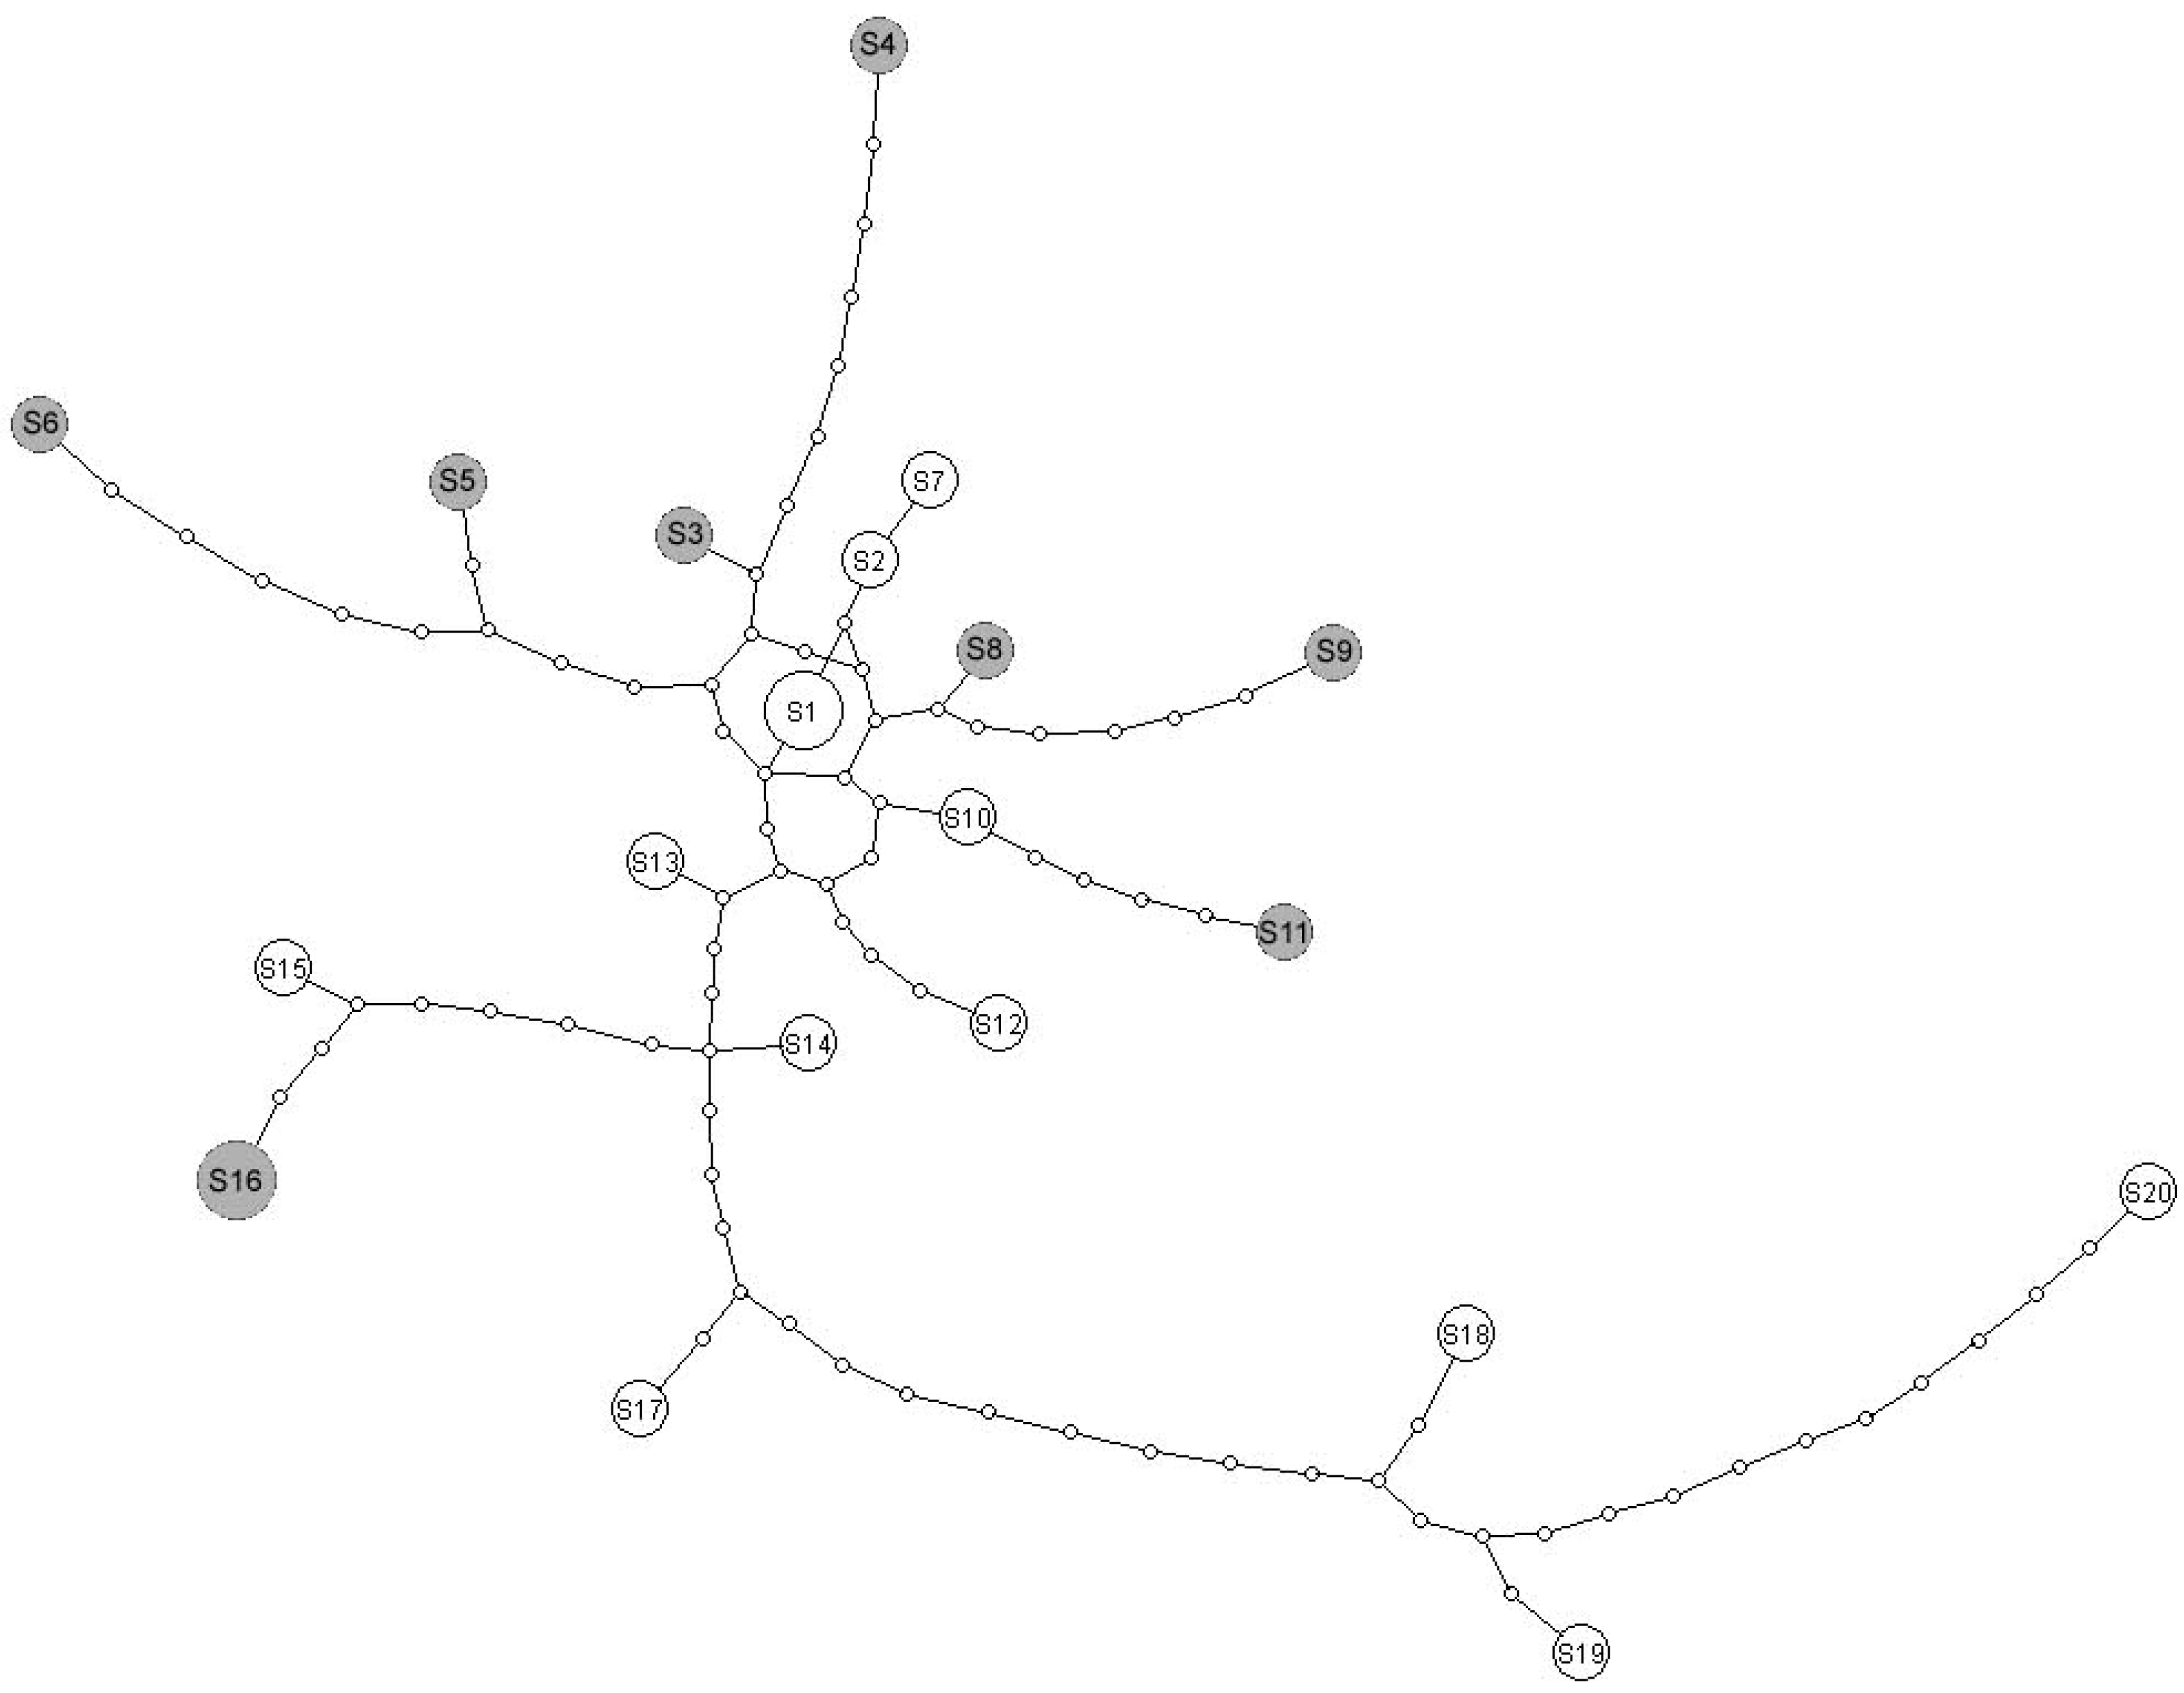
For Scarlet Macaws sampled at MDD1, 12 haplotypes were detected (Figure 4). Among these haplotypes there were 39 variable sites: 37 were transitions and three were transversions (Table 2). Both haplotype and nucleotide diversity were high (0.987, 0.02961). Among the eight haplotypes detected at Iquitos there were 35 variable sites: 34 were transitions and one was a transversion. Haplotype diversity and nucleotide diversity were also high (0.972, 0.03062). While diversity measures were similar for Scarlet Macaws at Iquitos and MDD1, there were no haplotypes shared between locations; thus, a total of 20 haplotypes were observed among 22 individuals (Table 2).
Figure 4.
Minimum spanning network showing mutational relationships among mtDNA haplotypes generated by TCS for Scarlet Macaws sampled at MDD1 (white) and Iquitos (grey). The size of a circle corresponds to the frequency of that haplotype in the sample; the smallest circle represents one haplotype and the largest circle represents two haplotypes. Nodes represent unsampled haplotypes or number of base-pair changes between sampled haplotypes. S1–S20 represent haplotypes 1–20.
3.6. Bayesian Clustering Analysis
Conclusions using Bayesian clustering analyses were consistent between the dataset including all loci and the dataset excluding problem loci, so the results reported here are for the final dataset excluding problem loci. Using results from STRUCTURE, we cannot reject the hypothesis that samples of Red-and-green Macaw from MDD1, MDD2, and MDD3 all belong to a single genetic group. The highest log likelihood value from Structure was for K = 1 (Table S5).
For Scarlet Macaws sampled from MDD1, MDD2, MDD3, and Iquitos, the highest log likelihood value from STRUCTURE analyses occurred at K = 1 (Table S5). Given this result, and the results of differentiation among sampling locations (see below), we conclude that there is little support for the hypothesis that K is greater than 1. Thus, all Scarlet Macaws sampled in this region of Peru belong to one genetic group (Table S2).
3.7. Differentiation Among Sampling Locations
Pairwise nDNA FST values for Red-and-green Macaws were very low (0-0.006) and not significantly different from zero (Table 3). Pairwise GST’ values were also very low and ranged from 0.04020 to 0.05630 (Table 4). Significant differences from zero were not tested for GST’ but are provided as a differentiation measure corrected for variability of the loci to allow a comparison to Scarlet Macaw.
Table 3.
Pairwise FST among sampling locations for Red-and-green Macaw estimated from nine microsatellite loci using Arlequin are shown in the lower left of the table. Results of permutation tests are in the upper right of the table and show that FST values between locations were not significantly different from zero.
Table 4.
Pairwise GST’ between sampling locations for Red-and-green Macaw are in the lower left of the table calculated after Hedrick [59] showing GST values corrected by the maximum GST possible based on the variability of the loci. Number of loci out of 10 with significantly different allele frequency distributions between locations are in the upper right.
Allele frequency distributions were significantly different among sampling locations for one locus between MDD1/MDD2, one locus between MDD2/MDD3, and three loci between MDD1/MDD3 out of the 10 loci tested (Table 4). No particular locus seemed to be driving differentiation patterns.
Pairwise nDNA FST among the four sampling locations for Scarlet Macaw ranged from 0.00638 to 0.01922 (Table 5). Only FST between MDD1 and Iquitos was significantly different from zero (p = 0.01327). Pairwise FST calculated from control region mitochondrial haplotype frequencies between Scarlet Macaws sampled from MDD1 and Iquitos was not significantly different from zero (FST = 0.02001, p = 0.14078) even though no haplotypes were shared between locations. Pairwise GST’ for Scarlet Macaw was higher than Red-and-green Macaw and ranged from 0.16779 to 0.29333 (Table 6).
Table 5.
Pairwise FST among sampling locations for Scarlet Macaw estimated from eight microsatellite loci using Arlequin are shown in the lower left of the table. Results of permutation tests are in the upper right of the table and show that FST among locations was significantly different from zero only between MDD1 and Iquitos (*).
Table 6.
Pairwise GST’ between sampling locations for Scarlet Macaw are in the lower left of the table calculated after Hedrick [59] showing GST values corrected by the maximum GST possible based on the variability of the loci. Number of loci out of nine with significantly different allele frequency distributions between locations are in the upper right.
Allele frequency distributions were significantly different among sampling locations for less than 50% of loci for most comparisons between locations (Table 6). Loci A17 and A19 had three comparisons and locus A90 had four comparisons significantly different among the six comparisons between locations, indicating that several loci may be driving the differentiation pattern.
3.8. Effective Population Size
Although STRUCTURE and F-statistics suggest that Scarlet Macaws throughout sampled areas in Peru belong to one genetic group, slight differentiation in allele frequencies and FST between MDD1 and Iquitos suggest that there may be very weak population structure across the study area. Because of these results, Θ was calculated from several different combinations of locations to understand how including or excluding sampling locations would influence estimates. For Red-and-green Macaw, the mtDNA Θ estimate at MDD1 ranged from 0.0068 to 0.0266 with an effective population size estimate ranging from 442 to 1727 for the median mutation rate (Table 7). Θ estimates from microsatellite data at MDD1 and across all sampling locations ranged between 3.2258 and 6.9741, with an effective population size ranging from 806 to 1744 using the median mutation rate. For Scarlet Macaw mtDNA data at MDD1 and MDD1/Iquitos, Θ ranged from 0.0409 to 0.2496 and the effective population size ranged from 2656 to 16,208. Θ estimates from microsatellite data for Scarlet Macaws at MDD1 and across all sampling locations ranged from 14.658 to 23.6215, and effective population size ranged from 3665 to 5905 (Table 7).
Table 7.
Θ point estimates and corresponding 95% confidence intervals were estimated from the Lamarc program for Red-and-green Macaw and Scarlet Macaw using mtDNA and nuclear microsatellite data. Corresponding effective population size estimates were calculated from 95% confidence intervals of Θ using low, median, and high estimates of mutation rates for avian mtDNA control region ranging from 6.8 × 10⁻⁶ to 2.4 × 10⁻⁵ and human nuclear microsatellite mutation rates ranging from 1 × 10⁻² to 1 × 10⁻⁴. The point estimate of Θ and the estimates of Ne calculated from the median mutation rate are in bold font.
4. Discussion
Our results indicate that genetic diversity levels are high for Scarlet Macaws and Red-and-green Macaws in this landscape and that gene flow is occurring over a very large spatial scale, especially for the Scarlet Macaws. More sampling is needed to fully assess the scale of gene flow for the Red-and-green Macaws. The genetic diversity and population structure observed for these species provides baseline data to compare to populations in disturbed systems, and also to monitor for impacts of current and future change in this landscape, such as the newly developed road (Figure 1). Our data show that conservation planning for the Amazon with respect to these macaws needs to focus on maintaining connectivity across thousands of kilometers to support their population dynamics.
4.1. Genetic Diversity
Genetic diversity levels are high for both species of macaw, and expected heterozygosities and allelic richness are similar among all sampling locations for each species. Diversity levels for Scarlet Macaw were substantially higher than Red-and-green Macaw for both nDNA and mtDNA loci (Table S4a,b). These differences in diversity between the two species could be due to stochastic differences in evolution for individual loci, differing genetic distances for each macaw from the original species the loci were developed for, or differing life history for the two species. Below we evaluate the support for each of these hypotheses.
The diversity at a locus inherited from a common ancestor is subject to stochastic evolutionary events that randomly cause increases or decreases in the diversity present at any given time [69]. If this were the cause for differences in average diversity between Red-and-green Macaw and Scarlet Macaw, we would expect that across multiple loci, disparity in diversity levels between species would exhibit a random pattern. However, at the 11 loci that amplified for both species, nine loci had higher allelic richness for Scarlet Macaws. This would happen at random with a probability less than 0.002; thus, there is little support for the hypothesis that differences are due to a stochastic evolutionary event.
The microsatellite loci used in this study were originally developed for other species of parrot. Primmer et al. [69] found that locus polymorphism decreased with increasing genetic distance from the species loci were described in. According to this hypothesis, diversity at a locus would be lower for the loci developed from Amazona guildingii than from Ara ararauna, and differences between species would correspond to genetic distances from the species of origin. Although exact evolutionary relationships are unknown, the genetic distance between Ara and Amazona is much larger than it is between the species within Ara, and the three large macaws are very closely related. Genetic diversity among loci is not consistently lower for Amazona guildingii loci. Additionally, five out of six Amazona loci and four out of five Ara loci have lower diversity for Red-and-green Macaw. The pattern is consistent among loci developed from different species, so there is little support for the hypothesis that diversity levels observed are driven by differing genetic distance among species. Thus we conclude that differing life histories such as different historic or current effective population sizes, movement patterns and levels of gene flow for the two species of parrot have led to the differences in diversity levels observed. This conclusion is supported by higher levels of diversity observed in the mitochondrial control region (Table 2). Also, previous studies of macaws in this region have shown that Scarlet Macaws have larger home range sizes than Red-and-green Macaws [4,5].
Previous studies of Scarlet and Red-and-green Macaw genetic diversity in this region using nDNA microsatellite loci also found high levels of genetic diversity [26,27,32]. Nader et al. [15] examined genetic diversity of confiscated birds for reintroduction projects in isolated populations of Scarlet Macaws in Costa Rica using DNA fingerprinting of tandem microsatellite repeats. Our studies are not directly comparable because we use different molecular markers and diversity quantification measures, but Nader et al. [15] also described high genetic diversity remaining in Scarlet Macaws in Costa Rica, even though confiscated birds originated from isolated populations. Another study of this Costa Rican Scarlet Macaw population using microsatellite loci found high levels of diversity similar to this study [28].
Caparroz [40] used six microsatellite markers and sequences from the mitochondrial control region to describe genetic diversity and population structure for Blue-and-yellow Macaws (Ara ararauna) in Brazil. Blue-and-yellow Macaw is similar in size and phylogenetic relationship to Red-and-green Macaw and Scarlet Macaw, and is also distributed throughout the Amazon Basin and the rainforest in Peru. Expected heterozygosities for the five loci in common among the species in our studies ranged from 0.60 to 0.77 across five locations, similar to values for Red-and-green Macaws (0.72) but lower than Scarlet Macaws (0.83) in Peru. Likewise, Brazilian Blue-and-yellow Macaw nucleotide diversity (0.01534) and haplotype diversity (0.912) measured for 381bp of the control region domain I fell between the values found for Peruvian Scarlet Macaw and Red-and-green Macaw.
4.2. Population Structure
Bayesian clustering analysis, FST and allele frequency differentiation indicates that each species belongs to one panmictic genetic group within the area sampled. While all tests indicated that there is no significant differentiation among locations where both species were sampled (MDD1, MDD3, and MDD2) a closer examination of FST and GST’ values can give some insight into the movement capabilities of these two macaw species. FST values between most sampling locations for Scarlet Macaw were close to an order of magnitude higher than for Red-and-green Macaws (Table 3 and Table 5). Even when correcting for differences in diversity using GST’ [59], Scarlet Macaws were more differentiated across sampling locations than were Red-and-green Macaws. Differentiation according to FST values is an indirect measure of gene flow between two sampling locations, and the inferred gene flow is a function of the effective population size and the migration rate between the two populations [70,71]. Thus, our results suggest that gene flow is more restricted among Scarlet Macaw than Red-and-green Macaw which is interesting since the home ranges of Scarlet Macaws during the non-breeding season are approximately two times the size of Red-and-Green Macaw home ranges [4]. However, home ranges in the breeding season were approximately equal [4].
To detect population genetic structure across a landscape, the scale of sampling needs to reflect the processes influencing structure. When there is a lack of baseline data, it is difficult to identify the proper scale of sampling, and our results indicate that the scale of population substructure in Scarlet Macaws in intact rainforest may be greater than the 1000 km spanned in our sampling. This is likely to also be the case for Red-and-green Macaws since sampling within Madre de Dios showed even less structure than for Scarlet Macaws. Thus, future studies need to expand sampling beyond Peru. We expect the genetic structure of macaws to be driven by isolation by distance because there are few suspected barriers to these highly vagile species within intact forest. Olah et al. [29] conducted a landscape genetic study of scarlet macaws in this landscape, and also found very little evidence for population structure with the exception of one population from an intermountain valley of the Andes (Fst = 0.008) located 20–60 km away. Landscape resistance models indicated that genetic distance between individuals was significantly positively associated with elevation and geographic distance. Also, mtDNA sequencing of two different subspecies of Scarlet Macaws has revealed strong phylogeographic structuring which may be linked to fragmentation by mountain ranges [34].
For Red-and-green Macaw we were only able to sample individuals from three locations all within 125 km. The lack of differentiation among these locations indicates that the sampling scale is too small to determine the processes that may drive differentiation. Another genetic study of red-and-green macaws over a similar spatial scale in this landscape also found no genetic differentiation [27]. We were able to sample Scarlet Macaw from Iquitos about 1000 km from the locations in Madre de Dios. Lack of significant differentiation among locations within Madre de Dios, with significant differentiation according to pairwise FST between the two farthest locations (MDD1 and Iquitos), might suggest that isolation by distance is the process operating in this system. However, we cannot test this statistically because we have too few sampling locations.
4.3. Effective Population Size Estimates
The wide ranges in uncertainty of effective population size estimates are associated with the mutation rate for our data rather than uncertainty in estimates of Θ. 95% confidence intervals around Θ were relatively narrow compared to the range of accepted mutation rate. The mutation rate for microsatellite loci varied by two orders of magnitude compared to only 0.5 orders of magnitude for the mtDNA control region and thus Ne estimates had a wider range when calculated from nDNA.
For both mtDNA and nDNA, Ne estimates were consistently higher for Scarlet Macaw than for Red-and-green Macaw regardless of which locations are considered. This disparity in Ne estimates between the two species may reflect important current differences in Ne. Alternatively, differences in the estimated Ne could be affected by other factors. If we assume that the mutation rate is constant between the two species, three additional factors could influence Ne estimates: (1) adequacy of sampling, (2) differing immigration rates, and (3) recent population growth or decline [72].
If sampling was not adequate to represent the diversity of the population, increasing sampling at a location would increase the Ne estimate. Adequacy of sampling for mitochondrial data can be evaluated by examining the accumulation curves for haplotypes detected as sampling increases. The accumulation curve for Scarlet Macaw mtDNA haplotypes at the present sampling intensity at MDD1 has not reached a plateau, whereas a plateau has been reached in the Red-and-green Macaw haplotype accumulation curve. Increasing the sampling intensity for Red-and-green Macaws would likely not increase the Θ estimate at a given location, whereas increasing sampling for Scarlet Macaws would increase the estimates of Θ and thus Ne. Thus, potential inadequacy in our sampling may have underestimated the actual difference between Ne of Scarlet Macaw and Red-and-green Macaw for mtDNA.
Immigration can cause inflated estimates of Θ, and if not detected will cause an overestimate of effective population size. To get an accurate estimate of Θ, populations should be stable and closed to migration. Populations in Peru are not ideal for Θ estimation because they experience high levels of gene flow. According to FST and GST calculations, Red-and-green Macaws have higher gene flow levels than Scarlet Macaws; thus, the estimated Ne for Red-and-green Macaw could be inflated compared to the estimate for Scarlet Macaw.
Θ estimates can also be influenced by different population histories of macaws, such as recent bottlenecks or range expansions. Tajima’s D, a test of selective neutrality, is sensitive to population growth or declines [67]. Assuming that variation in the mitochondrial control region is selectively neutral, Tajima’s D statistic can be used to assess recent changes in population size that have not yet returned to equilibrium. Tajima’s D for both species of macaw was negative (−0.1617 and −0.454 for Red-and-green Macaw and Scarlet Macaw, respectively), but not significantly different from zero (p = 0.456 and 0.275). Thus, we cannot reject the null hypothesis of no recent changes in population size in either species. Thus, after evaluating all the factors that could explain differences in Ne among species, we conclude that Red-and-green Macaws have a smaller effective population size than do Scarlet Macaws in regions sampled within Peru.
At locations where the comparison was possible, confidence intervals for Ne calculated from mtDNA and nDNA did not overlap for Scarlet Macaws, but did overlap well for Red-and-green Macaws. The differences among mtDNA effective population size and nDNA effective population size for Scarlet Macaws could be due to three factors: (1) inaccurate mutation rate for the markers used, (2) assumptions about mating systems, and (3) sex-biased dispersal.
Estimates of effective population size directly depend on the mutation rate when calculating from Θ, and can vary by orders of magnitude depending on the rate chosen. We chose to use the estimate for the mtDNA hypervariable region I of Adelie penguins [65] because this is the best estimate available for this specific region in birds. The authors calibrated their mutation rate estimate with fossils of several different ages dating back to 7000 years before present. Mutation rates for microsatellite loci have been reported to vary more dramatically [62]. The mutation rates for human microsatellite loci were used because published studies for microsatellite mutation in birds are based on observations of mutations in pedigrees and are biased toward hypervariable loci [63,69]. Mutation rates for these loci are at the higher edge of rates used in this study. Our choice to use the lower mutation rate from human microsatellite loci means that the Ne for nDNA could be inflated. Thus, the disparity between the Ne calculated from mtDNA versus nDNA is likely not due to poor choice of mutation rates for different loci.
Mating systems can affect the Ne calculated from markers with different inheritance patterns. The effective population size estimated from mitochondrial data is for females (Nef) while the estimate from nuclear data is for the total population (Ne). We assumed that the sex-ratio among breeders in the population is equal (Nef = Nem) so that the Ne from mitochondrial data is simply 2Nef. This is likely to be a valid assumption because macaws are socially monogamous, and this has been validated genetically for two species including Scarlet Macaws [73].
Sex-biased dispersal (increased migration for one sex) can cause disparate Ne and FST values for markers with different inheritance patterns due inflation by migration [74]. Caparroz [75] concluded that Blue-and-yellow Macaws exhibit male-biased dispersal because FST values significantly different from zero were observed among sampling locations for mtDNA but not for nDNA. For Scarlet Macaw, we found higher values of Ne for mtDNA (female-mediated gene flow) than for nDNA (average gene flow across both sexes), and between MDD1 and Iquitos, FST values significantly different from zero were observed for nDNA but not for mtDNA. These results suggest that gene-flow may be female-biased. If there is female-biased dispersal for macaws, FST values among males across the sampling areas should be higher than among females. We examined FST among the sexes between sampling locations for both Red-and-green Macaw and Scarlet Macaw (FSTAT [49]). For Red-and-green Macaw, FST among females was −0.003 (95% CI −0.015 to 0.011) and among males was 0.013 (95% CI −0.008 to 0.043). For Scarlet Macaw, FST among females was 0.011 (95%CI −0.008 to 0.028) and among males was 0.026 (95%CI −0.013 to 0.069). While none of the FST values were significantly different from zero, there was a trend for higher FST values among males for both species suggesting female-biased dispersal. Female-biased dispersal could occur if females disperse before pair-bonding with a mate. After males and females form pair bonds, pairs travel together when making long-distance movements [4]. If dispersal occurs after pair bonds are formed, macaws are not likely to exhibit sex-biases in dispersal. At our current sample sizes and scale of sampling, we cannot make any firm conclusions about the presence or absence of sex-biased dispersal in macaws. However, observed trends of female-biased gene flow warrant further investigation with genetic sampling expanded beyond Peru and radio-telemetry studies.
We caution against using these estimates of effective population size as absolute values of current Ne for conservation for two main reasons, (1) because of the large confidence intervals in the estimates and (2) our uncertainty of the spatial area that our estimates encompass because of the potential for high gene flow with unsampled areas. However, these results can be used to understand differences in the life history of these two parrot species. While they are sympatrically distributed throughout the same habitats, eat similar foods, and have similar body sizes, Scarlet Macaw has a much larger effective population size than Red-and-green Macaw. Assuming that Ne/N ratios are similar between both species, effective population size estimates will reflect census size and indicate large population sizes for Scarlet Macaw. Encounter rates of macaws along rivers in nearby Manu and in Ecuador support this result, as they also suggest that Scarlet Macaws are more abundant [3,13].
The differences in effective population size support nesting site-specificity of these two species. Red-and-green Macaws nest in cavities of the widely distributed, but low density, rainforest emergent, Dipteryx and similar emergent hardwood species [76]. They may make large-scale movements in search of these limited nesting sites and only a small percentage of the population may successfully breed each year, which corresponds to the trends for high gene flow and low effective population size detected in southeastern Peru. Scarlet Macaws are nest-site generalists, nesting in appropriate-sized cavities in a wide variety of tree species including palms, and have even been noted using artificial nest boxes [76]. It may not be necessary for this species to move large distances, and more individuals may successfully breed because suitable nesting sites are more available.
5. Conclusions and Conservation Implications
Our study provides the first estimates of genetic diversity, genetic population structure, and effective population sizes for Red-and-green Macaws and Scarlet Macaws in intact habitat. For both species genetic diversity and effective population sizes are high and population structuring is weak or nonexistent for the scale of our study across intact habitat. Scarlet Macaw may have more restricted gene flow than Red-and-green Macaw, and additional field studies are needed to evaluate this hypothesis and determine the mechanisms that led to these differences. These baseline data for intact habitat will inform conservationists and managers and allow monitoring for changes in populations over time in the Amazon rainforest of Peru. We can conclude that the processes that drive the genetic diversity and population structure of both Scarlet and Red-and-green Macaws operate at a large spatial scale and additional sampling outside of Peru is needed to evaluate genetic neighborhood size. Our work also focuses on a mtDNA and nDNA dataset collected in 2006. Additional analyses should be conducted using genomic methods (20) and with new sampling to assess the effect of the highway and associated development in the area.
Supplementary Materials
The following supporting information can be downloaded at: https://www.mdpi.com/article/10.3390/biosphere2040015/s1, Table S1. p-values for rejecting the null hypothesis that genotypes are in Hardy–Weinberg proportions. Table S2. p-values for Red-and-green Macaw for rejecting the null hypothesis that loci are in linkage disequilibrium. Table S3. p-values for Scarlet Macaw for rejecting the null hypothesis that loci are in linkage disequilibrium. Table S4a. Sample size (N), observed (Ho) and expected (He) heterozygosity and allelic richness (A) for 12 microsatellite loci amplified in Red-and-green Macaw. Table S4b. Sample size (N), observed (Ho) and expected (He) heterozygosity and allelic richness (A) for 12 microsatellite loci amplified in d Scarlet Macaw. Table S5. Log likelihood results from program Structure for the number of clusters (K) one through six for Red-and-green Macaw and Scarlet Macaw based on 10 and nine microsatellite loci, respectively.
Author Contributions
Conceptualization, K.G., D.J.B., G.V.N.P., and L.P.W.; methodology, K.G., D.J.B., G.V.N.P., and L.P.W.; validation, K.G., D.J.B., G.V.N.P., and L.P.W.; formal analysis, K.G.; data curation, K.G.; writing—original draft preparation, K.G.; writing—review and editing, K.G., D.J.B., G.V.N.P., and L.P.W.; supervision, G.V.N.P. and L.P.W.; project administration, L.P.W.; funding acquisition, G.V.N.P. All authors have read and agreed to the published version of the manuscript.
Funding
This study was made possible by a grant from the Andes Amazon Initiative of the Gordon and Betty Moore Foundation to the World Wildlife Fund. The World Wildlife Fund provided funding to L.P.W. at the University of Idaho.
Institutional Review Board Statement
“Not applicable” because shed feathers were collected noninvasively from clay licks.
Informed Consent Statement
Not applicable.
Data Availability Statement
MtDNA sequence data will be made available in Genebank. Microsatellite genotypes will be provided in Supplemental Materials.
Acknowledgments
Thanks to everyone who helped with sample collection, especially the MDD1 field leaders, G. Vigo-Trauco, D. Matsufuiji, and K. Quinteros. Thanks also to U. Aleman, S. Palminteri, and K. Adamek for help designing the traps. Thanks to A. Cáceres and K. Ledesma for help obtaining permits in Perú. Thanks to the LCEEG, and the Waits lab for laboratory assistance and comments. Thanks to C. Goldberg for help with maps and thanks to J. Sullivan for discussion. Thanks to the Peruvian government’s Instituto Nacional de Recursos Naturales (INRENA), CITES USA and CITES Peru for permission to conduct this work.
Conflicts of Interest
The authors declare no conflicts of interest.
Abbreviations
The following abbreviations are used in this manuscript:
| mtDNA | mitochondrial DNA |
| nDNA | nuclear DNA |
References
- IUCN. 2026 IUCN Red List of Threatened Species. 2026. Available online: www.iucnredlist.org (accessed on 25 April 2026).
- Guix, J.C.; Martín, M.; Mañosa, S. Conservation status of parrot populations in an Atlantic rainforest area of southeastern Brazil. Biodivers. Conserv. 1999, 8, 1079–1088. [Google Scholar] [CrossRef] [Scilit]
- Karubian, J.; Fabara, J.; Yunes, D.; Jorgenson, J.P.; Romo, D.; Smith, T.B. Temporal and spatial patterns of macaw abundance in the Ecuadorian Amazon. Condor 2005, 107, 617–626. [Google Scholar] [CrossRef]
- Adamek. Temporal Variation in Space and Resource Use of Macaws in the Southeastern Peruvian Amazon. Master’s Thesis, Texas A&M University, College Station, TX, USA, 2011. [Google Scholar]
- Brightsmith, D.J.; Boyd, J.D.; Hobson, E.A.; Randel, C.J. Satellite telemetry reveals complex migratory movement patterns of two large macaw species in the western Amazon basin. Avian Conserv. Ecol. 2021, 16, 14. [Google Scholar] [CrossRef] [Scilit]
- Meyers, J.M. Improved capture techniques for psittacines. Wild. Soc. Bull. 1994, 22, 511–516. [Google Scholar]
- Gilardi, J.D.; Munn, C.A. Patterns of activity, flocking, and habitat use of parrots of the Perúvian Amazon. Condor 1998, 100, 641–653. [Google Scholar] [CrossRef] [Scilit] [PubMed]
- Lloyd, H. Habitat and population estimates of some threatened lowland forest bird species in Tambopata, south-east Perú. Bird Conserv. Int. 2004, 14, 261–277. [Google Scholar] [CrossRef] [Scilit]
- Tambopata National Reserve. 2022. Available online: http://www.wtsonline.co.uk/treesnewweb/area.html (accessed on 22 April 2026).
- Monitoring of the Andes Amazon Program (MAAP). 2026. Available online: https://www.maapprogram.org/gold-mining-peru-amazon/ (accessed on 25 April 2026).
- Conover, T. Perú’s long haul: Highway to riches, or ruin? Natl. Geogr. 2003, 203, 80–100. [Google Scholar]
- Brooks, D.M.; Begazo, A.J. Macaw abundance in relation to human population density in the western Amazon basin. In Avian Ecology and Conservation in an Urbanizing World; Marzluff, J.M., Bowman, R., Donnelly, R., Eds.; Kluwer Academic Publishers: Norwell, MA, USA, 2001; pp. 427–438. [Google Scholar]
- Renton, K. Seasonal variation in occurrence of macaws along a rainforest river. J. Field Ornithol. 2002, 73, 15–19. [Google Scholar] [CrossRef] [Scilit]
- Forshaw, J.M. Parrots of the World; David and Charles Ltd.: London, UK, 1978. [Google Scholar]
- Nader, W.; Werner, D.; Wink, M. Genetic diversity of scarlet macaws Ara macao in reintroduction studies for threatened populations in Costa Rica. Biol. Conserv. 1999, 87, 269–272. [Google Scholar] [CrossRef] [Scilit]
- Myers, M.C.; Vaughan, C. Movement and behavior of scarlet macaws (Ara macao) during the post-fledging dependence period: Implications for in situ versus ex situ management. Biol. Conserv. 2004, 118, 411–420. [Google Scholar] [CrossRef] [Scilit]
- Powell, G.; Wright, P.; Aleman, U.; Guindon, C.; Palminteri, S.; Bjork, R. Research Findings and Conservation Recommendations for the Great Green Macaw (Ara ambigua) in Costa Rica; Centro Cientifico Tropical: San Jose, Costa Rica, 1999. [Google Scholar]
- Adamek, K.; Powell, G.; Albites, M.; Aleman, U.; Amable, R.; Ccoycosi, J.; Imunda, S.; Sandoval, I.; Sandoval, S. Conservation planning for large macaws: Considerations of spatial use. In 19th Annual Meeting of the Society for Conservation Biology; Universidad de Brazilia: Brasília, Brazil, 2005. [Google Scholar]
- Reed, D.H.; Frankham, R. Correlation between fitness and genetic diversity. Conserv. Biol. 2003, 17, 230–237. [Google Scholar] [CrossRef] [Scilit]
- Olah, G.; Smith, B.T.; Joseph, L.; Banks, S.C.; Heinsohn, R. Advancing genetic methods in the study of parrot biology and conservation. Diversity 2021, 13, 521. [Google Scholar] [CrossRef] [Scilit]
- Johnson, J.A.; Toepfer, J.E.; Dunn, P.O. Contrasting patterns of mitochondrial and microsatellite population structure in fragmented populations of greater prairie-chickens. Mol. Ecol. 2003, 12, 3335–3347. [Google Scholar] [CrossRef] [Scilit] [PubMed]
- Bates, J.M. The genetic effects of forest fragmentation on five species of Amazonian birds. J. Avian Biol. 2002, 33, 276–294. [Google Scholar] [CrossRef] [Scilit]
- Bried, J.; Nicolaus, M.; Parne, P.; Duboiso, M.P.; Jouventin, P. Population biology of the wandering albatross (Diomedea exulans) in the Crozet and Kerguelen archipelagos, southern Indian Ocean, approached through genetic and demographic methods. J. Zool. 2007, 272, 20–29. [Google Scholar] [CrossRef] [Scilit]
- Nunney, L.; Elam, D.R. Estimating the effective size of conserved populations. Conserv. Biol. 1994, 8, 175–184. [Google Scholar] [CrossRef] [Scilit]
- Gebhardt, K.J.; Brightsmith, D.; Powell, G.; Waits, L.P. Maximizing DNA yield from molted feathers: A case study of parrots in the Peruvian Amazon rainforest. J. Field Ornithol. 2009, 80, 183–192. [Google Scholar]
- Olah, G.; Heinsohn, R.G.; Brightsmith, D.J.; Peakall, R. The application of non-invasive genetic tagging reveals new insights into the clay lick use by macaws in the Peruvian Amazon. Conserv. Genet. 2017, 18, 1037–1046. [Google Scholar] [CrossRef] [Scilit]
- Olah, G.; Heinsohn, R.G.; Brightsmith, D.J.; Espinoza, J.R.; Peakall, R. Validation of non-invasive genetic tagging in two large macaw species (Ara macao and A. chloropterus) of the Peruvian Amazon. Conserv. Genet. Resour. 2016, 8, 499–509. [Google Scholar] [CrossRef] [Scilit]
- Monge, O.; Schmidt, K.; Vaughan, C.; Gutiérrez-Espeleta, G. Genetic patterns and conservation of the Scarlet Macaw (Ara macao) in Costa Rica. Conserv. Genet. 2016, 17, 745–750. [Google Scholar] [CrossRef] [Scilit]
- Olah, G.; Smith, A.L.; Asner, G.P.; Brightsmith, D.J.; Heinsohn, R.G.; Peakall, R. Exploring dispersal barriers using landscape genetic resistance modelling in scarlet macaws of the Peruvian Amazon. Landsc. Ecol. 2017, 32, 445–456. [Google Scholar] [CrossRef] [Scilit]
- Blanco, G.; Morinha, F.; Roques, S.; Hiraldo, F.; Rojas, A.; Tella, J.L. Fine-scale genetic structure in the critically endangered red-fronted macaw in the absence of geographic and ecological barriers. Sci. Rep. 2021, 11, 556. [Google Scholar] [CrossRef] [Scilit] [PubMed]
- Campos, C.I.; Martinez, M.A.; Acosta, D.; Diaz-Luque, J.A.; Berkunsky, I.; Lamberski, N.L.; Cruz-Nieto, J.; Russello, M.A.; Wright, T.F. Genetic diversity and population structure of two endangered Neotropical parrots inform in situ and ex situ conservation strategies. Diversity 2021, 13, 386. [Google Scholar] [CrossRef] [Scilit]
- Olah, G.; Heinsohn, R.G.; Espinoza, J.R.; Brightsmith, D.J.; Peakall, R. An evaluation of primers for microsatellite markers in Scarlet Macaw (Ara macao) and their performance in a Peruvian wild population. Conserv. Genet. Resour. 2015, 7, 157–159. [Google Scholar] [CrossRef] [Scilit]
- Presti, F.T.; Oliveira-Marques, A.R.; Caparroz, R.; Biondo, C.; Miyaki, C.Y. Comparative analysis of microsatellite variability in five macaw species (Psittaciformes, Psittacidae): Application for conservation. Genet. Mol. Biol. 2011, 34, 348–352. [Google Scholar] [CrossRef] [Scilit] [PubMed]
- Schmidt, K.L.; Aardema, M.L.; Amato, G. Genetic analysis reveals strong phylogeographical divergences within the Scarlet Macaw Ara macao. Ibis 2020, 162, 735–748. [Google Scholar] [CrossRef] [Scilit]
- Burger, J.; Gochfeld, M. Parrot behavior at a Río Manu (Perú) clay lick: Temporal patterns, associations, and antipredator responses. Acta Ethol. 2003, 6, 23–34. [Google Scholar]
- Gilardi, J.D.; Duffey, S.S.; Munn, C.A. Biochemical functions of geophagy in parrots: Detoxification of dietary toxins and cytoprotective effects. J. Chem. Ecol. 1999, 25, 897–922. [Google Scholar] [CrossRef] [Scilit]
- Brightsmith, D. Effects of weather on parrot geophagy in Tambopata, Perú. Wilson Bull. 2004, 116, 134–145. [Google Scholar] [CrossRef] [Scilit]
- Russello, M.A.; Calcagnotto, R.; DeSalle, R.; Amato, G. Characterization of microsatellite loci in the endangered St. Vincent Parrot, Amazona guildingii. Mol. Ecol. Notes 2001, 1, 162–164. [Google Scholar] [CrossRef] [Scilit]
- Russello, M.A.; Lin, K.; Amato, G.; Caccone, A. Additional microsatellite loci for the endangered St. Vincent Parrot, Amazona guildingii. Conserv. Genet. 2005, 6, 643–645. [Google Scholar] [CrossRef] [Scilit]
- Caparroz, R.; Miyaki, C.Y.; Baker, A.J. Characterization of microsatellite loci in the Blue-and-Gold Macaw, Ara ararauna (Psittaciformes: Aves). Mol. Ecol. Notes 2003, 3, 441–443. [Google Scholar] [CrossRef] [Scilit]
- Gebhardt, K.J.; Waits, L.P. Cross-species amplification and optimization of microsatellite markers for use in six Neotropical parrots. Mol. Ecol. Resour. 2008, 8, 835–839. [Google Scholar] [CrossRef] [Scilit] [PubMed]
- Eberhard, J.R.; Wright, T.F.; Bermingham, E. Duplication and concerted evolution of the mitochondrial control region in the parrot genus Amazona. Mol. Biol. Evol. 2001, 18, 1330–1342. [Google Scholar] [CrossRef] [Scilit] [PubMed]
- Pritchard, J.K.; Stephens, M.; Donnelly, P. Inference of population structure using multilocus genotype data. Genetics 2000, 155, 945–959. [Google Scholar] [CrossRef] [Scilit] [PubMed]
- Heffner, R.A.; Butler, M.J.; Reilly, C.K. Pseudoreplication revisited. Ecology 1996, 77, 2558–2562. [Google Scholar] [CrossRef] [Scilit]
- Valière, N. GIMLET: A computer program for analyzing genetic individual identification data. Mol. Ecol. Notes 2002, 2, 377–379. [Google Scholar] [CrossRef] [Scilit]
- Waits, L.P.; Luikart, G.; Taberlet, P. Estimating the probability of identity among genotypes in natural populations: Cautions and guidelines. Mol. Ecol. 2001, 10, 249–256. [Google Scholar] [CrossRef] [Scilit] [PubMed]
- Raymond, M.; Rousset, F. GENEPOP (Version 1.2): Population genetics software for exact tests and ecumenicism. J. Hered. 1995, 86, 248–249. [Google Scholar] [CrossRef] [Scilit]
- Rice, W.R. Analyzing tables of statistical significance. Evolution 1989, 43, 223–225. [Google Scholar] [CrossRef] [Scilit]
- Goudet, J. FSTAT (version 1.2): A computer program to calculate F-statistics. J. Hered. 1995, 86, 485–486. [Google Scholar] [CrossRef] [Scilit]
- Nei, M.; Roychoudhury, A.K. Sampling variances of heterozygosity and genetic distance. Genetics 1974, 76, 379–390. [Google Scholar] [CrossRef] [Scilit] [PubMed]
- El Mousadik, A.; Petit, R.J. High level of genetic differentiation for allelic richness among populations of the argan tree [Argania spinosa (l.) Skeels] endemic to Morocco. Theor. Appl. Genet. 1996, 92, 832–839. [Google Scholar] [CrossRef] [PubMed]
- Leberg, P.L. Estimating allelic richness: Effects of sample size and bottlenecks. Mol. Ecol. 2002, 11, 2445–2449. [Google Scholar] [CrossRef] [Scilit] [PubMed]
- SAS. JMP IN, Version 6; SAS Institute Inc.: Cary, NC, USA, 1985.
- Clement, M.; Posada, D.; Crandall, K.A. TCS: A computer program to estimate gene genealogies. Mol. Ecol. 2000, 9, 1657–1659. [Google Scholar] [CrossRef] [Scilit] [PubMed]
- Rozas, J.; Sanchez-DelBarrio, J.C.; Messeguer, X.; Rozas, R. DnaSP, DNA polymorphism analyses by the coalescent and other methods. Bioinformatics 2003, 19, 2496–2497. [Google Scholar] [CrossRef] [Scilit] [PubMed]
- Michalakis, Y.; Excoffier, L. A generic estimation of population subdivision using distances between alleles with special reference for microsatellite loci. Genetics 1996, 142, 1061–1064. [Google Scholar] [CrossRef] [Scilit] [PubMed]
- Weir, B.S.; Cockerham, C.C. Estimating F-statistics for the analysis of population structure. Evolution 1984, 38, 1358–1370. [Google Scholar] [CrossRef] [Scilit]
- Excoffier, L.; Laval, G.; Schneider, S. Arlequin ver. 3.0: An integrated software package for population genetics data analysis. Evol. Bioinform. 2005, 1, 47–50. [Google Scholar] [CrossRef] [Scilit]
- Hedrick, P.W. A standardized genetic differentiation measure. Evolution 2005, 59, 1633–1638. [Google Scholar] [CrossRef] [Scilit]
- Kimura, M.; Crow, J.F. The number of alleles that can be maintained in a finite population. Genetics 1964, 63, 701–709. [Google Scholar] [CrossRef] [Scilit] [PubMed]
- Kuhner, M. LAMARC 2.0: Maximum likelihood and Bayesian estimation of population parameters. Bioinformatics 2006, 22, 768–770. [Google Scholar] [CrossRef] [Scilit] [PubMed]
- Ellegren, H. Microsatellites: Simple sequences with complex evolution. Nat. Rev. Genet. 2004, 5, 435–445. [Google Scholar] [CrossRef] [Scilit] [PubMed]
- Beck, N.R.; Double, M.C.; Cockburn, A. Microsatellite evolution at two hypervariable loci revealed by extensive avian pedigrees. Mol. Biol. Evol. 2003, 20, 54–61. [Google Scholar] [CrossRef] [Scilit] [PubMed]
- Primmer, C.R.; Saino, N.; Møller, A.P.; Ellegren, H. Unraveling the processes of microsatellite evolution through analysis of germ line mutations in Barn Swallows Hirundo rustica. Mol. Biol. Evol. 1998, 15, 1047–1054. [Google Scholar] [CrossRef] [Scilit]
- Lambert, D.M.; Ritchie, P.A.; Millar, C.D.; Holland, B.; Drummon, A.J.; Baroni, C. Rates of evolution in ancient DNA from Adélie penguins. Science 2002, 295, 2270–2273. [Google Scholar] [CrossRef] [Scilit] [PubMed]
- Caswell, H. Matrix Population Models: Construction, Analysis, and Interpretation, 2nd ed.; Sinauer Associates: Sunderland, MA, USA, 2001. [Google Scholar]
- Tajima, F. The effect of change in population size on DNA polymorphism. Genetics 1989, 123, 597–601. [Google Scholar] [CrossRef] [Scilit] [PubMed]
- Kidd, M.G.; Friesen, V.L. Sequence variation in the Guillemot (Alcidae: Cepphus) mitochondrial control region and its nuclear homolog. Mol. Biol. Evol. 1998, 15, 61–70. [Google Scholar] [CrossRef] [Scilit] [PubMed]
- Primmer, C.R.; Møller, A.P.; Ellegren, H. A wide-range survey of cross-species microsatellite amplification in birds. Mol. Ecol. 1996, 5, 365–378. [Google Scholar] [CrossRef] [PubMed]
- Gaggiotti, O.E.; Lange, O.; Rassmann, K.; Gliddon, C. A comparison of two indirect methods for estimating average levels of gene flow using microsatellite data. Mol. Ecol. 1999, 8, 1513–1520. [Google Scholar] [CrossRef] [Scilit] [PubMed]
- Wright, S. The interpretation of population structure by F-statistics with special regard to systems of mating. Evolution 1965, 19, 395–420. [Google Scholar] [CrossRef] [Scilit]
- Lacy, R.C. Loss of genetic diversity from managed populations: Interacting effects of drift, mutation, immigration, selection, and population subdivision. Conserv. Biol. 1987, 1, 143–158. [Google Scholar] [CrossRef] [Scilit]
- Caparroz, R.; Guedes, N.M.; Bianchi, C.A.; Wajntal, A. Analysis of the genetic variability and breeding behaviour of wild populations of two macaw species (Psittaciformes: Aves) by DNA fingerprinting. Ararajuba 2001, 9, 43–49. [Google Scholar]
- Prugnolle, F.; De Meeus, T. Inferring sex-biased dispersal from population genetic tools: A review. Heredity 2002, 88, 161–165. [Google Scholar] [CrossRef] [Scilit] [PubMed]
- Caparroz, R. Ilogeografia, Estrutura e Variabilidade Genética da Araracanindé (Ara ararauna, Psittaciformes: Aves) No Brasil Baseadas na Análise de DNA Mitocondrial e de DNA Nuclear; Instituto de Biociências, Universidade de São Paulo: São Paulo, Brazil, 2003. [Google Scholar]
- Brightsmith, D. Parrot nesting in southeastern Perú: Seasonal patterns and keystone trees. Wilson Bull. 2005, 117, 296–305. [Google Scholar] [CrossRef] [Scilit]

Disclaimer/Publisher’s Note: The statements, opinions and data contained in all publications are solely those of the individual author(s) and contributor(s) and not of MDPI and/or the editor(s). MDPI and/or the editor(s) disclaim responsibility for any injury to people or property resulting from any ideas, methods, instructions or products referred to in the content. |
© 2026 by the authors. Licensee MDPI, Basel, Switzerland. This article is an open access article distributed under the terms and conditions of the Creative Commons Attribution (CC BY) license.